Assessment of Rainstorm Waterlogging Disaster Risk in Rapidly Urbanizing Areas Based on Land Use Scenario Simulation: A Case Study of Jiangqiao Town in Shanghai, China


Abstract
1. Introduction
2. Data and Methods
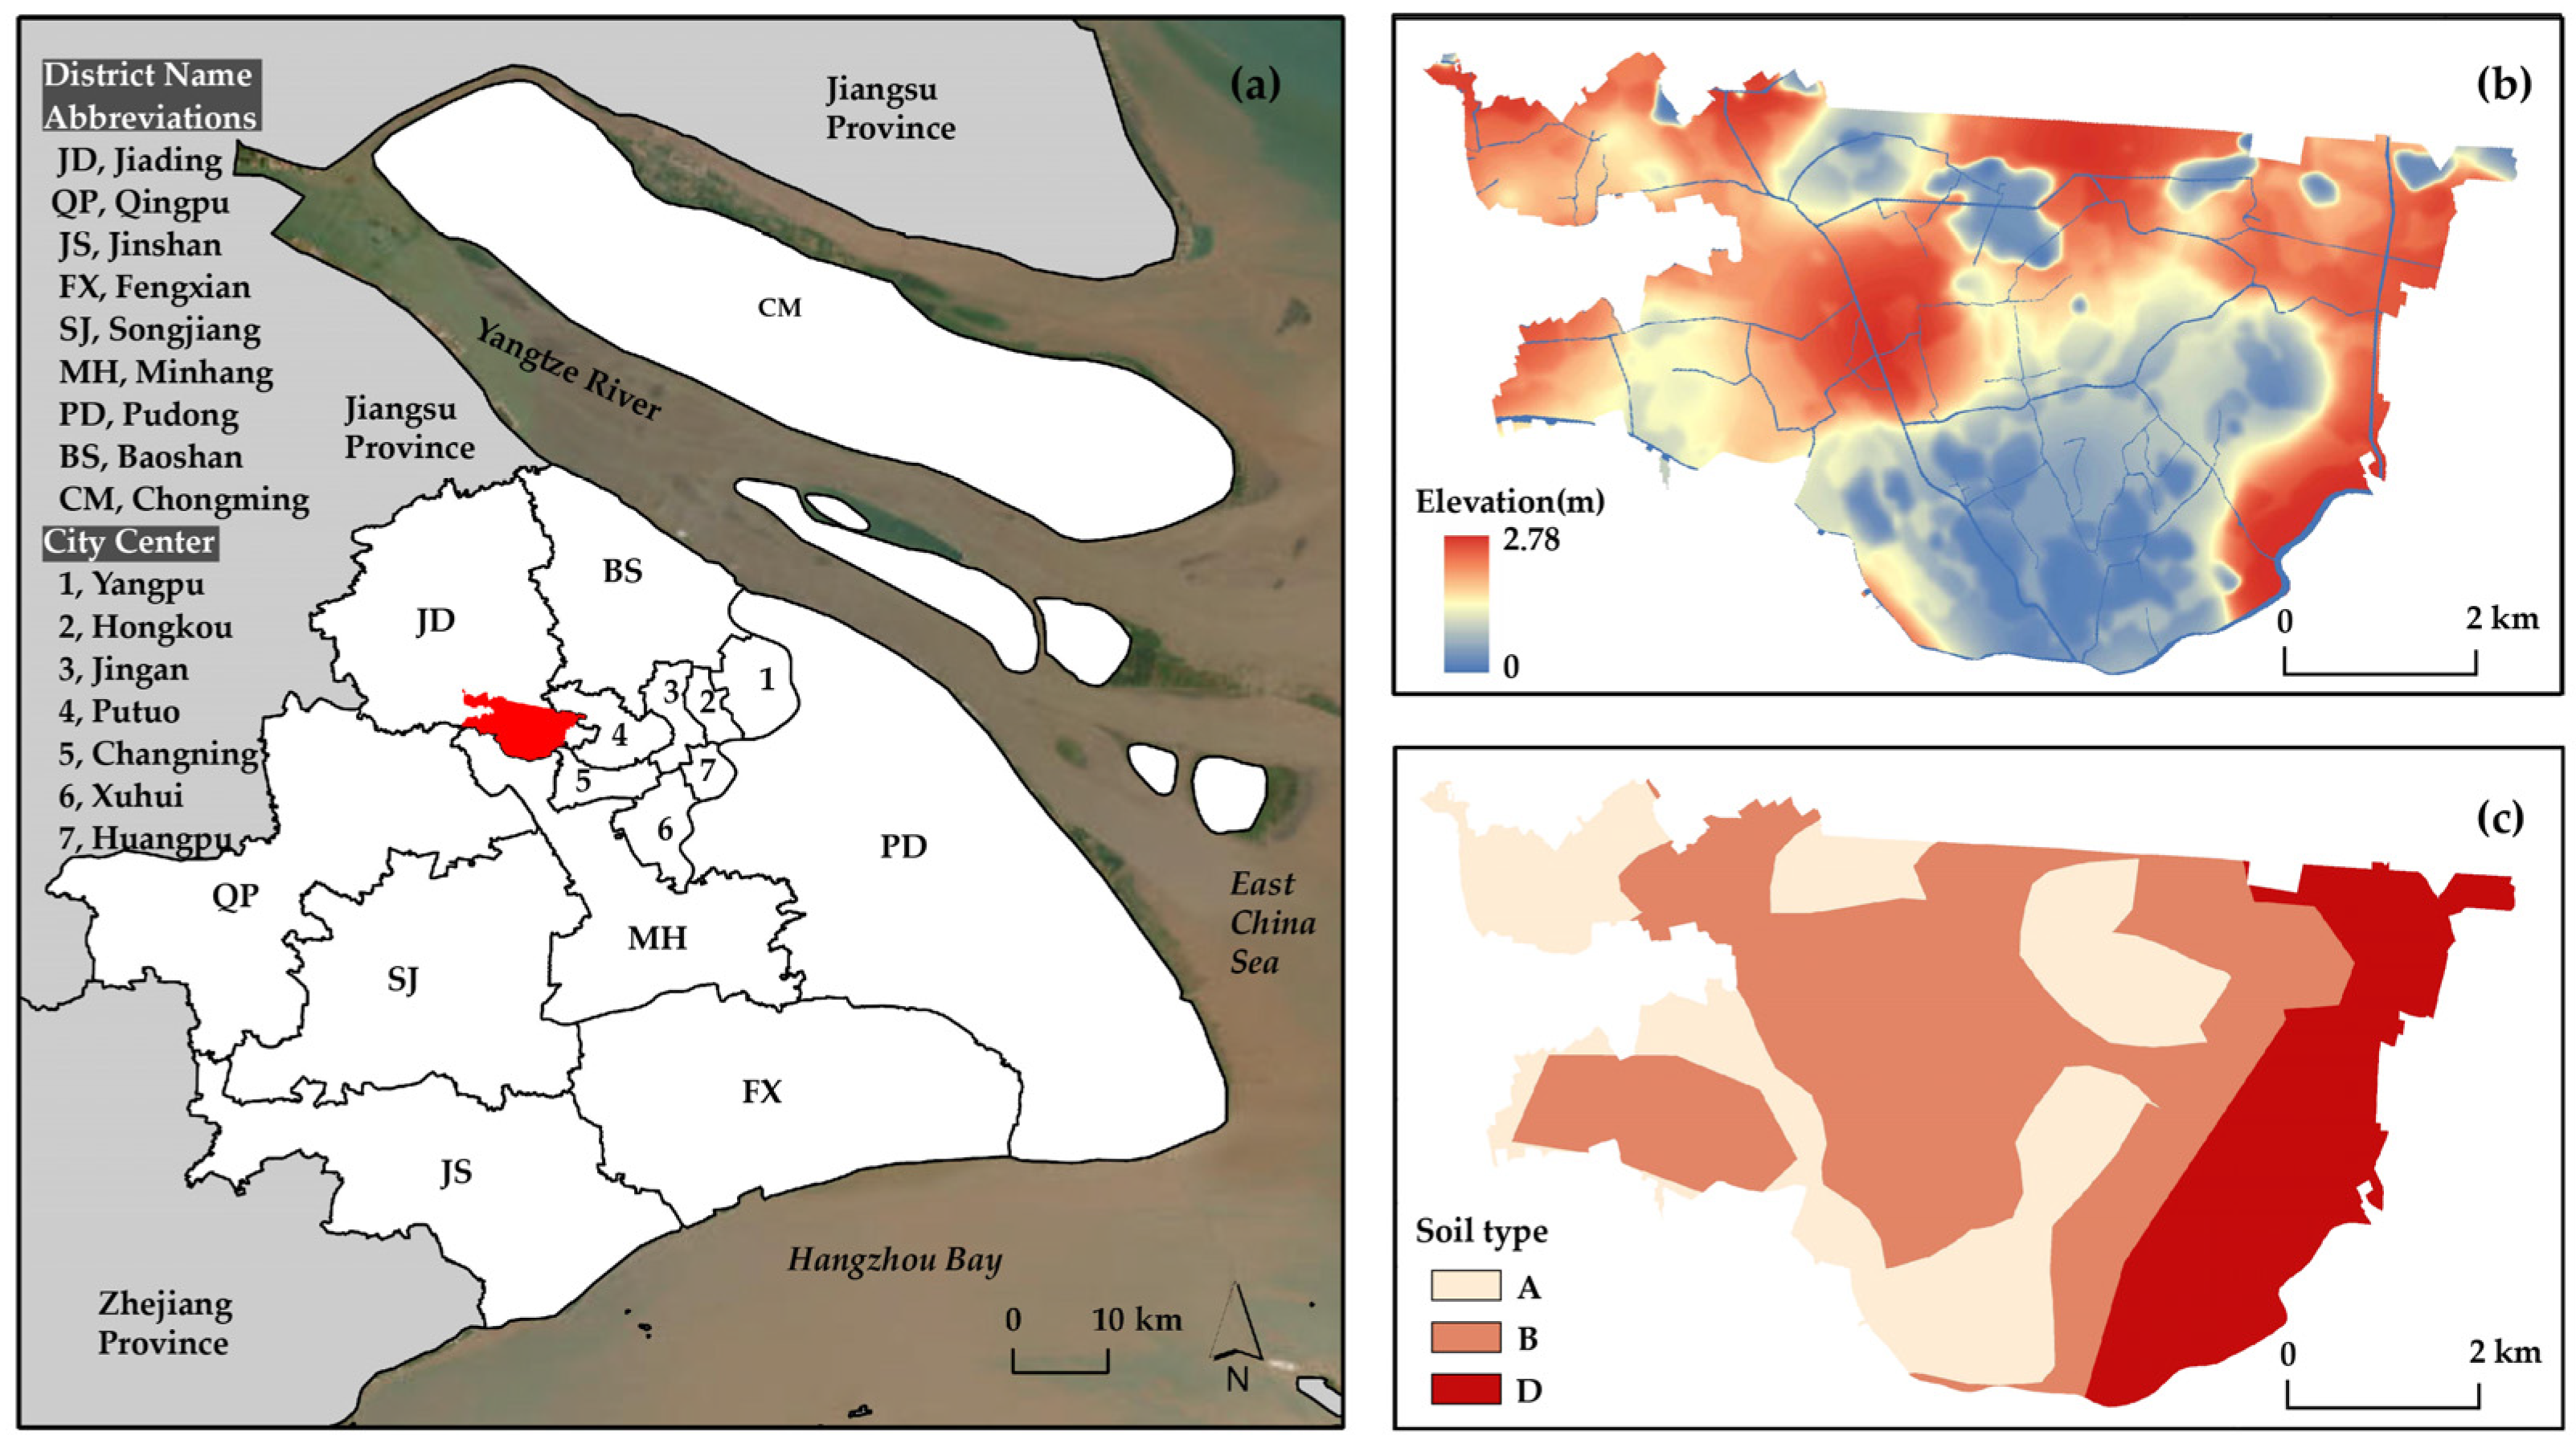
2.1. Study Area
2.2. Data
2.3. Methods
2.3.1. GIS-Based Simulation on Rainstorm Waterlogging Disaster
2.3.2. Land Use Simulation Based on GeoSOS-FLUS Model
2.3.3. Landscape Pattern Analysis
3. Results
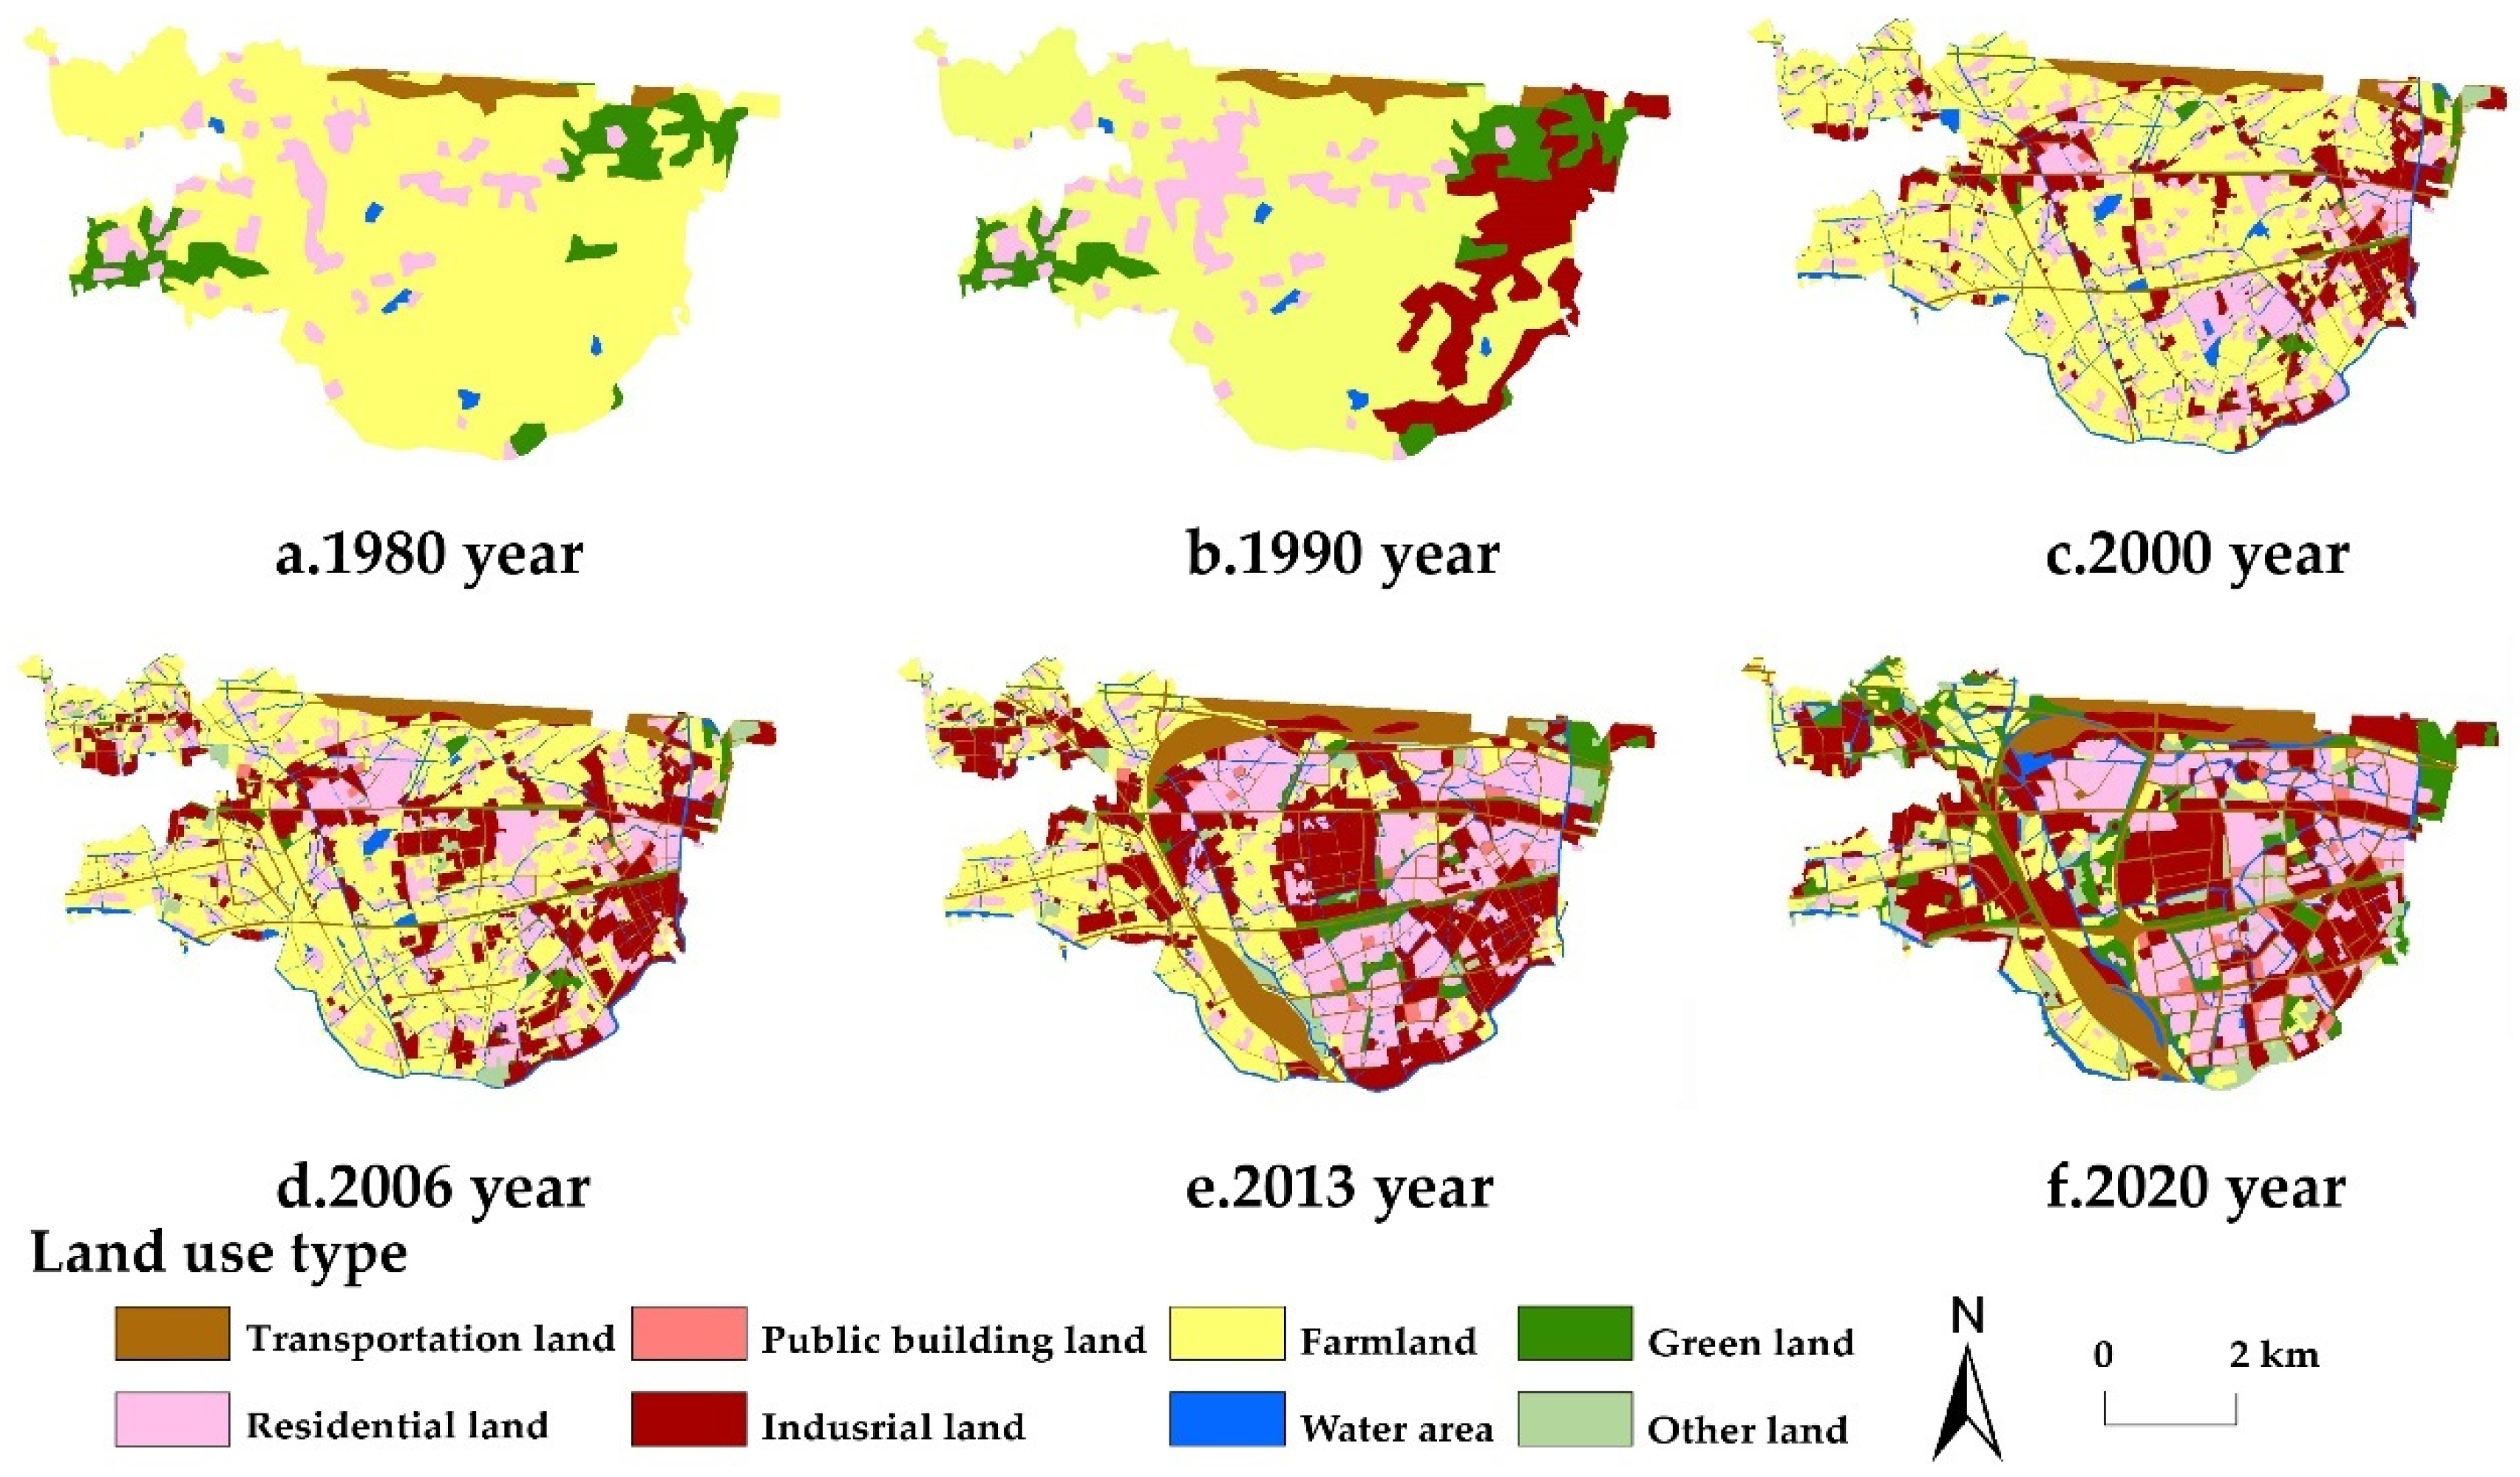
3.1. Land Use Change in Jiangqiao Town from 1980 to 2020
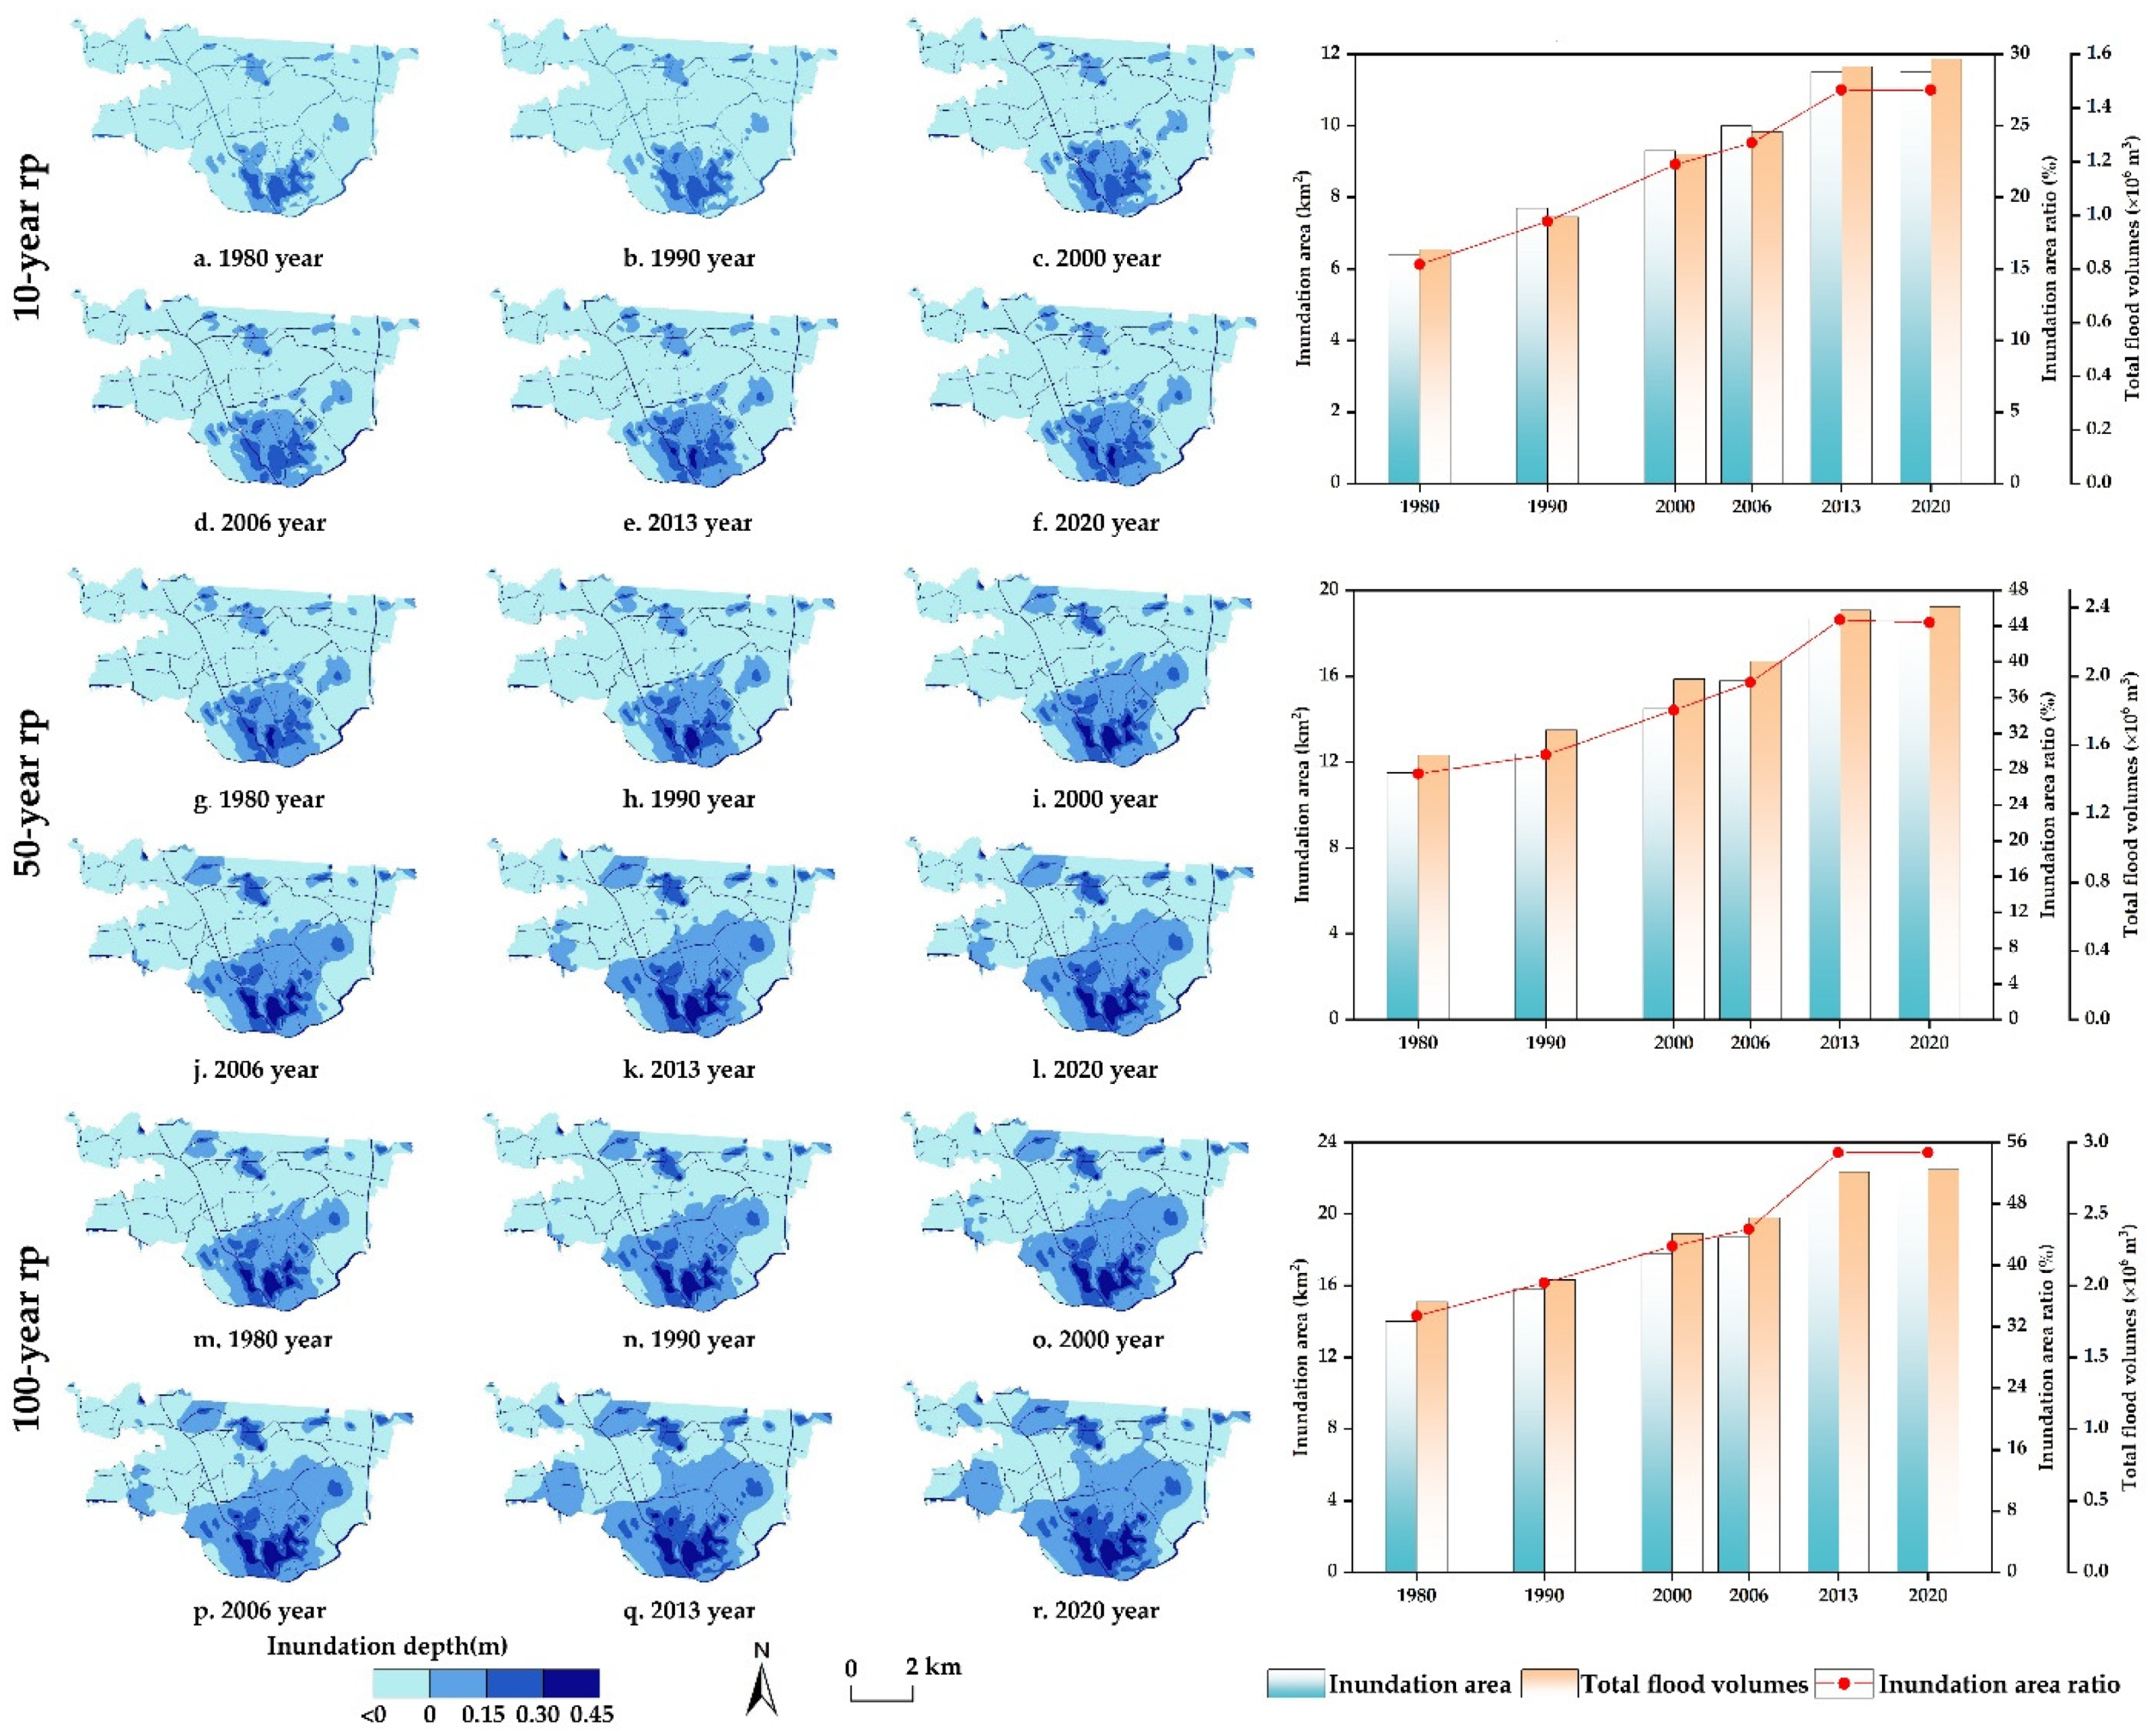
3.2. Rainstorm Waterlogging Simulation
3.3. Impact of Land Use Change on Rainstorm Waterlogging
3.3.1. Impact of Land Use Change on Surface Runoff Depth
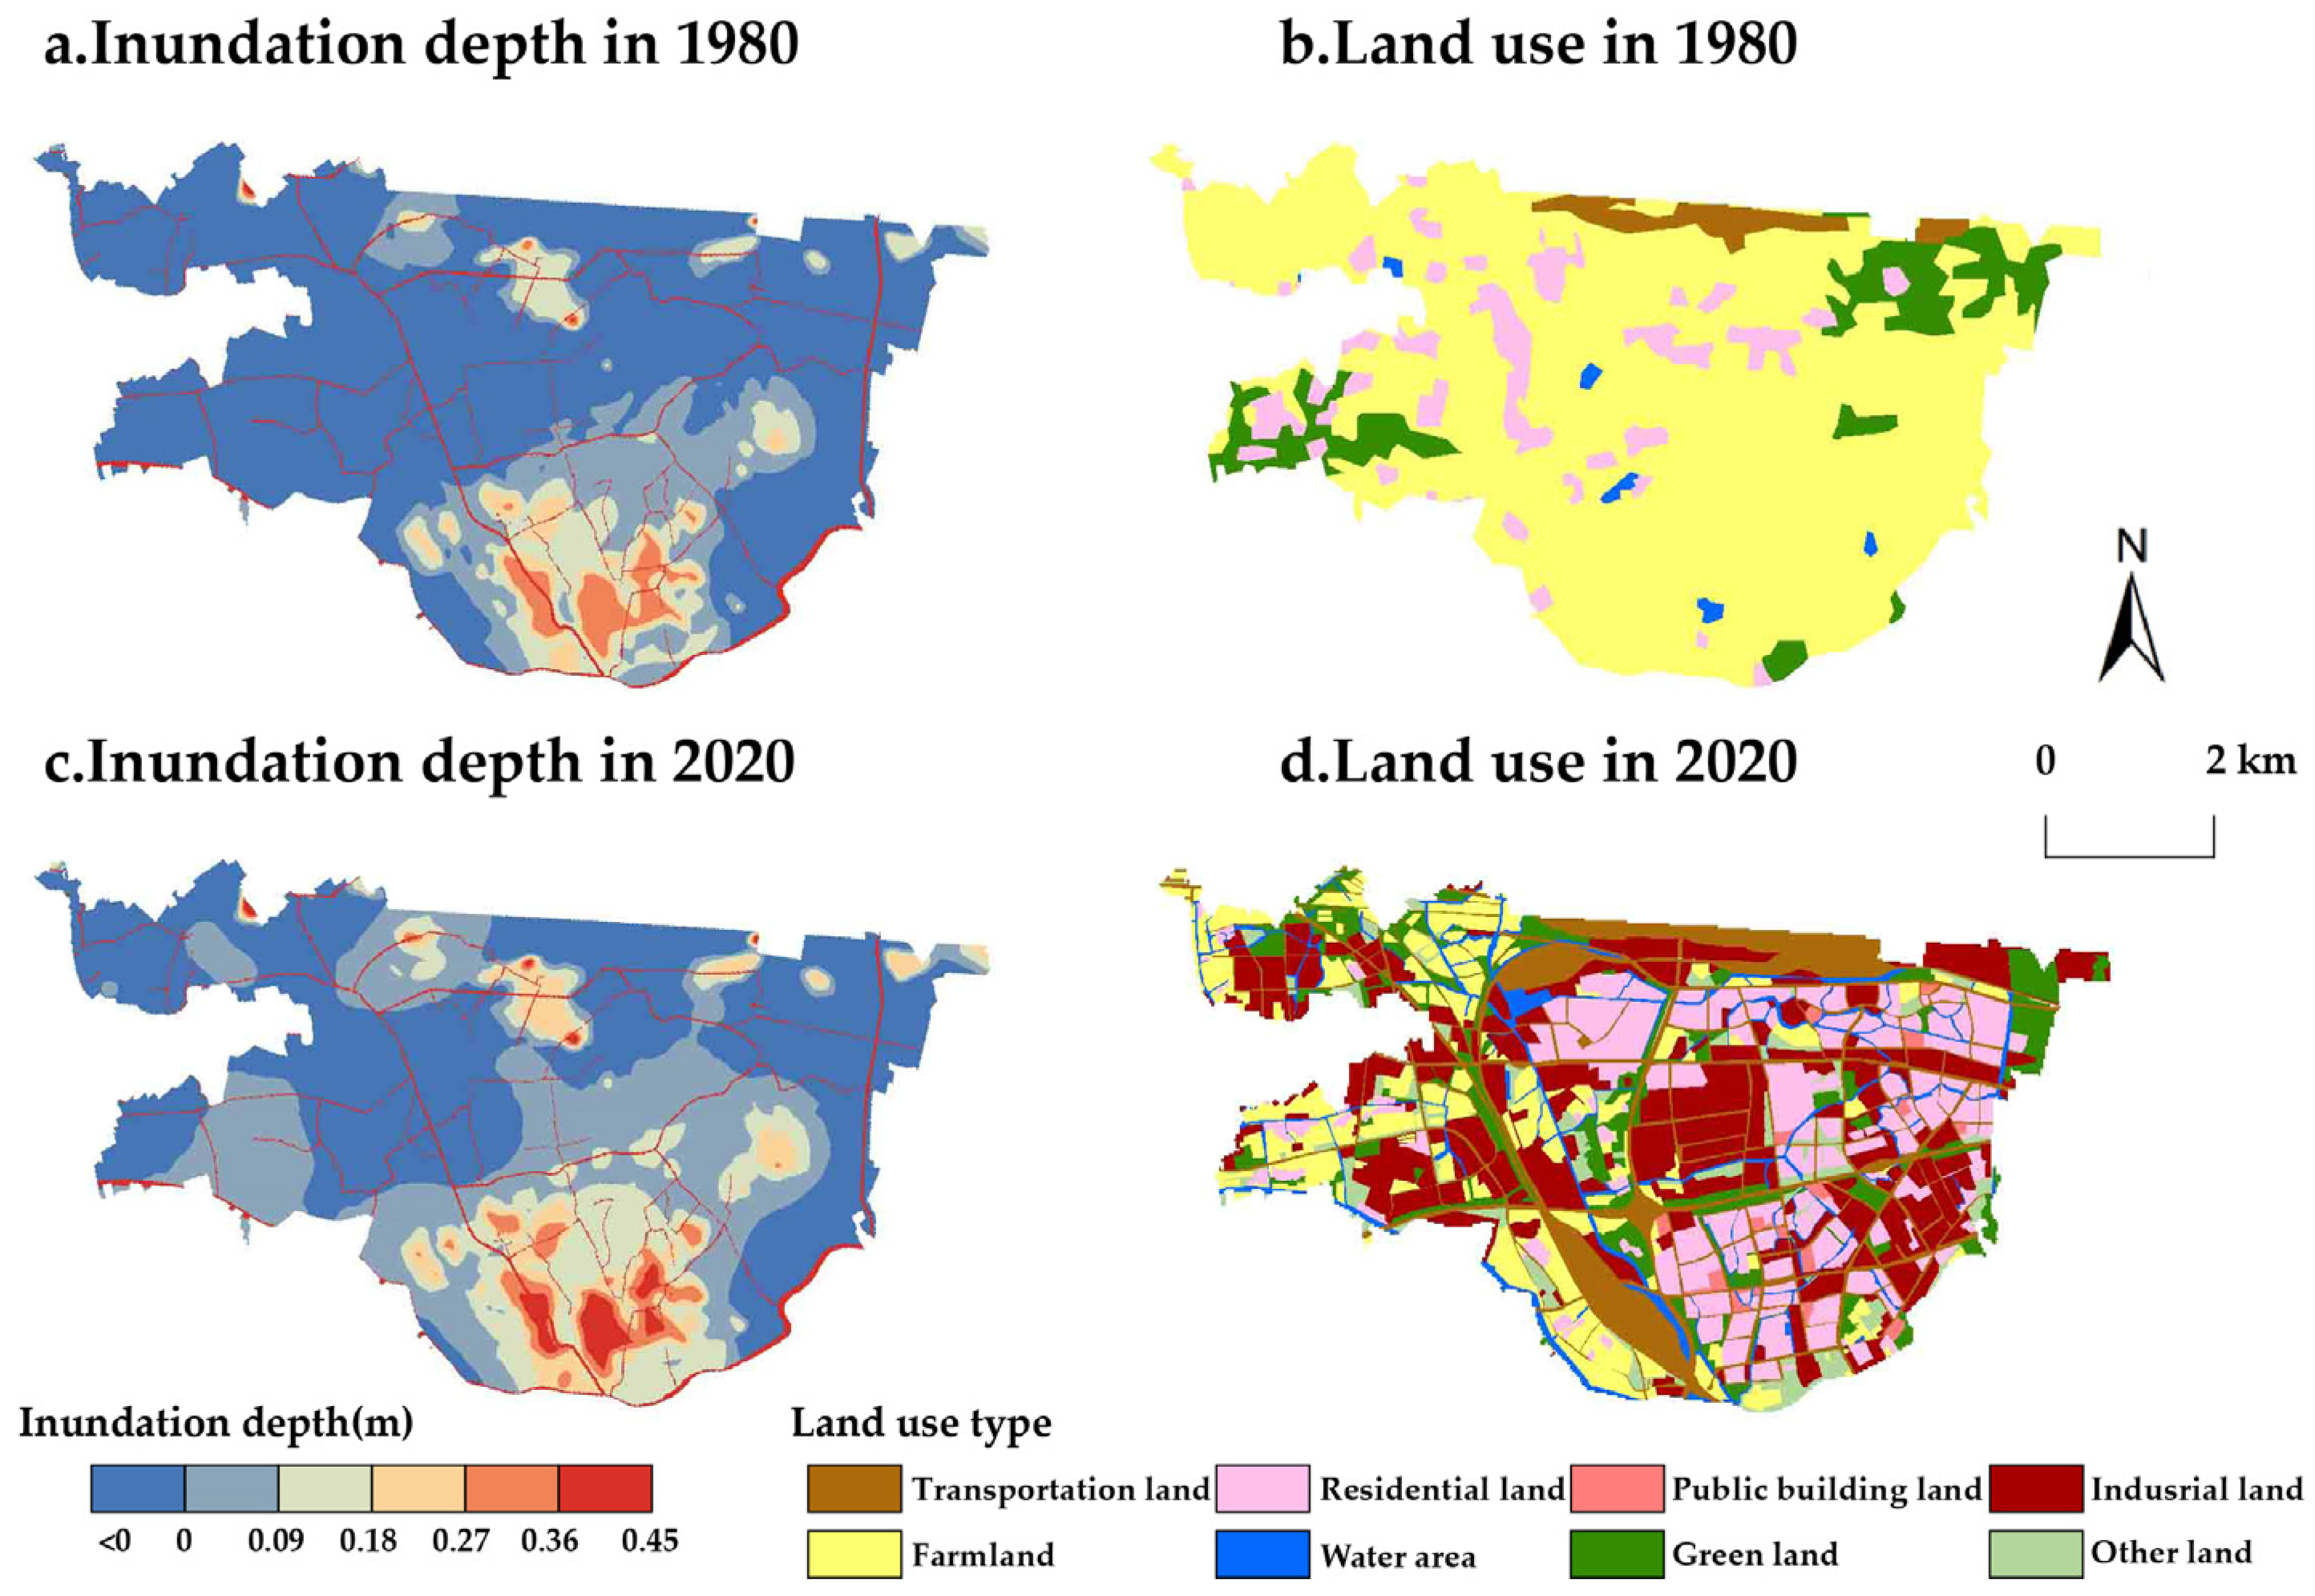
3.3.2. Impact of Land Use Change on Inundation Depth
3.4. Rainstorm Waterlogging Disaster Risk Assessment regarding Future Land Use
3.4.1. Land Use Scenario Simulations for 2040
3.4.2. Rainstorm Waterlogging Simulation in Different Land Use Scenarios
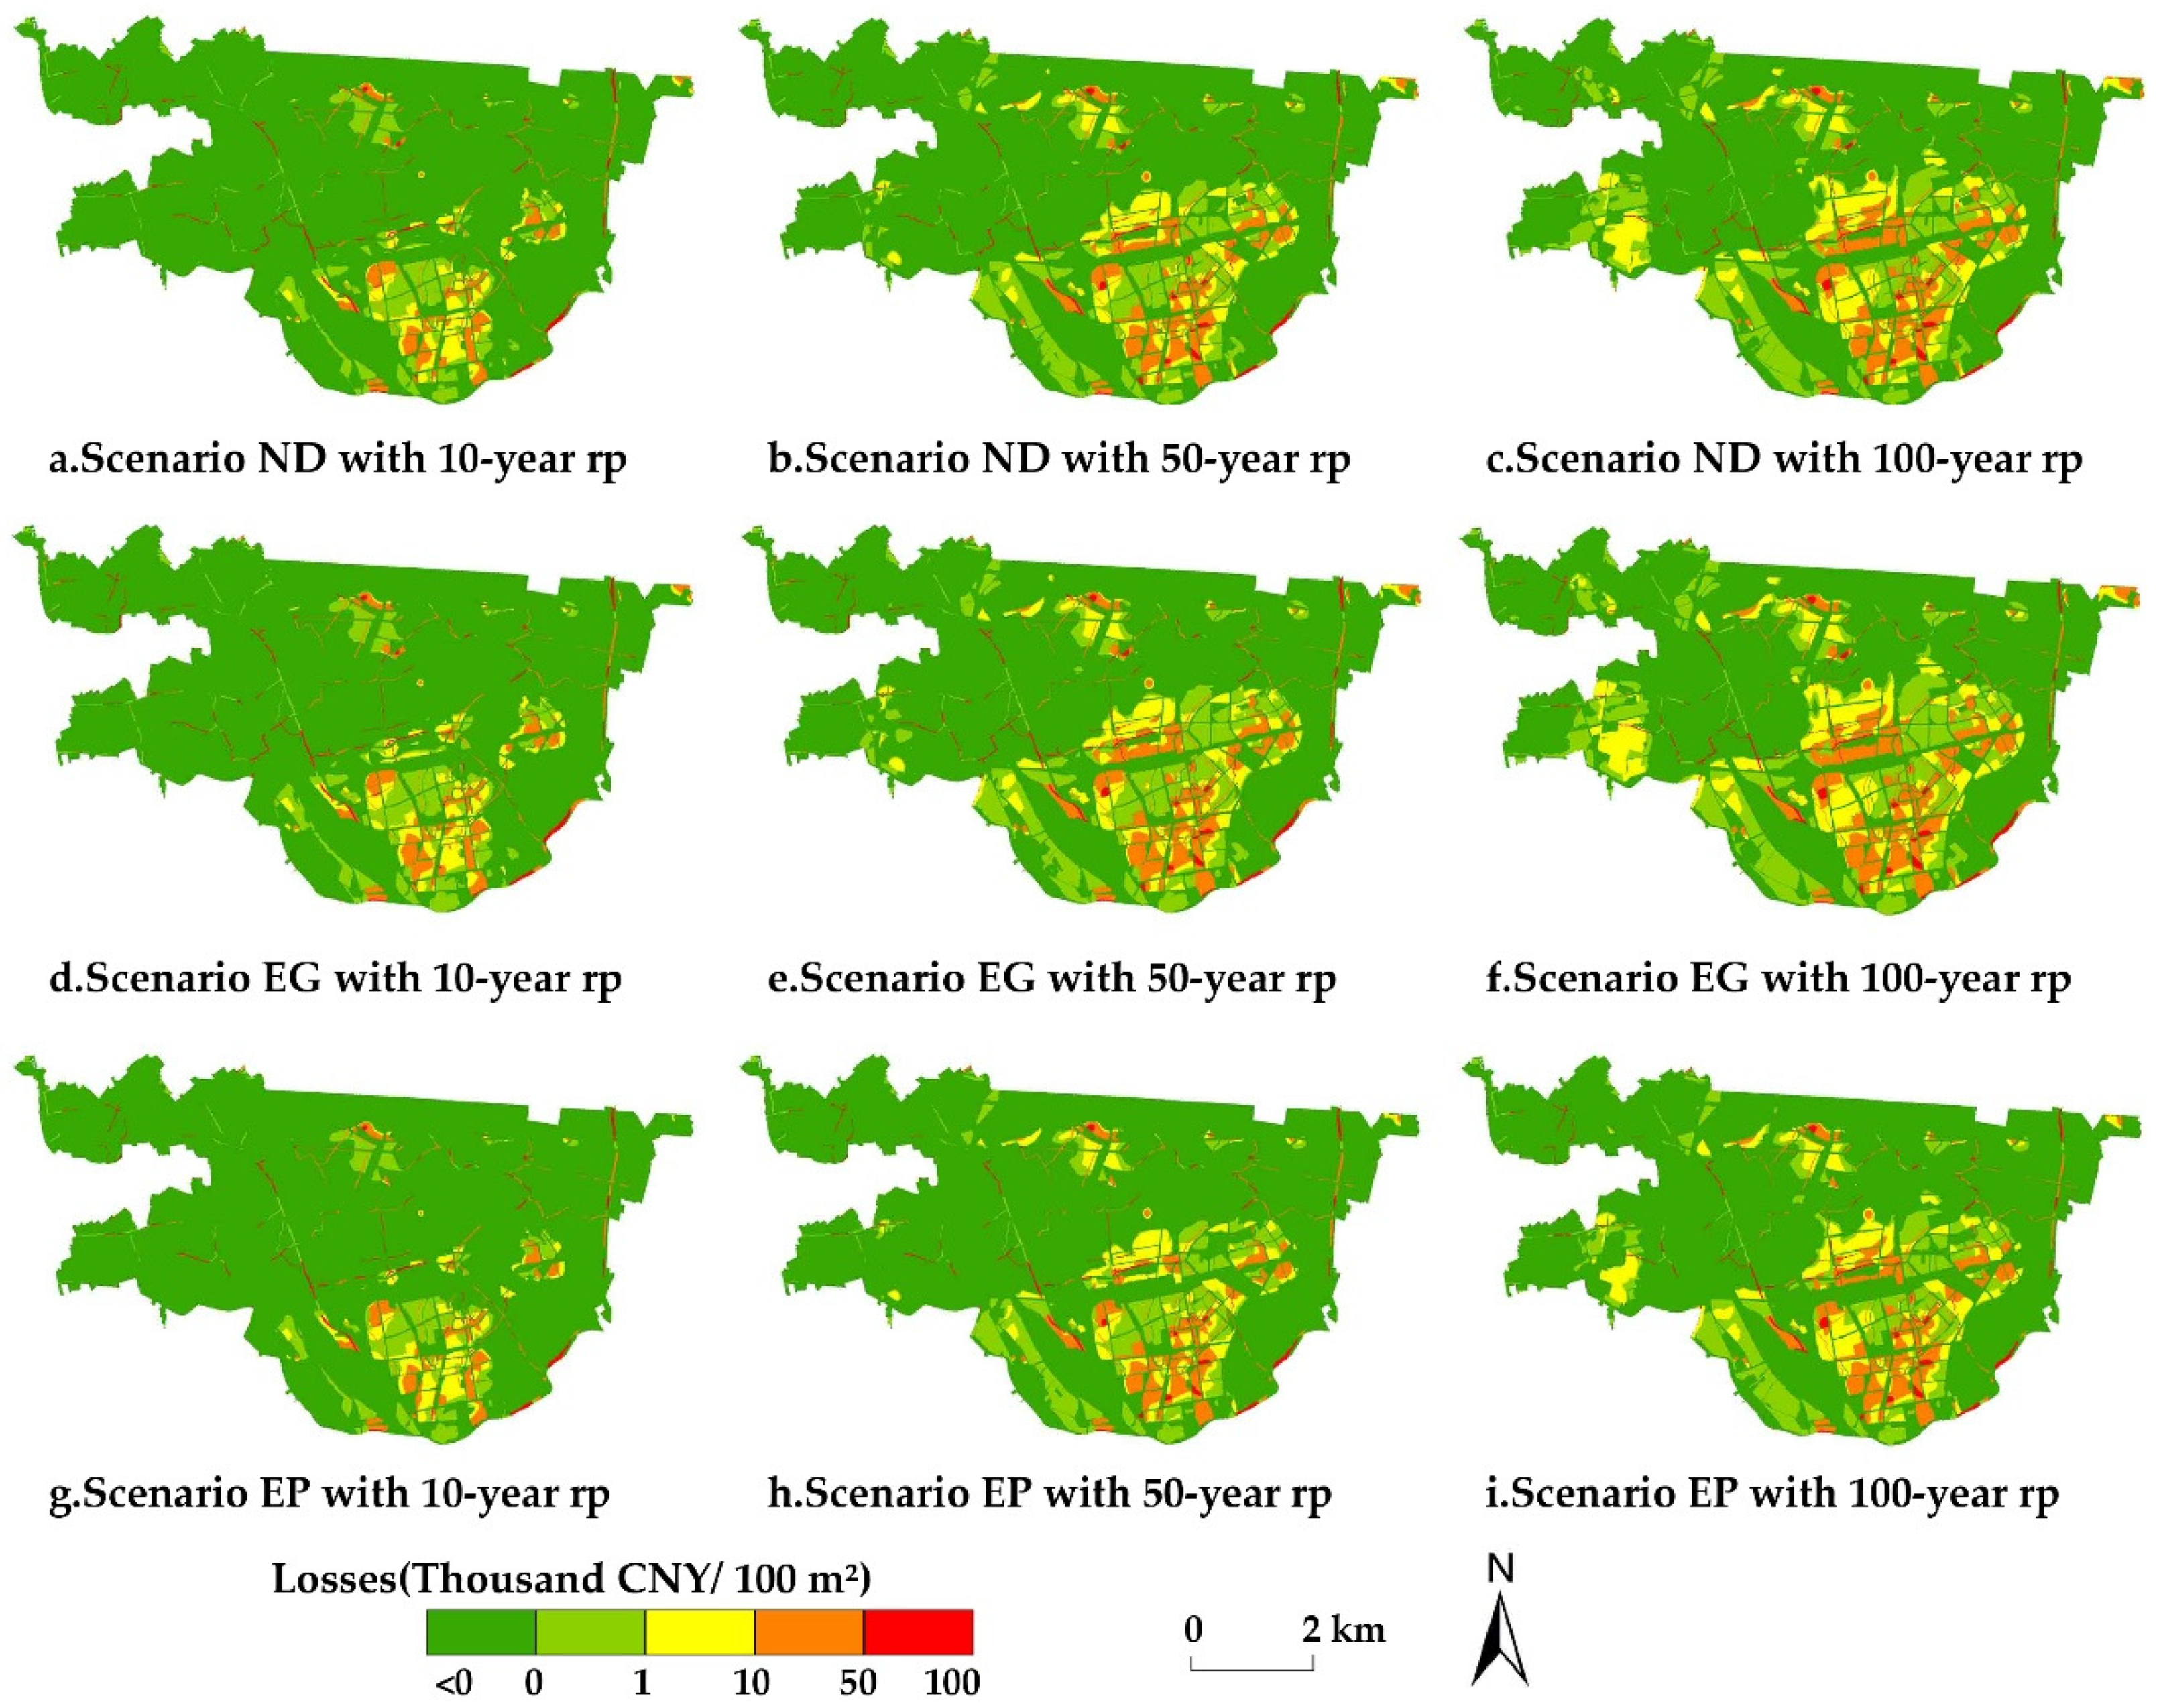
3.4.3. Rainstorm Waterlogging Disaster Risk Assessment in Different Land Use Scenarios
4. Conclusions
Author Contributions
Funding
Data Availability Statement
Conflicts of Interest
References
- Myhre, G.; Alterskjær, K.; Stjern, C.W.; Hodnebrog, Ø.; Marelle, L.; Samset, B.H.; Sillmann, J.; Schaller, N.; Fischer, E.; Schulz, M.; et al. Frequency of extreme precipitation increases extensively with event rareness under global warming. Sci. Rep. 2019, 9, 16063. [Google Scholar] [CrossRef] [PubMed]
- Field, C.B.; Barros, V.; Stocker, T.F.; Dahe, Q. Managing the Risks of Extreme Events and Disasters to Advance Climate Change Adaptation: Special Report of the Intergovernmental Panel on Climate Change, 1st ed.; Cambridge University Press: Cambridge, UK, 2012. [Google Scholar]
- CRED. 2022 Disaster in Numbers [DS/OL]. 2023. Available online: https://cred.be/sites/default/files/2022_EMDAT_report.pdf (accessed on 3 January 2024).
- Gashaw, T.; Tulu, T.; Argaw, M.; Worqlul, A.W. Modeling the hydrological impacts of land use/land cover changes in the Andassa watershed, Blue Nile Basin, Ethiopia. Sci. Total Environ. 2018, 619–620, 1394–1408. [Google Scholar] [CrossRef] [PubMed]
- Woldemichael, A.T.; Hossain, F.; Pielke, R., Sr. Evaluation of surface properties and atmospheric disturbances caused by post-dam alterations of land use/land cover. Hydrol. Earth Syst. Sci. 2014, 18, 3711–3732. [Google Scholar] [CrossRef]
- Hounkpè, J.; Diekkrüger, B.; Afouda, A.A.; Sintondji, L.O. Land use change increases flood hazard: A multi-modelling approach to assess change in flood characteristics driven by socio-economic land use change scenarios. Nat. Hazards 2019, 98, 1021–1050. [Google Scholar] [CrossRef]
- Janizadeh, S.; Chandra Pal, S.; Saha, A.; Chowdhuri, I.; Ahmadi, K.; Mirzaei, S.; Mosavi, A.H.; Tiefenbacher, J.P. Mapping the spatial and temporal variability of flood hazard affected by climate and land-use changes in the future. J. Environ. Manag. 2021, 298, 113551. [Google Scholar] [CrossRef] [PubMed]
- Yang, X.; Ren, L.; Singh, V.P.; Liu, X.; Yuan, F.; Jiang, S.; Yong, B. Impacts of land use and land cover changes on evapotranspiration and runoff at Shalamulun River watershed, China. Hydrol. Res. 2012, 43, 23–37. [Google Scholar] [CrossRef]
- Huong HT, L.; Pathirana, A. Urbanization and climate change impacts on future urban flooding in Can Tho city, Vietnam. Hydrol. Earth Syst. Sci. 2013, 17, 379–394. [Google Scholar] [CrossRef]
- Tang, J.; Li, Y.; Cui, S.; Xu, L.; Hu, Y.; Ding, S.; Nitivattananon, V. Analyzing the spatiotemporal dynamics of flood risk and its driving factors in a coastal watershed of southeastern China. Ecol. Indic. 2021, 121, 107134. [Google Scholar] [CrossRef]
- Muis, S.; Güneralp, B.; Jongman, B.; Aerts, J.C.J.H.; Ward, P.J. Flood risk and adaptation strategies under climate change and urban expansion: A probabilistic analysis using global data. Sci. Total Environ. 2015, 538, 445–457. [Google Scholar] [CrossRef]
- Rahmati, O.; Darabi, H.; Panahi, M.; Kalantari, Z.; Naghibi, S.A.; Ferreira, C.S.S.; Kornejady, A.; Karimidastenaei, Z.; Mohammadi, F.; Stefanidis, S.; et al. Development of novel hybridized models for urban flood susceptibility mapping. Sci. Rep. 2020, 10, 12937. [Google Scholar] [CrossRef]
- Nicholls, R.J.; Reeder, T.; Brown, S.; Haigh, I.D. The Risks of Sea-Level Rise for Coastal Cities; Centre of Science and Policy: Cambridge, UK, 2017. [Google Scholar]
- Ke, Q.; Jonkman, S.; Van Gelder, P.; Bricker, J.D. Frequency Analysis of Storm-Surge-Induced Flooding for the Huangpu River in Shanghai, China. J. Mar. Sci. Eng. 2018, 6, 70. [Google Scholar] [CrossRef]
- Shan, X.; Wen, J.; Zhang, M.; Wang, L.; Ke, Q.; Li, W.; Du, S.; Shi, Y.; Chen, K.; Liao, B.; et al. Scenario-Based Extreme Flood Risk of Residential Buildings and Household Properties in Shanghai. Sustainability 2019, 11, 3202. [Google Scholar] [CrossRef]
- Tsakiris, G. Flood risk assessment: Concepts, modelling, applications. Nat. Hazards Earth Syst. Sci. 2014, 14, 1361–1369. [Google Scholar] [CrossRef]
- Winsemius, H.C.; Van Beek LP, H.; Jongman, B.; Ward, P.J.; Bouwman, A. A framework for global river flood risk assessments. Hydrol. Earth Syst. Sci. 2013, 17, 1871–1892. [Google Scholar] [CrossRef]
- Ganguli, P.; Reddy, M.J. Probabilistic assessment of flood risks using trivariate copulas. Theor. Appl. Climatol. 2013, 111, 341–360. [Google Scholar] [CrossRef]
- Wang, Y.; Liu, M.; Xing, Z.; Liu, H.; Song, J.; Hou, Q.; Xu, Y. Study of Nonstationary Flood Frequency Analysis in Songhua River Basin. Water 2023, 15, 3443. [Google Scholar] [CrossRef]
- Chen, W.; Huang, G.; Zhang, H. Urban stormwater inundation simulation based on SWMM and diffusive overland-flow model. Water Sci. Technol. 2017, 76, 3392–3403. [Google Scholar] [CrossRef] [PubMed]
- Maryam, M.; Kumar, R.; Thahaby, N. Assessment of the Hydraulic Performance of the Urban Drainage System due to Climate Change using DHI MIKE URBAN. J. Biomed. Res. Environ. Sci. 2021, 2, 261–267. [Google Scholar] [CrossRef]
- Verma, R.K.; Verma, S.; Mishra, S.K.; Pandey, A. SCS-CN-Based Improved Models for Direct Surface Runoff Estimation from Large Rainfall Events. Water Resour. Manag. 2021, 35, 2149–2175. [Google Scholar] [CrossRef]
- Sharma, S.; Roy, P.S.; Chakravarthi, V.; Srinivasarao, G.; Bhanumurthy, V. Extraction of detailed level flood hazard zones using multi-temporal historical satellite data-sets—A case study of Kopili River Basin, Assam, India. Geomat. Nat. Hazards Risk 2017, 8, 792–802. [Google Scholar]
- Chawan, A.; Kakade, V.; Jadhav, J. Automatic Detection of Flood Using Remote Sensing Images. J. Inf. Technol. Digit. World 2020, 02, 11–26. [Google Scholar] [CrossRef]
- Smith, A.; Bates, P.D.; Wing, O.; Sampson, C.; Quinn, N.; Neal, J. New estimates of flood exposure in developing countries using high-resolution population data. Nat. Commun. 2019, 10, 1814. [Google Scholar] [CrossRef] [PubMed]
- Pham, Q.B.; Ali, S.A.; Bielecka, E.; Calka, B.; Orych, A.; Parvin, F.; Łupikasza, E. Flood vulnerability and buildings’ flood exposure assessment in a densely urbanised city: Comparative analysis of three scenarios using a neural network approach. Nat. Hazards 2022, 113, 1043–1081. [Google Scholar] [CrossRef]
- Zhang, M.; Zhai, G.; He, T.; Wu, C. A growing global threat: Long-term trends show cropland exposure to flooding on the rise. Sci. Total Environ. 2023, 899, 165675. [Google Scholar] [CrossRef] [PubMed]
- Shrestha, B.B.; Kawasaki, A.; Zin, W.W. Development of flood damage assessment method for residential areas considering various house types for Bago Region of Myanmar. Int. J. Disaster Risk Reduct. 2021, 66, 102602. [Google Scholar] [CrossRef]
- Mobini, S.; Nilsson, E.; Persson, A.; Becker, P.; Larsson, R. Analysis of pluvial flood damage costs in residential buildings—A case study in Malmö. Int. J. Disaster Risk Reduct. 2021, 62, 102407. [Google Scholar] [CrossRef]
- Dong, B.; Xia, J.; Li, Q.; Zhou, M. Risk assessment for people and vehicles in an extreme urban flood: Case study of the “7.20” flood event in Zhengzhou, China. Int. J. Disaster Risk Reduct. 2022, 80, 103205. [Google Scholar] [CrossRef]
- Nithila, A.N.; Shome, P.; Islam, I. Waterlogging induced loss and damage assessment of urban households in the monsoon period: A case study of Dhaka, Bangladesh. Nat. Hazards 2022, 110, 1565–1597. [Google Scholar] [CrossRef]
- Xiao, S.; Zou, L.; Xia, J.; Dong, Y.; Yang, Z.; Yao, T. Assessment of the urban waterlogging resilience and identification of its driving factors: A case study of Wuhan City, China. Sci. Total Environ. 2023, 866, 161321. [Google Scholar] [CrossRef]
- De Moel, H.; Jongman, B.; Kreibich, H.; Merz, B.; Penning-Rowsell, E.; Ward, P.J. Flood risk assessments at different spatial scales. Mitig. Adapt. Strateg. Glob. Change 2015, 20, 865–890. [Google Scholar] [CrossRef]
- De Kok, J.L.; Grossmann, M. Large-scale assessment of flood risk and the effects of mitigation measures along the Elbe River. Nat. Hazards 2010, 52, 143–166. [Google Scholar] [CrossRef]
- Gabriels, K.; Willems, P.; Van Orshoven, J. A comparative flood damage and risk impact assessment of land use changes. Nat. Hazards Earth Syst. Sci. 2022, 22, 395–410. [Google Scholar] [CrossRef]
- Dwarakish, G.S.; Ganasri, B.P. Impact of land use change on hydrological systems: A review of current modeling approaches. Cogent Geosci. 2015, 1, 1115691. [Google Scholar] [CrossRef]
- Patil, N.S.; Nataraja, M. Effect of land use land cover changes on runoff using hydrological model: A case study in Hiranyakeshi watershed. Model. Earth Syst. Environ. 2020, 6, 2345–2357. [Google Scholar] [CrossRef]
- Estrella, M.; Saalismaa, N.; Renaud, F.G. Reduction (Eco-DRR):an overview. In The Role of Ecosystems in Disaster Risk Reduction; United Nations University Press: Tokyo, Japan, 2013; Volume 26. [Google Scholar]
- Sun, X.; Li, R.; Shan, X.; Xu, H.; Wang, J. Assessment of climate change impacts and urban flood management schemes in central Shanghai. Int. J. Disaster Risk Reduct. 2021, 65, 102563. [Google Scholar] [CrossRef]
- Tu, J.; Wen, J.; Yang, L.E.; Reimuth, A.; Young, S.S.; Zhang, M.; Wang, L.; Garschagen, M. Assessment of building damage and risk under extreme flood scenarios in Shanghai. Nat. Hazards Earth Syst. Sci. 2023, 23, 3247–3260. [Google Scholar] [CrossRef]
- Balica, S.F.; Wright, N.G.; Van Der Meulen, F. A flood vulnerability index for coastal cities and its use in assessing climate change impacts. Nat. Hazards 2012, 64, 73–105. [Google Scholar] [CrossRef]
- Shan, X.; Yin, J.; Wang, J. Risk assessment of shanghai extreme flooding under the land use change scenario. Nat. Hazards 2022, 110, 1039–1060. [Google Scholar] [CrossRef]
- Quan, R. Risk assessment of flood disaster in Shanghai based on spatial–temporal characteristics analysis from 251 to 2000. Environ. Earth Sci. 2014, 72, 4627–4638. [Google Scholar] [CrossRef]
- Quan, R.; Liu, M.; Lu, M.; Zhang, L.; Wang, J.; Xu, S. Waterlogging risk assessment based on land use/cover change: A case study in Pudong New Area, Shanghai. Environ. Earth Sci. 2010, 61, 1113–1121. [Google Scholar] [CrossRef]
- Yin, Z.; Yin, J.; Xu, S.; Wen, J. Community-based scenario modelling and disaster risk assessment of urban rainstorm waterlogging. J. Geogr. Sci. 2011, 21, 274–284. [Google Scholar] [CrossRef]
- Wang, L.; Zhang, M.; Wen, J.; Chong, Z.; Ye, Q.; Ke, Q. Simulation of Extreme compound Costal Flooding in Shanghai. Adv. Water Sci. 2019, 30, 546–555. [Google Scholar]
- DB31/T 1043–2017; Standard of Rainstorm Intensity Formula and Design Rainstorm Distribution. Shanghai Engineering Design Institute: Shanghai, China, 2017.
- Ke, Q. Flood Risk Analysis for Metropolitan Areas: A Case Study for Shanghai. Ph.D. Thesis, TU Delft: Dlft University of Technology, Delft, The Netherlands, 2014. [Google Scholar]
- Quan, R. Vulnerability analysis of rainstorm waterlogging on buildings in central urban area of Shanghai based on scenario simulation. Sci. Geogr. Sin. 2014, 34, 1399–1403. [Google Scholar]
- Yin, Z.; Bao, L.; Yin, J. GIS-based study on vulnerability to rainstorm inundation in Pudong of Shanghai. J. Nat. Disasters 2011, 20, 29–35. [Google Scholar]
- Boughton, W.C. A review of the USDA SCS curve number method. Soil Res. 1989, 27, 511–523. [Google Scholar] [CrossRef]
- Yao, L.; Chen, L.; Wei, W.; Sun, R. Potential reduction in urban runoff by green spaces in Beijing: A scenario analysis. Urban For. Urban Green. 2015, 14, 300–308. [Google Scholar] [CrossRef]
- Quan, R.; Liu, M.; Hou, L.; Lu, M.; Zhang, L.; Ou, D.; Xu, S.; Yu, L. Impact of land use dynamic change on surface runoff: A case study on Shanghai Pudong New District. J. Catastr. 2009, 24, 44–49. [Google Scholar]
- Yin, Z.; Xu, S.; Yin, J.; Wang, J. Small-scale based scenario modeling and disaster risk assessment of urban rainstorm water-logging. Acta Geogr. Sin. 2010, 65, 553–562. [Google Scholar]
- Li, W.; Lan, Z.; Chen, D.; Zheng, Z. Multi-scenario simulation of land use and its spatial-temporal response to ecological risk in Guangzhou city. Bull. Soil Water Conserv. 2020, 40, 204–210. [Google Scholar]
- Ma, X.; Lin, P.; Chen, Z. Simulation of Land Use Spatial Layout Based on FLUS Model: A Case Study of Huadu District, Guangzhou. Adv. Soc. Sci. 2019, 8, 1327–1341. [Google Scholar]
- Phinyoyang, A.; Ongsomwang, S. Optimizing Land Use and Land Cover Allocation for Flood Mitigation Using Land Use Change and Hydrological Models with Goal Programming, Chaiyaphum, Thailand. Land 2021, 10, 1317. [Google Scholar] [CrossRef]
- Peng, J.; Wei, H.; Wu, W.H.; Liu, Y.X.; Wang, Y.L. Storm flood disaster risk assessment in urban area based on the simulation of land use scenarios: A case of Maozhou Watershed in Shenzhen City. Acta Ecol. Sin. 2018, 38, 3741–3755. [Google Scholar]
- Du, S.; Wang, C.; Shen, J.; Wen, J.; Gao, J.; Wu, J.; Lin, W.; Xu, H. Mapping the capacity of concave green land in mitigating urban pluvial floods and its beneficiaries. Sustain. Cities Soc. 2019, 44, 774–782. [Google Scholar] [CrossRef]
- Kasprzyk, M.; Szpakowski, W.; Poznańska, E.; Boogaard, F.C.; Bobkowska, K.; Gajewska, M. Technical solutions and benefits of introducing rain gardens—Gdańsk case study. Sci. Total Environ. 2022, 835, 155487. [Google Scholar] [CrossRef] [PubMed]
- Crichton, D. The risk triangle. Nat. Disaster Manag. 1999, 102, 102–103. [Google Scholar]
- Xu, H.; Gao, J.; Yu, X.; Wang, C.; Liu, Y.; Wen, J.; Qin, Q. Study on Suburban Land Use Optimization from the Perspective of Flood Mitigation—A Case Study of Pujiang Country Park in Shanghai. Sustainability 2024, 16, 3436. [Google Scholar] [CrossRef]
- Du, S.; Scussolini, P.; Ward, P.J.; Zhang, M.; Wen, J.; Wang, L.; Koks, E.; Diaz-Loaiza, A.; Gao, J.; Ke, Q.; et al. Hard or soft flood adaptation? Advantages of a hybrid strategy for Shanghai. Glob. Environ. Chang. 2020, 61, 102037. [Google Scholar] [CrossRef]


| Inundation Depth (m) | [0, 0.5) | [0.5, 1) | [1, 1.5) | [1.5, 2.5) |
| Damage Ratio (%) | 55 | 70 | 80 | 95 |
| Categories | Price (CNY/m2) | Data Source |
|---|---|---|
| Industrial construction costs (A standard factory building cost benchmark) | 1100 | Jiading District Statistical Yearbook (2020), Shanghai Statistical Yearbook (2020), Reference Standards for Cost of Various Construction Projects in Shanghai |
| Indoor properties of industrial buildings (Output of industrial enterprises above a designated size) | 1460 | |
| Construction cost of public buildings (Cost benchmark for ordinary office buildings, shops, and schools) | 1500 | |
| Indoor properties of public buildings (Consistent with indoor properties of residential buildings) | 800 | |
| Residential construction costs (A commercial housing cost benchmark) | 1400 | |
| Indoor properties of residential buildings (Field research) | 800 | |
| Farmland properties (Output of the planting industry in 2020) | 5.5 |
| Land Use | CN Value for Hydrologic Soil Group | ||
|---|---|---|---|
| A | B | D | |
| Green land | 34 | 60 | 80 |
| Farmland | 67 | 76 | 86 |
| Water area | 100 | 100 | 100 |
| Industrial land | 89 | 92 | 95 |
| Other land | 69 | 80 | 86 |
| Residential land | 77 | 85 | 92 |
| Transportation land | 98 | 98 | 98 |
| Public building land | 90 | 93 | 96 |
| Land Use Scenarios | Explanation |
|---|---|
| Natural development scenario (Scenario ND) | This refers to a situation in which land use change is not significant, there has been no excessive interference from human society, and the study area is in a state of natural development. |
| Economic growth scenario (Scenario EG) | This refers to the rapid expansion of urban areas while strictly adhering to the constraints of the bottom line of planning, and, in this case, the study area is in a state of rapid urbanization. |
| Ecological development priority scenario (Scenario EP) | This refers to the continuous expansion of ecological area, aimed at alleviating ecological and environmental problems, and, in this case, the study area is in an ecologically livable state. |
| Landscape Pattern Index | Formula | Explanation |
|---|---|---|
| Class area (CA) | This refers to the total area of a certain patch type, which is a component of the landscape and also the basis for calculating other indicators. | |
| Number of patches (NP) | This reflects the spatial pattern of the landscape, which can be used to describe landscape heterogeneity. | |
| Landscape shape index (LSI) | This reflects the degree of aggregation based on the shape characteristics of types of patches. | |
| Aggregation index (AI) | This reflects the concentration levels of certain patches. |
| Land Use | 1980 | 1990 | 2000 | 2006 | 2013 | 2020 | 1980 to 2022 |
|---|---|---|---|---|---|---|---|
| Green land | 3.56 | 3.56 | 0.88 | 0.88 | 1.76 | 4.06 | 0.50 |
| Farmland | 33.55 | 27.06 | 23.46 | 20.24 | 10.33 | 6.24 | −27.31 |
| Water area | 0.27 | 0.27 | 2.31 | 2.24 | 1.93 | 2.42 | 2.15 |
| Industrial land | 0.00 | 5.68 | 5.42 | 7.59 | 10.86 | 11.25 | 11.25 |
| Other land | 0.00 | 0.00 | 0.15 | 0.65 | 1.04 | 2.20 | 2.20 |
| Residential land | 3.64 | 4.45 | 7.27 | 7.34 | 9.35 | 8.23 | 4.59 |
| Transportation land | 1.16 | 1.16 | 2.67 | 3.24 | 6.63 | 7.39 | 6.23 |
| Public building land | 0.00 | 0.00 | 0.10 | 0.16 | 0.40 | 0.48 | 0.48 |
| Year | Return Period | ||
|---|---|---|---|
| 10-Year | 50-Year | 100-Year | |
| 1980 | 2.1 | 3.7 | 4.5 |
| 1990 | 2.4 | 4.0 | 4.9 |
| 2000 | 2.9 | 4.7 | 5.6 |
| 2006 | 3.1 | 5.0 | 5.9 |
| 2013 | 3.7 | 5.7 | 6.7 |
| 2020 | 3.8 | 5.7 | 6.7 |
Disclaimer/Publisher’s Note: The statements, opinions and data contained in all publications are solely those of the individual author(s) and contributor(s) and not of MDPI and/or the editor(s). MDPI and/or the editor(s) disclaim responsibility for any injury to people or property resulting from any ideas, methods, instructions or products referred to in the content. |
© 2024 by the authors. Licensee MDPI, Basel, Switzerland. This article is an open access article distributed under the terms and conditions of the Creative Commons Attribution (CC BY) license (https://creativecommons.org/licenses/by/4.0/).
Share and Cite
Xu, H.; Gao, J.; Yu, X.; Qin, Q.; Du, S.; Wen, J. Assessment of Rainstorm Waterlogging Disaster Risk in Rapidly Urbanizing Areas Based on Land Use Scenario Simulation: A Case Study of Jiangqiao Town in Shanghai, China. Land 2024, 13, 1088. https://doi.org/10.3390/land13071088
Xu H, Gao J, Yu X, Qin Q, Du S, Wen J. Assessment of Rainstorm Waterlogging Disaster Risk in Rapidly Urbanizing Areas Based on Land Use Scenario Simulation: A Case Study of Jiangqiao Town in Shanghai, China. Land. 2024; 13(7):1088. https://doi.org/10.3390/land13071088
Chicago/Turabian StyleXu, Hui, Junlong Gao, Xinchun Yu, Qianqian Qin, Shiqiang Du, and Jiahong Wen. 2024. "Assessment of Rainstorm Waterlogging Disaster Risk in Rapidly Urbanizing Areas Based on Land Use Scenario Simulation: A Case Study of Jiangqiao Town in Shanghai, China" Land 13, no. 7: 1088. https://doi.org/10.3390/land13071088
APA StyleXu, H., Gao, J., Yu, X., Qin, Q., Du, S., & Wen, J. (2024). Assessment of Rainstorm Waterlogging Disaster Risk in Rapidly Urbanizing Areas Based on Land Use Scenario Simulation: A Case Study of Jiangqiao Town in Shanghai, China. Land, 13(7), 1088. https://doi.org/10.3390/land13071088