Abstract
To prevent the degradation of light-textured soils, it is advisable to use them for grasslands. These soil management systems help with the faster accumulation of soil organic carbon (SOC), thereby improving the soil’s properties and reducing carbon emissions from agricultural land. In this experiment, we studied the distribution of multi-component perennial grass roots in the Arenosol profile and their impact on SOC sequestration in temperate climate zones. Our research aimed to identify differences in root biomass at depths of 0–15 cm, 15–30 cm, and 30–50 cm and to assess their correlation with SOC and dissolved organic carbon (DOC) in the soil. The roots, shoots, and soil samples of fertilized and unfertilized grasslands were collected at the flowering stage and after the final grass harvest two years in a row. Our findings revealed that, in sandy loam Arenosol rich in stones, 12.4–15.9 Mg ha−1 of root biomass was accumulated at 0–50 cm of soil depth. The application of NPK fertilizers did not significantly affect grass root biomass, but significantly affected shoot biomass. Most roots (84–88%) were concentrated in the 0–15 cm layer. On average, 5.10–6.62 Mg ha−1 of organic carbon (OC) was stored in the roots of perennial grasses within 0–50 cm of soil depth. We found that the SOC content in the 0–50 cm soil layer correlated more strongly (r = 0.62, p < 0.001) with C accumulated in the roots of the corresponding layer than with shoot biomass (r = 0.41, p = 0.04). However, a significant correlation was found between DOC and shoot biomass (r = 0.68, p < 0.001) and between DOC and the biomass of residues (r = 0.71, p < 0.001), explaining the significant increase in DOC in the 30–50 cm soil layer and indicating the leaching of mobile soil organic matter (SOM) substances from the above-ground biomass using fertilizers.
1. Introduction
The sustainable development strategy encompasses various goals and varying priorities depending on each country’s specific problems. However, in all countries, one of the most crucial objectives is to mitigate climate change and ensure the sustainable development of ecosystems. Soil is the most vital component of the terrestrial ecosystem, providing numerous ecosystem services such as maintaining water quality and plant productivity, regulating soil nutrient recycling and decomposition, and sequestering greenhouse gases from the atmosphere [1,2,3]. However, the increasing human population necessitates more food production, intensifying agricultural soil use. This can result in soil degradation, as agrotechnical practices often disrupt the ecological balance found in natural ecosystems [4,5,6,7].
Although low-productivity soils are susceptible to human impact, they are also used for agricultural production. To stabilize or improve their properties and prevent degradation, it is recommended to use forest and grassland [8,9]. These soil management systems have a faster accumulation of SOC, enhancing the soil’s physical, chemical, and microbiological properties and reducing carbon emissions from agricultural land. Reference [10] claims that root biomass and length are greater in perennial grasslands compared to annual crops, and they are an important factor in maintaining the productivity and soil quality of perennial grasslands without significant costs. Plant residues and roots contribute to the accumulation of surface OC and increases in soil quality. Agricultural soils benefit from reintroducing perennial grasses into the landscape, regaining soil organic matter and strengthening their capacity for long-term productivity and environmental resiliency [11]. The productivity of grassland is not constant; it fluctuates due to various factors, including soil quality, dominant perennial grass species, meteorological conditions, fertilization, and land use [12,13].
It is important to note that the positive effect of grassland on carbon sequestration is inconsistent across all regions [14,15,16]. Studies conducted in the temperate zone of Latvia on various soils did not confirm differences in carbon accumulation between arable land use and grassland. The research authors attributed these results to the dynamic changes in land use over the past decades and the significant impact of extensively cultivated arable land on carbon accumulation rates [17]. Also, scientific publications widely discuss the effects of different agricultural practices on developing grasses’ above-ground and underground biomass, as well as their soil properties. In reference [18], grassland management regimes affected grass production and species composition.
Regarding mineral nitrogen fertilization, it decreases the presence of legumes and herbs. These changes in above-ground plant biomass and botanical composition also affect root distribution and morphometric parameters. Long-term grassland fertilization experiments conducted in Germany and the Netherlands found that fertilization significantly positively affected SOC stocks [19]. Annual sequestration rates ranged from 0.13 to 0.37 Mg ha−1 yr−1 depending on the fertilization. However, it has also been demonstrated that the mass of grass roots is not influenced by applied fertilization [19]. According to the research, the increase in SOC in grasslands cannot be attributed only to altered below-ground carbon inputs or decomposition rates, as the carbon stocks in the roots were unaffected by fertilization and potential litter decomposition remained unchanged. Nevertheless, fertilization resulted in lower ranges of root carbon to nitrogen ratios in the treated areas. This lower range may have increased microbial carbon use efficiency, leading to higher carbon sequestration rates per unit of carbon entering the soil.
Plants with higher root biomass have been found to have a more significant effect on SOC sequestration, but this also depends on root properties. Roots with the lowest lignin and cellulose contents and the highest nitrogen content have a higher rate of decomposition [20]. The important influence of root lignin on SOC sequestration has also been noted in publications by other authors [21,22]. Additionally, SOC sequestration is affected by soil texture, particularly the amount of clay and silt particles, which account for over 90% of the total soil content [23]. According to a study conducted in Great Britain by Ward [24], significant amounts of carbon in subsurface soil are below 30 cm, which is not accounted for in standard carbon inventories. Additional research also suggests that soil organic carbon stored in grasslands at depths below 30 cm may not be significantly affected by management changes over extended periods, thus contributing to soil carbon conservation [25].
We conducted an experiment to indicate the locations of multi-component perennial grass roots in the Arenosol profile and their impact on SOC sequestration. The research aimed to (1) determine differences in root mass distribution in the 0–15, 15–30, and 30–50 cm layers; (2) evaluate the influence of mineral fertilizers on root biomass; (3) measure the accumulation of OC in the roots and assess its correlation with SOC in the soil; and (4) estimate the above-ground effect of plant residues on SOC accumulation. We believe that the results of our research will be useful and help to further develop the concept of the effect of perennial grasses on soil properties, especially carbon sequestration in soil.
2. Materials and Methods
2.1. Study Object and Experimental Site
The study was carried out as a long-term experiment (since 1995) in which the influence of different land uses on Arenosol properties was studied. This paper examines only the data of grassland research linked to its productivity and the formation of plant root biomass in the soil profile. The experimental field is located in the LAMMC Voke Branch, Vilnius, Lithuania (54°33′49.8″ N, 25°05′12.9″ E), classified as a temperate climate zone. This region is characterized by a moderate climate, with a mean long-term (1991–2020) annual precipitation of 678 mm and an annual mean air temperature of 7.2 °C (the standard climate norm—SCN) [26]. The soil is classified as Endocalcaric Arenosol formed on fluvioglacial deposits, with the following profile: Ah-AB-B1-B2-2Cα1-2Cα2 [27]. Carbonates were identified at a depth of 80–100 cm. The soil texture characteristics are presented in Table 1. The number of coarse particles (>2000 μm) in the upper depth of 0–15 cm was 15.2–17.6% of the soil mass; at 15–30 cm, it slightly increased to 18.6–20.1%; and it significantly increased in the 30–50 cm layer.

Table 1.
Arenosol A horizon (0–20 cm) and AB horizon texture (%) and coarse particles (>2000 μm). content.
At the start of the experiment (1995), in the topsoil (0–28 cm), pHKCl was 6.8, plant-available phosphorus was 177 mg P2O5 kg−1, plant-available potassium was 174 mg K2O kg−1, and OC was 9.9 g kg−1. After 27 years, the soil’s acidity increased to pHKCl 5.9–6.1, which was associated with plant uptake and removal of calcium and magnesium from the soil with plant yield and leaching of these elements from the upper soil layer. The soil was saturated with exchangeable cations (Ca2+; Mg2+) because the layer of carbonate rock started at 80 cm depth. In the unfertilized site, during the research period, available phosphorus and potassium in the soil decreased accordingly by 100 mg P2O5 kg−1 and 104 K2O kg−1, while in the fertilized site, using balanced fertilization, the available phosphorus increased from 177 to 208 mg P2O5 kg−1 and the concentration of potassium changed insignificantly. In the GRf site, the accumulation of Corg significantly increased in the Ah horizon (Table 2).
Table 2.
Arenosol Ah horizon properties.
At the grassland sites (each 200 m2), a grass–legume mixture was grown. In 1995–2006, it included 40% alfalfa (Medicago sativa L.) and 4 species of grasses: 20% red fescue (Festuca rubra L.), 20% bromegrass (Bromus inermis Leyss.), 10% cock’s-foot grass (Dactylis glomerata L.), and 10% meadowgrass (Poa pratensis L.). During the experiment period (1995–2023), in 2007 and 2015, they were resown to ensure the grasses’ productivity. The same grass mixture was grown in 2007–2023, and only in 2007 was cock’s-foot replaced by timothy (Phleum pratense L.). The grass was fertilized with N60 + 30 P90K120 at the fertilized site. Nitrogen (N60), phosphorus (P90), and potassium (K120) fertilizers were applied at the beginning of grass vegetation (the last ten days of March to the first ten days of April). The grass was fertilized for the second time with nitrogen fertilizer (N30) after the first grass cutting (during the first ten days of July). During the vegetation period, these grasses were cut twice or three times. The first grass-cutting was performed during the flowering phase of alfalfa (in the first ten days of July). The second cutting was performed in the first ten days of September. With a more extended and rainy vegetation period, the grass was cut three times—in the third ten days of June, the second ten days of August, and the first ten days of October. The biomass was removed from the experiment area every time.
2.2. Meteorological Conditions in 2022–2023
In Lithuania, plant vegetation begins in March and continues until November, when the air temperature drops below +5.0 °C. According to SCN, the average monthly air temperature in the summer is 16.3–18.5 °C, and the average rainfall is 65–92 mm (Table 3). The least precipitation (41–48 mm) falls in the cold period of the year (January, February, March). The average monthly air temperature in winter varies from −2.0 °C in December to −3.9 °C; there are often thaws. A flushing type of soil moisture regime characterizes Lithuania. Rainfall–runoff varies from 0.3 to 0.2 in different regions of Lithuania [28].
Table 3.
Air temperature and precipitation in 2022–2023.
In 2022, the vegetation period of the grasses was especially rainy; precipitation exceeded SCN by 118–199% in May–July. But from August to November, dry weather prevailed, and the precipitation comprised only 53–74% of the SCN. The air temperature in almost all months (except April, May, July, and September) exceeded the SCN (+0.4–5.9 °C). At the beginning of the vegetation period in 2023, the precipitation was 25–45% lower than SCN; only in August did abundant precipitation fall (162% of SCN). October was also rainy (189% SCN). As in 2022, the average air temperature of each month exceeded the SCN (+0.9–3.9 °C), except for May, July, and November.
2.3. Plant Shoot and Root Sampling
The biomass yield of the above-ground part of the plants was determined at each harvest. The botanical composition of the grass mixture (grasses, alfalfa, herbs) was determined after the first and second harvest. Before root collection, above-ground green mass (g m−2) and grass residue (g m−2) were recorded at the selected location. Grass root samples were taken with cores 0.085 m in diameter and 0–0.50 m in length (volume 3925 cm3) from three soil layers (0–0.15 m, 0.15–0.30 m and 0.30–0.50 m) at the flowering stage of the grass (end of June) and after the last grass harvest in 2022 and 2023. All samples (plant, root, and soil) were taken in three replicates from the unfertilized and NPK fertilized plots. The collected samples were tightly packed into plastic bags and stored in a freezer at +5 °C until analysis. Before analysis, soil samples with roots were carefully washed with water using 2.0 mm, 0.50 mm, and 0.25 mm sieves. Root samples were dried in an air flow oven for 48 h at 60 °C [29]. After separating the roots, a soil sample was taken for moisture determination, and the masses of coarse particles and stones were weighed. These data were used to recalculate the root mass per t ha−1 of dry soil [30].
2.4. Chemical Analysis
Soil chemical properties were determined as follows: the soil pHKCl was measured using the ISO 10390:2005 potentiometric method (1:5); plant-available P2O5 and K2O were extracted using 0.03 M ammonium lactate (Egner-Riehm-Domingo A–L method); the amount of exchangeable cations (Ca2+, Mg2+) was measured using atomic absorption spectrometry with an AAnalyst 200 instrument (Perkin Elmer, Waltham, MA, USA). Before the analysis, a wet digestion process with sulfuric acid was performed. The instrument utilized an air–acetylene flame and a hollow cathode lamp for the atomic absorption spectrometry measurements [31]. SOC was determined by the Nikitin modified Tyurin dichromate oxidation method using wet combustion at 160 °C. SOC measurement was performed using a spectrophotometer at a wavelength of 590 nm, with glucose as a standard [32]. The DOC analysis procedure was performed according to the methodology guided by the San++ Continuous Flow Ion Analyzer (SKALAR, The Nederlands) using C8H5KO4 as a standard. The sieved soil was poured with 0.025 mol L−1 solution of K2SO4; the prepared extract was filtered through a 0.45 μm PTFE filter; then, the automated measurement procedure, which is based on the IR detection method following UV-catalyzed persulfate oxidation under nitrogen, was performed [33]. Soil bulk density was determined using the Core method, which involves pressing a metal ring into the soil (intact core) and determining its weight after drying [34].
The amount of C in plants (g kg−1) was determined by the Nikitin-modified Tyurin dichromate oxidation method, and total N (g kg−1) by the Kjeldal method, which involved a spectrophotometric measurement at 655 nm. The C:N ratio was calculated as the relationship between C (g kg−1) and nitrogen content (N g kg−1) in the plants’ biomass.
2.5. Statistical Analysis
All data were analyzed using SAS Enterprise software, version 7.1 (SAS Institute Inc., Cary, NC, USA). The differences between the experimental treatments were tested using one-way and two-way analysis of variance (ANOVA). The significance of differences was set if the probability level was lower than or equal to 0.05. The linear regression analysis revealed the relationship between root biomass C, SOC, and DOC concentration in the soil. Duncan’s post hoc test was used to carry out multiple comparisons.
3. Results
3.1. Above-Ground Biomass and C and N Accumulation of Perennial Grasses
Under the climatic conditions of Lithuania (temperate climate zone), harvesting the perennial grassland two to three times is possible. The number of cuts is usually linked to precipitation during the growing season. If there is a sufficient amount (40–70 mm per month), three cuts of above-ground biomass can be made in perennial grassland. During the research period, the average annual DM yield of grass biomass in the fertilized treatment at the GRf site was 1084 g DM m−2 (Table 4). Without fertilization, the grass yield was reduced by two times due to the lack of nutritional elements in the sandy soil (p < 0.05). The above-ground grass biomass yield did not correlate with biomass of plant roots in the 0–50 cm layer, and only shoot biomass was significantly increased by fertilization (Table 5).
Table 4.
Above-ground biomass yield of perennial grasses. Average data for 2022–2023.
Table 5.
Pearson correlation coefficients of root biomass and residue biomass with SOC and DOC concentrations in soil.
For fodder production, the above-ground part of the plants was cut, but the leaves close to the ground surface remained on the surface. They were later mineralized, replenishing the reserves of carbon and other elements in the soil. On average, after the last grass harvest (the last ten days of September), 133 g DM m−2 of residues in the GRunf site remained on the soil surface. At the fertilized site, it was significantly more, reaching 193 g DM m−2 (p < 0.05). However, it should be noted that relatively more grass residue (28.7% of the total above-ground biomass) remains in the GRunf site compared to the GRf (17.4%). Without fertilizers, the grasses do not grow high in the sandy soil and there are more different herbs, which results in more grass residues being found on the surface after harvesting. The remaining residues of grass contained significant concentrations of CO (385–425 g kg−1) and N (3.68–5.86 g kg−1), and, depending on the amount of residue, accumulated an average of 415–1000 kg ha−1 C and 3.04–14.7 kg ha−1 N in total (Table 6). A higher C:N ratio in the residues of grasses in the unfertilized grassland was observed, while it was lower in the fertilized grassland and more favorable to microbial decomposition. After biomass mineralization, these elements can supplement C and N accumulation in the soils.
Table 6.
The yield and C and N contents of remaining grass residues after the last cut.
3.2. Root Biomass, C, and N of Perennial Grasses at Different Depths of Soil
Arenosols formed by fluvioglacial deposits are characterized by a significant amount of stone throughout the profile, which increases in the lower layers of soils. The stoniness values (coarse particles (>2000 μm) of the soil horizons in the 0–15 cm layer were, on average, 15.2–17.7%; in the 15–30 cm layer, 18.6–20.1%; and in the 30–50 cm layer, 22.9–35.2%. These data are essential for calculating the root mass in the soil profile, expressed as Mg ha−1, which also affects the agronomic processes and C sequestration.
According to research data, the grasses formed a rich root system only in the upper layer of Arenosol (Table 7). In the upper 0–15 cm layer, root biomass reached 10.9–13.2 Mg ha−1. In the 15–30 cm depth, the amount of roots drastically decreased to 1.14–1.51 Mg ha−1. This value was the lowest in the 30–50 cm depth, reaching only 0.38–1.06 Mg ha−1 (Table 7). This shows that the main root biomass (84–88% of the total root biomass found in the 0–50 cm depth) formed in the upper 0–15 cm layer. At a depth of 15–30 cm, the amount decreased significantly to 9–10% of the total biomass, and to 3–7% at 30–50 cm of depth.
Table 7.
The biomass of perennial grass roots (Mg DM ha−1) at different soil depths (averaged data of 2022–2023).
The grassland consisted of four species of cereal grasses with an abundant root system, with thin roots located in the top layer of soil, as well as hybrid lucerne, with a deep tap root system. Alfalfa roots introduced into the soil sample significantly increased the mass of roots in all layers, which led to significant differences in the mass of root samples in different replicates and an increase in statistical error.
The botanical composition of the grassland was significantly impacted by the fertilization level. In the unfertilized grassland, alfalfa plants accounted for an average of 13.0% of all plants (p < 0.05), and a high percentage of various herbs (7.9%) was observed. Unfertilized grassland in Arenosol was characterized by rare herb species and a more diverse plant species composition (Table 8). In the NPK-fertilized grassland, there were significantly lower amounts of alfalfa plants (1.7%, p < 0.05) and forbs, but nitrogen fertilizers promoted the development of cereal grasses, especially aggressive species such as bromegrass (Bromus inermis Leyss), which suppressed the growth of other plants.
Table 8.
Botanical composition of the grasslands.
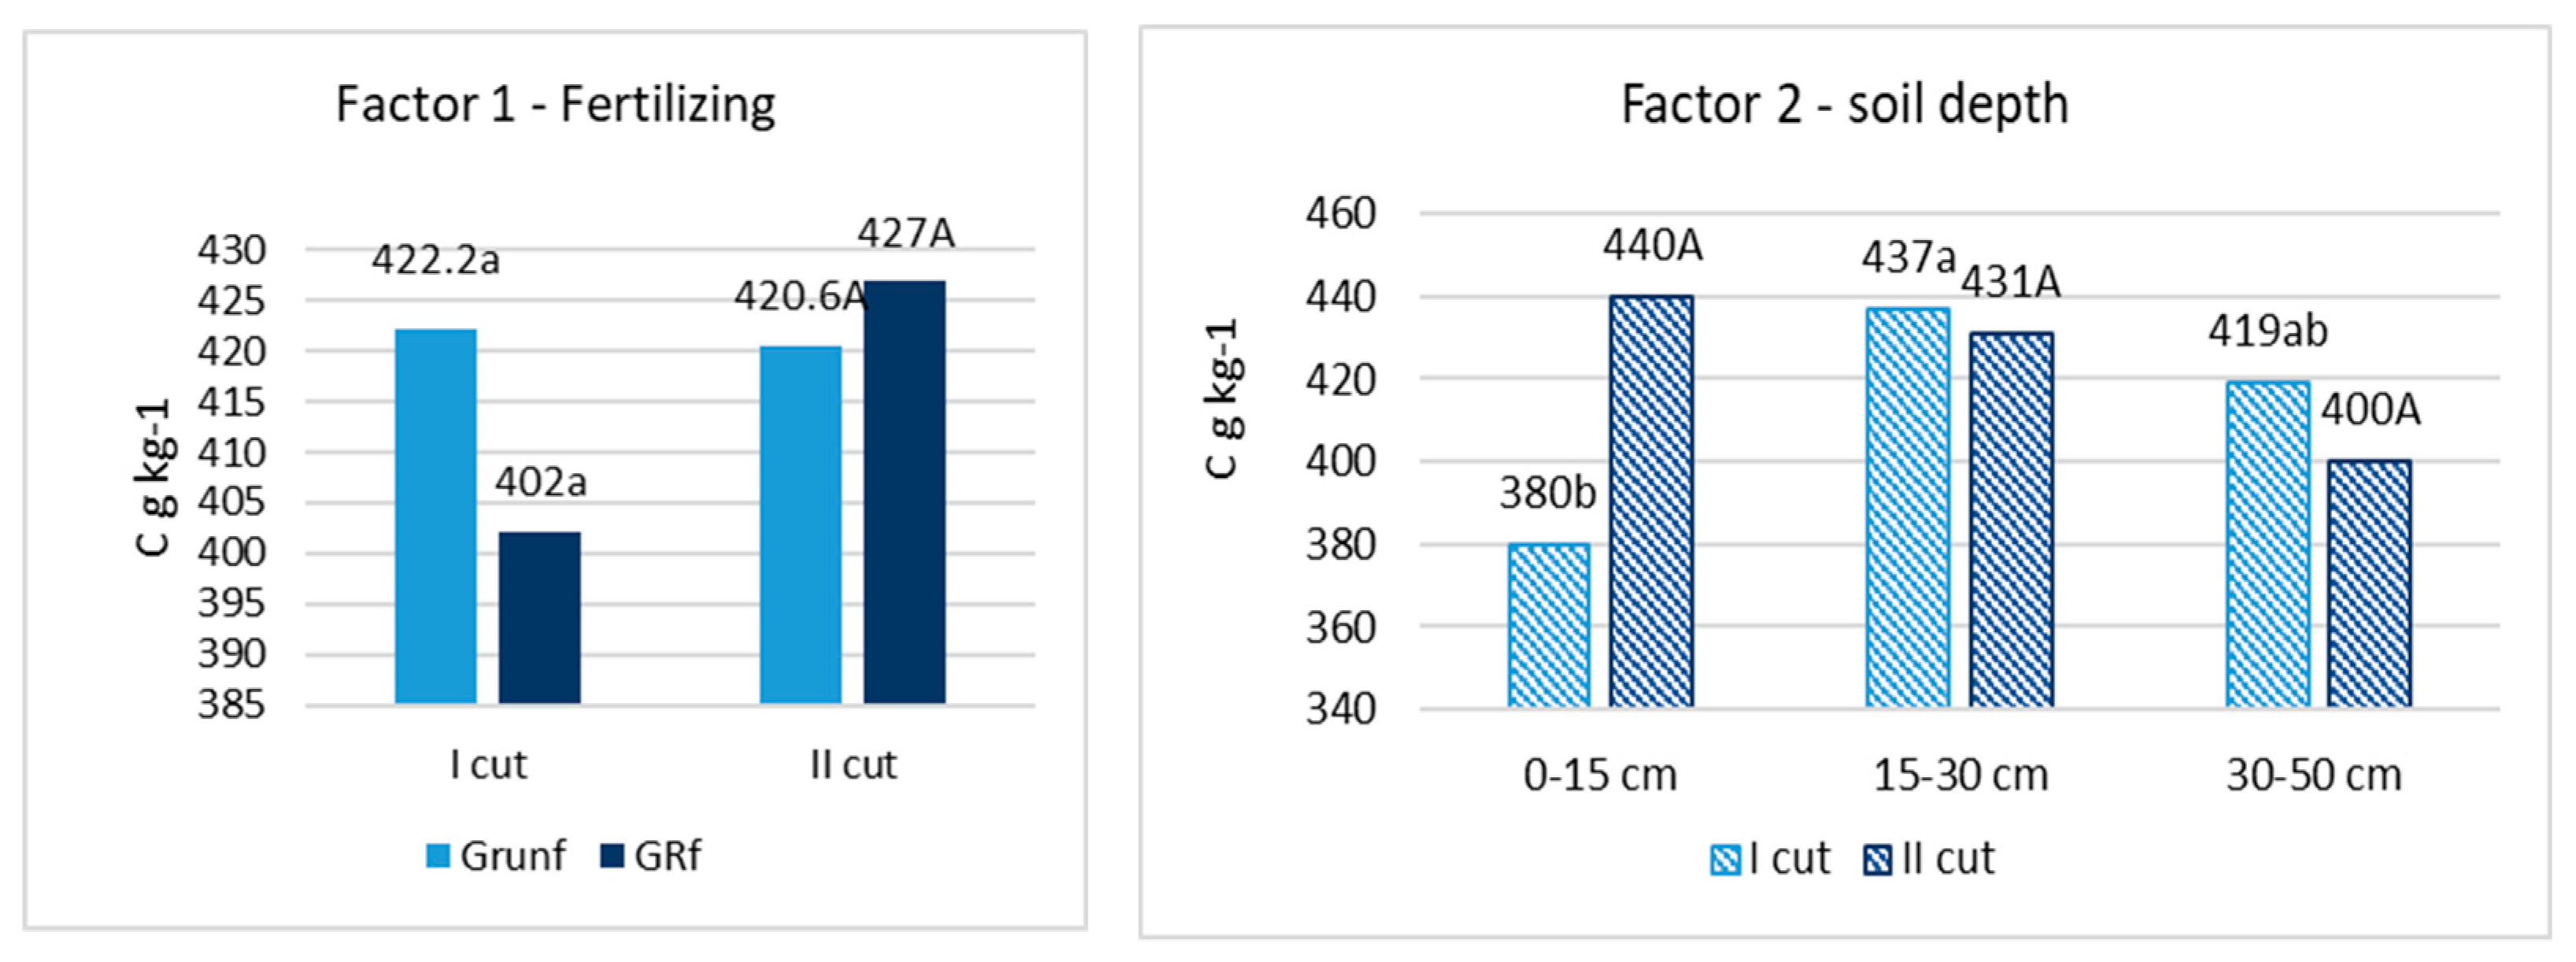
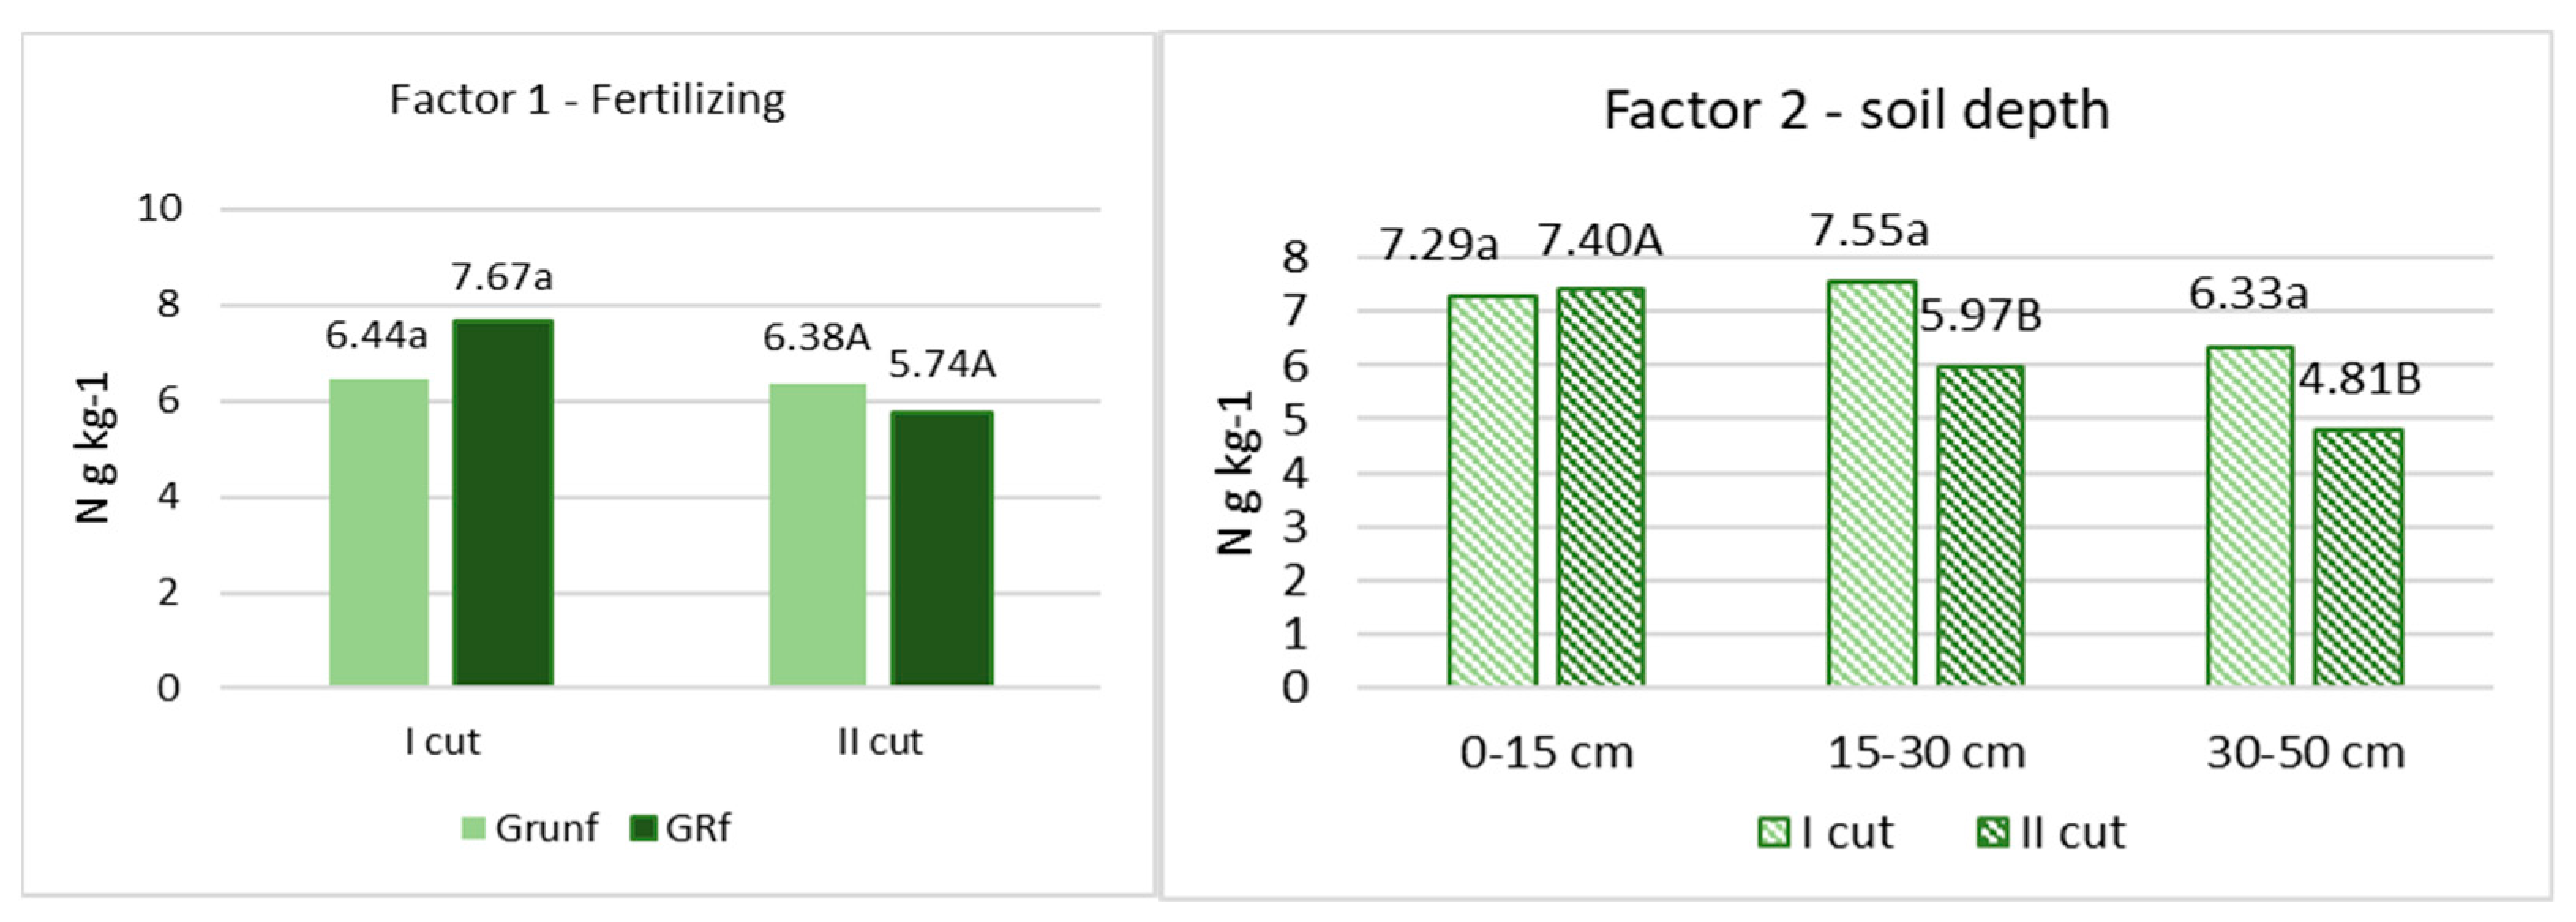
After chemical analyses of the roots were performed, it was found that the amount of C varied from 402 to 422 g C kg−1. in the flowering stage of grasses and from 421 to 427 g C kg−1 at the end of the grass vegetation (Figure 1). N varied from 6.44 to 7.67 g N kg−1 and from 5,71 to 6.38 g N kg−1, respectively (Figure 2). No significant differences in C and N content in roots, depending on fertilization and root location in the soil profile, were found. Only in the grass roots of the first cutting in the 0–15 cm layer was the amount of C significantly lower (p < 0.05) compared to other depths, and in the roots of the second cutting in the 0–15 cm layer, the amount of N was also significantly lower.
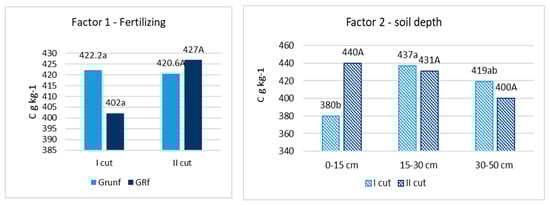
Figure 1.
Concentration of C in root biomass. Note. I—plant root mass studies were carried out during the flowering stage of grasses (the third ten days of June); II—after the last grass cutting (the third ten days of September). Lowercase letters indicate significant differences (p < 0.05) between the treatments for the I cut, and capital letters indicate significant differences (p < 0.05) between the treatments for the II cut.
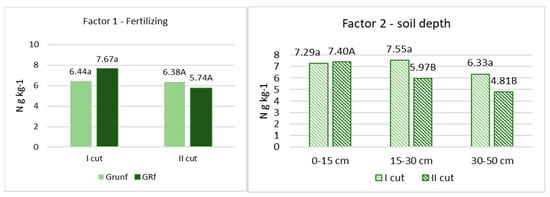
Figure 2.
The concentration of N in root biomass. Note. I—plant root mass studies were carried out during the flowering stage of grasses (the third ten days of June); II—after the last grass cutting (the third ten days of September). Lowercase letters indicate significant differences (p < 0.05) between the treatments for the I cut, and capital letters indicate significant differences (p < 0.05) between the treatments for the II cut.
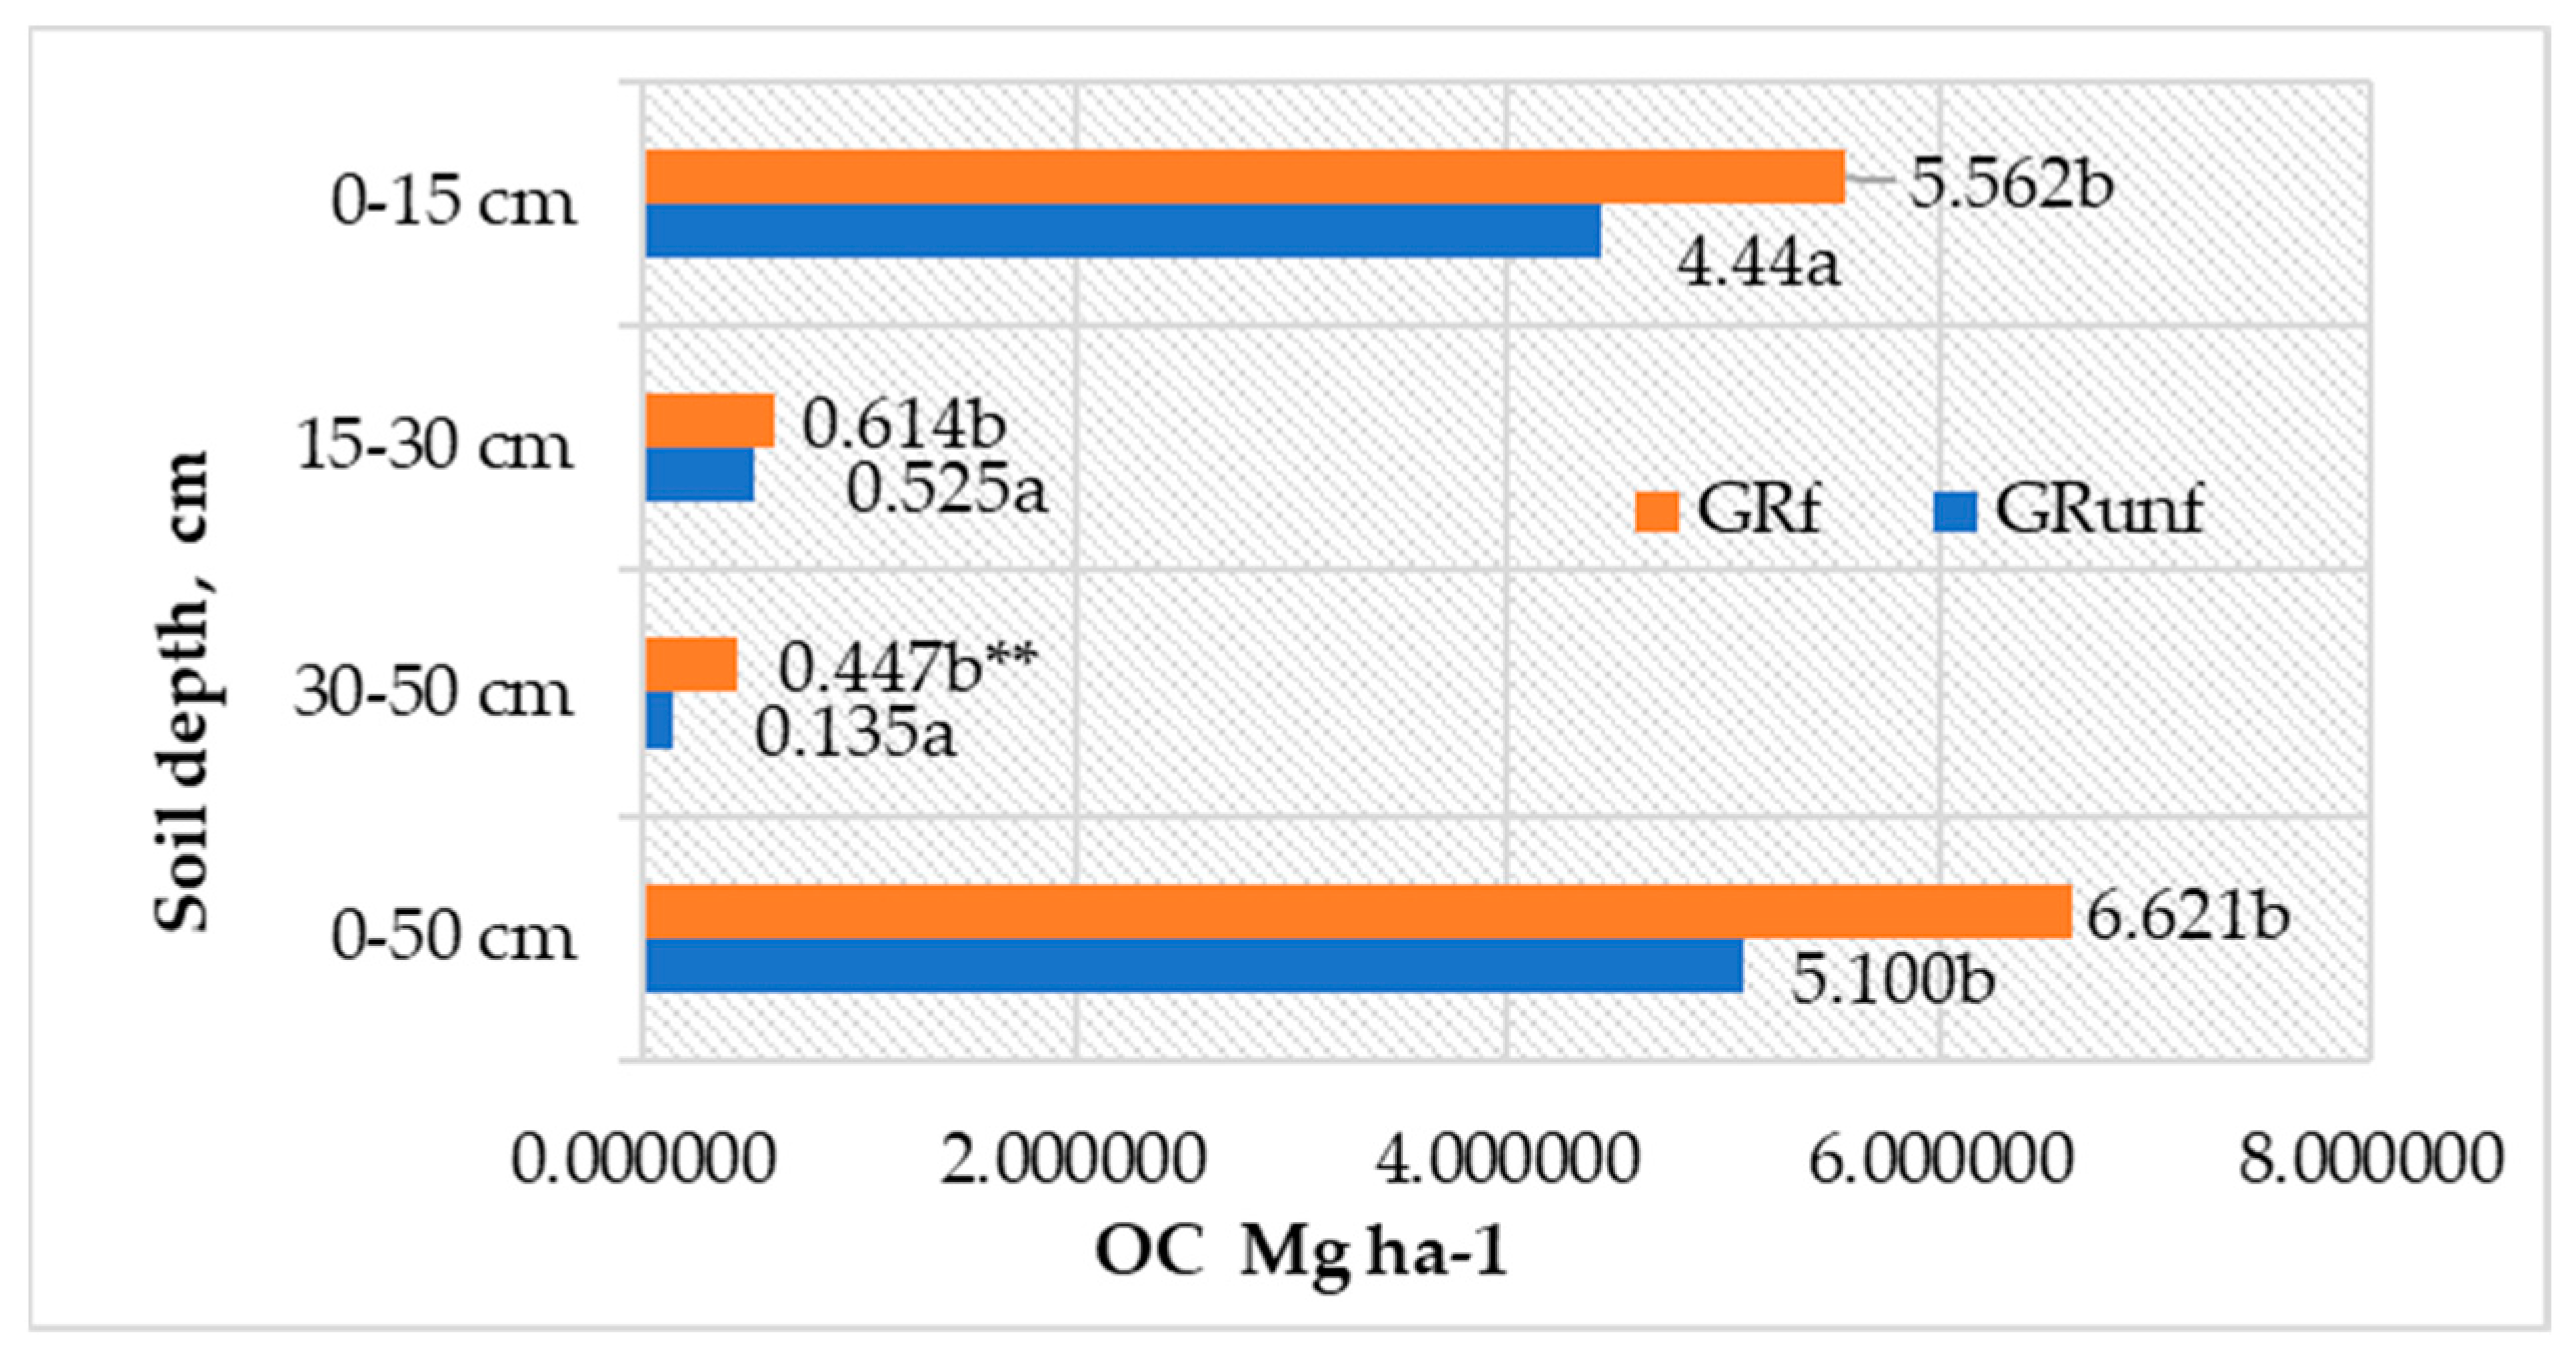
The accumulation of C in the roots of perennial grasses depended more on their biomass, as the differences in C concentration at various depths in the soil profile were insignificant. Most of the OC—84.9–87.1% of the total amount of OC roots in the 0–50 cm depth—was accumulated in the roots in the 0–15 cm layer (Figure 3). Below, in the 15–30 cm layer, its amount significantly decreased to 0.52–0.61 t ha−1, and even less (0.13–0.45 t C ha−1) was accumulated in the roots in the 30–50 cm layer. Long-term fertilization of grasses with mineral NPK fertilizers positively affected the accumulation of OC in the roots up to a depth of 30–50 cm (p < 0.05).
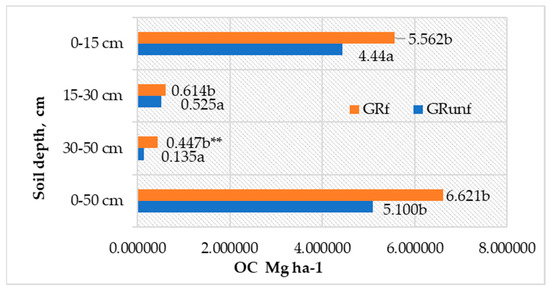
Figure 3.
C accumulation in roots of perennial grasses in Arenosol profile. GRunf—grassland unfertilized; GRf—grassland fertilized. Note. Lowercase letters indicate significant differences (p < 0.05) between the treatments ** indicates significant differences (p < 0.01).
3.3. SOC Distribution in Different Arenosol Depths
A higher amount of SOC (9.31–12.32 g kg−1) in the soil was accumulated at a depth of 0–15 cm (Table 9). At a depth of 15–30 cm, its amount decreased by 29.3–35.9%, and at 30–50 cm, it decreased by 75.9–80.5% (Table 9). The reduction in SOM content at different depths was significant in both the GRunf and GRf sites. Compared to unfertilized soil, mineral fertilizers significantly promoted SOC in the 0–15 cm layer (p < 0.05). At other depths, differences in the OC concentration were insignificant. We found that the SOC content in the 0–50 cm soil layer correlated more strongly (r = 0.62, p < 0.001) with the C accumulated in the roots of the corresponding layer than with shoot biomass (r = 0.41, p = 0.04), but it correlated weakly with the root biomass in the 0–50 cm layer. The remaining plant materials also had a specific effect on the amount of SOC, during the decomposition of which various SOM compounds were also formed.
Table 9.
SOC content (g kg−1) at the different soil depths.
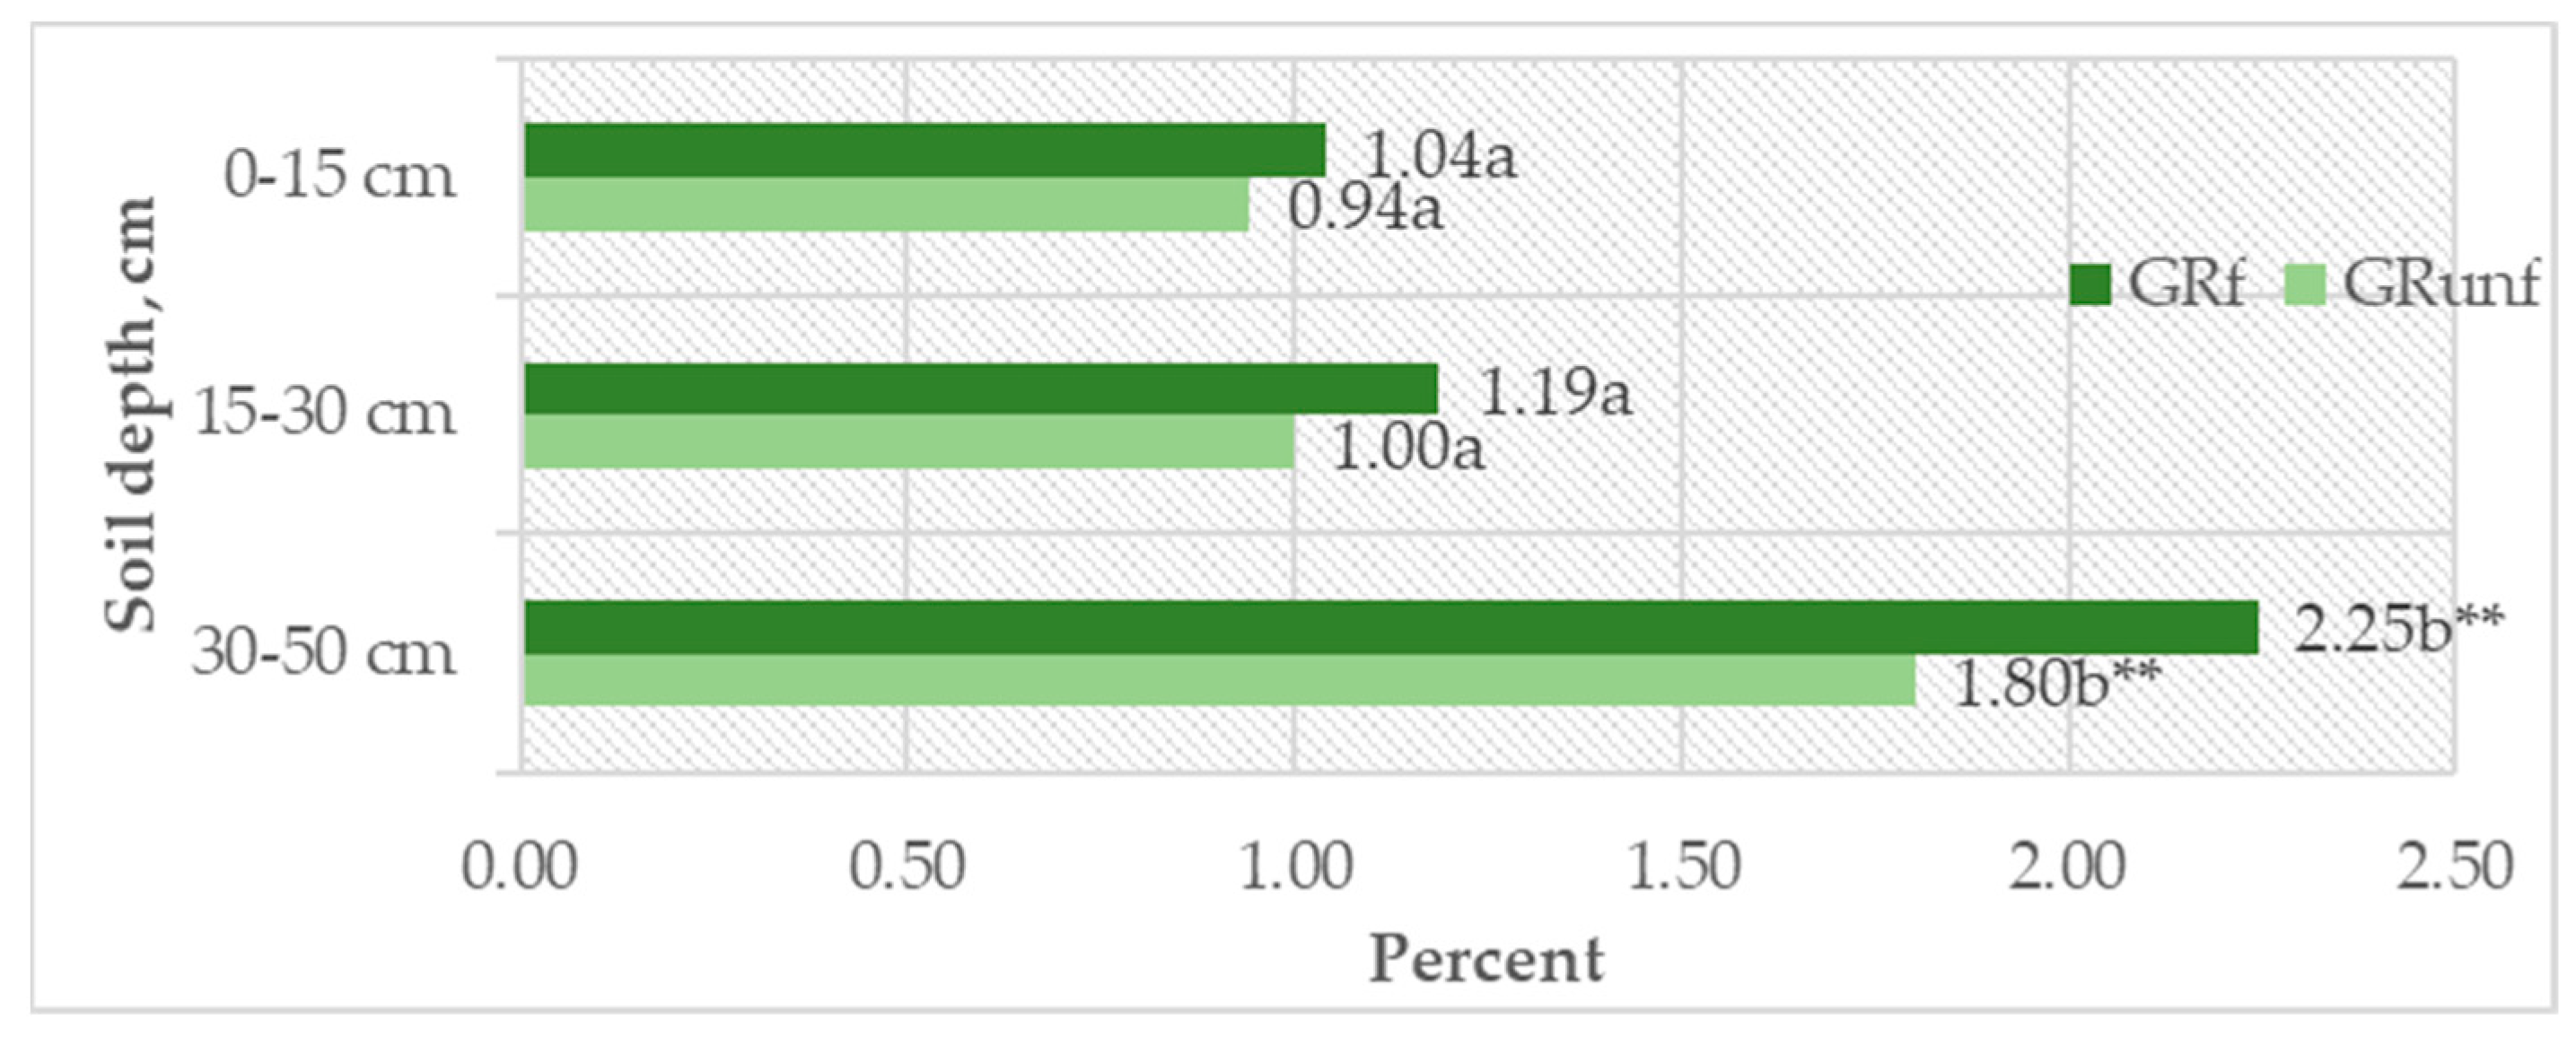
It was found that, at the 0–15 cm depth, the DOC content was, on average, 0.09–0.13 g kg−1; at 15–30 cm, it decreased to 0.07–0.09 g kg−1; and at 30–50 cm, the decrease was significant (p < 0.05). This corresponds to the SOC variation pattern in the Arenosol profile (Table 10). However, when evaluating the relative amounts of DOC and SOC (DOC/SOC), a significant increase (p < 0.05) in their amount was seen at the 30–50 cm depth. If the amount of DOC in the 0–30 cm depth was 0.94–1.19% of the SOC, then at the 30–50 cm depth, it reached 1.80–2.24% (p < 0.05) (Figure 4). At all profile depths, the DOC content was higher in unfertilized soil compared to NPK-fertilized soil, but the increase was statistically insignificant (p > 0.05). A moderate correlation (r = 0.679, p < 0.001) was found between DOC and shoot biomass, explaining the significant increase in DOC in the 30–50 cm soil layer and indicating the leaching of mobile soil organic matter (SOM) substances from the above-ground biomass using fertilizers.
Table 10.
DOC content (g kg−1) at the different soil depths.

Figure 4.
DOC (%) out of total SOC. GRunf—grassland unfertilized; GRf—grassland fertilized. Note. Lowercase letters indicate significant differences (p < 0.05) between soil layers within the same treatment, ** indicates significant differences (p < 0.01).
4. Discussion
Sandy soils are characterized by an insufficient amount of nutrients and organic matter [35]. However, when mineral fertilizers are used, considerable biomass quantities of perennial grasses can be grown in sandy soils, which are well-suited for fodder production [19,36,37,38,39]. According to our research, the average annual grass biomass yield in the fertilized Arenosol reached 892 g m−2, twice as high as in the unfertilized soil. By analyzing the grass yield data of this long-term experiment [40], it was found that grass productivity is influenced not only by fertilization, but also by the meteorological conditions of the vegetation period. Under dry conditions, the productivity of non-fertilized cultivated grasses decreased by 50.2%, and that of grasses fertilized with NPK fertilizers decreased by 16.9%. In the case of excess rainfall (more than 150 mm), it decreased by 111.0% and 50.4%, respectively. The maximum productivity of cultivated grasses in Arenosol was obtained when the amount of precipitation in May and June was close to SKN (115.6 mm): in the fertilized grassland site, the SM yield reached 9.46 t ha−1; in the unfertilized plot, 7.03 t ha−1. The positive effect of mineral fertilizers on grass productivity under dry meteorological conditions has been described in other scientific publications [41,42]. Still, it should be noted that mineral nitrogen fertilizers significantly reduce plant species richness and the abundance of forbs and legumes [43,44,45]. The data from our experiment also confirms this. Cereal grass accounted for 98% of fertilized soil and 79% of non-fertilized soil. Especially in the fertilized grassland, the number of legume plants decreased because they were overshadowed by tall cereal grasses (Festuca rubra L., Bromus inermis Leyss). Changes in the botanical composition of grasses also affected root biomass, as different plant species have different morphometric parameters [46,47,48,49].
After the last harvest of grass biomass, a significant amount of non-green residues remained on the soil surface (133–193 g DM m−2); they were mineralized in winter and replenished the SOC accumulation. Even though the decomposition of residues occurs on the soil surface, over a certain period, the accumulation of SOC in the soil increases significantly [40]. In the fertilized GRf plot, the amount of residues after the last harvest was higher than in the unfertilized soil, but the differences were insignificant (p > 0.05). This difference was because the fertilized soil was dominated by tall cereal grasses, which leave less residue on the soil surface. In the unfertilized soil, grass residues averaged 29% of the annual grass biomass yield, and in fertilized soil, 17%. They accumulated 415 and 1000 kg C ha−1 and 3.0 and 14.7 kg ha−1 of N, respectively, which will be included again in the biological cycle of these elements after the mineralization of the residues. The yield of the above-ground parts of the grasses did not depend on the mass of the roots in the 0–50 cm layer or their mass in the upper 0–15 cm layer, where the concentration of nutrients was higher. The weak correlation between above-ground and root biomass could be due to differences in the botanical composition of the grasslands, as different plant species have different root systems that influence root biomass. It was found in [50] that diverse communities with species from multiple families generate 1.3 times the amount of root standing crop compared to the average root biomass from monoculture. In our research, the fertilized soil was dominated by cereal grasses (98.1%), while in the unfertilized soil, it was significantly less (79.1%), and more alfalfa and forbs were present. Alfalfa plants have a thick taproot, significantly increasing the root biomass in upper and deeper soil depths [51,52]. In sandy soil, the biomass of grass roots in the 0–50 cm depth averaged 12.39–15.78 Mg ha−1. The grass root biomass in the 0–50 cm layer was higher in the GRf soil than in GRunf, but the difference was insignificant (p >0.05). Other researchers have described similar effects of fertilizers on root biomass [53]. The main mass of roots was in the upper 0–15 depth and accounted for an average of 84–88% of their biomass in the entire 0–50 cm layer. Below, in the 15–30 cm layer, their biomass drastically decreased and accounted for only 9–10% of the amount in the 0–50 cm layer. Even deeper (in the 30–50 cm layer), very few roots are found—3–7% of the total biomass. A similar distribution of root biomass in the soil profile has been described in many scientific publications [54,55,56,57]. Soil fertilized with mineral fertilizers, compared to unfertilized soil, increased the root biomass (+279%, p < 0.05), but the differences were significant only in the 30–50 cm layer. Such results were determined by the morphology of the roots of different plants, due to which the mass of the roots varied greatly in individual samples and increased the statistical errors of the reliability of the indicators. This was mainly influenced by alfalfa roots, which significantly increased the root mass in deeper layers, and rhizome plants, with thick roots in the upper layer. In a 2009 study by Titlyanova [58], scientists discovered that grasses’ below-ground biomass variation is much lower than that of their above-ground biomass. The active growth of a diverse plant species’ above-ground and below-ground organs may occur at different times during the season, and this growth pattern can vary from year to year.
There was 3.02–4.39 Mg ha−1 OC accumulated in the grass roots at the 0–50 cm depth. Fertilization with mineral fertilizers increased C accumulation in root biomass, but the difference was not statistically significant (p > 0.05). The main part of OC in the roots (72–87%) was accumulated in the 0–15 cm layer (2.62–3.17 Mg ha−1), and in the 15–30 cm layer, its amount significantly decreased, amounting to only 0.32–0.74 Mg ha−1. A global meta-analysis of 103 published studies assessed the effects of species mixtures on fine root biomass and traits. It highlighted that the community-level consequences of changes in plant diversity on fine root traits are inconsistent. Predicting these consequences requires considering the extent of changes in plant species richness, the stand age, the soil depth investigated, the background climates, and the particular fine root traits [48].
It was found that, in the sandy soil, SOC accumulation in the soil layers did not depend on the amount of OC accumulated in the roots. SOM compounds are known to be absorbed by clay and silt particles [30]. There are very few sandy soils, so the organic compounds formed in the course of root decay in sandy soils with high stone content can be leached into deeper horizons, especially in regions with excess precipitation. However, under other natural conditions, root biomass can positively affect SOC accumulation in soil [57,59]. Reference [60] found that, regardless of soil fertility, roots contributed the most (44%) to new SOC formation, while shoots (28%) and arbuscular mycorrhizal fungi (28%) exerted similar but lower contributions. Soils with higher fertility sequestered more shoot-, root-, and associated mycorrhizal fungi-derived C. Reference [61] states that plant roots control and influence SOC dynamics by providing OC to the soil, primarily in the forms of root litter and rhizodeposition. This C input results in SOC gain, particularly when plant roots promote SOC stabilization. However, roots can also destabilize SOC, exposing previously protected C to microbial decomposition and causing SOC loss. In sandy soils characterized by weak adsorption, the amount of SOC in the deeper horizons also has labile SOM substances leached from the Ah horizon. Under Lithuanian climatic conditions, leaching of SOC in sandy loam soil averages approximately 20 kg C ha−1 year−1 [62] [63]. DOC flux from the soil profile is negatively affected by soil clay content, with DOC export being seven times higher in clay-free Arenosol (55 kg C ha−1) than in clay-rich Vertisol (8 kg C ha−1). According to those studies, DOC export is not controlled by vegetation, but by physicochemical parameters such as soil mineral adsorption capacity and ecosystem water balance.
5. Conclusions
In sandy loam soil rich in stones (Arenosol), the yield of above-ground biomass in a multicomponent grassland was largely influenced by mineral fertilizers and meteorological conditions. NPK fertilizers’ application doubled the above-ground biomass yield (p < 0.05). In contrast to above-ground biomass yield, mineral fertilizers did not significantly affect the grass root biomass (p > 0.05). Only in the 30–50 cm depth did the biomass of their roots increase significantly (p < 0.05) due to the use of fertilizers. However, unfertilized grassland in Arenosol was distinguished by its composition of more diverse plant species and the conservation of rare herb species. Meanwhile, in NPK-fertilized grassland, there was a significantly lower amount of alfalfa (p < 0.05), where nitrogen fertilizers promoted the development of cereal grasses and aggressive species such as bromegrass (Bromus inermis Leyss). The yield of the above-ground part of the grasses highly depended on the root mass in the 0–15 cm depths (p > 0.05).
At the 0–50 cm soil depth, 12.4–15.8 Mg ha−1 of root biomass was accumulated. The main amount (84–88%) was allocated in the 0–15 cm layer. The perennial grass roots of the entire investigated depth range comprised 5.10–6.62 Mg ha−1 OC. At the fertilized site, significantly more grass residues remained on the soil surface after the last grass harvest, reaching 193 g DM m−2 (p < 0.05). The perennial grasslands, depending on the amount of residue, accumulated an average of 415–1000 kg ha−1 C and 3.04–14.7 kg ha−1 N in total. The SOC content in the 0–50 cm soil layer moderately correlated (r = 0.62, p < 0.001) with the C accumulated in the roots of the corresponding layer, and correlated moderately with the shoot biomass (r = 0.41, p = 0.04).
According to our long-term grassland experiment data, the fertilized site provided more favorable conditions for carbon accumulation in the soil and for the growth of above-ground and below-ground grass biomass. However, with fertilization, the relative content of DOC/SOC increased, indicating the leaching of soil organic matter from the Ah horizon of the Arenosol. Significant correlations were found between DOC and shoot biomass (r = 0.68, p < 0.001) and between DOC and biomass of residues (r = 0.71, p < 0.001), explaining the significant increase in DOC in the 30–50 cm soil layer. The biodiversity advantage of unfertilized grassland and significantly higher above-ground biomass yield when fertilized also need to be considered when selecting land management practices for low-productivity, vulnerable sandy soils.
Author Contributions
Conceptualization, M.T., L.T. and A.V.; methodology, M.T., L.T., A.V. and A.S.; formal analysis, L.T., M.T., A.V. and A.S., investigation, M.T., L.T. and A.V.; writing—original draft preparation, L.T. and M.T.; writing—review and editing, M.T., L.T., A.V. and A.S.; visualization, L.T. and M.T.; supervision, M.T. All authors have read and agreed to the published version of the manuscript.
Funding
This work was supported by the long-term program “Plant Biopotential and Quality for Multifunctional Practice and Sustainability of Agroecosystems” and was partly funded by the European Joint Program for SOIL “Towards climate-smart sustainable management of agricultural soils” (EJP SOIL) funded by the European Union Horizon 2020 research and innovation program (Grant Agreement N_862695) internal project “Are mixed species systems fostering belowground C inputs and C sequestration?” (MIXROOT-C).
Acknowledgments
This paper presents research findings obtained through the long-term research program “Biopotential and quality of plants for multifunctional use” implemented by the Lithuanian Research Centre for Agriculture and Forestry.
Conflicts of Interest
The authors declare no conflicts of interest.
References
- Armolaitis, K.; Aleinikovienė, J.; Lubytė, J.; Žėkaitė, V.; Garbaravičius, P. Stability of soil organic carbon in agro and forest ecosystems on Arenosol. Zemdirbystė-Agric. 2013, 100, 227–234. [Google Scholar] [CrossRef]
- Lal, R. Soil quality and sustainability. In Methods for assessment of Soil Degradation; CRC press: Boca Raton, FL, USA, 2020; pp. 17–30. [Google Scholar]
- Gerke, J. The Central Role of Soil Organic Matter in Soil Fertility and Carbon Storage. Soil Syst. 2022, 6, 33. [Google Scholar] [CrossRef]
- Powlson, D.S.; Gregory, P.J.; Whalley, W.R.; Quinton, J.N.; Hopkins, D.W.; Whitmore, A.P.; Hirsch, P.R.; Goulding, K.W.T. Soil management in relation to sustainable agriculture and ecosystem services. Food Policy 2011, 36, 72–87. [Google Scholar] [CrossRef]
- Keesstra, S.; Mol, G.; De Leeuw, J.; Okx, J.; Molenaar, C.; De Cleen, M.; Visser, S. Soil-Related Sustainable Development Goals: Four Concepts to Make Land Degradation Neutrality and Restoration Work. Land 2018, 7, 133. [Google Scholar] [CrossRef]
- Hou, D.; Balaną, B.N.; Tsang, D.C.W.; Kirkham, M.B.; O’Connor, D. Sustainable soil use and management: An interdisciplinary and systematic approach. Sci. Total Environ. 2020, 729, 138961. [Google Scholar] [CrossRef] [PubMed]
- Tahat, M.; Alananbeh, M.; Othman, K.A.Y.; Leskovar, I.D. Soil Health and Sustainable Agriculture. Sustainability 2020, 12, 4859. [Google Scholar] [CrossRef]
- Taube, F.; Gierus, M.; Hermann, A.; Loges, R.; Schönbach, P. Grassland and globalization–challenges for north-west European grass and forage research. Grass Forage Sci. 2014, 69, 2–16. [Google Scholar] [CrossRef]
- Ajayi, A.E.; Horn, R. Transformation of ex-arable land to permanent grassland promotes pore rigidity and mechanical soil resilience. Ecol. Eng. 2016, 94, 592–598. [Google Scholar] [CrossRef]
- DuPont, S.T.; Beniston, J.; Glover, J.D.; Hodson, A.; Culman, S.W.; Lal, R.; Ferris, H. Root traits and soil properties in harvested perennial grassland, annual wheat, and never-tilled annual wheat. Plant Soil 2014, 381, 405–420. [Google Scholar] [CrossRef]
- Franzluebbers, A.J. Grass roots of soil carbon sequestration. Carbon Manag. 2012, 3, 9–11. [Google Scholar] [CrossRef]
- Skuodiene, R.; Kinderiene, I.; Tomchuk, D.; Slepetys, J.; Karčauskiene, D. Root development of temporary and permanent grasslands and their anti-erosion significance on a hilly terrain. Zemdirbyste-Agric. 2020, 107, 209–216. [Google Scholar] [CrossRef]
- Macholdt, J.; Hadasch, S.; Macdonald, A.; Perryman, S.; Piepho, H.-P.; Scott, T.; Styczen, M.E.; Storkey, J. Long-term trends in yield variance of temperate managed grassland. Agron. Sustain. Dev. 2023, 43, 37. [Google Scholar] [CrossRef] [PubMed]
- Wang, S.; Wilkes, A.; Zhang, Z.; Chang, X.; Lang, R.; Wang, Y.; Niu, H. Management and land use change effects on soil carbon in northern China’s grasslands: A synthesis. Agric. Ecosyst. Environ. 2011, 142, 329–340. [Google Scholar] [CrossRef]
- Beniston, J.W.; DuPont, S.T.; Glover, J.D.; Lal, R.; Dungait, J.J. Soil organic carbon dynamics 75 years after land-use change in perennial grassland and annual wheat agricultural systems. Biogeochemistry 2014, 120, 37–49. [Google Scholar] [CrossRef]
- Guillaume, T.; Bragazza, L.; Levasseur, C.; Libohova, Z.; Sokrat Sinaj, S. Long-term soil organic carbon dynamics in temperate cropland-grassland systems. Agric. Ecosyst. Environ. 2021, 305, 107184. [Google Scholar] [CrossRef]
- Bardule, A.; Lupikis, A.; Butlers, A.; Lazdins, A. Organic carbon stock in different types of mineral soils in cropland and grassland in Latvia. Zemdirbyste-Agric. 2017, 104, 3–8. [Google Scholar] [CrossRef]
- Głąb, T.; Kacorzyk, P. Root distribution and herbage production under different management regimes of mountain grassland. Soil Tillage Res. 2011, 113, 99–104. [Google Scholar] [CrossRef]
- Poeplau, C.; Zopf, D.; Greiner, B.; Geerts, R.; Korvaar, H.; Thumm, U.; Don, A.; Heidkamp, A.; Flessa, H. Why does mineral fertilization increase soil carbon stocks in temperate grasslands? Agric. Ecosyst. Environ. 2018, 265, 144–155. [Google Scholar] [CrossRef]
- Yang, X.; Wang, B.; Fakher, A.; An, S.; Kuzyakov, Y. Contribution of roots to soil organic carbon: From growth to decomposition experiment. Catena 2023, 231, 107317. [Google Scholar] [CrossRef]
- Bai, X.; Guo, Z.; Huang, Y.; An, S. Root cellulose drives soil fulvic acid carbon sequestration in the grassland restoration process. Catena 2020, 191, 104575. [Google Scholar] [CrossRef]
- Yi, B.; Lu, C.; Huang, W.; Yu, W.; Yang, J.; Howe, A.; Weintraub-Leff, S.R.; Hall, S.J. Resolving the influence of lignin on soil organic matter decomposition with mechanistic models and continental-scale data. Glob. Chang. Biol. 2023, 29, 5968–5980. [Google Scholar] [CrossRef]
- Poeplau, C.; Reiter, L.; Berti, A.; Kätterer, T. Qualitative and quantitative response of soil organic carbon to 40 years of crop residue incorporation under contrasting nitrogen fertilisation regimes. Soil Res. 2017, 55, 1–9. [Google Scholar] [CrossRef]
- Ward, S.E.; Smart, S.M.; Helen Quirk, H.; Tallowin, J.R.B.; Simon, R.; Mortimer, S.R.; Shiel, R.S.; Wilby, A.; Bardgett, R.D. Legacy effects of grassland management on soil carbon to depth. Glob. Chang. Biol. 2016, 22, 2929–2938. [Google Scholar] [CrossRef]
- Crème, A.; Rumpel, C.; Malone, S.L.; Saby, N.P.; Vaudour, E.; Decau, M.L.; Chabbi, A. Monitoring grassland management effects on soil organic carbon—A matter of scale. Agronomy 2020, 10, 2016. [Google Scholar] [CrossRef]
- Lithuanian Hydrometeorological Service at the Ministry of Environment, LHMT Climate and Research Department. Vilnius 2021. Comparative Evaluation of Climate Changes in Lithuania 1961–1990 and 1991–2020 Standard Climate Norms. Available online: https://new.meteo.lt/app/uploads/2023/11/Lietuvos_klimato_pokyciu_vertinimas_lyginant_klimato_normas.pdf (accessed on 18 March 2024).
- IUSS Working Group WRB. World Reference Base for Soil Resources. In International Soil Classification System for Naming Soils and Creating Legends for Soil Maps, 4th ed.; International Union of Soil Sciences (IUSS): Vienna, Austria, 2022. [Google Scholar]
- Eidukeviciene, M. Lietuvos Gamtine Geografija [Natural Geography of Lithuania]; Klaipedos Universiteto Leidykla [Klaipeda. University Publishing House]: Klaipeda, Lithuania, 2013; ISBN 9789955187134. [Google Scholar]
- Kochiieru, M.; Veršulienė, A.; Feiza, V.; Feizienė, D. Trend for soil CO2 efflux in grassland and forest land in relation with meteorological conditions and root parameters. Sustainability 2023, 15, 7193. [Google Scholar] [CrossRef]
- Poeplau, C.; Vos, C.; Don, A. Soil organic carbon stocks are systematically overestimated by misuse of the parameters bulk density and rock fragment content. Soil 2017, 3, 61–66. [Google Scholar] [CrossRef]
- Jurgutis, L.; Šlepetienė, A.; Šlepetys, J.; Cesevičienė, J. Towards a full circular economy in biogas plants: Sustainable management of digestate for growing biomass feedstocks and use as biofertilizer. Energies 2021, 14, 4272. [Google Scholar] [CrossRef]
- Nikitin, B.A. A method for soil humus determination. Agric. Chem. 1999, 3, 156–158. [Google Scholar]
- Guigue, J.; Mathieu, O.; Lévêque, J.; Mounier, S.; Laffont, R.; Maron, P.A.; Navarro, N.; Chateau, C.; Amiotte-Suchet, P.; Lucas, Y. A Comparison of Extraction Procedures for Water-Extractable Organic Matter in Soils. Eur. J. Soil Sci. 2014, 65, 520–530. [Google Scholar] [CrossRef]
- McKenzie, N.J.; Jacquier, D.J.; Isbell, R.F.; Brown, K.L. Australian Soils and Landscapes: An Illustrated Compendium; CSIRO publishing: Clayton, Australia, 2004. [Google Scholar] [CrossRef]
- Šimanský, V.; Juriga, M.; Jonczak, J.; Uzarowicz, Ł.; Stępień, W. How relationships between soil organic matter parameters and soil structure characteristics are affected by the long-term fertilization of a sandy soil. Geoderma 2019, 342, 75–84. [Google Scholar] [CrossRef]
- LeBauer, D.S.; Treseder, K.K. Nitrogen limitation of net primary productivity in terrestrial ecosystems is globally distributed. Ecology 2008, 89, 371–379. [Google Scholar] [CrossRef] [PubMed]
- Humbert, J.; Dwyier, J.M.; Andrey, A.; Arlettaz, R. Impacts of nitrogen addition on plant biodiversity in mountain grasslands depend on does, application duration and climate: A systematic review. Glob. Chang. Biol. 2016, 22, 110–120. [Google Scholar] [CrossRef] [PubMed]
- Kizeková, M.; Feoli, E.; Parente, J.; Kanianska, R. Analysis of the effects of mineral fertilization on species diversity and yield of permanent grasslands: Revisited data to mediate economic and environmental needs. Community Ecol. 2017, 18, 295–304. [Google Scholar] [CrossRef]
- Kacorzyk, P.; Głąb, T. Effect of ten years of mineral and organic fertiliza¬tion on the herbage production of a mountain meadow. J. Elem. 2017, 22, 219–233. [Google Scholar] [CrossRef]
- Tripolskaja, L.; Kazlauskaite-Jadzevice, A.; Baliuckas, V.; Razukas, A. Natural and ManagedGrasslands Productivity during Multiyear in Ex-Arable Lands (in the Context of Climate Change). Agriculture 2021, 11, 215. [Google Scholar] [CrossRef]
- Ullah, M.R.; Corneo, P.E.; Sydney, F.A.D. Inter-seasonal Nitrogen Loss with Drought Depends on Fertilizer Management in a Seminatural Australian Grassland. Ecosystems 2020, 23, 1281–1293. [Google Scholar] [CrossRef]
- Bedaso, N.H.; Bezabih, M.; Kelkaym, T.Z.; Adie, A.; Khan, N.A.; Jones, C.S.; Mekonnen, K.; Wolde-meskel, E. Effect of fertilizer inputs on productivity and herbage quality of native pasture in degraded tropical grasslands. Agron. J. 2020, 114, 216–227. [Google Scholar] [CrossRef]
- Bijelić, Z.; Tomić, Z.; Ružić-Muslić, D. The effect of nitrogen fertilization on production. In Biotechnology in Animal Husbandry; Book 1; Springer Science & Business Media: Berlin, Germany, 2011; Volume 27, pp. 615–630. Available online: http://www.istocar.bg.ac.rs/radovi12/VOL27_3_1.pdf (accessed on 16 July 2024).
- Kidd, J.; Manning, P.; Simkin, J.; Peacock, S.; Stockdale, E. Impacts of 120 years of fertilizer addition on a temperate grassland ecosystem. PLoS ONE 2017, 12, e0174632. [Google Scholar] [CrossRef] [PubMed]
- Dindová, A.; Hakl, J.; Hrevušová, Z.; Nerušil, P. Relationships between long-term fertilization management and forage nutritive value in grasslands. Agric. Ecosyst. Environ. 2019, 279, 139–148. [Google Scholar] [CrossRef]
- Guerrero-Campo, J.; Palacio, S.; Pérez-Rontomé, C.; Montserrat-Martí, G. Effect of Root System Morphology on Root-sprouting and Shoot-rooting Abilities in 123 Plant Species from Eroded Lands in North-east Spain. Ann. Bot. 2006, 98, 439–447. [Google Scholar] [CrossRef]
- De Baets, S.; Poesen, J.; Knapen, A.; Barberá, G.G.; Navarro, J.A. Root characteristics of representative Mediterranean plant species and their erosion-reducing potential during concentrated runoff. Plant Soil 2007, 294, 169–183. [Google Scholar] [CrossRef]
- Peng, S.; Chen, H.Y.H. Global responses of fine root biomass and traits to plant species mixtures in terrestrial ecosystems. Glob. Ecol. Biogeogr. 2021, 30, 289–304. [Google Scholar] [CrossRef]
- Ravenek, J.M.; Bessler, H.; Engels, C.; Scherer-Lorenzen, M.; Gessler, A.; Gockele, A.; De Luca, E.; Temperton, V.M.; Ebeling, A.; Roscher, C.; et al. Long-term study of root biomass in a biodiversity experiment reveals shifts in diversity effects over time. Oikos 2014, 123, 1528–1536. [Google Scholar] [CrossRef]
- Podzikowski, L.Y.; Heffernan, M.M.; Bever, J.D. Plant diversity and grasses increase root biomass in a rainfall and grassland diversity manipulation. Front. Ecol. Evol. 2023, 11, 1259809. [Google Scholar] [CrossRef]
- Bolinder, M.A.; Angers, D.A.; Bélanger, G.; Michaud, R.; Laverdière, M.R. Root biomass and shoot to root ratios of perennial forage crops in eastern Canada. Can. J. Plant Sci. 2002, 82, 731–737. [Google Scholar] [CrossRef]
- Malhi, S.S.; Gill, K.S. Fertilizer N and P Effects on Root Mass of Bromegrass, Alfalfa and Barley. J. Sustain. Agric. 2002, 19, 51–63. [Google Scholar] [CrossRef]
- Balogianni, V.G.; Wilson, S.D.; Vaness, B.M.; MacDougall, A.S.; Bradley, D.; Pinno, B.D. Different Root and Shoot Responses to Mowing and Fertility in Native and Invaded Grassland. REM 2014, 67, 39–45. [Google Scholar] [CrossRef]
- De Bruijn, A.M.G.; Calanca, P.; Ammann, C.; Fuhrer, J. Differential long-term effects of climate change and management on stocks and distribution of soil organic carbon in productive grasslands. Biogeosciences 2012, 9, 1997–2012. [Google Scholar] [CrossRef]
- Gill, R.; Burke, I.; Milchunas, D.; Lauenroth, W. Relationship Between Root Biomass and Soil Organic Matter Pools in the Shortgrass Steppe of Eastern Colorado. Ecosystems 1999, 2, 226–236. [Google Scholar] [CrossRef]
- Sainju, U.M.; Allen, B.L.; Lenssen, A.W.; Rajan, P.; Ghimire, R.P. Root biomass, root/shoot ratio, and soil water content under perennial grasses with different nitrogen rates. Field Crops Res. 2017, 210, 183–191. [Google Scholar] [CrossRef]
- Ojeda, J.J.; Caviglia, O.P.; Agnusdei, M.G. Vertical distribution of root biomass and soil carbon stocks in forage cropping systems. Plant Soil 2018, 423, 175–191. [Google Scholar] [CrossRef]
- Titlyanova, A.A.; Romanova, I.P.; Kosykh, N.P.; Mironycheva-Tokareva, N.P. Pattern and process in above-ground and below-ground components of grassland ecosystems. J. Veg. Sci. 2009, 10, 307–320. [Google Scholar] [CrossRef]
- Chirinda, N.; Roncossek, S.D.; Heckrath, G.; Elsgaard, L.; Thomsen, I.K.; Olesen, J.E. Root and soil carbon distribution at shoulderslope and footslope positions of temperate toposequences cropped to winter wheat. Catena 2014, 123, 99–105. [Google Scholar] [CrossRef]
- Huang, J.; Liu, W.; Yang, S.; Yang, L.; Peng, Z.; Deng, M.; Xu, S.; Zhang, B.; Ahirwal, J.; Liu, L. Plant carbon inputs through shoot, root, and mycorrhizal pathways affect soil organic carbon turnover differently. Soil Biol. Biochem. 2021, 160, 108322. [Google Scholar] [CrossRef]
- Dijkstra, F.A.; Zhu, B.; Cheng, W. Root effects on soil organic carbon: A double-edged sword. New Phytol. 2021, 230, 60–65. [Google Scholar] [CrossRef]
- Verbylienė, I. The Influence of Agro-Measures on the Migration of Chemical Elements in Sandy Loam Soils. Ph.D. Thesis, Aleksandras Stulginskis University, Kauno, Lithuania, 2014; p. 89. [Google Scholar]
- Don, A.; Schulze, E.D. Controls on fluxes and export of dissolved organic carbon in grasslands with contrasting soil types. Biogeochemistry 2008, 91, 117–131. [Google Scholar] [CrossRef]
Disclaimer/Publisher’s Note: The statements, opinions and data contained in all publications are solely those of the individual author(s) and contributor(s) and not of MDPI and/or the editor(s). MDPI and/or the editor(s) disclaim responsibility for any injury to people or property resulting from any ideas, methods, instructions or products referred to in the content. |
© 2024 by the authors. Licensee MDPI, Basel, Switzerland. This article is an open access article distributed under the terms and conditions of the Creative Commons Attribution (CC BY) license (https://creativecommons.org/licenses/by/4.0/).