

Spillover Effects of Urban Expansion on Land Green Use Efficiency: An Empirical Study Based on Multi-Source Remote Sensing Data in China


Abstract
:1. Introduction
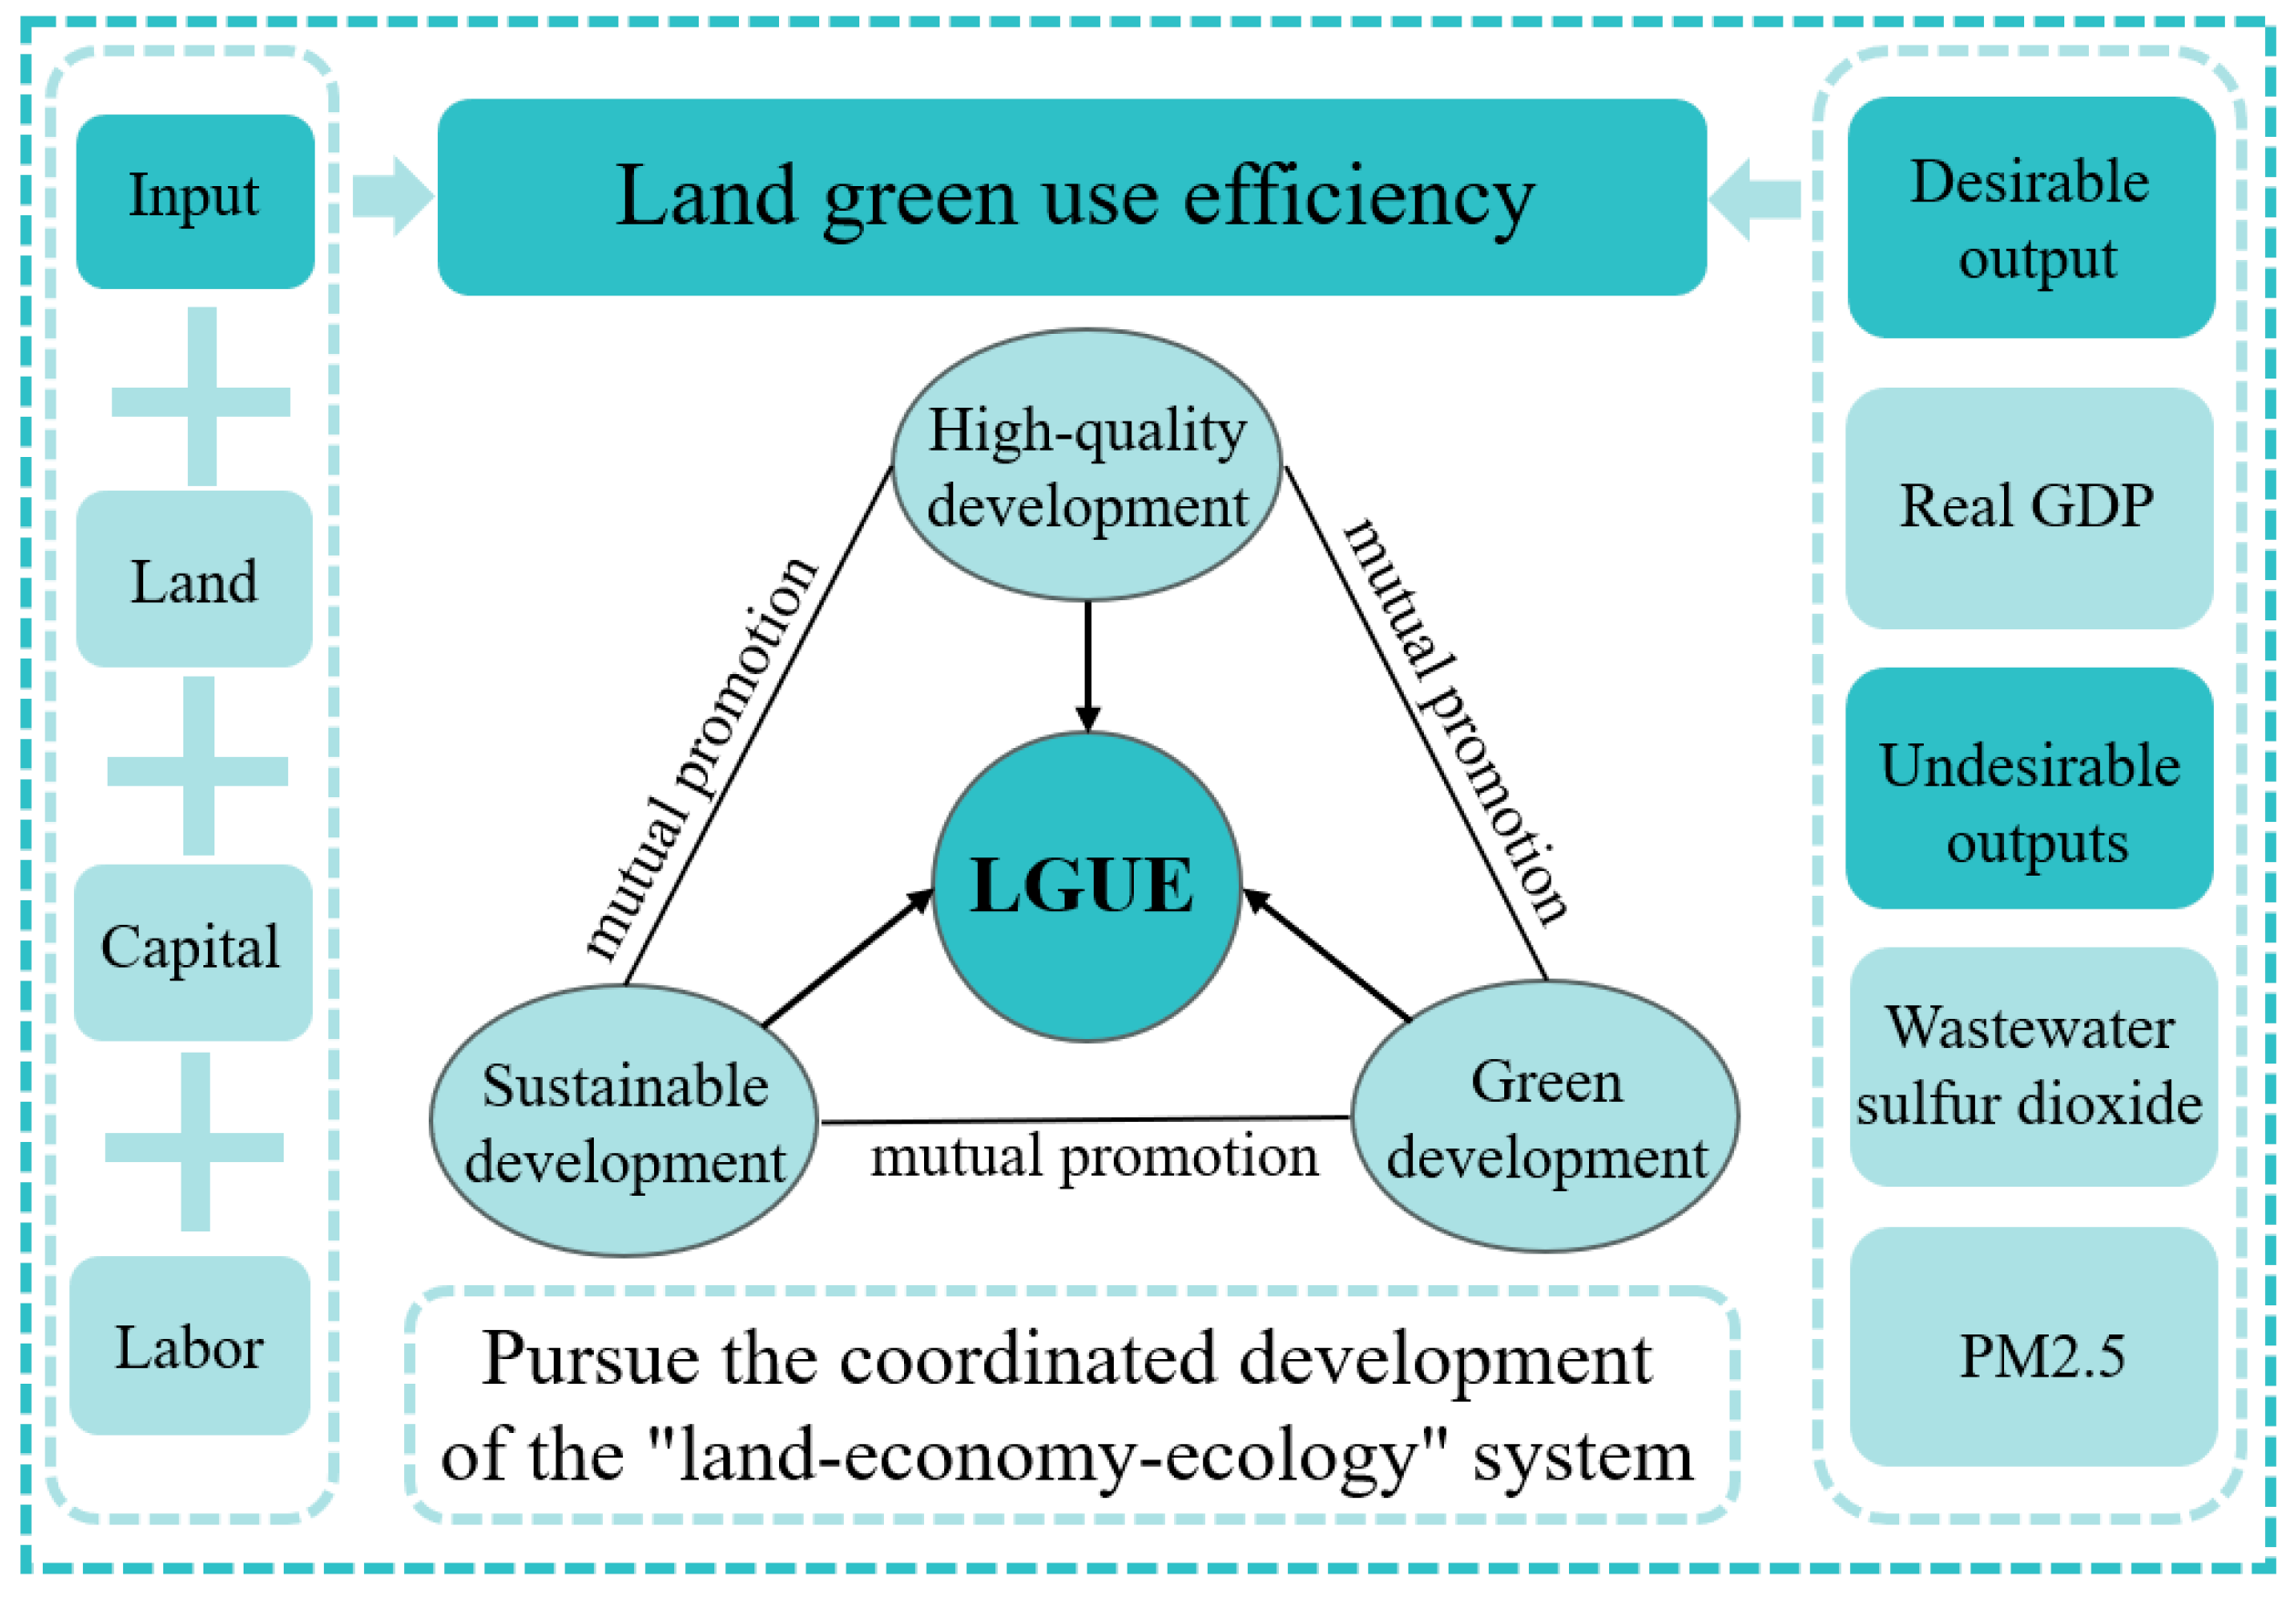
2. Theoretical Framework
3. Data and Methods
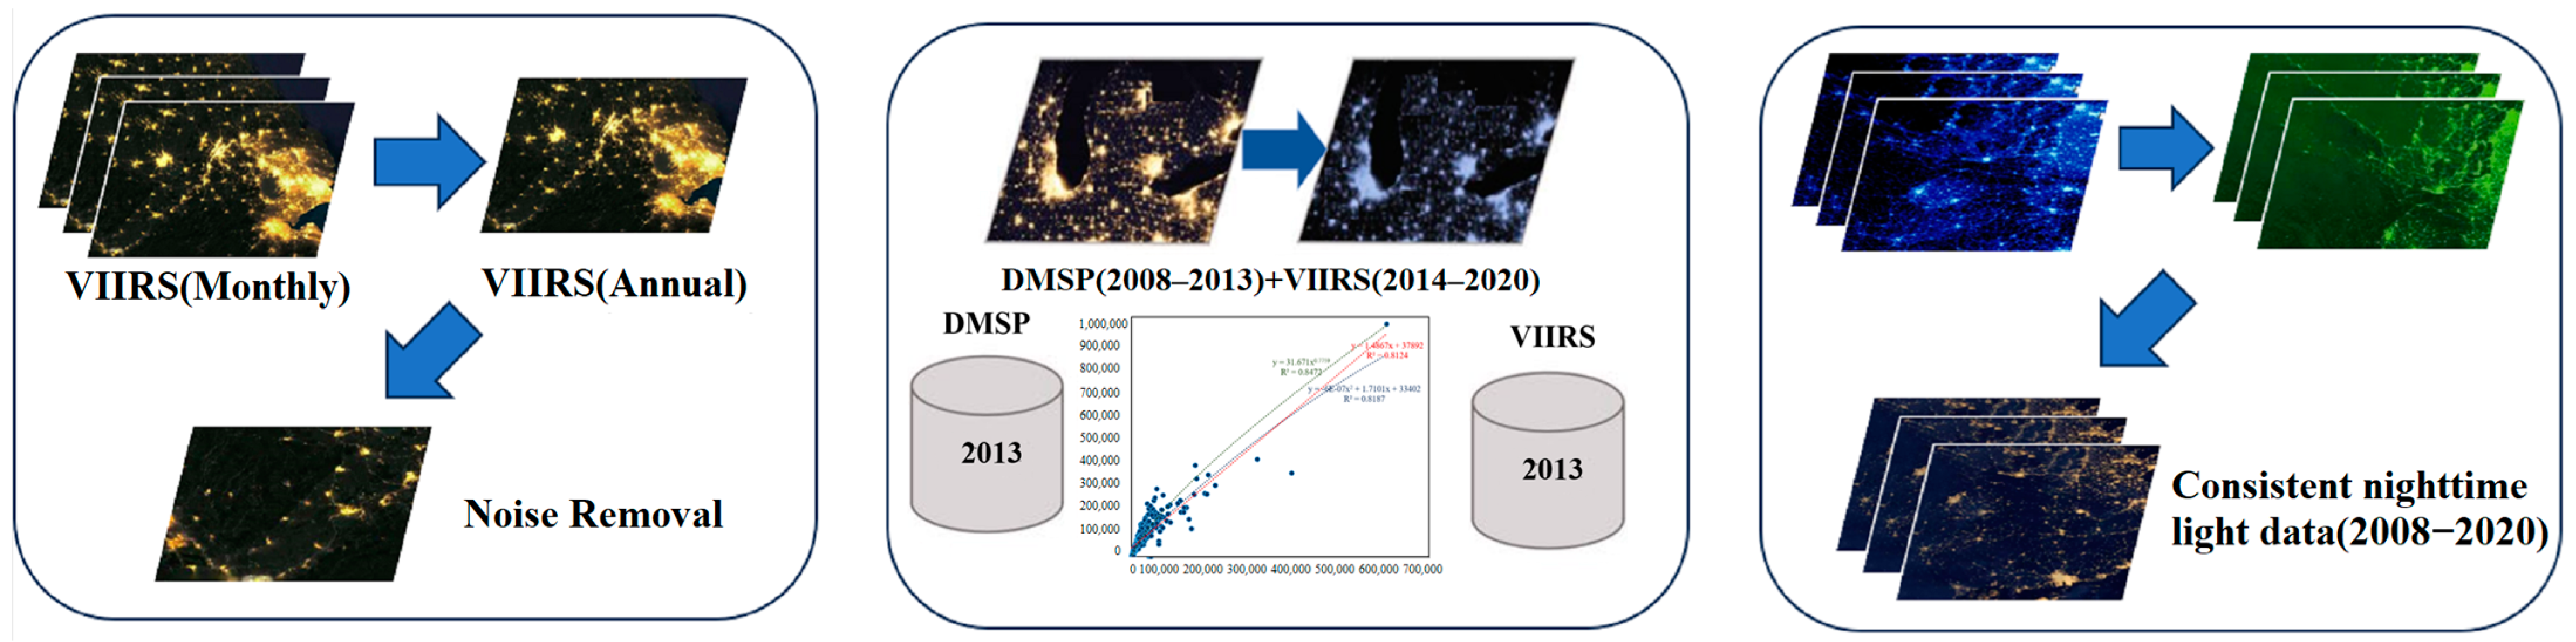
3.1. Data Sources
3.2. Indicator Selection for LGUE Measurement
3.3. Variable Selection
3.3.1. Core Explanatory Variables
3.3.2. Control Variables
3.4. Research Methods
3.4.1. Super-Efficiency EBM-DEA Model
3.4.2. Spatial Econometric Model
3.4.3. Spatial Weight Matrix
3.4.4. Geographical and Temporal Weighted Regression
4. The Spatiotemporal Evolution Characteristics of LGUE
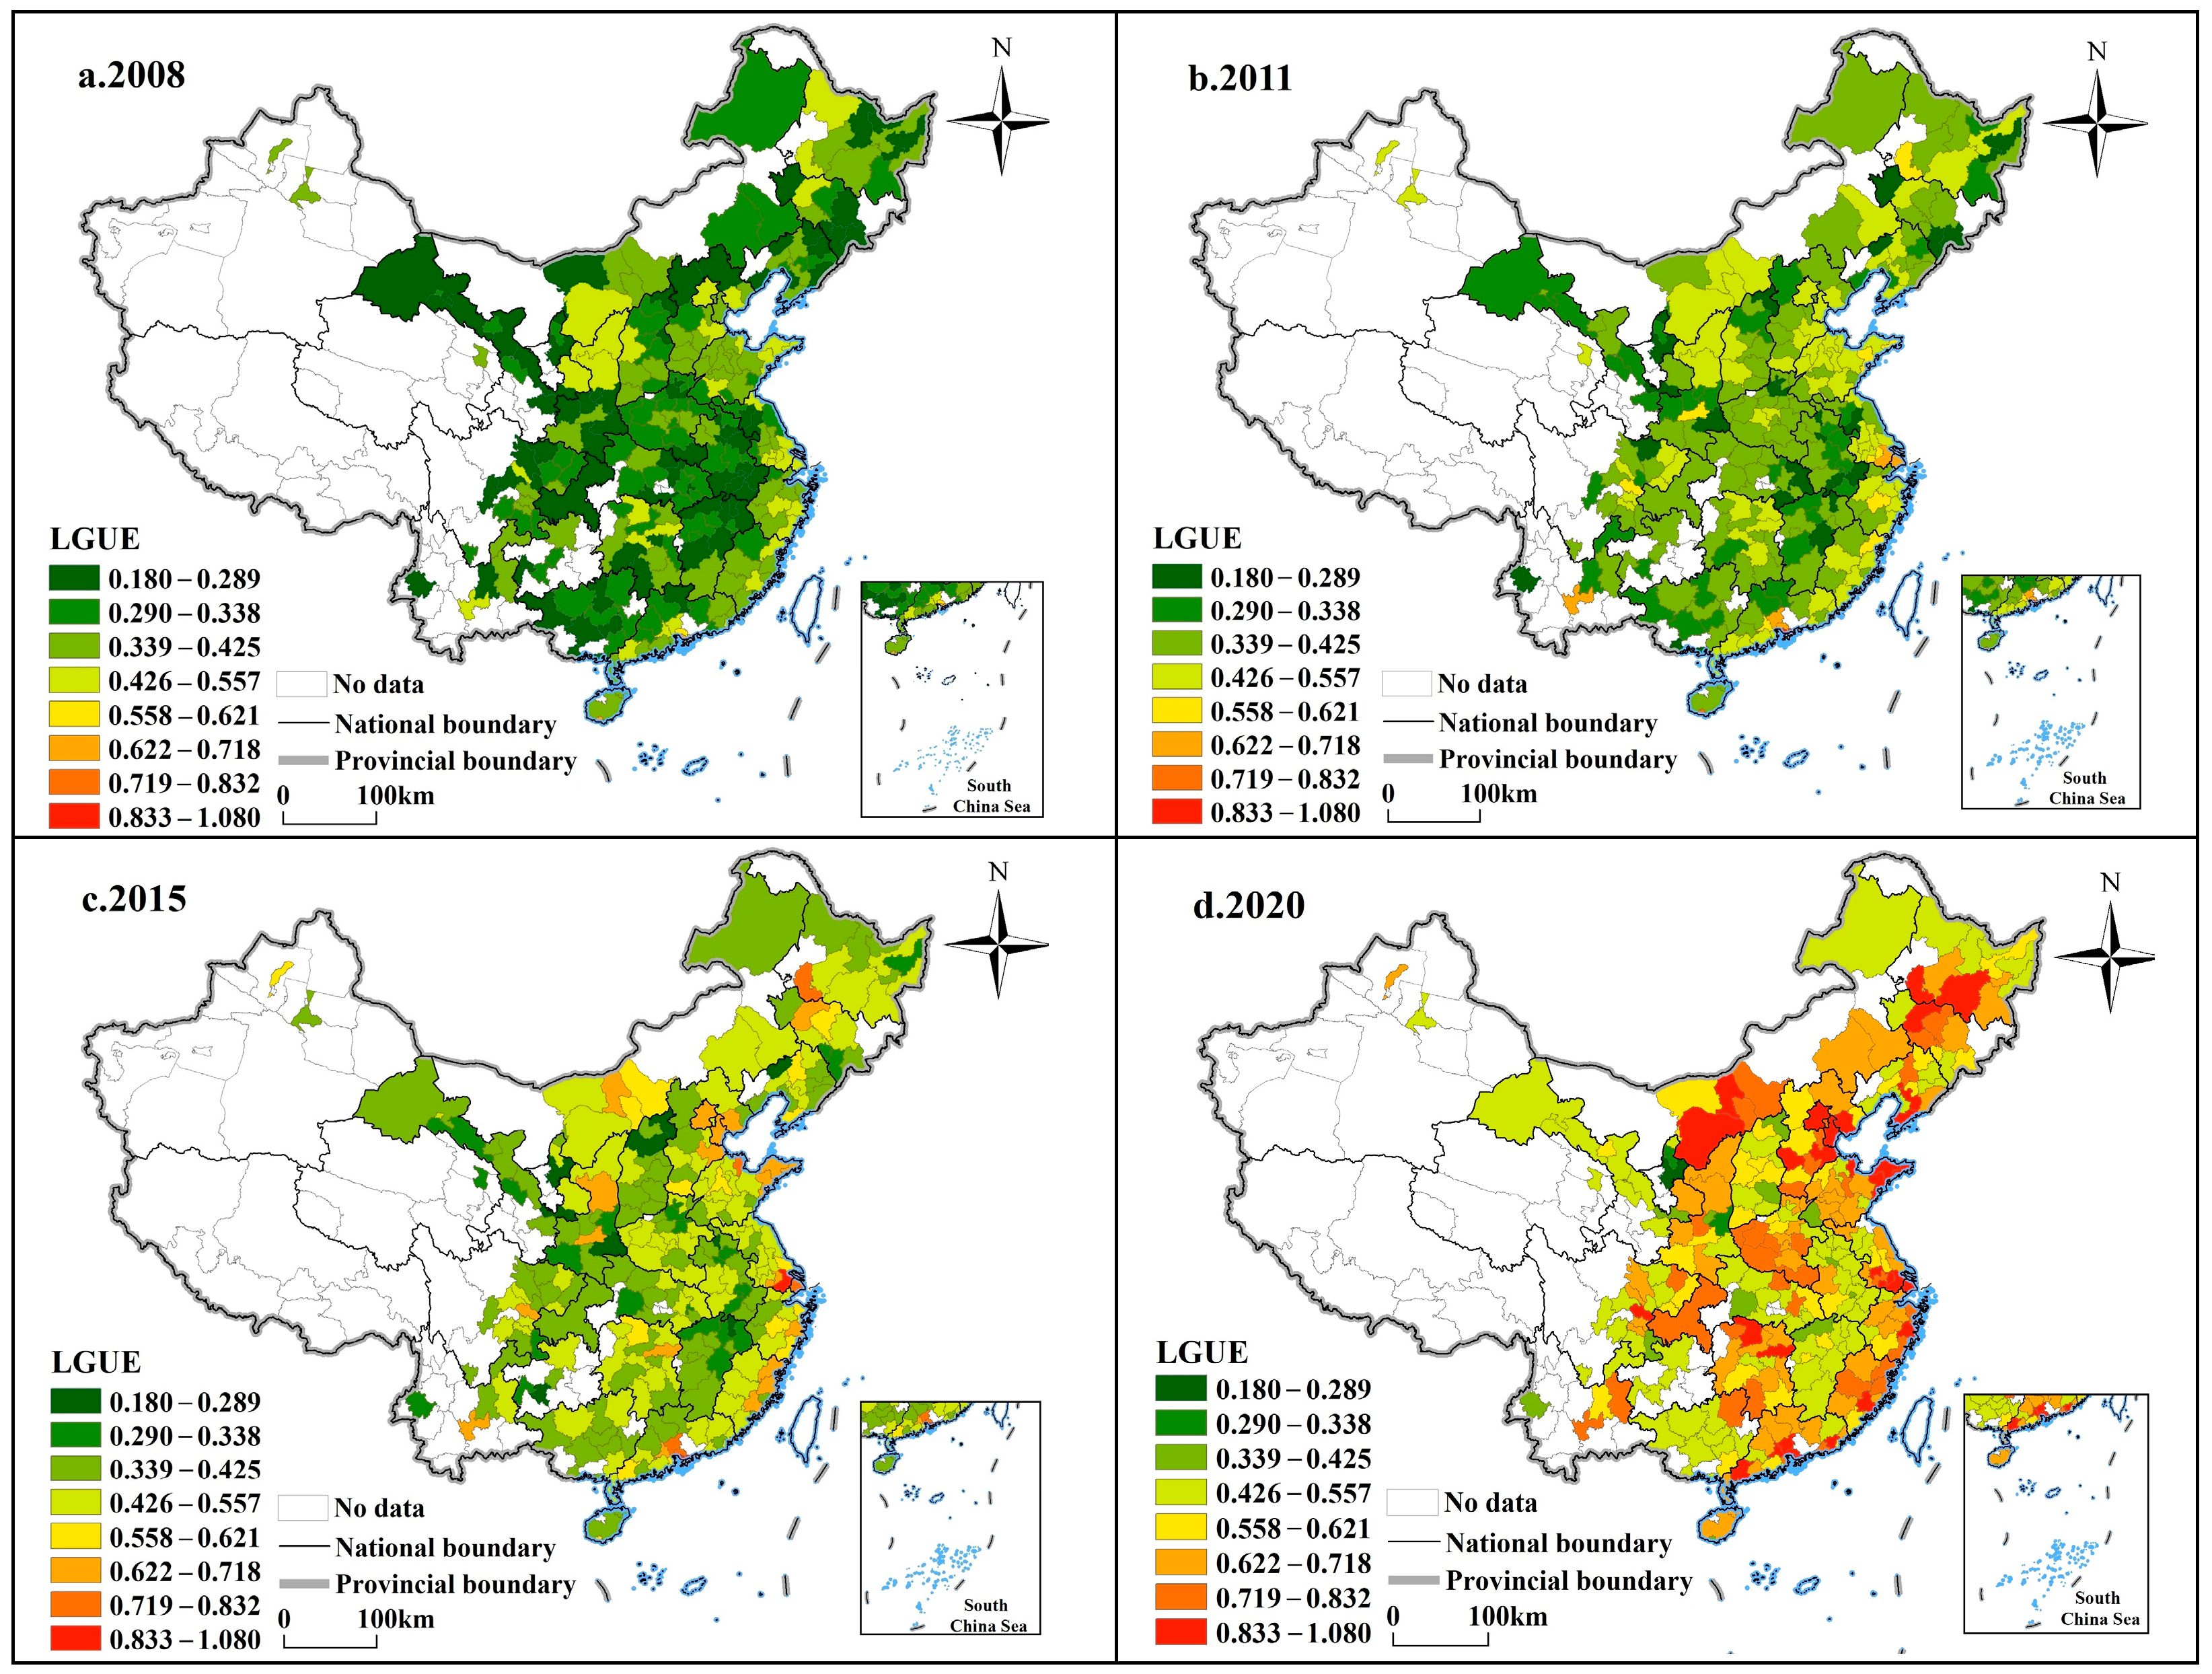
4.1. Time Series Evolution Characteristics of LGUE
4.2. Spatiotemporal Correlation Characteristics of LGUE
5. Empirical Analysis
5.1. Model Testing
5.2. Baseline Regression Results
5.3. Spatial Spillover Effects
5.4. Spatiotemporal Heterogeneity Effect
5.5. The Theoretical Analysis Framework of Urban Expansion on LGUE
6. Discussion
7. Conclusions and Policy Implications
7.1. Conclusions
7.2. Policy Implications
Author Contributions
Funding
Data Availability Statement
Conflicts of Interest
References
- Xia, S.; Han, J.; Li, A.; Ye, P.; Zhang, H. Impact of Free Trade (Pilot) Zone Establishment on Urban Land Use Efficiency—Empirical Evidence from Cities in China. Land 2024, 13, 969. [Google Scholar] [CrossRef]
- Chakraborty, S.; Maity, I.; Dadashpoor, H.; Novotnẏ, J.; Banerji, S. Building in or out? Examining urban expansion patterns and land use efficiency across the global sample of 466 cities with million+ inhabitants. Habitat Int. 2022, 120, 102503. [Google Scholar] [CrossRef]
- Yang, D.; Luan, W. Spatial-temporal patterns of urban land use efficiency in China’s national special economic parks. Ecol. Indic. 2024, 163, 111959. [Google Scholar] [CrossRef]
- Nwokolo, S.C.; Proutsos, N.; Meyer, E.L.; Ahia, C.C. Machine learning and physics-based hybridization models for evaluation of the effects of climate change and urban expansion on photosynthetically active radiation. Atmosphere 2023, 14, 687. [Google Scholar] [CrossRef]
- Kosma, M.; Laita, A.; Duflot, R. No net loss of connectivity: Conserving habitat networks in the context of urban expansion. Landsc. Urban Plan. 2023, 239, 104847. [Google Scholar] [CrossRef]
- Zhou, G.; Xu, H.; Jiang, C.; Deng, S.; Chen, L.; Zhang, Z. Has the Digital Economy Improved the Urban Land Green Use Efficiency? Evidence from the National Big Data Comprehensive Pilot Zone Policy. Land 2024, 13, 960. [Google Scholar] [CrossRef]
- Chen, Q.; Zheng, L.; Wang, Y.; Wu, D.; Li, J. A comparative study on urban land use eco-efficiency of Yangtze and Yellow rivers in China: From the perspective of spatiotemporal heterogeneity, spatial transition and driving factors. Ecol. Indic. 2023, 151, 110331. [Google Scholar] [CrossRef]
- Wang, Z.; Fu, H.; Liu, H.; Liao, C. Urban development sustainability, industrial structure adjustment, and land use efficiency in China. Sustain. Cities Soc. 2023, 89, 104338. [Google Scholar] [CrossRef]
- Zhou, C.; Wang, J.; Wu, Z. Impact of China’s Energy-Consuming Right Trading on Urban Land Green Utilization Efficiency. Land 2024, 13, 729. [Google Scholar] [CrossRef]
- Tan, S.; Hu, B.; Kuang, B.; Zhou, M. Regional differences and dynamic evolution of urban land green use efficiency within the Yangtze River Delta, China. Land Use Policy 2021, 106, 105449. [Google Scholar] [CrossRef]
- Li, G.; Fang, C.; Li, Y.; Wang, Z.; Sun, S.; He, S.; Qi, W.; Bao, C.; Ma, H.; Fan, Y.; et al. Global impacts of future urban expansion on terrestrial vertebrate diversity. Nat. Commun. 2022, 13, 1628. [Google Scholar] [CrossRef]
- Lu, X.H.; Tao, X.Q.; Kuang, B.; Tang, Y.F.; Wang, M.C. Environmental assessment, environmental attention of government and green utilization efficiency of urban land. China Land Sci. 2023, 37, 104–112. [Google Scholar]
- Xie, H.; Chen, Q.; Lu, F.; Wang, W.; Yao, G.; Yu, J. Spatial-temporal disparities and influencing factors of total-factor green use efficiency of industrial land in China. J. Clean. Prod. 2019, 207, 1047–1058. [Google Scholar] [CrossRef]
- Koroso, N.H.; Zevenbergen, J.A.; Lengoiboni, M. Urban land use efficiency in Ethiopia: An assessment of urban land use sustainability in Addis Ababa. Land Use Policy 2020, 99, 105081. [Google Scholar] [CrossRef]
- Liu, C.; Zhao, G. Convergence analysis of Chinese urban green land-use efficiency. Environ. Sci. Pollut. Res. 2022, 29, 89469–89484. [Google Scholar] [CrossRef]
- Li, W.; Cai, Z.; Jin, L. Urban green land use efficiency of resource-based cities in China: Multidimensional measurements, spatial-temporal changes, and driving factors. Sustain. Cities Soc. 2024, 104, 105299. [Google Scholar] [CrossRef]
- Zhong, S.; Li, X.; Ma, J. Impacts of land finance on green land use efficiency in the Yangtze River Economic Belt: A spatial econometrics analysis. Environ. Sci. Pollut. Res. 2022, 29, 56004–56022. [Google Scholar] [CrossRef]
- Moschetto, F.A.; Ribeiro, R.B.; De Freitas, D.M. Urban expansion, regeneration and socioenvironmental vulnerability in a mangrove ecosystem at the southeast coastal of São Paulo, Brazil. Ocean Coast. Manag. 2021, 200, 105418. [Google Scholar] [CrossRef]
- Wang, Z.; Wang, L.; Zhao, B.; Pei, Q. Analysis of Spatiotemporal Interaction Characteristics and Decoupling Effects of Urban Expansion in the Central Plains Urban Agglomeration. Land 2023, 12, 772. [Google Scholar] [CrossRef]
- Xiong, H.; Ma, C.; Li, M.; Tan, J.; Wang, Y. Landslide susceptibility prediction considering land use change and human activity: A case study under rapid urban expansion and afforestation in China. Sci. Total Environ. 2023, 866, 161430. [Google Scholar] [CrossRef]
- Zeng, J.; Cui, X.; Chen, W.; Yao, X. Impact of urban expansion on the supply-demand balance of ecosystem services: An analysis of prefecture-level cities in China. Environ. Impact Assess. 2023, 99, 107003. [Google Scholar] [CrossRef]
- Jing, S.; Yan, Y.; Niu, F.; Song, W. Urban expansion in China: Spatiotemporal dynamics and determinants. Land 2022, 11, 356. [Google Scholar] [CrossRef]
- Nor, A.N.M.; Corstanje, R.; Harris, J.A.; Brewer, T. Impact of rapid urban expansion on green space structure. Ecol. Indic. 2017, 81, 274–284. [Google Scholar] [CrossRef]
- Rustiadi, E.; Pravitasari, A.E.; Setiawan, Y.; Mulya, S.P.; Pribadi, D.O.; Tsutsumida, N. Impact of continuous Jakarta megacity urban expansion on the formation of the Jakarta-Bandung conurbation over the rice farm regions. Cities 2021, 111, 103000. [Google Scholar] [CrossRef]
- Huang, C.; Xu, N. Quantifying urban expansion from 1985 to 2018 in large cities worldwide. Geocarto Int. 2022, 37, 18356–18371. [Google Scholar] [CrossRef]
- Xie, X.; Fang, B.; Xu, H.; He, S.; Li, X. Study on the coordinated relationship between Urban Land use efficiency and ecosystem health in China. Land Use Policy 2021, 102, 105235. [Google Scholar] [CrossRef]
- Rimal, B.; Sloan, S.; Keshtkar, H.; Sharma, R.; Rijal, S.; Shrestha, U.B. Patterns of historical and future urban expansion in Nepal. Remote Sens. 2020, 12, 628. [Google Scholar] [CrossRef]
- Chu, M.; Lu, J.; Sun, D. Influence of urban agglomeration expansion on fragmentation of green space: A case study of Beijing-Tianjin-Hebei urban agglomeration. Land 2022, 11, 275. [Google Scholar] [CrossRef]
- Tian, S.; Wu, W.; Shen, Z.; Wang, J.; Liu, X.; Li, L.; Li, X.; Liu, X.; Chen, H. A cross-scale study on the relationship between urban expansion and ecosystem services in China. J. Environ. Manag. 2022, 319, 115774. [Google Scholar] [CrossRef]
- Basu, T.; Das, A.; Das, K.; Pereira, P. Urban expansion induced loss of natural vegetation cover and ecosystem service values: A scenario-based study in the siliguri municipal corporation (Gateway of North-East India). Land Use Policy 2023, 132, 106838. [Google Scholar] [CrossRef]
- Liu, X.; Xu, H.; Zhang, M. The effects of urban expansion on carbon emissions: Based on the spatial interaction and transmission mechanism. J. Clean. Prod. 2024, 434, 140019. [Google Scholar] [CrossRef]
- Yang, Y.; Nan, Y.; Liu, Z.; Zhang, D.; Sun, Y. Direct and indirect losses of natural habitat caused by future urban expansion in the transnational area of Changbai Mountain. Sustain. Cities Soc. 2020, 63, 102487. [Google Scholar] [CrossRef]
- Yang, K.; Sun, W.; Luo, Y.; Zhao, L. Impact of urban expansion on vegetation: The case of China (2000–2018). J. Environ. Manag. 2021, 291, 112598. [Google Scholar] [CrossRef] [PubMed]
- Mahtta, R.; Fragkias, M.; Güneralp, B.; Mahendra, A.; Reba, M.; Wentz, E.A.; Seto, K.C. Urban land expansion: The role of population and economic growth for 300+ cities. Npj Urban Sustain. 2022, 2, 5. [Google Scholar] [CrossRef]
- Wei, G.; He, B.J.; Sun, P.; Liu, Y.; Li, R.; Ouyang, X.; Luo, K.; Li, S. Evolutionary trends of urban expansion and its sustainable development: Evidence from 80 representative cities in the belt and road initiative region. Cities 2023, 138, 104353. [Google Scholar] [CrossRef]
- Han, S.S. Urban expansion in contemporary China: What can we learn from a small town? Land Use Policy 2010, 27, 780–787. [Google Scholar] [CrossRef]
- Wang, S.; Luo, X. The evolution of government behaviors and urban expansion in Shanghai. Land Use Policy 2022, 114, 105973. [Google Scholar]
- Puplampu, D.A.; Boafo, Y.A. Exploring the impacts of urban expansion on green spaces availability and delivery of ecosystem services in the Accra metropolis. Environ. Chall. 2021, 5, 100283. [Google Scholar] [CrossRef]
- Tian, P.; Li, J.; Cao, L.; Pu, R.; Wang, Z.; Zhang, H.; Chen, H.; Gong, H. Assessing spatiotemporal characteristics of urban heat islands from the perspective of an urban expansion and green infrastructure. Sustain. Cities Soc. 2021, 74, 103208. [Google Scholar] [CrossRef]
- Fu, T.; Zhang, T. Whether urban boundary expansion can form a new driving force for economic growth: The case of some provincial capitals’ boundary expansion. Econ. Sci. 2020, 4, 50–63. [Google Scholar]
- Ma, D.; Zhang, J.; An, B.; Guo, Z.; Zhang, F.; Yan, Y.; Peng, G. Research on urban land green use efficiency and influencing factors based on DEA and ESTDA models: Taking 284 cities in China as an example. Ecol. Indic. 2024, 160, 111824. [Google Scholar] [CrossRef]
- Levin, N.; Kyba, C.C.; Zhang, Q.; de Miguel, A.S.; Román, M.O.; Li, X.; Portnov, B.A.; Molthan, A.L.; Jechow, A.; Miller, S.D.; et al. Remote sensing of night lights: A review and an outlook for the future. Remote Sens. Environ. 2020, 237, 111443. [Google Scholar] [CrossRef]
- Dong, H.; Li, R.; Li, J.; Li, S. Study on urban spatiotemporal expansion pattern of three first-class urban agglomerations in China derived from integrated DMSP-OLS and NPP-VIIRS nighttime light data. J. Geo-Inf. Sci. 2020, 22, 1161. [Google Scholar]
- Li, X.; Zhou, Y.; Zhao, M.; Zhao, X. A harmonized global nighttime light dataset 1992–2018. Sci. Data 2020, 7, 168. [Google Scholar] [CrossRef] [PubMed]
- Liao, Z.J.; Wang, L. Urban sprawl and high-quality economic development: The research of nighttime satellite light data in China. Financ. Econ. 2019, 6, 106–119. [Google Scholar]
- Gao, X.; Zhang, A.; Sun, Z. How regional economic integration influence on urban land use efficiency? A case study of Wuhan metropolitan area, China. Land Use Policy 2020, 90, 104329. [Google Scholar] [CrossRef]
- Zhang, J.; Zhang, P.; Liu, Y.; Lu, S.; Wu, G. An analysis of the spatiotemporal evolution and driving force of cultivated land green utilization in karst region of southwest China. J. Clean. Prod. 2024, 434, 140002. [Google Scholar] [CrossRef]
- Wu, H.; Hao, Y.; Ren, S. How do environmental regulation and environmental decentralization affect green total factor energy efficiency: Evidence from China. Energy Econ. 2020, 91, 104880. [Google Scholar] [CrossRef]
- Chen, Y.; Miao, J.; Zhu, Z. Measuring green total factor productivity of China’s agricultural sector: A three-stage SBM-DEA model with non-point source pollution and CO2 emissions. China Econ. Rev. 2021, 318, 128543. [Google Scholar] [CrossRef]
- Zhang, Y.; Wang, T.; Ren, C.; Wang, L.; Zhang, K.; Song, R. Heterogeneous impacts and spillover effects of green innovation network and environmental regulation on water use efficiency: A spatiotemporal perspective from 269 cities in China. Sustain. Cities Soc. 2023, 90, 104361. [Google Scholar] [CrossRef]
- Tone, K.; Tsutsui, M. An epsilon-based measure of efficiency in DEA e a third pole of technical efficiency. Eur. J. Oper. Res. 2010, 207, 1554–1563. [Google Scholar] [CrossRef]
- Wang, H.; Cui, H.; Zhao, Q. Effect of green technology innovation on green total factor productivity in China: Evidence from spatial durbin model analysis. J. Clean. Prod. 2021, 288, 125624. [Google Scholar] [CrossRef]
- Xie, R.; Fu, W.; Yao, S.; Zhang, Q. Effects of financial agglomeration on green total factor productivity in Chinese cities: Insights from an empirical spatial Durbin model. Energy Econ. 2021, 101, 105449. [Google Scholar] [CrossRef]
- Elhorst, J.P. The dynamic general nesting spatial econometric model for spatial panels with common factors: Further raising the bar. Rev. Reg. Res. 2022, 42, 249–267. [Google Scholar] [CrossRef] [PubMed]
- Shabrina, Z.; Buyuklieva, B.; Ng, M.K.M. Short-term rental platform in the urban tourism context: A geographically weighted regression (GWR) and a multiscale GWR (MGWR) approaches. Geogr. Anal. 2021, 53, 686–707. [Google Scholar] [CrossRef]
- Wang, H.; Zhang, B.; Liu, Y.; Liu, Y.; Xu, S.; Zhao, Y.; Chen, Y.; Hong, S. Urban expansion patterns and their driving forces based on the center of gravity-GTWR model: A case study of the Beijing-Tianjin-Hebei urban agglomeration. J. Geogr. Sci. 2020, 30, 297–318. [Google Scholar] [CrossRef]
- Zhao, M.; Wang, H.; Sun, J.; Tang, R.; Cai, B.; Song, X.; Huang, X.; Huang, J.; Fan, Z. Spatio-temporal characteristics of soil Cd pollution and its influencing factors: A Geographically and temporally weighted regression (GTWR) method. J. Hazard. Mater. 2023, 446, 130613. [Google Scholar] [CrossRef] [PubMed]
- Myovella, G.; Karacuka, M.; Haucap, J. Determinants of digitalization and digital divide in Sub-Saharan African economies: A spatial Durbin analysis. Telecommun. Policy 2021, 45, 102224. [Google Scholar] [CrossRef]
- Halder, B.; Haghbin, M.; Farooque, A.A. An assessment of urban expansion impacts on land transformation of Rajpur-Sonarpur Municipality. Knowl.-Based Eng. Sci. 2021, 2, 34–53. [Google Scholar] [CrossRef]
- Koroso, N.H.; Lengoiboni, M.; Zevenbergen, J.A. Urbanization and urban land use efficiency: Evidence from regional and Addis Ababa satellite cities, Ethiopia. Habitat Int. 2021, 117, 102437. [Google Scholar] [CrossRef]
- Zeng, L. The driving mechanism of urban land green use efficiency in China based on the EBM model with undesirable outputs and the spatial Dubin model. Int. J. Environ. Res. Public Health 2022, 19, 10748. [Google Scholar] [CrossRef] [PubMed]
- He, S.; Yu, S.; Li, G.; Zhang, J. Exploring the influence of urban form on land-use efficiency from a spatiotemporal heterogeneity perspective: Evidence from 336 Chinese cities. Land Use Policy 2020, 95, 104576. [Google Scholar] [CrossRef]
- Ou, Y.; Bao, Z.; Ng, S.; Song, W.; Chen, K. Land-use carbon emissions and built environment characteristics: A city-level quantitative analysis in emerging economies. Land Use Policy 2024, 137, 107019. [Google Scholar] [CrossRef]


| Data Name | Unit | Data Type | Data Sources | Data Processing |
|---|---|---|---|---|
| Urban expansion | 1 km × 1 km 500 m × 500 m | DMSP–OLS and NPP–VIIRS remote sensing data sets | NOAA website and NGDC data center | Resampling-data correction-light fitting -consistency processing |
| PM2.5 concentration | μg/m3 | PM2.5 raster data | Dalhousie University Atmospheric Composition Analysis Group | Satellite retrieval of PM2.5 concentration |
| Urban construction land area | km2 | Economic and social attribute data | “China Urban Statistical Yearbook” “China Environmental Yearbook” “Statistical Bulletin” | — |
| Urban employed persons | 104 persons | — | ||
| Total fixed asset investment | 104 yuan | — | ||
| Real GDP | 104 yuan | GDP deflator | ||
| Industrial wastewater | 104 tons | — | ||
| industrial sulfur dioxide | tons | — |
| Fitting Function | Equation | Goodness of Fit (R2) |
|---|---|---|
| Linear function | y = 1.4867x + 37,892 | 0.8124 |
| Logarithmic function | y = 54,108ln(x) − 439,260 | 0.596 |
| Power function | y = 31.671x0.7759 | 0.8472 |
| Polynomial function | y = −6 × 10−7x2 + 1.7101x + 33,402 | 0.8187 |
| Variables | Obs | Mean | Std. Dev. | Min | Max |
|---|---|---|---|---|---|
| lnUE | 3497 | 0.6816 | 0.2520 | 0.001 | 0.9912 |
| lnIND | 3497 | 6.6461 | 1.0717 | 3.0445 | 9.8411 |
| lnER | 3497 | −4.5587 | 2.0900 | −12.5499 | 8.3547 |
| lnFIS | 3497 | −1.7359 | 0.5318 | −4.1758 | 1.7985 |
| lnFDI | 3497 | 9.8815 | 1.9905 | 2.3025 | 14.9417 |
| lnTEC | 3497 | 5.7736 | 0.9195 | 1.5973 | 8.8142 |
| Testing Method | W1 | Testing Method | W1 |
|---|---|---|---|
| LM-spatial lag | 1123.347 *** | Wald-spatial lag | 38.382 *** |
| R-LM-spatial lag | 489.283 *** | LR-spatial lag | 27.332 *** |
| LM-spatial error | 389.982 *** | Wald | 38.862 *** |
| R-LM-spatial error | 18.663 *** | LR-spatial error | 22.386 *** |
| Explanatory Variables | Traditional Panel Model | Fixed Effect SDM | ||
|---|---|---|---|---|
| Space-Time Fixed | Space Fixed | Time Fixed | ||
| UE | −0.0937 (−0.9974) | 0.036 *** (2.7798) | 0.0372 *** (2.8772) | −0.5371 *** (−5.9611) |
| UE2 | −0.0046 (−0.1518) | −0.0954 ** (−2.2267) | −0.0975 ** (−2.2932) | 0.1544 *** (5.1149) |
| IND | 0.0300 *** (10.5605) | −0.0429 *** (−8.9015) | −0.0470 *** (−9.1685) | 0.0244 *** (9.2188) |
| ER | 0.0416 *** (44.6848) | 0.0122 *** (20.4637) | 0.0217 *** (21.0959) | 0.0271 *** (28.2003) |
| FIS | 0.0363 *** (8.6734) | 0.0303 *** (6.6888) | 0.0315 *** (7.0187) | −0.0469 *** (−9.4781) |
| FDI | 0.0014 (1.0852) | 0.0021 *** (2.9796) | 0.0012 ** (2.2074) | 0.0003 (0.2845) |
| TEC | −0.0246 *** (−7.7982) | 0.0032 (0.8086) | 0.0060 (1.0026) | −0.0108 *** (−3.1386) |
| WX | YES | YES | YES | YES |
| δ | — | 0.4539 *** | 0.6199 *** | 0.4489 *** |
| R2 | 0.6912 | 0.8928 | 0.8922 | 0.6179 |
| sigma2 | — | 0.0023 | 0.0023 | 0.0082 |
| Log-L | — | 5354.1495 | 5209.1919 | 2930.3667 |
| Explanatory Variables | UE | UE2 | IND | ER | FIS | FDI | TEC |
|---|---|---|---|---|---|---|---|
| Direct effect | 0.0287 *** (4.8737) | −0.0673 ** (−2.2344) | −0.0463 *** (8.5534) | 0.0265 *** (17.6633) | 0.0245 *** (5.8448) | 0.0011 *** (2.5372) | 0.0039 (0.8730) |
| Spillover Effect | −0.0457 *** (−3.3385) | 0.2283 *** (2.6495) | −0.0212 ** (−2.237) | 0.0055 *** (2.8444) | −0.0020 (−0.1235) | 0.0034 * (1.6719) | 0.0025 (1.2184) |
| Total effect | −0.0218 * (−1.8930) | 0.1271 ** (1.9609) | −0.0535 *** (−4.5644) | 0.0453 *** (8.8654) | 0.0784 ** (2.2487) | 0.0036 *** (2.4287) | 0.0004 (0.5156) |
Disclaimer/Publisher’s Note: The statements, opinions and data contained in all publications are solely those of the individual author(s) and contributor(s) and not of MDPI and/or the editor(s). MDPI and/or the editor(s) disclaim responsibility for any injury to people or property resulting from any ideas, methods, instructions or products referred to in the content. |
© 2024 by the authors. Licensee MDPI, Basel, Switzerland. This article is an open access article distributed under the terms and conditions of the Creative Commons Attribution (CC BY) license (https://creativecommons.org/licenses/by/4.0/).
Share and Cite
Deng, Z.; Xiao, F.; Huang, J.; Zhang, Y.; Zhang, F. Spillover Effects of Urban Expansion on Land Green Use Efficiency: An Empirical Study Based on Multi-Source Remote Sensing Data in China. Land 2024, 13, 1102. https://doi.org/10.3390/land13071102
Deng Z, Xiao F, Huang J, Zhang Y, Zhang F. Spillover Effects of Urban Expansion on Land Green Use Efficiency: An Empirical Study Based on Multi-Source Remote Sensing Data in China. Land. 2024; 13(7):1102. https://doi.org/10.3390/land13071102
Chicago/Turabian StyleDeng, Zhen, Fan Xiao, Jing Huang, Yizhen Zhang, and Fang Zhang. 2024. "Spillover Effects of Urban Expansion on Land Green Use Efficiency: An Empirical Study Based on Multi-Source Remote Sensing Data in China" Land 13, no. 7: 1102. https://doi.org/10.3390/land13071102
APA StyleDeng, Z., Xiao, F., Huang, J., Zhang, Y., & Zhang, F. (2024). Spillover Effects of Urban Expansion on Land Green Use Efficiency: An Empirical Study Based on Multi-Source Remote Sensing Data in China. Land, 13(7), 1102. https://doi.org/10.3390/land13071102