Abstract
Many scholars have used samples of drying soil to observe the amount of soil condensation water, which may have exaggerated the amount of regional condensation water, as the soil water content in the natural state was not considered. To analyze the effect of soil moisture content on soil condensation in the natural state, the soil condensation volume in loess and sandy soil under different gravimetric moisture content conditions was measured in the autumn of 2022 and spring of 2023 using micro-lysimeters combined with the weighing method at the groundwater and environment site of Chang’an University, Guanzhong Basin, China. The results showed that the average daily condensation of loess under 0%, 3%, 7%, 11%, and 15% moisture content conditions was 0.34, 0.09, 0.01, −0.05, and −0.07 mm with the condensation days of 54, 40, 24, 21, and 16, respectively, and that of sandy soil was 0.21, −0.02, −0.28, −0.82, and −1.35 mm with condensation days of 54, 24, 2, 3, and 1, respectively. Under the same moisture content conditions, loess had more condensation and condensation days than sandy soil. Soil condensation water occurred mainly when the water content was less than 7%, and it was negatively correlated with soil water content. The quantity of soil condensation water was positively correlated with relative humidity and negatively correlated with air temperature–dew point differences. Relative humidity exceeding 60% and air temperature–dew point differences below 8 °C were more favorable for the formation of soil condensation water. This study provides a reference for the assessment of soil condensation in the natural state.
1. Introduction
In arid and semi-arid regions, water shortage has become a key problem restricting the regions’ ecological construction and economic development due to scarce rainfall and strong evaporation. It has been shown that condensation water can be directly absorbed and utilized by shallow-rooted plants or soil organisms and is a more efficient source of water than precipitation [1,2]. It is important for plant growth and the survival of soil organisms and plays a unique ecological role in sustaining fragile ecosystems in arid and semi-arid regions [3,4,5,6]. Soil condensation water is liquid water from atmospheric water vapor and water vapor in soil pores that condenses in the surface soil when the surface soil temperature reaches the dew point and becomes a component of soil water [7,8,9]. The process of water vapor condensation often occurs in conjunction with vapor adsorption in soil. Soil adsorption water refers to the water that adheres to the surface of soil particles in the form of film water and adsorbed water layers on the surface of dry soil particles [10,11,12]. Soil adsorption water and condensation water are known as adsorption–condensation water [13,14]. The soil condensation water investigated in this study also falls under the category of adsorption–condensation water.
Soil condensate should not be neglected in the hydrological cycle of dry regions. For example, non-precipitating land surface water dominated by condensate can account for 9% and 33% of the total source of land surface water in the Gurbantunggut Desert and Taklamakan Desert regions in Xinjiang, China, respectively [15,16]. The amount of condensate accounted for 20.18% of rainfall from autumn to spring in the Kubuch Desert of the Inner Mongolia Autonomous Region in China [17]. The amount of condensed water in the annual water balance reaches 8.68% in the Arid Valley region of the western United States [18]. Moro et al. found that the contribution of condensed water to the water balance reaches 12% [19]. In addition, condensation may be detrimental to plant growth and development—for example, dew forms a water film on the plant surface that favors the germination of pathogen spores [20]. Soil condensation water is mainly influenced by atmospheric relative humidity, air temperature–dew point difference, wind speed, and cloud cover [20,21]. Higher atmospheric relative humidity provides abundant water vapor for soil condensation, encouraging continuous condensation [22]. Smaller air temperature–dew point differences provide the impetus for soil condensation, which benefits soil condensation [23]. Wind influences the diffusion and exchange of water vapor in the air, and a moderate wind speed ensures that there is enough water vapor in the air to cause condensation [24,25]. When it is clear and cloudless at night, the ground temperature drops more rapidly, which favors vapor condensation [23,26].
In the mid-latitude arid and semi-arid zones of the Northern Hemisphere, such as the Loess Plateau in China [27] and parts of Europe [28] and North America [29], there are large amounts of loess, covering an area of up to 94,000,000 km2 [30], while in the arid and semi-arid regions of the globe, such as the Sahara Desert [31], the Arabian Desert [32], the Australian Desert [33], and the northwestern part of China [34], there are large amounts of sandy soils, covering an area of up to 9,772,000 km2. Due to the differences in the physical properties of soil, such as particle size, bulk density, and structure, there are differences in the condensate produced by different soil types. In this study, two typical soils, sandy soil and loess, were selected to carry out a comparative analysis of condensation water [35,36,37,38]. In previous studies, dry soil samples were often selected and placed in the field to observe condensation [39,40,41]. However, the surface soil in the natural environment is not always dry, especially before and after rainfall, when soil moisture content is high and largely evaporated. If dried soil samples are placed in the field before and after rainfall, there will inevitably be significant soil condensation, and the observed values will not accurately reflect the amount of soil condensation in the region. The soil water content in this natural state was not considered [42,43,44,45], thus neglecting its effect on condensation, which may lead to bias in the estimation of soil condensation. Therefore, we simulated soil that was not completely dry by formulating soil samples with varying levels of water content.
There are some methods for observing condensate, such as the micro-lysimeter meter combined with the weighing method, the Duvdevani condensate meter method [46], the Hiltner dew balance meter method [47], the soil moisture sensor method [48], and so on. The micro-lysimeter meter combined with the weighing method to determine soil condensate works on the principle of water balance. Most scholars have adopted this method because of its simple structure, easy operation, no limitation of time and space, and no damage to the original structure of the soil, and because it is especially suitable for the observation of condensate in the field [49,50,51,52,53,54,55,56]. In this study, hand-made micro-lysimeters were used to observe the amount of soil condensate under different soil moisture content conditions using the weighing method to analyze the relationship between soil moisture content and soil condensate [39,40,41]. This study not only fills the gap in the existing literature on the behavior of soil condensate under incompletely dry soil conditions but also provides a new perspective for understanding soil condensate water in arid and semi-arid regions.
2. Materials and Methods
2.1. Measurement Site
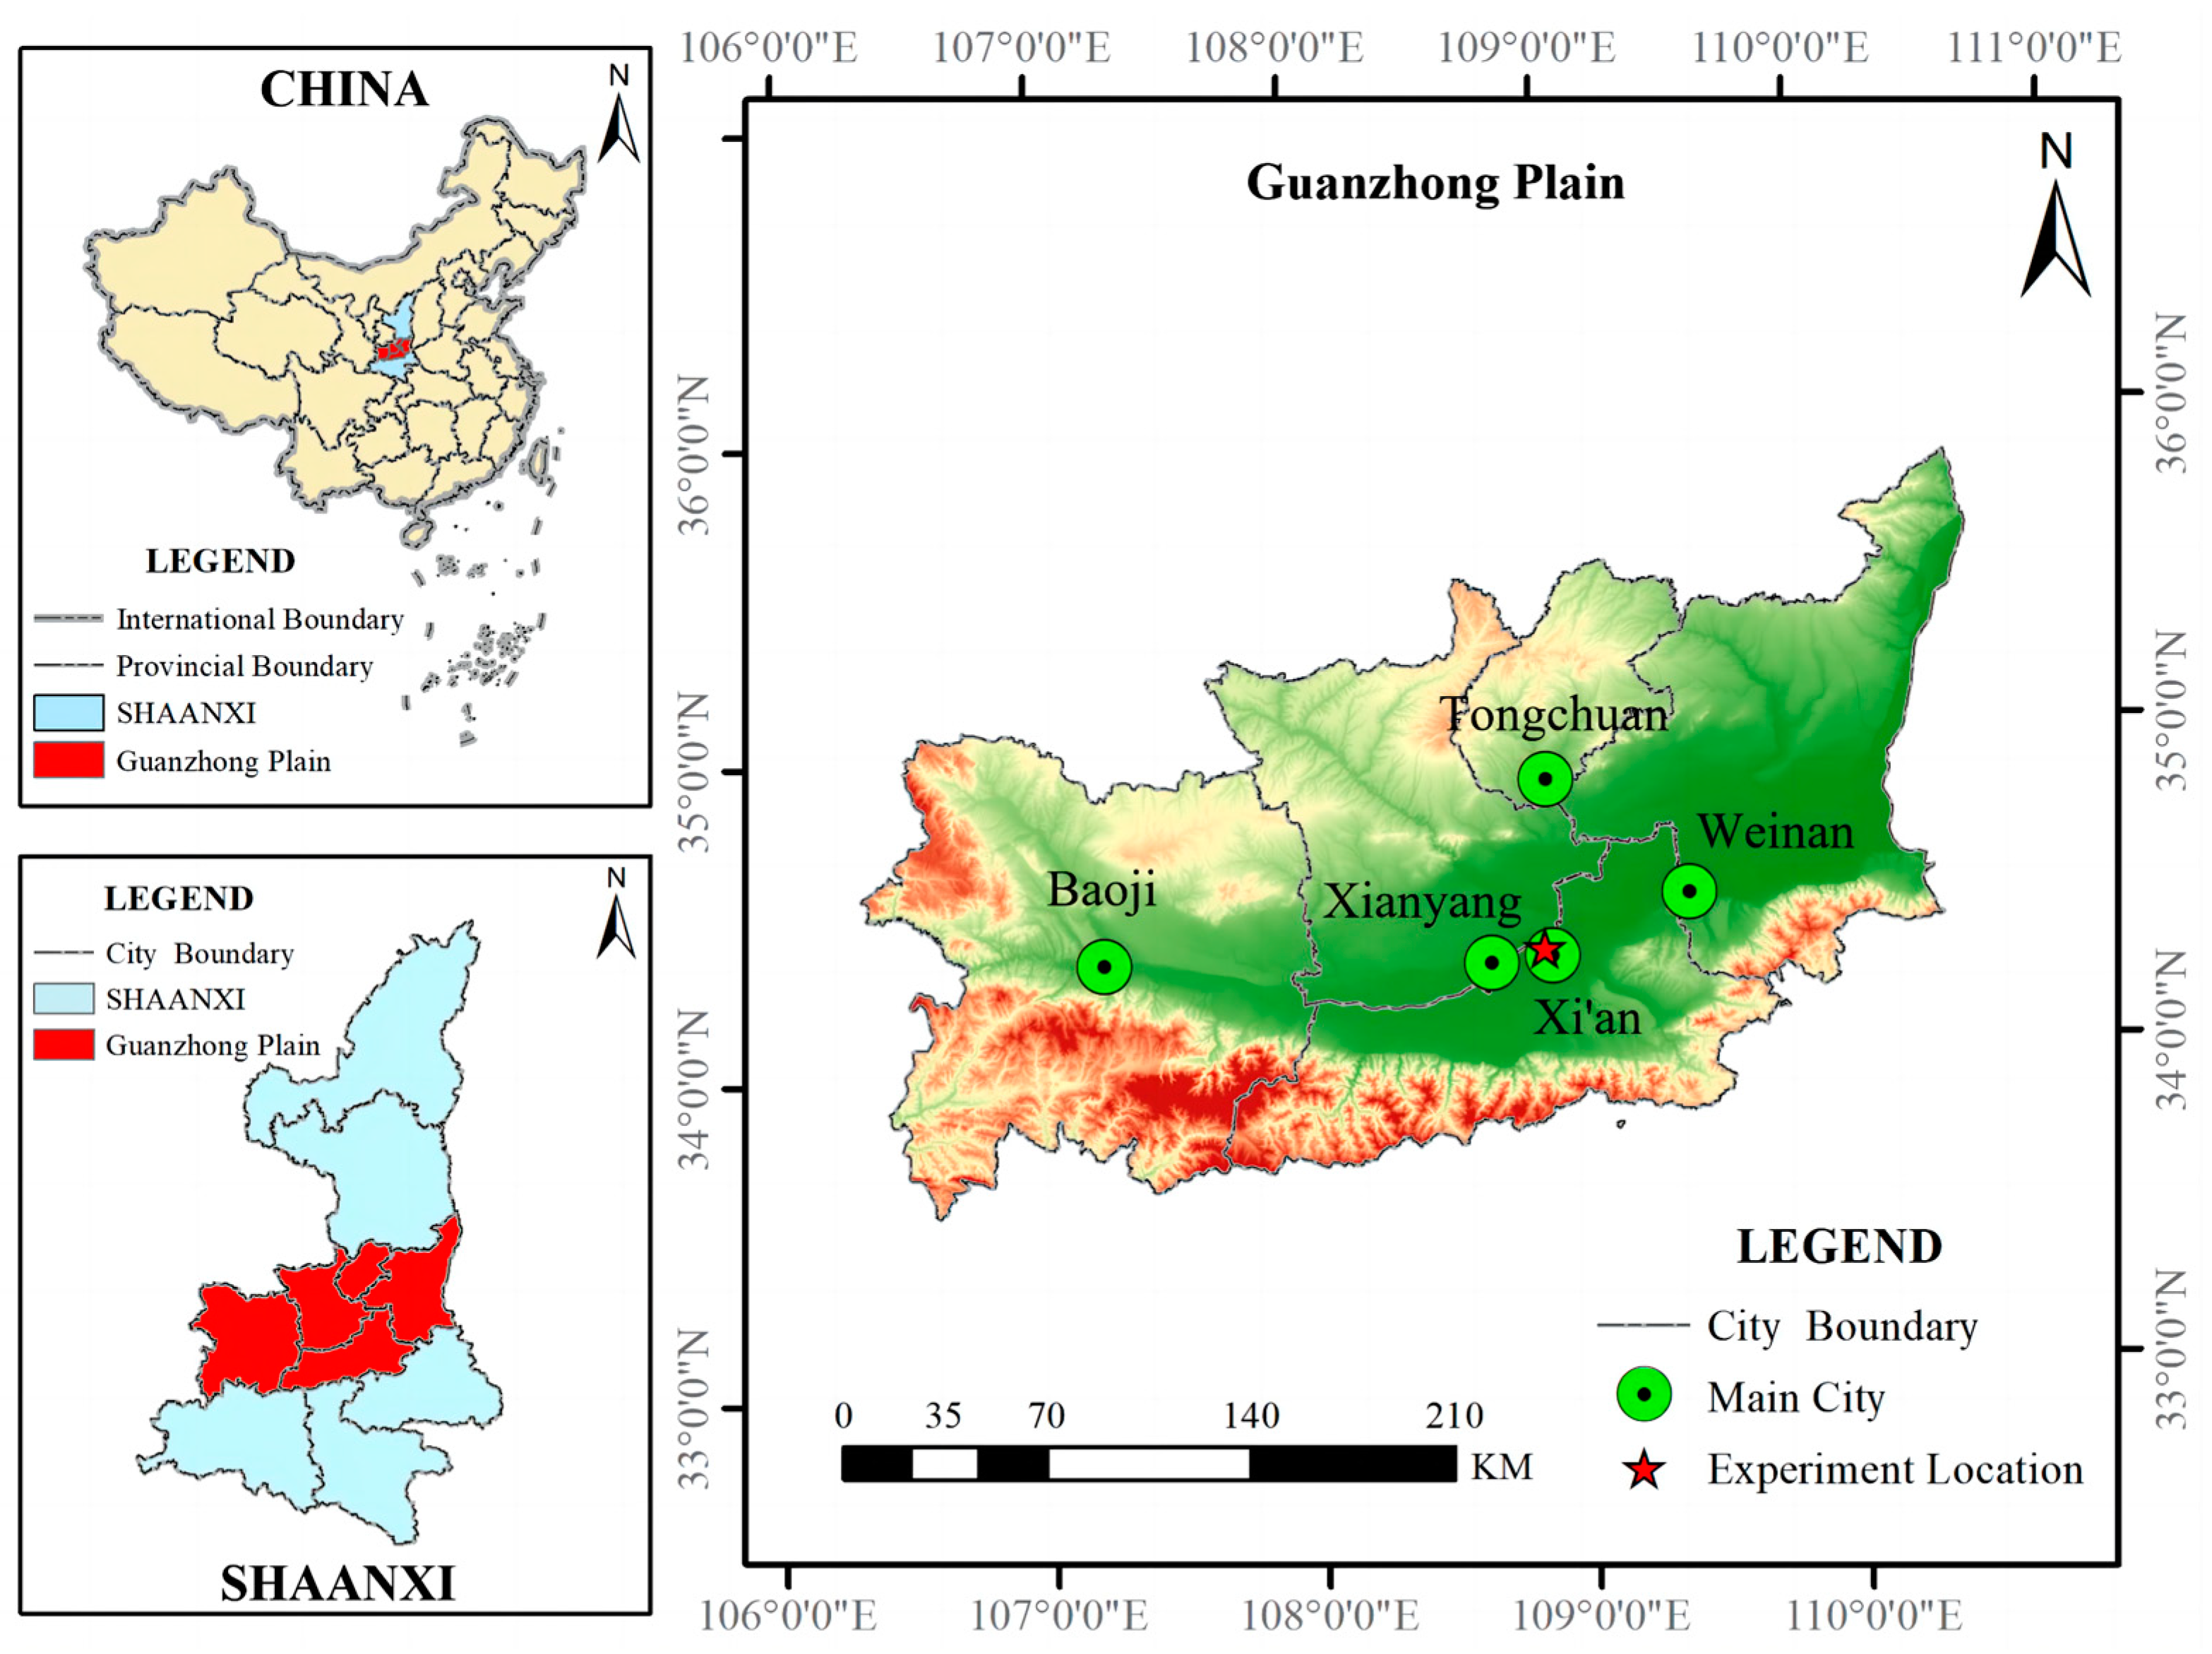
The experimental station was located in the middle of the Guanzhong Plain, China, as shown in Figure 1. The Guanzhong Plain is also known as the Weihe Alluvial Plain in central Shaanxi Province, extending from Baoji in the west to Tongguan in the east, and from the Qinling Mountains in the south to the Huanglong Mountains and Ziwuling Mountains in the north. The field experiment was conducted at the groundwater and ecological environmental in situ experiment site (34°22′8.34″ N, 108°54′28.44″ E), Weishui Campus, Chang’an University, Xi’an City, Shaanxi Province. The site is situated within the transitional zone of the warm temperate zone, exhibiting characteristics of both a semi-humid monsoon climate and a continental monsoon climate. It experiences a distinct seasonal shift, with cold winters and hot summers. The annual average temperature is 13.0–13.7 °C, with an average temperature of −1.2–0 °C in the coldest month (January) and 26.3–26.6 °C in the hottest month (July). Annual precipitation ranges from 522.4 to 719.5 mm, and annual potential evapotranspiration ranges from 1200 to 1400 mm. The zonal vegetation belongs to the warm-temperate deciduous broad-leaved forest zone and is rich in tree and shrub species. The plant community structure is dominated by a “tree-shrub-herb” type of vegetation, with Rosaceae, Oleaceae, Caprifoliaceae, and Leguminosae as the main dominant species [57,58].

Figure 1.
Geographical location of the experiment site.
2.2. Experimental Materials
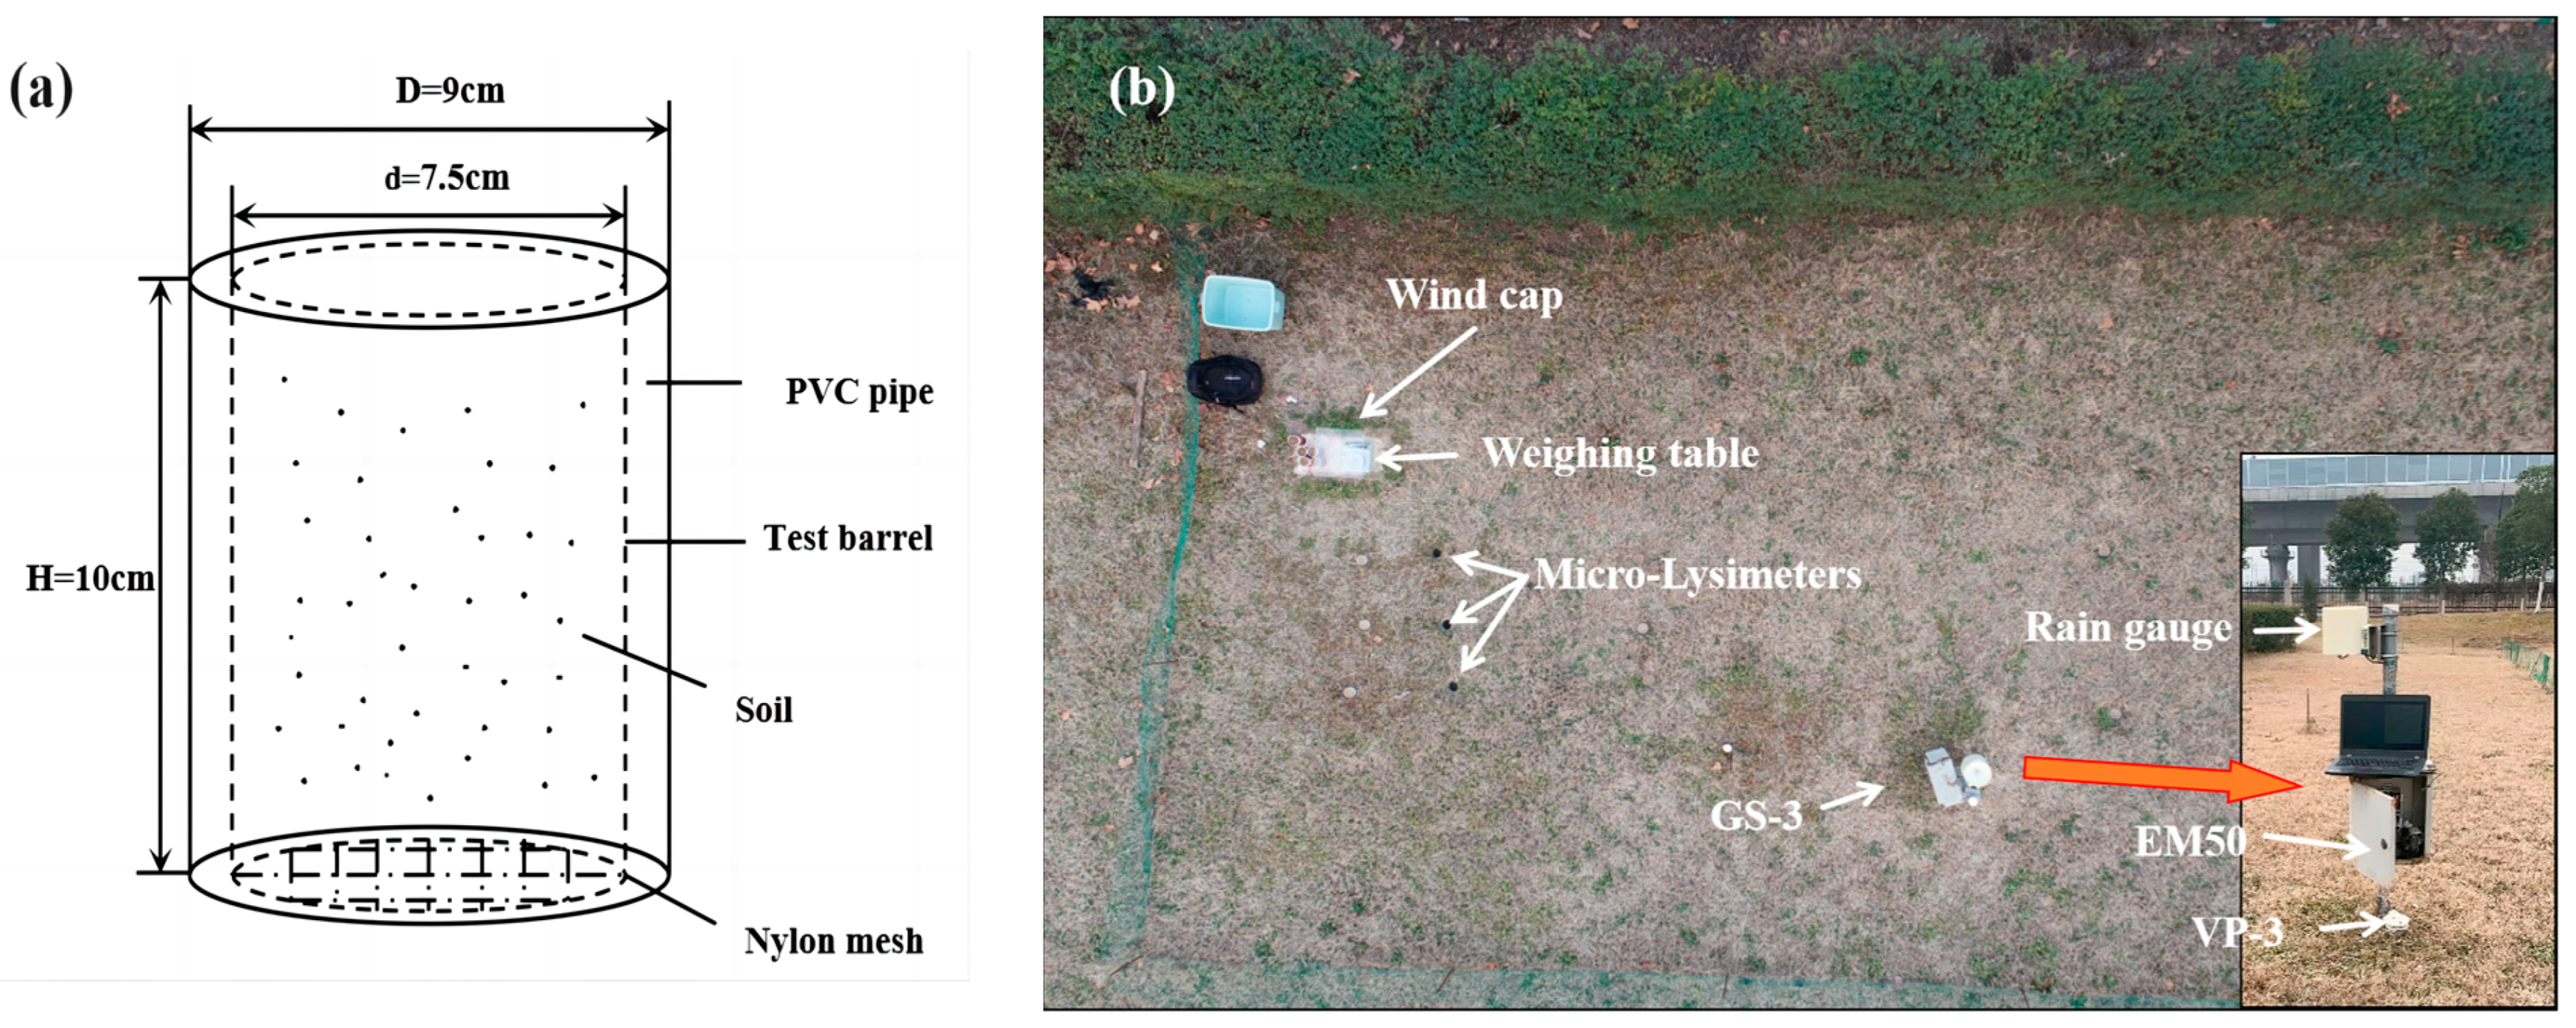
The micro-lysimeter consisted of inner and outer tubes with diameters of 7.5 cm and 9 cm, respectively. The height of the micro-lysimeter was 10 cm (Figure 2a). The inner tube was filled with soil of varying soil gravimetric moisture content. The upper part of the inner tube was unsealed, and the bottom was sealed with a 300-mesh nylon mesh so that water vapor in the air near the surface and soil pores could be exchanged within the micro-lysimeter, and the soil particles would remain in the cylinder. Gravel, which was approximately 1 cm thick, was placed at the bottom of the outer pipe to reduce soil capillary action.
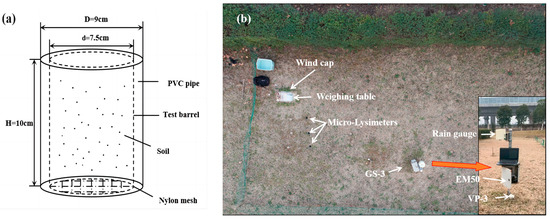
Figure 2.
Schematic diagram of the micro-lysimeter devices (a) and field layout (b).
Two soil types, loess and sandy soil, were selected for this experiment: the loess sampling site was located in Ansai District, Yan’an City, Shaanxi Province, and the sandy soil sampling site was located on the south bank of the Wei River in Xi’an City, Shaanxi Province. The loess structure is massive loose and porous, and the sandy soil structure is granular and disorganized. A ring knife with a volume of 200 cm2 was utilized to collect the in situ soil from the soil profile, which was dried for more than 8 h after collection, and the soil bulk weights at different depths were obtained by calculating the weight of the soil per unit volume after drying. According to the calculations, the soil capacity of loess soil was 1.40 g/cm3 and that of sandy soil was 1.60 g/cm3. The dried soil samples in the ring knife were ground and sieved (2 mm aperture sieve), and then a Bettersize 2000 laser particle size analyzer was used to determine the particle gradation of the soil at the sampling site, as shown in Table 1. Based on the analysis of the physical properties of soil in arid and semi-arid regions, the gravimetric moisture content of loess during non-rainfall periods is generally below 20%, while sandy soil has a moisture content lower than 15%. Therefore, five treatment groups with soil gravimetric moisture content of 0%, 3%, 7%, 11%, and 15% were established for each soil type. To ensure accuracy, each treatment was repeated on three separate occasions.

Table 1.
Particle size distribution of soils (units: %).
2.3. Experimental Design
Because condensation in the Guanzhong Plain region mainly occurs in fall, followed by spring [59], two periods, 12 October 2022–17 November 2022 (fall) and 22 February 2023–19 April 2023 (spring), were selected for the observation of soil condensation water. Before sunset and the next day before sunrise, the micro-lysimeters were weighed using an electronic balance with an accuracy of 0.01 g. The change in its mass was considered as the quantity of condensate on that day [60].
Rainfall was measured using an ECRN-100 rain gauge (Decagon, WA USA; accuracy: ±0.2 mm) placed 100 cm above the ground. Atmospheric relative humidity (RH) and temperature were observed using a VP-3 sensor (Decagon, WA 99136 USA; accuracy: RH ± 2%, air temperature ± 0.1 °C) placed 5 cm above the ground. A GS-3 sensor (Decagon, WA 99136 USA; accuracy: VWC: ±3%, temperature: ±1 °C) was buried about 1 cm below the ground to collect soil moisture and soil temperature. All sensors were set to automatically record at an interval of 30 min using an EM50 data collector. The field layout is shown in Figure 2b.
2.4. Data Processing
2.4.1. Soil Condensation Water
The quantity of soil condensation water was expressed as the mass change observed in the micro-lysimeter every morning and evening [61,62,63], which was converted to height per unit area using Equation (1):
where W is the quantity of soil condensation water (mm)—when W is greater than 0, condensation occurs; when W is less than 0, evaporation occurs; when W equals 0, there is a dynamic equilibrium between condensation and evaporation; Δm is the difference between the sunset and sunrise measurement mass of the micro-lysimeter (g); ρ is the density of water (g/cm3); and r is the inner diameter of the micro-lysimeter cylinder (cm).
2.4.2. Dew Point Temperature
The dew point temperature was calculated using Lawrence’s equation as follows: [60,64]
where t and td are air temperature and dew point temperature (°C), respectively, RH is the atmospheric relative humidity (%), and A1 and B1 are Alduchov and Eskridge’s recommended coefficients: A1 = 17.625 and B1 = 243.04 °C [65].
2.4.3. Data Statistics and Analysis
After analyzing the processed data, histograms of both variables were found to follow an approximately normal distribution [66]. Consequently, the Pearson product-moment correlation coefficient method was employed to test the correlation between soil moisture content and soil moisture absorption and condensation [67,68].
To minimize errors caused by manual measurement, the average values of the daily weight changes in the three micro-lysimeters within each group were taken as the observation. Data analysis and graph creation were performed using Excel 2019 and Origin 2021 software, and the correlation analysis was conducted using the Pearson product-moment correlation coefficient method in SPSS 26 software.
3. Results and Discussions
3.1. Analysis of Meteorological Factors
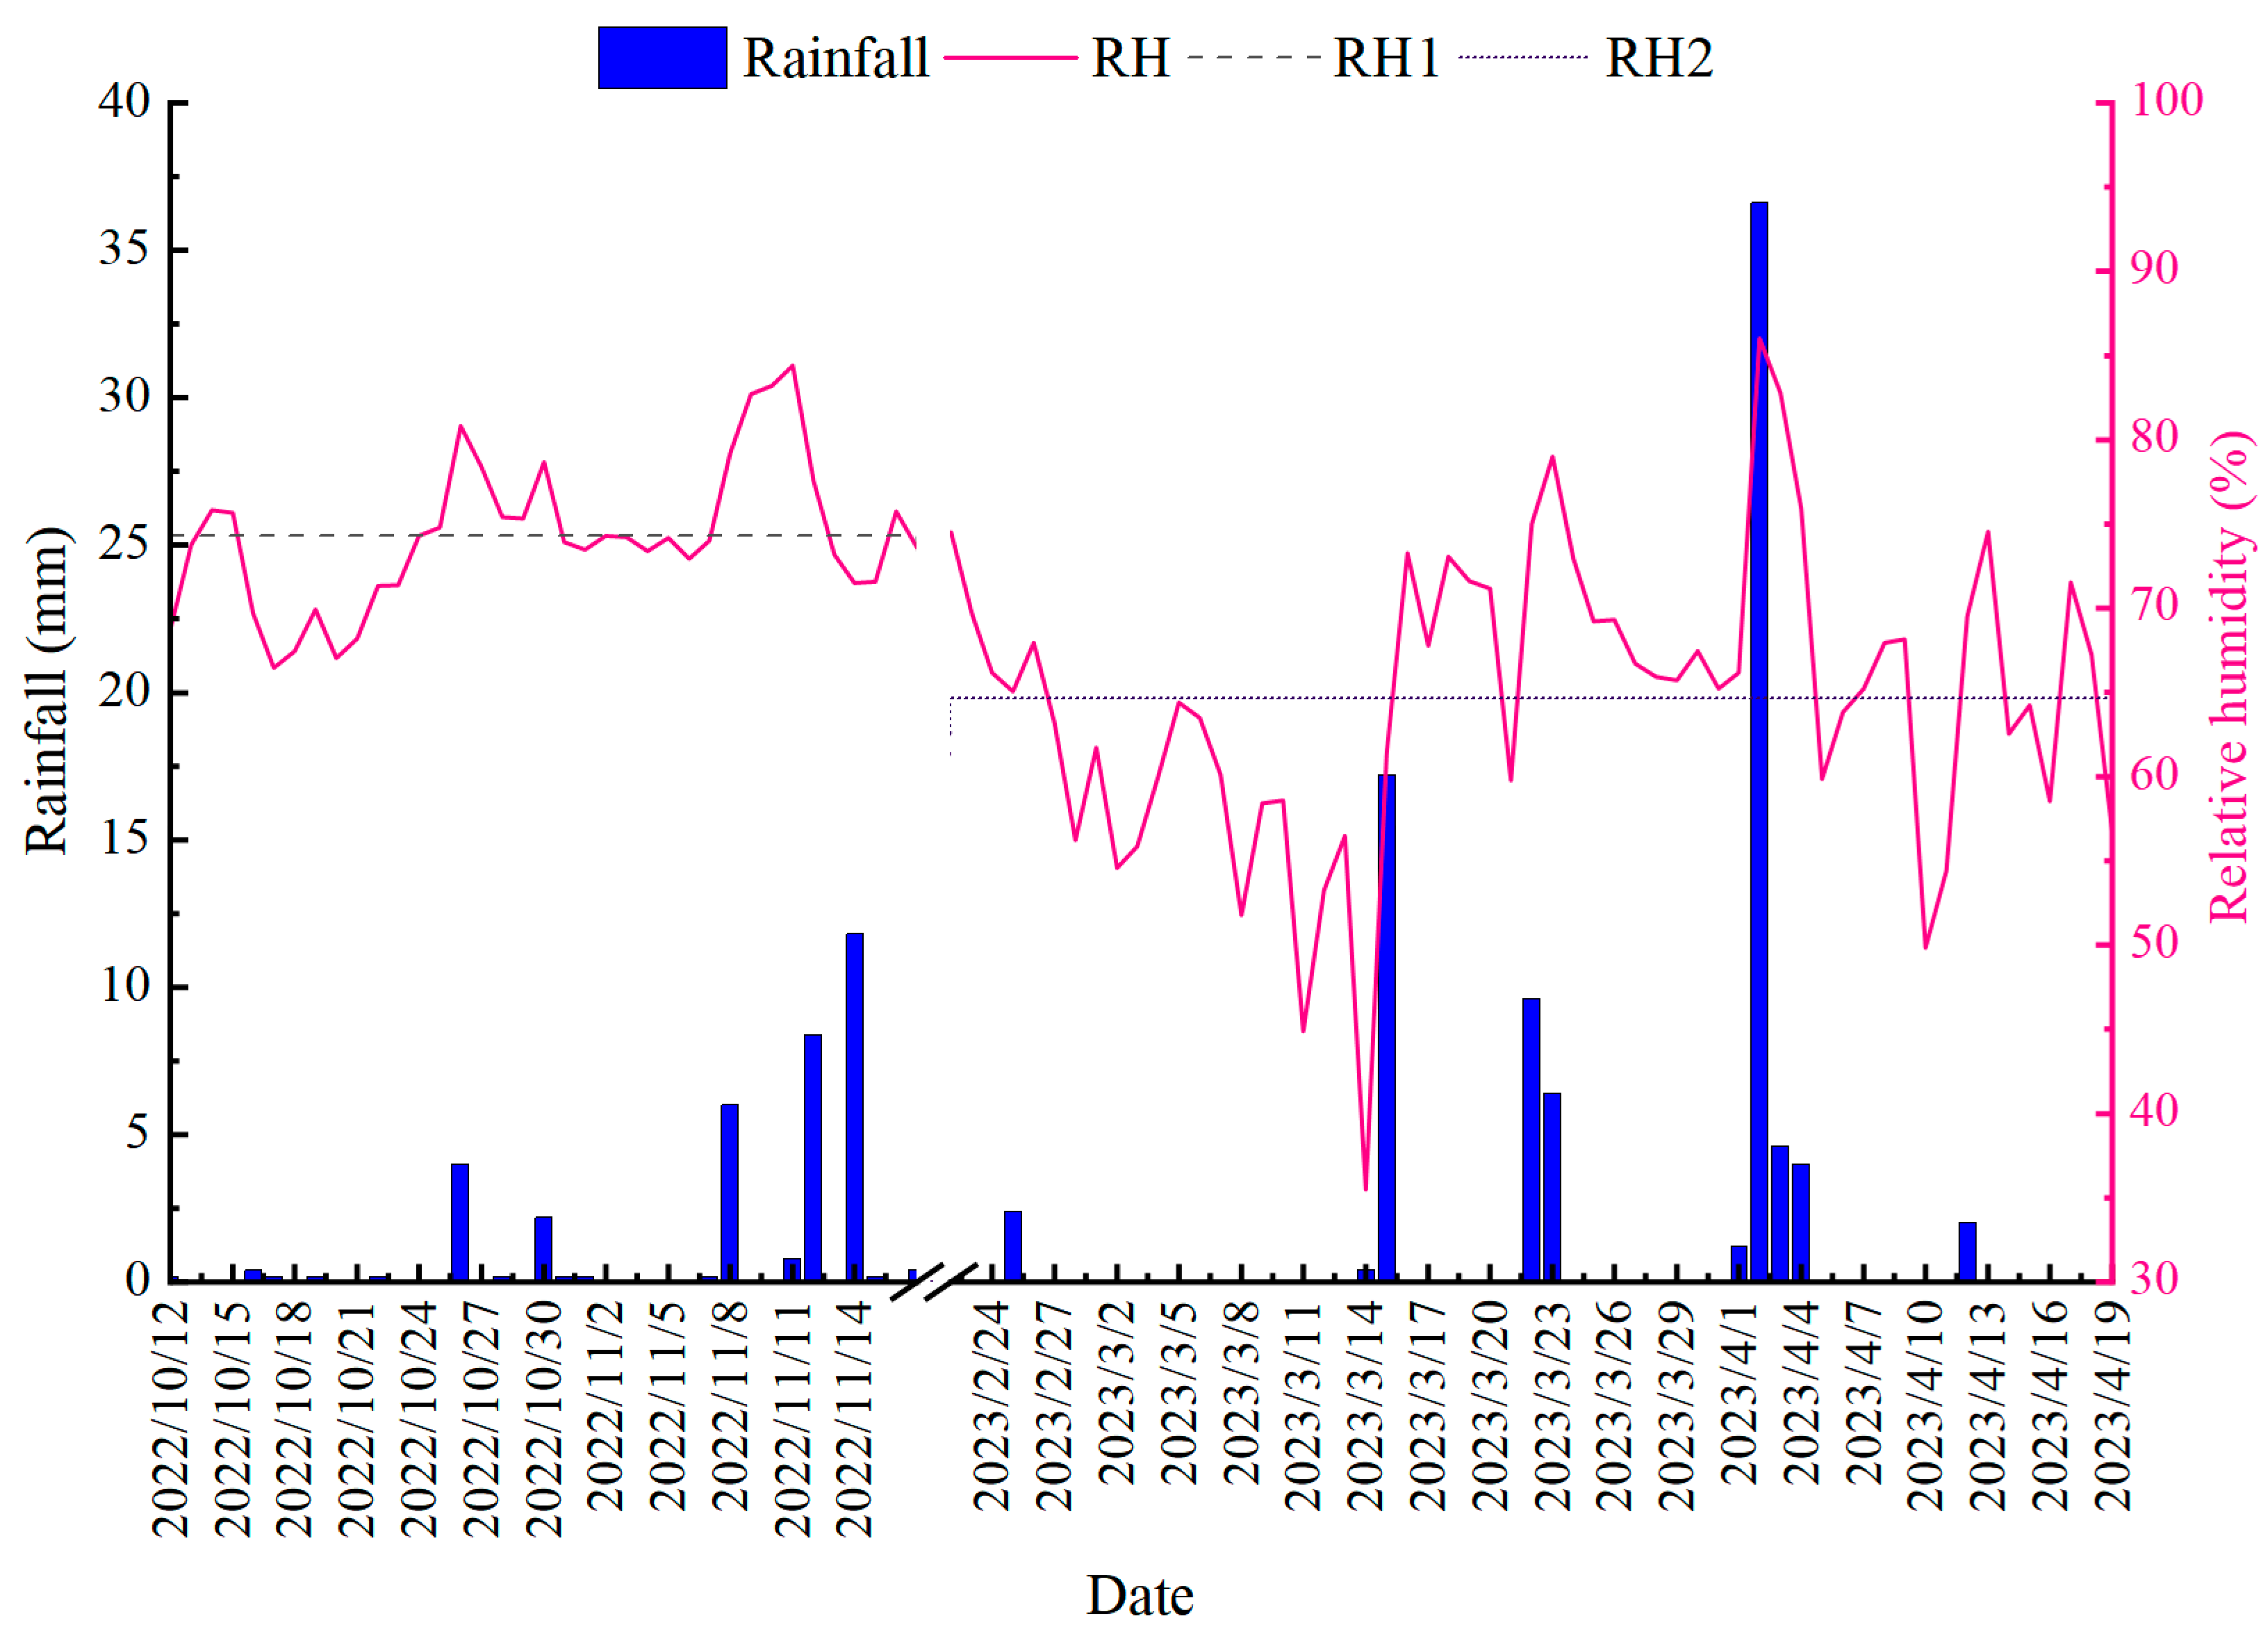
The variations in atmospheric relative humidity (RH) and rainfall during the two periods (12 October–17 November 2022 and 22 February–19 April 2023) are shown in Figure 3. There were 22 rainfall days during the monitoring period, including 19 days of light rainfall (0–10 mm/d), two days of medium rainfall (10–25 mm/d), and one day of heavy rainfall (25–50 mm/d). The total rainfall was 120.2 mm. The average daily RH during the two periods was 74.23% (RH1) and 64.58% (RH2). The maximum RH over the entire monitoring period was 86.03% (2 April 2023), and the minimum RH over the entire monitoring period was 35.47% (14 March 2023). Overall, the average RH in the first period (fall: RH1) was greater than that in the second period (spring: RH2).

Figure 3.
Variations in rainfall and atmospheric relative humidity (RH) over the monitoring period.
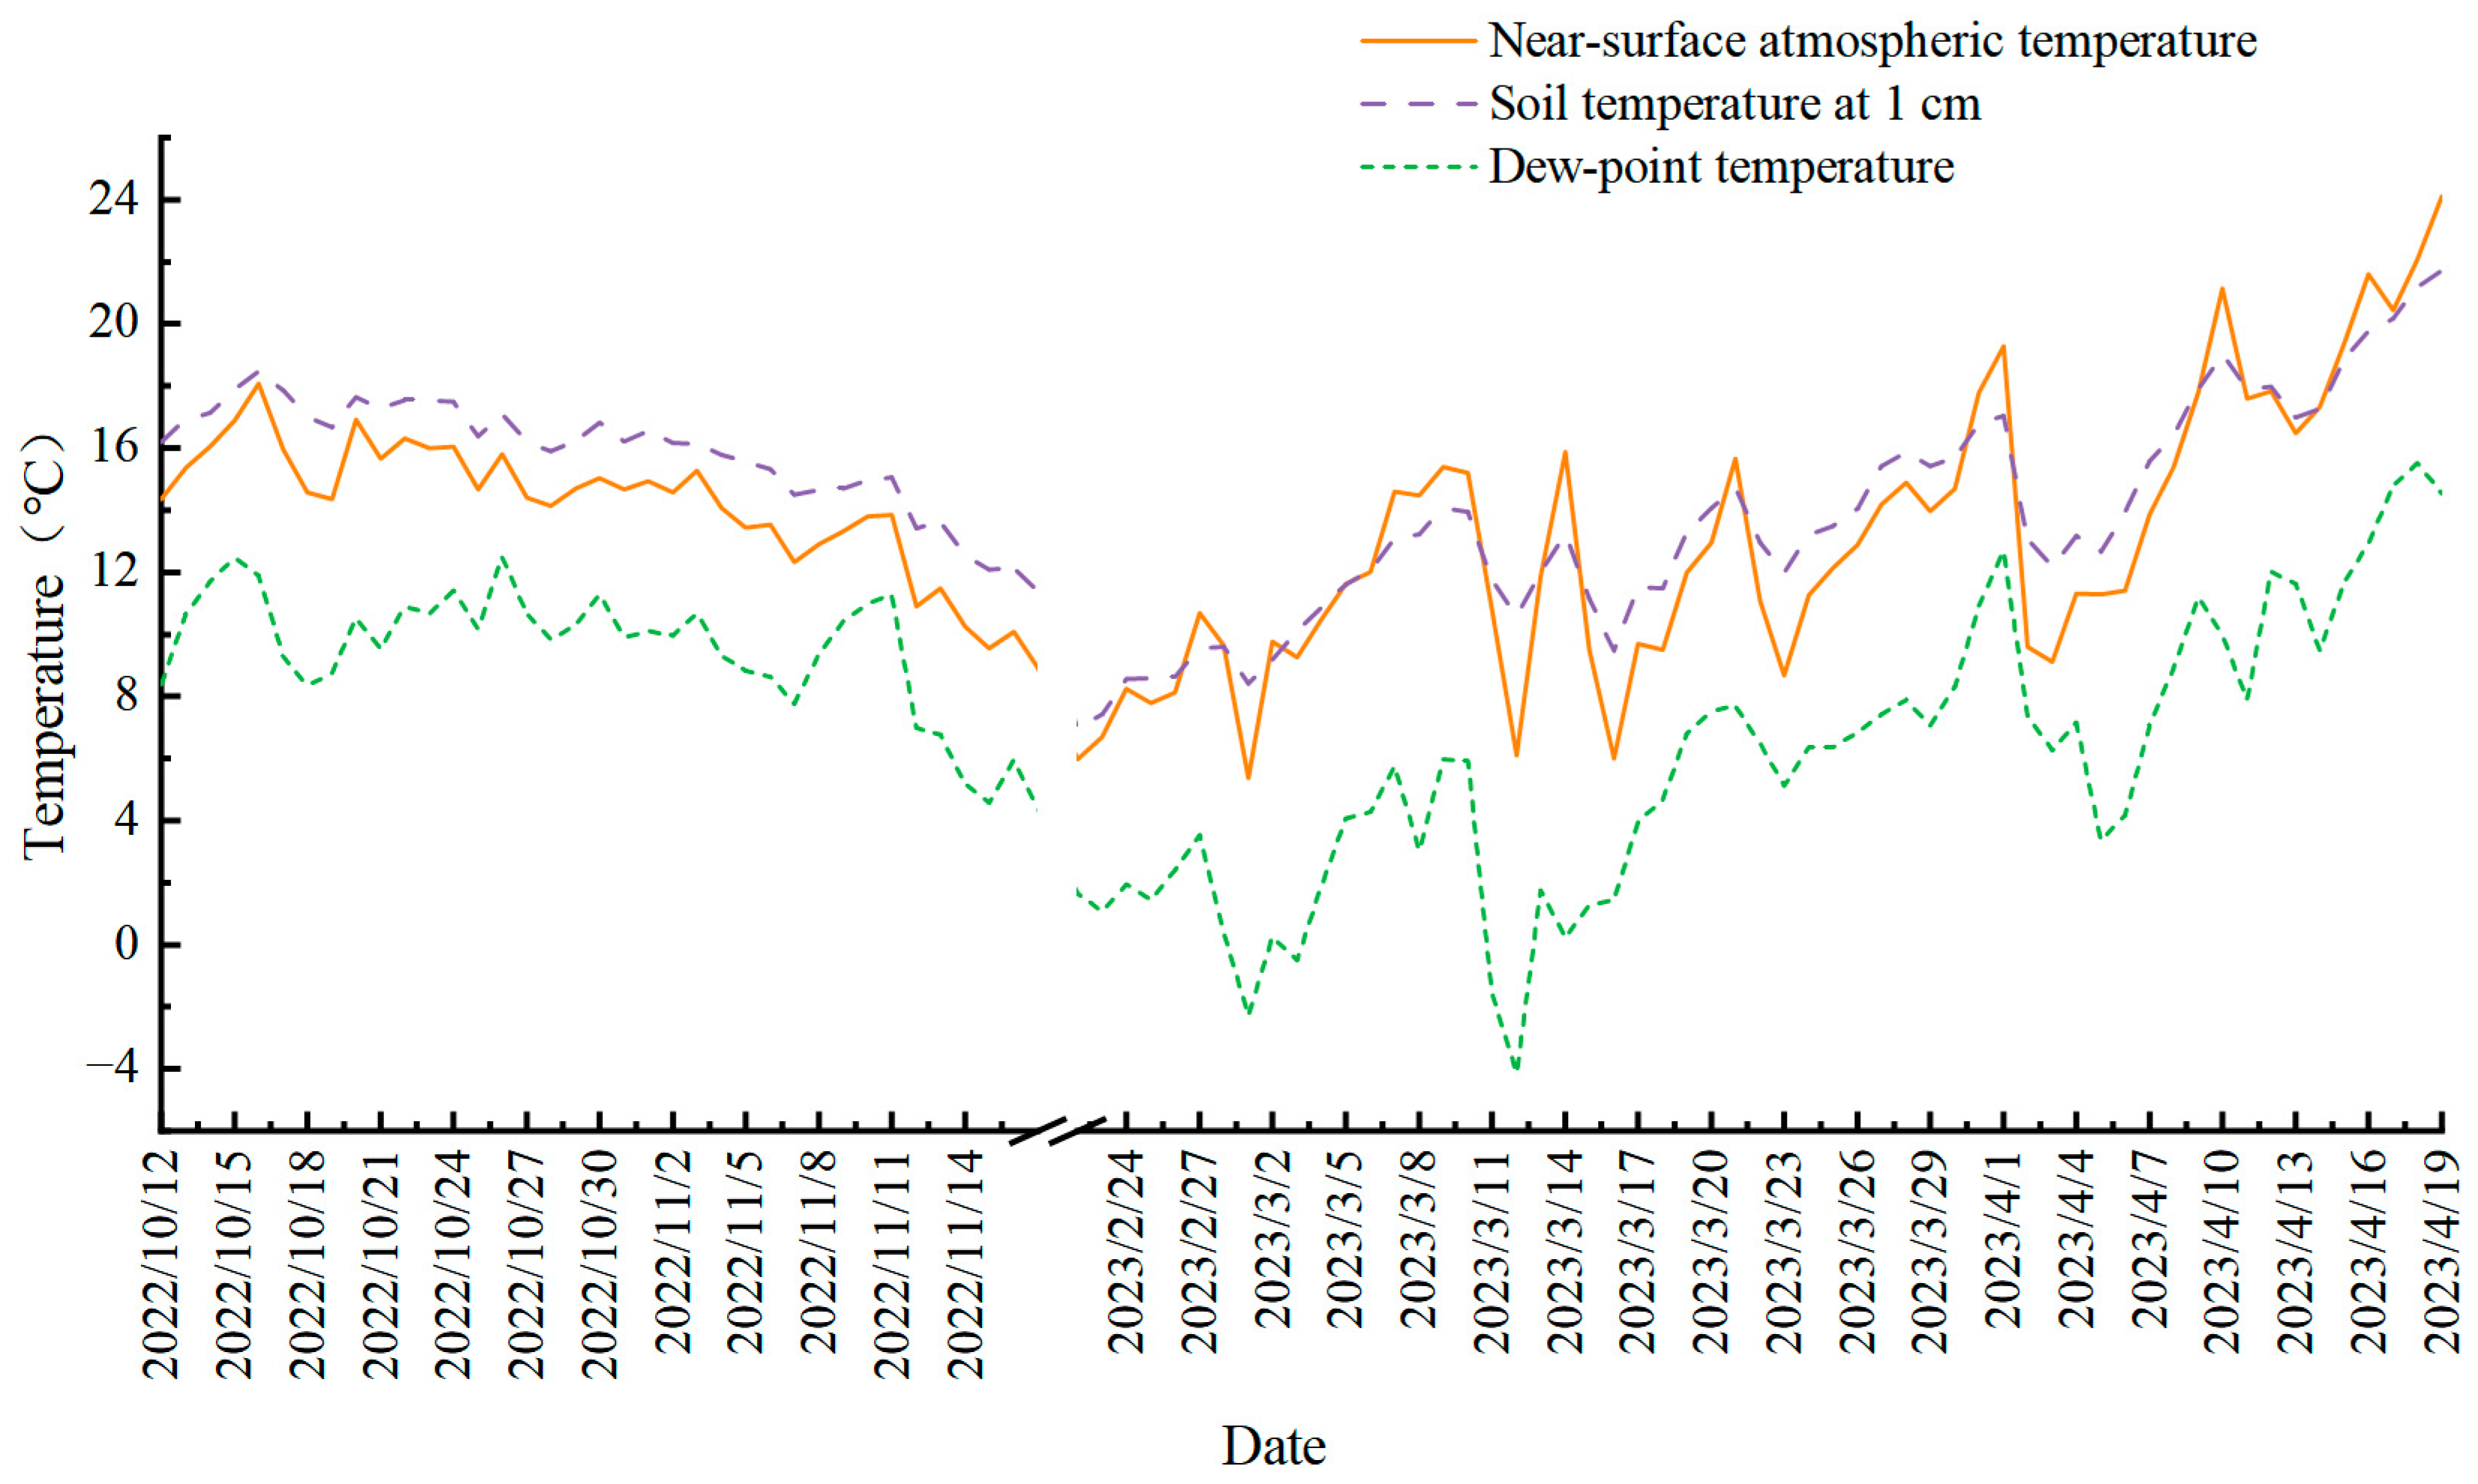
Daily air temperature, soil temperature at 1 cm below the ground, and dew point temperature showed similar trends, as shown in Figure 4. During autumn, the daily average air temperature showed an overall decreasing trend, with a mean temperature of 14.1 °C, maximum temperature of 18.1 °C (16 October), and minimum temperature of 8.9 °C (17 November). The dew point temperature remained lower than the air temperature, with a mean value of 9.6 °C, the highest temperature being 12.6 °C (15 November) and the lowest being 4.4 °C (17 November). The mean soil temperature was 15.8 °C, with the highest being 18.5 °C (16 October) and lowest being 11.4 °C (17 November). In contrast, the daily average air temperature during spring showed an overall increasing trend, with a mean value of 13.1 °C, peak value of 24.1 °C (19 April), and valley value of 5.4 °C (1 March). The mean dew point temperature was 6.4 °C, with a high temperature of 15.7 °C (18 April) and low temperature of −2.7 °C (12 March). The mean soil temperature was 13.6 °C, the peak value was 21.7 °C (19 April), and the lowest value was 6.9 °C (22 February).
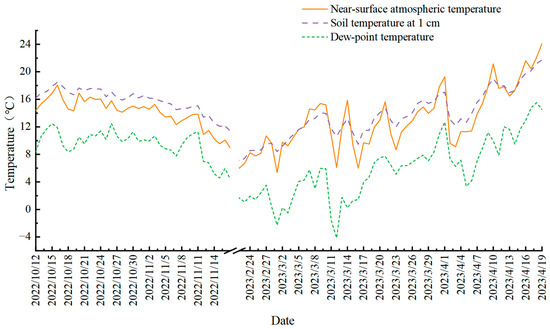
Figure 4.
Trends in near-surface—atmospheric temperature, soil temperature at 1 cm below ground, and dew point temperature during the monitoring period.
3.2. Variations in Soil Condensation Water
The daily condensation quantities in loess and sandy soil under different soil moisture content conditions during the monitoring period are shown in Figure 5. As for loess (Figure 5a), the mean daily condensation quantity under 0% moisture content conditions was 0.34 mm, with a maximum of 0.74 mm (6 April 2023) and a minimum of 0.02 mm (18 April 2023). Under 3% and 7% moisture content conditions, the mean daily condensation quantities were 0.09 mm and 0.01 mm, respectively, with a maximum of 0.61 mm and 0.82 mm (12 October 2022) and a minimum of −0.21 mm and −0.41 mm (18 April 2023), respectively. Under 11% and 15% moisture content conditions, the mean daily condensation quantities were −0.05 mm and −0.07 mm, respectively, with a maximum of 0.35 mm (13 April 2023) and 0.34 mm (13 October 2022) and a minimum of −0.49 mm and −0.57 mm (19 April 2023), respectively.
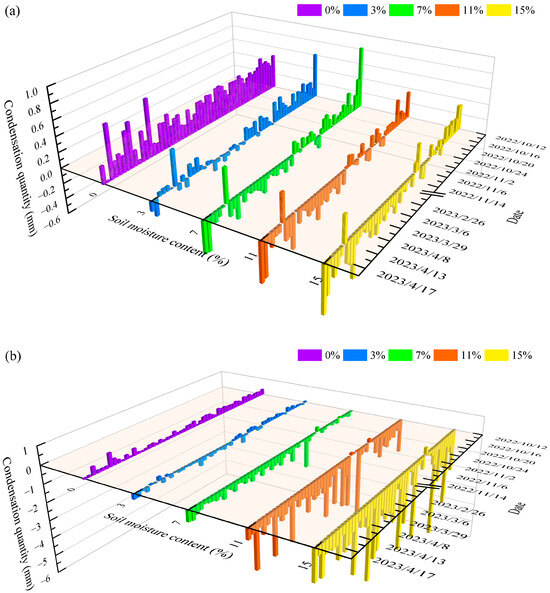
Figure 5.
Daily condensation quantities in loess (a) and sandy soil (b) under different soil moisture content conditions during the monitoring period.
As for sandy soil (Figure 5b), the mean daily condensation quantity under 0% moisture content conditions was 0.21 mm, with a maximum of 0.72 mm (13 April 2023) and a minimum of 0.04 mm (13 November 2022). Under 3% moisture content conditions, the mean daily condensation quantity was −0.02 mm, with a maximum of 0.24 mm (19 October 2022) and a minimum of −0.39 mm (25 March 2023). Under 7% and 11% moisture content conditions, the mean daily condensation quantities were −0.28 mm and −0.82 mm, respectively, with a maximum of 0.24 mm and 0.18 mm (29 October 2022) and a minimum of −1.61 mm and −4.00 mm (4 November 2022). Under 15% moisture content conditions, the mean daily condensation quantity was −1.35 mm, with a maximum of 0.35 mm (29 October 2022) and a minimum of −4.97 mm (21 October 2022).
The cumulative condensation quantities and condensation days in loess and sandy soil under different soil moisture content conditions during the monitoring period are shown in Figure 6. The cumulative condensation quantities in loess and sandy soil vary significantly under different soil moisture content conditions. Throughout the entire observation period, the total condensation quantities in loess decreased under 0%, 3%, 7%, 11%, and 15% moisture content conditions, with the quantities being 18.26 mm, 4.90 mm, 0.46 mm, −2.71 mm, and −3.67 mm, respectively. The corresponding numbers of condensation days for these moisture content conditions were 54, 40, 24, 21, and 16, respectively. For sandy soil, the total quantity of condensation water decreased under 0%, 3%, 7%, 11%, and 15% moisture content conditions, with the quantities being 11.59 mm, −1.27 mm, −14.86 mm, −44.19 mm, and −72.75 mm, respectively. The corresponding numbers of condensation days for these moisture content conditions were 54, 24, 2, 3, and 1, respectively.
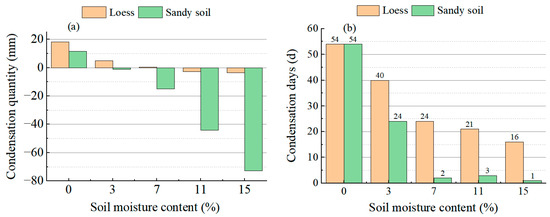
Figure 6.
Condensation quantity (a) and condensation days (b) for loess and sandy soil.
Comparing the cumulative condensation quantity and condensation days in loess and sandy soil shown in Figure 6, it is found that under the same water content conditions, not only the condensation quantity of loess is larger than that of sandy soil but the condensation days of loess are also many more than those of sandy soil. As shown in Figure 6a, the condensation quantity of loess and sandy soil is negative when the soil water content is greater than 7%. It means that evaporation plays a leading role in soil water content greater than 7%. As shown in Figure 6b, when soil moisture content increased from 0% to 3%, the number of condensation days for loess decreased from 54 to 40, a change rate of 26%, and for sandy soil, it decreased from 54 to 24 days, a change rate of 56%. When soil moisture content increased from 3% to 7%, the number of condensation days for loess decreased from 40 to 24, a change rate of 40%, and for sandy soil, it decreased from 24 to 2 days, a change rate of 92%. When soil moisture content is greater than 7%, the number of condensation days for loess show a slow decreasing trend, while those for sandy soil are very small and show no obvious change. On the whole, when soil moisture content is greater than 7%, evaporation occurs on most observation days. Condensation is more likely to occur when the soil moisture content is less than 7%.
The cumulative soil condensation quantity and number of condensation days for loess were greater than those for sandy soil under the same soil moisture conditions. Previous studies have shown that the mechanical composition of soils, such as particle size, plays a role in determining the quantity of condensation water. The smaller the soil particle size, the greater the quantity of condensation water [69,70,71,72]. Loess has a much smaller average particle size than sandy soil. Smaller particle sizes result in larger capillary rise heights and high water storage capacities between pores. Furthermore, because of its smaller particle size, loess has a larger specific surface area for water than sandy soil, resulting in a greater water adsorption capacity [37,73,74,75,76].
3.3. Correlation of Soil Condensation Water in Loess and Sandy Soil
In order to analyze whether the characteristics of soil condensation water in soil with different levels of soil moisture content are consistent, the correlation of condensation water under different soil moisture content conditions was determined using the Pearson correlation coefficient method. The results are shown in Table 2. The two adjacent treatments showed the strongest correlations. The correlation between soil condensation quantities in loess under different soil moisture content conditions was significant; the highest correlation coefficient was observed between 3% and 7% moisture content conditions, with a correlation coefficient of 0.895. For sandy soil under different soil moisture content conditions, the correlation between 0% and 11% or 15% moisture content was insignificant. The correlation between 3% and 15% moisture content was not significant, whereas the relationships among the other moisture content conditions were significant. The highest correlation was observed between the 11% and 15% moisture content, with a correlation coefficient of 0.691. According to Table 2, there is a strong correlation between adjacent soil water content groups. Next, we can analyze the average amount of condensation in loess and sandy soil under different soil water content conditions.
Table 2.
Correlation of condensation quantity in loess and sandy soil with different levels of soil moisture content.
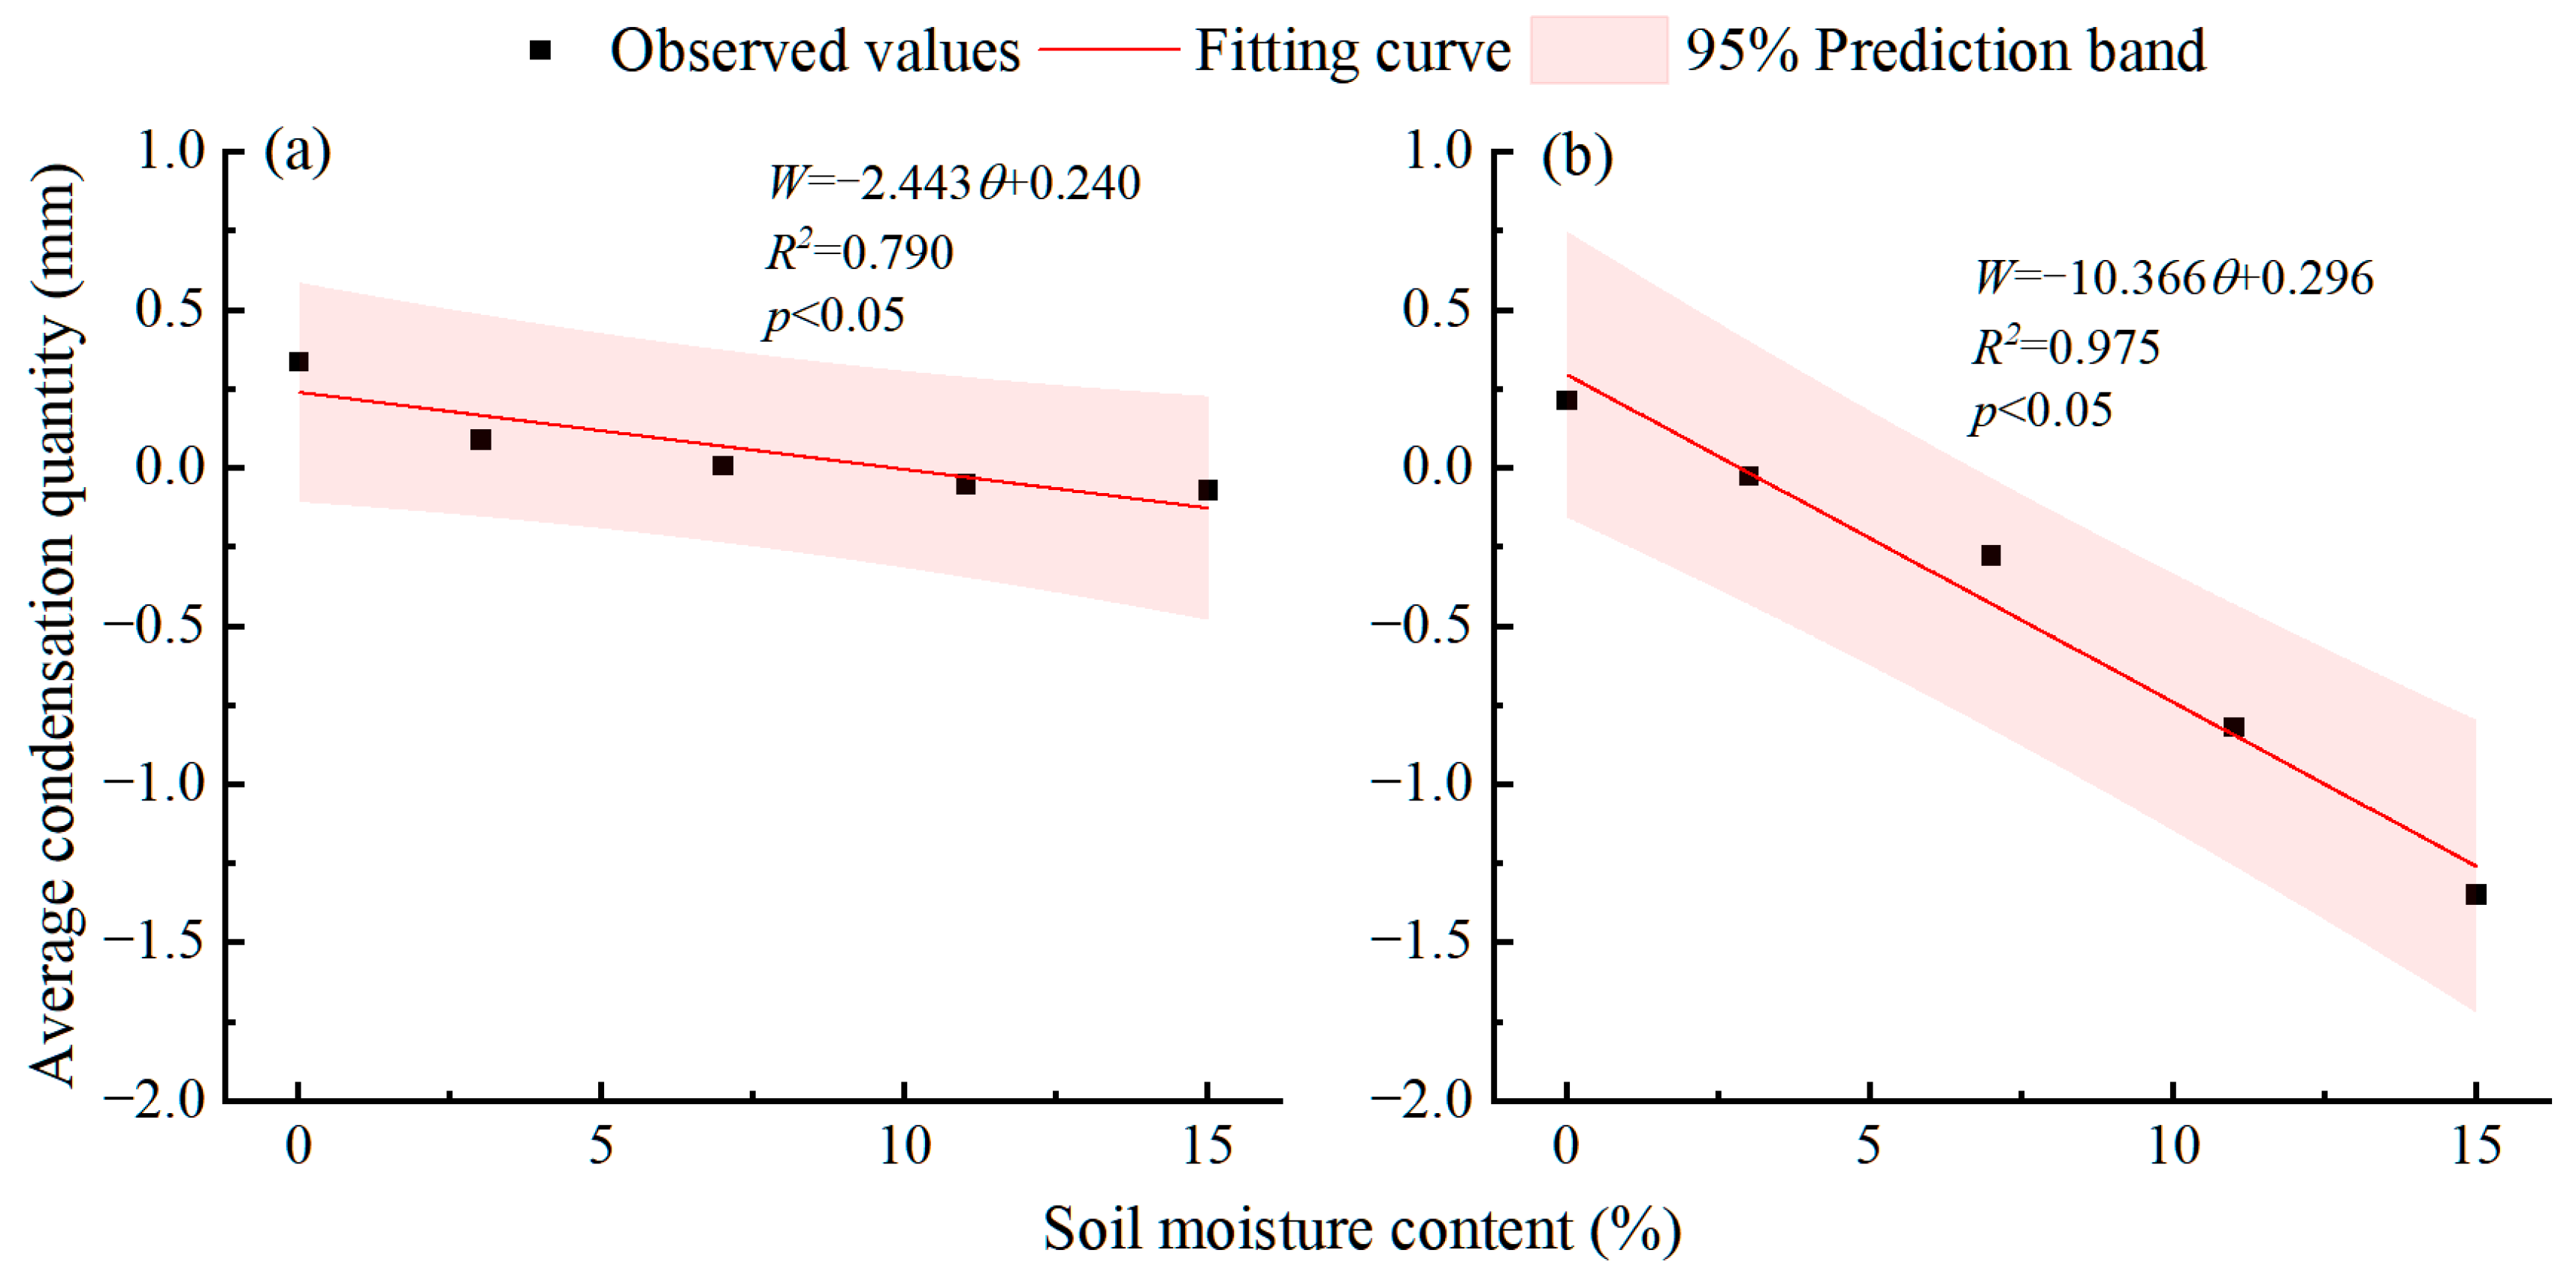
The soil moisture content and average condensation quantity with each treatment of loess and sandy soil are shown in Figure 7. The average soil condensation quantity in both loess and sandy soil showed a significant negative correlation with soil moisture content (loess: W = −2.443θ + 0.240, R2 = 0.790, p < 0.05; sandy soil: W = −10.366θ + 0.296, R2 = 0.975, p < 0.05). The higher the soil moisture content, the smaller the quantity of condensation water. When the moisture content was at least 7%, the soil appeared to evaporate on most of the observed days. These results indicate that a lower soil moisture content is more favorable for an increase in the quantity of soil condensation water. This is because the higher the soil moisture content, the larger the soil matrix potential, and a higher soil matrix potential is more conducive to evaporation [77,78].

Figure 7.
Correlation between condensation water and soil moisture content in (a) loess and (b) sandy soil.
3.4. Influencing Factors
High soil moisture content may impede soil adsorption and condensation [79]. Both loess and sandy soil only exhibited noticeable condensation of water under 0% and 3% moisture content conditions. Therefore, the following analysis primarily focuses on factors impacting condensation water at 0% and 3% moisture content.
3.4.1. Atmospheric Relative Humidity
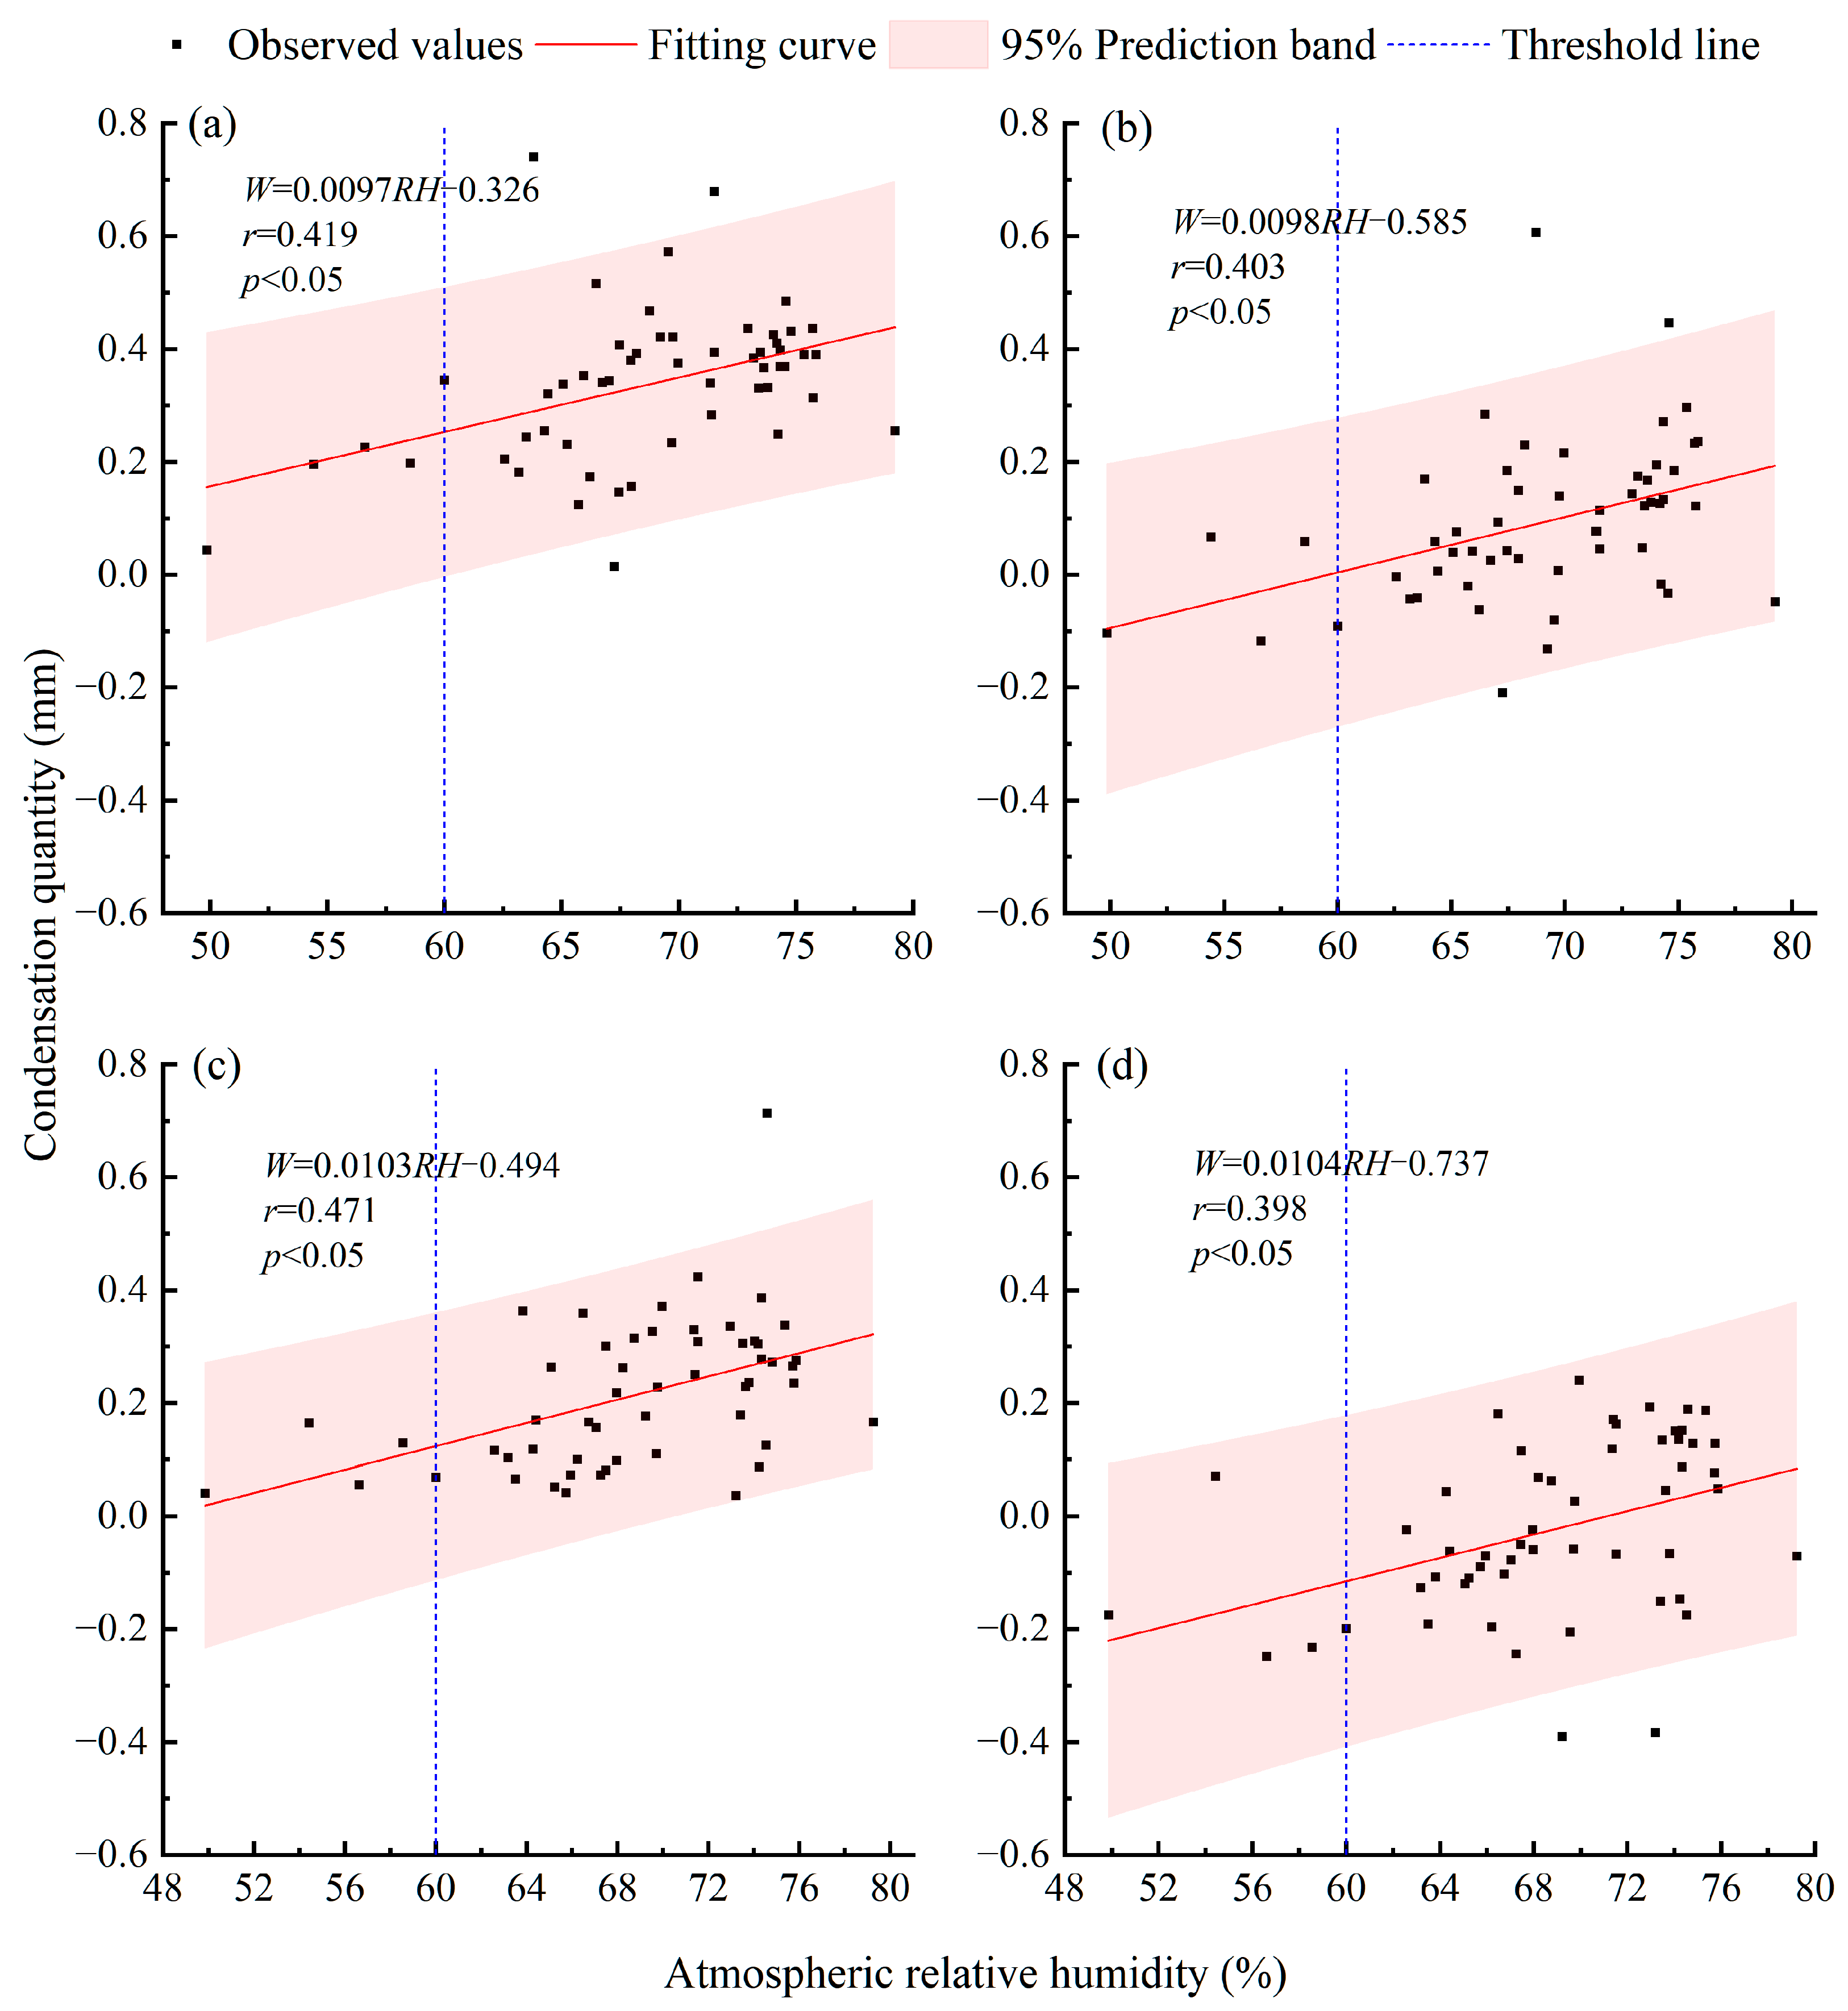
The soil condensation quantity and atmospheric relative humidity (RH) at 0% and 3% moisture content in loess and sandy soil are shown in Figure 8. There was a significant positive correlation (p < 0.05) between soil condensation water and RH in both soils under 0% and 3% moisture content conditions. For the same soil moisture content, the slope of the regression equation for sandy soil was greater than that for loess, indicating that the response of sand condensation to RH was more pronounced. For a soil, the correlation coefficient with 0% soil water content was greater than that with 3% soil water content, indicating that the response of low soil water content to RH was more pronounced. In either soil type, the soil condensation quantity increased significantly with an increase in RH under conditions of 0% or 3% moisture content. The atmospheric temperature provides the driving force for condensation and is a crucial factor in dew formation, whereas the RH serves as a necessary source of water vapor for condensation [80,81]. Monteith indicated that soil condensation occurs when the temperature of the condensation surface is lower than the dew point temperature, and that condensation does not necessarily require an RH of 100% [82]. In this study, soil condensation water formed primarily when the RH exceeded 60%. When the air contains more moisture, formation of soil condensation water is promoted. Castillo et al. [22] indicated that the condensation rate on soil surfaces significantly increased with increasing RH within the range of 30% to 80%. This trend aligns with the findings of this study regarding the relationship between soil condensation quantity and RH. In addition, an increase in RH results in more water vapor, which can supply more water for condensation.
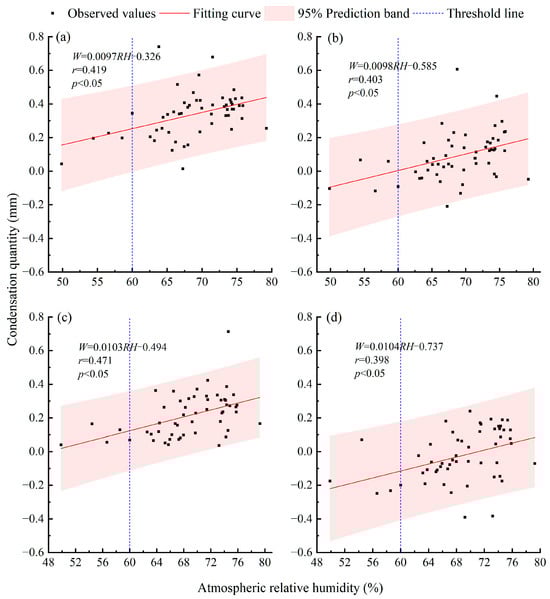
Figure 8.
The relationship between daily soil condensation quantity and RH at 0% and 3% moisture content in loess and sandy soil: (a) loess at 0% moisture content; (b) loess at 3% moisture content; (c) sandy soil at 0% moisture content; and (d) sandy soil at 3% moisture content.
3.4.2. Differences between Air Temperature and Dew Point Temperature
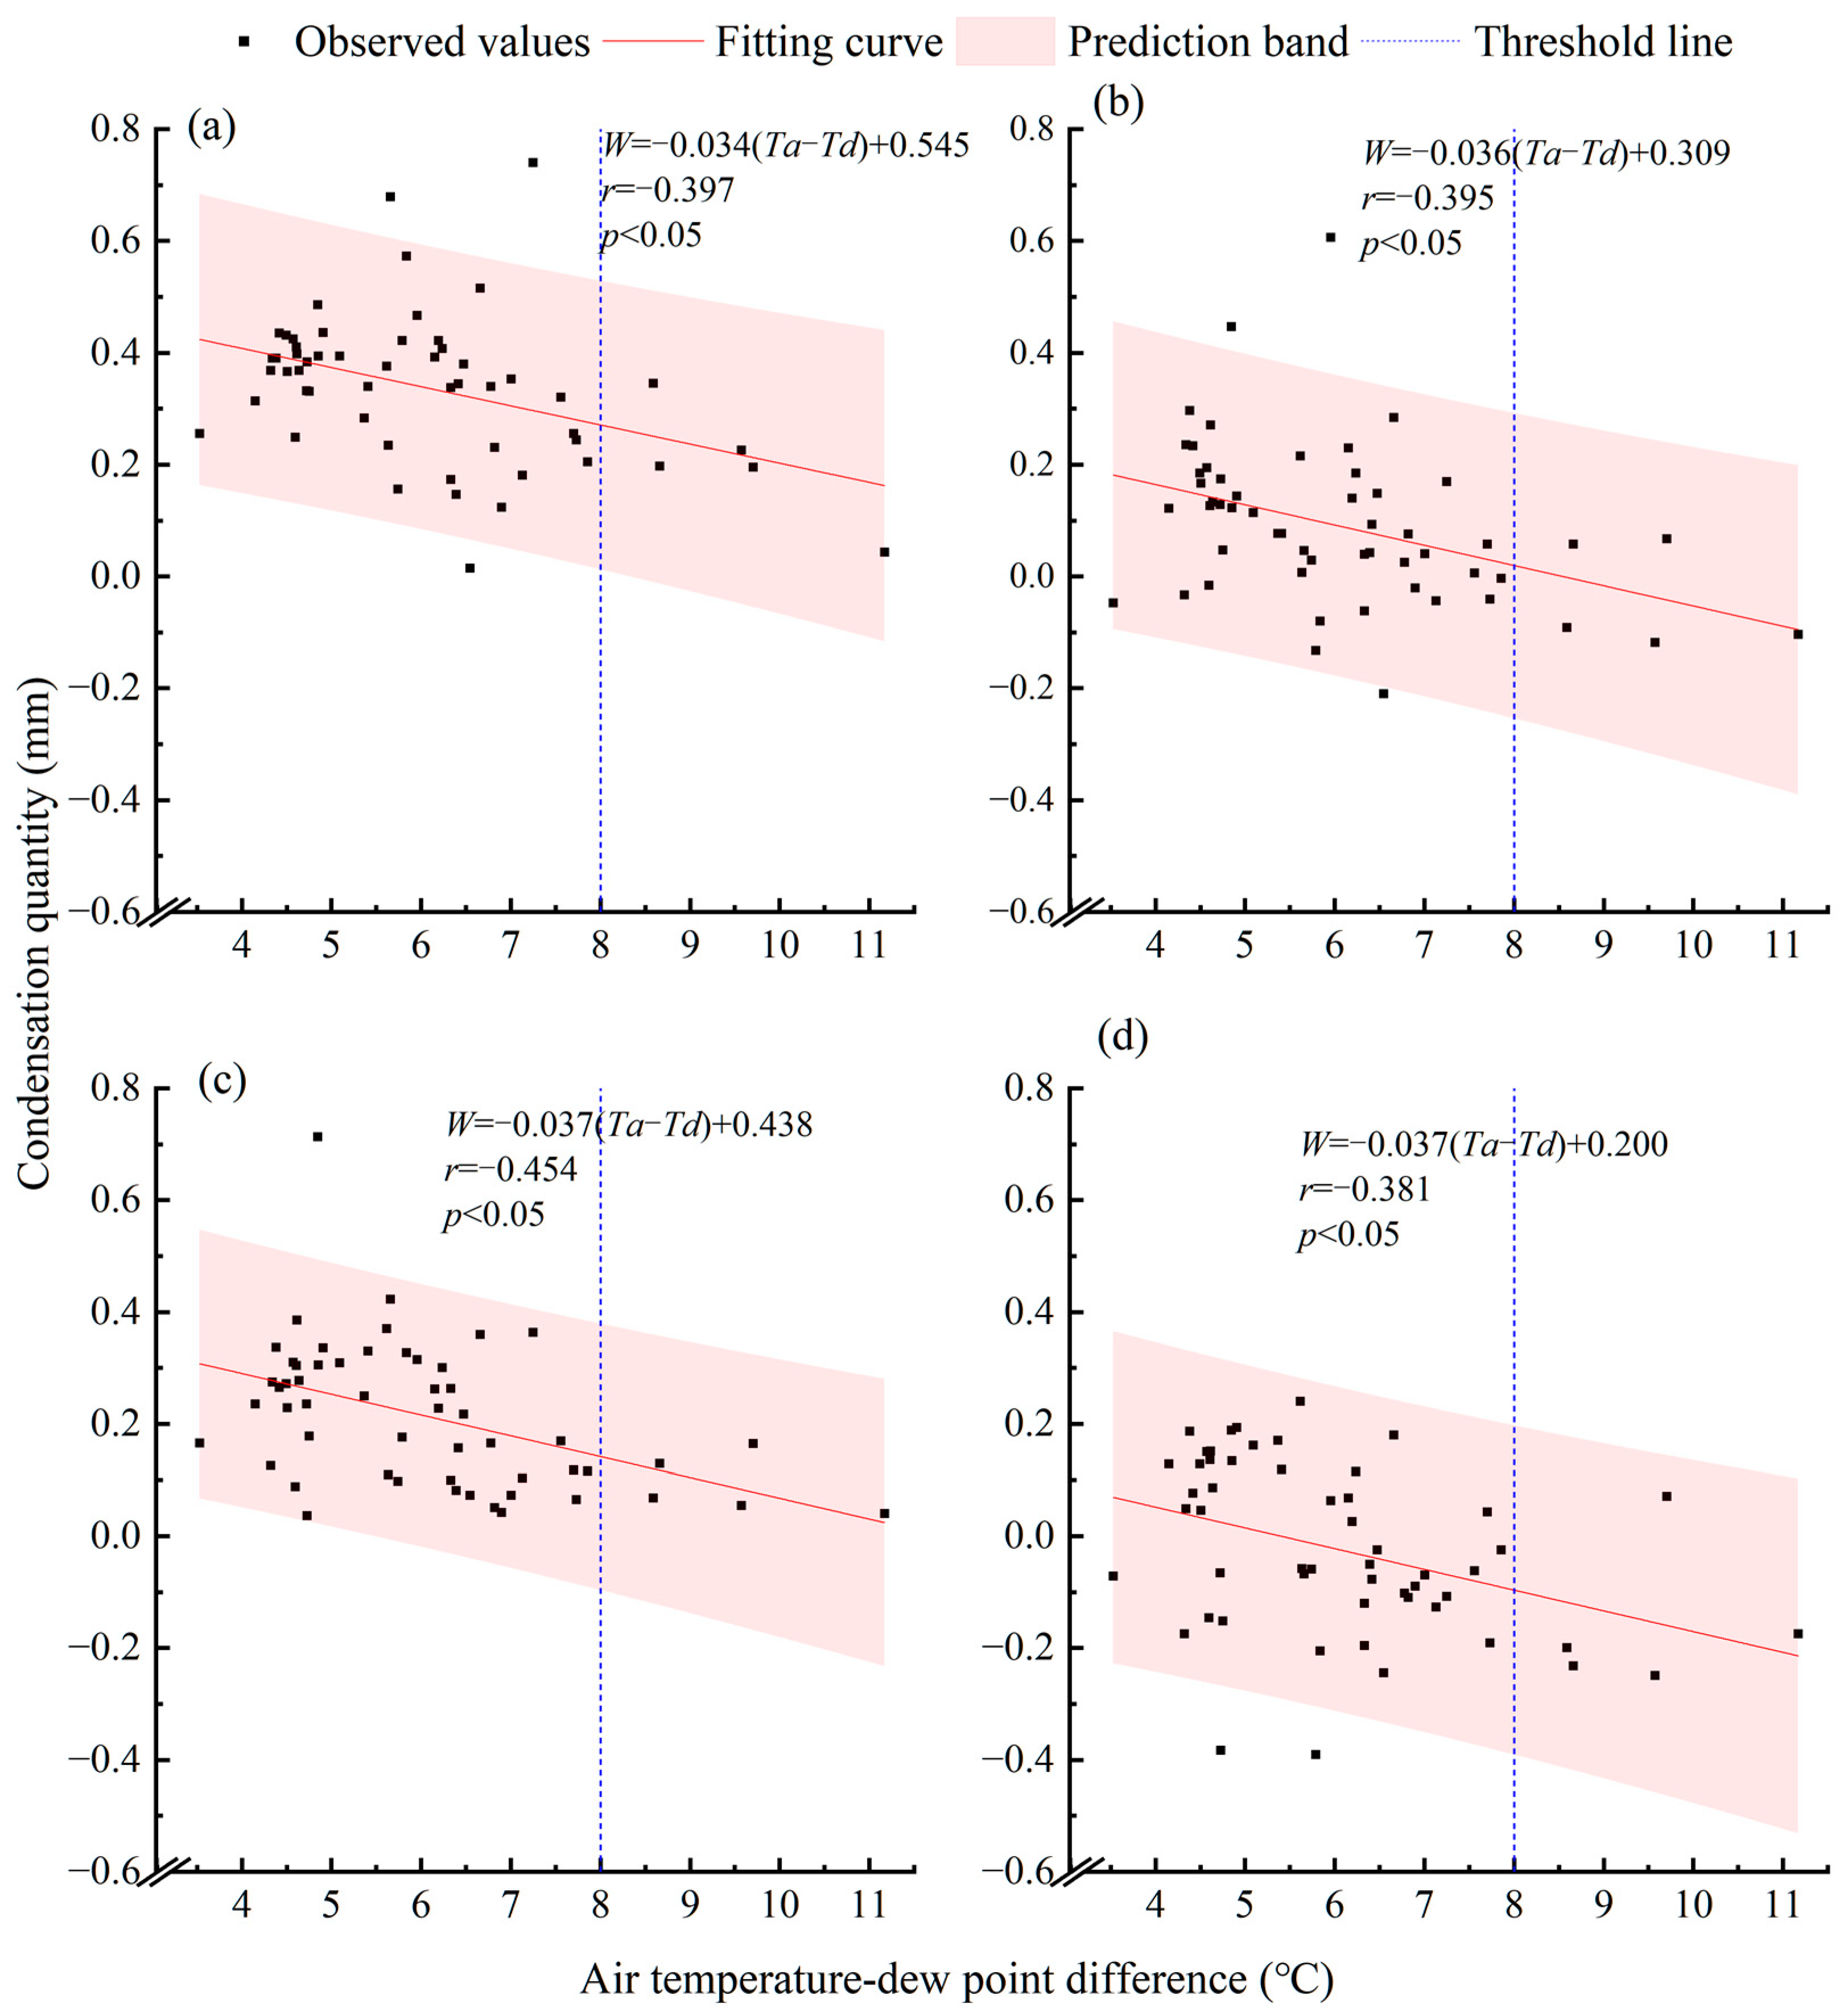
The soil condensation quantities and differences between air temperature (Ta) and dew point temperature (Td) at 0% and 3% moisture content in loess and sandy soil are shown in Figure 9. There was a negative correlation between soil condensation water and air temperature–dew point temperature differences (p < 0.05).
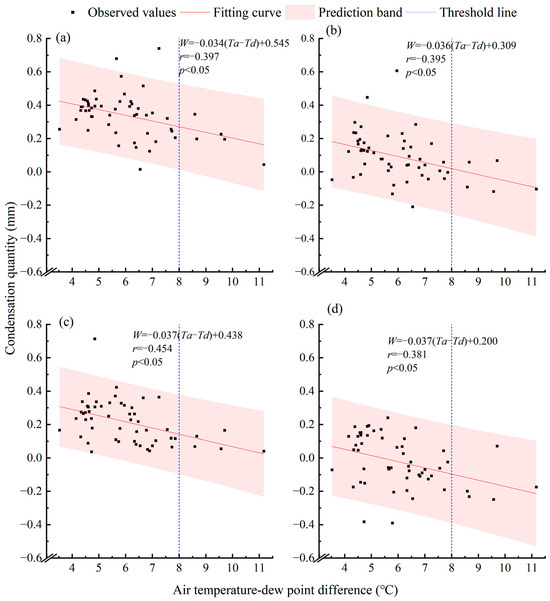
Figure 9.
The relationship between soil condensation quantity and air temperature–dew point differences at 0% and 3% moisture content in loess and sandy soil: (a) loess at 0% moisture content; (b) loess at 3% moisture content; (c) sandy soil at 0% moisture content; and (d) sandy soil at 3% moisture content.
For the same soil moisture content, the absolute value of the slope of the regression equation for sandy soil was greater than that for loess, indicating that the response of sand condensation to the differences between air temperature (Ta) and dew point temperature (Td) was more pronounced. For a soil, the correlation coefficient with 0% soil water content was less than that with 3% soil water content, indicating that the response of low soil water content to the differences between air temperature (Ta) and dew point temperature (Td) was more pronounced. Soils with 0% moisture content in Figure 9a,c show higher intercepts than that in Figure 9b,d, respectively, which indicates greater condensation for soils with low moisture content at the same air temperature–dew point difference.
With a constant soil moisture content, a smaller air temperature–dew point difference (Ta-Td) led to a greater quantity of soil condensation water in both soils, especially when Ta-Td was less than 8 °C. As the air temperature–dew point difference exceeded 8 °C, the frequency of soil condensation water generation decreased gradually. This finding is consistent with those of other researchers [23,83,84,85]. In either soil type, the degree of correlation between soil condensation water and Ta-Td at 0% moisture content was greater than that at 3% moisture content, indicating that the lower the soil moisture content, the stronger the influence of the air temperature–dew point difference on the soil condensation quantity. Previous studies have shown that water condensation mainly occurs when the temperature dew point difference is less than 0 [15,86,87]. During the observation period, the surface temperature remained consistently higher than the dew point temperature, similar to what has been observed in previous studies [88]. Previous research [89,90] has suggested that, in such cases, it is not condensation that occurs; rather, it is soil adsorption.
4. Conclusions
The soil condensation volumes of loess and sandy soil were measured under different gravimetric moisture content conditions in the autumn of 2022 and spring of 2023 using hand-made micro-lysimeters and the weighing method at the groundwater and environmental sites of Chang’an University, Guanzhong Basin, China. The following conclusions can be drawn:
- (i)
- Under the same soil moisture conditions, the amount of condensation and the number of days of condensation for loess are greater than those for sand because loess pores, which are smaller than sand pores, have a larger specific surface area, resulting in a higher adsorption capacity for water.
- (ii)
- The average soil condensation quantity (W) in loess and sandy soil showed a significant negative correlation with the gravimetric moisture content (θ). For loess, the regression model can be described as follows: W = −2.443θ + 0.240 (R2 = 0.790, p < 0.05); and for sandy soil, the regression model can be described as follows: W = −10.366θ + 0.296 (R2 = 0.975, p < 0.05).
- (iii)
- Soil condensation water quantities were positively correlated with RH and negatively correlated with air temperature–dew point differences. Soil condensation predominantly occurs under conditions with an RH above 60% and air temperature–dew point differences less than 8 °C.
Author Contributions
Conceptualization, Z.J. and C.J.; methodology, C.J., Z.J. and G.L.; software, C.J. and G.L.; validation, C.J., Z.J., G.L., L.Z. and Y.R.; investigation, C.J., G.L., L.Z. and Y.R.; writing—original draft preparation, C.J. and Z.J.; writing—review and editing, C.J., Z.J., G.L., L.Z. and Y.R. All authors have read and agreed to the published version of the manuscript.
Funding
This work was supported by the Fundamental Research Funds for the Central Universities, CHD (300102293209), the National Natural Science Foundation of China (42001033), and the Natural Science Basic Research Plan in the Shaanxi Province of China (2021JQ-237).
Data Availability Statement
The original contributions presented in the study are included in the article material. Further inquiries can be directed to the corresponding author.
Conflicts of Interest
Author Yuze Ren was employed by the company China Certification & Inspection Northwest Ecological Technology (Shaanxi) Co., Ltd. The remaining authors declare that the research was conducted in the absence of any commercial or financial relationships that could be construed as a potential conflict of interest.
References
- Uclés, O.; Villagarcía, L.; Cantón, Y.; Domingo, F. Partitioning of non rainfall water input regulated by soil cover type. Catena 2016, 139, 265–270. [Google Scholar] [CrossRef]
- Florentin, A.; Agam, N. Estimating non-rainfall-water-inputs-derived latent heat flux with turbulence-based methods. Agric. For. Meteorol. 2017, 247, 533–540. [Google Scholar] [CrossRef]
- Gutterman, Y.; Shem-Tov, S. Mucilaginous seed coat structure ofCarrichtera annuaandAnastatica hierochunticafrom the Negev Desert highlands of Israel, and its adhesion to the soil crust. J. Arid Environ. 1997, 35, 695–705. [Google Scholar] [CrossRef]
- Jacobs, A.F.G.; Heusinkveld, B.G.; Berkowicz, S.M. Dew deposition and drying in a desert system: A simple simulation model. J. Arid Environ. 1999, 42, 211–222. [Google Scholar] [CrossRef]
- Hughes, R.N.; Brimblecombe, P. Dew and guttation: Formation and environmental significance. Agric. For. Meteorol. 1994, 67, 173–190. [Google Scholar] [CrossRef]
- Wang, L.; Kaseke, K.F.; Seely, M.K. Effects of non-rainfall water inputs on ecosystem functions. Wiley Interdiscip. Rev.-Water. 2017, 4, e1179. [Google Scholar] [CrossRef]
- Pan, Y.X.; Wang, X.P.; Zhang, Y.F.; Hu, R. Dew formation characteristics at annual and daily scale in xerophyte shrub plantations at Southeast margin of Tengger desert, Northern China. Ecohydrology 2018, 11, e1968. [Google Scholar]
- Aguirre-Gutiérrez, C.A.; Holwerda, F.; Goldsmith, G.R.; Delgado, J.; Yepez, E.; Carbajal, N.; Escoto-Rodríguez, M.; Arredondo, J.T. The importance of dew in the water balance of a continental semiarid grassland. J. Arid Environ. 2019, 168, 26–35. [Google Scholar] [CrossRef]
- Kidron, G.J. Altitude dependent dew and fog in the Negev Desert, Israel. Agric. For. Meteorol. 1999, 96, 1–8. [Google Scholar] [CrossRef]
- Jabro, J.D. Water Vapor Diffusion Through Soil as Affected by Temperature and Aggregate Size. Transp. Porous Media 2009, 77, 417–428. [Google Scholar] [CrossRef]
- Arthur, E.; Tuller, M.; Moldrup, P.; de Jonge, L.W. Effects of biochar and manure amendments on water vapor sorption in a sandy loam soil. Geoderma 2015, 243–244, 175–182. [Google Scholar] [CrossRef]
- Arthur, E.; Tuller, M.; Moldrup, P.; Greve, M.H.; Knadel, M.; de Jonge, L.W. Applicability of the Guggenheim-Anderson-Boer water vapour sorption model for estimation of soil specific surface area. Eur. J. Soil Sci. 2018, 69, 245–255. [Google Scholar] [CrossRef]
- Shang, S.; Horne, R.N.; Ramey, H.J., Jr. Measurement of Surface Area and Water Adsorption Capacity of the Geysers Rocks; Petroleum Engineering Department, Stanford University: Stanford, CA, USA, 1994. [Google Scholar]
- Kidron, G.J.; Starinsky, A. Measurements and ecological implications of non-rainfall water in desert ecosystems—A review. Ecohydrology 2019, 12, e2121. [Google Scholar] [CrossRef]
- Jia, Z.F.; Zhao, Z.Q.; Zhang, Q.Y.; Wu, W.C. Dew Yield and Its Influencing Factors at the Western Edge of Gurbantunggut Desert, China. Water 2019, 11, 733. [Google Scholar] [CrossRef]
- Hao, X.; Li, C.; Guo, B.; Ma, J.; Ayup, M.; Chen, Z. Dew formation and its long-term trend in a desert riparian forest ecosystem on the eastern edge of the Taklimakan Desert in China. J. Hydrol. 2012, 472–473, 90–98. [Google Scholar] [CrossRef]
- Wang, H.; Zhang, J.; Cao, Y.; Wang, H.; Liu, X.; Sun, X.; Sun, K.; Li, Y.; Pei, Z. Surface Condensation Water under Salix psammophila Is the Main Water Source in Addition to Rainfall in the Kubuqi Desert. Water 2023, 15, 3098. [Google Scholar] [CrossRef]
- Kalthoff, N.; Fiebig-Wittmaack, M.; Meißner, C.; Kohler, M.; Uriarte, M.; Bischoff-Gauß, I.; Gonzales, E. The energy balance, evapo-transpiration and nocturnal dew deposition of an arid valley in the Andes. J. Arid Environ. 2006, 65, 420–443. [Google Scholar] [CrossRef]
- Moro, M.J.; Were, A.; Villagarcía, L.; Cantón, Y.; Domingo, F. Dew measurement by Eddy covariance and wetness sensor in a semiarid ecosystem of SE Spain. J. Hydrol. 2007, 335, 295–302. [Google Scholar] [CrossRef]
- Baier, W. Studies on dew formation under semi-arid conditions. Agric. For. Meteorol. 1966, 3, 103–112. [Google Scholar] [CrossRef]
- Chen, L.; Meissner, R.; Zhang, Y.Q.; Xiao, H.J. Studies on dew formation and its meteorological factors. J. Food Agric. Environ. 2013, 11, 1063–1068. [Google Scholar]
- Castillo, J.E.; Weibel, J.A.; Garimella, S.V. The effect of relative humidity on dropwise condensation dynamics. Int. J. Heat. Mass. Transf. 2015, 80, 759–766. [Google Scholar] [CrossRef]
- Shrestha, A.K.; Thapa, A.; Gautam, H.; Sandrolini, L. Solar Radiation, Air Temperature, Relative Humidity, and Dew Point Study: Damak, Jhapa, Nepal. Int. J. Photoenergy 2019, 2019, 8369231. [Google Scholar] [CrossRef]
- Beysens, D. The formation of dew. Atmos. Res. 1995, 39, 215–237. [Google Scholar] [CrossRef]
- Kidron, G.J.; Kronenfeld, R.; Temina, M. The different effects of regional and local winds on dew formation in the Negev desert. J. Hydrol. Hydromech. 2023, 71, 132–138. [Google Scholar] [CrossRef]
- Davis, P.A. An investigation of a method for predicting dew duration. Meteorol. Atmos. Phys. 1957, 10, 66–93. [Google Scholar] [CrossRef]
- Wang, L.; Shao, M.A.; Wang, Q.; Gale, W.J. Historical changes in the environment of the Chinese Loess Plateau. Environ. Sci. Policy 2006, 9, 675–684. [Google Scholar] [CrossRef]
- Haase, D.; Fink, J.; Haase, G.; Ruske, R.; Pécsi, M.; Richter, H.; Altermann, M.; Jäger, K.D. Loess in Europe—Its spatial distribution based on a European Loess Map, scale 1:2,500,000. Quat. Sci. Rev. 2007, 26, 1301–1312. [Google Scholar] [CrossRef]
- Muhs, D.R. The geochemistry of loess: Asian and North American deposits compared. J. Asian Earth Sci. 2018, 155, 81–115. [Google Scholar] [CrossRef]
- Li, Y.; Shi, W.; Aydin, A.; Beroya-Eitner, M.A.; Gao, G. Loess genesis and worldwide distribution. Earth-Sci. Rev. 2020, 201, 102947. [Google Scholar] [CrossRef]
- Swezey, C. Eolian sediment responses to late Quaternary climate changes: Temporal and spatial patterns in the Sahara. Palaeogeogr. Palaeoclimatol. Palaeoecol. 2001, 167, 119–155. [Google Scholar] [CrossRef]
- Al-Masrahy, M.A.; Mountney, N.P. A classification scheme for fluvial–aeolian system interaction in desert-margin settings. Aeolian Res. 2015, 17, 67–88. [Google Scholar] [CrossRef]
- Cohen, T.J.; Arnold, L.J.; Gázquez, F.; May, J.; Marx, S.K.; Jankowski, N.R.; Chivas, A.R.; Garćia, A.; Cadd, H.; Parker, A.G.; et al. Late Quaternary climate change in Australia’s arid interior: Evidence from Kati Thanda—Lake Eyre. Quat. Sci. Rev. 2022, 292, 107635. [Google Scholar] [CrossRef]
- Zhu, B.Q. Paleo-Atmospheric Precipitation Recharged to Groundwater in Middle-Latitude Deserts of Northern China. Atmosphere 2023, 14, 774. [Google Scholar] [CrossRef]
- Zhu, X.; Li, Y.; Peng, X.; Zhang, S. Soils of the loess region in China. Geoderma 1983, 29, 237–255. [Google Scholar]
- Dang, Y.; Li, S.; Wang, G.; Zhao, K. Fractal characteristics of soil particle composition for typical types of soil profile on Loess Plateau. Trans. Chin. Soc. Agric. Eng. 2009, 25, 74–78. [Google Scholar]
- Zhao, C.; Shao, M.; Jia, X.; Zhang, C. Particle size distribution of soils (0–500 cm) in the Loess Plateau, China. Geoderma Reg. 2016, 7, 251–258. [Google Scholar] [CrossRef]
- Jiang, Y.; Yin, X.; Luo, X.; Yu, L.; Sun, H.; Wang, N.; Mathews, S. Sorption of vanadium (V) on three typical agricultural soil of the Loess Plateau, China. Environ. Pollut. Bioavail. 2019, 31, 120–130. [Google Scholar] [CrossRef]
- Uclés, O.; Villagarcía, L.; Cantón, Y.; Lázaro, R.; Domingo, F. Non-rainfall water inputs are controlled by aspect in a semiarid ecosystem. J. Arid Environ. 2015, 113, 43–50. [Google Scholar] [CrossRef]
- Agam, N.; Berliner, P.R. Diurnal water content changes in the bare soil of a coastal desert. J. Hydrometeorol. 2004, 5, 922–933. [Google Scholar] [CrossRef]
- Matimati, I.; Musil, C.F.; Raitt, L.; February, E. Non rainfall moisture interception by dwarf succulents and their relative abundance in an inland arid South African ecosystem. Ecohydrology 2013, 6, 818–825. [Google Scholar] [CrossRef]
- Whalley, W.R. Considerations on the use of time-domain reflectometry (TDR) for measuring soil water content. Eur. J. Soil Sci. 1993, 44, 1–9. [Google Scholar] [CrossRef]
- Jones, S.B.; Wraith, J.M.; Or, D. Time domain reflectometry measurement principles and applications. Hydrol. Process. 2002, 16, 141–153. [Google Scholar] [CrossRef]
- Louki, I.I.; Al Omran, A.M.; Aly, A.A.; Al Harbi, A.R. Sensor effectiveness for soil water content measurements under normal and extreme conditions. Irrig. Drain. 2019, 68, 979–992. [Google Scholar] [CrossRef]
- Kidron, G.J.; Kronenfeld, R. Microlysimeters overestimate the amount of non-rainfall water–an experimental approach. Catena 2020, 194, 104691. [Google Scholar] [CrossRef]
- Duvdevani, S. An optical method of dew estimation. Q. J. R. Meteorol. Soc. 1947, 73, 282–296. [Google Scholar] [CrossRef]
- Zangvil, A. Six years of dew observations in the Negev Desert, Israel. J. Arid Environ. 1996, 32, 361–371. [Google Scholar] [CrossRef]
- Kidron, G.J. Analysis of dew precipitation in three habitats within a small arid drainage basin, Negev Highlands, Israel. Atmos. Res. 2000, 55, 257–270. [Google Scholar] [CrossRef]
- Griend, A.A.V.D.; Owe, M. Bare soil surface resistance to evaporation by vapor diffusion under semiarid conditions. Water Resour. Res. 1994, 30, 181–188. [Google Scholar] [CrossRef]
- Kaseke, K.F.; Mills, A.J.; Brown, R.; Esler, K.J.; Henschel, J.R.; Seely, M.K. A Method for Direct Assessment of the “Non Rainfall” Atmospheric Water Cycle: Input and Evaporation From the Soil. Pure Appl. Geophys. 2012, 169, 847–857. [Google Scholar] [CrossRef]
- Kidron, G.J.; Kronenfeld, R. Assessing the effect of micro-lysimeters on NRWI: Do micro-lysimeters adequately represent the water input of natural soil? J. Hydrol. 2017, 548, 382–390. [Google Scholar] [CrossRef]
- Hannes, M.; Wollschläger, U.; Schrader, F.; Durner, W.; Gebler, S.; Pütz, T.; Fank, J.; von Unold, G.; Vogel, H.J. A comprehensive filtering scheme for high-resolution estimation of the water balance components from high-precision lysimeters. Hydrol. Earth Syst. Sci. 2015, 19, 3405–3418. [Google Scholar] [CrossRef]
- Herbrich, M.; Gerke, H.H.; Bens, O.; Sommer, M. Water balance and leaching of dissolved organic and inorganic carbon of eroded Luvisols using high precision weighing lysimeters. Soil. Tillage Res. 2017, 165, 144–160. [Google Scholar] [CrossRef]
- Jannis, G.; Veronika, S.; Markus, H.; Alexander, G.; Harry, V.; Thomas, P. Determining dew and hoar frost formation for a low mountain range and alpine grassland site by weighable lysimeter. J. Hydrol. 2018, 563, 372–381. [Google Scholar]
- Baker, J.M.; Spaans, G.J. Measuring water exchange between soil and atmosphere with TDR-microlysimetry. Soil Sci. 1994, 158, 22–30. [Google Scholar] [CrossRef]
- Kinama, J.M.; Stigter, C.J.; Ong, C.K.; Ng Ang A, J.K.; Gichuki, F.N. Evaporation from soils below sparse crops in contour hedgerow agroforestry in semi-arid Kenya. Agric. For. Meteorol. 2005, 130, 149–162. [Google Scholar] [CrossRef]
- Dai, J.; Wang, H.; Ge, Q. Multiple phenological responses to climate change among 42 plant species in Xi’an, China. Int. J. Biometeorol. 2013, 57, 749–758. [Google Scholar] [CrossRef]
- Cervelli, E.W.; Lundholm, J.T.; Du, X. Spontaneous urban vegetation and habitat heterogeneity in Xi’an, China. Landsc. Urban. Plan. 2013, 120, 25–33. [Google Scholar] [CrossRef]
- Jia, Z.F.; Ma, Y.D.; Liu, P.; Yao, C.C. Relationship between sand dew and plant leaf dew and its significance in irrigation water supplementation in Guanzhong Basin, China. Environ. Earth Sci. 2019, 78, 1–10. [Google Scholar]
- Jia, Z.F.; Wang, Z.; Wang, H. Characteristics of Dew Formation in the Semi-Arid Loess Plateau of Central Shaanxi Province, China. Water 2019, 11, 126. [Google Scholar] [CrossRef]
- Riedl, A.; Li, Y.; Eugster, J.; Buchmann, N.; Eugster, W. Technical note: High-accuracy weighing micro-lysimeter system for long-term measurements of non-rainfall water inputs to grasslands. Hydrol. Earth Syst. Sci. 2022, 26, 91–116. [Google Scholar] [CrossRef]
- Jia, Z.; Chang, Y.; Liu, H.; Li, G.; Guan, Z.; Zhang, X.; Xi, R.; Liu, P.; Liu, Y. Characteristics and Estimation of Dew in the Loess Hilly Region of Northern Shaanxi Province, China. Sustainability 2024, 16, 2482. [Google Scholar] [CrossRef]
- Boast, C.W.; Robertson, T.M. A “Micro-Lysimeter” Method for Determining Evaporation from Bare Soil: Description and Laboratory Evaluation. Soil Sci. Soc. Am. J. 1982, 46, 689–696. [Google Scholar] [CrossRef]
- Lawrence, M.G. The Relationship between Relative Humidity and the Dewpoint Temperature in Moist Air: A Simple Conversion and Applications. Bull. Am. Meteorol. Soc. 2005, 86, 225–233. [Google Scholar] [CrossRef]
- Alduchov, O.A.; Eskridge, R.E. Improved Magnus Form Approximation of Saturation Vapor Pressure. J. Appl. Meteorol. 1996, 35, 601–609. [Google Scholar] [CrossRef]
- Puth, M.; Neuhäuser, M.; Ruxton, G.D. Effective use of Pearson’s product–moment correlation coefficient. Anim. Behav. 2014, 93, 183–189. [Google Scholar] [CrossRef]
- Ly, A.; Marsman, M.; Wagenmakers, E.J. Analytic posteriors for Pearson’s correlation coefficient. Stat. Neerl. 2018, 72, 4–13. [Google Scholar] [CrossRef] [PubMed]
- van den Heuvel, E.; Zhan, Z. Myths About Linear and Monotonic Associations: Pearson’s r, Spearman’s ρ, and Kendall’s τ. Am. Stat. 2022, 76, 44–52. [Google Scholar] [CrossRef]
- Chen, M.; Zeng, W.; Arthur, E.; Gaiser, T.; Lei, G.; Zha, Y.; Ao, C.; Fang, Y.; Wu, J.; Huang, J. Relating soil salinity, clay content and water vapour sorption isotherms. Eur. J. Soil Sci. 2020, 71, 399–414. [Google Scholar] [CrossRef]
- Arthur, E.; Rehman, H.U.; Tuller, M.; Pouladi, N.; Nørgaard, T.; Moldrup, P.; de Jonge, L.W. Estimating Atterberg limits of soils from hygroscopic water content. Geoderma 2021, 381, 114698. [Google Scholar] [CrossRef]
- Ghanbarian, B.; Hunt, A.G.; Bittelli, M.; Tuller, M.; Arthur, E. Estimating specific surface area: Incorporating the effect of surface roughness and probing molecule size. Soil Sci. Soc. Am. J. 2021, 85, 534–545. [Google Scholar] [CrossRef]
- Song, X.; Chen, C.; Arthur, E.; Tuller, M.; Zhou, H.; Shang, J.; Ren, T. Cation exchange capacity and soil pore system play key roles in water vapour sorption. Geoderma 2022, 424, 116017. [Google Scholar] [CrossRef]
- Li, G.; Zhan, L.; Hu, Z.; Chen, Y. Effects of particle gradation and geometry on the pore characteristics and water retention curves of granular soils: A combined DEM and PNM investigation. Granul. Matter. 2021, 23, 9. [Google Scholar] [CrossRef]
- Altuhafi, F.N.; Coop, M.R.; Georgiannou, V.N. Effect of Particle Shape on the Mechanical Behavior of Natural Sands. J. Geotech. Geoenviron. Eng. 2016, 142, 4016071. [Google Scholar] [CrossRef]
- Li, X.; Sun, J.; Ren, H.; Lu, T.; Ren, Y.; Pang, T. The effect of particle size distribution and shape on the microscopic behaviour of loess via the DEM. Environ. Earth Sci. 2022, 81, 290. [Google Scholar] [CrossRef]
- Chen, J.; Wang, E.; Xue, J.; Cui, L.; Zheng, X.; Du, Q. Effects of soil particle size and gradation on the transformation between shallow phreatic water and soil water under laboratory freezing-thawing action. J. Hydrol. 2023, 619, 129323. [Google Scholar] [CrossRef]
- Ritchie, J.T.; Porter, C.H.; Judge, J.; Jones, J.W.; Suleiman, A.A. Extension of an Existing Model for Soil Water Evaporation and Redistribution under High Water Content Conditions. Soil Sci. Soc. Am. J. 2009, 73, 792–801. [Google Scholar] [CrossRef]
- Schwartz, R.C.; Baumhardt, R.L.; Evett, S.R. Tillage effects on soil water redistribution and bare soil evaporation throughout a season. Soil Tillage Res. 2010, 110, 221–229. [Google Scholar] [CrossRef]
- Fang, J. Variability in condensation water and its determinants in arid regions of north-western China. Ecohydrology 2020, 13, e2226. [Google Scholar] [CrossRef]
- Kidron, G.J.; Kronenfeld, R. Assessing the likelihood of the soil surface to condense vapour: The Negev experience. Ecohydrology 2020, 13, e2200. [Google Scholar] [CrossRef]
- Lin, X.; Hu, Q.; Chen, Z.; Wang, Q.; Zhang, T.; Sun, M. Changes in water vapor adsorption and water film thickness in clayey materials as a function of relative humidity. Vadose Zone J. 2020, 19, e20063. [Google Scholar] [CrossRef]
- Monteith, J.L. Dew. Q. J. R. Meteorol. Soc. 1957, 83, 322–341. [Google Scholar] [CrossRef]
- Atashi, N.; Rahimi, D.; Al Kuisi, M.; Jiries, A.; Vuollekoski, H.; Kulmala, M.; Vesala, T.; Hussein, T. Modeling long-term temporal variation of dew formation in Jordan and its link to climate change. Water 2020, 12, 2186. [Google Scholar] [CrossRef]
- Moratiel, R.; Soriano, B.; Centeno, A.; Spano, D.; Snyder, R.L. Wet-bulb, dew point, and air temperature trends in Spain. Theor. Appl. Climatol. 2017, 130, 419–434. [Google Scholar] [CrossRef]
- Bui, A.; Johnson, F.; Wasko, C. The relationship of atmospheric air temperature and dew point temperature to extreme rainfall. Environ. Res. Lett. 2019, 14, 074025. [Google Scholar] [CrossRef]
- Beysens, D.; Clus, O.; Mileta, M.; Milimouk, I.; Muselli, M.; Nikolayev, V.S. Collecting dew as a water source on small islands: The dew equipment for water project in Biševo (Croatia). Energy 2007, 32, 1032–1037. [Google Scholar] [CrossRef]
- Maestre-Valero, J.F.; Martin-Gorriz, B.; Martínez-Alvarez, V. Dew condensation on different natural and artificial passive surfaces in a semiarid climate. J. Arid Environ. 2015, 116, 63–70. [Google Scholar] [CrossRef]
- Agam, N.; Berliner, P.R. Dew formation and water vapor adsorption in semi-arid environments—A review. J. Arid Environ. 2006, 65, 572–590. [Google Scholar] [CrossRef]
- Ansari, E.; Ferber, N.L.; Milošević, T.; Barron, J.; Karanikolos, G.N.; AlMarzooqi, F.; Dumée, L.F.; Calvet, N. Atmospheric water generation in arid regions—A perspective on deployment challenges for the Middle East. J. Water Process. Eng. 2022, 49, 103163. [Google Scholar] [CrossRef]
- Kool, D.; Agra, E.; Drabkin, A.; Duncan, A.; Fendinat, P.P.; Leduc, S.; Lupovitch, G.; Nambwandja, A.N.; Ndilenga, N.S.; Nguyễn Thị, T.; et al. The overlooked non-rainfall water input sibling of fog and dew: Daily water vapor adsorption on a! Nara hummock in the Namib Sand Sea. J. Hydrol. 2021, 598, 126420. [Google Scholar] [CrossRef]


Disclaimer/Publisher’s Note: The statements, opinions and data contained in all publications are solely those of the individual author(s) and contributor(s) and not of MDPI and/or the editor(s). MDPI and/or the editor(s) disclaim responsibility for any injury to people or property resulting from any ideas, methods, instructions or products referred to in the content. |
© 2024 by the authors. Licensee MDPI, Basel, Switzerland. This article is an open access article distributed under the terms and conditions of the Creative Commons Attribution (CC BY) license (https://creativecommons.org/licenses/by/4.0/).