Article

Housing Practices of Albanian Immigrants in Athens: An “in-between” Socio-Spatial Condition

by
Iris Polyzou
1 and
Stavros Nikiforos Spyrellis
2,*
1
School of Architecture, National Technical University of Athens, 10682 Athens, Greece
2
Institute of Social Research, National Centre for Social Research, 10552 Athens, Greece
*
Author to whom correspondence should be addressed.
Land 2024, 13(7), 964; https://doi.org/10.3390/land13070964
Submission received: 27 April 2024 / Revised: 17 June 2024 / Accepted: 23 June 2024 / Published: 1 July 2024
(This article belongs to the Special Issue Urban Micro-Segregation)

Abstract

:
Immigrants’ access to housing is often the outcome of self-settlement practices within a context of limited social policies that often characterizes Southern European metropolises. Hence, immigrants are facing multiple constraints and remain vulnerable towards diverse socioeconomic fluctuations. This article focuses on the housing practices followed by Albanian immigrants, the largest immigrant group in Athens’s municipality, to examine how spatial inequalities are intertwined with ethnicity in the Greek capital. The objective is twofold: to discuss ethnic segregation on the micro-scale of Athenian central neighborhoods and examine how immigrants’ housing practices are being challenged within a rapidly changing socio-spatial context. The methodology follows a mixed approach, aiming at identifying differentiations and inequalities both on the macro- and micro-spatial scale. First, differentiations among Greeks, Albanians, and other third-country nationals in Athens (2011) are traced and compared, based on quantitative data. Second, for the purpose of highlighting micro-geographies in the city, this article presents an analysis of collected narratives of Albanian immigrants, through semi-structured interviews held in 2023. The main results indicate that the population under study finds itself in an “in-between” socio-spatial condition: an “in-between”, compared to the housing experiences of Greek households and other third-country nationals, that produces (and reproduces) segregation trends visible on the micro-scale. Moreover, this article attempts to highlight how the lack of housing policies put in peril the successful self-settlement practices of Albanian immigrants, in the current context of financialization of the Athenian housing market.

1. Introduction

The Albanian population in Greece is the largest immigrant group established in the country since the 1990s. This article relies on primary and secondary research data, seeking to present the ethnic dimension of housing practices in Athens, a Southern European (henceforth SE) capital undergoing major socio-spatial transformations. Following a pluridisciplinary geographic approach, we observe the spatial dynamics of the Albanian population, a research topic insufficiently discussed, so far, in the relevant literature. Cross-examining the socioeconomic, residential, and ethnic differentiations, the analysis focuses on the access of Albanians to the housing sector and on the contextual factors that have been interfering with their practices on the micro-scale. We conclude that Albanian immigrants in Athens stand in an “in-between” situation: an “in-between” compared to Greek households and other third-country nationals.
Ethnic and socioeconomic segregation within the broader European urban context has been increasing since the mid-1970s, following the rise in wealth inequalities on the global and national scale [1]. The SE context is characterized by low levels of spatial segregation, and, often, ethnic segregation is the outcome of residential inequalities experienced by the immigrant population [2]. As main indicators of residential inequalities, we identify limited access to higher-quality housing, discrimination in the housing market, or limited social encounters with nationals within a context of spatial proximity.
In Athens, access to affordable and decent housing remains problematic for most of the immigrant population to this day, mainly due to increasing housing prices, the absence of relevant policies and social housing, shortages of affordable housing following new trends in the touristification of the city [3] and multifaceted discrimination in the housing market [4,5,6,7].
While immigrants’ contribution to the social and economic life of the country is incontestable [8,9], social policies concerning their integration have (diachronically) been poor [10,11]. Numerous studies demonstrate how social housing policies in Greece are almost non-existent (for both national and immigrant population), while the social housing sector is also limited [4,12,13]. A few exceptions are the policies implemented since 2015 due to the so-called “refugee crisis”. During that period, in response to the extreme accommodation needs of asylum seekers and beneficiaries of international protection in Greece, as in other SE countries, an expansive reception system was shaped including two types of accommodation infrastructures: the Open Temporary Reception Facilities (henceforth “Sites”), which in the case of Athens were established in suburban and peri-urban areas, and the Emergency Support to Integration and Accommodation (ESTIA), which included urban accommodation in apartments, hotels, and other buildings [14]. The Sites were turned into prolonged displacement accommodation infrastructures, while the ESTIA project was discontinued in 2023 and progressively replaced by the HELIOS project (Hellenic Integration Support for Beneficiaries of International Protection), a program which, nevertheless, exclusively addresses asylum seekers who received refugee status [15,16].
Throughout this turbulent period, asylum seekers and beneficiaries of international protection were included in EU-funded project-based initiatives. At the same time, immigrant communities already established in Athens, before 2015, were not included in the policies implemented during the “refugee crisis” and were left, once again, in a position of relative exclusion vis-à-vis the housing policy.
Following the introduction (Section 1), this paper presents the contextual and theoretical factors of the analysis (Section 2), highlighting the micro-segregation trends and outlining the general socioeconomic pathways of Albanian immigrants in Athens. Section 3 presents the materials and the methods employed in this study in order to examine the demographic profile and the housing patterns of the Albanian population in Athens using quantitative and qualitative data. Section 4 compares the education and housing profile of Albanians, Greeks, and other migrant populations. Lastly, Section 5 discusses the issue of immigrant settlement within the context of profound changes taking place in Athens today, and Section 6 presents the main findings.

2. Contextual and Theoretical Factors

2.1. Micro-Segregation Trends in Athens

The theoretical approach of this paper draws insights from the conceptualization of segregation as an urban condition visible on the macro-, mezzo- and micro-socio-spatial scale. Concerning the case of Athens, a typical example of an SE city, the spatial and social inequalities “manifest themselves in spatially fragmented ways” [17]. Rather than observing large-scale and horizontal segregation patterns, the research conducted since the mid-1990s has shown that inequalities on the spatial scale are often manifested vertically and, therefore, on the micro-scale level [18,19,20]. Recent methodological inputs, such as the use of combined statistical data, in-depth interviews, and empirical research, allowed an analysis of multiple segregation trends that are visible on the mezzo- and micro-scale of the neighborhood, the street, and/or the apartment buildings (polykatoikia).
The Athenian housing stock produces a relatively homogeneous setting, especially in central urban areas. Most of the Athenians reside in apartment buildings, built on small plots—often smaller than 500 m2—with an average of 15 apartments and 5–7 floors. Furthermore, most of these buildings were erected between 1960 and 1980 [3]. The prevalent mechanism of housing promotion throughout that period was the antiparochi system, which is a market-based mechanism of housing production associated with the massive densification and spread of the typical post-war apartment buildings (polykatoikies) following a triangulated form of building processes including a landowner; a small contractor, with whom they formed a joint venture to carry out a single operation, at the end of which they split the apartments according to their initial contract terms; and buyers [17,21]. Throughout this otherwise homogeneous (and relatively new) housing stock, differences do occur. They are expressed via access to homeownership, housing quality and amenities, or location. Furthermore, the floor of residence in the apartment building (polykatoikia) is also important, since it produces a social or ethnic stratification by floor of residence. Upper floors are more advantageous, offering higher living standards, while lower floors—ground floor and underground apartments—are much smaller, darker, and noisier [20,22,23].
This paper is about ethnic micro-segregation; it enriches the study on socio-spatial and ethnic inequalities in the Greek capital. Micro-segregation highlights that, despite urban proximity, “socio-spatial hierarchies, even in otherwise socially mixed neighborhoods, are (re)built at a micro spatial scale” [24]. Albanian immigration—with Albanians being the largest immigrant group which, according to the relevant literature, follows patterns of invisibility in the city—is taken as the main case study to address issues of social and ethnic mixes, entrapment and marginality, and micro- and mezzo-segregation in an urban context defined and redefined by hierarchies and inequalities.

2.2. Contextual Evidence on the Athenian Housing Market

Access to rental housing is primarily determined by demand and supply, mainly imposed by rental prices, which are regulated by the expectations of owners and the incomes of those seeking a residence. Other forms of filtering, such as home insurance contracts or pay slips, are not imposed. First impressions and a warranty (one or two months in advance) seem to determine the whole procedure. Moreover, neither the owners nor the tenants are fully protected by the legal framework. On the one hand, the contracts are easily bypassed by the tenants and can be ended in advance. On the other hand, at the end of the initial three-year contract, the owner can set a new price without restrictions. In recent years, the rise in rental prices has led to changes in the Athenian housing market [25]. Fueled, among other factors, by touristification trends and an increase in short-term rentals, the rise in rental prices reflect mostly an increase in homeowners’ expectations, rather than an increase in renters’ incomes.
Access to homeownership remains a key housing strategy for Greek society. Traditionally, homeownership has been financed by personal savings, or families’ ability to support younger members. Bank loans, linked to annual incomes, also used to play a pivotal role in access to ownership. The aforementioned sources were strongly affected by the debt crisis that turmoiled the Greek economy. Access to homeownership became more difficult, savings were reduced, the number of non-performing loans (henceforth NPL) increased, while property taxes were imposed horizontally on all income classes [5,26].
Social housing provision in Greece is limited, while there is a complete absence of the social rental sector [27,28]. The production of social housing often tried to resolve the extreme housing needs of more vulnerable groups (i.e., war refugees, internal immigrants due to natural hazards), but rarely proposed an organized housing solution. The state’s absence was replaced by loans distributed mainly by the Greek Workers’ Housing Organization (OEK), not active since 2012 [27], reproducing the homeownership residential strategy through social policies.

2.3. Albanians in Athens: Arrival, Socio-Spatial Settlement, and Vulnerabilities

Albanian migration in Greece started in the early 1990s, during a period of economic and political challenges for both countries. Greece, on the one hand, secured its position in the North Atlantic Alliance (NATO) and the European Union (EU), while entering progressively in the EU market. Through the subsequent economic development, Greece became an immigration country, in need of an unskilled and flexible labor force. Citizens from the Balkan countries and Eastern Europe arrived first, followed by an ethnically diversified migrant population, from Asia, the Middle East, and Africa. Albania, on the other hand, experienced in the 1990s a profound political change with the collapse of communism. The subsequent transformation of the economy, from socialist to market-oriented, resulted in an extended financial crisis with a subsequent increase in unemployment [29,30]. A part of the Albanian population fled the country, following the path of international immigration, mainly towards Greece and Italy. According to the Albanian Statistical Bureau (INSTAT), in the mid-2000s, Greece absorbed around 600,000 people out of 1,000,000 that had fled to Albania [30] (101).
The main factor that facilitated Albanian mobilities towards Greece is the border that the two countries share—a mountainous zone, difficult to control, of more than 280 km. The geographic proximity shaped migration patterns and fostered transnational economic, personal, and cultural ties between the two countries [31]. The border was the gateway for most of the migrants that moved towards Greece since the 1990s, regardless of which part of Albania they came from. Scholars have demonstrated that the Albanian population consists of a complex migratory group with important heterogeneities reflecting, among others, differences in the generational status, ethnic and spatial origins, length of stay, legal status, or employment conditions of its members [29,31,32,33]. For the needs of this analysis, we observed the pathway of Albanians coming from different cities, such as Shkoder in the north, Fier and Berat in central Albania, or Saradë in the south (Figure 1).
On a global scale, the border between Albania and Greece was, and still is, a threshold between different economic systems or organizations. During the Cold War—after WWII and the end of the Greek Civil War (1945–1949), up until 1990—it was the limit between East and West. Today, it delimits the European Union. Largely, it was the vicinity and the extreme instability of the Albanian economy that fueled the immigration towards Greece and not the pre-existing relations between the two countries.
Albanian nationals started arriving in Athens in great numbers in the early 1990s due to the political turmoil in Eastern Europe. This migratory wave continued throughout the decade, with a second increase around 1997–1998 due to the pyramid investment schemes that took place in Albania, resulting in the collapse of the local economy [34] (Table 1 and Figure 2).
After 2000, the rates of Albanian external migration decreased, while in the mid-2000s, some limited repatriation trends were recorded [32]. The migration towards Greece was still growing until the beginning of the 2000s. During that period, a sharp decline in the number of Albanians arriving in Athens was observed, returning to pre-1990 levels after 2008, when the signs of the financial crisis became evident (Figure 2). The arrival in greater numbers of immigrants and asylum seekers from other countries—especially from the Indian peninsula—since 2000, linked to the construction needs of modern infrastructures and of the 2004 Summer Olympics, resulted in substantial changes concerning the ethnic composition of the city. At the same time, other Eastern Europeans, especially from EU member states (e.g., Poland, acceded to the EU in 2004, and Bulgaria and Romania, acceded in 2007), showed a slow increase and stability in numbers throughout the 2000s.
Upon their arrival, Albanian populations settled in urban or rural areas and managed to self-integrate in the labor market, the housing sector, and other societal aspects [9,31,36]. The economic growth of the Greek economy during that period, mainly an effect of European funding, produced an increasing demand for low-skilled workers. Once in Greece, most of them were employed in pillar sectors of the local market, such as the service (tourism), agriculture, construction, and care sectors. This enabled the immigrants to enter the formal but—most of the time, due to the lack of a legal framework for the employment of immigrants in Greece—informal labor market [36].
Albanians progressively experienced social mobility and, as King and Vullnetari point out, their presence in Greece evolved into a permanent family settlement [9,37]. The legalization programs in the 1990s permitted family reunification, also giving access to legal status.1 The dependency between work and the legal permit status did not prove to be an impediment of considerable importance, since the economic sectors that Albanians were employed in continued to flourish throughout that period, offering a considerable income.
The socioeconomic trajectories of Albanian immigrants in Greece were disrupted due to the economic crisis. Found in a spiral of increased precarity, their status changed dramatically [9,31]. Researchers demonstrate how they were disproportionately affected by very high rates of unemployment, since the basic employment sectors, in which they were typically occupied, were severely affected. As a result, their inflow was further reduced, while many Albanians fled the country, either to return to Albania or re-emigrate to other, more economically stable markets. According to the first published results of the 2021 census by the Hellenic Statistical Authority (ELSTAT), on a national level between 2011 and 2021, there was a decline of 22% (105,925 people) in the Albanian population and of 27.6% (53,375 people) in the Athenian metropolitan area [39].
Moreover, the crisis and the subsequent unemployment also had an impact on legal status—the so-called “de-legalization” of immigrants [31]. Legal debates on citizenship during the period of 2009–2015 became more complex within an increasingly nationalistic political landscape under conditions of intense economic instability [40].
Albanians, mostly second-generation, are currently coping with multiple economic and structural challenges, related to unemployment or underemployment, legal status exclusion, and poor opportunities. According to the 2011 census data, 20.8% of the Albanians residing in Athens in 2011 declared that they had never lived abroad, a percentage that shows the numerical importance of the second generation [35]. As already mentioned, Albanian immigrants were critically affected, often more than the Greek nationals, by the economic recession. The sovereign debt crisis intensified the challenges for the immigrant population, transforming in many cases the social mobility strategies that this population had applied over several years [41]. The existing socio-spatial inequalities were aggravated, increasing deprivation and precarity, especially in the ethnically mixed neighborhoods of the city [12,14].
On a local scale, Athens also changed profoundly during that period (1990–2010). For the first time, Greece became a “host” country for ethnically and socially diverse populations, with Athens being the epicenter of these changes, absorbing the majority of arriving populations, which meant new and more complex segregation patterns [7,42]. Due to the absence of public housing, the newcomers found accommodation in the private sector; in other words, they were obliged to “survive” in the free market. In Athens, the prevailing—apartment building (polykatoikia)—housing stock resulted in intense spatial proximity within the densely built neighborhoods. On the one hand, combined with high percentages of homeownership, this favored low levels of segregation; on the other hand, spatial proximity often masks social distance, marginalization, and social exclusion, associated with poor-quality housing and precariousness [12,43].

3. Materials and Methods

Our analysis was based on both quantitative and qualitative research, conducted within the framework of the Horizon 2020-funded ITHACA (Interconnecting Histories and Archives for Migrant Agency) research program. The quantitative research used data obtained from the 2011 national census, the last available national census, accessible through the application Panorama of Greek Census Data [35]. The data were collected by the Hellenic Statistical Authority (ELSTAT). The scope of the analysis was to investigate the different social profiles and to identify differentiations in the quality of the housing stock occupied by migrants in Athens. The analysis focused on the population from developing economy countries2 [44], especially from Albania. First, we compared the trends in the Albanian community with the Greek population’s trends. Then, in order to facilitate the comparison with other migrant populations, we regrouped the most important ethnic groups into three distinct geo-economic groups. The first group included the countries from Eastern Europe who are not members of the EU—i.e., Georgia and Ukraine (henceforth EEnEU); the second, the countries of Eastern Europe that have joined the EU, i.e., Bulgaria, Poland, and Romania (henceforth EEEU); finally, the third features countries from the Indian peninsula, i.e., Bangladesh and Pakistan (henceforth IP).
In the relatively homogeneous Athenian housing stock, our analysis unraveled differentiations according to the nationality of the residents. To investigate the relation between poor housing conditions and ethnic segregation, we used several variables available in the census. The data analysis, and the mapping, was made at the lowest possible spatial level, i.e., the Urban Analysis Units (URANUs) [35]3.
First, we present the average profile of the ethnic groups residing in the Athenian municipality, putting emphasis on educational attainment, employment, and other demographic indicators. Second, we analyzed and mapped the data linked to homeownership, and then focused on housing amenities, such as the age of the housing stock, the heating system, and the sufficient insulation. Lastly, beyond the analysis of variables demonstrating horizontal ethnic inequalities, this paper also investigates the presence of vertical differentiations by investigating the unequal distribution of ethnic groups among floor levels in apartment buildings [14,20,23].
Our analysis also included the results of the qualitative research conducted during the ITHACA Horizon 2020 research program, containing a series of interviews and informal meetings with representatives of NGOs, representatives of migrant associations, academics, and experts in the field of migration and refugees’ studies (Annex, Table A1 and Table A2). Through the above-mentioned exchanges, a specific migrant association—representing Albanian households—further collaborated with us in order to deepen our understanding of this specific migrant group. Having built a relationship of trust, the research team engaged in extended discussions with its representatives and proceeded in conducting eight semi-structured interviews (Annex, Table A1)4. For the needs of those interviews, an extended interview guide was elaborated, composed of 44 open-ended questions and organized into five distinctive parts including questions about the household composition, the employment status of the household members, their educational level, their migratory status, and lastly, the detailed record of the household’s housing pathway in Athens (i.e., first, second, and third accommodation). Special attention was given to aspects such as the rent, the apartment surface, its amenities, and the relations with the owner.
The resulting qualitative material was laden with narratives concerning the process of settlement in Athens. For the needs of this article, we utilized only those parts highlighting housing practices deployed by the migrants. Following a life story approach to migration [45], we recorded their pathways from their arrival to mid-2023, when these interviews took place.

4. Results

4.1. Albanian Socioeconomic Profile

In 2011, in the municipality of Athens, foreigners represented 25.9% of the population and Albanians represented 39.8% of them (see Table 1). Before proceeding to the analysis of the housing practices, it is important to question the average profile of ethnic groups in the city. This part of our analysis refers to educational attainment (e.g., 12–14 year olds not in education), employment (e.g., percentage in specific professions), and specific demographic indicators (e.g., age or number of children per mother). In the next part of this analysis (Section 4.2), we examine issues concerning their housing practices, such as the age of the housing stock, the amenities, the access to homeownership, and the indices of vertical segregation.
Concerning education (Table 2), the drop-out rate for 12–15 year olds is extremely high for immigrants from the IP (32.1%), while the rest of the groups show small deviations between them—4.2% for the Albanians and 3.1% for the rest of East Europeans—with higher levels of participation in the compulsory education (this age cohort corresponds to lower secondary school, which is part of compulsory education). The percentage of those not in education, employment, or training (NEETs) also differentiates the EE countries from the IP countries, revealing important differences between them. The Albanians (21.1%) score lower than the other Europeans (22.8% and 27.8%), but still 8% higher than the Greeks. Unemployment places Albanians closer to other foreigners, scoring almost twice higher than the Greeks. It is interesting to mention that unemployment for Albanians and other Eastern Europeans decreases when first-time job seekers (i.e., those who never worked officially before) are considered. The latter finding reinforces the argument of important differentiations between the first and the second generation.
According to the data, the Albanian population in Athens is composed of a much larger percentage of children and a much smaller percentage of elderly compared to the Greek population (Table 3). Furthermore, there is an impressive gender equilibrium. The higher number of children per mother (1.5) indicates that fertility is higher in the Albanian population. Low scores for immigrants from IP counties are linked to their gender and age profile (adolescent males), while demographically, those from the other European countries, especially EEnEU, are primarily middle-aged women—mostly occupied in the care sector [35,46]. This factor, i.e., the over-representation of women, explains the low levels of the average number of children per mother.
The low score of the elder population should not be linked to lower life expectancy, but to the geographic vicinity and therefore the possibility of returning to the country of origin. Albanian immigrants in Greece supported their national economy through remittances; therefore, investments in the place of origin, linked to an eventual return, are not rare. For the populations originating from the IP, the low scores can be linked to their recent arrival at the time of the census (2011).
According to the census, Albanians tend to occupy lower, unskilled and semi-skilled, positions in the occupational spectrum. In Athens, they are over-represented in the construction sector, the services, and the care sector. Important differentiations, and traces of intergenerational mobility, do occur if we divide the active population into two distinct age groups (Table 4) and check the five most popular occupations for each group. The first group includes the younger population, between 16 and 29 years old, who were mostly born and raised, or just raised, in Greece. The second group includes those between the ages of 30 and 50. Born before 1981, they arrived in Greece in a productive age, and they represented more than half of the active Albanian population in 2011. The generational differences come to the forefront; the same sectors prevail in both groups, but with important inter-sectorial dissimilarities. For the younger people, 20% are employed in the service and sales sector (shop or waiters and bartenders). For the 30–50-year-old cohort, sales is the third most important category but absorbs only 6%. In this age group, the broader construction sector (i.e., builders, painters) dominates, while domestic, hotel, and office cleaners and helpers follow. For the younger population, these sectors remain important but to a lesser extent.

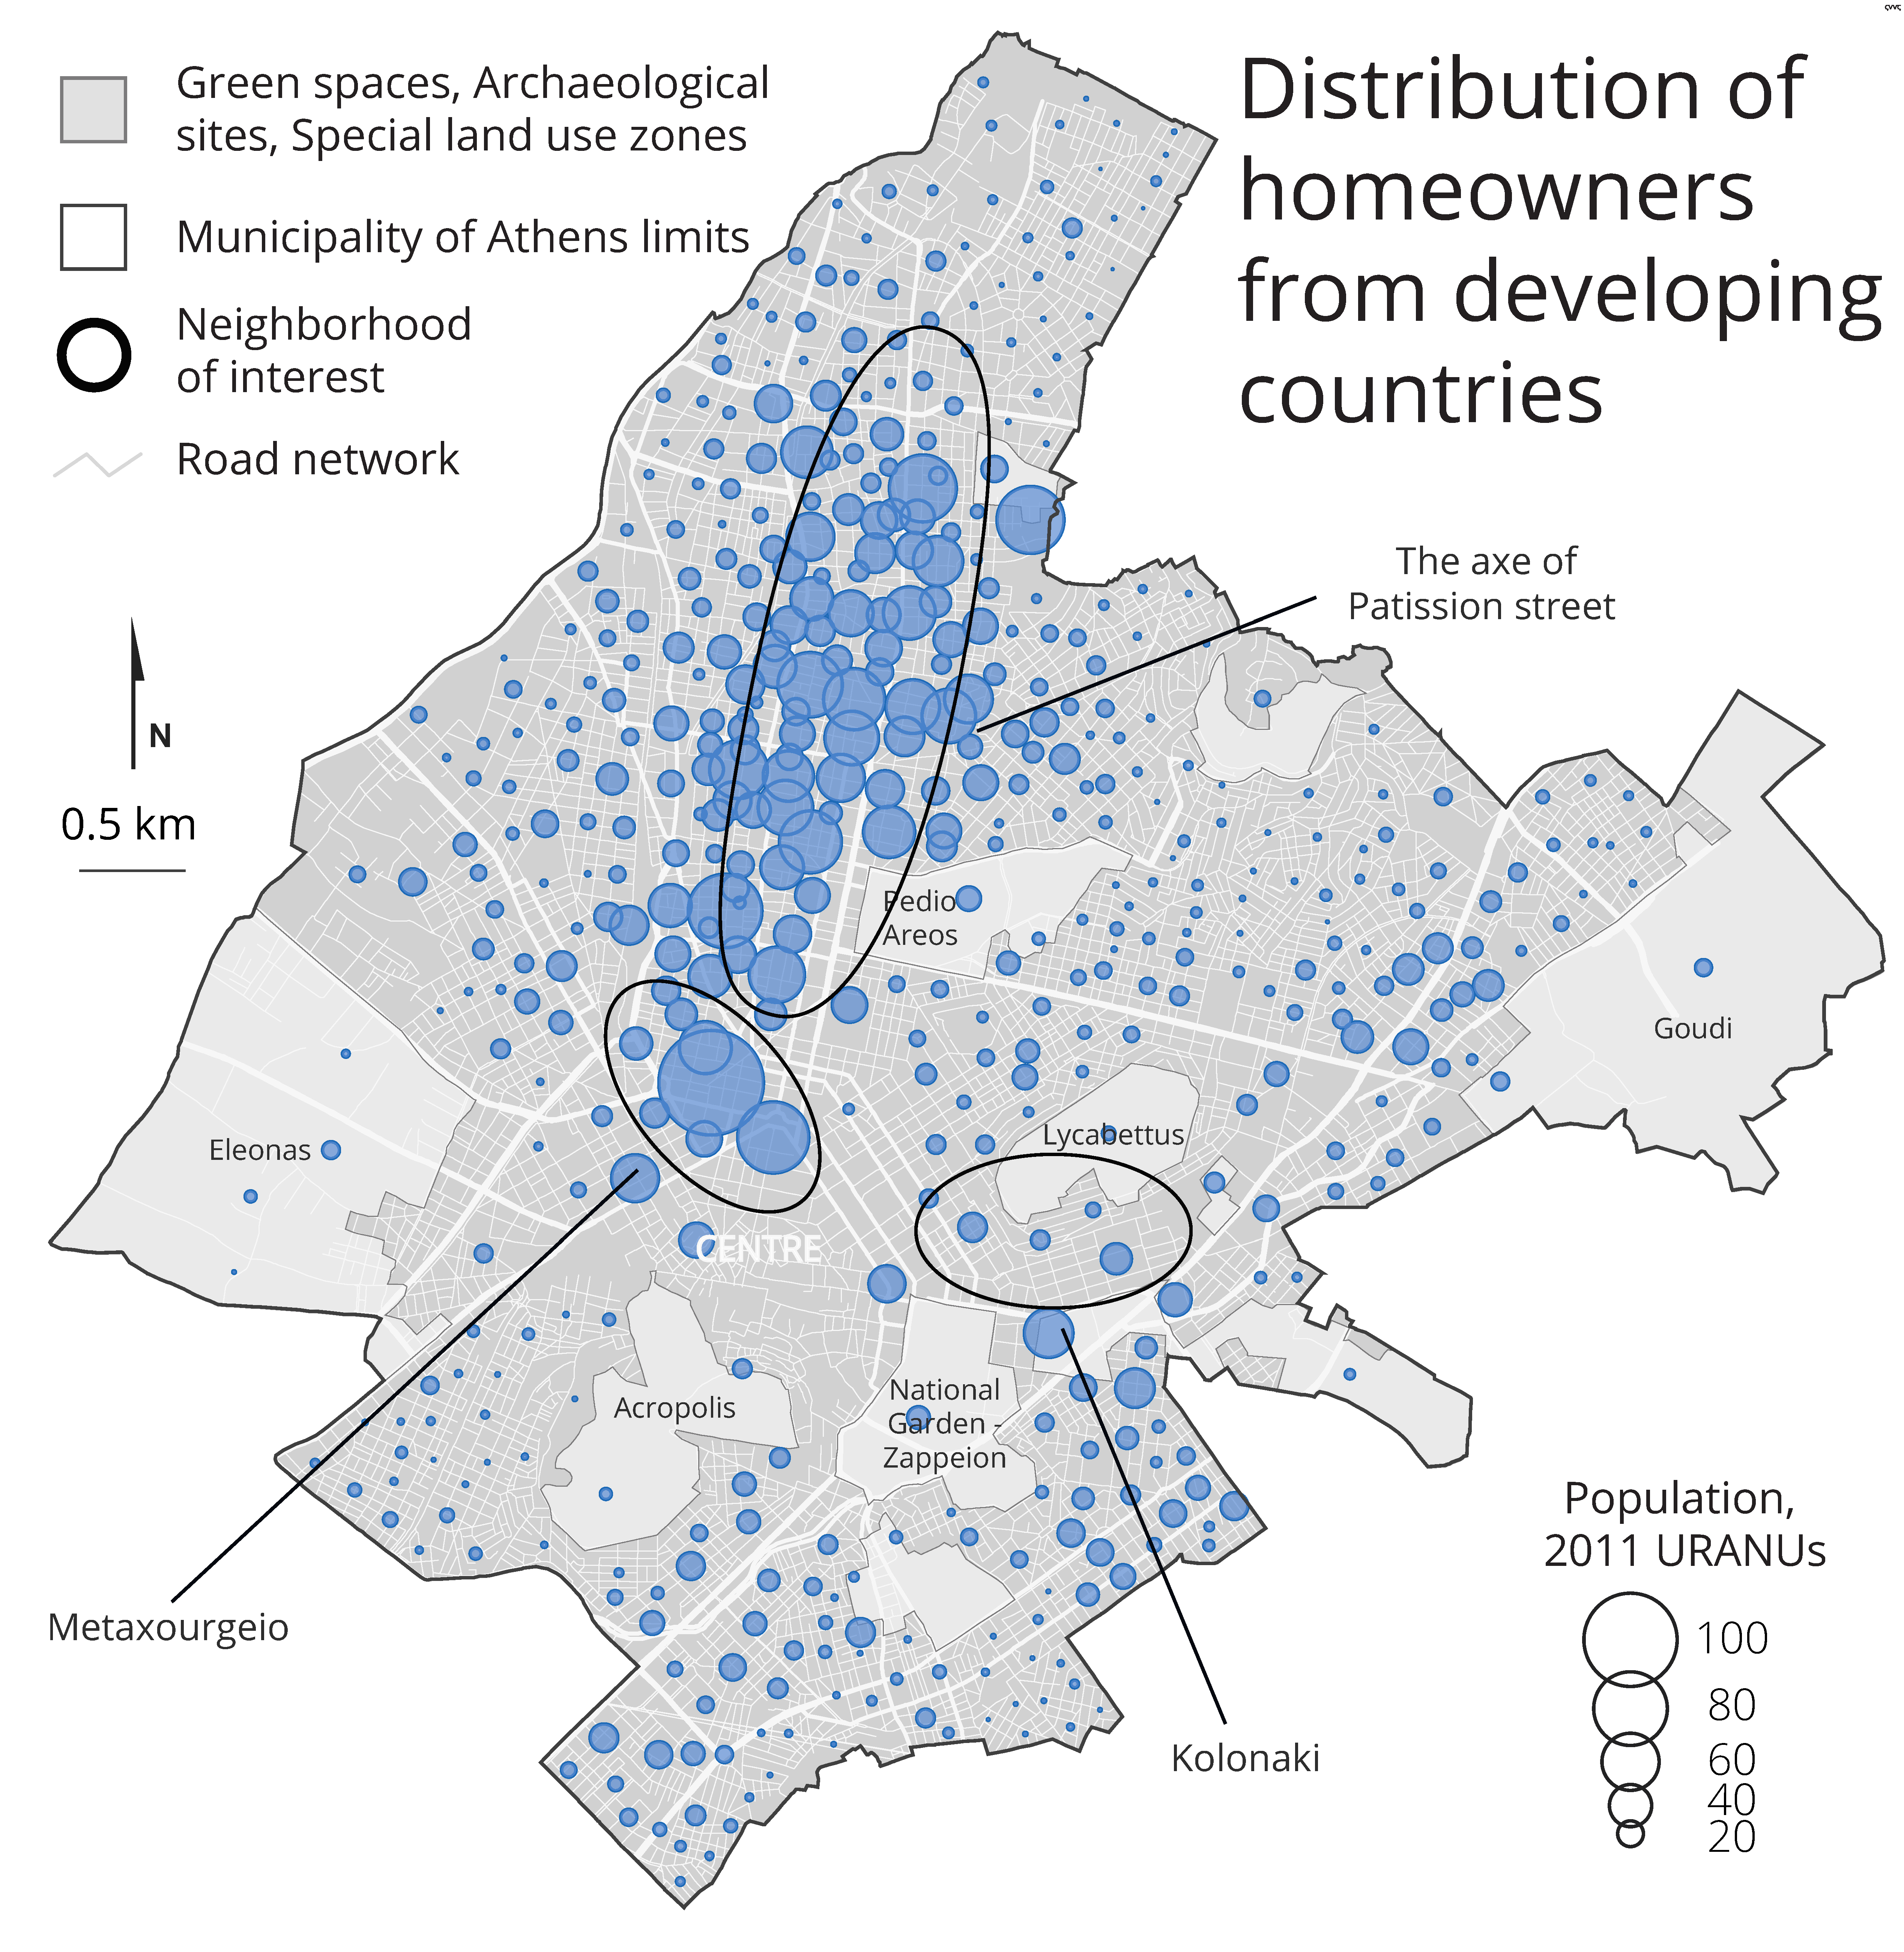
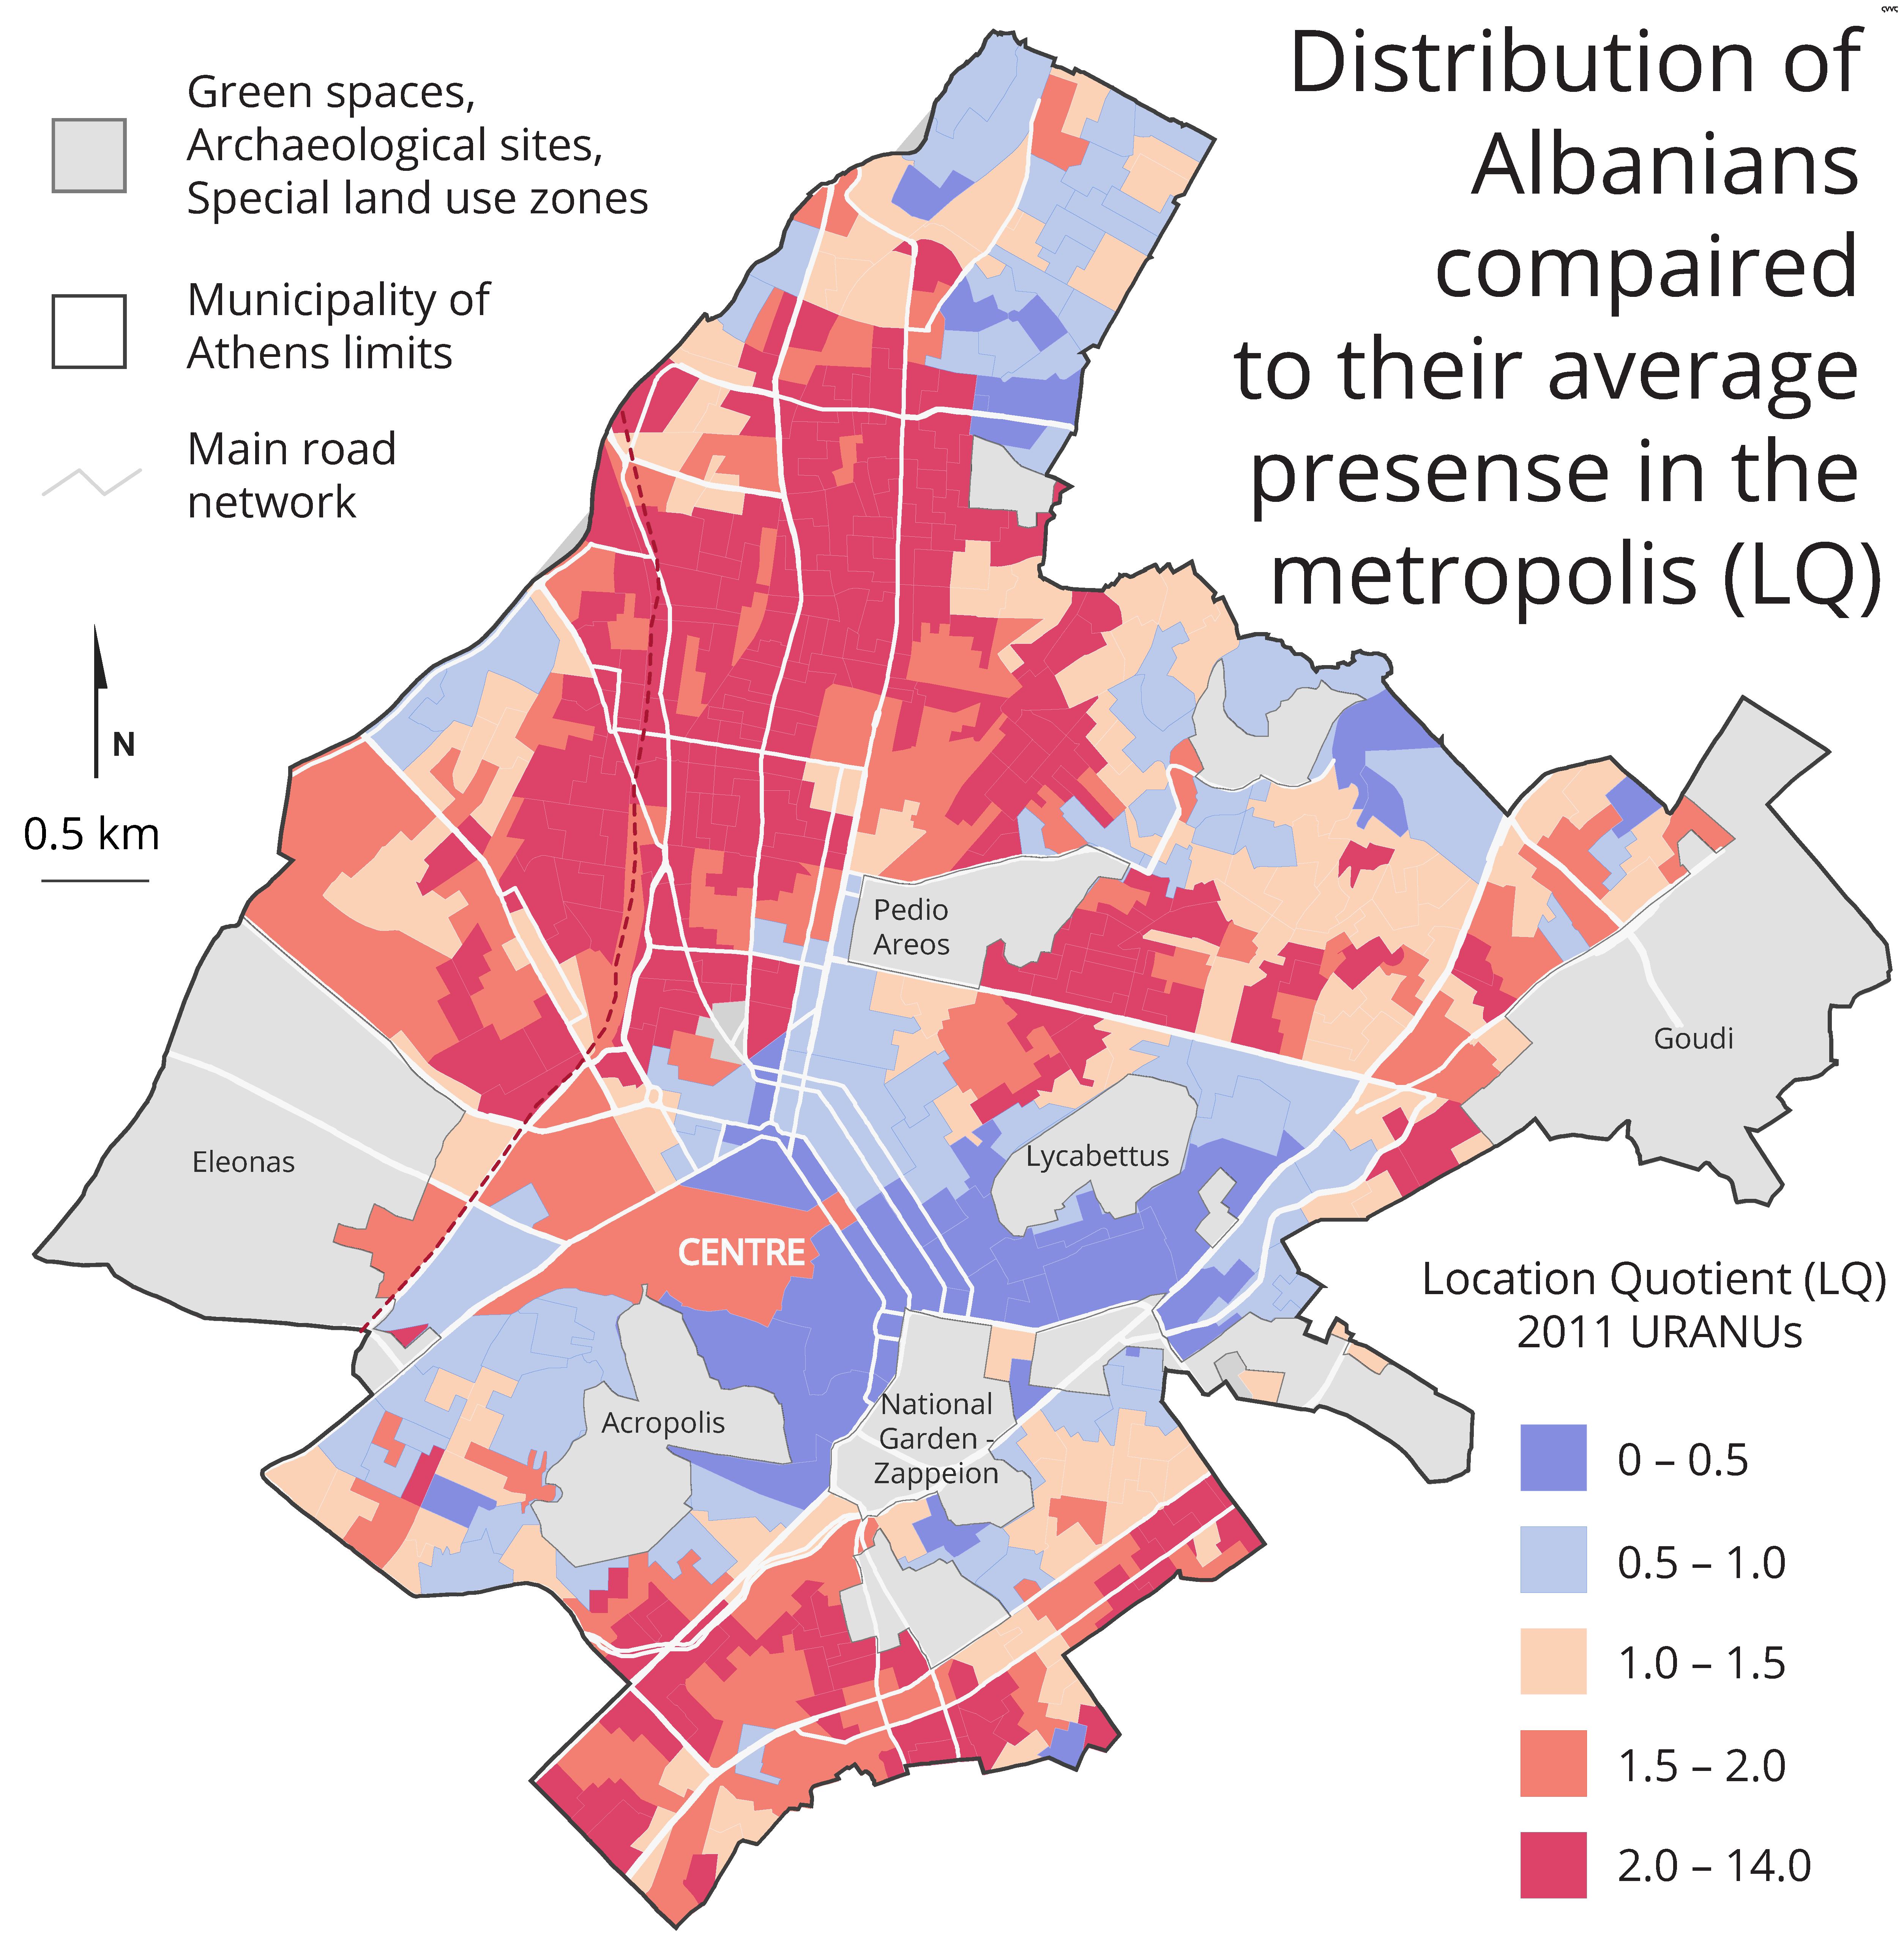
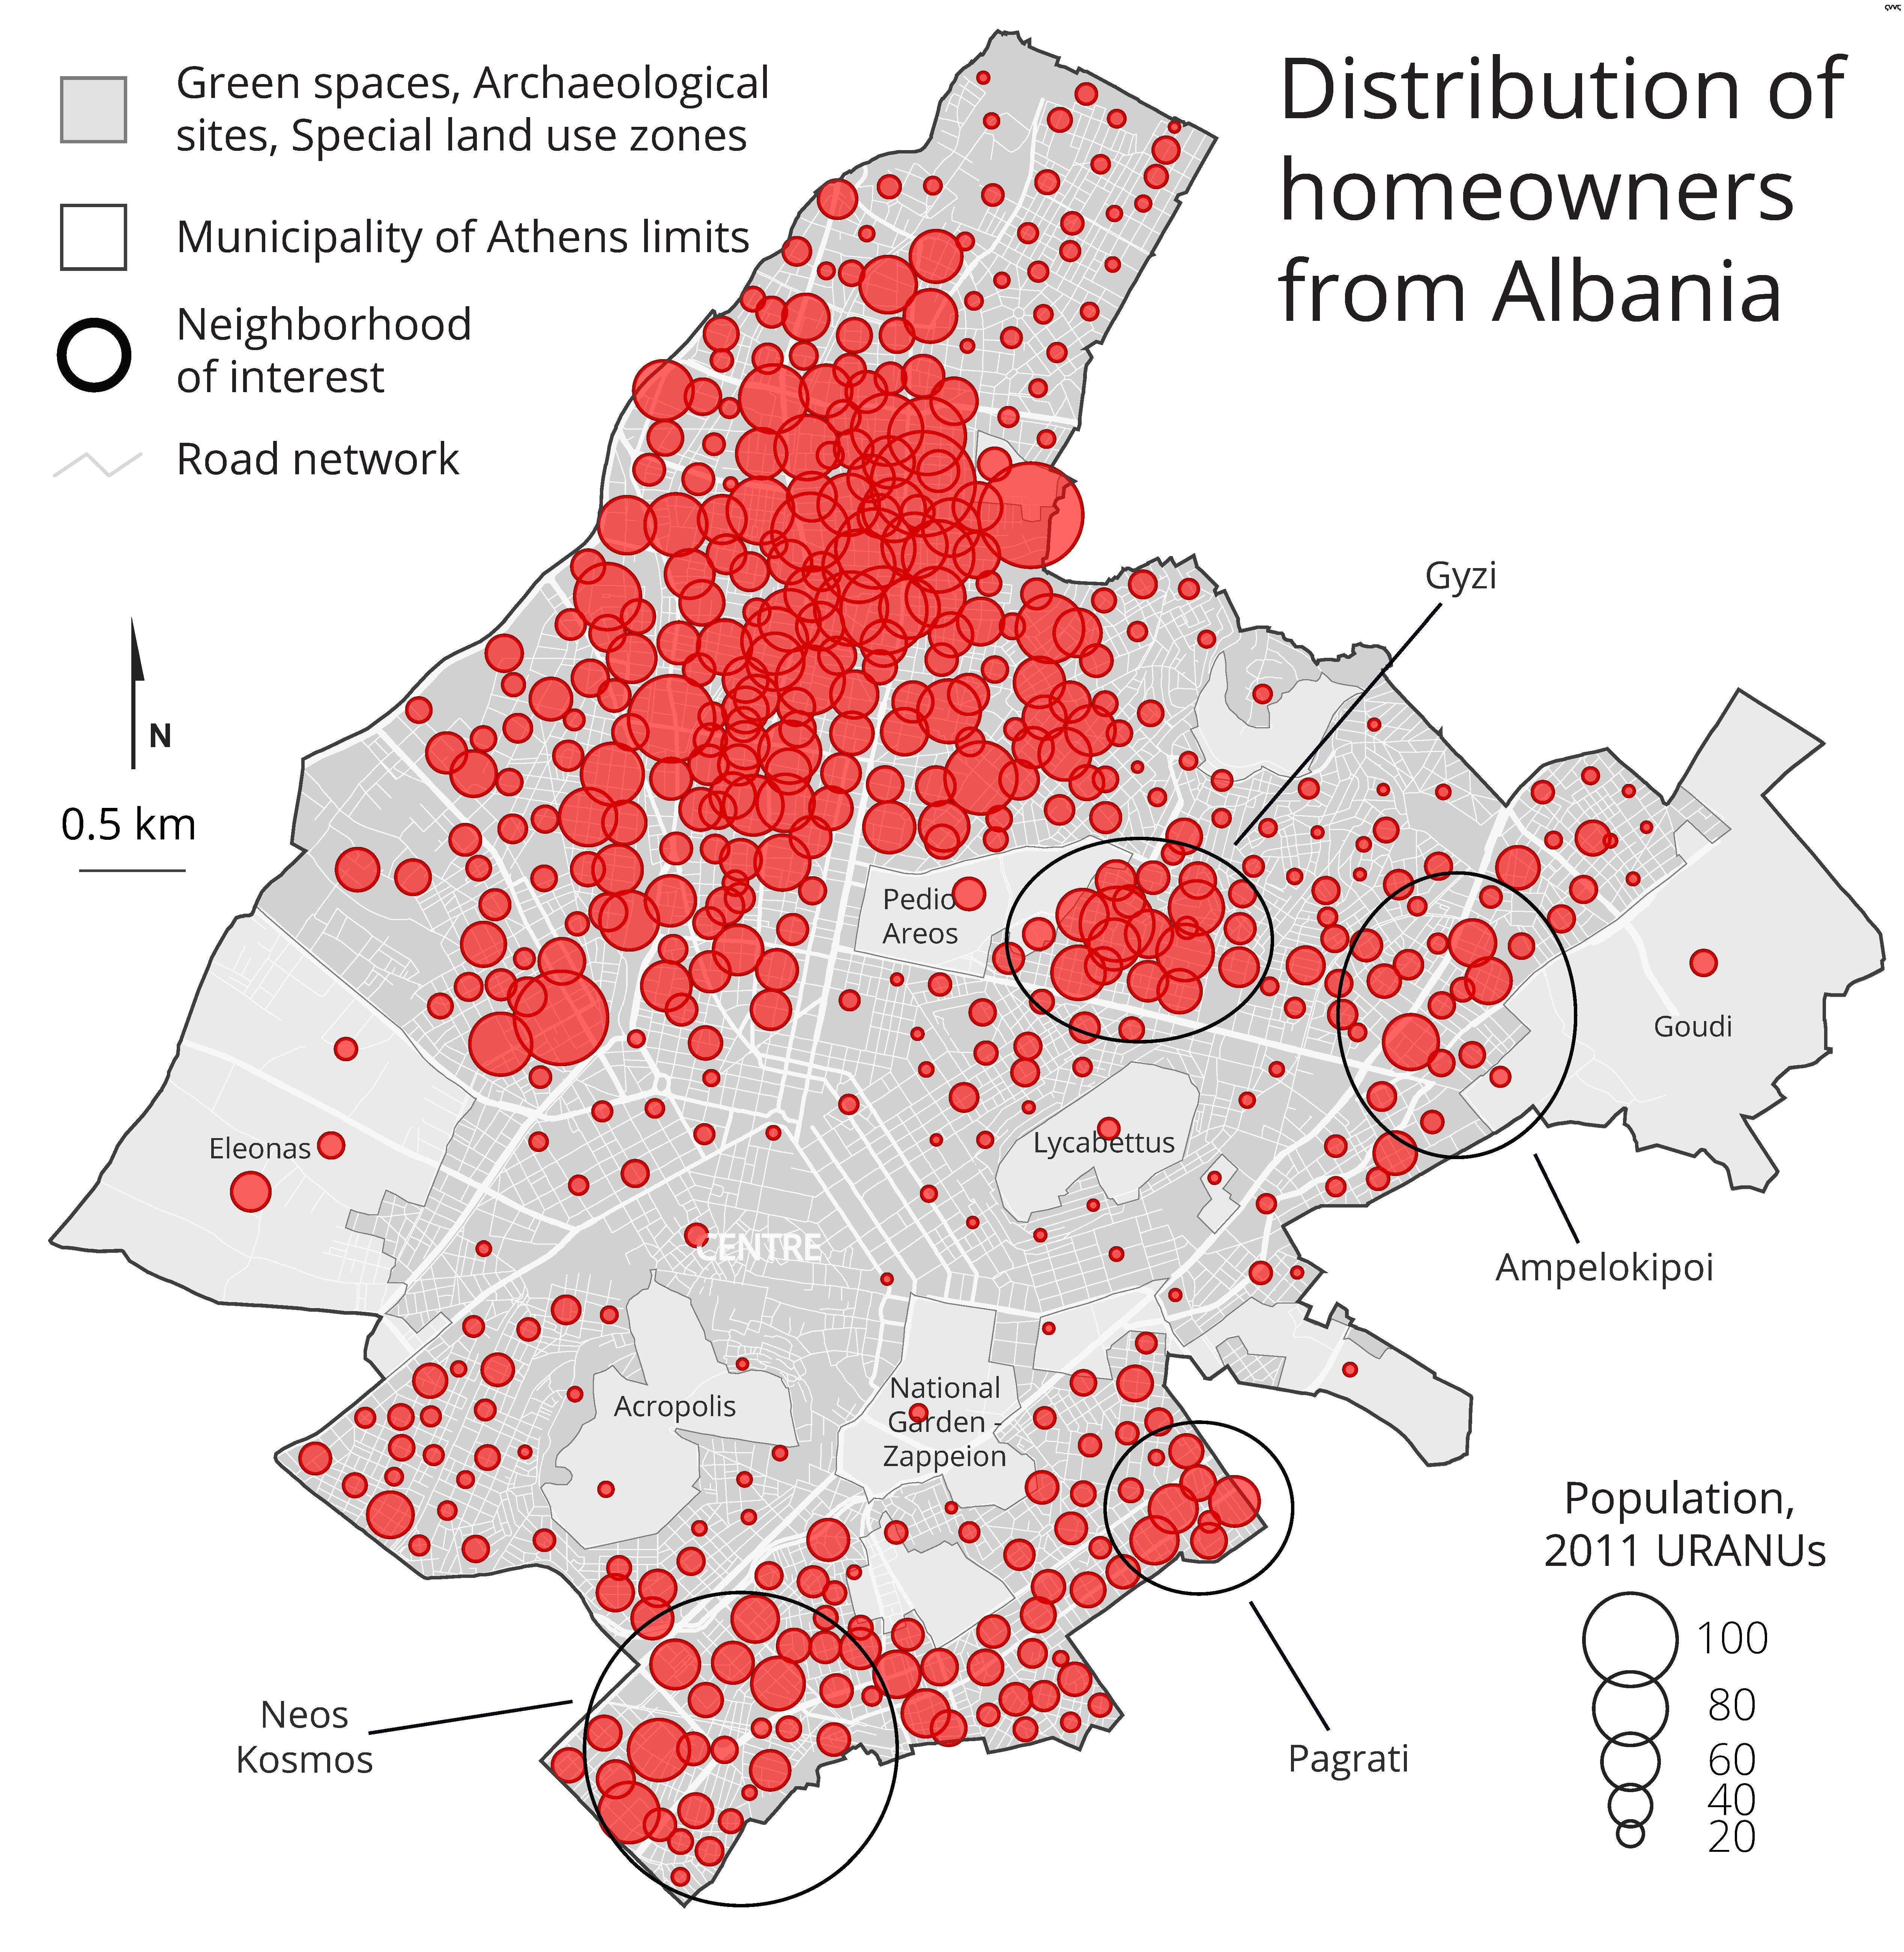
4.2. Urban Settlement of Albanian Immigrants in the Municipality of Athens: An “in-between” Situation

This part of our analysis seeks to reveal to what extent housing patterns and living conditions of Albanian immigrants differ from those of Greeks or other foreigners coming from developing countries.
The rental market remains the predominant housing solution for foreigners (Table 5). Across Europe, third-country national households are three times less likely to involve homeowners, especially in more recent destinations, such as Spain, Italy, and Greece, but also in long-standing destinations, such as Belgium [47]. Furthermore, researchers concerning the Global North have shown that renters are more precarious than homeowners in all the dimensions of housing precarity [48]. In Athens, access to ownership seems to be an important indicator of differentiation between Albanians and those coming from developing countries, since there are twice as many of the former.
As seen in Figure 3, homeowners from developing countries are concentrated in the northern part of the municipality, especially around the main vertical axis of Patission Street and the Metaxourgeio neighborhood, both ethnically mixed [14,20,49] and deprived areas [12,50].
Albanians are dispersed, spreading throughout the municipality (Figure 4). In order to map their distribution in the municipality of Athens, we calculated a location quotient (LQ). The LQ is estimated by comparing their presence in a given URANU to their average presence in the municipality of Athens. An LQ score below 1 indicates the under-representation of Albanians, in blue colors, and an LQ score above 1 indicates the over-representation of Albanians, in red colors, compared to their average presence in Athens. An LQ of 1 indicates that their presence is proportional to their contribution in the rest of the municipality.
Important under-representations can be traced; the most important are in the eastern city center (where residential space is limited) and the southern slopes of the Lycabettus Hill, i.e., the Kolonaki district, a traditional bourgeoise stronghold of the city. At the same time, some clusters are identified in densely built areas where the high-rise housing stock prevails—such as Ampelokipoi, Gyzi, and the northern part of Pangrati—or, to a lesser extent, around areas of mixed uses (housing and manufacture) such as Neos Kosmos. The latter show that, through their housing pathways, Albanians manage to avoid stigmatized neighborhoods, such as Metaxourgeio, where ethnically diverse populations tend to concentrate.
A similar pattern is observed concerning the Albanian homeowners (Figure 5). The dispersion of homeowners is linked to the earlier arrival of Albanian populations compared to immigrants of other origins (see Figure 3). Being around longer, Albanians probably had the opportunity to make their choices not only according to availability, but also based on other aspects of a given area/district, such as social or family networks, ethnic composition, or schooling quality. Thus, our main observation is that Albanian immigrants are to be found “in-between” Greeks and foreigners from developing countries. On the one hand, concerning homeownership, Albanians seem to follow similar strategies to those of the native population—a practice that differentiates this migratory group from the rest of foreign populations. On the other hand, concerning the quality of housing, Albanians follow the trends in other foreigners.
The high rates of homeownership among Greeks (67.6%) reveal the importance of owning a residence in Greek society. Albanians also appear to seek access to homeownership: one out of four Albanian households are homeowners, therefore embracing, to a certain extent, this strategy. The element of spatial dispersion corroborates this. Albanian populations are dispersed and, hence, spatially closer to Greeks.
The analysis shows that access to homeownership does not lead to better housing amenities, such as heating or insulation. Albanians seem to experience poorer housing conditions than Greeks. Therefore, the housing quality factor (see Table 6) seems to reduce their differentiation from other foreigners from developing countries. The age of the residence is also considered as a housing quality indicator for the purpose of our analysis. As already mentioned, most of the Athenian housing stock was produced between 1960 and 1980. The distribution of nationalities according to the age of the housing stock appears to be a factor leading to differentiation, even though immigrants reside in the prevailing residential constructions of the 1960s–1980s. Populations from developing countries show higher percentages in the older part of the stock (before 1960), while Greeks dominate the newest part of city dwellings. Albanians seem to be highly concentrated (76.5%) in the 1960–1980 stock, not having access to “newer“, post-1980 residencies, even though they score higher than the other groups, but also avoiding the oldest, and poorer, housing stock, scoring lower than the others. An important finding is that a clear differentiation between Albanian homeowners and tenants is observed. Albanians who had access to ownership seem to increase their numbers in post-1980 residences.
To cross-examine the spatial proximity and housing quality parameters between Albanians and other nationals, we took into consideration the mechanism of micro-segregation, especially of vertical segregation, for the needs of this analysis. We consider this parameter pivotal in understanding housing practices of Albanian populations. Residing in the same apartment building indicates spatial proximity, but residing on a different floor, in vertically segregated urban spaces, reveals social distance (Figure 6 and Figure 7) [23].
Foreigners from developing countries are over-represented on lower floors, scoring more than the average profile (14.5%) (Table 7). This stock of poorer quality, characterized by negative features such as a lack of sunlight, increased noise, poor ventilation, and smaller surface, is disadvantaged and less desirable. On the other hand, Greeks dominate the more advantaged higher floors (fourth floor and above). Albanians are over-represented on the middle floors (63.7%), therefore “avoiding”, once again, the apartments of poorer quality found on lower floors, where they score lower than the other groups. The fact that Albanians score lower on higher floors is directly linked to their dispersal. Two arguments could explain this finding: First, it may be because other groups are concentrated in disadvantaged areas with a homogeneous ethnic profile and where foreign citizens from developing economy countries are over-represented across all floors. Second, it may be because—as we have already demonstrated—there is an important demographic differentiation in the Eastern European migrant groups, with women prevailing. Often, these women are occupied as in-house cleaners and helpers or personal care workers; therefore, being recorded by the statistical bureau at the place of residence, they are found in the more advantaged housing stock. Specifically, 74.3% of women from EEnEU countries and 64.2% of women from EEEU countries, residing on upper floors, were employed in those sectors. Lastly, one could assume that the score of the other foreign citizens on upper floors could be linked to the presence of foreign tenants in the so-called doma rooms (Figure 8). It is impossible though to prove it through the data we dispose of. Doma, the old common laundry room, is a common space found on most of the polykatoikia buildings’ rooftops. These small rooms, with a complete absence of housing amenities, are not used anymore as such. Therefore, in some cases, they are rented to immigrants. Unavoidably, being on the rooftop, these spaces are recorded as “upper floors” in official statistics.
Albanians are dispersed around the municipality (see Figure 4) and, therefore, also found in areas of ethnic vertical segregation [14,20]. In those instances, Greeks and foreign citizens from developed economy countries are over-represented on upper floors, while foreign citizens from developing economy countries are over-represented on lower floors. As such, while they are spatially closer on the micro-scale, it is much more difficult, financially and socially, to have access to the advantaged higher floors. The differentiation between Albanian homeowners and tenants, concerning the housing quality, already mentioned earlier, is further explored. Homeowners tend to live on higher floors; only 9.7% own a lower-floor apartment. This shows that Albanian homeowners, residing longer in Athens and having adopted a long-term settlement pattern, have experienced social and residential mobility on the micro-scale.

4.3. Housing Pathways: Between Geographic Dispersal, Social Mobility, and Multiple Marginalities

The following section complements the above quantitative data, aiming to provide insights on the housing practices within the Athenian context, a context characterized by the so-called “segregation paradox” concerning SE cities, consisting of high levels of deprivation within a relatively low level of spatial separation [43]. To highlight micro-geographies in the city, this article presents insights of eight semi-structured interviews held in 2023 with Albanian immigrants that live and work in Athens, since the mid- and end of the 1990s.
The first finding of the qualitative analysis confirms that Albanian immigrants tend to settle, as tenants or owners, throughout the city, while their pathways indicate a social mobility. This “in-between” socio-spatial condition that they managed to achieve is evident in the narratives below:
Agni’s household, from Sarandë in Albania, settled in Athens in 1992. When she first arrived in Athens, she lived as a domestic housekeeper in Kolonaki, downtown Athens. Four years later, and since she got married, she said the following: “We needed to make money, then my son was born, and I needed help. We moved in with my husband’s parents in a one-bedroom house in Koropi. The four of us worked a lot, we had few expenses. We indeed made money and moved a few years later [in 2001] to our own apartment in Glyka Nera, but always with my parents-in-law under the same roof” (HS.INT.02). All three locations Agni mentions in her interview indicate a wider radius of choice of abode in the general metropolitan area of Athens, decided by the family with the purpose of long-term settlement, one synonymous with an upward social mobility trajectory. The relevant literature concerning Albanians’ settlement in SE cities suggests that Albanian immigrants do not choose specific neighborhoods, thus composing “invisible” housing pathways. Geographically, they are settling in a dispersed way, following the so-called “Albanian assimilation paradox”. An urban pattern that can be found in most SE metropolises is where immigrants’ urban self-settlement is not related to specific national or local public policies, but primarily the outcome of family or personal strategies of a long-term settlement [37,51,52].
The next case shows a gradual improvement in housing conditions, mostly during the years before the economic crisis of 2010. Vasiliki arrived from Fieri to Athens in 1998, with her husband and young daughter. After four months of sharing a home with the family of her husband’s brother, a two-bedroom apartment in Plateia Koliatsou, they rented their own apartment in the same area. She said the following: “We could only afford a basement; we stayed there for three and a half years, and my second daughter was born there. We needed to move, my children often got sick, it was too humid” (HS.INT.08). A few months later, the household moved to the second floor of the same building as tenants for four years. Then, in 2005, they managed to buy an apartment. “We decided that we were not going to go back [to Albania]. With the money we managed to put aside and by taking out a loan, we bought a two-bedroom apartment in Agios Eleftherios. The area was much nicer [than Plateia Koliatsou], the schools were better. Everything we did was for our children” (HS.INT.08). Vasiliki describes the gradual improvement in her household’s housing conditions in terms of floors occupied (from the basement to the second floor), in terms of occupational status (from sharing an apartment with relatives, to becoming tenant and then homeowner), and in terms of the areas chosen: from Plateia Koliatsou, a very central and downgraded area, to Agios Eleftherios, again a central area which represents better living conditions and a better access to schooling, but still considered disadvantaged. Let us underline that the above “successful” housing pathway of Vasiliki’s family, as recorded in other cases of this research, would become compromised a few years later, due to the economic recession of 2010.
Two main observations may be extracted from the above narratives. Firstly, the “invisible” practices of urban settlement—“invisible” vis-à-vis districts of immigrants’ presence—for both households are typical of a migration project aiming at long-term settlement. What seems particularly crucial is that decisions are mostly taken “collectively” within a context of strong family and social networks that shape decisions concerning housing. Secondly, both cases are characteristic of the “in-between” housing pathways of Albanian immigrants, as described by the above quantitative data and the relevant literature.
The second finding is related to the marginalities that also contributed to the shaping of precarious housing pathways of the Albanian immigration in Athens. The interview held with Afroditi, from Shkodër, Albania, who migrated to Athens with her husband and two children, without the help of their close family members, is indicative of the very harsh conditions that this household—as many others—had to cope with and are still facing in the housing market. In fact, Afroditi’s family was obliged to leave their apartment and rent a new one during those challenging times. “We had nothing, no furnishing, no food, nothing. My son brought a mattress where my daughter and her child slept, while he slept on the floor. The neighbors helped a lot, bringing milk and cookies to our door. We stayed there for eight years. Then we moved to a building in Kypseli. We were much better there, on the second floor. In 2009 we moved again in the same area. But in 2020 [during the pandemic], the owner asked me to leave; he wanted to rent the apartment as an Airbnb. My husband was sick, and I asked the landlord to give us some extra time. A few months later, we moved [within the same area] to an apartment that was in an extremely bad condition— everything was broken inside. We are still living there” (HS.INT.07).
Eleni’s narrative highlighted the issue of racism and marginality as well: “In 2005 we were living in Nea Ionia [with her parents], in a very small and inconvenient apartment. I could not invite a friend; I was truly ashamed. So, we found another apartment in the area. It was located on the sixth floor, had a nice balcony and was sunny [...]. We paid the owner six-months’ rent in advance, we cleaned the whole apartment and started packing. Then, he accused us of giving him counterfeit money and told us he had found a more reliable tenant. I knew all this happened because we were foreigners” (HS.INT.01).
The above narratives indicate that, within a context of very scarce housing policies, immigrants’ housing settlement does not always follow a linear pathway of gradual improvement [42,53,54]. On the contrary, housing pathways are characterized by precarity, often changing and fluctuating, while remaining fragile in front of multiple crises. Indeed, the economic crisis of 2010 affected the housing condition for the majority of our interviewees. Monthly rents or banking loans were paid with extreme difficulty due to high unemployment rates, mostly for Albanian men working in the construction sector.
Apart from the well-known effects of the economic recession of 2010s, recent trends in the housing market have intensified migrants’ marginalities in the housing sector [55]. As noted in Afroditi’s narrative, the progressive financialization of the housing market and the expansion of short-term vs. long-term rentals produce new limitations [6,56]. Those marginalities, while they do not only affect migrant households, become much more obvious if one takes into account the racism experienced by immigrants in the everyday spaces of the city, as stated in Eleni’s interview (HS.INT.01).
A third finding of the qualitative research is related to the access of Albanian immigrants to homeownership, a finding that also became evident from the quantitative analysis indicating that, in 2011, almost one out of four Albanian households in Athens has managed to buy a property. Of the eight participants in our study, six of them managed to buy an apartment. Anna’s household, from Berat, managed to buy an apartment in Pankrati: “We bought our apartment in 2006. It was my personal goal to have my own home. Since we got married, even in Albania, we did not have our own home; I wanted to buy property [...]. We took out a loan from OEK [Workers’ Housing Organization] with a banking rate of 0.25%. In 15 years, we returned the money and, since I was paying [the loan instalments] regularly, I also got a refund. The loan was in my husband’s name, since he was the one having ‘declared’ work.” Vasiliki, from Fier, says: “In 2005 we bought an apartment in Agios Eleftherios district. The cash we had saved wasn’t enough. So, we took out a loan. We paid €70,000 in cash and the rest was given to us by the bank. Since we decided with my husband that we were not going back [to Albania], we decided to buy. We both worked very hard. In 2010–2012, the interest rate increased, and we really had difficulty paying the loan back. It took us until 2022 to repay all the money”. Two of our interviewees used a successful policy that was most often implemented in the beginning of the 2000s by the Worker’s Housing Organization (OEK, abolished in 2012), which offered fixed-interest mortgages provided stable banking rates for buying an apartment. Immigrants with documents proving that they declared tax and paid insurance contributions were also eligible. It is thus obvious that policies that aim to reinforce immigrants’ access to housing are crucial for facilitating access to homeownership, which is recognized as a core integration indicator at the EU level, since the acquisition of property is seen as a sign of upward social mobility and long-term settlement [47].
At the same time, it is crucial to underline that access to homeownership is also beneficial for the host society, since immigrants’ investment revitalizes the existing building stock in central, and usually degraded, urban districts [54,57].

5. Discussion

The Athenian housing market has undergone a transformation in the last two decades, compared to the postwar period where the intense urbanization processes gave access to affordable housing for large segments of the population. As presented in the contextual section, the mechanism of antiparochi produced a largely homogenous socio-spatial setting in Athens’ central neighborhoods. This mechanism created the conditions for interethnic coexistence and the settlement of immigrants near non-immigrant households. Currently, the increasing commodification of housing, also evident in the socially and ethnically mixed areas of Athens, seems to be affecting the self-settlement practices of immigrants. This is a newly emergent issue concerning Athens’s socio-spatial transformations, which requires further empirical research through a pluridisciplinary geographic approach.
Concerning macroeconomic figures, IMF [58] in its 2024 Country Report underlines the acute price increase, exceeding 35% since 2017, putting forth the “emerging vulnerabilities in the real estate and household sectors”. In 2023, the Bank of Greece [59], in its published data on residential property prices, estimates a 13% increase in Athens. This increase was still ongoing during the first third of 2024 (9.4%).
The growing demand for real estate is partially linked to the increase in foreign investments. Specifically, the foreign capital invested in the Greek market, through the Golden Visa investment attraction policy, is estimated at EUR 5.5 billion, with more than 22,298 issued residence permits [60]. At the same time, the increase in residential rental prices is estimated at 30% [25], which, in a macroeconomic context of strong inflationary pressures (5.3% in 2023) [61], has amplified the inequality trends. It is thus obvious why the housing cost overburden rate in Greece is estimated at 32.4% [62] for 2021, the highest among the EU-27 members.
The relevant literature on SE cities, and Athens in particular, also underlines the impact of short-term rental (henceforth STR) expansion in a changing socio-spatial landscape. Pettas et al. observe that, between 2014 and 2022, approximately 33,900 housing units entered the Airbnb platform [3]. This “unavailability” of what was, until recently, an affordable and accessible apartment stock for rental purposes creates tensions over residential central areas, where the ethnic population is over-represented. Through the STR mechanism, downtown areas that were previously designated as “non-gentrifiable” are changing [46]. Finally, although the construction sector is flourishing, the increase in supply has not led to a decline in prices, probably because the newly constructed dwellings target higher-income investors.
Today, for the first time, affordable housing is at the center of the political agenda. While several policies or ad hoc support programs funded by the Greek state or the EU are being implemented, their impact on those in need seems to be limited. The above challenges formulate a complementary research question: how do recent real-estate developments undermine immigrants’ access to housing? This question could be addressed through further secondary and field research. First, new insights could emerge through the comparative analysis of the 2021 census data concerning the 2011–2021 decade, a decade that was marked by the financialization of the Athenian real-estate market. Moreover, interviews with key actors, such as real-estate agencies, Airbnb hosts, and other professionals related to the STR market, as well as complementary interviews with residents living in Athens’s socially and ethnically mixed neighborhoods, would allow a better understanding of immigrants’ housing practices in this context.

6. Conclusions

Albanian immigrants have been (self-)settling in Athens’s metropolitan area since the 1990s, following personal or family practices of adaptation to the particular Athenian context: a SE metropolitan area, characterized by the so-called “segregation paradox”, consisting of high levels of deprivation within a relatively low level of spatial separation [43]. Moreover, as has been largely discussed in the literature, their urban settlement did not benefit from housing policies. Even though they progressively experienced social mobility, the Albanian population remained vulnerable to the socioeconomic changes that ensued. Hence, the economic recession of 2010 must be considered another key contextual factor. It strongly affected the social and urban settlement of Albanian immigration in Athens, producing high unemployment rates and interrupting the “successful” settlement pathways that were previously underway [31].
This analysis led to the verification of the “in-between” hypothesis at different levels. First, we have demonstrated that Albanians follow different spatial patterns compared with both Greeks and other foreigners. Then, we explored the differences that occur in their sociodemographic profile, revealing important indications of intergenerational mobility. A third point concerns the residential strategies, underlining traces of residential mobility, expressed on the micro-scale, concerning mainly those with access to homeownership. Lastly, the quantitative analysis verifies the hypothesis of the invisible Albanian housing pathways, the improvement in housing conditions, the spatial dispersion, and the vulnerability towards the socioeconomic changes.
This article combined a mixed methodological approach to investigate segregation patterns and housing practices on the micro-scale of Athens’s central neighborhoods. Using the data of the national census of 2011, this analysis first presented the average profile of ethnic groups in Athens, examining their demographic and educational characteristics, as well as the main employment sectors in which they are absorbed. The results demonstrate that Albanians stand in an “in-between” situation among Greeks and the other third-country nationals that were studied—namely, those from countries of Eastern Europe that have not acceded to the EU, those from countries of Eastern Europe that acceded to the EU, and those originating from countries of the Indian peninsula.
Concerning educational attainment, Albanians—as the rest of the Europeans—are differentiated to the populations from the Indian peninsula. Regarding the general demographic profile, Albanians are differentiated to the other ethnic groups, scoring higher at young ages and lower at older ages, while showing an impressive gender equilibrium. Finally, concerning their occupation, they tend to occupy lower, unskilled, and semi-skilled positions. A key finding in this context is the important intergenerational differentiations regarding (i) unemployment rates for first-time job seekers (lower levels of unemployment for the second generation of Albanians) and (ii) the most popular professional specialization (sales and services for the 16–29-year-old cohort, domestic and construction sector for the 30–50-year-old cohort).
Concerning immigrants’ access to housing, Albanians are much closer to the native population—an aspect which differentiates this migratory group from the rest of the foreign populations—seeking access to homeownership. The spatial analysis reveals the dispersed geographical settlement of Albanians in Athens and demonstrates the avoidance of the stigmatized downtown neighborhoods, where an ethnically diverse population is mostly concentrated. A crucial finding relates to the living standards within the Athenian urban context, as Albanians seem to experience poorer housing conditions than Greeks.
Moreover, our analysis attempted to investigate the vertical segregation pattern by cross-examining spatial proximity with housing quality parameters. Foreigners from developing countries are over-represented on lower floors, scoring more than the average profile (14.5%). This lower-quality stock, characterized by negative features such as a lack of sunlight, increased noise, poor ventilation, and smaller surface, is considered disadvantaged and less desirable. On the other hand, Greeks dominate the more advantaged higher floors (fourth floor and above). Albanians are over-represented on middle floors (63.7%), therefore avoiding, once again, the poorer-quality apartments found on lower floors. The analysis revealed traces of upward residential mobility among Albanian homeowners. Those who had access to ownership tend to invest, more than 90% of them, in middle or upper floors, and in newer apartments, 23% of homeowners reside in buildings constructed after the 1980s.
The qualitative material examined in this study is indicative of the fluctuations that have been shaping Albanians’ socio-spatial settlement in Athens. It revealed vulnerabilities concerning the access to decent housing and showed how immigrants’ urban settlement does not always follow a gradual improvement scheme.
According to our data, during the first months following their arrival, most of our interviewees resided temporally with relatives in rented apartments. The broader family networks seemed decisive during this initial phase. The economic development from the end of the 1990s until the mid-2000s generated considerable incomes and provided the opportunity for an upward residential mobility either to rented apartments with improved amenities compared to the previous one, or to homeownership within Athens’s socially and ethnically mixed urban space. These “successful” and linear housing pathways are clearly depicted in the 2011 census data. Instead, the qualitative material collected in 2023, a decade after the outburst of the economic recession and at the end of the COVID-19 pandemic, brings into question the current validity of the 2011 findings. In fact, the interviews highlight that not only have those “successful” housing pathways still not recovered, but new, additional challenges have also emerged. These challenges are related to the ongoing increase in rent prices and the intense touristification of Athens’s downtown areas, which directly affect the self-settlement practices of immigrants.

Author Contributions

Conceptualization, I.P. and S.N.S.; methodology, I.P. and S.N.S.; formal analysis, I.P. and S.N.S.; data curation, I.P. and S.N.S.; writing—original draft preparation, I.P. and S.N.S.; writing—review and editing, I.P. and S.N.S.; visualization, S.N.S. All authors have read and agreed to the published version of the manuscript.

Funding

As part of the Horizon 2020 project ITHACA—Interconnecting Histories and Archives for Migrant Agency: Entangled Narratives Across Europe and the Mediterranean Region, this research was funded by the European Union’s Horizon 2020 research and innovation program under grant agreement No. 101004539.

Data Availability Statement

The datasets concerning the 2011 census can be directly accessed at the Panorama of the Greek Census Data (https://panorama.statistics.gr/en/, accessed on 3 November 2023).

Acknowledgments

We thank Evgenia Bournova, scientific coordinator of the NKUA team; and Myrto Dimitropoulou for the overall coordination of the NKUA team, partner of the ITHACA research project. Moreover, we thank Nefeli Stournara for her participation with the organization of the ITHACAs’ Policy Council Events and the collection of the semi-structured interviews that were used for the needs of this analysis.

Conflicts of Interest

The authors declare no conflicts of interest. The funders had no role in the design of the study; in the collection, analyses, or interpretation of data; in the writing of the manuscript; or in the decision to publish the results.

Appendix A

Table A1. List of interviews and informal meetings with experts (representatives of Greek NGOs, communities, forums, academics, and experts in the field of migration and refugees).
Code IDRole/FunctionPlace of MeetingDate of Meeting
EX.INT.01Professor, Aleksander Moisiu UniversityOnline (Durrës)19 April 2022
EX.INT.02Professor, University of Western AtticaOnline (Athens)10 March 2023
EX.INT.03Postdoctoral Researcher, Aegean UniversityAthens2 June 2022
EX.INT.04Member of an Albanian association in AthensOnline (Athens)3 March 2023
EX.INT.05Member of the Greek Forum for MigrantsOnline (Athens)13 July 2022
Table A2. List of Council Policy Events (CPEs).
TitlePlace of
Meeting
ParticipantsDate of
Meeting
Local Policy Council Event. Media representations and self-representation of migrants in COVID-19 Times.Online
(Athens)
ACCMR, Municipality of Athens, IOM, NGO Intersos, NGO Babel, NGO Nostos, NGO Praxis, Greek Council for Refugees, Greek Forum of Migrants, Migrant Intercultural, Mediator Integration Centers, National Kapodistrian University of Athens (NKUA)18 February 2022
National Policy Council Event. Media representations and self-representations ofmigrants in COVID-19 Times.Online
(Athens)
ACCMR, Migrant Intercultural, Mediator Integration Centers, IOM, Greek Council for Refugees, Migrants’ Integration Center (M.I.C) in the Municipality of Athens, Greek Organization of Public Health (EODY), NGO NOSTOS, NGO PRAXIS, Médecins sans Frontières (MSF)11 March 2022
Training session. “How the Ngos can become active protagonists of the collection and preservation of migrants’ narratives”Athens, NKUA, Department of EconomicsCentre for Asia Minor Studies, Institute of Historical, Research of the National Hellenic Research Foundation (IHR/NHRF), Greek Forum of refugees, NGO Babel, Greek Forum of migrants, Sams-USA, University of West Attica, National Centre for Social Research (EKKE)29–30 September 2023
Local Policy Council Event. Acted, narrated, deconstructed: how research may influence European migration policies.Online
(Athens)
University of Cyprus, UNHCR, Migrants’ Integration Center (M.I.C) in the Municipality of Athens, Federation of Albanian Associations in Greece3 March 2023
National Policy Council Event. Acted, narrated, deconstructed: how research may influence European migration policies.Online
(Athens)
Federation of Albanian Associations in Greece, Ministry of Migration & Asylum, Greek Forum of refugees, University of West Attica10 March 2023
Table A3. List and composition of interviewed households.
Code IDHousehold Composition during the Day of the Interview—Present MembersDate of Birth of the Principal Household Informant)Year of the Household Settlement in GreecePlace and Date of Interview
HS.INT.01
(Eleni)
4 members: husband, wife, wife’s father, and daughter19791997Athens,
8 March 2023
HS.INT.02
(Agni)
5 members: husband, wife, husband’s mother, two sons19721992Athens,
3 April 2023
HS.INT.03
(Mari)
4 members: husband, wife, two sons19651995Athens,
5 April 2023
HS.INT.04
(Irini)
4 members: husband, wife, daughter, son19801998Athens,
5 April 2023
HS.INT.05
(Liza)
3 members: husband, wife, son19701995Athens,
5 April 2023
HS.INT.06
(Zoe)
4 members: husband, wife, daughter, son19781997Athens,
10 April 2023
HS.INT.07
(Afroditi)
3 members: husband, wife, son19491993Athens,
10 April 2023
HS.INT.08
(Vasiliki)
4 members: husband, wife, two daughters19711998Athens,
3 April 2023

Notes

1. 
For the 1998 and 2001 legalization procedures, see [38].
2. 
The distinction between developed and developing countries was made according to the UN’s Human Development Index [44] (127–130). http://www.undp.org/content/undp/en/home/librarypage/hdr/human_developmentreport2011.html (accessed on 22 June 2024).
3. 
These units are a modified version of the 2011 Census Tracts (CTs) produced by the Panorama of Greek Census Data 1991–2011 team to bypass confidentiality issues in sparsely populated Census Tracts. The metropolitan area comprises 3000 URANUs with an average population of 1250, and the municipality of Athens comprises 494 URANUs with an average population of 1330.
4. 
It is critical to underline that while the informants were female members of the aforementioned NGO, the questionnaire used—designed specifically for the needs of the ITHACA program—collects information about the households as a whole. As a result, this policy paper observes the issue of household integration, not focusing especially on women’s housing integration experience.

References

  1. Musterd, S. Social and Ethnic Segregation in Europe: Levels, Causes, and Effects. J. Urban Aff. 2005, 27, 331–348. [Google Scholar] [CrossRef]
  2. Arbaci, S. (Re)Viewing Ethnic Residential Segregation in Southern European Cities: Housing and Urban Regimes as Mechanisms of Marginalisation. Hous. Stud. 2008, 23, 589–613. [Google Scholar] [CrossRef]
  3. Pettas, D.; Avdikos, V.; Papageorgiou, A. Platform—Driven housing commodification, financialisation and gentrification in Athens. J. Hous. Built Environ. 2024. [Google Scholar] [CrossRef]
  4. Maloutas, T.; Siatitsa, D.; Balampanidis, D. Access to Housing and Social Inclusion in a Post-Crisis Era: Contextualizing Recent Trends in the City of Athens. Soc. Incl. 2020, 8, 5–15. [Google Scholar] [CrossRef]
  5. Dimitrakou, I. Vacancy, Access to Housing and Micro-segregation. Bull. De Corresp. Hellénique Mod. Et Contemp. 2022, 43–66. [Google Scholar] [CrossRef]
  6. Balampanidis, D.; Maloutas, T.; Papatzani, E.; Pettas, D. Informal urban regeneration as a way out of the crisis? Airbnb in Athens and its effects on space and society. Urban Res. Pract. 2021, 14, 223–242. [Google Scholar] [CrossRef]
  7. Emmanuel, D. Socio-economic inequalities and housing in Athens: Impacts of the monetary revolution of the 1990s. Greek Rev. Soc. Res. 2004, 113, 121–143. [Google Scholar] [CrossRef]
  8. Cavounidis, J. Migration and the Economic and Social Landscape of Greece. South-East. Eur. J. Econ. 2013, 11, 59–78. [Google Scholar]
  9. Gemi, E. Transnational practices of Albanian families during the Greek crisis: Unemployment, de-regularization and return. Int. Rev. Sociol. 2014, 24, 406–421. [Google Scholar] [CrossRef]
  10. Gropas, R.; Triandafyllidou, A. Migrants and Political Life in Greece: Between Political Patronage and the Search for Inclusion. South Eur. Soc. Politics 2012, 17, 45–63. [Google Scholar] [CrossRef]
  11. Kandylis, G.; Maloutas, T. From Laissez-Faire to the Camp: Immigration and the Changing Models of Affordable Housing Provision in Athens. In New Developments in Southern European Housing after the Crisis; Pisa University Press: Pisa, Italy, 2017. [Google Scholar]
  12. Karadimitriou, N.; Maloutas, T.; Arapoglou, V.P. Multiple Deprivation and Urban Development in Athens, Greece: Spatial Trends and the Role of Access to Housing. Land 2021, 10, 290. [Google Scholar] [CrossRef]
  13. Emmanuel, D. The Greek System of Home Ownership and the Post-2008 Crisis in Athens. Région Et Développement 2014, 39, 167–182. [Google Scholar]
  14. Arapoglou, V.P.; Spyrellis, S.N. Arrival Infrastructures: Segregation of Displaced Migrants and Processes of Urban Change in Athens. Geographies 2024, 4, 182–202. [Google Scholar] [CrossRef]
  15. Papatzani, E.; Psallidaki, T.; Kandylis, G.; Micha, I. Multiple geographies of precarity: Accommodation policies for asylum seekers in metropolitan Athens, Greece. Eur. Urban Reg. Stud. 2021, 29, 189–203. [Google Scholar] [CrossRef]
  16. Kourachanis, N. From camps to social integration? Social housing interventions for asylum seekers in Greece. Int. J. Sociol. Soc. Policy 2019, 39, 221–234. [Google Scholar] [CrossRef]
  17. Dimitrakou, I.; Balampanidis, D.; Myofa, N.; Polyzou, I.; Siatitsa, D.; Spyrellis, S.N.; Vakalopoulos, K. Micro-Segregation and Coexistence in Athens: The Debate on Segregation and Its Implications for Urban Research. In Cities. Micro-Segregation, Social Mix and Urban Housing Markets; Maloutas, T., Karadimitiriou, N., Eds.; Edward Elgar Publishing: Cheltenham, UK, 2022; pp. 73–87. [Google Scholar]
  18. Leontidou, L. The Mediterranean City in Transition: Social Change and Urban Development; Cambridge University Press: Cambridge, UK, 1990; ISBN 9780521344678. [Google Scholar]
  19. Maloutas, T.; Karadimitriou, N. Vertical Social Differentiation in Athens: Alternative or Complement to Community Segregation? Int. J. Urban Reg. Res. 2001, 25, 699–716. [Google Scholar] [CrossRef] [PubMed]
  20. Maloutas, T.; Spyrellis, S.N. Vertical segregation: Mapping the vertical social stratification of residents in Athenian apartment buildings. Méditerranée 2016, 127, 27–36. [Google Scholar] [CrossRef]
  21. Mantouvalou, M.; Mavridou, M.; Vaiou, D. Processes of social integration and Urban development in Greece: Southern challenges to European unification. Eur. Plan. Stud. 1995, 3, 189–204. [Google Scholar] [CrossRef]
  22. Maloutas, T.; Spyrellis, S.N.; Karadimitriou, N. Measuring and Mapping Vertical Segregation in Athens. In Vertical Cities. Micro-segregation, Social Mix and Urban Housing Markets; Maloutas, T., Karadimitriou, N., Eds.; Edward Elgar Publishing: Cheltenham, UK, 2022; pp. 88–99. [Google Scholar]
  23. Maloutas, T. The role of vertical segregation in urban social processes. Nat. Cities 2024, 1, 185–193. [Google Scholar] [CrossRef]
  24. Maloutas, T.; Karadimitriou, N. Introduction to Vertical Cities: Urban Micro-Segregation, Housing Markets and Social Reproduction. In Vertical Cities. Micro-segregation, Social Mix and Urban Housing Markets; Maloutas, T., Karadimitriou, N., Eds.; Edward Elgar Publishing: Cheltenham, UK, 2022; pp. 1–21. [Google Scholar]
  25. Veneti, A.; Poulakidakos, S.; Minotakis, A. Rents—ETERON Housing 360°; ETERON: Athens, Greece, 2022. [Google Scholar]
  26. Alexandri, G. Housing financialisation a la Griega. Geoforum 2022, 136, 68–79. [Google Scholar] [CrossRef]
  27. Myofa, N. Social Housing Estates in Athens. In Athens Social Atlas. Digital Compendium of Texts and Visual Material; Maloutas, T., Spyrellis, S., Eds.; Athens Social Atlas: Athens, Greece, 2021. [Google Scholar] [CrossRef]
  28. Kandylis, G.; Maloutas, T.; Myofa, N. Exceptional Social Housing in a Residual Welfare State: Housing Estates in Athens, Greece. In Housing Estates in Europe; Hess, D.B., Tammaru, T., van Ham, M., Eds.; Springer International Publishing: Cham, Switzerland, 2018. [Google Scholar]
  29. Kerpaci, K.; Kuka, M. The Greek Debt Crisis and Albanian Return Migration. J. Balk. Near East. Stud. 2019, 21, 104–119. [Google Scholar] [CrossRef]
  30. Triantis, L. Spatial Planing, Institutional Refroms and Globalization. In Policies of International Development during the Post-Socialist Transition in Albania (in Greek); Nissos Academic Publishing: Athens, Greece, 2022. [Google Scholar]
  31. Triantafyllidou, A.; Maroukis, T. Migration in Greece in the 21st Century (in Greek); Kritiki: Athens, Greece, 2010. [Google Scholar]
  32. Labrianidis, L.; Hatziprokopiou, P. The Albanian Migratory Cycle. Migrants Tend to Return to Their Country of Origin after All. In The New Albanian Migration; King, R., Mai, N., Schwandner-Sievers, S., Eds.; Sassex Academic Press: Brighton, UK, 2005; pp. 93–118. [Google Scholar]
  33. de Rapper, G. Better than Muslims, Not as Good as Greeks. Emigration as Experienced and Imagined by the Albanian Christians of Lunxhëri. In The New Albanian Migration; King, R., Mai, N., Schwandner-Sievers, S., Eds.; Sussex Academic Press: Brighton, UK, 2005; pp. 173–194. [Google Scholar]
  34. Korovilas, J.P. The Albanian Economy in Transition: The Role of Remittances and Pyramid Investment Schemes. Post-Communist Econ. 1999, 11, 399–415. [Google Scholar] [CrossRef]
  35. EKKE (National Centre for Social Research)—ELSTAT (Hellenic Statistical Authority) Panorama of Greek Census Data 1991–2011. Internet Application to Access and Map Census Data 2015. Available online: https://panorama.statistics.gr/en/ (accessed on 3 November 2023).
  36. Papadopoulos, A.; Fratsea, L.M.; Spyrellis, S.; Baltas, P. Exploring Migrant Labour Contribution in Greek Agriculture Exploring Migrant Labour Contribution in Greek Agriculture. Ital. Rev. Agric. Econ. 2021, 76, 33–48. [Google Scholar]
  37. King, R.; Vullnetari, J. A population on the move: Migration and gender relations in Albania. Camb. J. Reg. Econ. Soc. 2012, 5, 207–220. [Google Scholar] [CrossRef]
  38. Fakiolas, R. Regularising undocumented immigrants in Greece: Procedures and effects. J. Ethn. Migr. Stud. 2003, 29, 535–561. [Google Scholar] [CrossRef]
  39. ELSTAT (Hellenic Statistical Authority). The Results of the Census, Population and Residences 2021; Hellenic Statistical Authority: Athens, Greece, 2023. (In Greek) [Google Scholar]
  40. Mavrommatis, G. Nativism and second-generation migrants in Greece: Differentiating between ethnic and civic elements of citizenship. Ethn. Racial Stud. 2022, 45, 2289–2308. [Google Scholar] [CrossRef]
  41. Kasimis, C.; Papadopoulos, A.G.; Zografakis, S. The Precarious Status of Migrant Labour in Greece: Evidence from Rural Areas. In The New Social Division; Della Porta, D., Hanninen, S., Siisiainen, M., Silvasti, T., Eds.; Palgrave Macmillan: London, UK, 2015; pp. 101–119. [Google Scholar]
  42. Vaiou, D. In the Interstices of the City: Albanian Women in Athens. Espace Popul. Soc. 2002, 3, 373–385. [Google Scholar] [CrossRef]
  43. Arbaci, S. Paradoxes of Segregation; Wiley: Hoboken, NJ, USA, 2019; ISBN 9781444338324. [Google Scholar]
  44. UNDP Human Development Report 2011. Sustainability and Equity: A Better Future for All; UNDP: New York, NY, USA, 2011. [Google Scholar]
  45. Thomson, A. Moving Stories: Oral History and Migration Studies. Migration 1999, 27, 24–37. [Google Scholar]
  46. Maloutas, T. The Social Geography of Athens; Alexandria: Athens, Greece, 2018. (In Greek) [Google Scholar]
  47. European Commission. Immigrant Housing in Europe: Overview; European Commission: Luxembourg, 2016. [Google Scholar]
  48. Debrunner, G.; Hofer, K.; Wicki, M.; Kauer, F.; Kaufmann, D. Housing Precarity in Six European and North American Cities: Threatened by the Loss of a Safe, Stable, and Affordable Home. J. Am. Plan. Assoc. 2024, 1–17. [Google Scholar] [CrossRef]
  49. Polyzou, I. Invest the city by doing businesses: Geographies of migrant entrepreneurs in the center of Athens. Greek Rev. Soc. Res. 2020, 153, 61. [Google Scholar] [CrossRef]
  50. Karadimitriou, N.; Spyrellis, S.N. Measuring Deprivation and Micro-Segregation in Greek ITI SUD: Time to Apply a Common Method? Land 2024, 13, 552. [Google Scholar] [CrossRef]
  51. King, R.; Mai, N.; Schwandner-Sievers, S. The New Albanian Migration; Sussex Academic Press: Brighton, UK, 2005. [Google Scholar]
  52. Gemi, E.; Triantafyllidou, A. Rethinking Migration and Return in Southeastern Europe. In Albanian Mobilities to and from Italy to Greece; Routledge: Abington, UK, 2021. [Google Scholar]
  53. Hatziprokopiou, P.A. Globalisation, Migration and Socio-Economic Change in Contemporary Greece: Processes of Social Incorporation of Balkan Immigrants in Thessaloniki; Amsterdam University Press: Amsterdam, The Netherlands, 2006; ISBN 9789053568736. [Google Scholar]
  54. Balampanidis, D.; Polyzos, I. Migrants’ settlement in two central neighborhoods of Athens. City 2016, 20, 75–90. [Google Scholar] [CrossRef]
  55. Soureli, K. Housing Affordability, Fair Housing, and Adaptation Strategies by Migrant Residents of Athens in the Early 2010s; University of California: Los Angeles, CA, USA, 2023. [Google Scholar]
  56. Alexandri, G.; Janoschka, M. Who Loses and Who Wins in a Housing Crisis? Lessons From Spain and Greece for a Nuanced Understanding of Dispossession. Hous. Policy Debate 2017, 28, 117–134. [Google Scholar] [CrossRef]
  57. Balampanidis, D. Access of Immigrants to Homeownership (2000–2010). Main Patterns of “Horizontal” and “Vertical” Ethnic Residential Segregation in the Municipality of Athens. In Athens Social Atlas. Digital Compendium of Texts and Visual Material; Maloutas, T., Spyrellis, S., Eds.; Athens Social Atlas: Athens, Greece, 2015. [Google Scholar] [CrossRef]
  58. IMF. IMF Country Report No. 24/24; IMF: Washington, DC, USA, 2024. [Google Scholar]
  59. Bank of Greece. Indices of Residential Property Prices: Q1 2024; Bank of Greece: Athens, Greece, 2024. [Google Scholar]
  60. Rousanoglou, N. Properties: More than 5.5 Billion Euros from the Golden Visa Program. Kathimerini Money Rev. 2024. (In Greek) [Google Scholar]
  61. Bank of Greece. Governor’s Annual Report 2023; Bank of Greece: Athens, Greece, 2024. [Google Scholar]
  62. Eurostat Housing in Europe; Interactive Publications: Brisbane, Australia, 2023.
Figure 1. Greece and neighboring countries. Mapping by the authors.
Land 13 00964 g001
Figure 2. Year of arrival for the immigrant population residing in the municipality of Athens in 2011. Source: EKKE 2015 [35]; data processed by the authors.
Land 13 00964 g002
Figure 3. Distribution of homeowners from developing countries, Municipality of Athens, URANUs level 2011. Source: EKKE 2015 [35]; data processed and mapping by the authors.
Land 13 00964 g003
Figure 4. Distribution of Albanian population, Municipality of Athens, URANUs level 2011. Source: EKKE 2015 [35]; data processed and mapping by the authors.
Land 13 00964 g004
Figure 5. Distribution of homeowners from Albania, Municipality of Athens, URANUs level 2011. Source: EKKE 2015 [35]; data processed and mapping by the authors.
Land 13 00964 g005
Figure 6. Apartment buildings in vertically segregated neighborhoods in Athens. Photo by authors.
Land 13 00964 g006
Figure 7. Apartment buildings in densely built vertically segregated neighborhoods in Athens. Photo by authors.
Land 13 00964 g007
Figure 8. Upper floors and doma rooms in apartment buildings. Vertically advantaged areas (left) and vertically disadvantaged areas (right). Photos by authors.
Land 13 00964 g008
Table 1. Part (%) of the population of the most important foreign nationalities in the municipality of Athens (2011). 1 Source: EKKE 2015 [35], data processed by the authors.
Country
of Origin
PopulationPart (%) of Total PopulationPart (%) of Foreign
Population
Greece499,94774.1
Albania66,82510.139.8
Eastern Europe—EU
(Bulgaria, Romania, Poland)
24,3473.714.5
Indian peninsula
(Bangladesh, Pakistan)
11,5781.76.9
Eastern Europe—non-EU (Georgia, Ukraine)10,7911.66.4
Total664,04691.867.7
1 For the needs of this analysis, we regrouped our dataset geographically. As a result, we did not take into consideration the population from the Philippines (6th) and Afghanistan (10th), who are also part of the 10 most important foreign nationalities in Athens.
Table 2. Educational attainment and unemployment (2011). Source: EKKE, 2015 [35]; data processed by the authors.
Country
of Origin
12–15 Year Olds Not in
Education
NEET 1
(15–22)
UnemployedLooking for a Job for the First Time
Greece1.313.05.92.0
Albania4.221.112.12.9
Eastern Europe—EU
(Bulgaria, Romania, Poland)
3.227.812.13.1
Indian peninsula
(Bangladesh, Pakistan)
32.150.016.911.2
Eastern Europe—non-EU (Georgia, Ukraine)3.222.811.13.1
Total1.113.97.42.7
1 NEET: Not in education, employment or training.
Table 3. Age and families (2011). Source: EKKE 2015 [35], data processed by the authors.
Country
of Origin
0–14
Years Old
More
Than 65
Years Old
MalesAverage Number
of Children
per Mother 1
Greece9.923.746.21.1
Albania21.34.050.61.5
Eastern Europe—EU
(Bulgaria, Romania, Poland)
14.01.541.20.8
Indian peninsula
(Bangladesh, Pakistan)
4.70.592.30.9
Eastern Europe—non-EU (Georgia, Ukraine)7.82.028.40.8
Total11.019.047.51.1
1 Women > 15 years old.
Table 4. Top 5 occupational categories by age group (2011). Source: EKKE (2015) [35]; data processed by the authors.
Top 5 Occupations
16–29 Year Olds 130–50 Year Olds 2
Shop salespersons.11.4Domestic, hotel, and office cleaners and helpers.21.3
Waiters and bartenders.9.7Building frame and related trades workers.18.2
Building frame and related trades workers.8.9Shop salespersons.6.0
Domestic, hotel, and office cleaners and helpers.7.8Building finishers and related trades workers.4.9
Building finishers and related trades workers.5.9Painters, building structure cleaners, and related trades workers.3.9
Total43.7Total54.3
1 16–29 year olds represent 23.5% of the Albanian active population; 2 30–50 year olds represent 57.9% of the Albanian active population.
Table 5. Distribution (%) of households by tenure and housing amenities in the Municipality of Athens, 2011. Source: EKKE (2015) [35]; data processed by the authors.
Tenure Status
by Household
Housing Amenities
by Household
Country
of Origin
OwnersTenantsNo GlazingNo Heating
Greece67.625.348.92.1
Albania25.972.369.48.0
Eastern Europe—EU
(Bulgaria, Romania, Poland)
13.583.871.95.8
Indian peninsula
(Bangladesh, Pakistan)
7.090.877.516.3
Eastern Europe—non-EU (Georgia, Ukraine)22.373.373.55.7
Total56.037.754.43.5
Table 6. Part (%) of the population by the residence’s construction period, Municipality of Athens, 2011. Source: EKKE (2015) [35]; data processed by the authors.
Country
of Origin
Before 19601960–1980After 1980
Greece10.860.428.7
Albania13.076.510.5
tenants13.979.96.3
owners9.967.222.9
Eastern Europe—EU
(Bulgaria, Romania, Poland)
14.476.88.9
Indian peninsula
(Bangladesh, Pakistan)
23.474.42.2
Eastern Europe non-EU (Georgia, Ukraine)18.074.67.4
Total12.164.023.9
Table 7. Part (%) of the population residing in apartment blocks, by floor of residence, Municipality of Athens, 2011. Source: EKKE 2015 [35]; data processed by the authors.
Country
of Origin
Lower Floors (Basements and Ground Floors)Middle Floors
(1st to 3rd Floor)
Higher Floors
(4th Floor
or Higher)
Greece8.161.731.1
Albania22.363.714.0
tenants24.462.812.9
owners9.770.020.2
Eastern Europe—EU
(Bulgaria, Romania, Poland)
24.854.720.5
Indian peninsula
(Bangladesh, Pakistan)
35.846.417.8
Eastern Europe—non-EU (Georgia, Ukraine)23.754.321.9
Total14.560.225.2
Disclaimer/Publisher’s Note: The statements, opinions and data contained in all publications are solely those of the individual author(s) and contributor(s) and not of MDPI and/or the editor(s). MDPI and/or the editor(s) disclaim responsibility for any injury to people or property resulting from any ideas, methods, instructions or products referred to in the content.

