
Impacts of Land Ownership and Forest Fragmentation on Water-Related Ecosystem Services Provision, Dynamics and Their Economic Valuation in Kentucky


Abstract
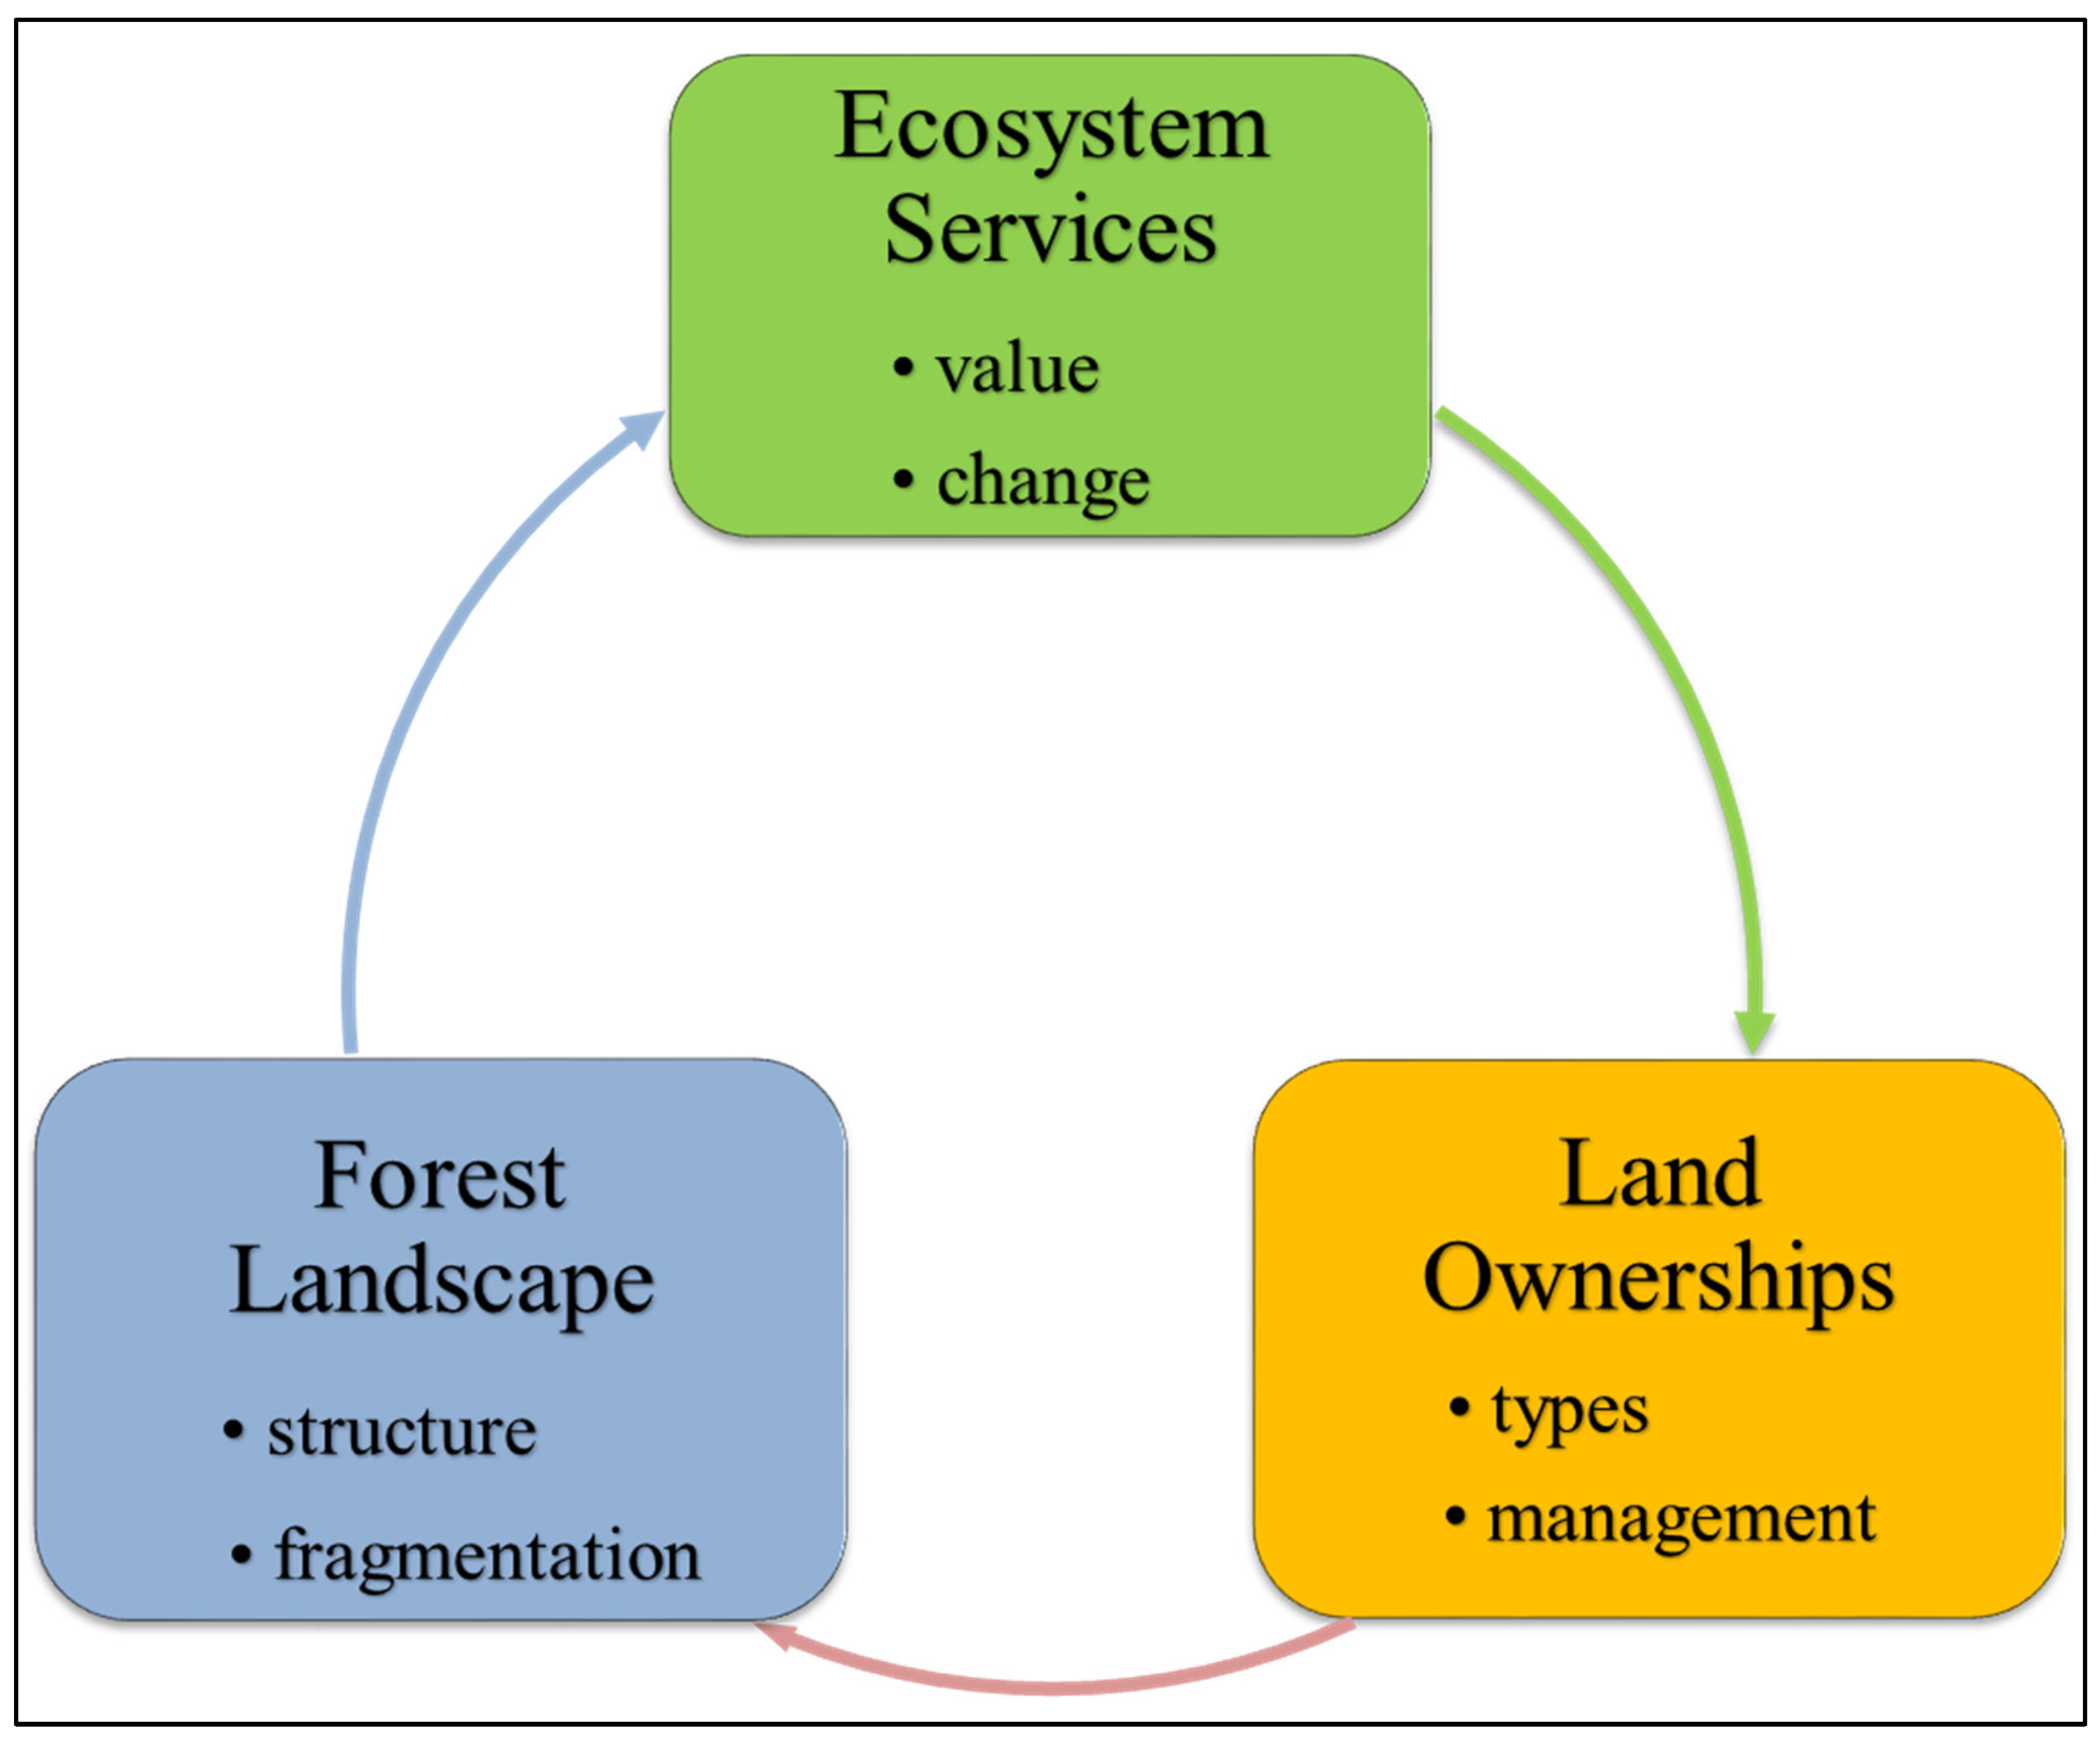
:1. Introduction
2. Materials and Methods
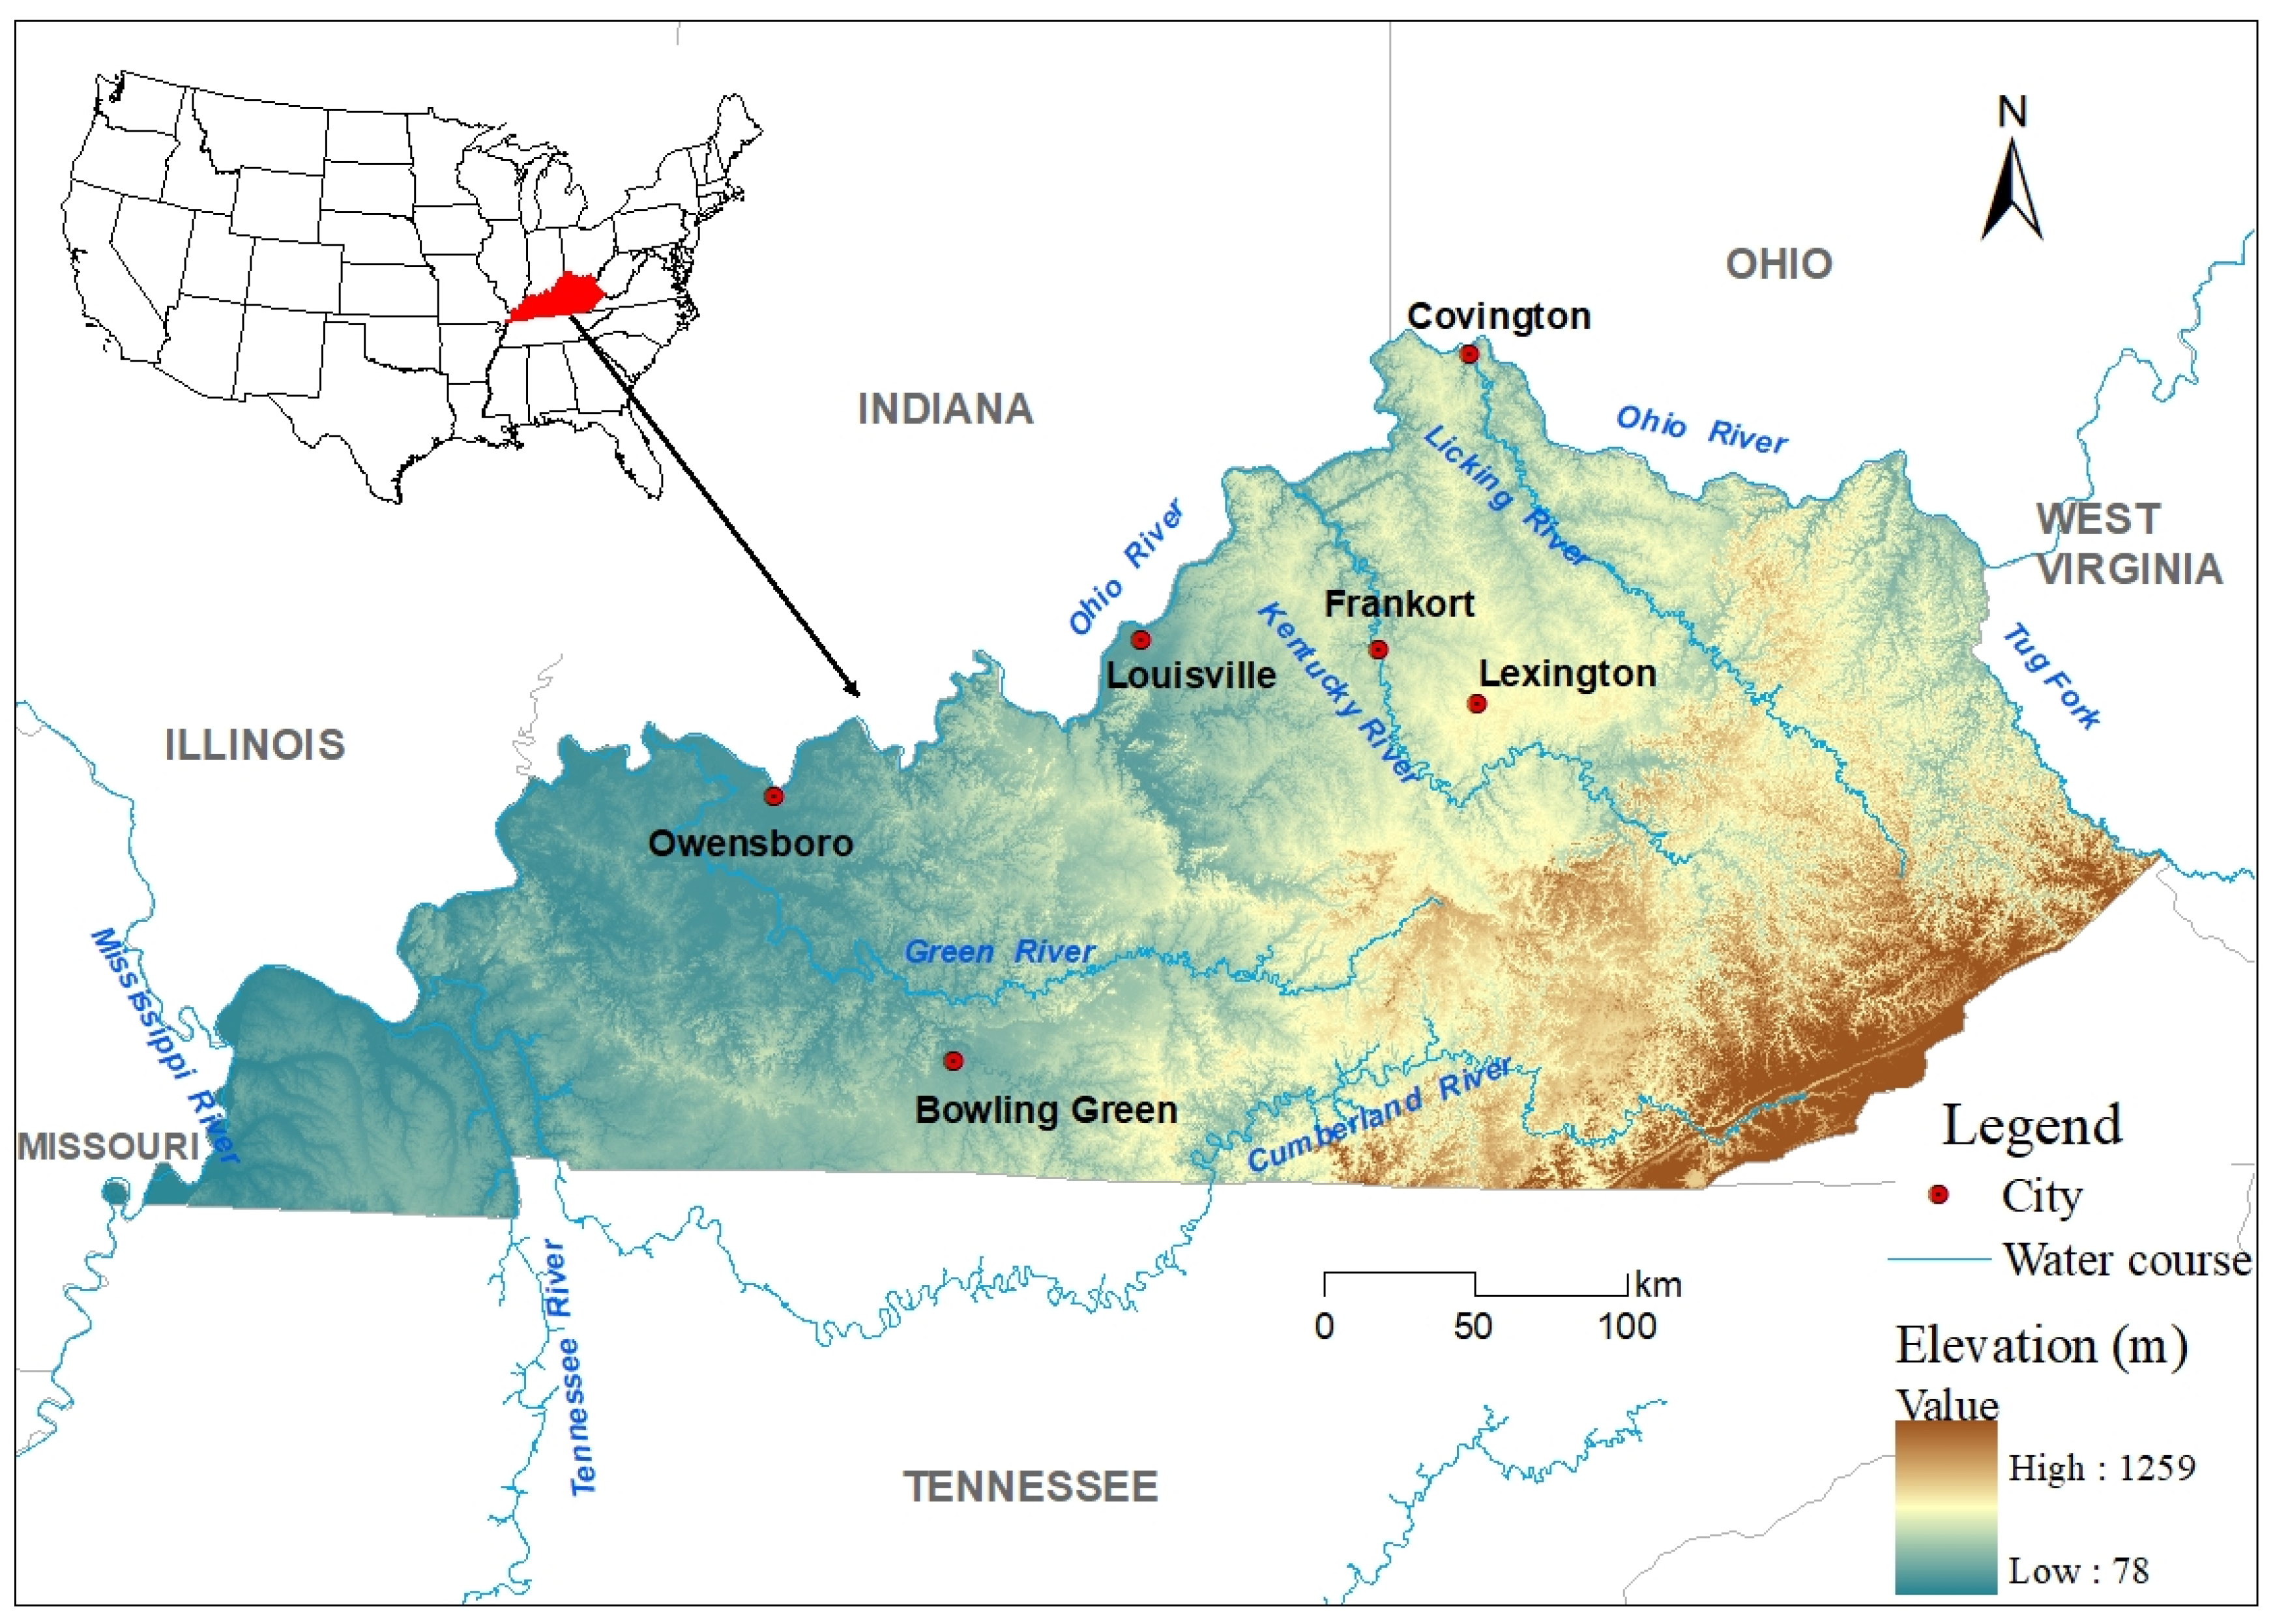
2.1. Study Area
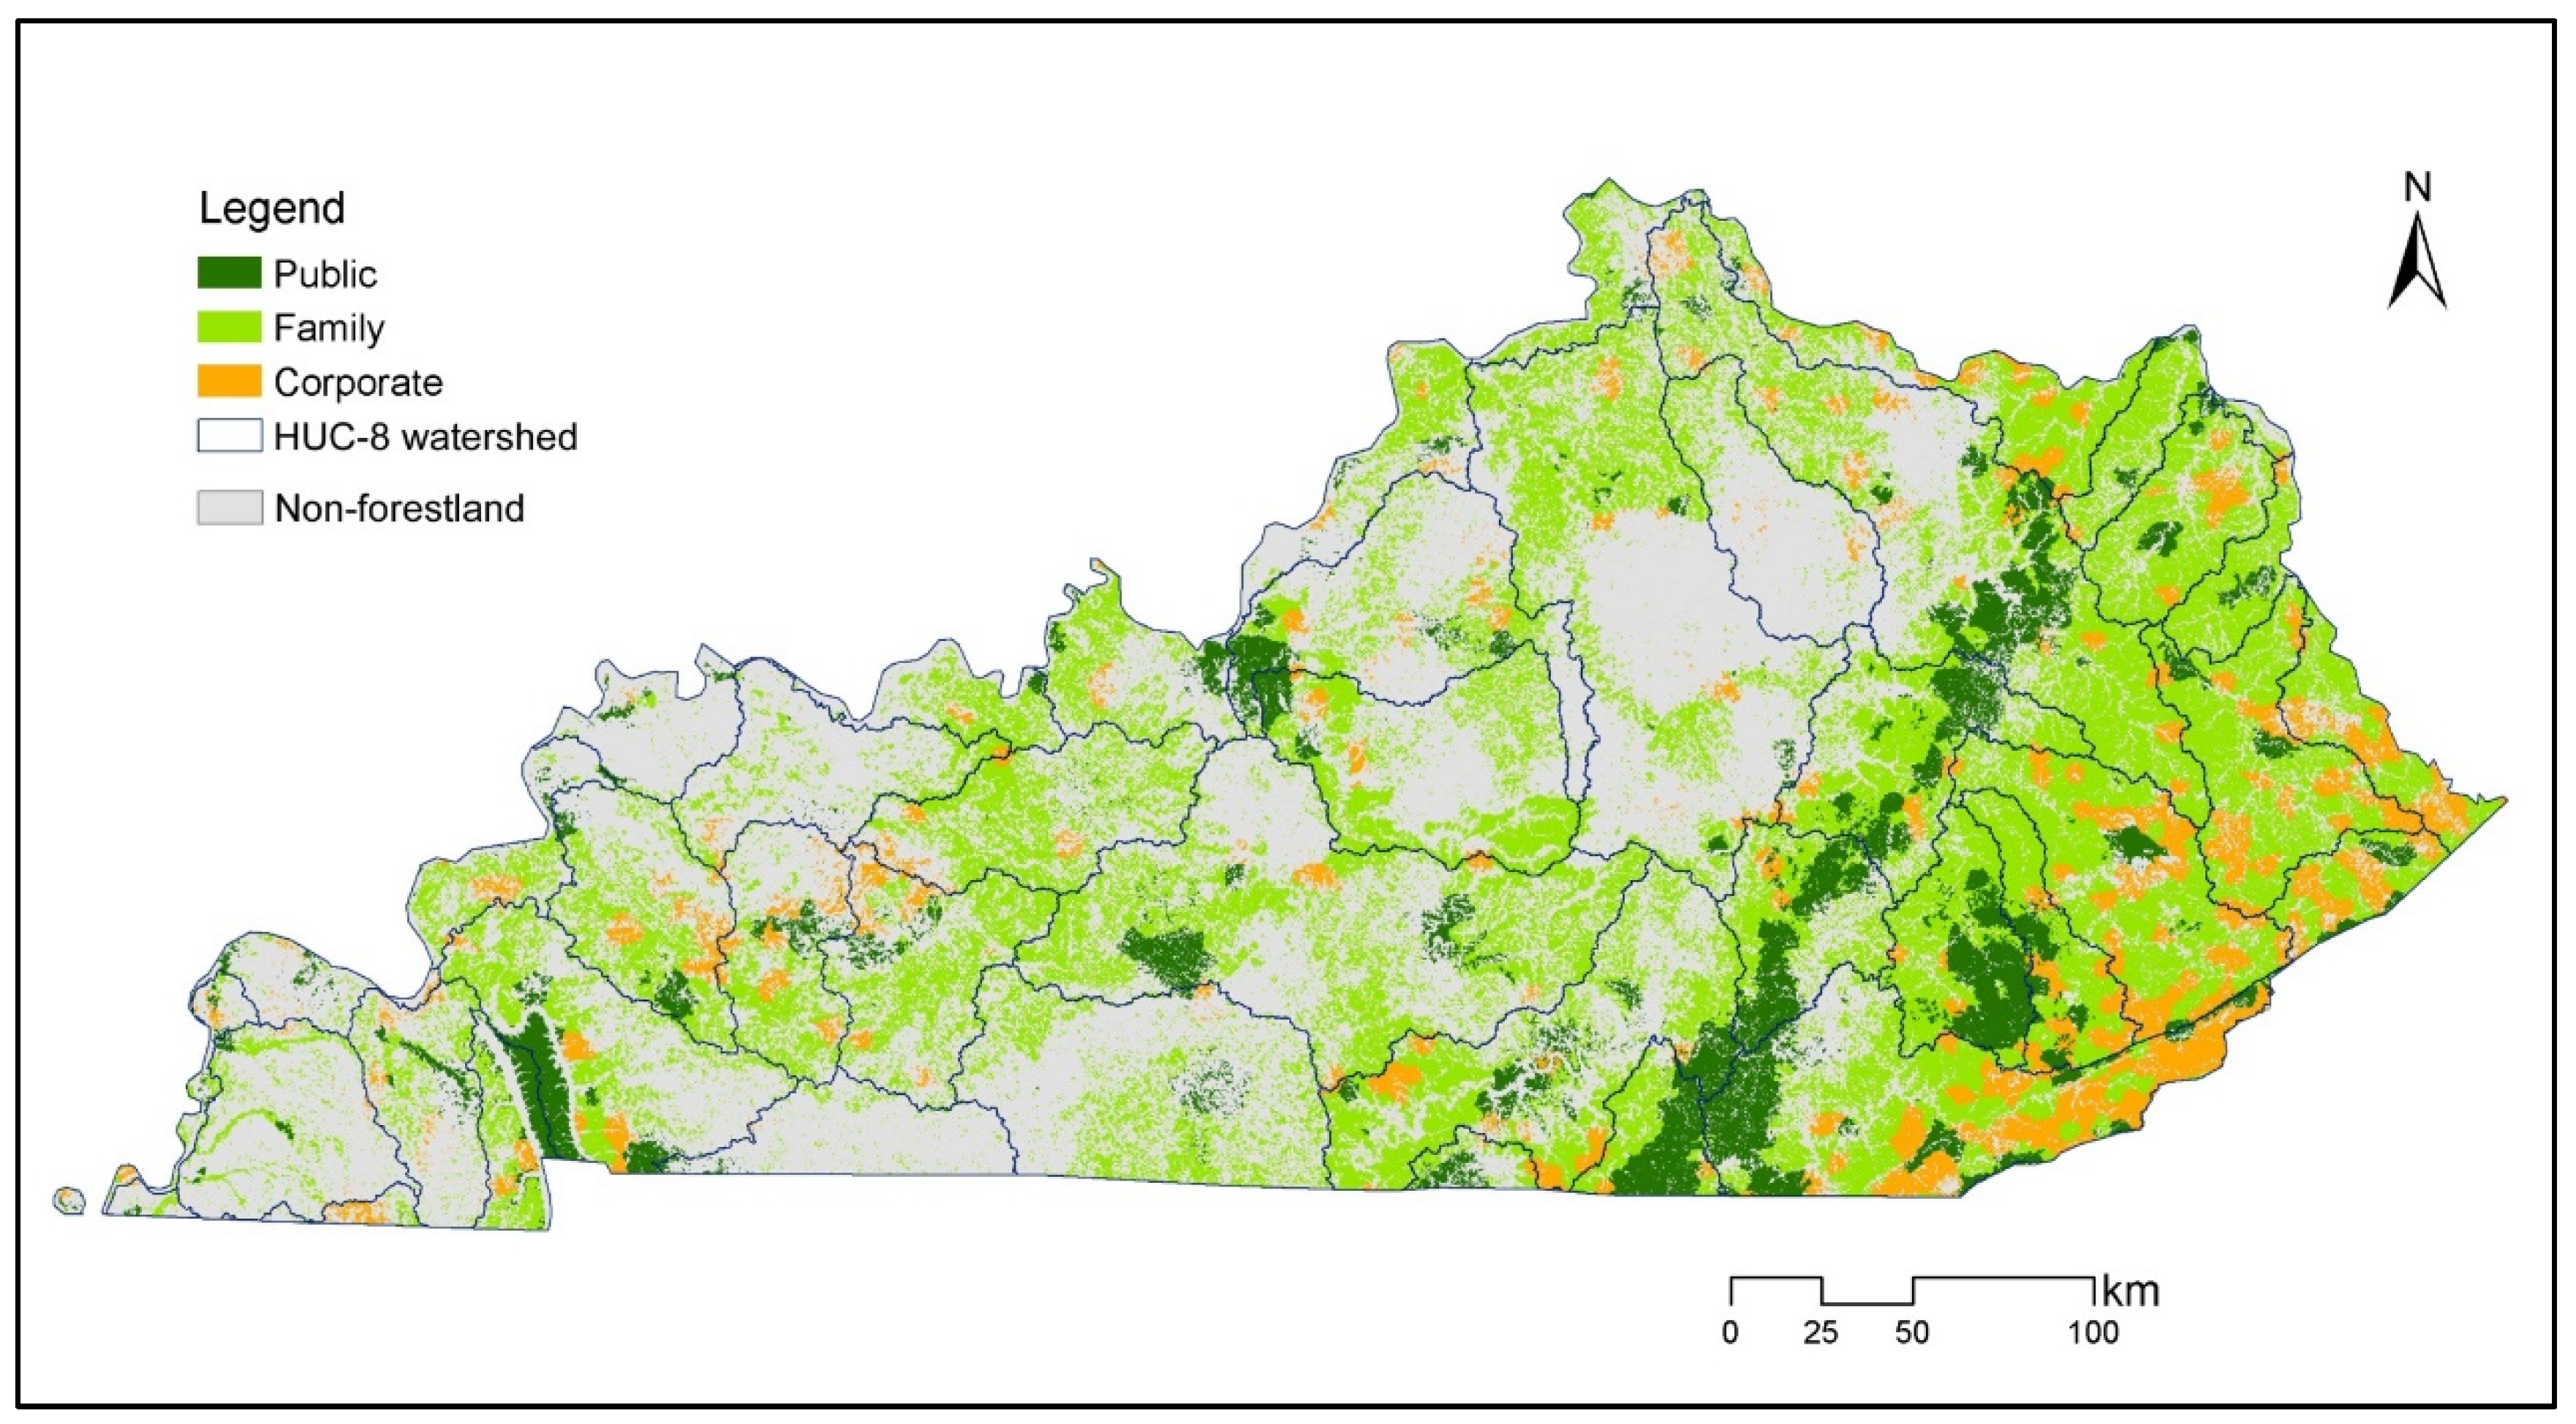
2.2. Ownership of Kentucky Forestland
2.3. Ecosystem Services Selection
2.4. Ecosystem Services Evaluation
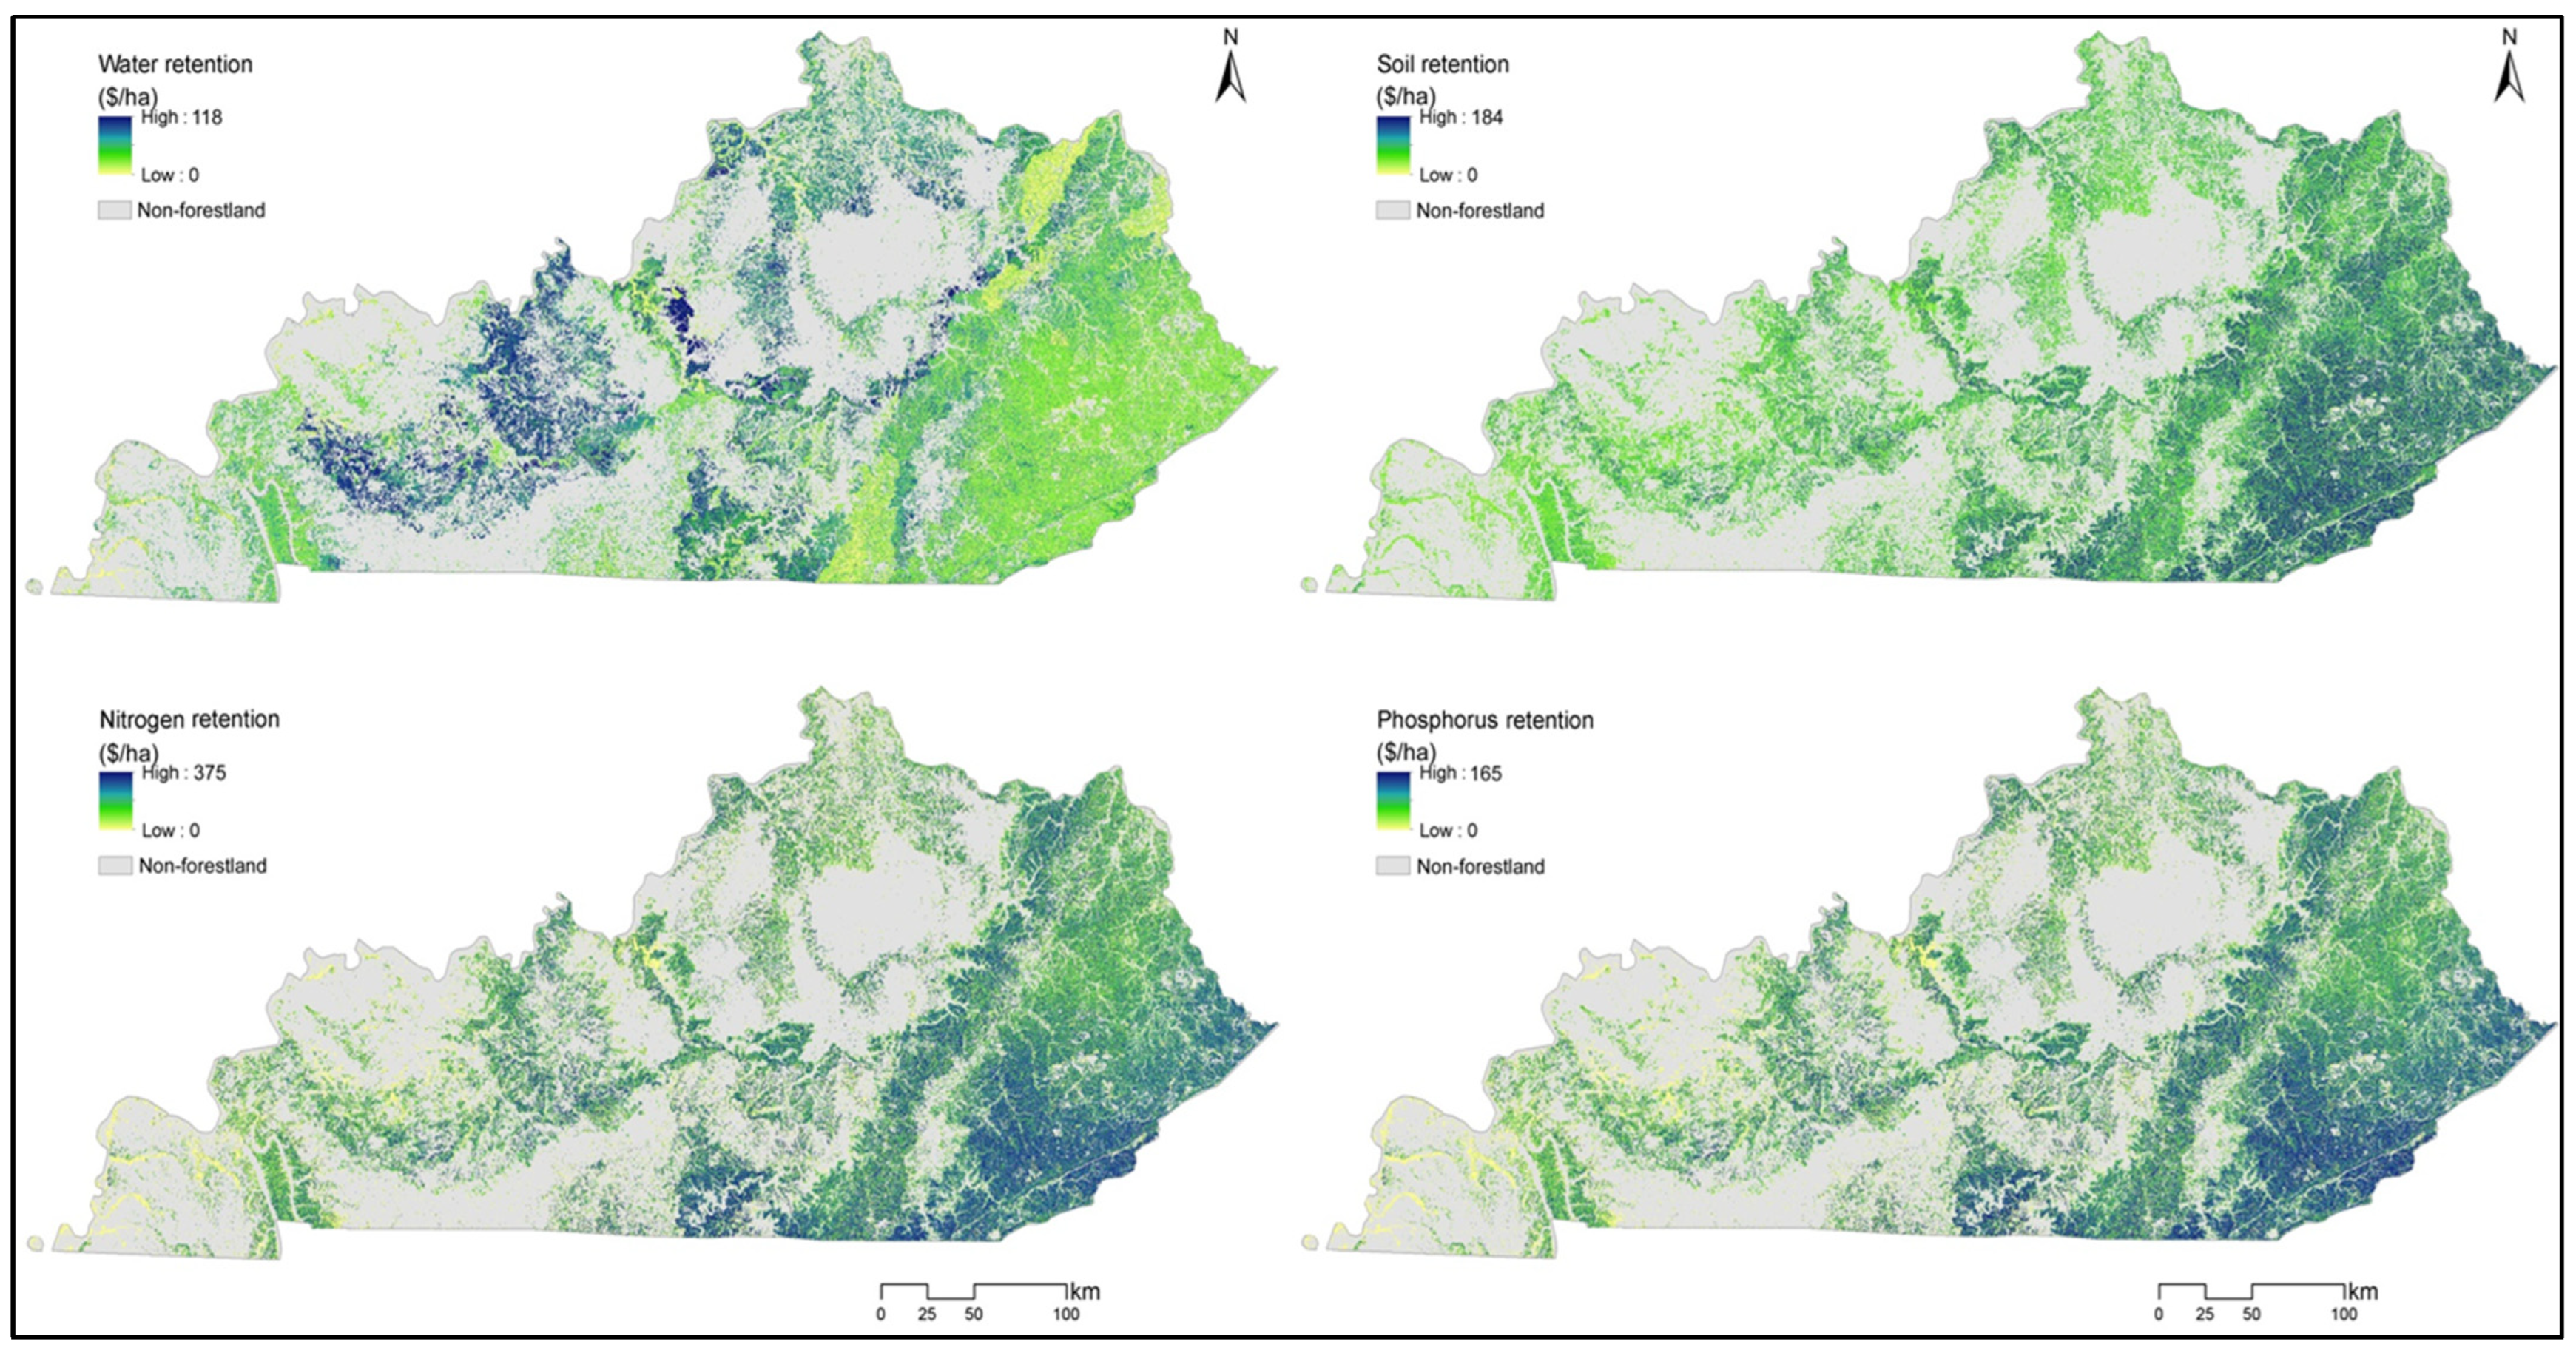
2.4.1. Water Retention
2.4.2. Soil Retention
2.4.3. Water Purification
2.5. Ecosystem Services Valuation
2.6. Landowner and Forest Fragmentation Indicators
2.6.1. Patch Density by Land Ownership
2.6.2. Mean Landownership Patch Size
2.6.3. Patch Density by Forestland Cover
2.6.4. Mean Forest Patch Size
2.7. Statistical Analysis
2.8. Data Requirement and Preparation
3. Results
3.1. Land Use Composition and Transition
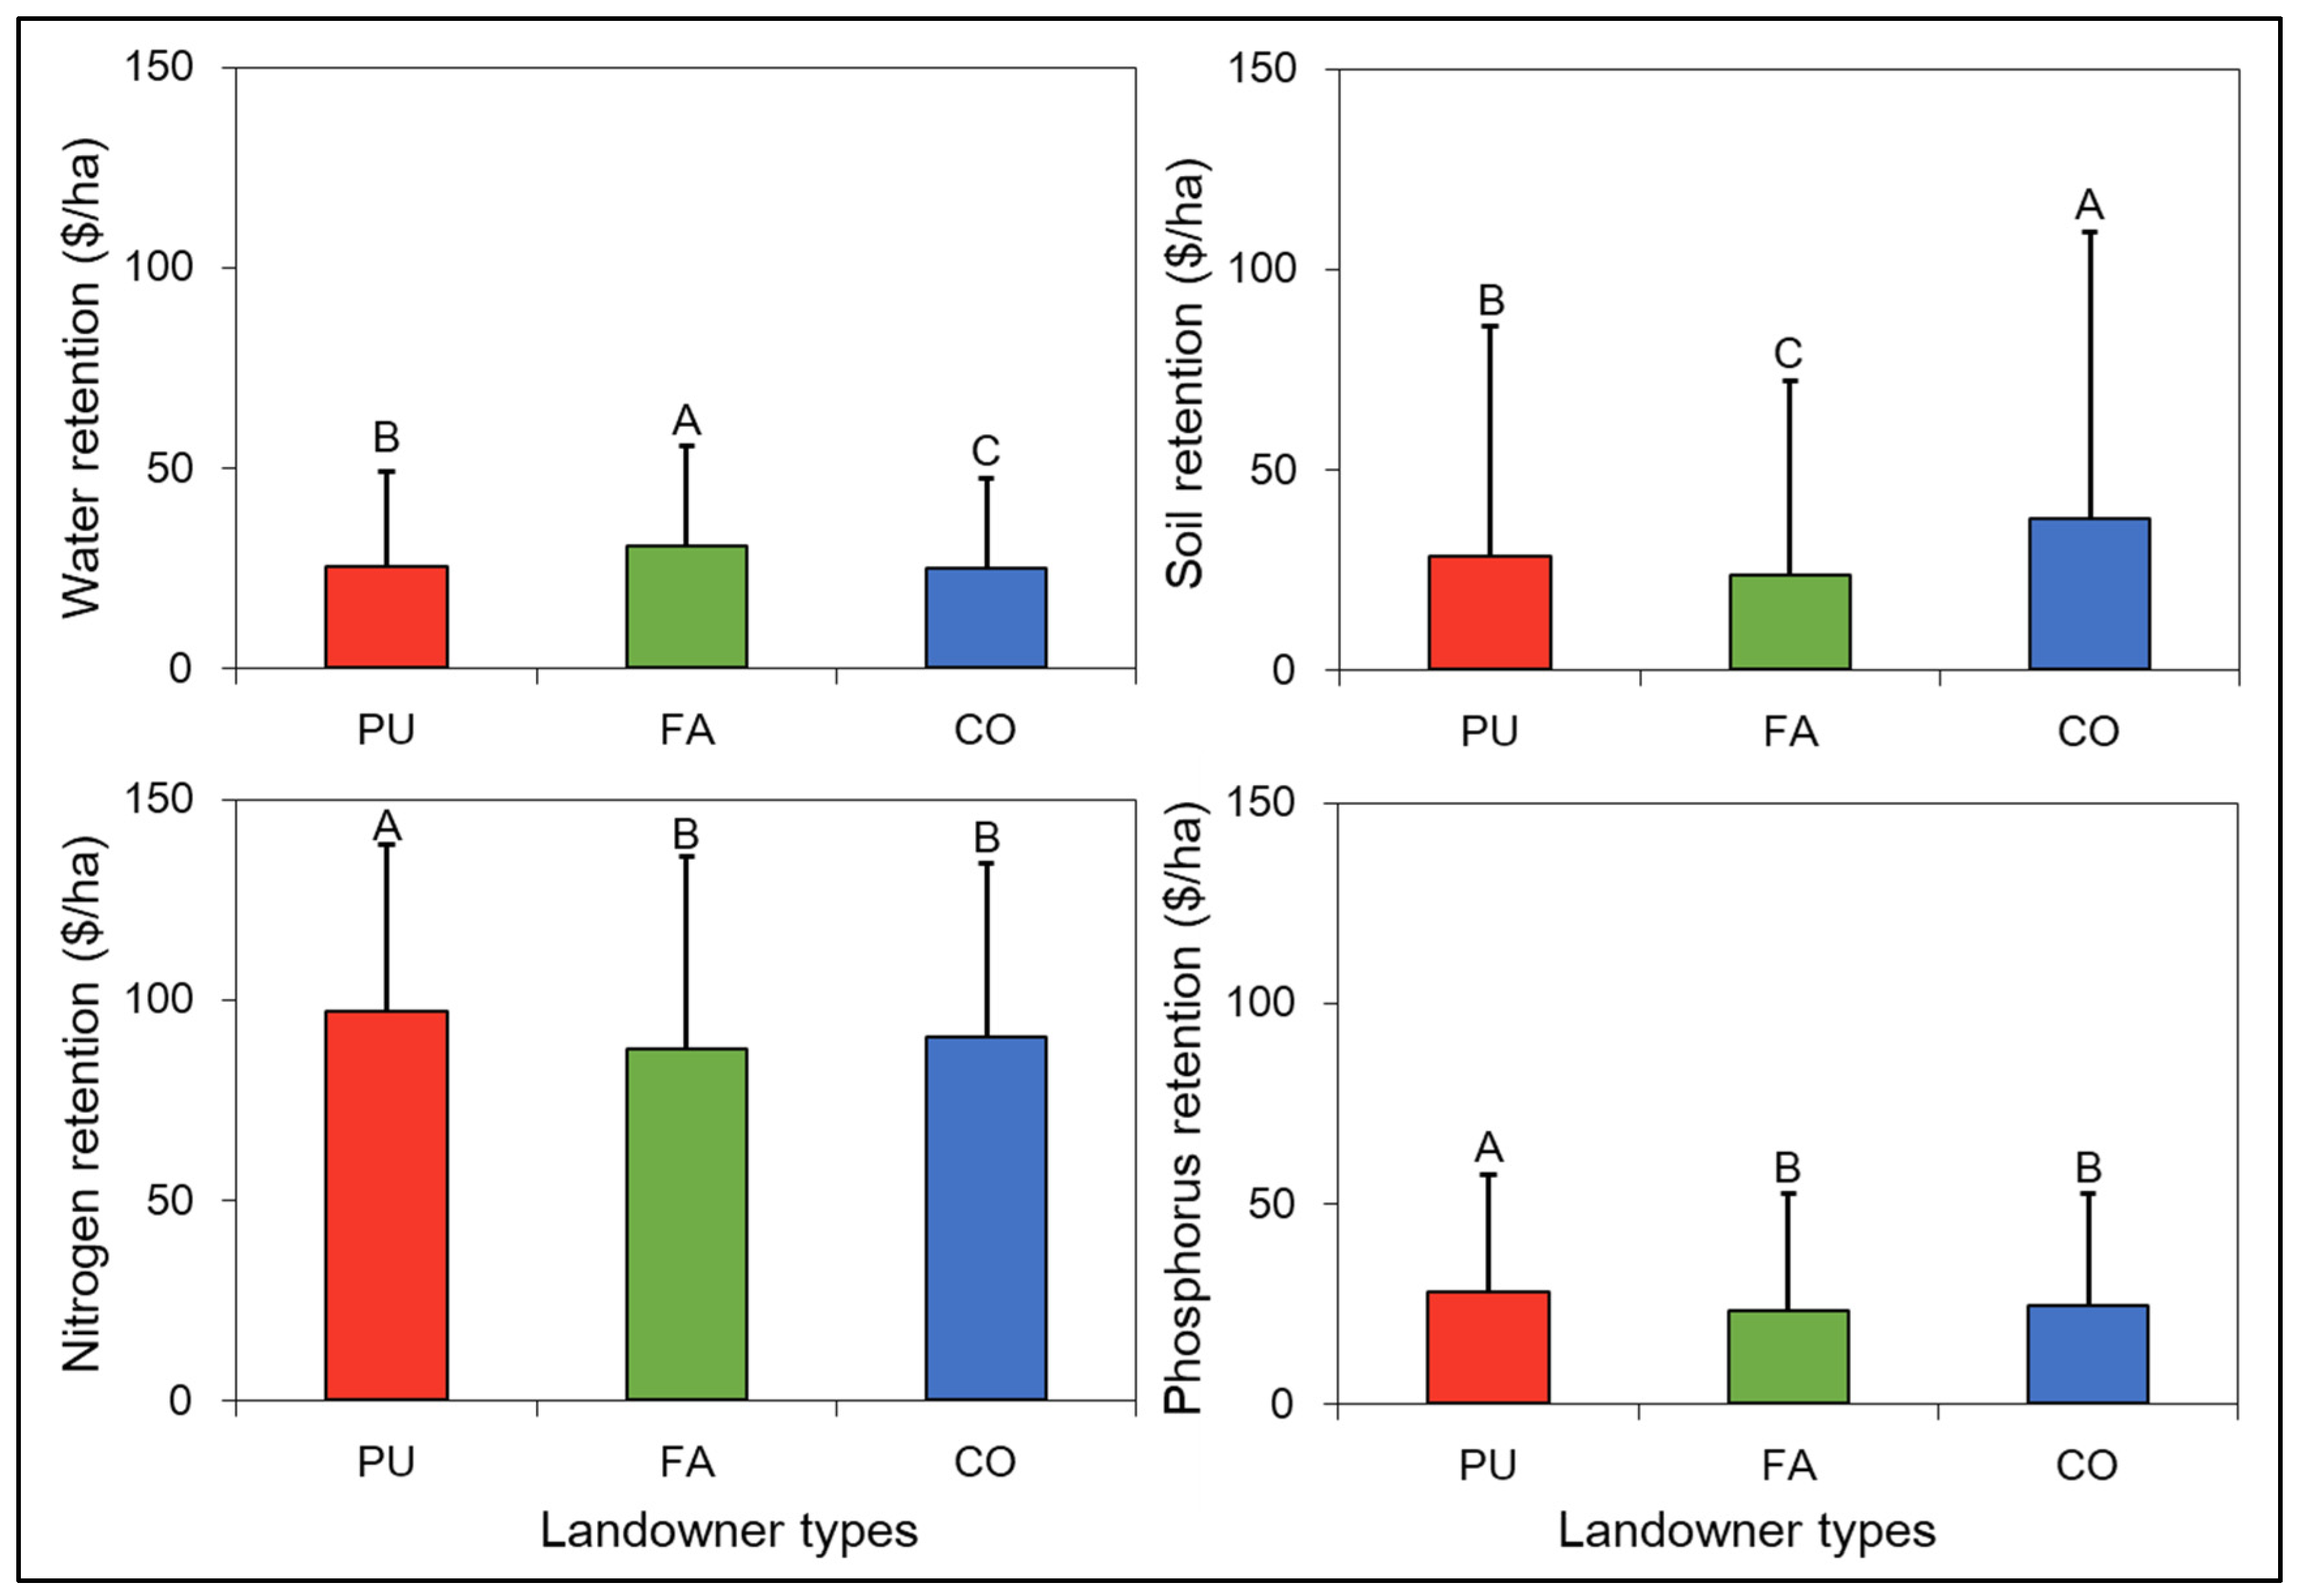
3.2. Ecosystem Services Comparison and Factors
3.3. Ecosystem Service Changes
4. Discussion
4.1. Landowners Experience a Major Loss of Ecosystem Service Values
4.2. Integrating Ecosystem Services Information into Landscape Planning
4.3. Summary, Limitations and Future Directions
5. Conclusions
Supplementary Materials
Author Contributions
Funding
Data Availability Statement
Conflicts of Interest
References
- Millennium Ecosystem Assessment (MEA). Ecosystems and Human Well-Being: Synthesis; Island Press: Washington, DC, USA, 2005. [Google Scholar]
- Daily, G.C.; Polasky, S.; Goldstein, J.; Kareiva, P.M.; Mooney, H.A.; Pejchar, L.; Ricketts, T.H.; Salzman, J.; Shallenberger, R. Ecosystem services in decision making: Time to deliver. Front. Ecol. Environ. 2009, 7, 21–28. [Google Scholar] [CrossRef]
- Sills, E.O.; Moore, S.E.; Cubbage, F.W.; McCarter, K.D.; Holmes, T.P.; Mercer, D.E. Trees at Work: Economic Accounting for Forest Ecosystem Services in the U.S. South; General Technical Report SRS-226; Forest Service, Southern Research Station: Asheville, NC, USA, 2017.
- Polasky, S.; Tallis, H.; Reyers, B. Setting the bar: Standards for ecosystem services. Proc. Natl. Acad. Sci. USA 2015, 112, 7356–7361. [Google Scholar] [CrossRef] [PubMed]
- LaRocco, G.L.; Deal, R.L. Giving Credit Where Credit Is Due: Increasing Landowner Compensation for Ecosystem Services; General Technical Report PNW-GTR-842; Forest Service, Pacific Northwest Research Station: Portland, OR, USA, 2011. [CrossRef]
- Ferranto, S.; Huntsinger, L.; Kelly, M. Sustaining Ecosystem Services From Private Lands in California: The Role of the Landowner. Rangelands 2014, 36, 44–51. [Google Scholar] [CrossRef]
- Bai, Y.; Zhuang, C.W.; Ouyang, Z.Y.; Zheng, H.; Jiang, B. Spatial characteristics between biodiversity and ecosystem services in a human-dominated watershed. Ecol. Complex. 2011, 8, 177–183. [Google Scholar] [CrossRef]
- Mitchell, M.G.E.; Bennett, E.M.; Gonzalez, A. Forest fragments modulate the provision of multiple ecosystem services. J. Appl. Ecol. 2014, 51, 909–918. [Google Scholar] [CrossRef]
- Lamy, T.; Liss, K.N.; Gonzalez, A.; Bennett, E.M. Landscape structure affects the provision of multiple ecosystem services. Environ. Res. Lett. 2016, 11, 124017. [Google Scholar] [CrossRef]
- Kim, I.; Arnhold, S.; Ahn, S.; Le, Q.B.; Kim, S.J.; Park, S.J.; Koellner, T. Land use change and ecosystem services in mountainous watersheds: Predicting the consequences of environmental policies with cellular automata and hydrological modeling. Environ. Modell. Softw. 2017, 122, 103982. [Google Scholar] [CrossRef]
- Ma, Z.; Butler, B.J.; Kittredge, D.B.; Catanzaro, P. Factors associated with landowner involvement in forest conservation programs in the U.S.: Implications for policy design and outreach. Land Use Policy 2012, 29, 53–61. [Google Scholar] [CrossRef]
- Andersson, M.; Gong, P. Risk preferences, risk perceptions and timber harvest decisions—An empirical study of nonindustrial private forest owners in northern Sweden. For. Policy Econ. 2010, 12, 330–339. [Google Scholar] [CrossRef]
- Richards, K.R.; Stokes, C. A review of forest carbon sequestration cost studies: A dozen years of research. Clim. Chang. 2004, 63, 1–48. [Google Scholar] [CrossRef]
- Hussain, A.; Munn, I.A.; Grado, S.C.; West, B.C.; Daryl Jones, W.D.; Jones, J.C. Hedonic analysis of hunting lease revenue and landowner willingness to provide fee-access hunting. For. Sci. 2007, 53, 493–506. [Google Scholar] [CrossRef]
- Mozumder, P.; Meghan Starbuck, C.; Berrens, R.P.; Alexander, S. Lease and fee hunting on private lands in the US: A review of the economic and legal issues. Hum. Dimens. Wildl. 2007, 12, 1–14. [Google Scholar] [CrossRef]
- Mutandwa, E.; Grala, R.K.; Grebner, D.L. Family forest land availability for the production of ecosystem services in Mississippi, United States. For. Policy Econ. 2016, 73, 18–24. [Google Scholar] [CrossRef]
- Butler, B.; Swenson, J.; Alig, R. Forest fragmentation in the Pacific Northwest: Quantifications and correlations. For. Ecol. Manag. 2004, 189, 363–373. [Google Scholar] [CrossRef]
- Alig, R.J. A United States view on changes in land use and land values affecting sustainable forest management. J. Sustain. For. 2007, 24, 209–227. [Google Scholar] [CrossRef]
- Stein, S.M.; Alig, R.J.; White, E.M.; Comas, S.J.; Carr, M.; Eley, M.; Elverum, K.; O’Donnell, M.; Theobald, D.M.; Cordell, K.; et al. National Forests on the Edge: Development Pressures on America’s National Forests and Grasslands; General Technical Report PNW-GTR-728; U.S. Department of Agriculture, Forest Service, Pacific Northwest Research Station: Portland, OR, USA, 2007; 26p.
- Jenkins, M.; Scherr, S.; Inbar, M. Markets for biodiversity services: Potential roles and challenges. Environ. Sci. Policy Sustain. Dev. 2004, 46, 32–42. [Google Scholar] [CrossRef]
- Verzoni, A.; Roman, J.; Sutherland, S. Greetings from the 2020 wildfire season: Five undeniable truths from a pivotal year in the world’s growing struggle with wildfire. NFPA J. 2020. Available online: https://www.nfpa.org/News-and-Research/Publications-and-media/NFPA-Journal/2020/November-December-2020/Features/Wildfire (accessed on 1 May 2024).
- Zhang, B.; Li, W.H.; Xie, G.D.; Yu, X. Water conservation of forest ecosystem in Beijing and its value. Ecol. Econ. 2010, 69, 1416–1426. [Google Scholar] [CrossRef]
- Ninan, K.N.; Kontoleon, A. Valuing forest ecosystem services and disservices—Case study of a protected area in India. Ecosyst. Serv. 2016, 20, 1–14. [Google Scholar] [CrossRef]
- Lubowski, R.N.; Plantinga, A.J.; Stavins, R.N. What drives land-use change in the United States? A national analysis of landowner decisions. Land Econ. 2008, 84, 529–550. [Google Scholar] [CrossRef]
- Turner, M.G.; Wear, D.N.; Flamm, R.O. Land Ownership and Land-Cover Change in the Southern Appalachian Highlands and the Olympic Peninsula. Ecol. Appl. 1996, 6, 1150–1172. [Google Scholar] [CrossRef]
- Wear, D.N.; Flamm, R.O. Public and private disturbance regimes in the Southern Appalachians. Nat. Resour. Model. 1993, 7, 379–397. [Google Scholar] [CrossRef]
- Kuemmerle, T.; Kozak, J.; Radeloff, V.C.; Hostert, P. Differences in forest disturbance among land ownership types in Poland during and after socialism. J. Land Use Sci. 2009, 4, 73–83. [Google Scholar] [CrossRef]
- Ahn, S.; Plantinga, A.J.; Alig, R.J. Predicting future forestland area: A comparison of econometric approaches. For. Sci. 2000, 46, 363–376. [Google Scholar] [CrossRef]
- Hines, S.J.; Daniels, A. Private Forestland Stewardship; U.S. Department of Agriculture, Forest Service, Climate Change Resource Center: Washington, DC, USA, 2011. Available online: http://www.fs.usda.gov/ccrc/topics/forest-stewardship (accessed on 20 July 2022).
- BEA (Bureau of Economic Analysis). U.S. Department of Commerce. 2020. Available online: https://www.bea.gov (accessed on 5 August 2022).
- Thomas, B. Kentucky woodland owners: Who they are and the challenges they face. Ky. Woodl. 2017, 11, 3–7. [Google Scholar]
- Stringer, J.; Thomas, B.; Ammerman, B.; Niman, C.; Agyeman, D.; Dhungel, G.; Ochuodho, T. Kentucky Forest Sector Economic Contribution Report 2018–2019, FORFS 20-02; University of Kentucky, College of Agriculture, Food and Environment, Forestry and Natural Resources Extension: Lexington, KY, USA, 2019. [Google Scholar]
- Hewes, J.H.; Butler, B.J.; Liknes, G.C. Forest Ownership in the Conterminous United States Circa 2014: Distribution of Seven Ownership Types—Geospatial Dataset; Forest Service Research Data Archive: Fort Collins, CO, USA, 2017. [CrossRef]
- U.S. Forest Service. Who Owns America’s Trees, Woods, and Forests? Results from the US Forest Service 2011–2013 National Woodland Owner Survey; NRS-INF-31-15; U.S. Department of Agriculture, Forest Service, Northern Research Station: Newtown Square, PA, USA, 2015; 12p.
- Egan, P.; Price, M.F. Mountain Ecosystem Services and Climate Change; The United Nations Educational, Scientific and Cultural Organization: Paris, France, 2017. [Google Scholar]
- Bhaduri, B.; Harbor, J.; Engel, B.; Grove, M. Assessing watershed-scale, long term hydrologic impacts of land use change using a GIS-NPS model. Environ. Manag. 2000, 26, 643–658. [Google Scholar] [CrossRef]
- Sharp, R.; Tallis, H.T.; Ricketts, T.; Guerry, A.D.; Wood, S.A.; Chaplin-Kramer, R.; Nelson, E.; Ennaanay, D.; Wolny, S.; Olwero, N.; et al. InVEST +VERSION+ User’s Guide; The Natural Capital Project, Stanford University, University of Minnesota, The Nature Conservancy, and World Wildlife Fund: Stanford, CA, USA, 2016. [Google Scholar]
- Price, R. An Introductory Guide to Valuing Ecosystem Services; Department for Environment, Food & Rural Affairs: London, UK, 2011. Available online: www.defra.gov.uk (accessed on 7 March 2018).
- Guo, Z.; Xiao, X.; Gan, Y.; Zheng, Y. Ecosystem functions, services and their values: A case study in Xingshan county of China. Ecol. Econ. 2001, 38, 141–154. [Google Scholar] [CrossRef]
- Zhang, B.; Shi, Y.T.; Liu, J.H.; Xu, L.; Xie, G.D. Economic values and dominant providers of key ecosystem services of wetlands in Beijing, China. Ecol. Indic. 2017, 77, 48–58. [Google Scholar] [CrossRef]
- Ninan, K.N.; Inoue, M. Valuing forest ecosystem services—Case study of a Forest reserve in Japan. Ecosyst. Serv. 2013, 5, e78–e87. [Google Scholar] [CrossRef]
- Song, Q.F.; Niu, X.; Yin, T.; Yang, S.T. Evaluation on wetland ecosystem service in Heilongjiang province. J. Northeast For. Univ. 2015, 43, 149–152. [Google Scholar]
- de Groot, R.; Brander, L.; van der Ploeg, S.; Costanza, R.; Bernard, F.; Braat, L.; Christie, M.; Crossman, N.; Ghermandi, A.; Hein, L.; et al. Global estimates of the value of ecosystem services and their services in monetary terms. Ecosyst. Serv. 2012, 1, 50–61. [Google Scholar] [CrossRef]
- Chuai, X.W.; Huang, X.J.; Wu, C.Y.; Li, J.B.; Lu, Q.L.; Qi, X.X.; Zhang, M.; Zuo, T.H.; Lu, J.Y. Land use and ecosystems services value changes and ecological land management in coastal Jiangsu, China. Habitat Int. 2016, 57, 164–174. [Google Scholar] [CrossRef]
- Shi, Y.; Liu, L.R.; Shi, H.; Li, H.Q.; Li, Q. The ecosystem service value as a new eco-efficiency indicator for industrial parks. J. Clean. Prod. 2017, 164, 597–605. [Google Scholar] [CrossRef]
- Yi, H.; Güneralp, B.; Filippi, A.M.; Kreuter, U.P.; Güneralp, I. Impacts of Land Change on Ecosystem Services in the San Antonio River Basin, Texas, from 1984 to 2010. Ecol. Econ. 2017, 135, 125–135. [Google Scholar] [CrossRef]
- Ruitenbeek, H.J. Social Cost Benefit Analysis of the Korup Project, Cameroon; WWF Report; World Wildlife Fund: London, UK, 1989. [Google Scholar]
- Kramer, R.A.; Richter, D.D.; Pattanayak, S.; Sharma, N.A. Ecological and economic analysis of watershed protection in Eastern Madagascar. J. Environ. Manag. 1997, 49, 277–295. [Google Scholar] [CrossRef]
- MRC (Mitsubishi Research Centre). Research Report about the Evaluation of the Multiple Functions of Agriculture and Forests Concerning Global Environment and Human Life; MRC (Mitsubishi Research Centre): Tokyo, Japan, 2001. [Google Scholar]
- Nahuelhual, L.; Donoso, P.; Lara, A.; Nunez, D.; Oyarzun, C.; Neira, E. Valuing Ecosystem services of Chilean temperate rainforests. Environ. Dev. Sustain. 2007, 9, 481–499. [Google Scholar] [CrossRef]
- Hansen, R.; Ribaudo, M. Economic Measures of Soil Conservation Benefits: Regional Values for Policy Assessment; (Technical bulletin (United States Department of Agriculture). NO. 1922; USDA: Washington, DC, USA, 2008. Available online: https://ssrn.com/abstract=2014840 (accessed on 14 September 2019).
- Hopkins, K.G.; Noe, G.B.; Franco, F.; Pindilli, E.J.; Gordon, S.; Metes, M.J.; Claggett, P.R.; Gellis, A.C.; Hupp, C.R.; Hogan, D.M. A method to quantify and value floodplain sediment and nutrient retention ecosystem services. J. Environ. Manag. 2018, 220, 65–76. [Google Scholar] [CrossRef] [PubMed]
- Carpenter, S.R.; Mooney, H.A.; Agard, J.; Capistrano, D.; DeFries, R.S.; Díaz, S.; Dietz, T.; Duraiappah, A.K.; Oteng-Yeboah, A.; Pereira, H.M.; et al. Science for managing ecosystem services: Beyond the Millennium Ecosystem Assessment. Proc. Natl. Acad. Sci. USA 2009, 106, 1305–1312. [Google Scholar] [CrossRef]
- Rickenbach, M.; Schulte, L.A.; Kittredge, D.B.; Labich, W.G.; Shinneman, D.J. Cross-boundary cooperation: A mechanism for sustaining ecosystem services from private lands. J. Soil Water Conserv. 2011, 66, 91–96. [Google Scholar] [CrossRef]
- Fisher, B.; Turner, R.K.; Morling, P. Defining and classifying ecosystem services for decision making. Ecol. Econ. 2009, 68, 643–653. [Google Scholar] [CrossRef]
- Sorice, M.G.; Kreuter, U.P.; Wilcox, B.P.; Fox, W.E., III. Changing landowners, changing ecosystem? Land-ownership motivations as drivers of land management practices. J. Environ. Manag. 2014, 133, 144–152. [Google Scholar] [CrossRef] [PubMed]
- Ferranto, S.P. Private Lands, Public Goods: Engaging Landowners in Ecosystem Management. Ph.D. Thesis, University of California, Berkeley, CA, USA, 2012. [Google Scholar]
- Goldman, R.L.; Thompson, B.H.; Daily, G.C. Institutional incentives for managing the landscape: Inducing cooperation for the production of ecosystem services. Ecol. Econ. 2007, 64, 333–343. [Google Scholar] [CrossRef]
- Finely, A.O.; Kittredge, D.B., Jr.; Stevens, T.H.; Schweik, C.M.; Dennis, D.C. Interest in cross-boundary cooperation: Identification of distinct types of private forest owners. For. Sci. 2006, 52, 10–22. [Google Scholar] [CrossRef]
- Bergmann, S.A.; Bliss, J.C. Foundations of cross-boundary cooperation: Resource management at the public–private interface. Soc. Nat. Resour. 2004, 17, 377–393. [Google Scholar] [CrossRef]
- Vigerstol, K.L.; Aukema, J.E. A comparison of tools for modeling freshwater ecosystem services. J. Environ. Manag. 2011, 92, 2403–2409. [Google Scholar] [CrossRef] [PubMed]

| Land Use Types | 2001 | 2011 | Change Rate | ||
|---|---|---|---|---|---|
| Area (km2) | Percentage | Area (km2) | Percentage | ||
| Water | 188.38 | 0.38% | 186.25 | 0.37% | −1.13% |
| Developed | 1781.38 | 3.55% | 1815.13 | 3.62% | 1.89% |
| Barren | 59.38 | 0.12% | 242.25 | 0.48% | 308.00% |
| Forest | 41,299.25 | 82.29% | 40,696.75 | 81.09% | −1.46% |
| Shrubland | 190.25 | 0.38% | 249.00 | 0.50% | 30.88% |
| Grassland | 2241.75 | 4.47% | 2518.13 | 5.02% | 12.33% |
| Pasture | 2976.25 | 5.93% | 3011.38 | 6.00% | 1.18% |
| Cultivated | 813.50 | 1.62% | 830.63 | 1.66% | 2.11% |
| Wetlands | 634.38 | 1.26% | 635.00 | 1.27% | 0.10% |
| Water Retention | Soil Retention | Nitrogen Retention | Phosphorus Retention | Aggregated | |||||
|---|---|---|---|---|---|---|---|---|---|
| Biophysical (109 m3) | Monetary (Million USD) | Biophysical (106 t) | Monetary (Million USD) | Biophysical (106 kg) | Monetary (Million USD) | Biophysical (106 kg) | Monetary (Million USD) | Monetary (Million USD) | |
| PU | 1.11 (1.4 ± 1.3) | 22.24 (25.5 ± 23.5) | 3.75 (4.8 ± 9.7) | 22.28 (28.4 ± 57.4) | 4.18 (6.3 ± 2.7) | 64.53 (97.1 ± 41.6) | 1.19 (1.8 ± 1.9) | 18.44 (27.8 ± 29.3) | 127.49 (178.8 ± 151.8) |
| FA | 5.99 (1.7 ± 1.4) | 119.74 (30.4 ± 25.1) | 14.41 (4 ± 8.1) | 85.57 (23.8 ± 48.2) | 15.67 (5.7 ± 3.1) | 241.70 (87.8 ± 47.8) | 4.12 (1.5 ± 1.9) | 63.61 23.1 ± 29.3 | 510.62 (165.1 ± 150.4) |
| CO | 0.94 (1.4 ± 1.3) | 18.82 (24.8 ± 22.6) | 4.42 (6.3 ± 12.1) | 26.23 (37.6 ± 71.9) | 3.20 (5.9 ± 2.8) | 49.30 (90.9 ± 43.2) | 0.88 (1.6 ± 1.8) | 13.37 (24.7 ± 27.7) | 107.72 (178.0 ± 165.4) |
| Total | 8.04 | 160.80 | 22.58 | 134.08 | 23.05 | 355.53 | 6.19 | 95.42 | 745.83 |
| Precipitation | Elevation | Slope | |
|---|---|---|---|
| Water retention | 0.331 * | −0.05 | −0.089 |
| Soil retention | −0.476 ** | 0.907 ** | 0.949 ** |
| Nitrogen retention | −0.328 * | 0.74 ** | 0.757 ** |
| Phosphorus retention | −0.38 * | 0.785 ** | 0.805 ** |
| Landowner Types | Water Retention | Soil Retention | Nitrogen Retention | Phosphorus Retention |
|---|---|---|---|---|
| PU | −0.08 | −0.07 | −1.57 | −0.15 |
| FA | −0.55 | −1.14 | −7.65 | −5.18 |
| CO | −0.19 | −0.38 | −1.69 | −0.71 |
| Ecosystem Services | Fragmentation | Water Retention | Soil Retention | Nitrogen Retention | Phosphorus Retention |
|---|---|---|---|---|---|
| Provision | PDL | −0.478 ** | −0.425 ** | −0.769 ** | −0.757 ** |
| −0.259 | −0.63 ** | −0.788 ** | −0.793 ** | ||
| MFPS | 0.278 | 0.879 ** | 0.548 ** | 0.594 ** | |
| MLPS | 0.26 | 0.832 ** | 0.512 ** | 0.558 ** | |
| Change | PDL | 0.381 * | 0.292 | 0.345 * | 0.342 * |
| 0.357 * | 0.35 * | 0.374 * | 0.379 * | ||
| MFPS | −0.345 * | −0.584 ** | −0.605 ** | −0.612 ** | |
| MLPS | −0.268 | −0.496 ** | −0.555 ** | −0.559 ** |
Disclaimer/Publisher’s Note: The statements, opinions and data contained in all publications are solely those of the individual author(s) and contributor(s) and not of MDPI and/or the editor(s). MDPI and/or the editor(s) disclaim responsibility for any injury to people or property resulting from any ideas, methods, instructions or products referred to in the content. |
© 2024 by the authors. Licensee MDPI, Basel, Switzerland. This article is an open access article distributed under the terms and conditions of the Creative Commons Attribution (CC BY) license (https://creativecommons.org/licenses/by/4.0/).
Share and Cite
Bai, Y.; Yang, J.; Ochuodho, T.O.; Thapa, B. Impacts of Land Ownership and Forest Fragmentation on Water-Related Ecosystem Services Provision, Dynamics and Their Economic Valuation in Kentucky. Land 2024, 13, 984. https://doi.org/10.3390/land13070984
Bai Y, Yang J, Ochuodho TO, Thapa B. Impacts of Land Ownership and Forest Fragmentation on Water-Related Ecosystem Services Provision, Dynamics and Their Economic Valuation in Kentucky. Land. 2024; 13(7):984. https://doi.org/10.3390/land13070984
Chicago/Turabian StyleBai, Yang, Jian Yang, Thomas O. Ochuodho, and Bobby Thapa. 2024. "Impacts of Land Ownership and Forest Fragmentation on Water-Related Ecosystem Services Provision, Dynamics and Their Economic Valuation in Kentucky" Land 13, no. 7: 984. https://doi.org/10.3390/land13070984
APA StyleBai, Y., Yang, J., Ochuodho, T. O., & Thapa, B. (2024). Impacts of Land Ownership and Forest Fragmentation on Water-Related Ecosystem Services Provision, Dynamics and Their Economic Valuation in Kentucky. Land, 13(7), 984. https://doi.org/10.3390/land13070984