Article

Predicting Land-Use Change Trends and Habitat Quality in the Tarim River Basin: A Perspective with Climate Change Scenarios and Multiple Scales

1
College of Ecology and Environment, Xinjiang University, Urumqi 830046, China
2
Ministry of Education Key Laboratory of Oasis Ecology, Xinjiang University, Urumqi 830046, China
3
Faculty of Mathematics and Geography, University of Eichstaett-Ingolstadt, 85071 Eichstaett, Germany
4
Institute of Ecology, College of Urban and Environmental Sciences, Peking University, Beijing 100871, China
*
Author to whom correspondence should be addressed.
Land 2024, 13(8), 1146; https://doi.org/10.3390/land13081146
Submission received: 16 June 2024 / Revised: 12 July 2024 / Accepted: 25 July 2024 / Published: 26 July 2024

Abstract

:
Under the influences of climate change and human activities, habitat quality (HQ) in inland river basins continues to decline. Studying the spatiotemporal distributions of land use and HQ can provide support for sustainable development strategies of the ecological environment in arid regions. Therefore, this study utilized the SD-PLUS model, InVEST-HQ model, and Geodetector to assess and simulate the land-use changes and HQ in the Tarim River Basin (TRB) at multiple scales (county and grid scales) and scenarios (SSP126, SSP245, and SSP585). The results indicated that (1) the Figure of Merit (FoM) values for Globeland 30, China’s 30 m annual land-cover product, and the Chinese Academy of Sciences (30 m) product were 0.22, 0.12, and 0.15, respectively. A comparison of land-use datasets with different resolutions revealed that the kappa value tended to decline as the resolution decreased. (2) In 2000, 2010, and 2020, the HQ values were 0.4656, 0.4646, and 0.5143, respectively. Under the SSP126 and SSP245 scenarios, the HQ values showed an increasing trend: for the years 2030, 2040, and 2050, they were 0.4797, 0.4834, and 0.4855 and 0.4805, 0.4861, and 0.4924, respectively. Under SSP585, the HQ values first increased and then decreased, with values of 0.4791, 0.4800, and 0.4766 for 2030, 2040, and 2050, respectively. (3) Under three scenarios, areas with improved HQ were mainly located in the southern and northern high mountain regions and around urban areas, while areas with diminished HQ were primarily in the western part of the basin and central urban areas. (4) At the county scale, the spatial correlation was not significant, with Moran’s I ranging between 0.07 and 0.12, except in 2000 and 2020. At the grid scale, the spatial correlation was significant, with clear high- and low-value clustering (Moran’s I between 0.80 and 0.83). This study will assist land-use planners and policymakers in formulating sustainable development policies to promote ecological civilization in the basin.

1. Introduction

The sustainable development of human society is closely linked to the structure and functioning of ecosystems. The richness of biodiversity provides the material foundation necessary for human survival and development, playing a crucial role in fostering and maintaining human ecological civilization [1,2]. Habitat quality (HQ), as a critical indicator for assessing biodiversity, refers to the capacity of ecosystems to provide survival resources and services [3,4]. In recent years, rapid population growth and economic development have strained limited natural resources, leading to ecological degradation attributable to a prolonged imbalance in supply and demand. Habitat fragmentation has resulted in widespread losses of biodiversity and degradation of natural habitats, and environmental issues such as global warming-induced ice and snow melting and urban heat islands continue to threaten the living spaces of humans and wildlife [5,6,7]. Therefore, it is crucial to reduce the intensity of disturbances from industrial and agricultural expansion on natural ecosystems, maintain ecosystem stability and biodiversity, and attain a balance among human activities, economic development, and ecological environments to achieve sustainable development [8,9].
Drought is a significant factor in limiting species diversity in the Tarim River Basin. As a drought intensifies, structural changes in land use can impact the structure and functioning of ecosystems, leading to biodiversity loss, reduced HQ, and subsequently affecting human well-being [10,11]. Meanwhile, the HQ in the Tarim River Basin is influenced by multiple factors, such as vegetation, regional climate, and water resources. Water resources are crucial for agricultural production and economic development in the Tarim River Basin, and most crops and vegetation are sensitive to water scarcity. Particularly in areas with significant land-use changes, ecosystems are more vulnerable and have lower resilience. Structural changes in land use can alter the hydrological cycle of a basin, affecting processes such as evapotranspiration, infiltration, and water retention, thereby impacting biodiversity [12,13,14]. On the other hand, in recent years, human activities have accelerated the process of land-use change, regulating human production, ecological functioning, and human lifestyle by altering land-use structures. This has involved a series of actions, including ecosystem value assessments, agricultural cultivation and intensification, forest logging, and urban expansion [15,16]. Due to the close correlations between HQ and the aforementioned behaviors and management patterns, it is imperative to govern the HQ in the Tarim River Basin comprehensively to enhance its ecological security. This necessitates a clear understanding of how to plan and achieve this goal, such as by improving conflict resolution among multiple stakeholders, delineating the boundaries between human economic production and ecological conservation, and quantifying the economic benefits of ecosystem services at different scales and under different scenarios for the policymakers and residents involved in implementing comprehensive basin management. This would ensure that policies can fairly compensate residents for the economic losses incurred by ecological transformation.
Land resources serve as the spatial foundation for ecosystems and human survival and development, and rational planning and integration of land resources are fundamental prerequisites for achieving sustainable development in arid regions [17,18]. Since the beginning of the new century, rapid economic development has driven changes in HQ, exacerbating conflicts between ecological security and human activities. In the future, land use and HQ structure will be influenced by factors such as the population and economy. The latest Coupled Model Intercomparison Project phase 6 (CMIP6) models provide researchers with various future development scenarios under global climate change backgrounds, which utilize shared socioeconomic pathways (SSPs) and representative concentration pathways (RCPs) for coupling, thus offering insights into future global climate change [19,20]. SSP scenarios depend on the potential changes in future energy systems, land use, anthropogenic emissions, and atmospheric composition, which often significantly influence the structure of land use. Therefore, investigating spatial changes in land use under different pathways has significant implications for guiding land-use policies in the Tarim River Basin. Consequently, land-use simulation based on this foundation has gradually become a focal point of research [17]. Cellular automaton (CA) models, which consider transition rules and neighborhood effects, are commonly regarded as effective tools for simulating land-use and land-cover (LULC) changes. Derived models from CA include logistic-CA and ANN-CA, but these models cannot accurately simulate the development of different LULC patches. However, the PLUS model combines artificial neural networks with CA models, establishing an interactive simulation platform for land simulation under various development scenarios. This addresses the shortcomings of previous models’ inability to predict outcomes reliably. At the same time, the PLUS model is deeply integrated with various socioeconomic models to simulate the impacts of economic policies, population dynamics, technological advancements, and other factors on land use, providing comprehensive support for land-use decision-making. For example, combining the PLUS model with system dynamics (SD) models enables a more comprehensive simulation of the dynamic changes across social, economic, and environmental factors, offering a more robust tool for studying complex systems. Based on the above reasons, PLUS has gradually become the mainstream model for land-use simulation and is being applied widely in land-use planning [21,22]. Land-use simulation is a dynamic process. While single methods can represent the dynamic process of land changes to some extent, they often emphasize block-based and phased simulation studies, lacking complex connections with important factors such as regional characteristics, population, and the economy. This study combines the system dynamics model with the PLUS model, utilizing different SSP scenarios to set development directions. This approach helps to deeply explore the complex interactions between HQ changes and land-use structure in the Tarim River Basin, clarifying the impact of the coupling between the economic structure and ecological environment changes on HQ.
Located in an arid region, the Tarim River Basin receives little annual precipitation and lacks water resources. Consequently, the area faces severe environmental challenges, such as water scarcity, land desertification, and desertification. It is designated as a key ecological management area in China and has the potential for ecological construction and economic growth [23]. However, because of its harsh ecological conditions and intense human interference, the already fragile land-use structure faces even greater risks. Natural habitats continue to degrade, leading to a sharp decline in biodiversity [24,25]. For instance, in studies of the Yellow River Basin, there is often an emphasis on the differing land-use demands between small-scale and large-scale regions. This relationship is typically not a simple accumulation but rather, it is determined by the expansion of land use within various scales, influencing the quantity, structural composition, and spatial distribution of land within each respective area. This perspective is critical from a professional academic standpoint. Relevant studies at the county scale have primarily focused on the smaller planning areas in the central and western regions. However, previous research on the Tarim River Basin has mainly concentrated on the ecosystem service functions at the grid scale, lacking studies on the spatial distribution differences in HQ from a county perspective. Moreover, given the large basin area, inconsistent county-level planning, and current unreasonable conditions, it is necessary to explore the spatial differences in land-use changes and HQ at the county and grid scales while considering the individual independence and coordination backgrounds. Using this approach to define the research scale of land-use changes in the Tarim River Basin helps to avoid the research discrepancies caused by the quantity and spatial constraints of land. It enables the identification of trends in land utilization and HQ within different scale ranges, eliminating the restraint of county boundaries to promote regional integration and development more effectively.
The healthy development of HQ in the Tarim River Basin, a pivotal region within the “Belt and Road Initiative”, plays a crucial role in maintaining the ecological security barrier in western China. To elucidate the patterns of land-use change from the perspective of HQ and clarify the key areas for future ecological environment protection, the study pursued several research objectives: (1) explore the suitability and scientific validity of land-use datasets for land-use simulation research, (2) determine the reliability of coupled models in predicting land-use data, (3) investigate the trends in structural changes in LULC and HQ, and (4) reveal the spatial differences in the evolution of HQ at different scales, thus identifying ecologically vulnerable areas and the response mechanisms of spatial changes in land use and HQ to human activities and climate characteristics through multi-scale, multi-scenario simulations. It is hoped that this work will provide a new scientific reference for promoting ecological civilization construction in the Tarim River Basin.

2. Materials and Methods
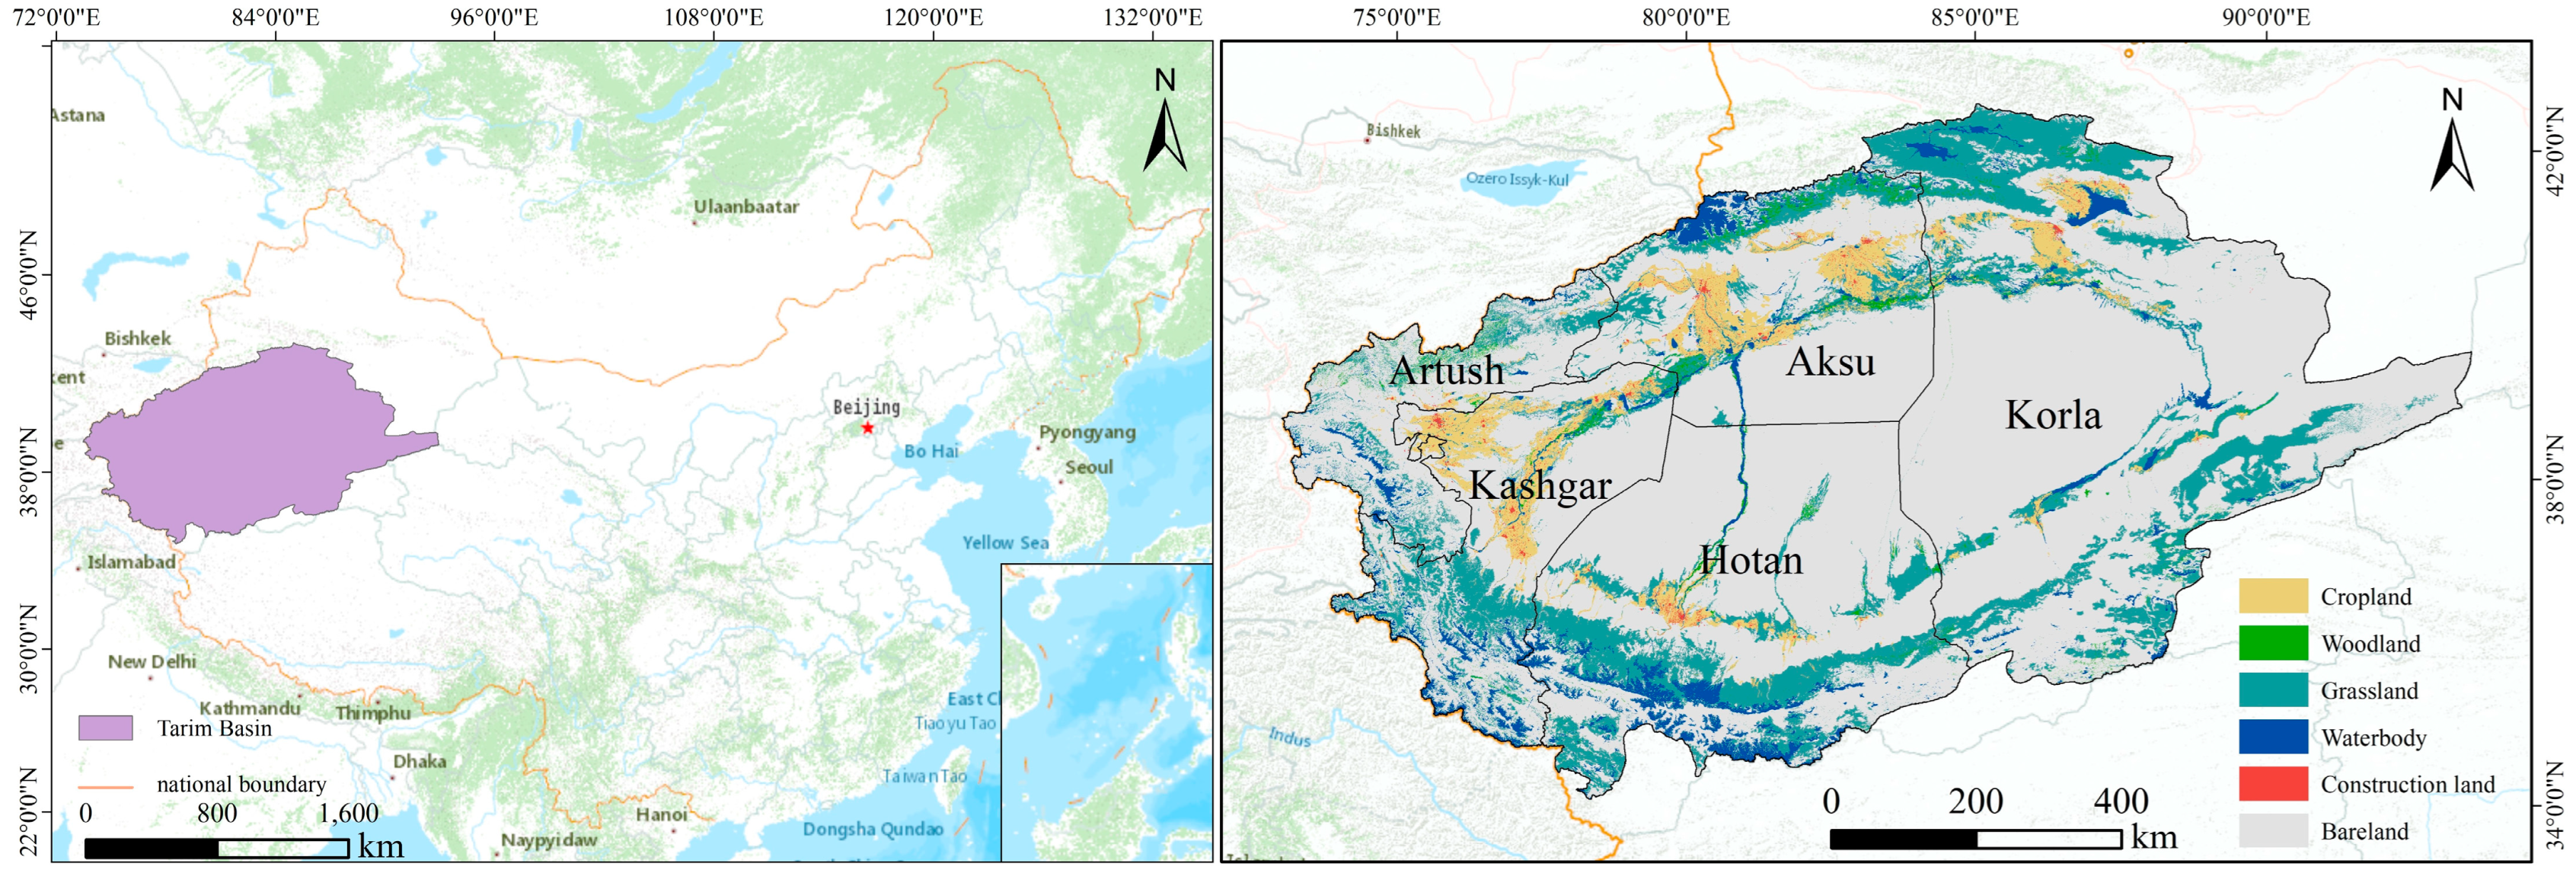
2.1. Study Area

The Tarim River Basin is located in northwestern China (34°55′–43°08′ N, 73°10′–94°05′ E), in the southern region of the Xinjiang Uygur Autonomous Region (Figure 1). The region has arid climatic conditions, characterized by an average annual precipitation of approximately 50 mm and potential evapotranspiration ranging from 2300 to 3000 mm, representing a typical temperate arid continental climate [26]. The Tarim River Basin encompasses five autonomous prefectures and includes extensive glaciers, primarily located in high-altitude areas such as the Karakoram Mountains and Muztagh Peak. These glaciers, often referred to as “solid reservoirs”, primarily supply the rivers and lakes of the Tarim River Basin with meltwater. Through the past few decades, agricultural cultivation and the excessive exploitation of water resources have led to the ongoing degradation of the ecological environment in the basin, and severe vegetation degradation has resulted in a downward trend in HQ. Balancing land resource planning and ecological security while maintaining rapid economic and social development has gradually become a significant topic of research in this region.

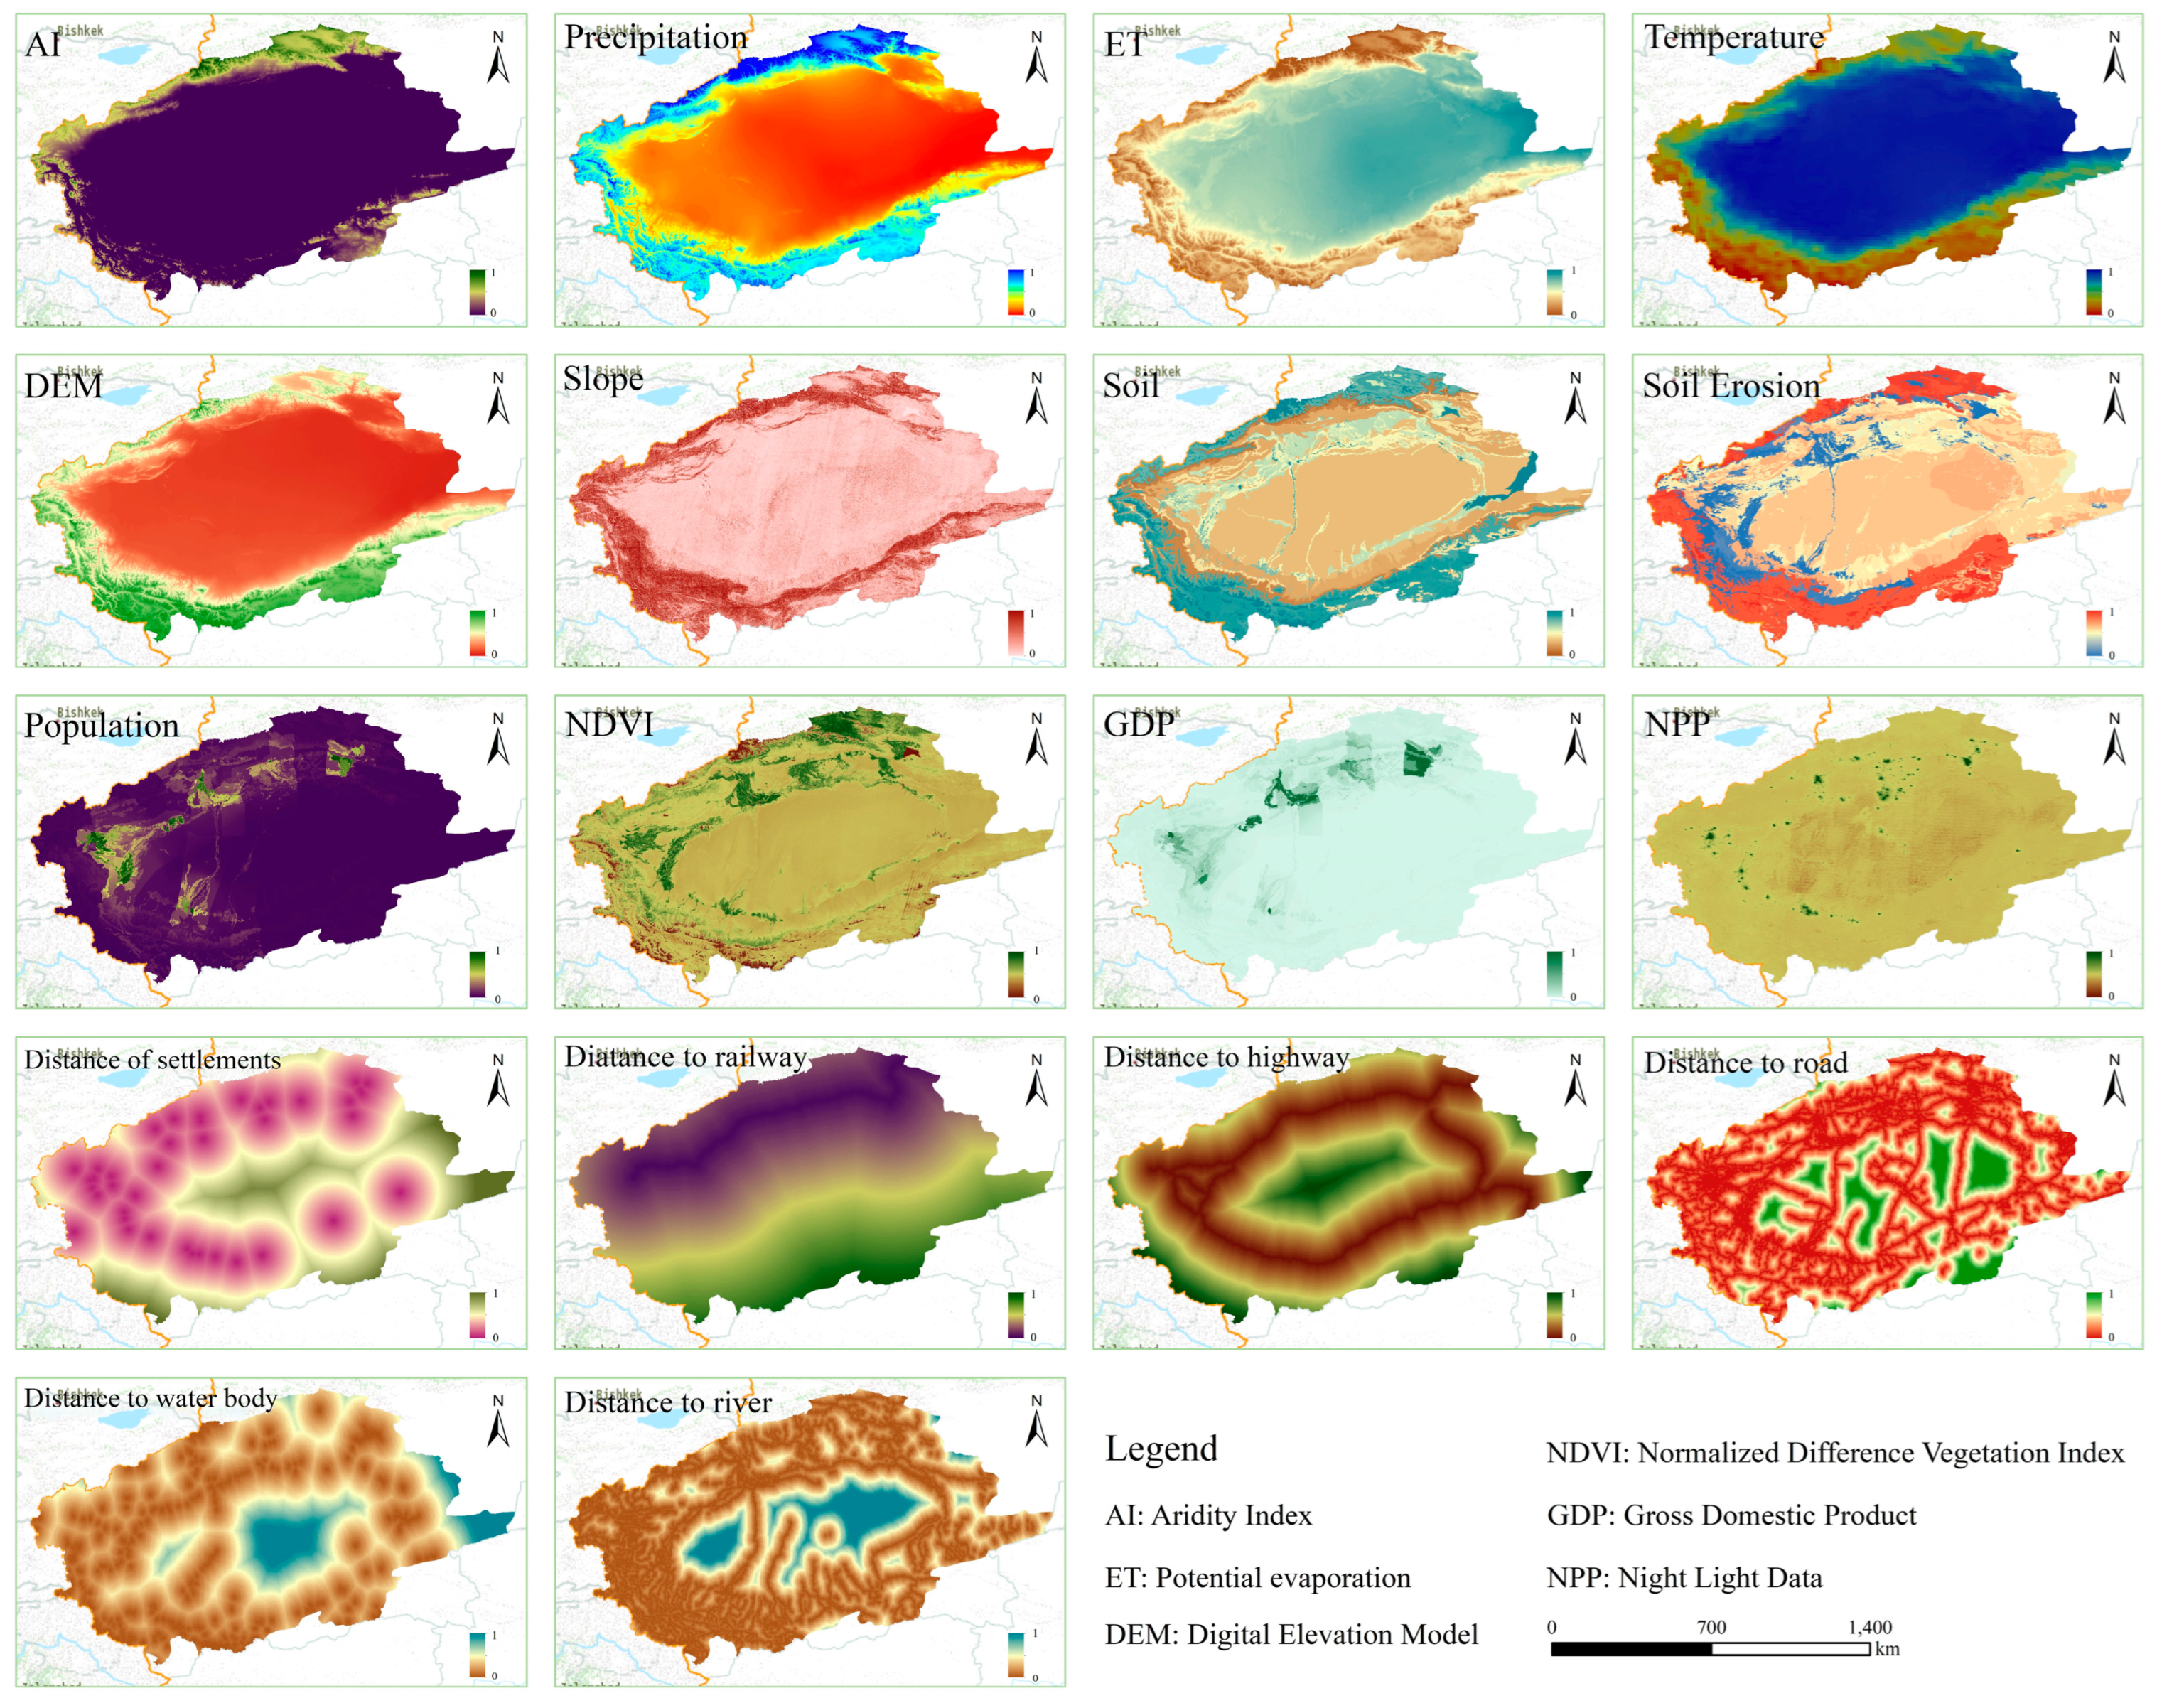
2.2. Data Description

The data types used in this study primarily included spatial data and statistical data. The spatial data were mainly land-use and land-use simulation influencing factor data. The land-use dataset consisted of six series of products: China’s 30 m annual land-cover product (30 m), the Chinese Academy of Sciences (30 m) product, GlobeLand 30 (30 m), ESA_CCI (300 m), MODIS (500 m), and the Chinese Academy of Sciences (1000 m) product. The nine sets of LULC data were reclassified according to the first-level land-use classification standard of the Chinese Academy of Sciences, which includes the six categories of cropland, forest land, grassland, water, construction land, and bare land. As shown in Figure 2, the PLUS model influencing factor data included a total of 18 categories, such as temperature and precipitation. The statistical data included (1) economic and climatic data required for the SD model, sourced from the Xinjiang Uygur Autonomous Region Statistical Yearbook from 2000 to 2020, and (2) economic data for the CMIP6 project, derived from GDP forecast data under five SSPs [27]. The population data parameters were based on grid data at the scale of future Chinese population censuses [28], and the temperature and precipitation data were sourced from the A Big Earth Data Platform for Three Poles website. Details of the data are provided in Table 1.

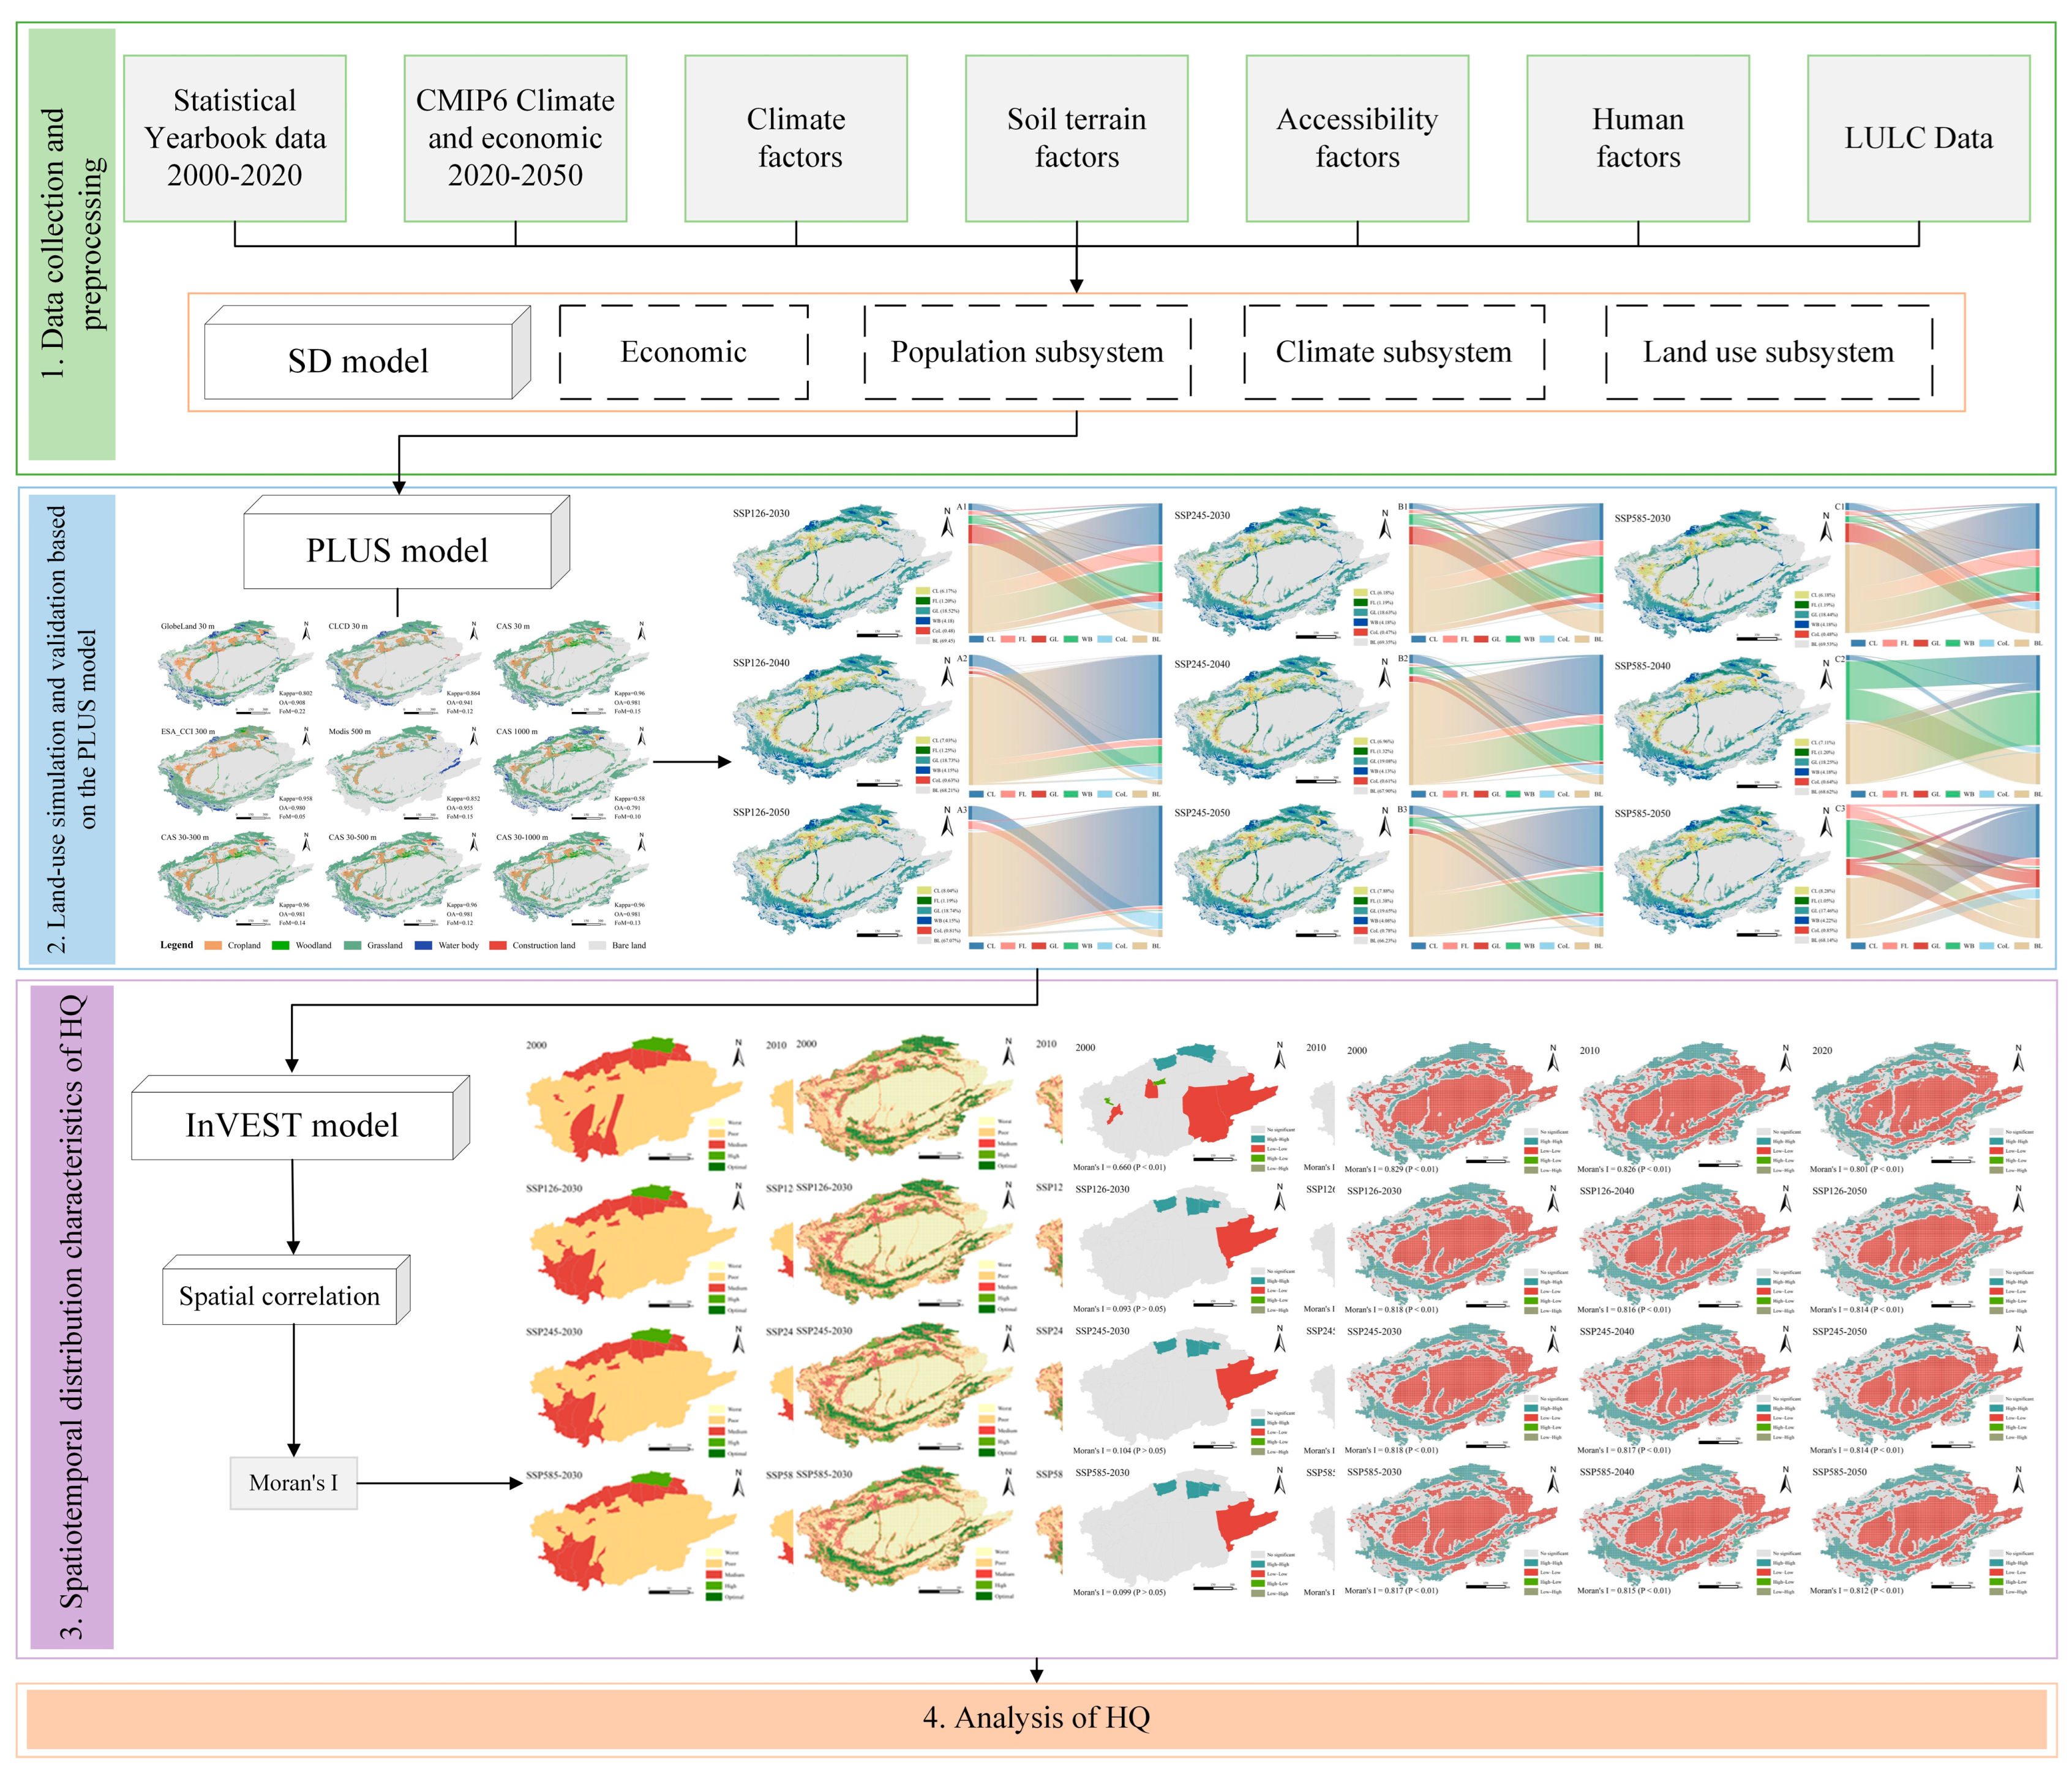
2.3. Technical Framework and Methods

The technology roadmap was comprised of four sections (Figure 3). These included data preprocessing, land-use simulation, spatial distribution analysis of HQ, and analysis of the influencing factors of HQ. We compared the suitability of nine sets of land-use data and selected the most appropriate land-use dataset for this study; based on the CMIP6 climate, population, and economic data for the Tarim River Basin, we conducted our research to forecast the land-use demands in the region using a system dynamics (SD) model These predictions were then input into the PLUS model for spatial land-use prediction. Finally, the InVEST-HQ model was used to compute the HQ. Upon completing the aforementioned procedures, we conducted a spatial analysis of the HQ distribution using the geographic detector. Spatial heterogeneity tests and analyses of HQ changes in the Tarim River Basin were performed across different scales and scenarios. The detailed steps of data processing and methodology are recorded in the references [29,30].

2.3.1. Development Scenarios

To understand the economic growth potential of the Belt and Road Initiative comprehensively and confront the challenges posed by continuous ecological degradation, we amalgamated the developmental strategies outlined in CMIP6 with various measures, including afforestation, demographic shifts, and governmental policies. This integration led to the formulation of three unique socioeconomic pathways. The SSP126 scenario emphasizes the adaptive and mitigative measures for economic challenges, highlighting sustainable development. It envisions a relatively moderate human impact on the environment, resulting in reduced ecological challenges and improved ecological resilience. The SSP245 scenario integrates SSP2 and RCP4.5, thus assuming that humanity maintains the current development and emission trends in the absence of major policy changes. This development pattern is commonly utilized in the Coordinated Regional Downscaling Experiment (CORDEX) for regional downscaling and the Decadal Climate Change Prediction Project (DCCP). In addition, SSP245’s land-use and aerosol pathways are relatively moderate, representing a scenario of moderate societal vulnerability and moderate radiative forcing. The SSP585 scenario assumes large-scale utilization of fossil fuels, continuous emissions of greenhouse gases, and unrestrained exploitation and degradation of the ecological environment.

2.3.2. SD-PLUS Model

To predict future land-use changes under different development pathways scientifically, this study established nonlinear relationships between historical and CMIP6-simulated socioeconomic data and land-use changes. A complex framework, including land use, population, climate, and economy, was constructed using the SD model, which was then utilized to simulate the trends of land-use changes under the three future scenarios. The PLUS model, on the other hand, utilized the future demand and trend changes of the six land types acquired from the SD model as a foundation. It was used to integrate existing land-use data with land-use planning policies and simulate the spatial distribution of land use from 2020 to 2050. This simulation framework comprehensively considered the economic effects and ecological environments, taking into account the impacts of human–land conflicts and multiple driving factors on the expansion of different land-use types. By adjusting the weights and conversion probabilities, the dynamic simulation process of random patches and the spatial distribution probability of land types were controlled, thereby effectively enhancing the simulation’s accuracy. Widely applied in future land-use change simulation studies, this approach ensures precision and reliability [21,31].

2.3.3. InVEST-HQ Model

Closely associated with biodiversity, HQ refers to the capacity of ecosystems to provide suitable conditions for the sustained existence of individuals and populations. The InVEST-HQ module is currently one of the most effective means of assessing HQ [32,33]. HQ is calculated by using habitat suitability data for each land-use type, along with the influence distances and weights of various stressors and the sensitivity data for each land-use type to these stressors. The primary equation is presented below:
H Q = H J [ 1 ( D x j z D x j z + K z ) ] ,
where HQ is the HQ of surface cover type-j raster x, H J is the suitability of LULC-type j for the habitat, D x j z is the degree of HQ degradation in unit x of LULC-type j, z is the default parameter, and the semi-saturation constant k is typically set to 0.5.

2.3.4. Spatial Autocorrelation and Hot-spot Analysis of HQ

The Moran index was utilized to elucidate the spatiotemporal heterogeneity of HQ in more detail by analyzing the spatial distribution of HQ through spatial autocorrelation models. Global Moran’s I was employed to ascertain the spatial heterogeneity and correlation of HQ. A value closer to 1 indicates a stronger spatial autocorrelation among the HQ attributes, whereas a value closer to 0 suggests a weaker correlation. A value approaching −1 indicates a stronger negative correlation [34,35]. Local Moran’s I was used to identify different types of spatial clustering and dispersion phenomena within the study area. The primary equations are presented below:
G l o b a l M o r a n s   I = n i = 1 n j = 1 n W i j ( X i X ¯ ) ( X j X ¯ ) i = 1 n j = 1 n W i j i = 1 n ( X i X ¯ ) 2 ,
L o c a l M o r a n s   I = n ( X i X ¯ ) i = j n W i j ( X j X ¯ ) i = 1 n ( X i X ¯ ) 2 ,
where n is the number of samples, X i and X j are the attribute values of I and j, respectively, X is the mean value of all data, and W i j is the spatial weight matrix.
Cold- and hot-spot analyses are geospatial statistical methods used to identify significant clusters of high and low values. In this study, The Getis-Ord Gi* index was employed to determine the degree of geographic clustering of HQ in the Tarim River Basin [36]. The statistical significance of the Getis-Ord Gi* values was assessed using z-scores and p-values, with significance determined at a 95% confidence level. The primary equation is presented below:
G i * = j = 1 n W i j x ¯ j = 1 n W i j j = 1 n x j 2 n 1 ( x ¯ ) 2 n j = 1 n W i j 2 ( j = 1 n W i j ) 2 ) n 1
where x_j is the HQ for grid j, W_ij is the spatial weight between grid i and grid j, and n is the grid number. x ¯ denotes the average HQ of evaluation units.

2.3.5. GeoDetector

To assess the explanatory power of the factors affecting the spatial heterogeneity of HQ, we employed factor detectors, with q-values serving as the evaluation metric. The formula used is as follows:
q = 1 1 N σ 2 h = 1 L N h σ h 2 = 1 S S W S S T
where SSW is the sum of squares within, and SST is the total sum of squares. The q-value ranges from 0–1, and higher q-values indicate a stronger explanatory power of HQ [37].

3. Results

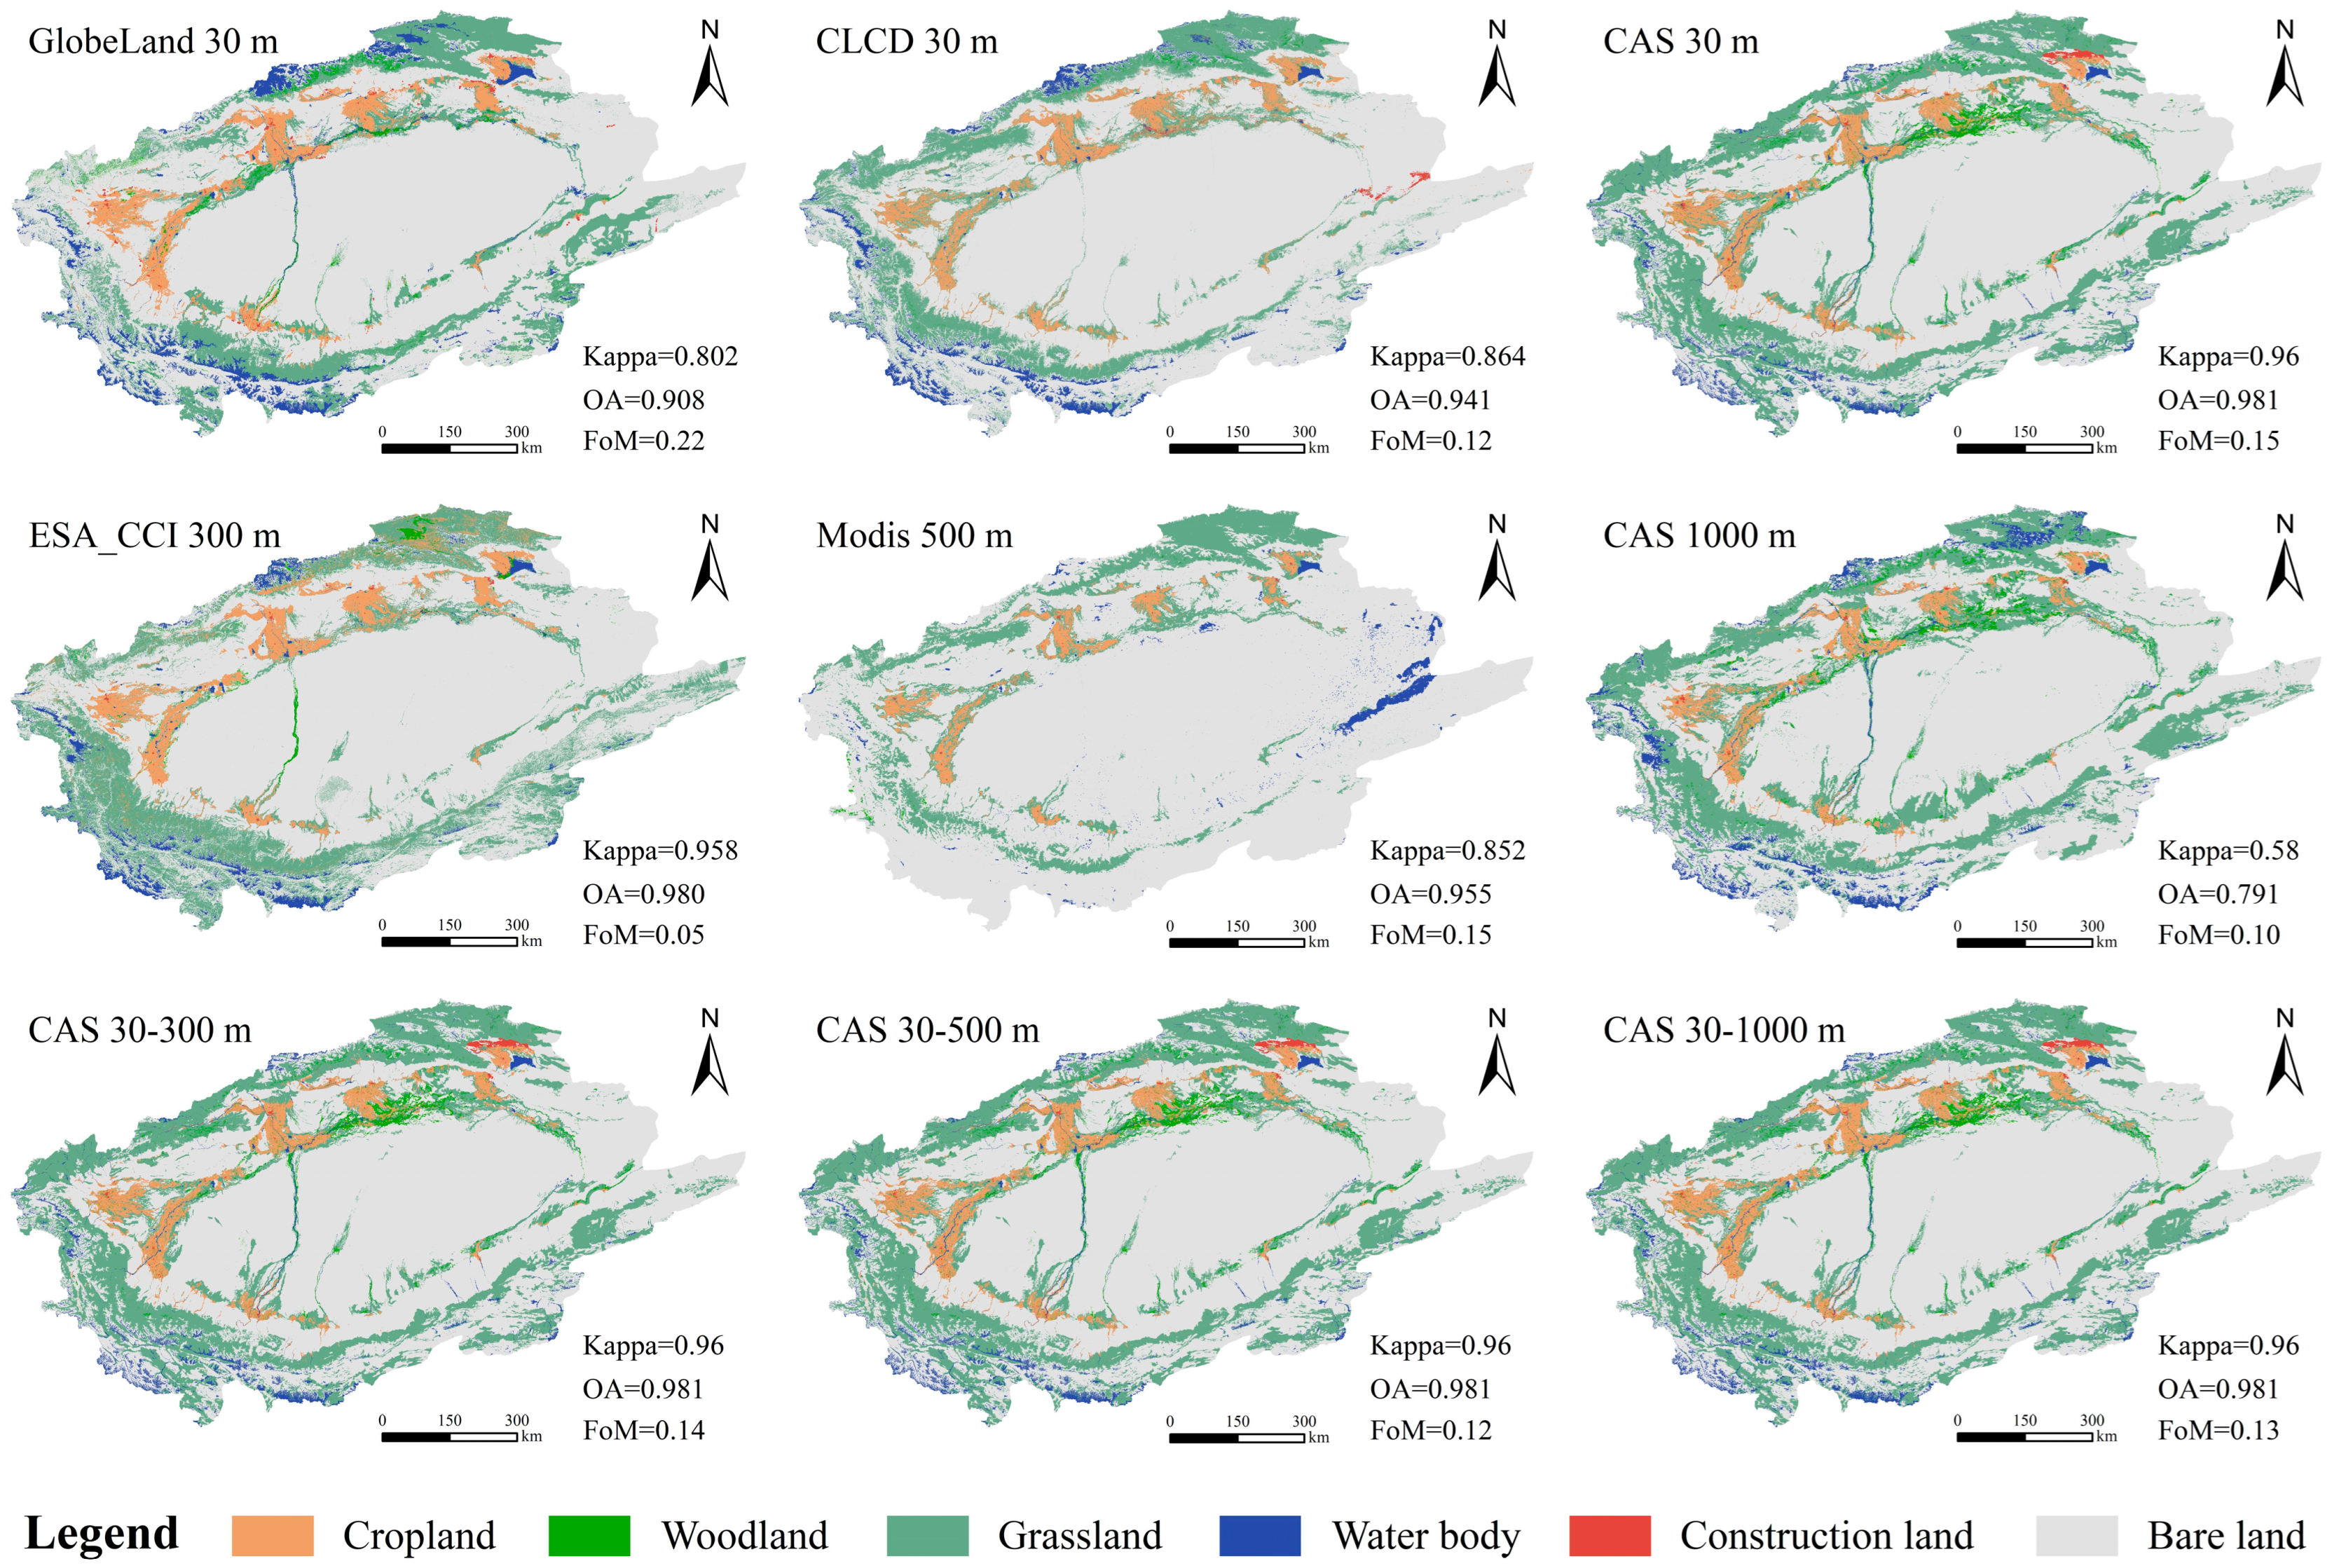
3.1. Evaluation of Simulation Accuracy Using Different Land-Use Data

As shown in Figure 4 (nine sets of 2020 land-use data simulated based on the PLUS model), the selection of land-use datasets plays a crucial role in the scientific validity of land-use simulation and related research. When the resolution was 30 m, the kappa values of GlobeLand 30, China’s 30 m annual land-cover product, and the Chinese Academy of Sciences land-use dataset were 0.802, 0.864, and 0.960, respectively. The overall accuracy (OA) values were 0.908, 0.974, and 0.981, and the figure of merit (FoM) values were 0.22, 0.12, and 0.15, respectively. A comparison with the actual ground conditions revealed that some areas of cultivated land in the riparian zone of the Tarim River were classified as construction land in China’s 30 m annual land-cover product dataset, and similar issues were observed in the downstream region of the Tarim River. In the Chinese Academy of Sciences land-use dataset, there were instances in which cropland around Bosten Lake was classified as construction land. Therefore, despite the higher classification accuracy of China’s 30 m annual land-cover product and the Chinese Academy of Sciences land-use dataset (kappa value) and considering the regional characteristics and the correctness of the simulation (FoM), the GlobeLand 30 dataset series proved superior to the aforementioned two datasets. When comparing land-use data of different resolutions, there is no significant regularity in the simulation accuracy of the PLUS model. However, reducing the resolution can lead to the loss of local detailed land-use information. To analyze the impact of downscaling resolution on land-use simulation, the Chinese Academy of Sciences 30 m land-use data were resampled to 300 m, 500 m, and 1000 m, respectively. According to the simulation results, as the resolution decreased, the kappa and OA remained unchanged at 0.96 and 0.981, respectively, while the FoM showed a decreasing trend with values of 0.15, 0.14, 0.12, and 0.13, respectively. Based on a comprehensive analysis of the kappa, OA, and FoM results, the GlobeLand 30 dataset is more suitable for the actual conditions of the study area. Therefore, subsequent research will be based on the GlobeLand 30 dataset.

3.2. Characteristics of Land-Use Change

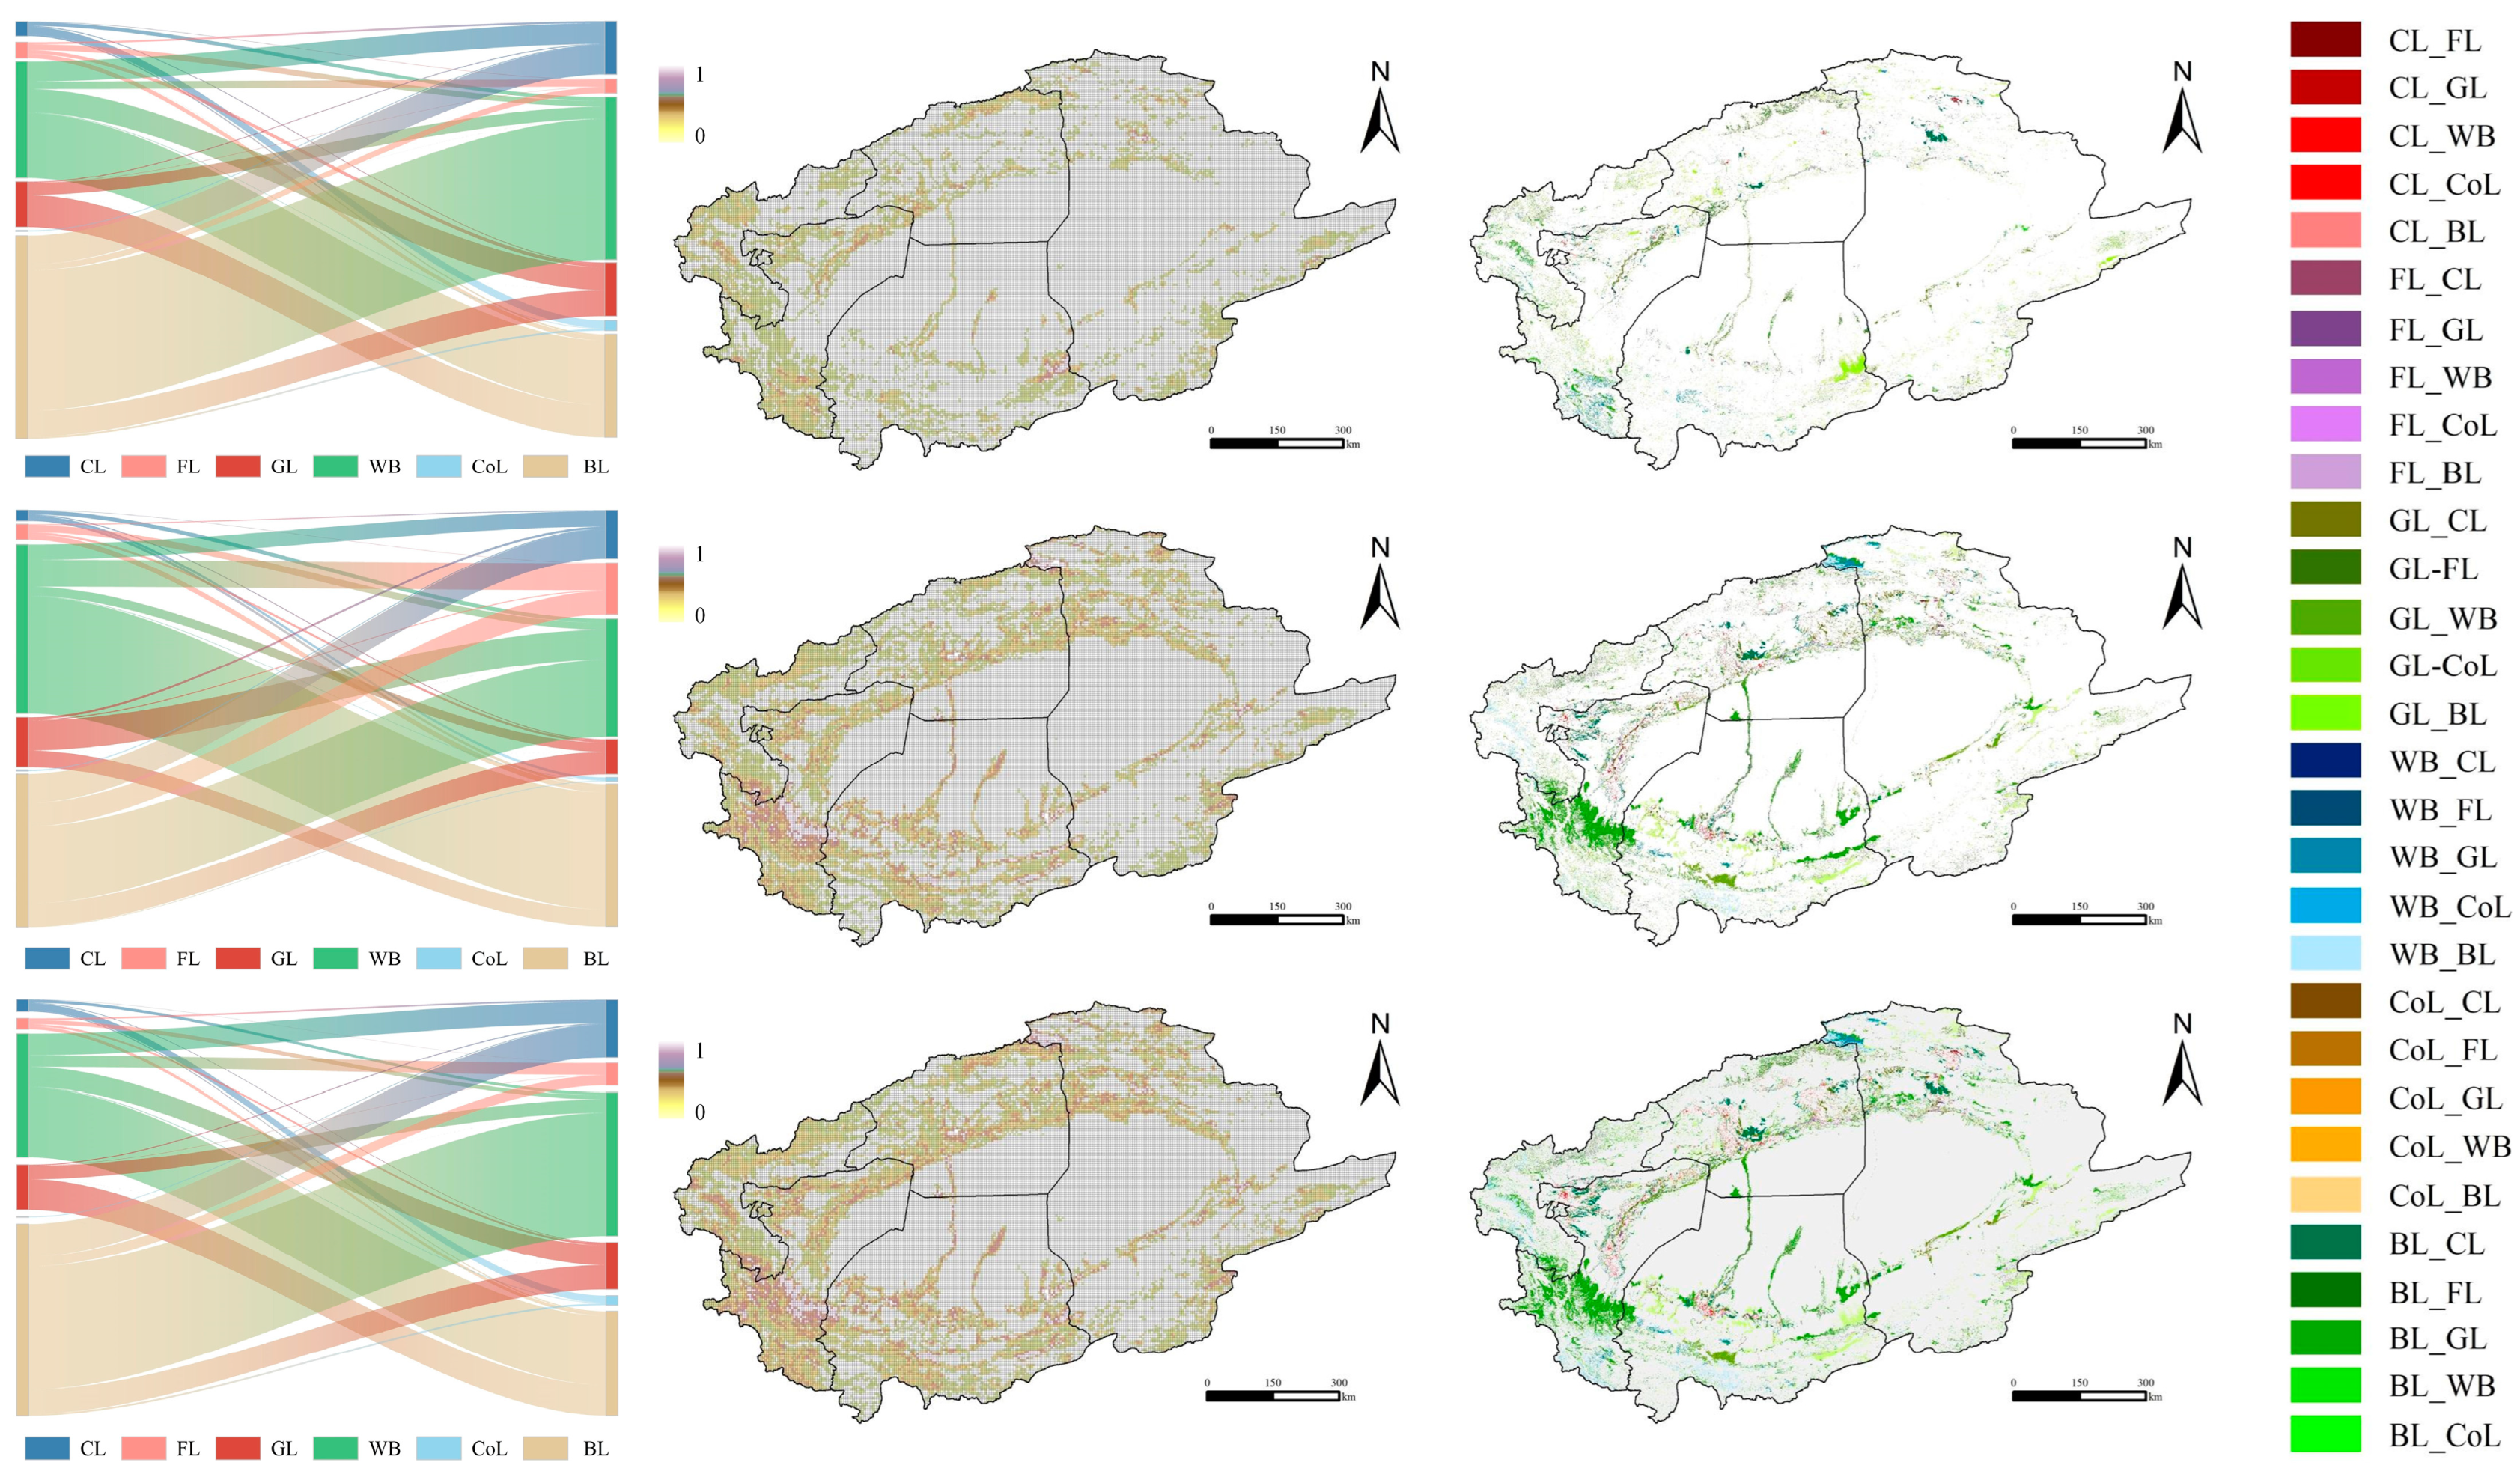
3.2.1. Spatiotemporal Changes of LULC (Historical Period)

As shown in Figure 5, from 2000 to 2010, among the six land-use types, grassland had the largest area of conversion, with 15,943.50 km2 transferred, accounting for 42.31% of the total land-use change. The grassland was mainly converted to bare land, grassland, and cropland, with transfer areas of 11,034.74 km2 (69.21%), 2544.83 km2 (15.96%), and 1147.65 km2 (9.08%), respectively. The bare land had a transfer area of 14,409.25 km2, primarily converting to grassland, cropland, forest land, and water bodies, with transfer areas of 7273.83 km2 (50.48%), 2718.49 km2 (18.87%), 2194.97 km2 (15.23%), and 2160.96 km2 (15.00%), respectively. The proportions of incoming land types were bare land (38.24%) > grassland (42.31%) > forestland (12.52%) > cropland (3.91%) > water body (2.74%) > construction land (0.28%). From 2010 to 2020, among the six land-use types, bare land had the largest area of conversion, totaling 44,896.64 km2 and accounting for 51.22% of the total land-use change. Primarily, it was converted into grassland, cropland, and water bodies, with conversion areas of 31,088.30 km2 (69.24%), 6336.60 km2 (14.11%), and 5729.69 km2 (12.76%), respectively. The area of grassland converted was 25,837.16 km2, which was primarily transformed into bare land, water bodies, cropland, and forestland, with areas of 14,366.21 km2 (55.60%), 5180.28 km2 (20.05%), 4534.84 km2 (17.55%), and 1628.68 km2 (6.30%), respectively. The proportions of incoming land types were as follows: bare land (51.22%) > grassland (29.47%) > water body (11.41%) > forestland (4.01%) > cropland (3.65%) > construction land (0.24%). In the period from 2000 to 2020, among the six land-use types, the type with the largest area of land converted was bare land, with a total of 50,690.09 km2, accounting for 49.94% of the total land-use change. This land was primarily converted into grassland, cropland, and water bodies, with areas of 32,577.92 km2 (64.27%), 8550.81 km2 (16.87%), and 6419.01 km2 (12.66%), respectively. The area of grassland converted was 32,668.02 km2, primarily transformed into bare land, cropland, water bodies, and forestland, with areas of 18,363.90 km2 (56.21%), 5706.75 km2 (17.47%), 5274.73 km2 (16.15%), and 3146.20 km2 (9.63%) respectively. The proportions of incoming land types were as follows: bare land (49.94%) > grassland (32.19%) > water body (11.70%) > cropland (3.09%) > grassland (2.89%) > construction land (0.20%). As shown in Figure 5, regions with a high intensity of change were mainly located in areas with a high population density and plateau and mountainous areas. Additionally, regions with a high intensity of change were larger during the period of 2010–2020 than during the period of 2000–2020.

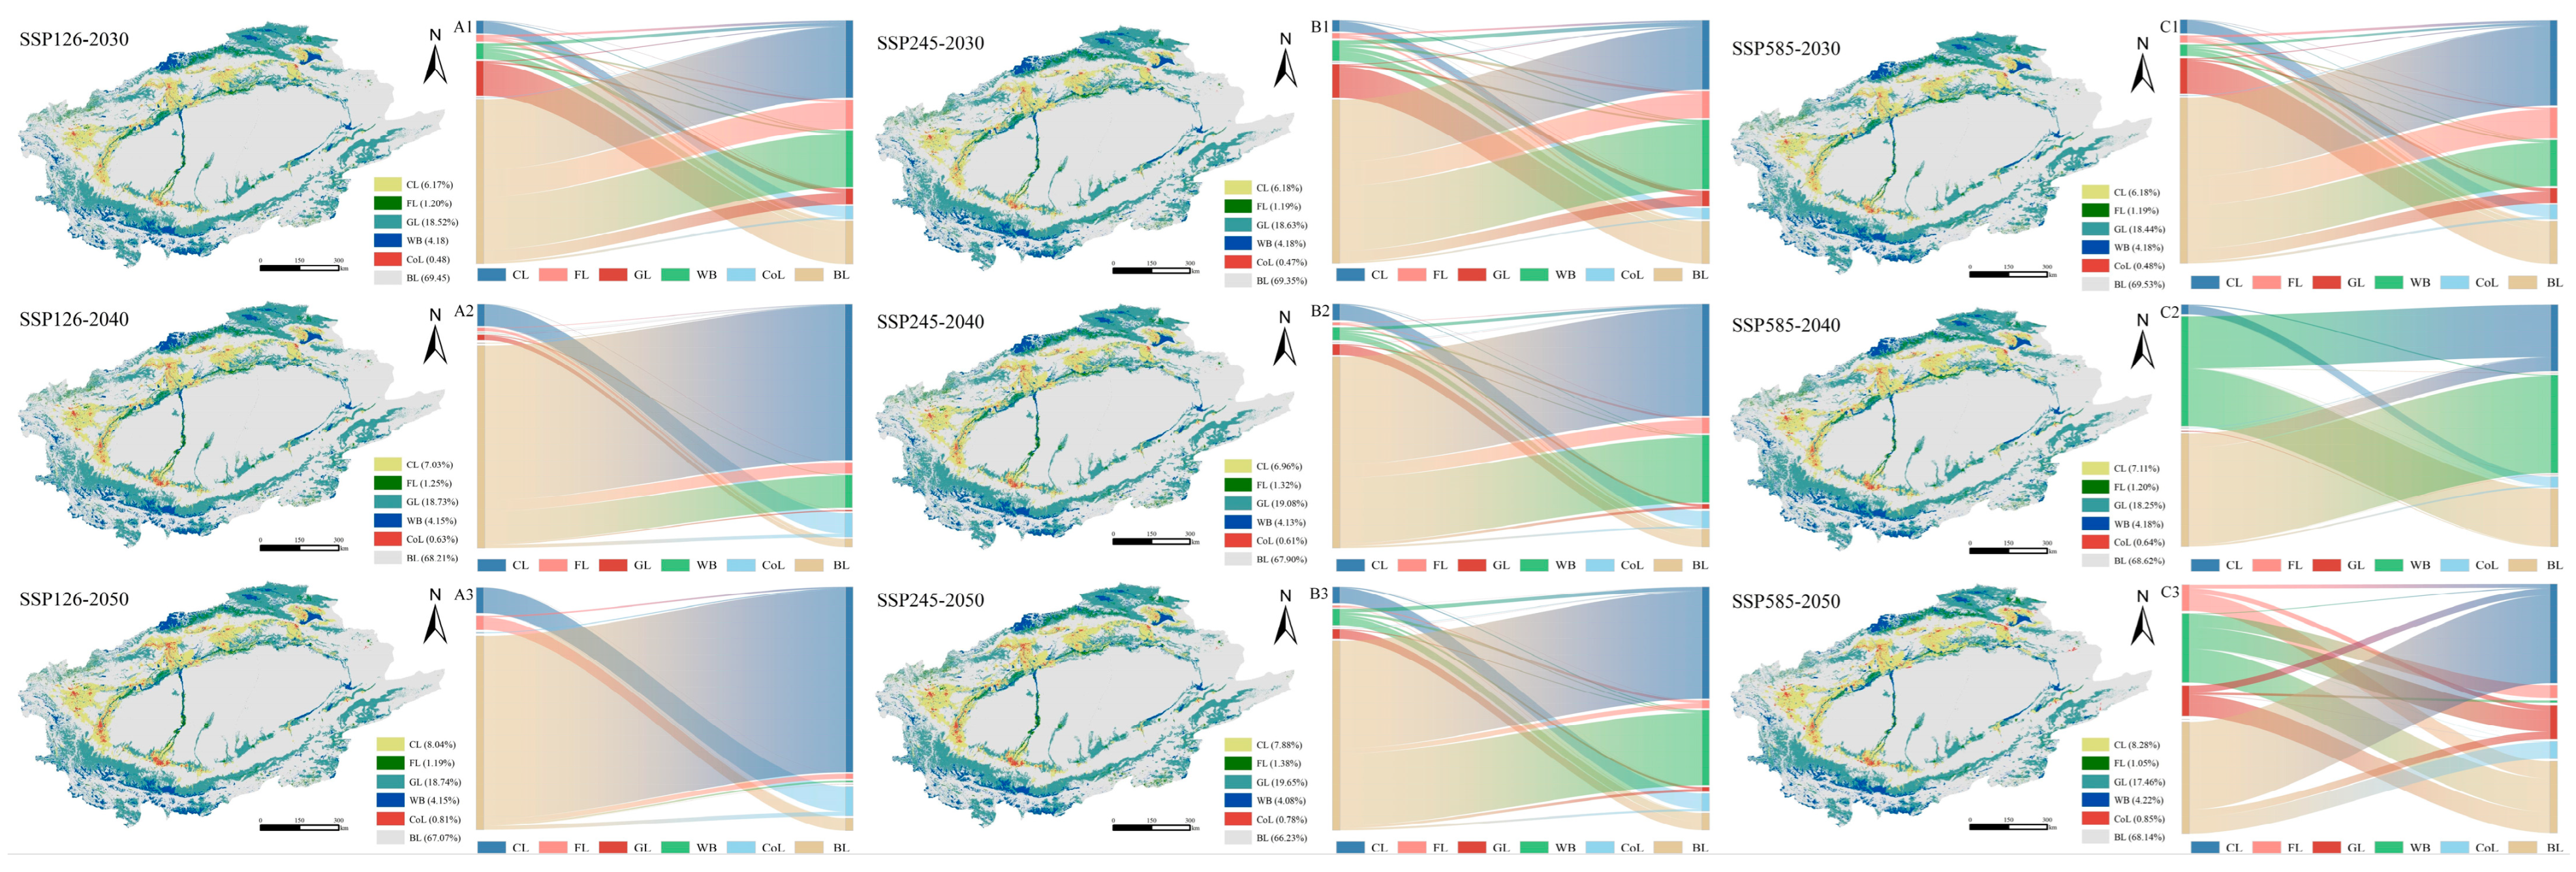
3.2.2. Spatiotemporal Changes in LULC (Simulation Period)

As shown in Figure 6, from 2020 to 2050, the simulated area of cropland in the Tarim River Basin shows an increasing trend, mainly distributed in the population-dense oases along the Tarim River. The growth rate of cropland is fastest under the SSP585 scenario, followed by SSP126. Specifically, under the SSP126 scenario, the proportions for the years 2030, 2040, and 2050 are 6.17%, 7.03%, and 8.04%, respectively. Under the SSP245 scenario, the proportions for 2030, 2040, and 2050 are 6.18%, 6.96%, and 7.88%, respectively. Under the SSP585 scenario, the proportions for 2030, 2040, and 2050 are 6.18%, 7.11%, and 8.28%, respectively. For forestland and grassland, significant differences exist across the three scenarios. Under both the SSP126 and SSP585 scenarios, forestland and grassland initially increase and then stabilize. From 2020 to 2030, both forestland and grassland show an increasing trend, reaching their peak during the 2030–2040 period. Forestland then exhibits a slight decreasing trend, while grassland continues to increase moderately, with the trend stabilizing over time. Forestland is mainly distributed along the Tarim River and in the transitional zones between urban areas and deserts, whereas grassland is primarily located in high-altitude regions and around water bodies. Under the SSP245 scenario, there is a continuously increasing trend. From 2020 to 2050, under SSP585, the area of construction land increases most rapidly, doubling by 2050 and exceeding 7000 km2. Under SSP245, the growth rate of construction land is slower than under SSP126 or SSP585, but the area still increases by more than 6500 km2 from 2020 to 2050. In all three future scenarios, water resources in the Tarim River Basin generally show a decreasing trend, although the reduction in area is relatively small. According to the land-use transition Sankey diagram (Figure 6A1–C3), under the SSP126 scenario, from 2020 to 2030, 42.89% of the bare land is converted to cropland. This percentage increases significantly to 76.35% and 94.35% for the periods 2030–2040 and 2040–2050, respectively. Under SSP245, the transition matrix shows that bare land is primarily converted into cropland, forestland, and grassland. In the SSP585 scenario, the proportion of other land types being converted to bare land increases gradually.

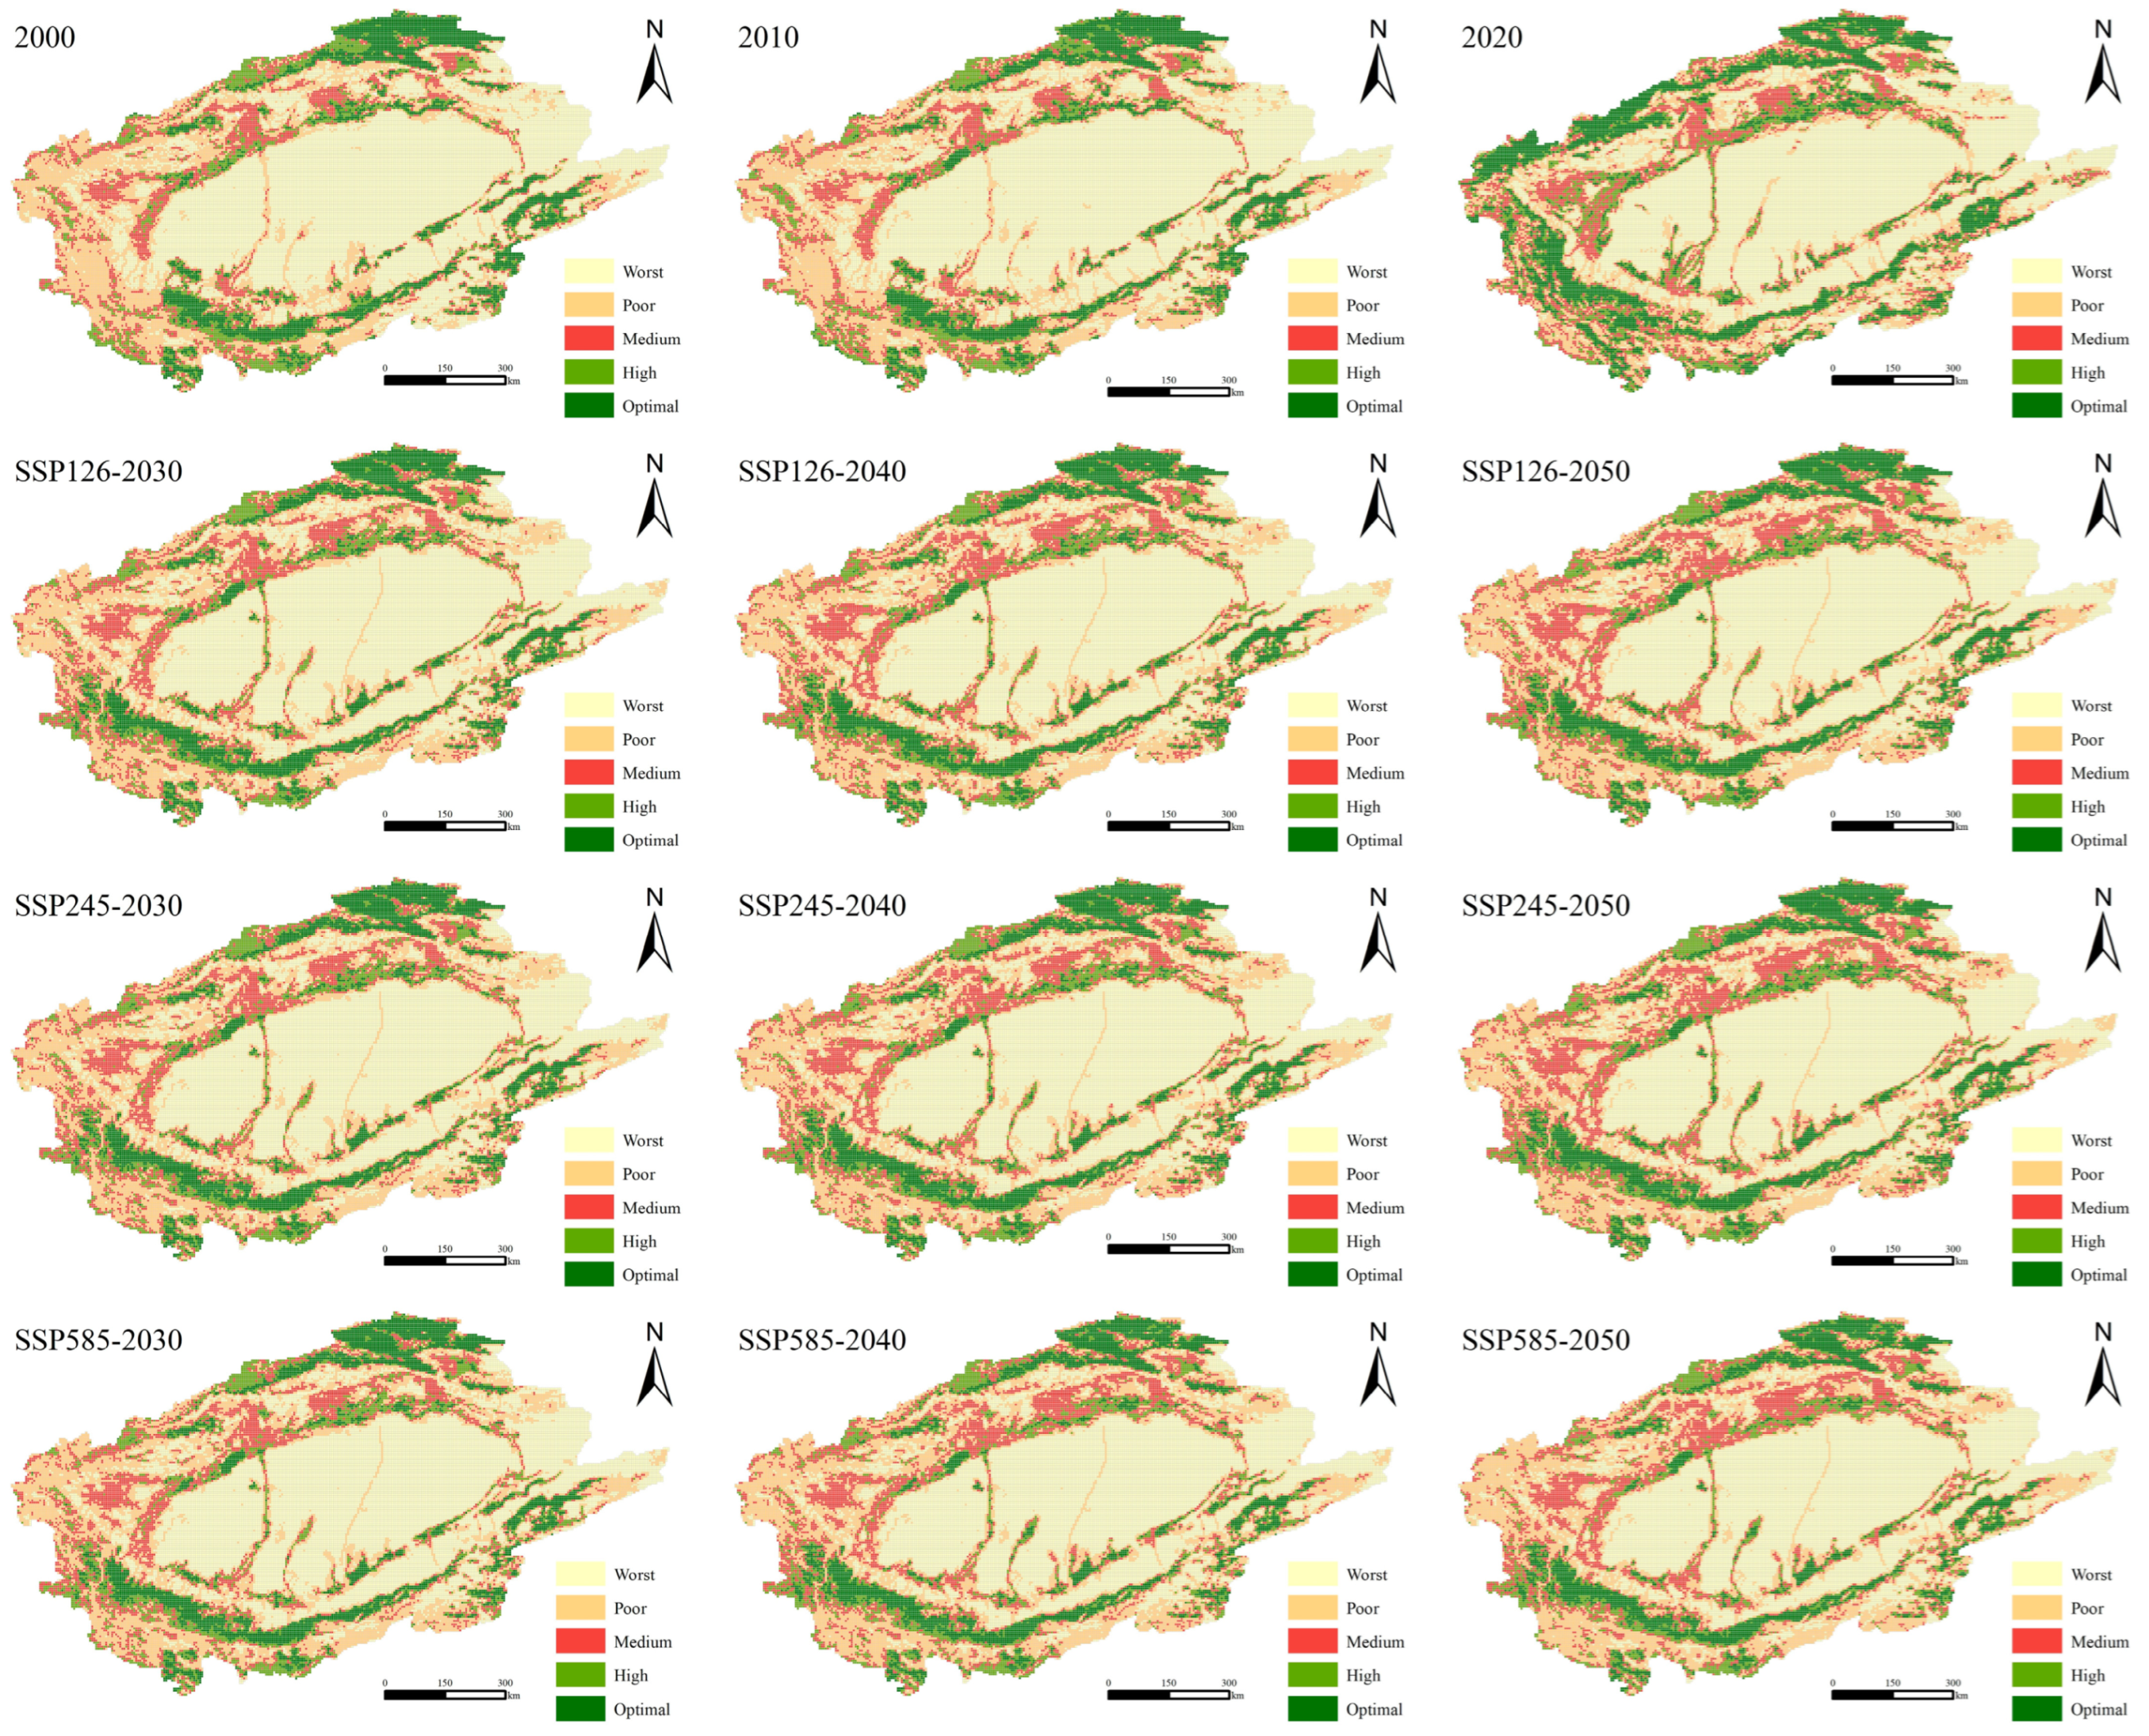
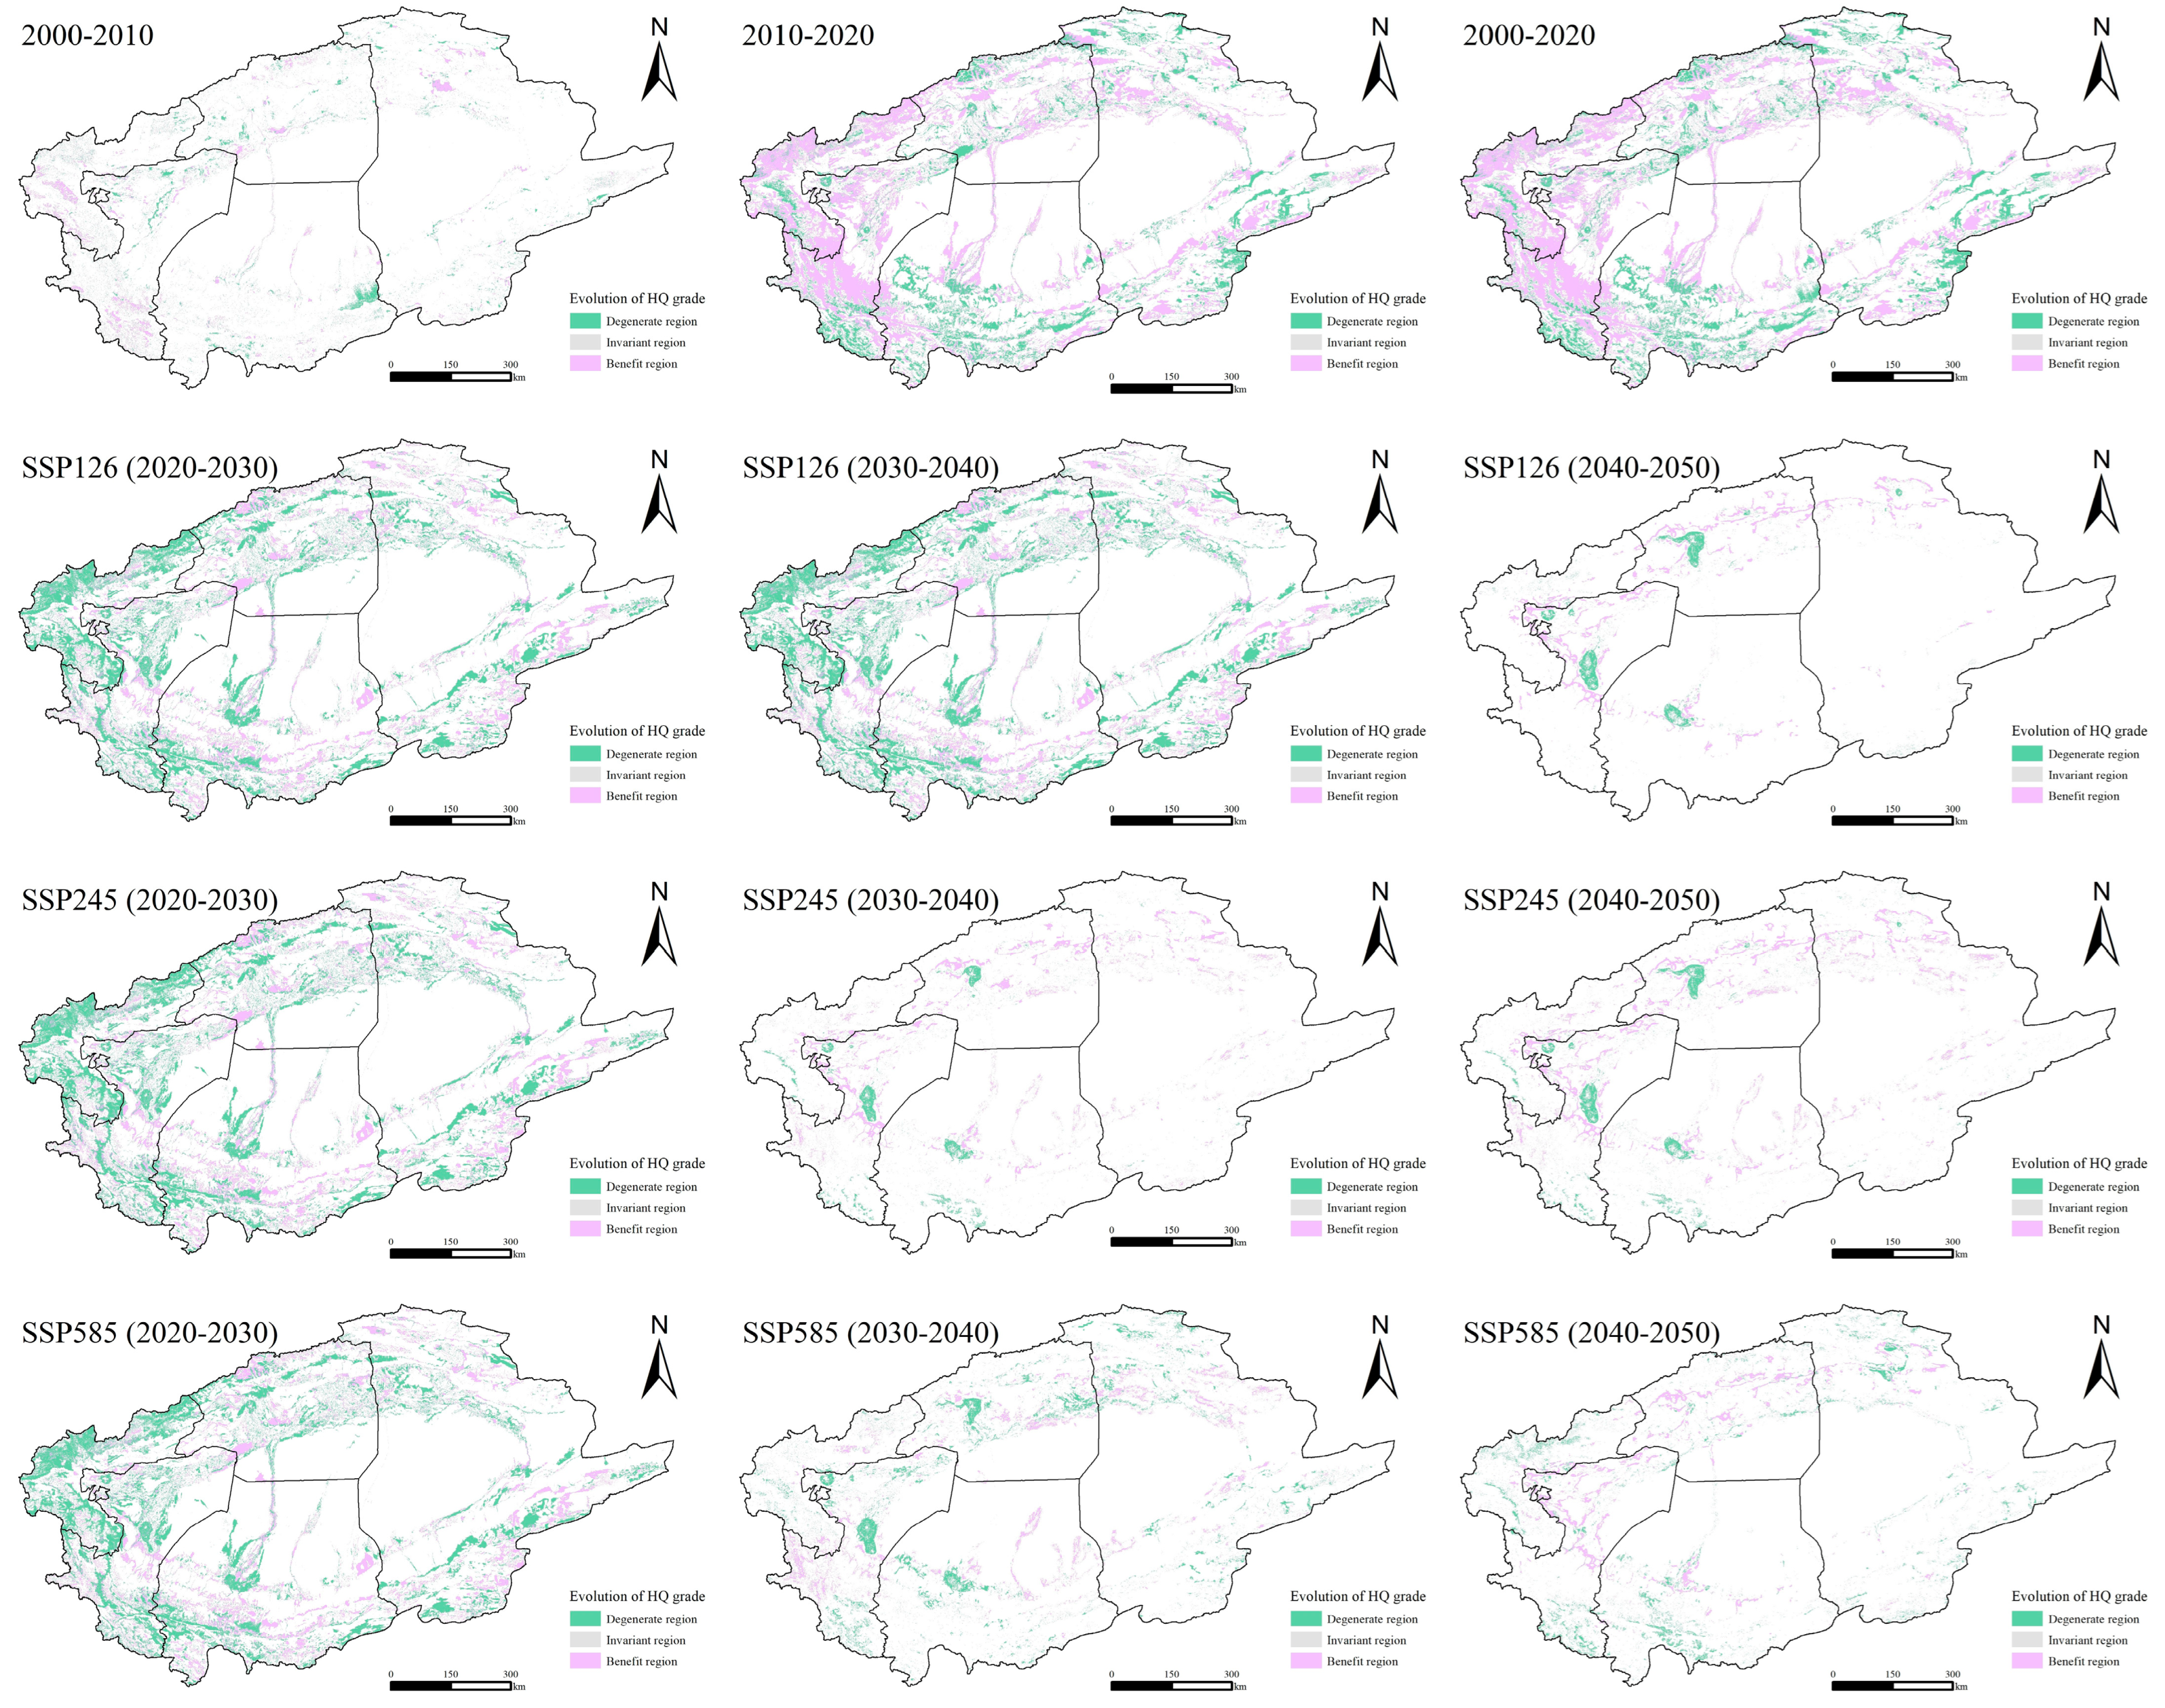
3.3. Change and Response of HQ

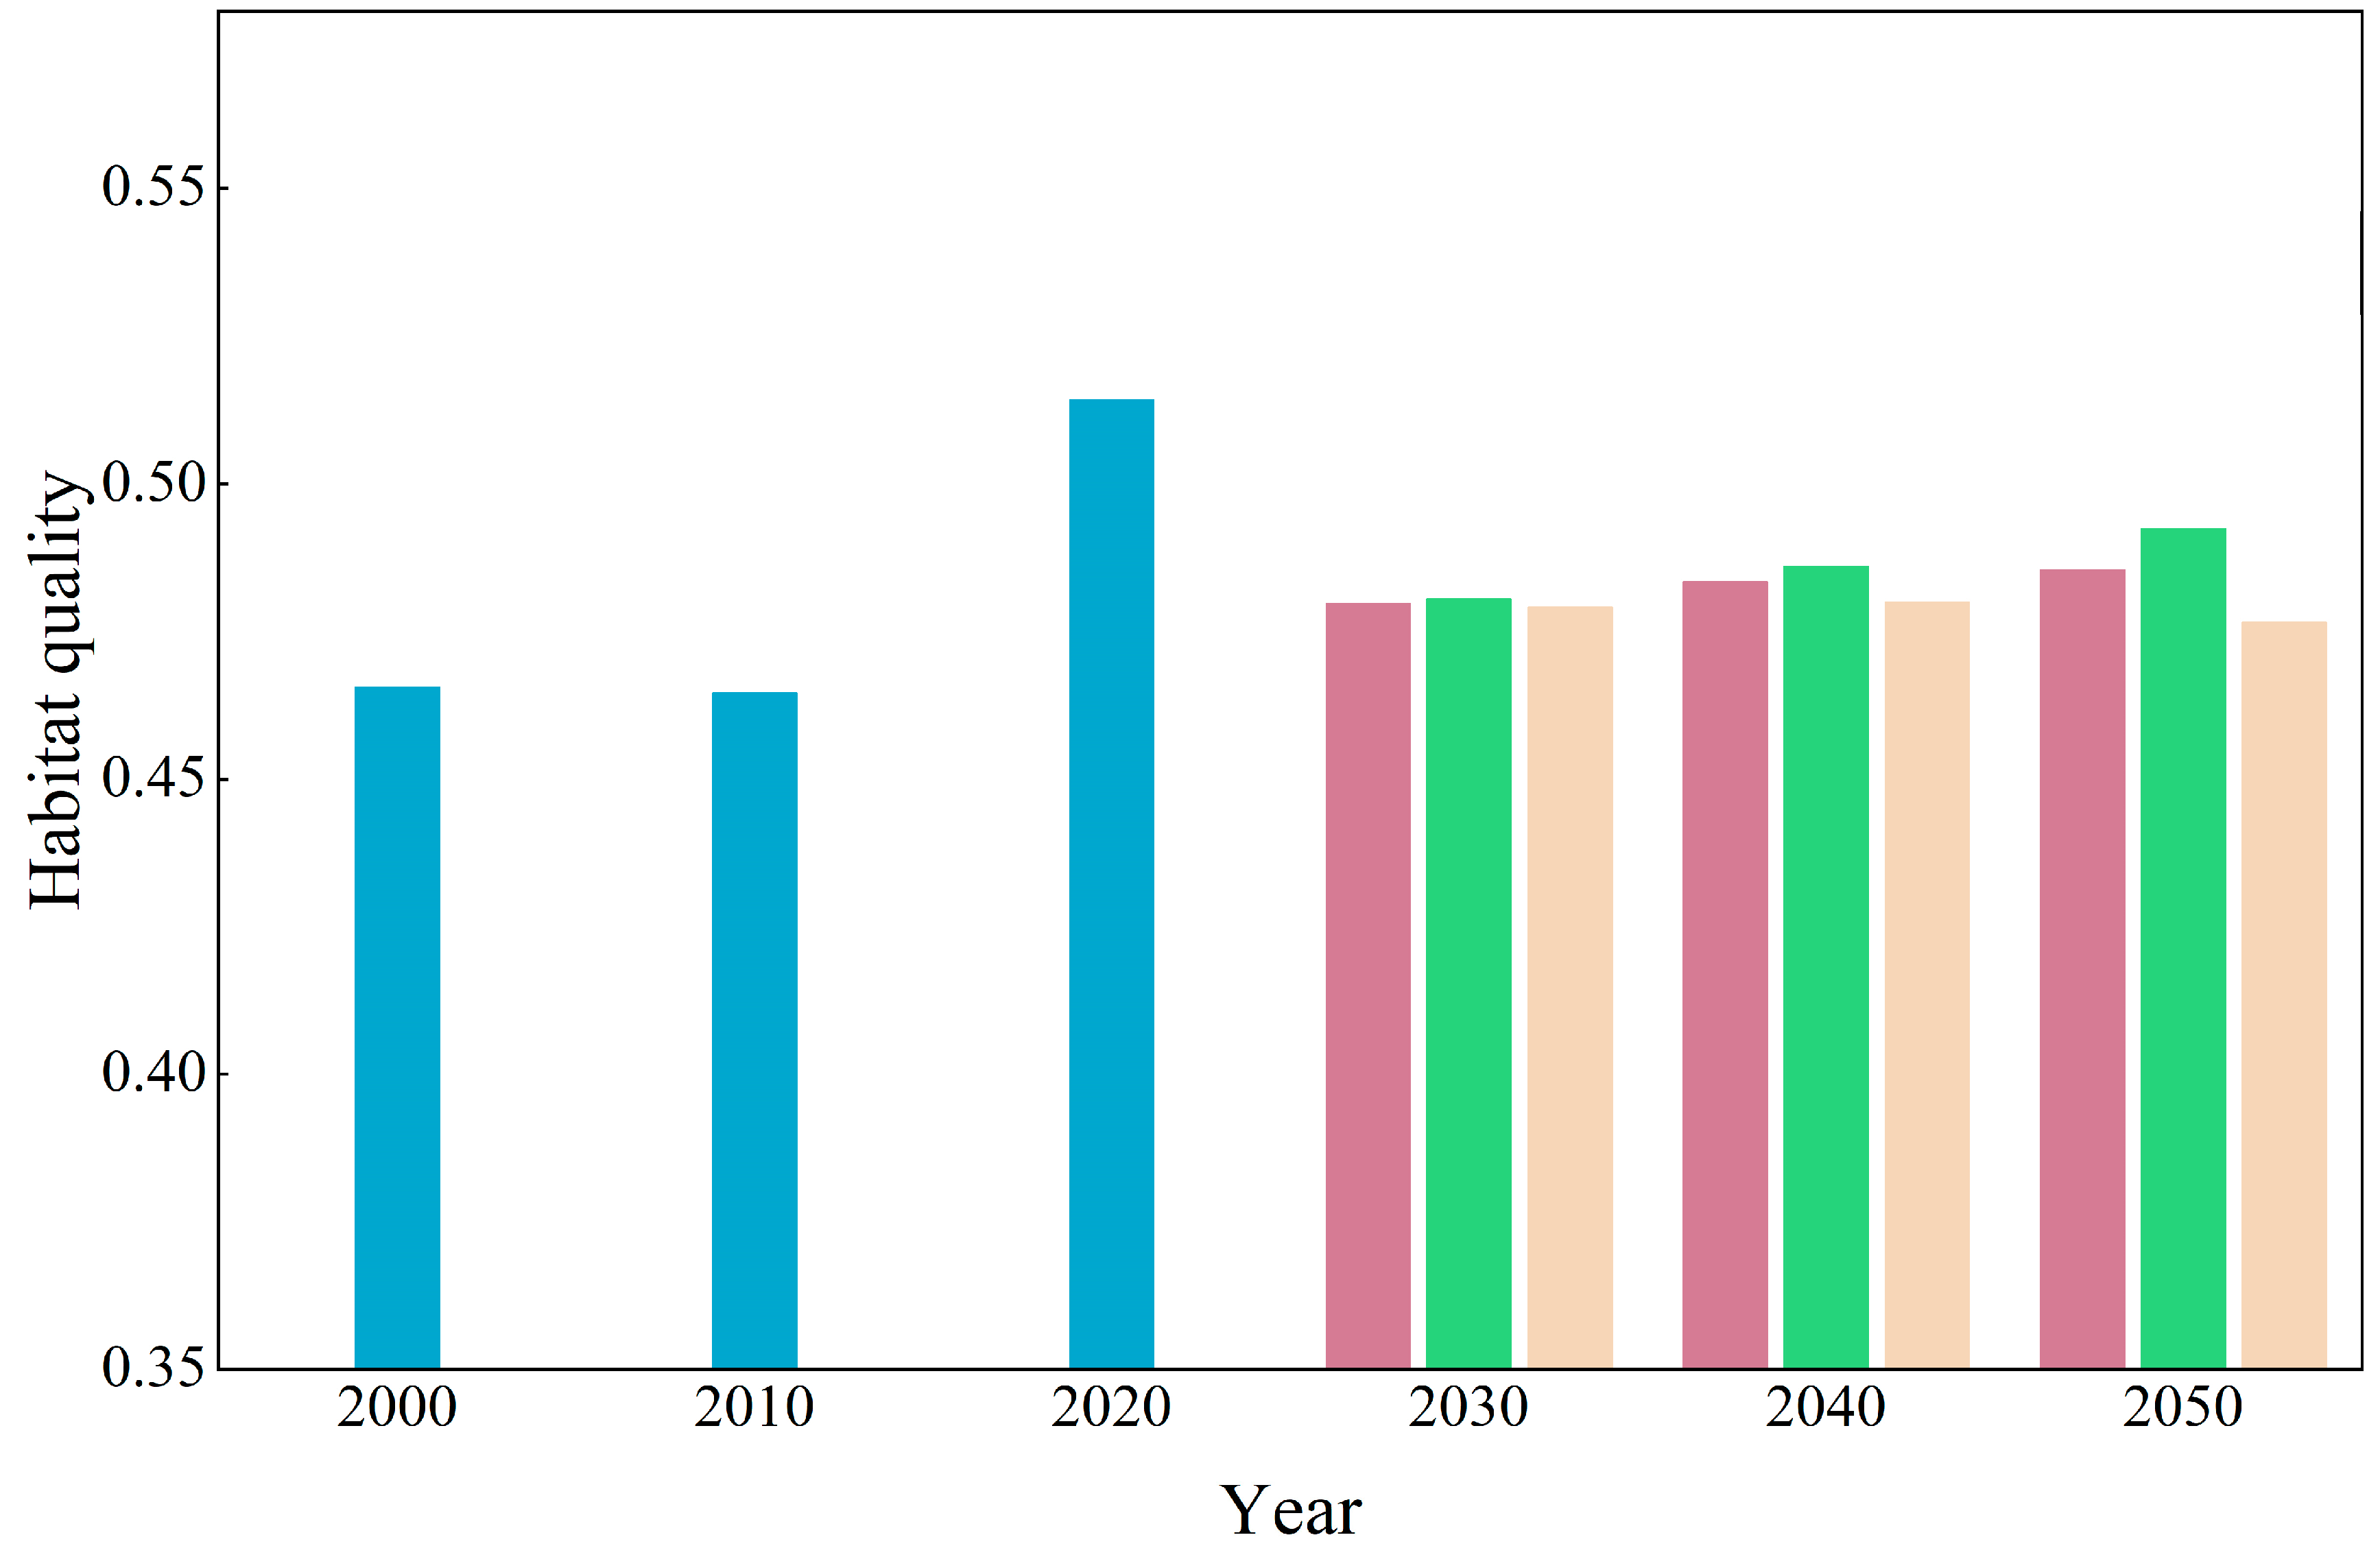
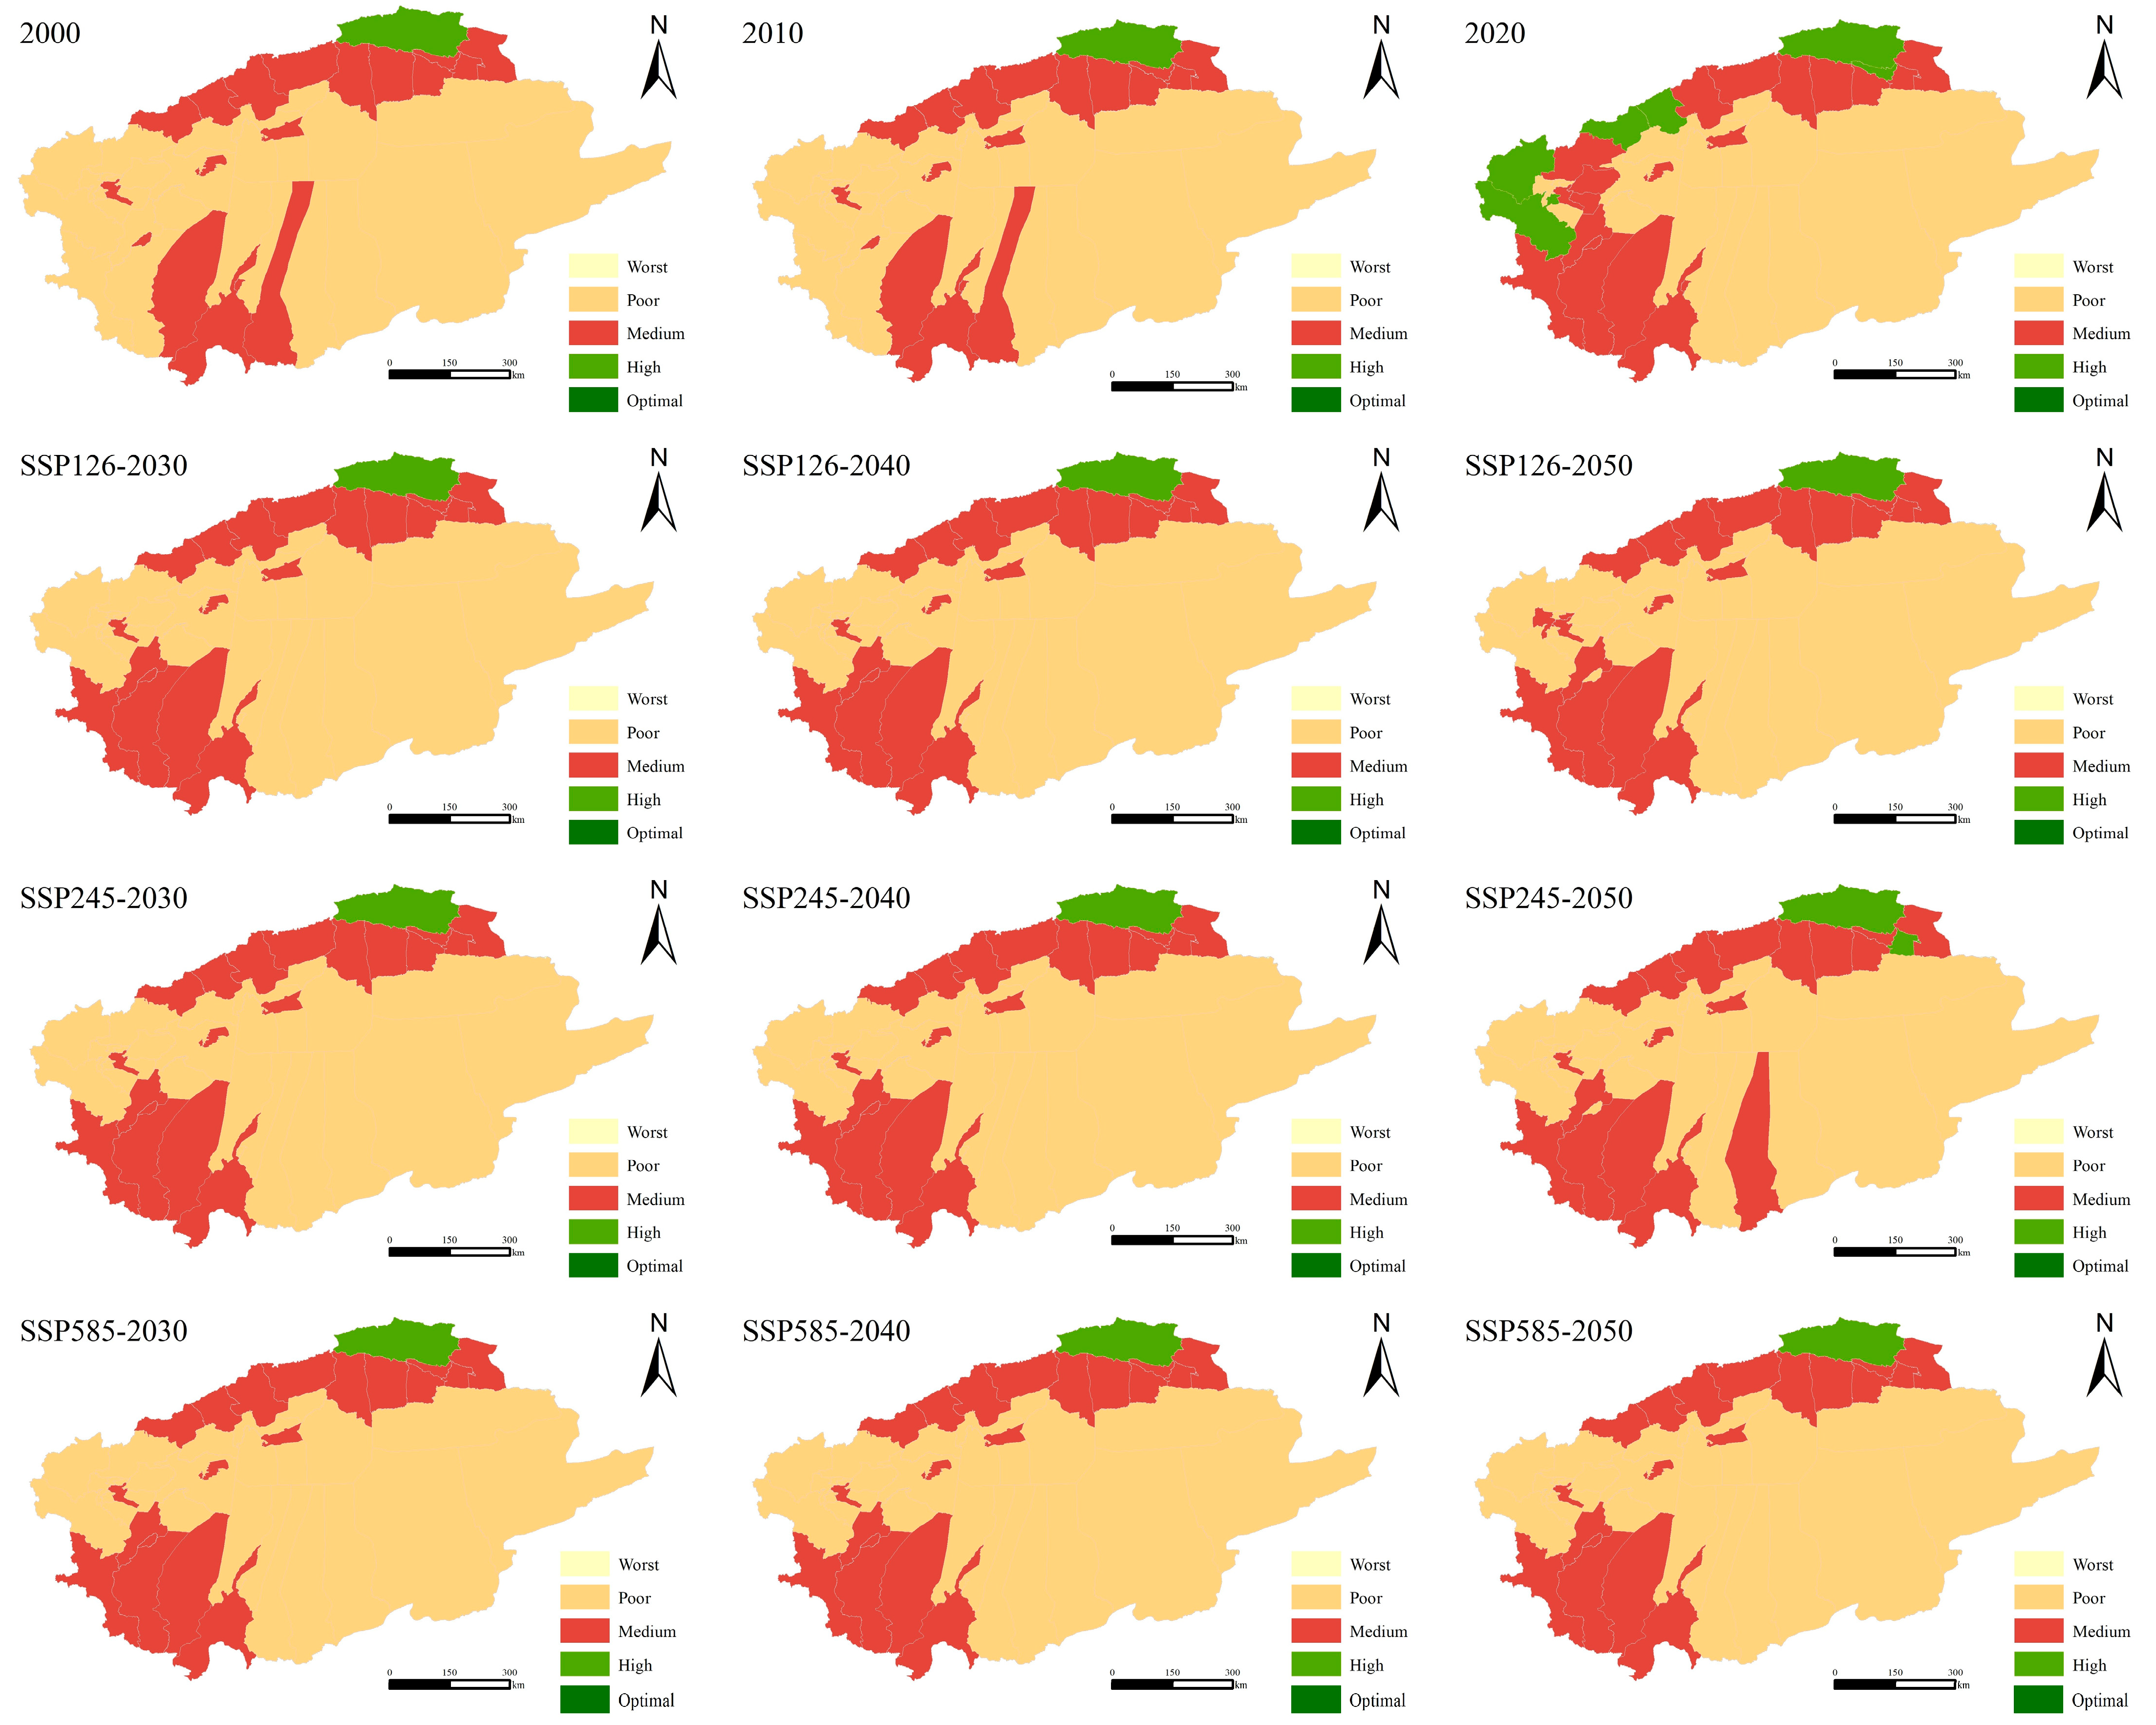
3.3.1. HQ Distribution and Evolution Under Different Scales

The average HQ of the Tarim River Basin for the historical period of 2000–2020 and the simulated scenarios for 2030–2050 are presented in Figure 7. The average HQ values for 2000, 2010, and 2020 were 0.4656, 0.4646, and 0.5143, respectively. Among the three simulated scenarios, the SSP126 scenario shows an increasing trend with average HQ values of 0.4797, 0.4834, and 0.4855 for 2030, 2040, and 2050, respectively. The SSP245 scenario exhibits a higher growth trend than SSP126, with average HQ values of 0.4805, 0.4861, and 0.4924, respectively. In contrast, the SSP585 scenario shows an initial increase followed by a decrease, with average HQ values of 0.4791, 0.4800, and 0.4766, respectively.
To study the spatial heterogeneity of HQ in the Tarim River Basin, we classified HQ into the five following categories: worst (0–0.3), poor (0.3–0.5), medium (0.5–0.7), high (0.7–0.9), and optimal (0.9–1). The spatial distribution of HQ was mapped at the county scale and fishnet scale, as shown in Figure 8 and Figure 9, respectively. At the county scale, the optimal HQ areas are primarily located in Hejing County of the Bayingolin Mongol Autonomous Prefecture. Medium-quality areas are mainly concentrated in the Tianshan and Kunlun Mountains and some densely populated areas. Most other regions fall into the poor category. The variation in HQ at this scale is relatively small, with higher HQ areas generally located in regions with abundant water resources, concentrated in mountainous areas, and around more developed urban areas.
Using a 5 km × 5 km fishnet to explore the distribution characteristics of HQ in the Tarim River Basin, as shown in Figure 9, the central cities and surrounding areas of the five prefectures (Hotan, Korla, Aksu, Kashgar, and Atush) generally fall into the medium category. Optimal areas occur mainly on the southern slopes of the Tianshan Mountains, in the Kunlun Mountains, in the Altun Mountains, and some desert riparian zones. Unlike the county scale, the fishnet scale, with its smaller grid size, reveals more areas with the worst HQ. Compared to 2000, areas of high and optimal HQ show an expanding trend in 2020 and the three simulated scenarios. This phenomenon mainly occurs in the southwestern region of the Tarim River Basin, along both sides of the desert highway, and in the lower reaches of the Tarim River. Additionally, the Keriya River Basin shows improvement in HQ.
The succession distribution of HQ is shown in Figure 10. During the 2000–2010 period, areas of change were relatively small. Degenerate regions were mainly located in populated areas, while the benefit regions were primarily located in the southwestern Tarim River Basin and the Tianshan Mountains. During the 2010–2020 period, the succession characteristics became more pronounced. The benefit regions were mainly located in the western mountainous areas, along the desert highway, and in the lower reaches of the Tarim River, whereas the degenerate regions were concentrated in the southern parts of the study area and certain urban areas. Under the three simulated scenarios, the southern part of the Tarim River Basin generally showed a declining trend during the 2020–2030 period, while the areas around the urban boundaries showed improvement. This trend continued under the SSP126 scenario, whereas the changes were relatively smaller under the SSP245 and SSP585 scenarios. In the 2040–2050 period, under the SSP126 and SSP245 scenarios, degraded areas were mainly in central urban areas, and improved areas were primarily around urban peripheries. Under the SSP585 scenario, the benefit regions were mainly located in the northwestern Tarim River Basin, and the degenerate regions were predominantly in the southeast and the Kunlun Mountains. The observed phenomena are primarily due to structural changes in land use. For instance, with the implementation of ecological water conveyance, the revival of desert riparian forests has improved the HQ in riparian zones. Windbreak and sand-fixation forests around urban areas have also positively impacted HQ. However, in rapidly urbanizing and developing areas, the increase in construction land has led to ecosystem degradation and a decline in HQ. In regions with rapid agricultural expansion, unsustainable land development practices have exacerbated soil erosion and overutilization of water resources, further reducing the HQ. In mountainous areas, the increase in water resources has led to the conversion of some bare land into grassland and forest, significantly enhancing the HQ in these high-altitude regions.

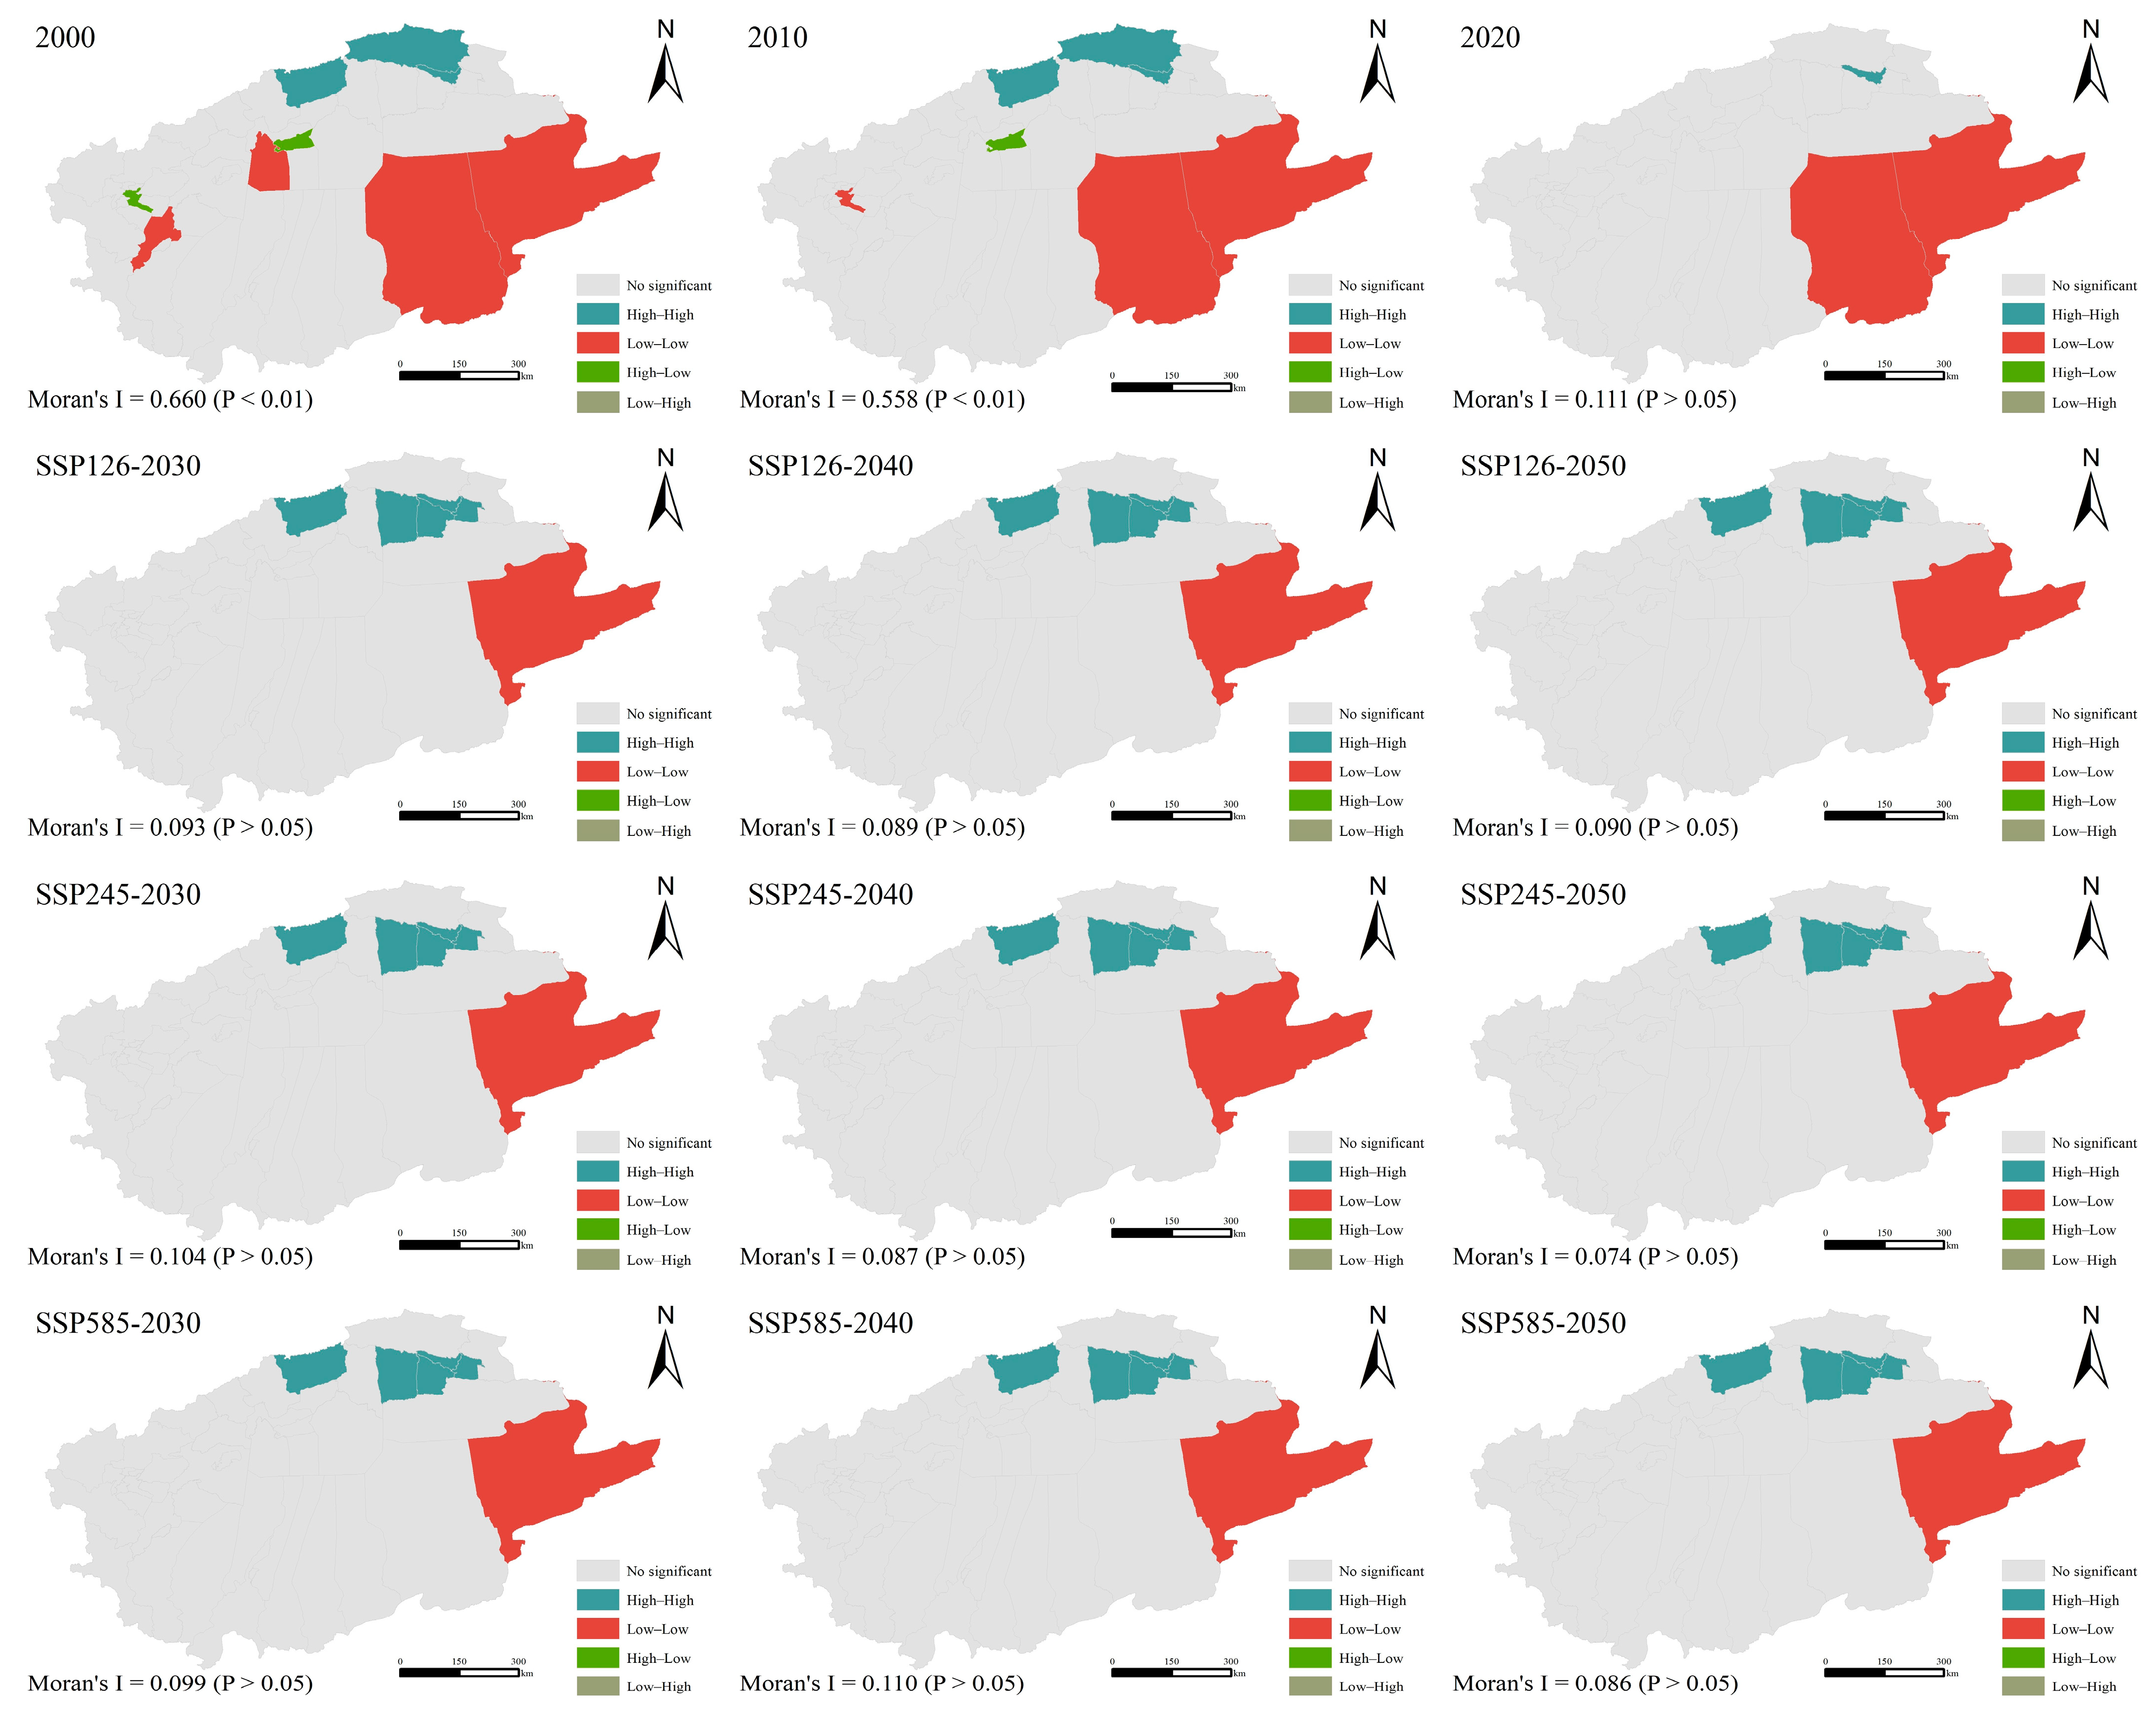
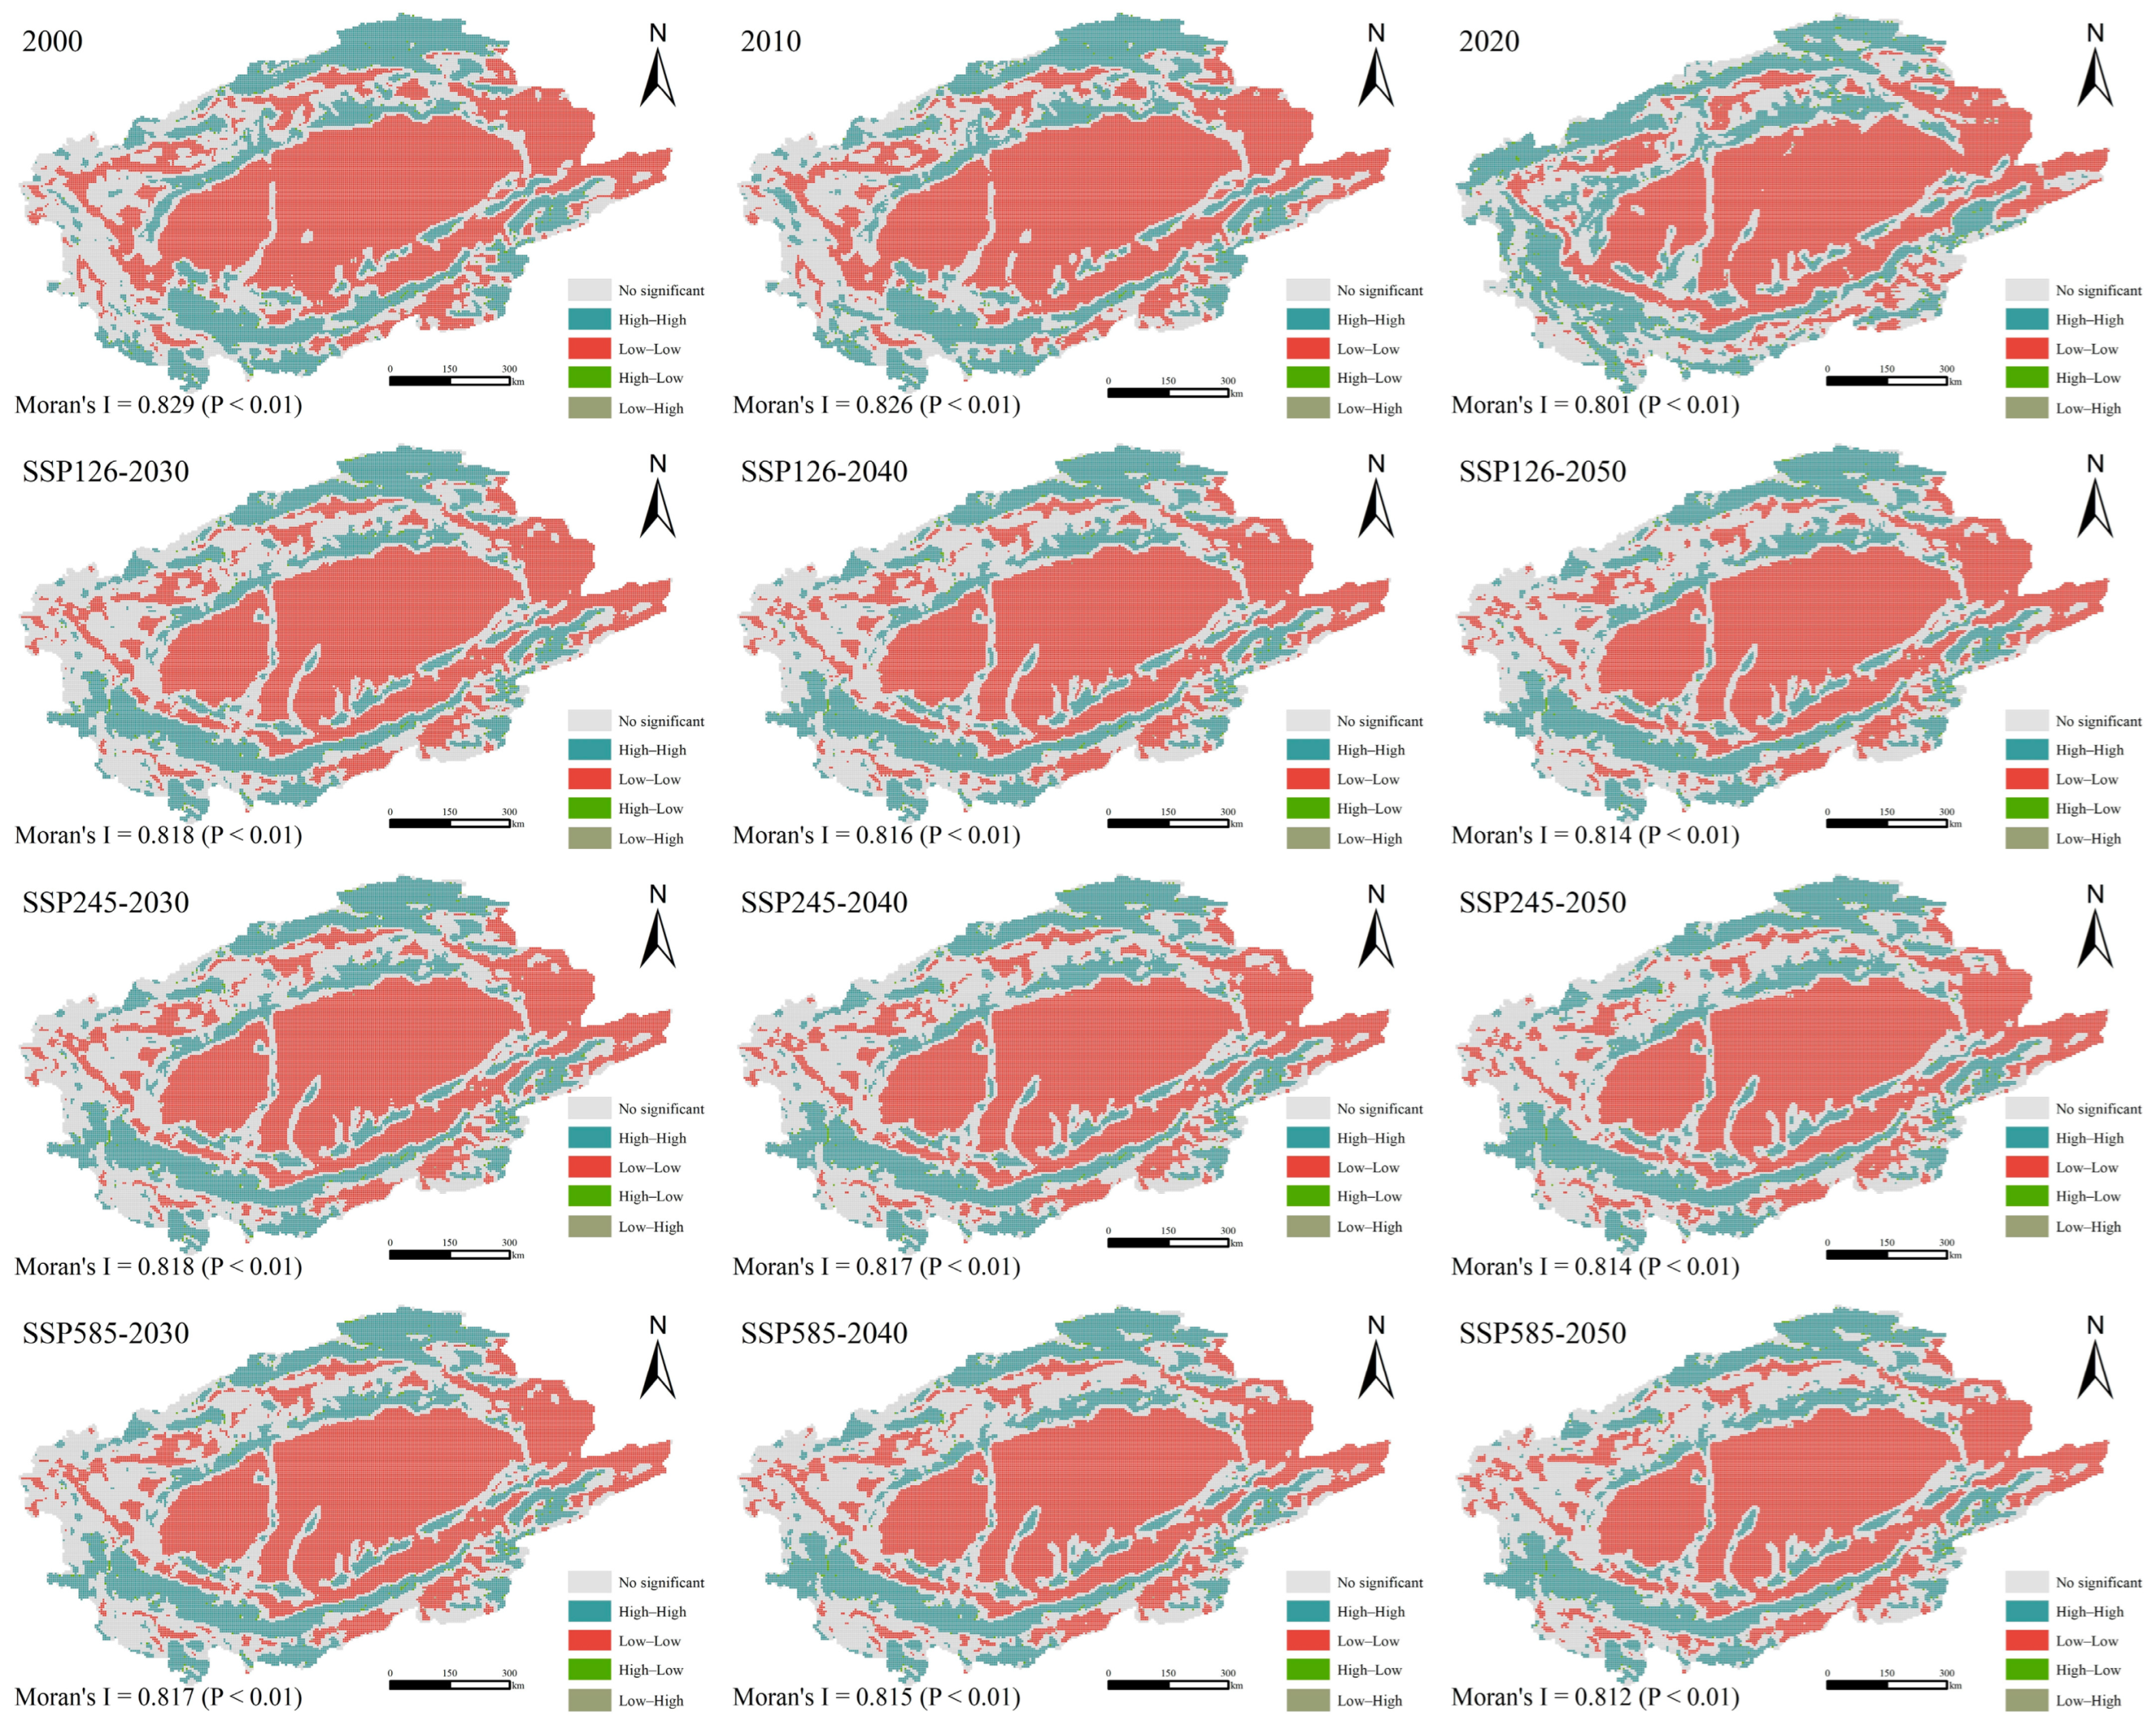
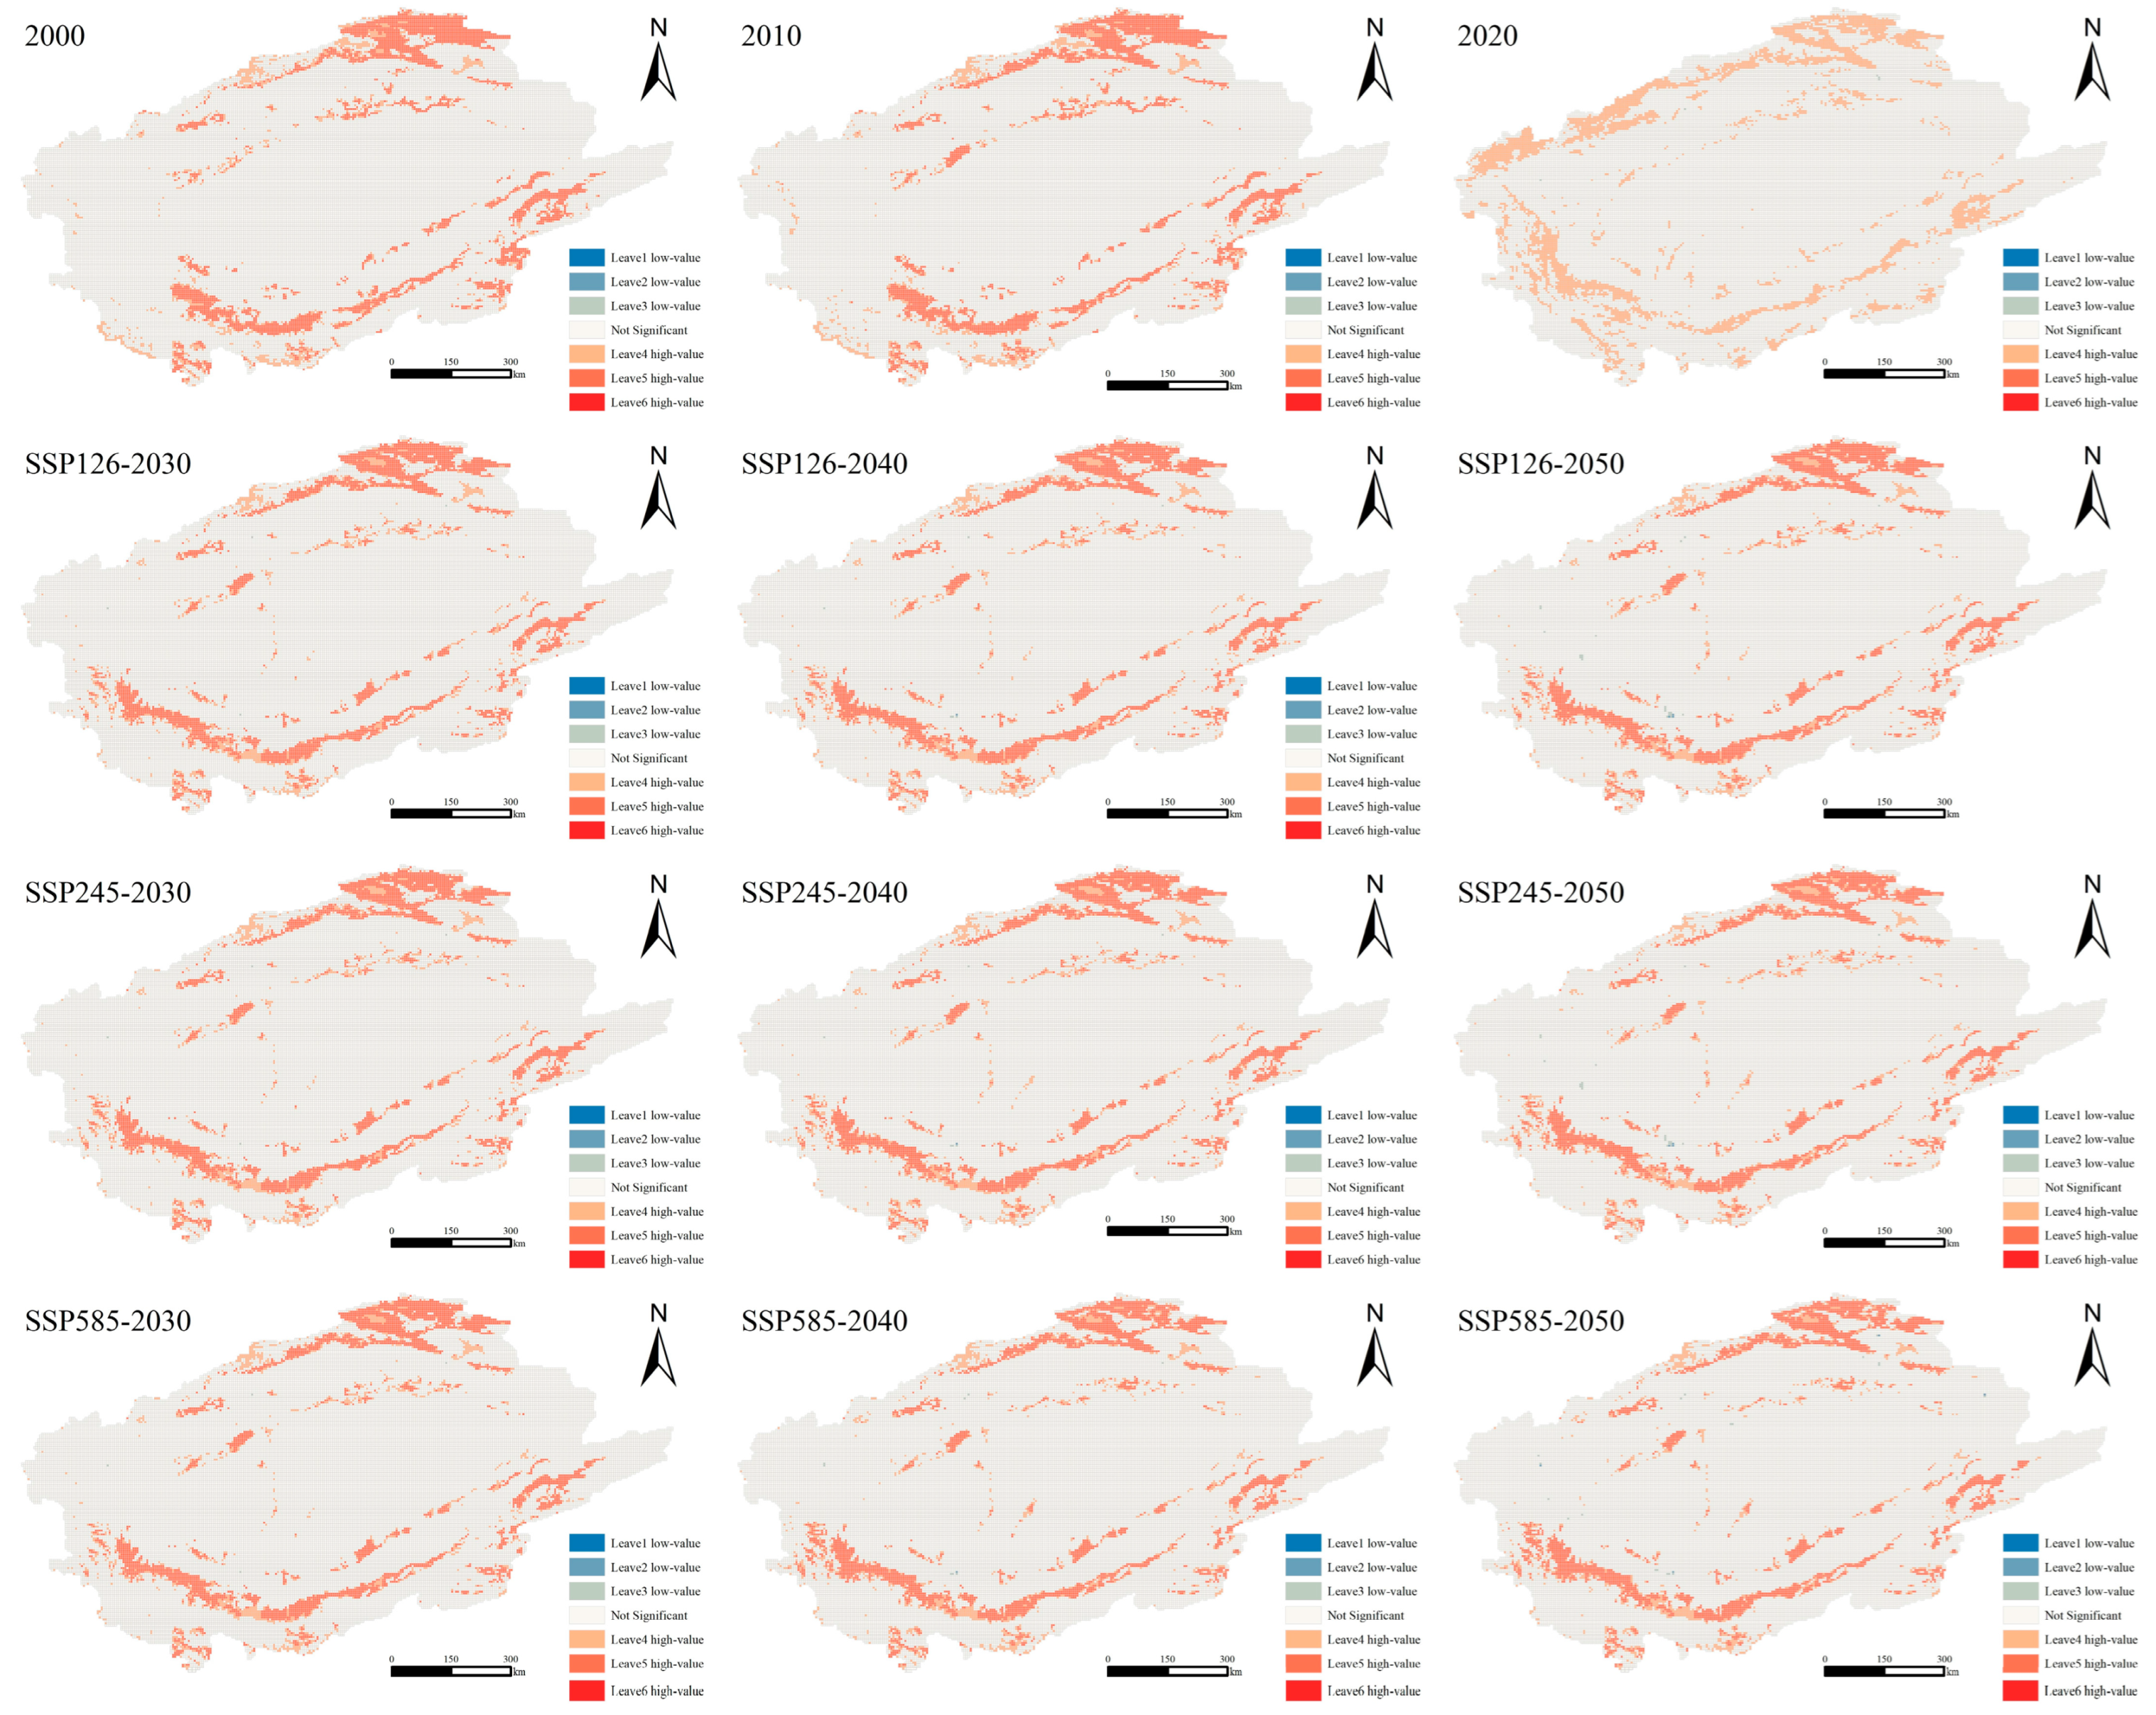
3.3.2. HQ Clustering under Different Scales

The Moran’s I index was used to investigate the spatial clustering of HQ at both the county scale and grid scale. High clustering indicates relative stability and a resistance to change; low clustering suggests a higher susceptibility to change. As shown in Figure 11, the Moran’s I index at the county scale was 0.660 in 2000 and 0.558 in 2010, indicating significant spatial clustering (p < 0.01). However, in 2020 and under the three simulated scenarios for 2030, 2040, and 2050, the Moran’s I index generally ranged between 0.070 and 0.120 with p > 0.05, indicating a weaker spatial correlation. Exploring local correlations within the region revealed that the desert areas in the southeastern part of the Tarim River Basin primarily exhibited low–low clustering, whereas parts of the southern slopes of the Tianshan Mountains showed high–high clustering. The remainder of the region did not exhibit significant spatial clustering.
As shown in Figure 12, during the historical period of 2000–2020 and under the three simulated scenarios for 2030–2050, the Moran’s I index remained positive, generally ranging between 0.800 and 0.830. This reflects a high degree of spatial clustering of HQ in the Tarim River Basin. The clustering predominantly manifests as high–high and low–low types, with the spatial distribution exhibiting typical arid region heterogeneity. The vast desert areas mainly exhibit low–low clustering. The transitional zone between the Taklamakan Desert and populated areas includes China’s longest inland river, the Tarim River, with typical desert riparian forests along its banks, characterized by a high–high clustering of HQ. No significant clustering occurs in the central urban areas and densely populated regions. The areas surrounding urban centers, primarily agricultural areas, predominantly show a low–low HQ. In contrast, the outer highland and mountainous regions exhibit high–high clustering, with the southern slopes of the Tianshan Mountains and the Kunlun Mountains showing significantly higher clustering than other areas. Overall, the pattern is characterized by a high–high clustering on the periphery and a low–low clustering in the center.
As depicted in Figure 13, we categorized the Getis-Ord G* index into seven levels based on the confidence levels, emphasizing the trend changes to analyze the hot spots and cold spots. We conducted tests on the clustering degree at three significance levels (99%, 99.5%, and 99.9%). The hot spots represent areas of high clustering, whereas the cold spots indicate areas of low clustering. Due to the consistently low values in cold-spot areas, regions exhibiting low-value clustering are relatively rare. Conversely, in regions with high-value clustering, there is significant spatial heterogeneity in the range of HQ changes. Therefore, in the Tarim River Basin, cold and hot spots predominate in areas of high-value clustering. The spatial distribution under different simulated scenarios demonstrates a high level of consistency. Hot spots are primarily concentrated in the southern slopes of the Tianshan Mountains, the Kunlun Mountains, along the Tarim River, and around Taitema Lake.

4. Discussion

4.1. Response Characteristics of LULC and Data Selection Principles

In previous studies, land-use datasets at the county and municipal scales often had a resolution of 30 m, whereas those at the regional scale typically had a resolution ranging from 250 to 1000 m. Moreover, the proportion of studies selecting the Chinese Academy of Sciences land-use dataset was significantly higher than studies using other land-use datasets [38,39]. According to the findings of this study, the simulation accuracy of different land uses remains generally consistent with the inherent accuracy of the land-use data as the resolution decreases. Despite the decrease in resolution, the kappa and OA remain unchanged, but the FoM shows a decreasing trend. Performing a comprehensive combined evaluation of the kappa, OA, and FoM can enhance the accuracy and scientific validity of the research results.
The Tarim River Basin is a typical ecologically fragile area with agriculture as its primary economic activity. The conflict between ecological economy and economic development has persisted throughout its history. To protect the fragile ecosystem of the Tarim River Basin, the Chinese government has implemented various ecological conservation projects, such as the Three-North Shelter Forest Program and the Ecological Water Diversion Project in the lower reaches of the Tarim River. These initiatives aim to enhance soil and water conservation capabilities, restore damaged ecosystems, improve soil quality, and promote biodiversity [40,41]. This policy development model is reflected in the SSP126 and SSP245 scenarios, where cropland, forestland, and grassland all show an increasing trend, primarily due to their conversion from bare land. This development pattern improves the structure and function of the ecosystem. However, with a reduction in the constraint on carbon emission intensity (SSP585), the development of the energy industry and the process of urbanization increase the destructive impact on the land-use structure. There is a risk of other land types being converted into bare land, which will increase the ecological risks in the Tarim River Basin in the future.
An increase in the labor force plays a significant driving role in the agricultural economy. However, while developing croplands, it is essential to prevent encroachment on forestlands. Wind and wind-induced sand erosion are among the important natural disasters affecting human well-being in the Tarim River Basin. To prevent developed oasis cities from being destroyed by wind and sand, the construction of protective forests is a critical factor affecting the success or failure of the basin’s ecological economy [42,43]. Forests are mainly located along the banks of the Tarim River and around urban areas. Therefore, it is advisable to increase the scale of artificial forests appropriately while maintaining the sustainable development of the Tarim River desert riparian forest ecosystem.

4.2. Spatial Heterogeneity of HQ

Due to factors such as climate, topography, soil, and human activities, HQ varies significantly across different regions. For example, tropical rainforest regions typically exhibit a high HQ, whereas desert and urbanized areas generally have a lower HQ. HQ assessments are usually based on multiple indicators, such as vegetation cover, species richness, water quality, and soil health. Therefore, in humid regions, the classification of HQ tends to emphasize high-value areas, while in arid regions, the focus is on uniform distribution, paying particular attention to both areas of extremely high and extremely low HQ. The Tarim River Basin is predominantly covered by bare land, resulting in most areas being categorized as poor. Research conducted at the grid scale better reflects the distribution of HQ in the Tarim River Basin. Regions with a higher HQ are mainly located in certain plateau areas and along the banks of the Tarim River. The scarcity of water resources is the primary factor limiting biodiversity in the Tarim River Basin. Melting snow from the high mountains provides essential moisture for natural vegetation as it flows downstream. Additionally, river migration facilitates the dispersal and germination of seeds [44,45], which is the reason why areas with a higher HQ and exhibiting high–high clustering are mainly located around water sources. The HQ and clustering analysis for the period 2000–2010 revealed that the clustering in the lower reaches of the Tarim River was often not significant or showed low–low clustering. However, with the ongoing ecological water transfer, areas exhibiting high–high clustering have increased significantly. This further demonstrates the importance of improving HQ’s rational allocation and scientific management of the limited water resources in the Tarim River Basin.
Meanwhile, we observed that the areas experiencing changes in HQ across the three simulated scenarios are mainly located in high-altitude regions, distant from population centers. Conversely, population-dense areas tend to exhibit a decrease in HQ. The process by which humans transform natural ecosystems into agricultural ecosystems leads to reduced biodiversity and increases the fragmentation and loss of original habitats, thereby resulting in the degradation of HQ. Furthermore, the expansion of built-up areas is also a significant factor that contributes to the decline in HQ [46,47]. This underscores the close connection between human activities and HQ degradation. The transformation of nature during the process of economic development is inevitable. However, the transformation of ecologically fragile areas should be scientifically assessed and predicted for its detrimental effects on nature. For example, Inner Mongolia, also a region with scarce water resources, has implemented corresponding ecological water transfer projects, significantly improving the habitat quality in riparian zones. Long-term afforestation projects have enhanced the soil structure, converting some bare land into forests, thereby increasing windbreak and sand-fixation capabilities and improving the HQ in the region. Another area where changes in land-use structure significantly correlate with HQ domains is the forest belt along both sides of railways. Investment in policy funds to convert bare land into protective forests has notably enhanced the ecological environment and improved the HQ in this area. Compared to vegetation in humid regions, vegetation in arid areas has weaker growth and survival capabilities. Once damaged, the cost of restoring it outweighs the economic benefits derived from the damage significantly. With the increase in urban construction land, the impact on HQ in the arid northwest region becomes more pronounced, with a relatively long recovery period after surface vegetation damage. This underscores the significant long-term importance of the Three-North Shelter Forest Program in enhancing HQ in China. Therefore, creating HQ distribution maps, trend analysis charts, and spatial clustering maps of the Tarim River Basin can facilitate the formulation of rational ecological conservation policies. Tailored conservation policies based on scientific evidence can be proposed for degraded HQ areas to prevent further HQ degradation in the Tarim River Basin.

4.3. Driving Factors and the Impact of HQ

As shown in Figure 14, the NDVI exhibits the highest explanatory power for the HQ spatial variation in 2050 across all three simulated scenarios (0.31205, 0.29445, and 0.29914), followed by soil factors: soil erosion (0.22658, 0.22078, and 0.21895) and soil type (0.21329, 0.20832, and 0.20078). Vegetation is a crucial barrier against desertification in the Tarim River Basin, altering surface roughness and soil properties and thereby providing an essential environmental foundation for enhancing HQ. Unlike the case of humid regions, the increase in vegetation cover in the Tarim River Basin primarily arises from afforestation projects conducted around urban areas in recent decades to combat sandstorm erosion. Lu et al. assessed the carbon storage capacity in regions where China has implemented six major ecological restoration projects and found that more than half (56%) of the carbon sink in the areas could be attributed to the implementation of ecological water diversion projects. Therefore, the increase in vegetation cover is primarily attributable to anthropogenic factors [48]. Due to their extensive grasslands, plateau areas provide habitats for both flora and fauna.
Previous scholars have studied the correlations from various perspectives, such as land-use structure, HQ, and landscape. In studies focusing on Hainan, it has been shown that increased landscape fragmentation, urban sprawl, and a reduction in forested areas can elevate potential risks in the region [49]. Conversely, ecological environments in the northwest are more fragile, with correspondingly higher risks, as affirmed by past research. This underscores the critical importance of harmonizing economic development with soil improvement and vegetation enhancement for HQ in the Tarim River Basin. Balancing agricultural land use, urban expansion, and the preservation of natural habitats is crucial for safeguarding the ecological security of the watershed [6].
The distributions of afforestation and water resources indicate that regions with better HQ in the Tarim River Basin are mainly located around urban areas, along the oases economic belt along the Tarim River, and in high-altitude mountainous areas. The implementation of ecological projects reflects the importance of water resources for the HQ in the Tarim River Basin. Given this importance, ecological construction should be strengthened when pursuing economic development. Assessing the ecological benefits as a key criterion alongside economic growth is essential for prioritizing protection and undertaking corresponding ecological governance projects.

4.4. Comparison of HQ with Other Regions

Focusing on the Tarim River Basin, this study explored the spatiotemporal distribution characteristics of land-use change and HQ within a framework integrating multiple models, scales, and scenarios. The spatial planning of land use is often the result of coordinated consideration of various limiting factors, such as economics, policies, and geographic spatial resources. As a result, although a single model may demonstrate good applicability in specific functions, it often has limitations when used for a comprehensive ecological assessment. Consequently, simulation and prediction within a framework that couples multiple models is becoming increasingly mainstream. In this study, the models used for HQ assessment included SD, PLUS, and InVEST, which exhibit extensive application potential and high stability in ecosystem service evaluations. The issues of foundational datasets, resolution, and scale have been focal points in ecosystem service research for a long time [19]. Altering the resolution and studying scale differentially is advantageous to comprehensively reflecting the status of ecosystem services and exploring sensitive areas and succession features across various scales. The constraining role of water resources in arid regions is an indispensable factor, whereas, for humid areas, emphasis is placed on the urban heat island effect and urban flooding. In semiarid regions, there is a stronger emphasis on the coupled mechanisms between human activities and ecological environments [15,50,51,52]. Different from the aforementioned regions, improvement in the HQ of the Tarim River Basin is primarily concentrated in areas influenced by the urban scale and population effects. Factors such as vegetation, precipitation, and topography play significant roles in shaping the HQ in the Tarim River Basin. To ensure ecological security in the basin, it is imperative to emphasize tailored measures based on local conditions, implement targeted policies, and formulate rational land-use planning policies that integrate the ecological characteristics of different regions. Compared to those in regions with abundant water resources, efforts in the Tarim River Basin should focus on enhancing the construction of ecological belts and corridors instead of large-scale developments of economic forests and crops. The emphasis should be on stabilizing the structure of the ecosystem, improving the efficiency of regional water resource utilization, actively developing ecological land, and promoting the development of agricultural and industrial water-saving technologies to reduce water consumption and waste [53,54].
In the expansive Tarim River Basin, identifying the pivotal drivers affecting ecosystem services, elucidating the influence mechanisms of human activities and natural factors on ecosystem spatial heterogeneity, and devising resource acquisition approaches and improved ecosystem management strategies that are distinct from urban clusters and small watersheds is imperative [55]. It is essential to assess the discrepancies between simulated scenarios and actual development patterns. To investigate the impact of land-use datasets and resolution on the errors in land-use change and HQ, this study was based on a comprehensive consideration of the environmental factors and economic development influences. This approach aims to mitigate errors resulting from localized accuracy changes in basin-scale mapping and analyze the spatial heterogeneity of HQ under multi-scale simulated scenarios. On another level, long-term planning at the basin scale typically extends to within 30 years. This determines the inherent uncertainty in the potential driving factors of land-use change, ecological governance policies, and economic planning. It is challenging to incorporate the profound changes in production methods and the recurrence patterns of extreme weather events into scenario simulations, leading this study to focus primarily on exploring and proposing policies for future development patterns from the current perspective. This perspective lacks a dynamic view. Hence, future research should emphasize factors such as technological advancements and human capacity to transform nature, aiming to complement this study’s limitations with a more dynamic developmental perspective. This will pave the way for new ecological governance solutions for the Tarim River Basin.

5. Conclusions

This study employed the SD-PLUS and InVEST-HQ models, considering regional policies, natural conditions, and socioeconomic factors as joint constraints to predict the quantitative and spatial distribution characteristics of future land use. It constructed land-use simulations under multiple objective scenarios. Simultaneously, it compared different series and spatial resolutions of land-use datasets to enhance the scientific accuracy and precision of the simulations. The main conclusions of the study thus follow. As the resolution decreases, the FoM shows a downward trend, while the kappa and OA values remain largely unchanged. Compared to the other land-use datasets, Globeland 30 data are more suitable for land-use simulation studies of the Tarim River Basin. Under the SSP126 and SSP245 scenarios, the land-use structure is mainly characterized by the conversion of bare land to other land types. This indicates that the development models under these two scenarios primarily focus on the development of bare land, resulting in relatively minor ecological damage. Under the SSP585 scenario, there is a conversion between bare land and other land types, reflecting the conflict between changes in land resource structure and the ecological environment. Therefore, to coordinate the development of watershed soil and water resources with ecological protection, it is necessary to strengthen land quantity and structure optimization to prevent ecological land from being damaged. From 2020 to 2030, the HQ in the southern and northern mountainous regions of the Tarim River Basin was modeled as being in the improvement zone, while the western and urban areas show a higher proportion of decline. From 2030 to 2050, the areas surrounding urban zones become improvement zones, while the central urban areas degrade. At the county level, the HQ in the Tarim River Basin generally remains poor, with a weak spatial correlation and no spatial clustering. However, at the fishnet scale, the optimal HQ typically occurs along the boundaries of the Tianshan and Kunlun Mountains and urban areas, where it exhibits significant spatial correlation. This suggests that the fishnet scale is more suitable for studying the overall HQ of the area. Long-term ecological restoration projects such as afforestation, returning farmland to forest, and desertification control have gradually improved the HQ of human settlement areas. Therefore, stakeholders should consider continuing to invest in ecological conservation funds to protect ecological land and natural habitats. Population and economic development are significant factors that influence land-use structure. Future research will incorporate in-depth studies on population policies and economic structural adjustment planning, integrating national macroeconomic policies as influencing factors. Additionally, by implementing effective, sustainable management plans, they can promote coordination between economic development and ecological protection. The coupled model proposed in this paper can forecast changes in land use and HQ, thus offering new reference solutions for ecological environment planning based on different scenarios and scales under the constraints of CMIP6 data. Meanwhile, future research will focus on exploring the severity of drought frequency and its impact on HQ in arid areas. This will involve quantifying the economic benefits derived from changes in ecosystem service functions under ecological engineering, such as ecological water conveyance and afforestation. It provides a new development model for exploring how to formulate pathways conducive to regional sustainable development, which holds practical significance and can be widely applied to research in basins and urban clusters under different climatic backgrounds.

Author Contributions

All authors contributed to the design and development of this manuscript. T.A.: Conceptualization, writing—original draft preparation, and methodology; J.S.: visualization, software, and writing—review and editing; Ü.H.: writing—review and editing and supervision; F.B.: provided important advice and technical support on the methodology and writing—review and editing; A.Y.: visualization and writing—review and editing. All authors have read and agreed to the published version of the manuscript.

Funding

This work was supported by the Third Xinjiang Scientific Expedition and Research Program (Grant No. 2022xjkk0301) and the National Natural Science Foundation of China (32160367 and 32260285).

Data Availability Statement

The raw data supporting the conclusions of this article will be made available by the authors on request.

Acknowledgments

We would like to thank our other project colleagues from Xinjiang University for their support and help during fieldwork and data processing.

Conflicts of Interest

The authors declare no conflict of interest.

References

  1. Mengist, W.; Soromessa, T.; Feyisa, G.L. Landscape change effects on habitat quality in a forest biosphere reserve: Implications for the conservation of native habitats. J. Clean. Prod. 2021, 329, 129778. [Google Scholar] [CrossRef]
  2. Zhang, B.T.; Feng, Q.; Li, Z.X.; Lu, Z.X.; Zhang, B.J.; Cheng, W.J. Land Use/Cover-Related Ecosystem Service Value in Fragile Ecological Environments: A Case Study in Hexi Region, China. Remote Sens. 2024, 16, 563. [Google Scholar] [CrossRef]
  3. Gomes, E.; Inácio, M.; Bogdzevic, K.; Kalinauskas, M.; Karnauskait, D.; Pereira, P. Future scenarios impact on land use change and habitat quality in Lithuania. Environ. Res. 2021, 197, 111101. [Google Scholar] [CrossRef] [PubMed]
  4. Mehring, M.; Ott, E.; Hummel, D. Ecosystem services supply and demand assessment: Why social-ecological dynamics matter. Ecosyst. Serv. 2018, 30, 124–125. [Google Scholar] [CrossRef]
  5. Burrell, A.L.; Evans, J.P.; De Kauwe, M.G. Anthropogenic climate change has driven over 5 million km2 of drylands towards desertification. Nat. Commun. 2020, 11, 3853. [Google Scholar] [CrossRef] [PubMed]
  6. Zhang, T.J.; Chen, Y.N. The effects of landscape change on habitat quality in arid desert areas based on future scenarios: Tarim River Basin as a case study. Front. Plant Sci. 2022, 13, 1031859. [Google Scholar] [CrossRef] [PubMed]
  7. Wang, Z.Y.; Gao, Y.; Wang, X.R.; Lin, Q.; Li, L. A new approach to land use optimization and simulation considering urban development sustainability: A case study of Bortala, China. Sustain. Cities Soc. 2022, 87, 104135. [Google Scholar] [CrossRef]
  8. Liu, X.Q.; Liu, Y.S.; Wang, Y.S.; Liu, Z.J. Evaluating potential impacts of land use changes on water supply-demand under multiple development scenarios in dryland region. J. Hydrol. 2022, 610, 127811. [Google Scholar] [CrossRef]
  9. Gerten, D.; Heck, V.; Jäegermeyr, J.; Bodirsky, B.L.; Fetzer, I.; Jalava, M.; Kummu, M.; Lucht, W.; Rockström, J.; Schaphoff, S.; et al. Feeding ten billion people is possible within four terrestrial planetary boundaries. Nat. Sustain. 2020, 3, 200–208. [Google Scholar] [CrossRef]
  10. Berdugo, M.; Delgado-Baquerizo, M.; Soliveres, S.; Hernández-Clemente, R.; Zhao, Y.C.; Gaitan, J.J.; Gross, N.; Saiz, H.; Maire, V.; Lehman, A.; et al. Global ecosystem thresholds driven by aridity. Science 2020, 367, 787–790. [Google Scholar] [CrossRef]
  11. Hu, B.A.; Wu, H.F.; Han, H.R.; Cheng, X.Q.; Kang, F.F. Dramatic shift in the drivers of ecosystem service trade-offs across an aridity gradient: Evidence from China’s Loess Plateau. Sci. Total Environ. 2023, 858, 159836. [Google Scholar] [CrossRef] [PubMed]
  12. Song, J.; Betz, F.; Aishan, T.; Halik, U.; Abliz, A. Impact of water supply on the restoration of the severely damaged riparian plants along the Tarim River in Xinjiang, Northwest China. Ecol. Indic. 2024, 158, 111570. [Google Scholar] [CrossRef]
  13. Jiang, W.; Aishan, T.; Halik, Ü.; Wei, Z.C.; Wumaier, M. A Bibliometric and Visualized Analysis of Research Progress and Trends on Decay and Cavity Trees in Forest Ecosystem over 20 Years: An Application of the CiteSpace Software. Forests 2022, 13, 1437. [Google Scholar] [CrossRef]
  14. Halik, Ü.; Aishan, T.; Betz, F.; Kurban, A.; Rouzi, A. Effectiveness and challenges of ecological engineering for desert riparian forest restoration along China’s largest inland river. Ecol. Eng. 2019, 127, 11–22. [Google Scholar] [CrossRef]
  15. Ran, P.L.; Hu, S.G.; Frazier, A.E.; Yang, S.F.; Song, X.Y.; Qu, S.J. The dynamic relationships between landscape structure and ecosystem services: An empirical analysis from the Wuhan metropolitan area, China. J. Environ. Manag. 2023, 325, 116575. [Google Scholar] [CrossRef] [PubMed]
  16. Dourado, G.F.; Rallings, A.M.; Viers, J.H. Overcoming persistent challenges in putting environmental flow policy into practice: A systematic review and bibliometric analysis. Environ. Res. Lett. 2023, 18, 043002. [Google Scholar] [CrossRef]
  17. Hyka, I.; Hysa, A.; Dervishi, S.; Solomun, M.K.; Kuriqi, A.; Vishwakarma, D.K.; Sestras, P. Spatiotemporal Dynamics of Landscape Transformation in Western Balkans’ Metropolitan Areas. Land 2022, 11, 1892. [Google Scholar] [CrossRef]
  18. Niu, X.Y.; Hu, Y.F.; Lei, Z.Y.; Yan, H.M.; Ye, J.Z.; Wang, H. Temporal and Spatial Evolution Characteristics and Its Driving Mechanism of Land Use/Cover in Vietnam from 2000 to 2020. Land 2022, 11, 920. [Google Scholar] [CrossRef]
  19. Zhang, S.Q.; Yang, P.; Xia, J.; Wang, W.Y.; Cai, W.; Chen, N.C.; Hu, S.; Luo, X.G.; Li, J.; Zhan, C.S. Land use/land cover prediction and analysis of the middle reaches of the Yangtze River under different scenarios. Sci. Total Environ. 2022, 833, 155238. [Google Scholar] [CrossRef]
  20. Cook, B.I.; Mankin, J.S.; Marvel, K.; Williams, A.P.; Smerdon, J.E.; Anchukaitis, K.J. Twenty-First Century Drought Projections in the CMIP6 Forcing Scenarios. Earth’s Future 2020, 8, e2019EF001461. [Google Scholar] [CrossRef]
  21. Liang, X.; Guan, Q.F.; Clarke, K.C.; Liu, S.S.; Wang, B.Y.; Yao, Y. Understanding the drivers of sustainable land expansion using a patch-generating land use simulation (PLUS) model: A case study in Wuhan, China. Comput. Environ. Urban Syst. 2021, 85, 101569. [Google Scholar] [CrossRef]
  22. Zhang, Y.; Yu, P.H.; Tian, Y.S.; Chen, H.T.; Chen, Y.Y. Exploring the impact of integrated spatial function zones on land use dynamics and ecosystem services tradeoffs based on a future land use simulation (FLUS) model. Ecol. Indic. 2023, 150, 110246. [Google Scholar] [CrossRef]
  23. Wei, Z.C.; Halik, U.; Aishan, T.; Abliz, A.; Welp, M. Spatial distribution patterns of trunk internal decay of Euphrates poplar riparian forest along the Tarim River, northwest China. For. Ecol. Manag. 2022, 522, 120434. [Google Scholar] [CrossRef]
  24. Yusup, A.; Halik, Ü.; Abliz, A.; Aishan, T.; Keyimu, M.; Wei, J.X. Population Structure and Spatial Distribution Pattern of Populus euphratica Riparian Forest Under Environmental Heterogeneity Along the Tarim River, Northwest China. Front. Plant Sci. 2022, 13, 844819. [Google Scholar] [CrossRef]
  25. Aishan, T.; Mumin, R.; Halik, U.; Jiang, W.; Sun, Y.X.; Yusup, A.; Chen, T.Y. Patterns in Tree Cavities (Hollows) in Euphrates Poplar (Populus euphratica, Salicaceae) along the Tarim River in NW China. Forests 2024, 15, 421. [Google Scholar] [CrossRef]
  26. Hou, Y.F.; Chen, Y.N.; Li, Z.; Li, Y.P.; Sun, F.; Zhang, S.; Wang, C.; Feng, M.Q. Land Use Dynamic Changes in an Arid Inland River Basin Based on Multi-Scenario Simulation. Remote Sens. 2022, 14, 2797. [Google Scholar] [CrossRef]
  27. Wang, T.T.; Sun, F.B. Global gridded GDP data set consistent with the shared socioeconomic pathways. Sci. Data 2022, 9, 221. [Google Scholar] [CrossRef]
  28. Chen, Y.D.; Guo, F.; Wang, J.C.; Cai, W.J.; Wang, C.; Wang, K.C. Provincial and gridded population projection for China under shared socioeconomic pathways from 2010 to 2100. Sci. Data 2020, 7, 83. [Google Scholar] [CrossRef]
  29. Song, J.; Aishan, T.; Ma, X. Coupled water-habitat-carbon nexus and driving mechanisms in the Tarim River Basin: A multi-scenario simulation perspective. Ecol. Indic. 2024, submitted.
  30. Song, J. Modeling of Land Use/Cover Changes and Ecosystem Services Based on PLUS and InVEST Models—A Case Study of the Tarim River Basin. Master’s Thesis, Xinjiang University, Urumqi, China, 2 June 2024. [Google Scholar]
  31. Wang, Z.Y.; Li, X.; Mao, Y.T.; Li, L.; Wang, X.R.; Lin, Q. Dynamic simulation of land use change and assessment of carbon storage based on climate change scenarios at the city level: A case study of Bortala, China. Ecol. Indic. 2022, 134, 108499. [Google Scholar] [CrossRef]
  32. Baral, H.; Keenan, R.J.; Sharma, S.K.; Stork, N.E.; Kasel, S. Spatial assessment and mapping of biodiversity and conservation priorities in a heavily modified and fragmented production landscape in north-central Victoria, Australia. Ecol. Indic. 2014, 36, 552–562. [Google Scholar] [CrossRef]
  33. Ji, X.L.; Sun, Y.L.; Guo, W.; Zhao, C.W.; Li, K. Land use and habitat quality change in the Yellow River Basin: A perspective with different CMIP6-based scenarios and multiple scales. J. Environ. Manag. 2023, 345, 118729. [Google Scholar] [CrossRef] [PubMed]
  34. Gan, L.; Halik, U.; Shi, L.; Welp, M. Multi-scenario dynamic prediction of ecological risk assessment in an arid area of northwest China. Ecol. Indic. 2023, 154, 110727. [Google Scholar] [CrossRef]
  35. Liu, J.; Chen, J.J.; Qin, Q.T.; You, H.T.; Han, X.W.; Zhou, G.Q. Patch Pattern and Ecological Risk Assessment of Alpine Grassland in the Source Region of the Yellow River. Remote Sens. 2020, 12, 3460. [Google Scholar] [CrossRef]
  36. Yu, D.S.; Li, X.P.; Yu, J.J.; Li, H. The impact of the spatial agglomeration of foreign direct investment on green total factor productivity of Chinese cities. J. Environ. Manag. 2021, 290, 112666. [Google Scholar] [CrossRef] [PubMed]
  37. Wang, J.F.; Li, X.H.; Christakos, G.; Liao, Y.L.; Zhang, T.; Gu, X.; Zheng, X.Y. Geographical detectors-based health risk assessment and its application in the neural tube defects study of the Heshun region, China. Int. J. Geogr. Inf. Sci. 2010, 24, 107–127. [Google Scholar] [CrossRef]
  38. Gao, L.A.; Tao, F.; Liu, R.R.; Wang, Z.L.; Leng, H.J.; Zhou, T. Multi-scenario simulation and ecological risk analysis of land use based on the PLUS model: A case study of Nanjing. Sustain. Cities Soc. 2022, 85, 104055. [Google Scholar] [CrossRef]
  39. Shi, M.J.; Wu, H.Q.; Jiang, P.A.; Zheng, K.; Liu, Z.; Dong, T.; He, P.X.; Fan, X. Food-water-land-ecosystem nexus in typical Chinese dryland under different future scenarios. Sci. Total Environ. 2023, 880, 163183. [Google Scholar] [CrossRef] [PubMed]
  40. Ling, H.B.; Xu, H.L.; Guo, B.; Deng, X.Y.; Zhang, P.; Wang, X.Y. Regulating water disturbance for mitigating drought stress to conserve and restore a desert riparian forest ecosystem. J. Hydrol. 2019, 572, 659–670. [Google Scholar] [CrossRef]
  41. Li, L.Q.; Jiang, E.H.; Yin, H.J.; Wu, K.; Dong, G.T. Ultrashort-term responses of riparian vegetation restoration to adjacent cycles of ecological water conveyance scheduling in a hyperarid endorheic river basin. J. Environ. Manag. 2022, 320, 115803. [Google Scholar] [CrossRef]
  42. Penny, J.; Ordens, C.M.; Barnett, S.; Djordjevic, S.; Chen, A.S. Small-scale land use change modelling using transient groundwater levels and salinities as driving factors—An example from a sub-catchment of Australia’s Murray-Darling Basin. Agric. Water Manag. 2023, 278, 108174. [Google Scholar] [CrossRef]
  43. Elagib, N.A.; Khalifa, M.; Rahma, A.E.; Babker, Z.; Gamaledin, S.I. Performance of major mechanized rainfed agricultural production in Sudan: Sorghum vulnerability and resilience to climate since 1970. Agric. For. Meteorol. 2019, 276, 107640. [Google Scholar] [CrossRef]
  44. Seaton, D.; Dube, T.; Mazvimavi, D. Use of multi-temporal satellite data for monitoring pool surface areas occurring in non-perennial rivers in semi-arid environments of the Western Cape, South Africa. ISPRS J. Photogramm. Remote Sens. 2020, 167, 375–384. [Google Scholar] [CrossRef]
  45. Dou, X.; Ma, X.F.; Huo, T.C.; Zhu, J.T.; Zhao, C.Y. Assessment of the environmental effects of ecological water conveyance over 31 years for a terminal lake in Central Asia. Catena 2022, 208, 105725. [Google Scholar] [CrossRef]
  46. Serna-Chavez, H.M.; Kissling, W.D.; Veen, L.E.; Swenson, N.G.; van Bodegom, P.M. Spatial scale dependence of factors driving climate regulation services in the Americas. Glob. Ecol. Biogeogr. 2018, 27, 828–838. [Google Scholar] [CrossRef]
  47. Li, J.H.; Xie, B.G.; Gao, C.; Zhou, K.C.; Liu, C.C.; Zhao, W.; Xiao, J.Y.; Xie, J. Impacts of natural and human factors on water-related ecosystem services in the Dongting Lake Basin. J. Clean. Prod. 2022, 370, 133400. [Google Scholar] [CrossRef]
  48. Lu, F.; Hu, H.F.; Sun, W.J.; Zhu, J.J.; Liu, G.B.; Zhou, W.M.; Zhang, Q.F.; Shi, P.L.; Liu, X.P.; Wu, X.; et al. Effects of national ecological restoration projects on carbon sequestration in China from 2001 to 2010. Proc. Natl. Acad. Sci. USA 2018, 115, 4039–4044. [Google Scholar] [CrossRef] [PubMed]
  49. Liang, Y.; Song, W. Integrating potential ecosystem services losses into ecological risk assessment of land use changes: A case study on the Qinghai-Tibet Plateau. J. Environ. Manag. 2022, 318, 115607. [Google Scholar] [CrossRef] [PubMed]
  50. Song, Q.; Hu, B.F.; Peng, J.; Bourennane, H.; Biswas, A.; Opitz, T.; Shi, Z. Spatio-temporal variation and dynamic scenario simulation of ecological risk in a typical artificial oasis in northwestern China. J. Clean. Prod. 2022, 369, 133302. [Google Scholar] [CrossRef]
  51. Yin, L.C.; Feng, X.M.; Fu, B.J.; Wang, S.; Wang, X.F.; Chen, Y.Z.; Tao, F.L.; Hu, J. A coupled human-natural system analysis of water yield in the Yellow River basin, China. Sci. Total Environ. 2021, 762, 143141. [Google Scholar] [CrossRef]
  52. Xu, Z.H.; Peng, J.; Dong, J.Q.; Liu, Y.X.; Liu, Q.Y.; Lyu, D.N.; Qiao, R.L.; Zhang, Z.M. Spatial correlation between the changes of ecosystem service supply and demand: An ecological zoning approach. Landsc. Urban Plan. 2022, 217, 104258. [Google Scholar] [CrossRef]
  53. Bao, Q.L.; Ding, J.L.; Han, L.J.; Li, J.; Ge, X.Y. Predicting land change trends and water consumption in typical arid regions using multi-models and multiple perspectives. Ecol. Indic. 2022, 141, 109110. [Google Scholar] [CrossRef]
  54. Wang, Z.R.; Xie, F.; Ling, F.; Du, Y. Monitoring Surface Water Inundation of Poyang Lake and Dongting Lake in China Using Sentinel-1 SAR Images. Remote Sens. 2022, 14, 3473. [Google Scholar] [CrossRef]
  55. Zhang, S.; Wang, Y.; Wang, Y.; Li, Z.; Hou, Y.F. Spatiotemporal Evolution and Influencing Mechanisms of Ecosystem Service Value in the Tarim River Basin, Northwest China. Remote Sens. 2023, 15, 591. [Google Scholar] [CrossRef]
Figure 1. Geographical information of the study area in the Tarim River Basin.
Land 13 01146 g001
Figure 2. Various influencing factors of natural climate, geography, accessibility, and human activities in the study area.
Land 13 01146 g002
Figure 3. Technical roadmap for land-use modeling and HQ evaluation.
Land 13 01146 g003
Figure 4. Simulation and accuracy validation of nine land-use datasets for 2020.
Land 13 01146 g004
Figure 5. Historical period land-use transfer matrix and intensity from 2000–2020 (CL: cropland; FL: forestland; GL: grassland; WB: water body; CoL: construction land; BL: bare land).
Land 13 01146 g005
Figure 6. Simulation period land-use transfer matrix from 2030–2050 (A1A3: land transfer matrices for 2020–2030, 2030–2040, and 2040–2050 under the SSP126 scenario; B1B3: land transfer matrices for 2020–2030, 2030–2040, and 2040–2050 under the SSP245 scenario; C1C3: land transfer matrices for 2020–2030, 2030–2040, and 2040–2050 under the SSP585 scenario).
Land 13 01146 g006
Figure 7. Trend map of changes in HQ. The red, green, and beige bars represent the SSP126, SSP245, and SSP585 scenarios, respectively.
Land 13 01146 g007
Figure 8. Distributional characteristics of spatiotemporal distribution of different levels of HQ at the county scale.
Land 13 01146 g008
Figure 9. Distributional characteristics of spatiotemporal distribution of different levels of HQ at the fishnet scale.
Land 13 01146 g009
Figure 10. Spatiotemporal changes in HQ and analytical characterization under three scenarios for 2020–2050.
Land 13 01146 g010
Figure 11. Airborne correlation maps of HQ at the county scale.
Land 13 01146 g011
Figure 12. Airborne correlation maps of HQ at the fishnet scale.
Land 13 01146 g012
Figure 13. Spatiotemporal characterization of HQ cold spots and hot spots.
Land 13 01146 g013
Figure 14. Degree of explanatory power of factors influencing HQ in three simulation scenarios.
Land 13 01146 g014
Table 1. The land-use and impact factors data and data sources (data accessed on 1 May 2022).
Sub-DataYear (s)ResolutionDatabase Sources
LULC2000–202030 m
300 m
500 m
1 km
National Catalogue Service For Geographic Information (https://www.webmap.cn), China’s 30 m annual land-cover product (https://essd.copernicus.org), National Ecological Science Data Center (http://www.nesdc.org.cn), Climate Data Store (https://cds.climate.copernicus.eu), and Earth Data (https://www.earthdata.nasa.gov)
DEM/Slope202030 mEarth Data (https://urs.earthdata.nasa.gov)
NDVI202030 mNational Ecological Science Data Center
(http://www.nesdc.org.cn)
Night light data2020500 mResource and Environmental Science Data Platform (https://www.resdc.cn)
GDP/Population20191 km
Soil19951 km
Erosion20101 km
ET20001 kmPlant Science Data Center (https://www.plantplus.cn)
AI
Precipitation20201 kmA Big Earth Data for Three Poles (https://poles.tpdc.ac.cn)
Temperature
Railway2023 OpenStreetMap (https://www.openstreetmap.org)
Highway
Road
Settlement
River
Water
Socioeconomic data2000–2020 Statistic Bureau of Xinjiang Uygur Autonomous Region (https://tjj.xinjiang.gov.cn)
Disclaimer/Publisher’s Note: The statements, opinions and data contained in all publications are solely those of the individual author(s) and contributor(s) and not of MDPI and/or the editor(s). MDPI and/or the editor(s) disclaim responsibility for any injury to people or property resulting from any ideas, methods, instructions or products referred to in the content.

