Abstract
Urban green space (UGS) is a fundamental infrastructure in modern urban settings, crucial for regulating the urban climate and improving public health. Accessibility to UGS represents a significant environmental justice issue, influencing the sustainable development of local communities. In this work, we comprehensively evaluated the temporal dynamics of UGS accessibility and the disparity in exposure for all 31 metropolitan divisions in the United States from 2013 to 2022. Our findings indicate that there have been no significant changes in both population-weighted UGS exposure and within-city inequality of UGS exposure for all racial/ethnic groups across the study period. Furthermore, a consistent racial/ethnic disparity in UGS exposure was noted throughout the study period, with the White group tending to have higher-than-average UGS accessibility, and all other racial/ethnic groups, including Asian, Black, Hispanic, Native American, and Pacific Islander, experiencing lower-than-average UGS accessibility. These findings underscore the urgency for urban planning and policy-making strategies to address these inequities, promoting healthy and sustainable urban development.
1. Introduction
As global urbanization progresses, a growing proportion of the world’s population is settling in urban areas, which amplifies concerns about noise and air pollution, along with significant public health challenges [1,2,3,4,5]. In response to escalating urbanization, the concept of green infrastructure (GI) was introduced in 2002 [6] as a strategic approach to land conservation. This concept encompasses the integration of parks, wetlands, green roofs, and other green spaces within urban landscapes, to mitigate the adverse social and ecological impacts of urban sprawl [7,8,9]. Concurrently, the development of the GI concept has spotlighted a more specific focus on vegetative land within urban settings, known as urban green space (UGS). UGS refers to natural spaces within urban or suburban environments that offer a visual and environmental respite from the built environment, typically featuring open areas, landscapes, or environments adorned with grass, trees, plants, or other vegetation [8,10].
UGS plays an essential role in mitigating environmental stressors within urban environments. Vegetation, including trees and shrubs, is particularly effective in attenuating noise and filtering air pollutants, contributing to a healthier urban atmosphere [11,12,13]. Furthermore, accessible UGS is linked to favorable physical health outcomes, such as reduced rates of obesity, cardiovascular diseases, and overall mortality [14,15,16,17,18,19]. Epidemiological studies in 2023 and 2024 have also demonstrated that UGS can reduce physiological stress and improve mental health conditions [20,21], underscoring its importance in urban planning and public health initiatives.
UGS functions as a critical infrastructure within urban environments, enhancing urban climate, increasing thermal comfort, and mitigating the severity of flooding. Vegetation in these areas, particularly trees, provides shade that significantly reduces surface and air temperatures. Moreover, the process of evapotranspiration from plants aids in further lowering surrounding air temperatures. A study in 2020 showed that the cooling effects of UGS are notably substantial, with average maximum temperature reductions of 1.8 °C during the day and 2.3 °C at night observed in urban settings [22]. Furthermore, studies in 2020 and 2022 proved that enhanced accessibility to UGS has been correlated with significant reductions in heat-related mortality rates [22,23]. UGS also increases the extent of permeable surfaces in cities, which improves rainwater infiltration and diminishes surface runoff. Various green infrastructure elements within UGS, such as bioswales and rain gardens, capture and store rainwater, thus alleviating pressure on urban drainage systems.
Access to UGS is a critical environmental justice issue, as disparities in accessibility can lead to imbalances in community well-being and sustainability. The literature extensively documents the complex nature of spatial accessibility to UGS, revealing that disadvantaged communities often have reduced access to nearby green spaces [24,25,26,27,28,29]. Ref. [30] analyzed densely populated urban areas in the United States, identifying significant disparities in tree coverage between Black and White neighborhoods. Another study in Connecticut showed that higher-income individuals tend to reside in areas with more street greenery, though no significant racial or ethnic disparities were observed in proximity to urban parks [25]. Ref. [31] assessed park and tree accessibility across six Illinois cities, finding disparities in tree access among different income levels in some cities, but not in park accessibility across both racial and income groups. Additionally, a study examining ten major U.S. cities revealed heterogeneous impacts on the inequality of park and tree accessibility for different income and racial groups [32]. In 2020, a metropolitan-wide analysis of Columbus, Ohio, and Atlanta, Georgia, employing multiple green measurement indices, highlighted the spatially heterogeneous and context-dependent nature of UGS accessibility [33].
A growing body of literature is examining the inequalities in UGS accessibility on a global scale. Song et al. (2021) assessed UGS exposure across 303 cities in China, concluding that a significant majority of these cities experience high levels of greenspace inequality [34]. Furthermore, a 2022 study examining the disparities in greenspace exposure between cities in the global north and global south revealed significant inequalities. The findings indicated that cities in the global south experience only one-third of the greenspace exposure of their global north counterparts while suffering from twice the level of inequality [35]. Despite these insights, there remains a lack of focus on intra-city variability and the temporal dynamics of UGS accessibility. The inconsistent findings across these studies highlight the need for more comprehensive analyses to address these inequalities and promote equitable access to UGS.
To address gaps in existing research, this study conducts a comprehensive analysis of the dynamics of UGS accessibility from 2013 to 2022 across 31 major metropolitan areas in the United States. Utilizing state-of-the-art satellite imagery and advanced spatial analysis techniques, we offer a novel perspective on the evolution of green space distribution within these areas. Moreover, our approach enables a refined examination of both inter-city and intra-city disparities in UGS accessibility across various demographic groups. This not only enhances the granularity of our findings but also makes a significant contribution to the field by mapping these disparities with unprecedented precision and scope. The integration of long-term, high-resolution spatial big data with demographic insights marks a significant advancement in urban environmental research, establishing a new standard for future studies.
2. Materials and Methods
2.1. Study Area
We focused on the 31 metropolitan divisions as defined by the 2020 American Community Survey (ACS) across the United States, illustrated in Figure 1. These metropolitan divisions represent specific subdivisions of larger metropolitan statistical areas (MSAs), which are delineated and utilized by the Office of Management and Budget (OMB) to furnish a more detailed perspective of large, densely populated metropolitan areas [36]. This delineation facilitates a more comprehensive understanding and reporting of social, economic, and demographic data within these expansive regions.
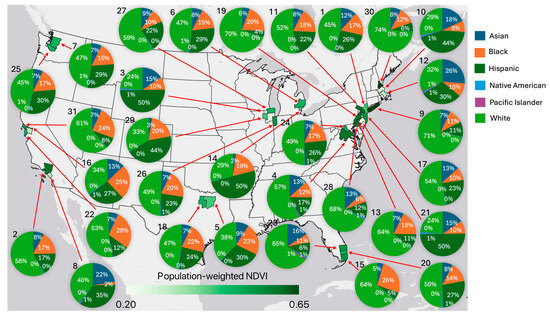
Figure 1.
Spatial Distribution of Metropolitan Divisions, Racial/Ethnic Compositions, and Population-Weighted NDVI in 2022. The numbers on the top left of each pie chart represent the rank of each metropolitan division based on their population sizes. These rankings serve as indices for referencing the name, population, area, and population density of each metropolitan division as detailed in Table S1.
2.2. Urban Greenness Space Indicator
One common index for evaluating UGS is the proximity and accessibility to trees and parks [32,37,38,39,40]. Additional sources of greenness utilized in other studies include countryside, backyards, and agricultural green fields [25,33,41,42]. However, these indicators primarily focus on specific sources of greenness and do not encompass the complete spectrum of green coverage in urban settings, such as street plantations, lawns, and small gardens. These smaller green areas play a pivotal role in high-density urban environments [43,44]. Neglecting green spaces below a certain size or of a specific type may not accurately represent the overall situation of UGS exposure and accessibility in neighborhoods.
The Normalized Difference Vegetation Index (NDVI) is a widely utilized metric to assess the healthiness and density of vegetation, with values ranging from −1 to 1. Higher NDVI values (approaching 1) signify healthier and denser vegetation coverage. In this study, NDVI values were derived from Landsat 8 imagery, which provides a spatial resolution of 30 m. This fine resolution enables a detailed and comprehensive analysis of UGS exposure and accessibility, capturing all types of greenness coverage in high-density urban environments, including grass, trees, plants, and all other green vegetation from parks, lawns, green roofs, walking paths, and so on.
In this study, we utilized the Landsat 8 Collection 2 Tier 1 and Real-Time data calibrated top-of-atmosphere (TOA) reflectance data [45] from Google Earth Engine to calculate the NDVI index, using the following equation:
where NIR and Red represent near-infrared and red bands from Landsat 8, respectively.
We extracted the annual maximum NDVI value for each pixel, which represents the peak vegetation greenness observed during the year. These annual maximum NDVI values from 2013 to 2022 were then aligned with census tract polygons obtained from ACS. Within each census tract, these values were averaged to provide a spatial aggregation of NDVI, thereby offering a quantitative measure of UGS exposure across the landscape.
Demographic data, including total population and populations for various racial and ethnic groups, were sourced from the 5-year ACS dataset spanning from 2013 to 2022. The population and racial/ethnic compositions across all metropolitan divisions demonstrated relative consistency throughout the study period (Figure S1). For each metropolitan division, the population-weighted NDVI was calculated using the following formula:
where indexes each census tract within the metropolitan division of interest and indexes different racial and ethnic groups, including total population, Asian, Black, Hispanic, Native American, Pacific Islander, and White.
The spatial locations of all metropolitan divisions are shown in Figure 1, each colored according to the 2022 population-weighted NDVI value. Within the same figure, pie charts display the population compositions of all racial/ethnic groups, as derived from the 2022 demographic data. The name, population, area, and population density for each metropolitan division are listed in Table S1 in the Supplementary Materials. The numbers on the top left of each pie chart in Figure 1 indicate the rank of each metropolitan division based on population size. These ranks also function as indices for Table S1, which provides detailed demographic information for each metropolitan division. Notably, the population-weighted NDVI exhibits variations even within regions that share identical weather conditions, suggesting disparities in UGS that are attributable to the unequal distribution of population and urban infrastructure.
2.3. Exposure Disparity Index
To accurately assess the disparity in UGS accessibility, we computed two distinct types of disparity indices within each metropolitan division. The first disparity index quantified the inequality of UGS accessibility among different census tracts within a single metropolitan division, thus addressing within-city UGS accessibility disparities. For this purpose, we employed the widely utilized Gini index metric, adapting it to measure metropolitan division inequality in UGS accessibility and incorporating the population of various racial/ethnic groups as weighting coefficients. To accommodate negative NDVI values, we employed a transformed version of the Gini index [46,47,48], calculated as follows:
where , , and represent all the census tracts within each metropolitan division and indexes different racial/ethnic groups. The Gini index is calculated using the ‘wINEQ’ package in R [49,50]. A higher Gini index value indicates greater disparity in UGS accessibility, whereas a lower Gini index suggests more equitable accessibility. This metric effectively quantifies the inequality of UGS within each metropolitan division. However, it does not address potential disparities in UGS accessibility between different racial/ethnic groups.
The second disparity index is designed to evaluate the inequality in UGS accessibility between different racial/ethnic groups within each metropolitan division. This is achieved by using the population-weighted NDVI assigned to various racial/ethnic groups. The disparity index is quantified through the following equation:
where indexes different racial/ethnic groups, including Asian, Black, Hispanic, Native American, Pacific Islander, and White, and indexes different metropolitan divisions. This formula allows for a direct comparison of UGS accessibility among racial/ethnic groups by normalizing their NDVI values against the total population-weighted NDVI within the same metropolitan division. A positive disparity value indicates greater-than-average UGS accessibility, while a negative value indicates less-than-average UGS accessibility. This method is extensively employed in environmental exposure studies to assess environmental justice issues, providing a valuable metric for evaluating the equitable distribution of UGS accessibility among different demographic groups [51].
3. Results
3.1. Greenness Exposure over Time
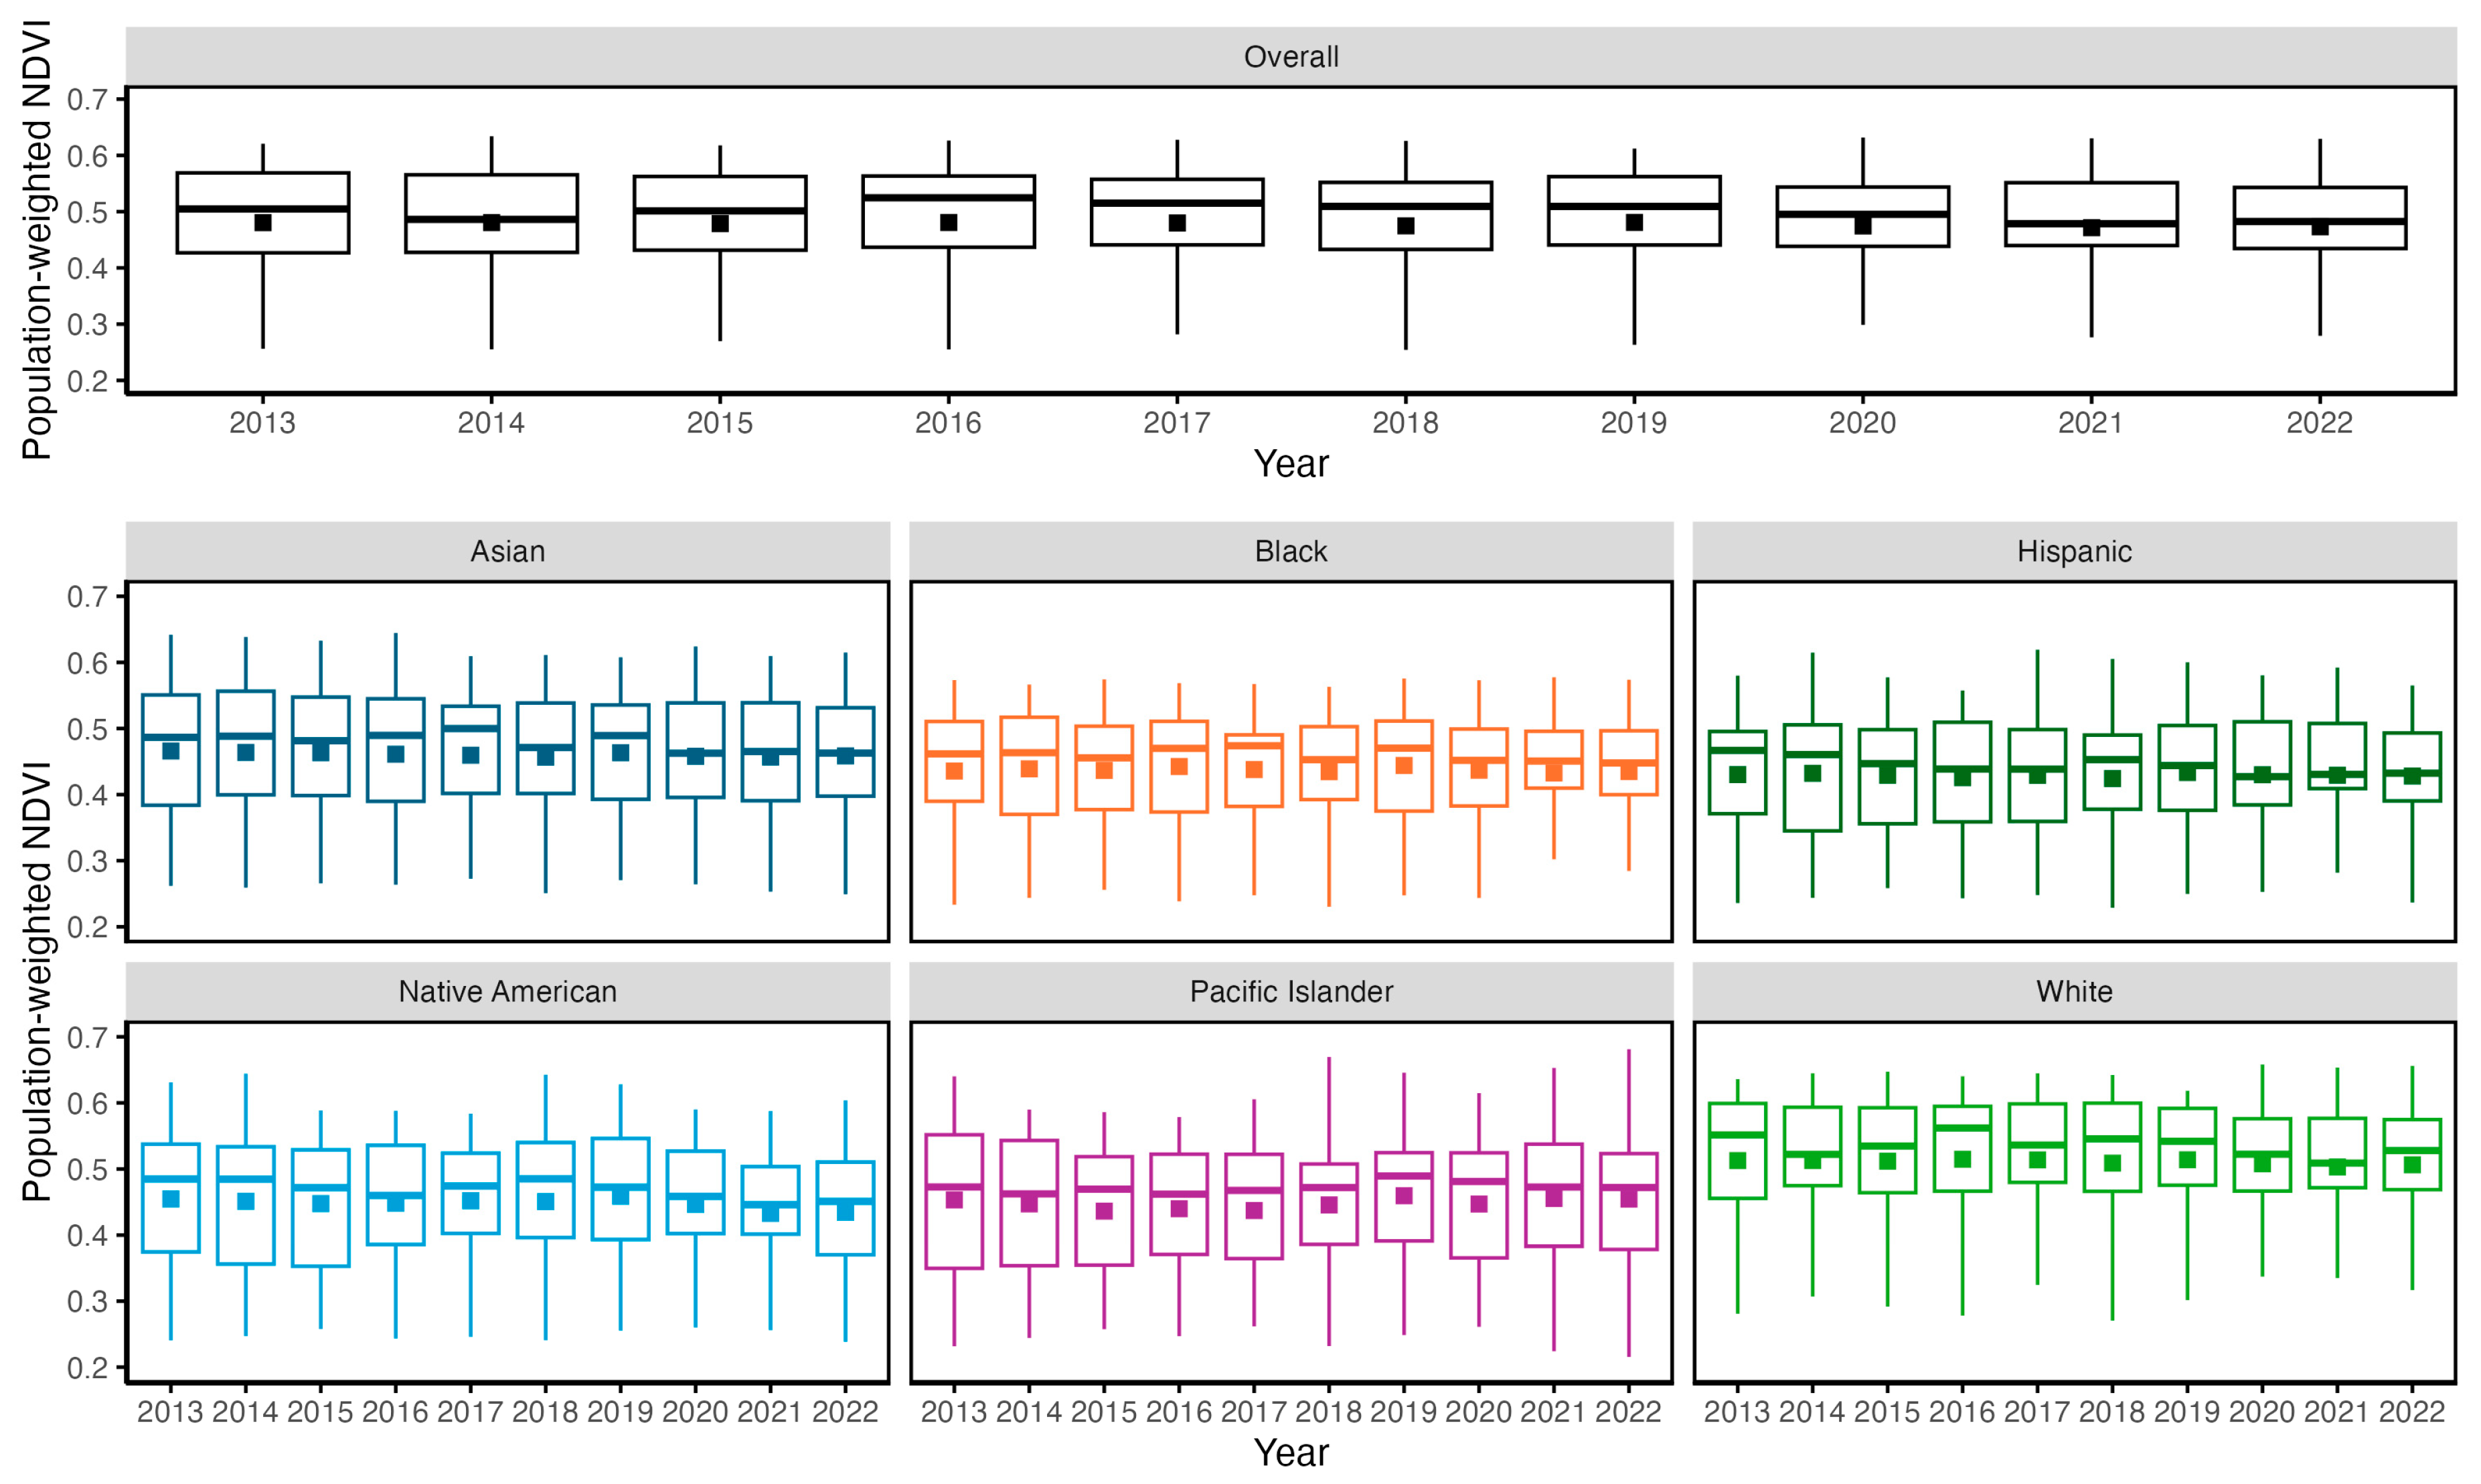
As illustrated in Figure 2, we examined the changes in population-weighted NDVI for various racial/ethnic groups from 2013 to 2022. This analysis did not reveal any significant trends in NDVI changes across the racial/ethnic groups. The average values of the overall population-weighted NDVI for each metropolitan division ranged between 0.239 and 0.618. Notably, the Camden, NJ Metro Division recorded the lowest overall population-weighted NDVI in 2022, while the San Rafael, CA Metro Division exhibited the highest NDVI exposure in 2018. Regarding average NDVI exposure of all metropolitan divisions across different racial/ethnic groups, Hispanic individuals experienced the lowest average population-weighted NDVI exposure, recorded at 0.424 in 2018. In contrast, the highest exposure was observed among White individuals, reaching 0.515 in 2016.
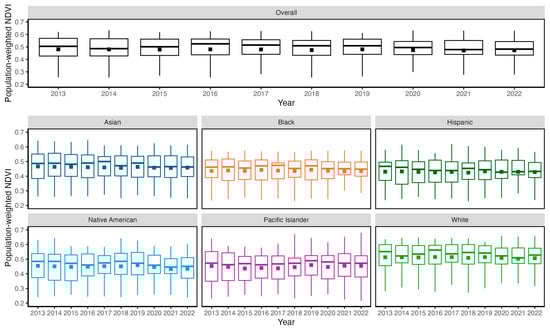
Figure 2.
Changes in population-weighted NDVI for different racial/ethnic groups across all metropolitan divisions from 2013 to 2022.
3.2. Greenness Exposure Disparity over Time
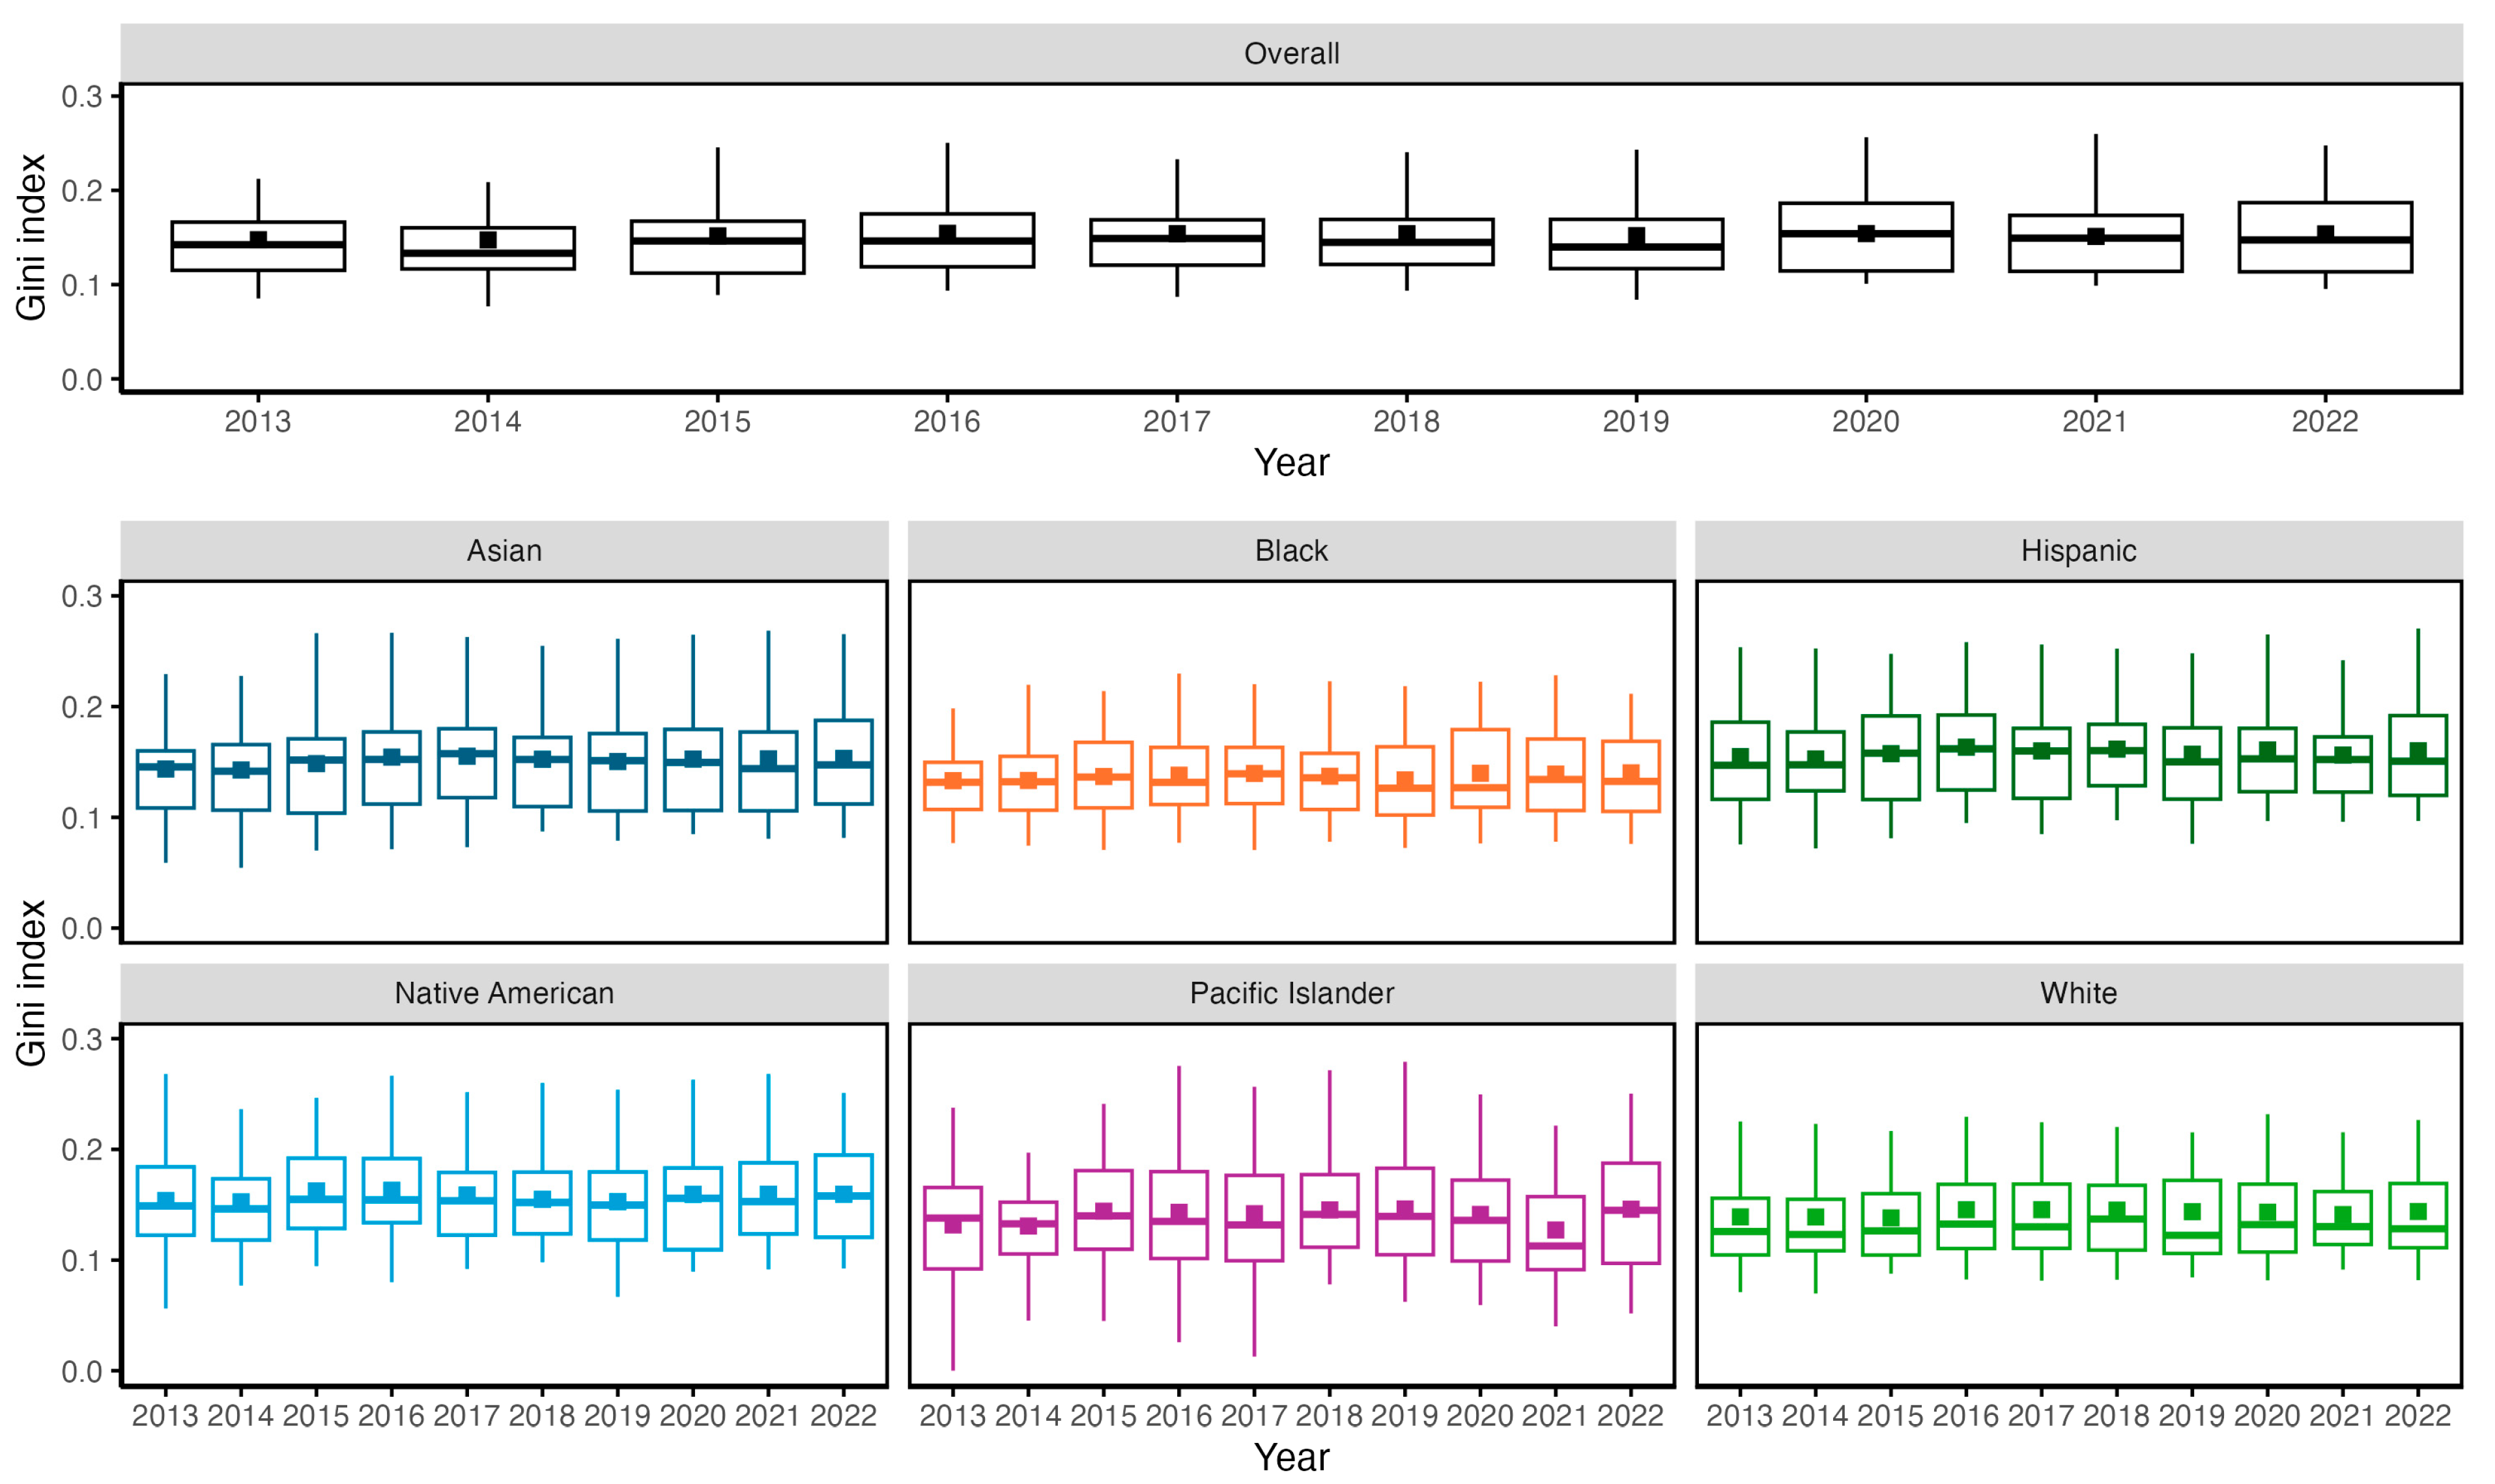
The Gini index is employed to quantify the inequality of UGS accessibility across different census tracts within each metropolitan division. Temporal variations of the Gini indices for different racial/ethnic groups are depicted in Figure 3. Regarding the average Gini index of overall population-weighted NDVI exposure across different metropolitan divisions, the lowest value recorded was 0.147 in 2014, while the highest was 0.154 in 2016. The most equitable UGS accessibility was observed in 2021 for Pacific Islanders, with an average Gini index of 0.127. Conversely, the most inequitable UGS accessibility was noted for Hispanic individuals in 2016, with an average Gini index of 0.163.
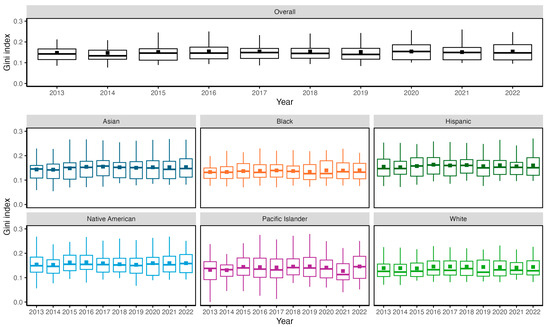
Figure 3.
Changes in the disparity of greenness exposure over time for all metropolitan divisions and different racial/ethnic groups.
The average Gini indices for all metropolitan divisions have shown minimal variation, fluctuating around 0.152 ± 0.003 for the overall condition, 0.151 ± 0.004 for Asians, 0.137 ± 0.003 for Blacks, 0.158 ± 0.003 for Hispanics, 0.158 ± 0.003 for Native Americans, 0.140 ± 0.007 for Pacific Islanders, and 0.143 ± 0.002 for Whites, for the years between 2013 and 2022. The very low standard deviations across different years underscore the relative stability of the Gini indices from 2013 to 2022 for all six racial/ethnic groups and the overall condition, indicating consistent inequality levels across the time period examined.
3.3. Racial Disparities of Greenness Exposure
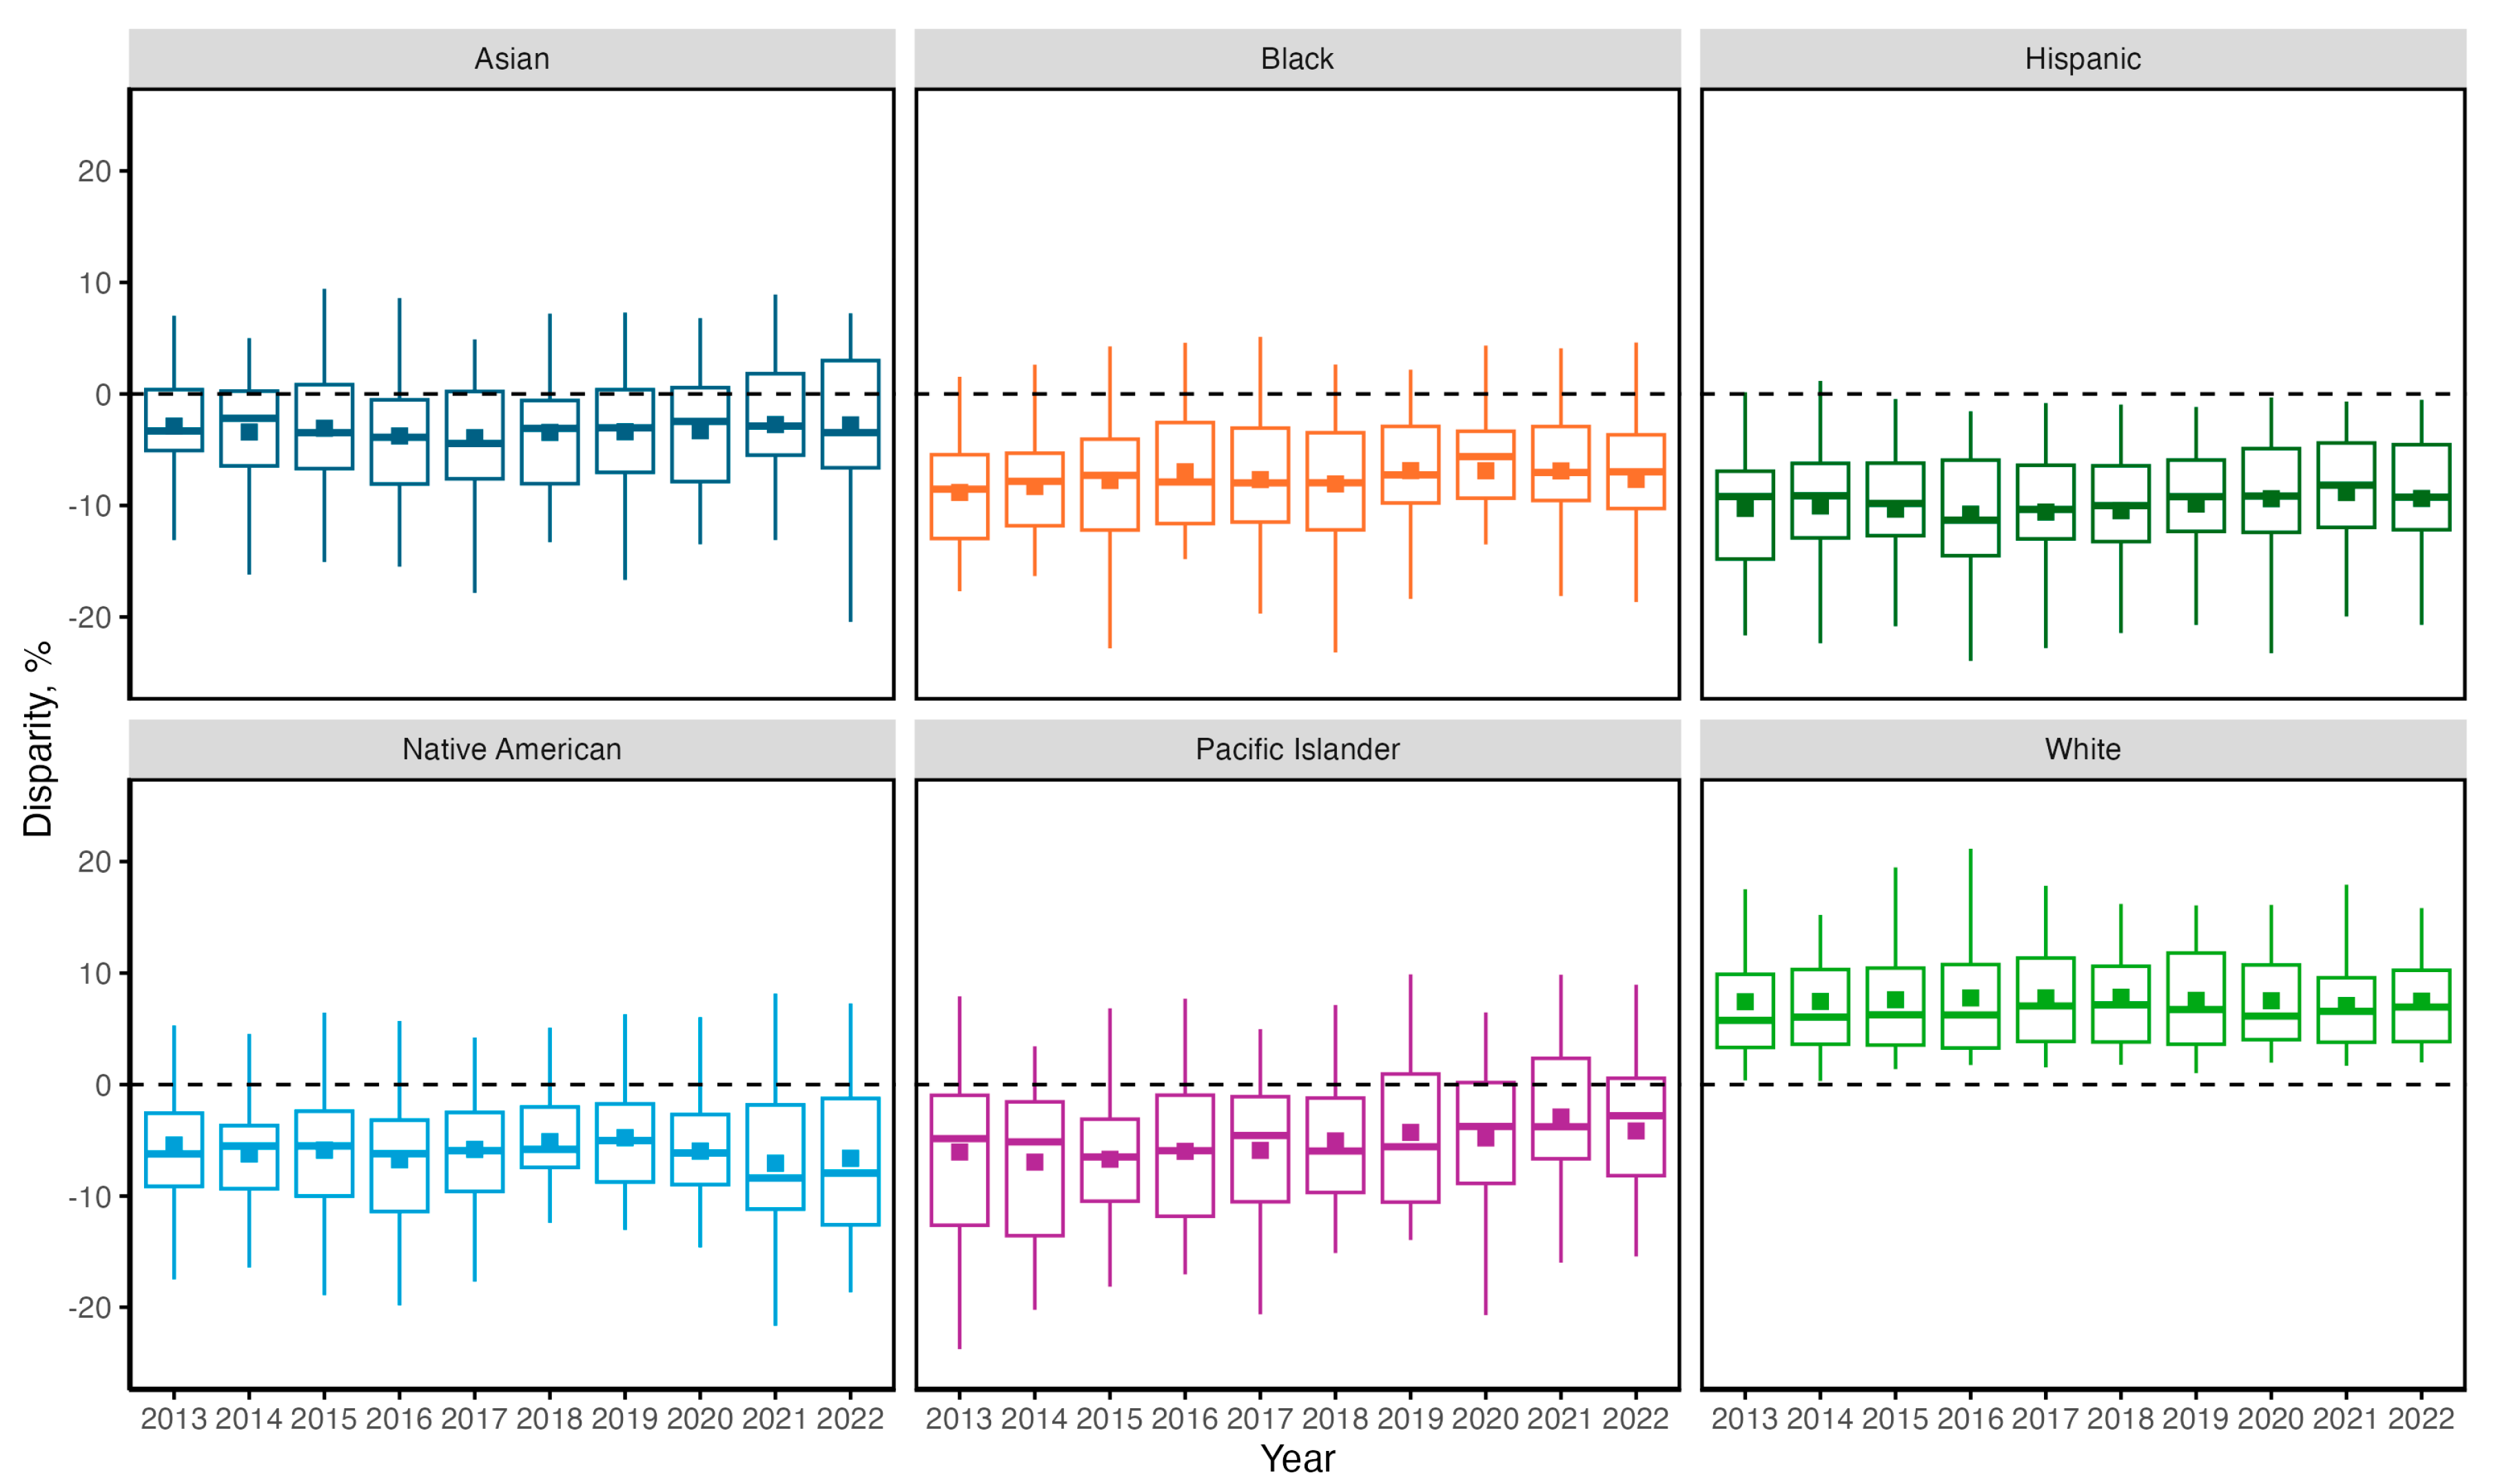
To assess the unequal accessibility to UGS, we computed the disparity index for each racial/ethnic group and visualized the temporal variations of these indices in Figure 4. While some temporal variations are observed, the disparity indices generally remain consistent across different racial/ethnic groups. White individuals exhibit higher-than-average greenness exposure across all 10 years for all metropolitan divisions. Conversely, all other racial/ethnic groups including Asian, Black, Hispanic, Native American, and Pacific Islander individuals frequently experience lower-than-average greenness exposure. Hispanic people experience the worst UGS exposure; they have lower-than-average UGS exposure in almost all years across all metropolitan divisions.
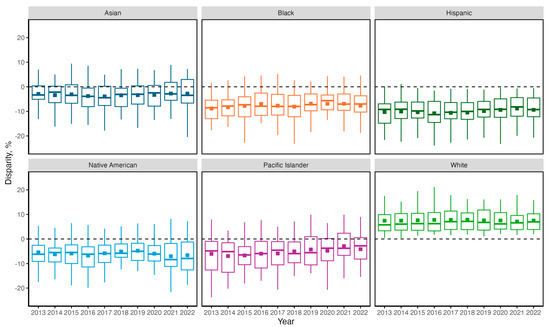
Figure 4.
Changes in greenness exposure disparities among different racial/ethnic groups over time.
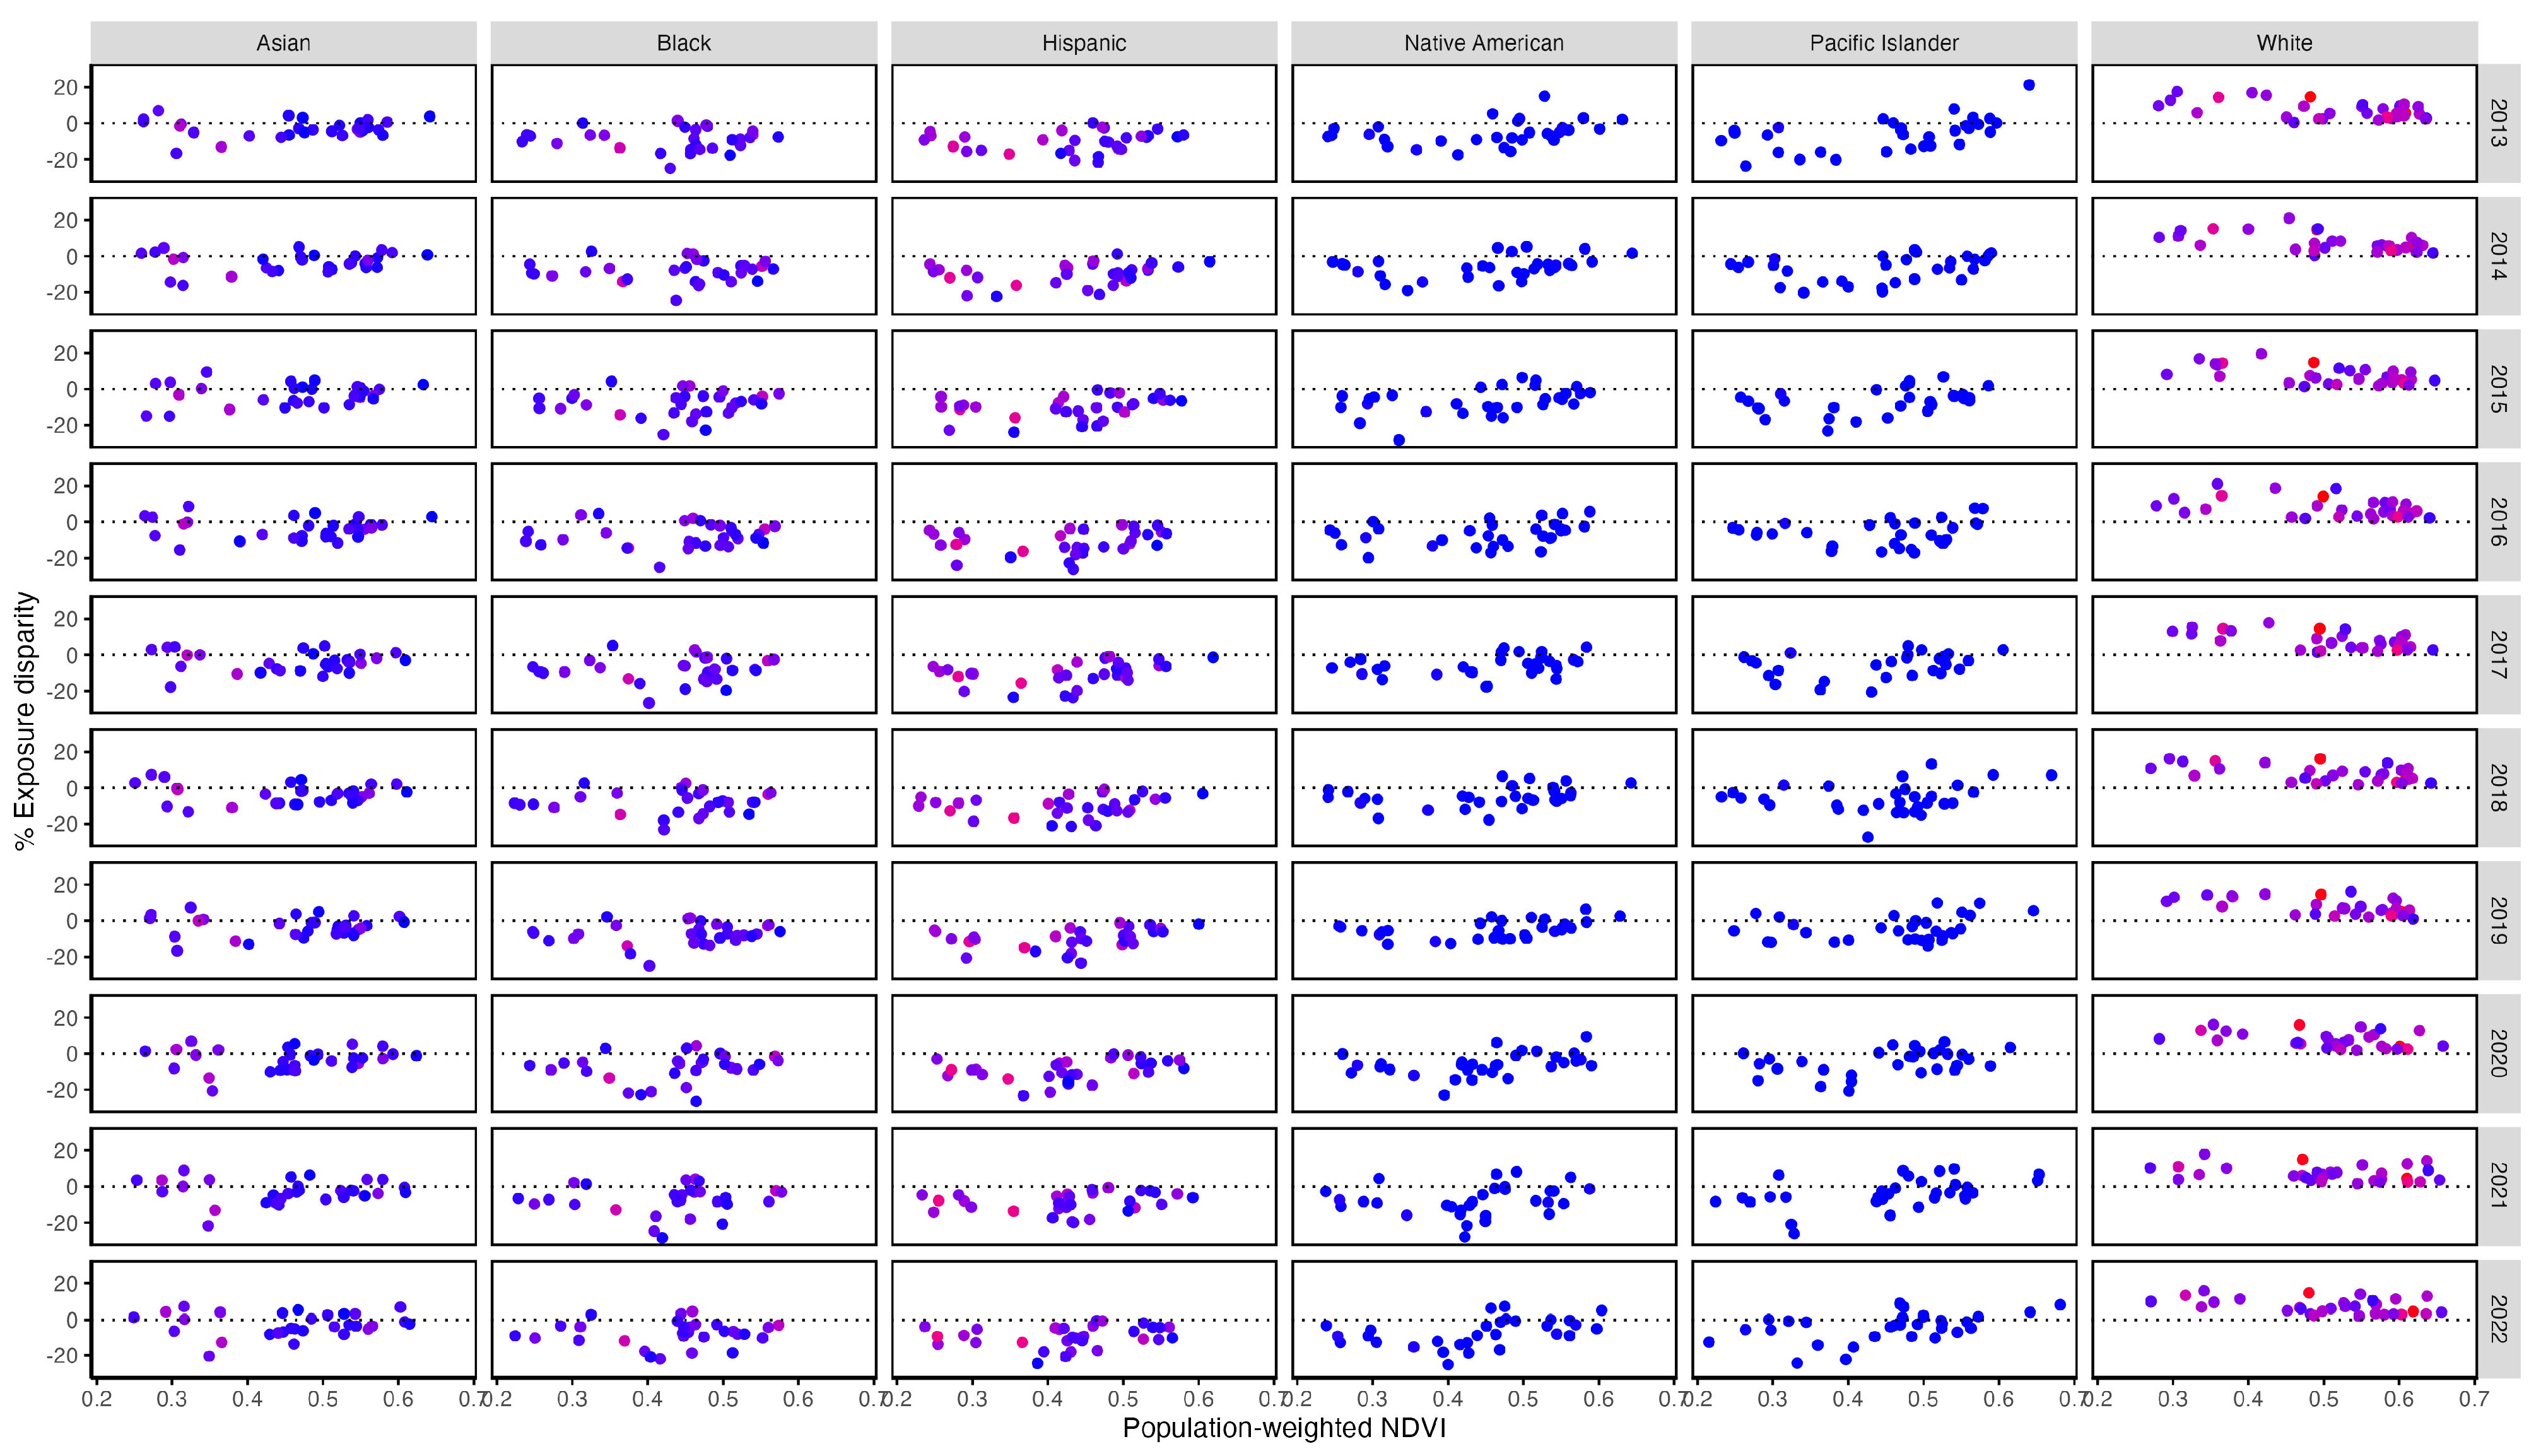
Figure 5 visualizes the relationships between greenness exposure disparity and population-weighted NDVI across all years and racial/ethnic groups. Each point on the graph represents a metropolitan division, with colors indicating population size—a filled color closer to red denotes larger populations, while a filled color closer to blue indicates smaller populations. Consistent with the findings presented in Figure 4, the 10 subplots in the last row of Figure 5 (subplots for the White group between 2013 and 2022) illustrate that White individuals exhibit positive disparity values in all metropolitan divisions over the entire study period, indicating higher-than-average UGS exposure. Conversely, all other subplots from Figure 5 show that all other racial/ethnic groups, including Asian, Black, Hispanic, Native American, and Pacific Islander, consistently demonstrate lower-than-average exposure. Notably, 10 subplots from the Hispanic row between 2013 and 2022 illustrate that Hispanic individuals experience lower-than-average UGS exposure in all metropolitan divisions throughout the ten-year period, whereas other racial/ethnic groups encounter higher-than-average UGS exposure in certain metropolitan divisions during specific years.
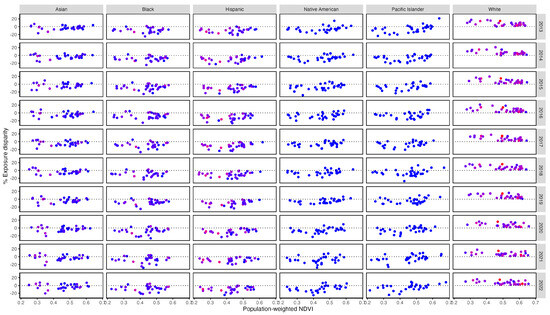
Figure 5.
The relationship between racial/ethnic greenness exposure disparity and population-weighted NDVI for all metropolitan divisions (points are colored by population size, with colors closer to red indicating larger populations and colors closer to blue indicating smaller populations).
4. Discussion
In this study, we assessed the temporal evolution of UGS exposure across major U.S. metropolitan areas, focusing on different racial/ethnic groups from 2013 to 2022. Our findings indicate that there have been no significant changes in population-weighted NDVI over the past decade. This lack of significant improvement in UGS accessibility suggests that efforts to enhance green space availability in these urban areas have been insufficient.
Figure 3 shows the within-city disparities in NDVI exposure across all racial/ethnic groups, demonstrating fluctuations with no significant changes throughout the study period. This consistency in within-city disparities suggests a lack of significant community-level updates to the existing green infrastructure and a limited effort to enhance the equality of UGS accessibility across all metropolitan divisions over the past decade. This persistent trend in disparity underscores the urgent need for a focused and proactive approach by local urban planning and policy-making entities to enhance the equity of UGS accessibility across cities.
Disparities in UGS accessibility among different racial/ethnic groups within major metropolitan areas are clear. As demonstrated in Figure 4 and Figure 5, White individuals consistently experience higher-than-average greenness exposure across all cities, whereas other racial/ethnic groups frequently face lower-than-average exposure. This pattern of disparity has persisted over the past decade without any signs of improvement, highlighting a continuous environmental injustice. The consistent trend in within-city disparity across all racial/ethnic groups further underscores the systematic and enduring inequalities in UGS accessibility across all major U.S. cities during this period.
The profound inequalities in UGS accessibility observed in this study were caused by a range of complex, inter-related factors. A significant contributing factor is the historical development patterns during periods of rapid urban infrastructure expansion, where there was limited awareness of or consideration for equitable UGS distribution. This oversight has led to systematic disparities in green space accessibility. Additionally, in densely developed areas, the availability of land and high real estate values often restrict opportunities for new green space development. Socioeconomic disparities further influence the capacity of different communities to develop and maintain these green spaces. Collectively, these factors contribute to spatial disparities in UGS distribution, resulting in unequal access to green spaces among different racial/ethnic groups.
This study underscores the critical need for targeted interventions in urban planning and policy-making, to address disparities in UGS accessibility. To ensure equitable access, strategies must prioritize the just distribution of green resources so that all communities, especially those historically underserved, can benefit equitably. We propose comprehensive strategies from three directions: firstly, enhancing green infrastructure by augmenting existing public spaces with features such as street trees, green roofs, and walls, and encouraging the development of private green spaces through incentives for businesses and landowners; secondly, optimizing future UGS design by modifying zoning regulations to support green space integration in urban development, particularly in high-density, low-access areas, and involving community members in the planning process to tailor UGS developments to their specific needs; and lastly, developing metrics for continuous monitoring and evaluation of UGS accessibility disparities, utilizing geospatial data to identify and target areas lacking green space. These strategies are aimed at mitigating persistent disparities in UGS exposure and are essential for promoting environmental justice, enhancing public health, and advancing sustainable urban development.
One limitation of this study is its focus on the static distribution of population at an aggregated level, neglecting the spatiotemporal variations in population movement. While people may encounter green spaces beyond their immediate residential areas due to daily routines, we believe that the population-weighted models at the aggregated level remain effective for assessing greenness exposure across metropolitan areas. This assertion holds particularly true under the condition that this research primarily addresses infrastructure-induced UGS accessibility disparities, rather than mobility-induced UGS exposure disparities. These models are grounded in the assumption that individuals’ activities are predominantly centered around their places of residence. For future research, incorporating human mobility into the assessment of greenness exposure could enhance the accuracy of real-time evaluations. This approach would allow for a more detailed examination of spatial and temporal variations and disparities in greenness exposure.
5. Conclusions
In conclusion, this study has illuminated significant concerns regarding the distribution and accessibility of UGS across major U.S. metropolitan divisions from 2013 to 2022. Despite the established importance of UGS in enhancing urban climate regulation and public health, our findings reveal a stagnant trend in population-weighted UGS exposure and within-city disparities in UGS access among racial/ethnic groups. Particularly, White communities exhibit greater access compared to all other groups, such as Asian, Black, Hispanic, Native American, and Pacific Islander communities, highlighting persistent inequalities. These disparities underscore a critical need for targeted urban planning and policy interventions aimed at reducing uneven UGS access and ensuring equitable green space distribution. Addressing these challenges is essential not only for fostering environmental justice but also for enhancing the overall health and sustainability of urban environments. Our research highlights the need for a focus on inclusive urban development policies that prioritize green space accessibility for all communities, thereby contributing to the resilience and vitality of urban areas.
Supplementary Materials
The following supporting information can be downloaded at https://www.mdpi.com/article/10.3390/land13081182/s1, Figure S1: The changes in racial/ethnic group populations between 2013 and 2022 for all 31 metropolitan divisions; Table S1: The list of each metropolitan division’s name, area, population, and population density based on 2020 ACS demographical data (ordered by total population).
Author Contributions
Conceptualization, M.T. and X.L.; methodology, M.T. and X.L.; software, M.T.; formal analysis, M.T. and X.L.; investigation, M.T. and X.L.; resources, M.T. and X.L.; data curation, M.T.; writing—original draft preparation, M.T.; writing—review and editing, M.T. and X.L.; visualization, M.T. and X.L. All authors have read and agreed to the published version of the manuscript.
Funding
This research received no external funding.
Data Availability Statement
The data presented in this study are available on request from the corresponding author.
Conflicts of Interest
The authors declare no conflicts of interest.
References
- Abdmouleh, M.A.; Dahech, S. Spatio-temporal variation of noise pollution in South Paris during and outside the COVID-19 lockdowns. Sci. Rep. 2024, 14, 1487. [Google Scholar] [CrossRef] [PubMed]
- Amoatey, P.; Al-Harthy, I.; Al-Jabri, K.; Al-Mamun, A.; Baawain, M.S.; Al-Mayahi, A. Impact of COVID-19 pandemic on aircraft noise levels, annoyance, and health effects in an urban area in Oman. Environ. Sci. Pollut. Res. 2022, 29, 23407–23418. [Google Scholar] [CrossRef] [PubMed]
- Tang, M.; Acharya, T.D.; Niemeier, D.A. Black Carbon Concentration Estimation with Mobile-Based Measurements in a Complex Urban Environment. ISPRS Int. J. Geo Inf. 2023, 12, 290. [Google Scholar] [CrossRef]
- Mueller, N.; Rojas-Rueda, D.; Basagaña, X.; Cirach, M.; Hunter, T.C.; Dadvand, P.; Donaire-Gonzalez, D.; Foraster, M.; Gascon, M.; Martinez, D.; et al. Urban and transport planning related exposures and mortality: A health impact assessment for cities. Environ. Health Perspect. 2017, 125, 89–96. [Google Scholar] [CrossRef] [PubMed]
- Zhong, J.; Liu, W.; Niu, B.; Lin, X.; Deng, Y. Role of Built Environments on Physical Activity and Health Promotion: A Review and Policy Insights. Front. Public Health 2022, 10, 950348. [Google Scholar] [CrossRef]
- Benedict, M.A.; McMahon, E.T. Green infrastructure: Smart conservation for the 21st century. Renew. Resour. J. 2002, 20, 12–17. [Google Scholar]
- Mell, I.C. Green infrastructure: Reflections on past, present and future praxis. Landsc. Res. 2017, 42, 135–145. [Google Scholar] [CrossRef]
- Gupta, A.; De, B. A systematic review on urban blue-green infrastructure in the south Asian region: Recent advancements, applications, and challenges Uncorrected Proof. Water Sci. Technol. 2024, 89, 382–403. [Google Scholar] [CrossRef]
- Hamel, P.; Tan, L. Blue–Green Infrastructure for Flood and Water Quality Management in Southeast Asia: Evidence and Knowledge Gaps. Environ. Manag. 2022, 69, 699–718. [Google Scholar] [CrossRef] [PubMed]
- Rahman, K.M.; Zhang, D. Analyzing the Level of Accessibility of Public Urban Green Spaces to Different Socially Vulnerable Groups of People. Sustainability 2018, 10, 3917. [Google Scholar] [CrossRef]
- Khan, S.A.; Fatima, K.; Hussain, S.; Ali, M.M.; Mannan, A.; Butt, N.I. Mitigation of Noise Pollution in Urban Areas by Strategically Planting Trees and Shrubs. J. CleanWAS 2023, 7, 41–47. [Google Scholar] [CrossRef]
- Selmi, W.; Weber, C.; Rivière, E.; Blond, N.; Mehdi, L.; Nowak, D. Air pollution removal by trees in public green spaces in Strasbourg. Urban For. Urban Green. 2016, 17, 192–201. [Google Scholar] [CrossRef]
- Nowak, D.J.; Crane, D.E.; Stevens, J.C. Air pollution removal by urban trees and shrubs in the United States. Urban For. Urban Green. 2006, 4, 115–123. [Google Scholar] [CrossRef]
- Rundle, A.; Quinn, J.; Lovasi, G.; Bader, M.D.M.; Yousefzadeh, P.; Weiss, C.; Neckerman, K. Associations between Body Mass Index and Park Proximity, Size, Cleanliness, and Recreational Facilities. Am. J. Health Promot. 2013, 27, 262–269. [Google Scholar] [CrossRef] [PubMed]
- Astell-Burt, T.; Feng, X. Urban green space, tree canopy and prevention of cardiometabolic diseases: A multilevel longitudinal study of 46,786 Australians. Int. J. Epidemiol. 2020, 49, 926–933. [Google Scholar] [CrossRef] [PubMed]
- Astell-Burt, T.; Feng, X. Urban green space, tree canopy, and prevention of heart disease, hypertension, and diabetes: A longitudinal study. Lancet Planet. Health 2019, 3, S16. [Google Scholar] [CrossRef]
- Seo, S.; Choi, S.; Kim, K.; Kim, S.M.; Park, S.M. Association between urban green space and the risk of cardiovascular disease: A longitudinal study in seven Korean metropolitan areas. Environ. Int. 2019, 125, 51–57. [Google Scholar] [CrossRef]
- Twohig-Bennett, C.; Jones, A. The health benefits of the great outdoors: A systematic review and meta-analysis of greenspace exposure and health outcomes. Environ. Res. 2018, 166, 628–637. [Google Scholar] [CrossRef]
- Fong, K.C.; Hart, J.E.; James, P. A review of epidemiologic studies on greenness and health: Updated literature through 2017. Curr. Environ. Health Rep. 2018, 5, 77–87. [Google Scholar] [CrossRef]
- Lee, K.O.; Mai, K.M.; Park, S. Green space accessibility helps buffer declined mental health during the COVID-19 pandemic: Evidence from big data in the United Kingdom. Nat. Ment. Health 2023, 1, 124–134. [Google Scholar] [CrossRef]
- Lai, K.Y.; Kumari, S.; Gallacher, J.; Webster, C.; Sarkar, C. Nexus between residential air pollution and physiological stress is moderated by greenness. Nat. Cities 2024, 1, 225–237. [Google Scholar] [CrossRef]
- Santamouris, M.; Osmond, P. Increasing Green Infrastructure in Cities: Impact on Ambient Temperature, Air Quality and Heat-Related Mortality and Morbidity. Buildings 2020, 10, 233. [Google Scholar] [CrossRef]
- Choi, H.M.; Lee, W.; Roye, D.; Heo, S.; Orru, H.; Kim, H.; Kysel, J.; Madueira, J.; Schwartz, J.; Jaakkola, J.J.K.; et al. Effect modification of greenness on the association between heat and mortality: A multi-city multi-country study. Lancet 2022, 84, 104251. [Google Scholar] [CrossRef]
- Wu, L.; Kim, S.K. Exploring the equality of accessing urban green spaces: A comparative study of 341 Chinese cities. Ecol. Indic. 2021, 121, 107080. [Google Scholar] [CrossRef]
- Li, X.; Zhang, C.; Li, W.; Kuzovkina, Y.A. Urban Forestry & Urban Greening Environmental inequities in terms of different types of urban greenery in Hartford, Connecticut. Urban For. Urban Green. 2016, 18, 163–172. [Google Scholar] [CrossRef]
- LU, Y.; CHEN, R.; CHEN, B.; WU, J. Inclusive green environment for all? An investigation of spatial access equity of urban green space and associated socioeconomic drivers in China. Landsc. Urban Plan. 2024, 241, 104926. [Google Scholar] [CrossRef]
- Wüstemann, H.; Kalisch, D.; Kolbe, J. Access to urban green space and environmental inequalities in Germany. Landsc. Urban Plan. 2017, 164, 124–131. [Google Scholar] [CrossRef]
- You, H. Characterizing the inequalities in urban public green space provision in Shenzhen, China. Habitat Int. 2016, 56, 176–180. [Google Scholar] [CrossRef]
- Dai, D. Racial/ethnic and socioeconomic disparities in urban green space accessibility: Where to intervene? Landsc. Urban Plan. 2011, 102, 234–244. [Google Scholar] [CrossRef]
- Jesdale, B.M.; Morello-Frosch, R.; Cushing, L. The Racial/Ethnic Distribution of Heat Risk–Related Land Cover in Relation to Residential Segregation. Environ. Health Perspect. 2013, 121, 811–817. [Google Scholar] [CrossRef]
- Zhou, X.; Kim, J. Social disparities in tree canopy and park accessibility: A case study of six cities in Illinois using GIS and remote sensing. Urban For. Urban Green. 2013, 12, 88–97. [Google Scholar] [CrossRef]
- Watkins, S.L.; Gerrish, E. The relationship between urban forests and race: A meta-analysis. J. Environ. Manag. 2018, 209, 152–168. [Google Scholar] [CrossRef] [PubMed]
- Park, Y.; Guldmann, J.M. Understanding disparities in community green accessibility under alternative green measures: A metropolitan-wide analysis of Columbus, Ohio, and Atlanta, Georgia. Landsc. Urban Plan. 2020, 200, 103806. [Google Scholar] [CrossRef]
- Song, Y.; Chen, B.; Ho, H.C.; Kwan, M.P.; Liu, D.; Wang, F.; Wang, J.; Cai, J.; Li, X.; Xu, Y.; et al. Observed inequality in urban greenspace exposure in China. Environ. Int. 2021, 156, 106778. [Google Scholar] [CrossRef]
- Chen, B.; Wu, S.; Song, Y.; Webster, C.; Xu, B.; Gong, P. Contrasting inequality in human exposure to greenspace between cities of Global North and Global South. Nat. Commun. 2022, 13, 4636. [Google Scholar] [CrossRef]
- US Census Bureau. TIGER/Line Shapefile, 2020, Nation, U.S., Metropolitan Divisions. Available online: https://catalog.data.gov/dataset/tiger-line-shapefile-2020-nation-u-s-metropolitan-divisions (accessed on 9 February 2024).
- Chuang, W.-C.; Boone, C.G.; Locke, D.H.; Grove, J.M.; Whitmer, A.; Buckley, G.; Zhang, S. Tree canopy change and neighborhood stability: A comparative analysis of Washington, D.C. and Baltimore, MD. Urban For. Urban Green. 2017, 27, 363–372. [Google Scholar] [CrossRef]
- Fan, C.; Johnston, M.; Darling, L.; Scott, L.; Liao, F.H. Land use and socio-economic determinants of urban forest structure and diversity. Landsc. Urban Plan. 2019, 181, 10–21. [Google Scholar] [CrossRef]
- Xiao, Y.; Wang, Z.; Li, Z.; Tang, Z. An assessment of urban park access in Shanghai—Implications for the social equity in urban China. Landsc. Urban Plan. 2017, 157, 383–393. [Google Scholar] [CrossRef]
- Nesbitt, L.; Meitner, M.J.; Girling, C.; Sheppard, S.R.J.; Lu, Y. Who has access to urban vegetation? A spatial analysis of distributional green equity in 10 US cities. Landsc. Urban Plan. 2019, 181, 51–79. [Google Scholar] [CrossRef]
- Shanahan, D.F.; Lin, B.B.; Gaston, K.J.; Bush, R.; Fuller, R.A. Socio-economic inequalities in access to nature on public and private lands: A case study from Brisbane, Australia. Landsc. Urban Plan. 2014, 130, 14–23. [Google Scholar] [CrossRef]
- Pham, T.-T.-H.; Apparicio, P.; Landry, S.; Séguin, A.-M.; Gagnon, M. Predictors of the distribution of street and backyard vegetation in Montreal, Canada. Urban For. Urban Green. 2013, 12, 18–27. [Google Scholar] [CrossRef]
- Mao, Q.; Wang, L.; Guo, Q.; Li, Y.; Liu, M.; Xu, G. Evaluating cultural ecosystem services of urban residential green spaces from the perspective of residents’ satisfaction with green space. Front. Public Health 2020, 8, 226. [Google Scholar] [CrossRef] [PubMed]
- Wu, C.; Li, J.; Wang, C.; Song, C.; Haase, D.; Breuste, J.; Finka, M. Estimating the cooling effect of pocket green space in high density urban areas in Shanghai, China. Front. Environ. Sci. 2021, 9, 657969. [Google Scholar] [CrossRef]
- Chander, G.; Markham, B.L.; Helder, D.L. Summary of current radiometric calibration coefficients for Landsat MSS, TM, ETM+, and EO-1 ALI sensors. Remote Sens. Environ. 2009, 113, 893–903. [Google Scholar] [CrossRef]
- Dixon, P.M.; Weiner, J.; Mitchell-Olds, T.; Woodley, R. Bootstrapping the Gini coefficient of inequality. Ecology 1987, 68, 1548–1551. [Google Scholar] [CrossRef]
- Firebaugh, G. Empirics of world income inequality. Am. J. Sociol. 1999, 104, 1597–1630. [Google Scholar] [CrossRef]
- Deininger, K.; Squire, L. A new data set measuring income inequality. World Bank Econ. Rev. 1996, 10, 565–591. [Google Scholar] [CrossRef]
- R Core Team. R: A Language and Environment for Statistical Computing; R Core Team: Vienna, Austria, 2021; Available online: https://www.r-project.org/ (accessed on 1 May 2024).
- Wójcik, S.; Giemza, A.; Machowska, K.; Napora, J. wINEQ: Inequality Measures for Weighted Data. 2023. Available online: https://cran.r-project.org/web/packages/wINEQ/wINEQ.pdf (accessed on 1 May 2024).
- Tessum, C.W.; Paolella, D.A.; Chambliss, S.E.; Apte, J.S.; Hill, J.D.; Marshall, J.D. PM2.5 polluters disproportionately and systemically affect people of color in the United States. Sci. Adv. 2021, 7, eabf4491. [Google Scholar] [CrossRef]

Disclaimer/Publisher’s Note: The statements, opinions and data contained in all publications are solely those of the individual author(s) and contributor(s) and not of MDPI and/or the editor(s). MDPI and/or the editor(s) disclaim responsibility for any injury to people or property resulting from any ideas, methods, instructions or products referred to in the content. |
© 2024 by the authors. Licensee MDPI, Basel, Switzerland. This article is an open access article distributed under the terms and conditions of the Creative Commons Attribution (CC BY) license (https://creativecommons.org/licenses/by/4.0/).