Article

Does the Carbon Emissions Trading Pilot Policy Have a Demonstrated Impact on Advancing Low-Carbon Technology? Evidence from a Case Study in Beijing, China

1
School of Land Science and Technology, China University of Geosciences, 29, Xueyuan Road, Haidian District, Beijing 100083, China
2
Key Laboratory of Land Consolidation and Rehabilitation, Ministry of Natural Resources, Beijing 100083, China
*
Author to whom correspondence should be addressed.
Land 2024, 13(8), 1276; https://doi.org/10.3390/land13081276
Submission received: 14 July 2024 / Revised: 4 August 2024 / Accepted: 12 August 2024 / Published: 13 August 2024

Abstract

:
In response to the international appeal of developing low-carbon economy and realizing carbon peaking and neutrality goals, China has been exploring the construction of the carbon emissions trading market for years. Without the guidance of advanced technology, there would not be a low-carbon economy in the first place. Based on panel data of 30 provinces and cities in China from 2005 to 2020, this paper takes Beijing—which is the first pilot city in China—as the only treated group and uses the Synthetic Control Method to study the impact of the pilot policy on low-carbon technology innovation. The results show that, firstly, the number of low-carbon technology patents in Beijing increases significantly after the implementation of the pilot policy, proving a positive influence on technology innovation. Secondly, the policy effect has a certain time lag and is sensitive to the shock from both domestic and foreign carbon market, but this effect is gradually stable over time. This paper confirms that technological innovation is the key means of promoting the development of the low-carbon economy and calls on various carbon trading markets to pay attention to the internal mechanism of promoting low-carbon technology innovation to stimulate the vitality of market entities.

1. Introduction

Developing a low-carbon economy and reducing carbon emissions have become the consensus of the international community. By 2024, 36 international carbon markets will have been in operation, covering 18 percent of global greenhouse gas emissions and 58 percent of the global GDP. To achieve the “dual carbon goal”, China has continuously strengthened top-level design, technological, financial support; other guarantee plans have also been in place in a timely manner. However, as the largest carbon emitter in the world [1], China still faces an arduous task in the construction of the carbon emissions trading market system [2].
In 2011, China launched carbon emissions trading pilot markets in seven provinces and cities including Beijing, Tianjin, Shanghai, Chongqing, Guangdong, Hubei and Shenzhen, in chronological order, and national carbon trading markets were not opened until 2017. Although China started later, it now owns the world’s second largest carbon trading market after the European Union. As a major innovation of China’s climate governance mechanism, whether the carbon emissions trading market can further stimulate technological innovation and provide strong support to the realization of the “dual carbon” goal is becoming a focal issue [3]. In this context, many scholars have used simulation methods or established econometric models to analyze the ex-ante or ex-post effects of this environmental regulation [4], but few studies have analyzed its impact from the perspective of low-carbon technology innovation [5]. Moreover, most scholars have combined the seven pilot cities of China into one treated group [6,7,8] to calculate the average policy effect; with this method, it is hard to eliminate the fitting effect error caused by regional heterogeneity in different pilot provinces and cities. Accordingly, this study applies the Synthetic Control Method (SCM), a typical policy effect evaluation method, to select Beijing, the first pilot city in China, as the only treated group, and screens panel data of 30 provinces and cities in China from 2005 to 2020 to construct synthetic control groups, respectively. Robustness tests are conducted on the results of the Synthetic Control Method to ensure that the pilot policy is the only resulting incentive.
The theoretical contributions of this paper are as follows: Firstly, from the perspective of research, it confirms the positive impact of the carbon trading pilot policy from the perspective of low-carbon technology innovation; secondly, in terms of the research topic, low-carbon technology rather than broad technological innovation is taken as the main variable, and the Cooperative Patent Classification Method is chosen as the source of the explained variable, which has more international authority [5,6]; thirdly, in terms of research methods, the Synthetic Control Method is used to fit the data of the only treated group, and the results have passed the validity test, which enhances the scientificity and reliability of the experiment.
In fact, low-carbon technology innovation is considered to be the most important means of dealing with climate change and reducing long-term emissions costs [9]. This study provides a core suggestion for defining the future development direction of the carbon emissions trading market, which is to promote low-carbon technology innovation, which avoids affecting the application of this useful environmental regulation tool in practice due to the lack of relevant research. Since this paper mainly focuses on the specific impact of the carbon emissions trading market on low-carbon technology innovation, there are limitations in further summarizing the temporal and regional differences of such an impact.

2. Literature Review and Mechanism Analysis

2.1. Research Background of Domestic and Foreign Carbon Markets

The European Union Carbon Emission Trading System (EU-ETS) is the world’s first cross-national carbon emissions trading system. Some scholars believe that the mechanism of the European Union Carbon Emission Trading System can reduce carbon dioxide emissions and control energy efficiency [10], and national climate legislation has produced good guarantees for market operation [11]. However, in order to solve the pollution problems of emission-intensive enterprises, the strength of this market mechanism is far from enough [12], and the unfair competition caused by introduced emission-reducing enterprises may endanger the balanced market environment [13]. Some scholars have also used synthetic methods to assess the impact of ETS-type carbon emissions trading mechanisms on Australia, but the results show it is not adaptable, indicating that a good market’s running status depends on the decisions of policymakers according to the local conditions [14].
Summarizing the research themes of China’s carbon emissions trading pilot policy, it can be found that they mainly focus on two aspects: the carbon emissions reduction effect and low-carbon economic effect [5], but therein lies similar differences in the discussion of this issue. Most scholars believe that the pilot policy has a positive effect on pollution reduction targets; the emissions of carbon dioxide and other gas pollutants in pilot areas have decreased year by year [15,16]. Yu et al. [7] evaluated the policy impact on carbon performance level and concluded that this indicator has significantly improved, and Beijing’s improvement rate was the highest in China. Yu et al. [17] proved that expanding the scale of the carbon emissions trading market is conducive to improving environmental quality and promoting economic growth; the larger the scale is, the greater the incentive effect is. Chai et al. [18] also highlighted that the pilot policy promoted the growth of regional GDP.
However, some scholars propose that certain conditions are needed to realize the positive correlation between the size of the carbon emissions trading market and economic growth. Specifically, this is affected by the regional economic development level [19]. In the case of low economic development, carbon emissions trading will inhibit economic growth to a certain extent. Wang Bo et al. [20] also proved that unstable financial frictions, monetary policies and other macro-control may amplify the negative impact of climate policies on the macro-economy. Taking the pilot city Shenzhen as an example, Huang et al. [21] showed that the policy only stimulated relevant technology investment in the short term, while its long-term power was obviously limited.
The reasons for this divergence could fall into two categories: Firstly, the research data sets adopted by respective scholars are different. When evaluating the same explained variable, different scholars may adopt different control variables because there is no written evaluation standard in the academic circle. Some studies have found that the negative impact of the policy is more likely to be obtained by using numerical simulation methods [22]; Li et al. [23] believe that this phenomenon is related to the subjectivity that researchers can exercise in adjusting key parameters according to research assumptions. Secondly, different scholars have different opinions on environmental–economic theories. The traditional idea is that environmental regulation causes an increased input of related costs; the burden on enterprises weakens their vitality. On the contrary, the revision school puts forward the “Porter Hypothesis” [24], believing that reasonable environmental regulations can stimulate innovation motivation.
It is worth noting that most scholars mention that low-carbon technology innovation has a certain “intermediary role” in promoting low-carbon economic development [25,26]. The Porter Hypothesis has been confirmed and cited by many Chinese scholars [27]; this study is also inclined to this hypothesis, and the mechanism is analyzed below in detail.

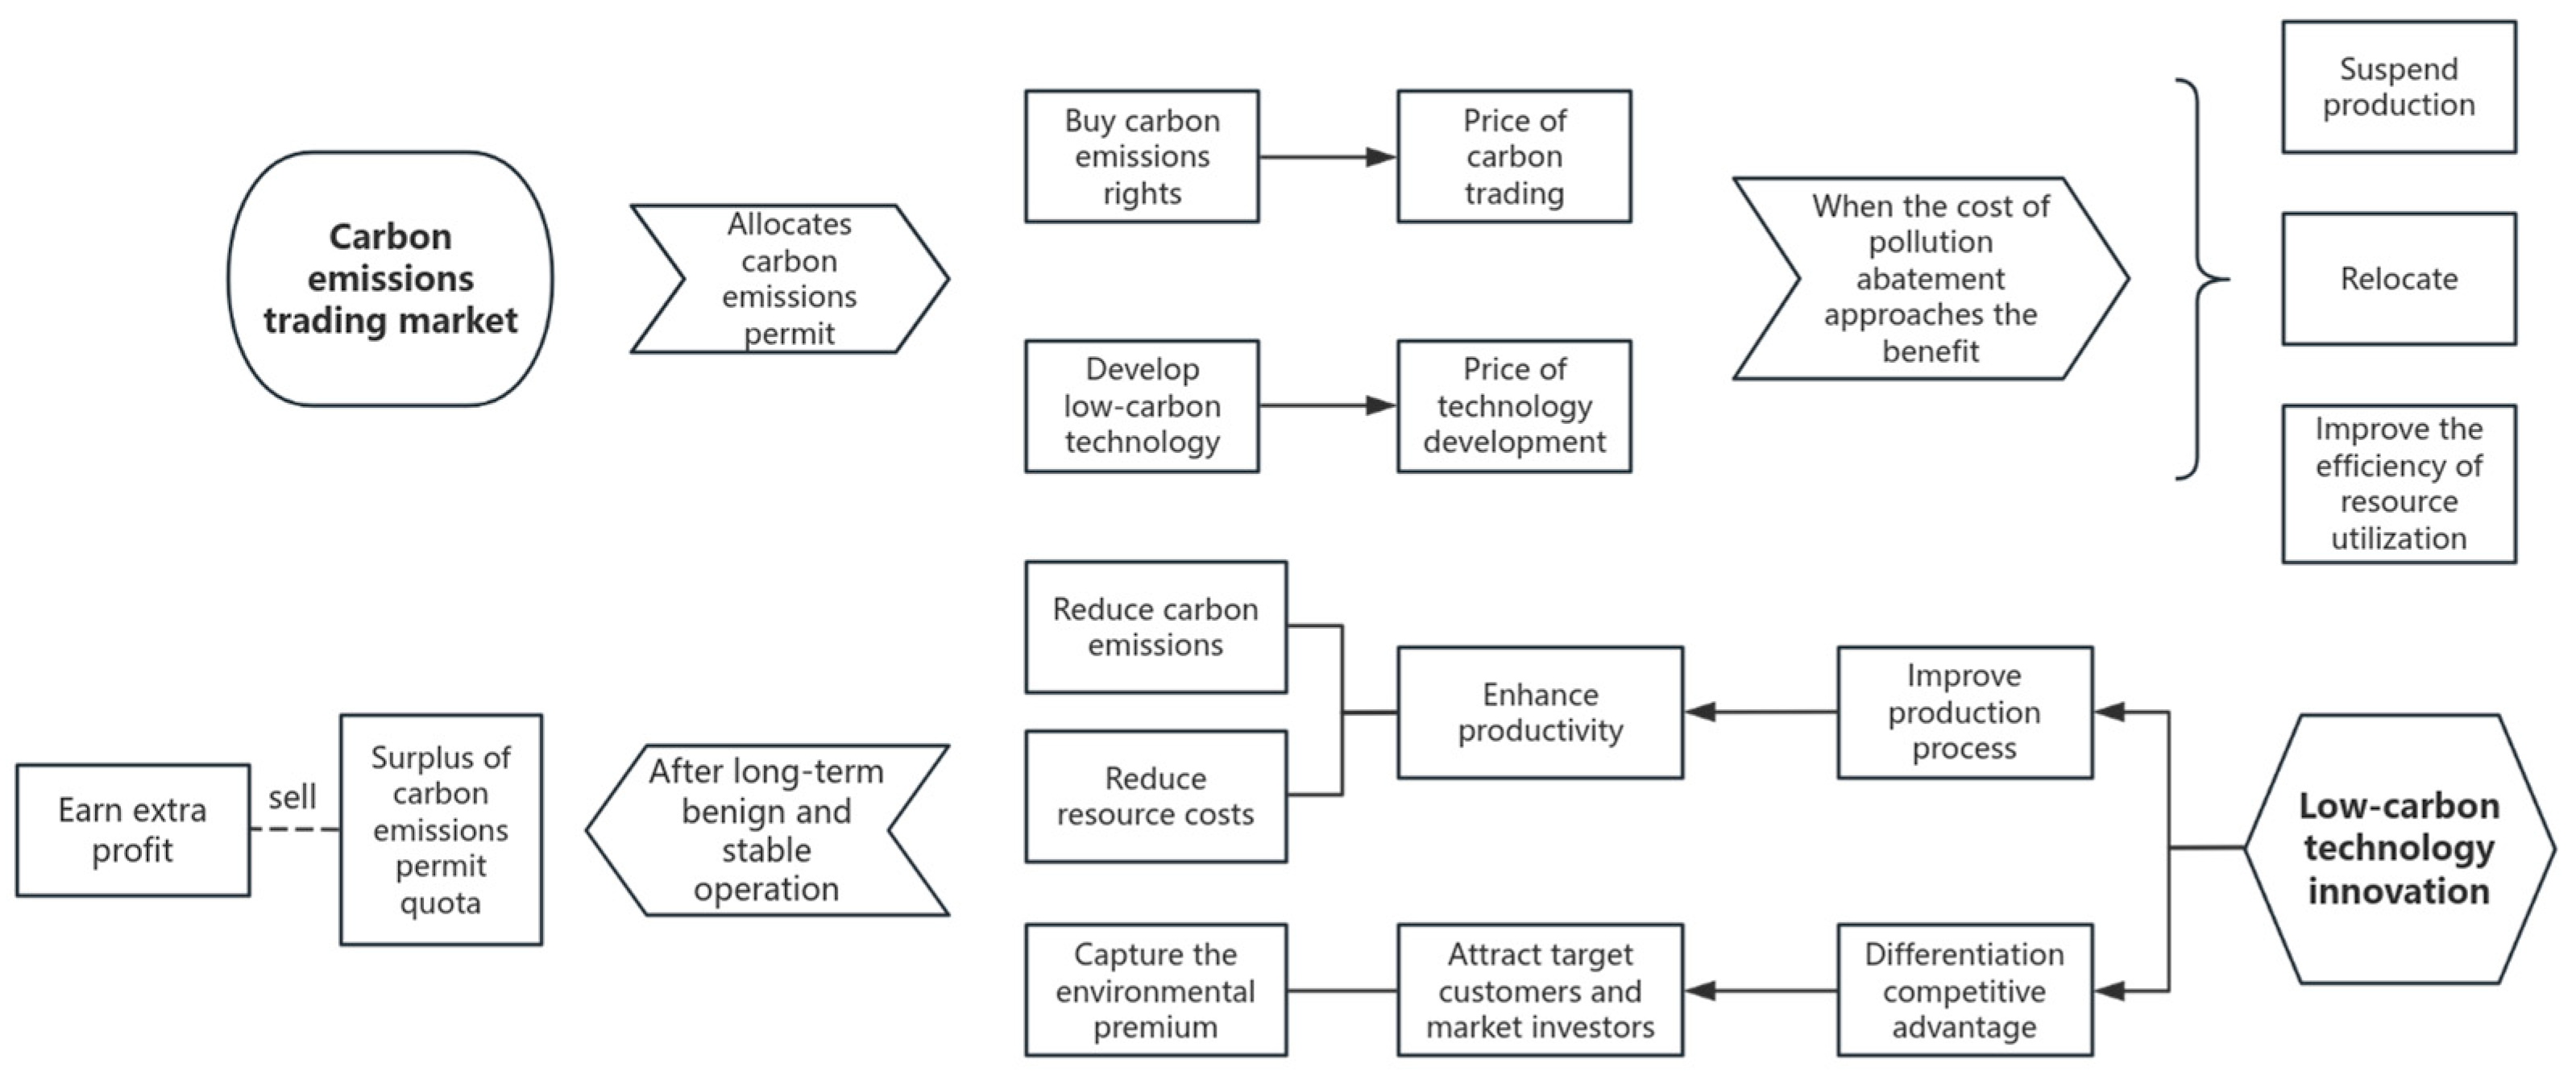
2.2. Derivation of Economic Theory

After greenhouse gas rights are confirmed, its market characteristics such as scarcity, commodity and trading become obvious; the carbon emissions trading market emerges soon after. In this market mechanism, the upper amount limit that enterprises are willing to pay for the purchase of carbon emissions rights is called the “green premium”, but when the purchase price exceeds the cost of low-carbon technology innovation, which means the “green premium” exceeds the threshold, enterprises will be more inclined to their own green transformation and technological upgrading rather than buying emissions rights [15]. Because when the cost of pollution reduction approaches its benefit, the enterprises are faced with three choices: suspending production, relocating or improving resource utilization efficiency through innovation [28]. If the first two methods are chosen, a large number of productive investments will become sunk costs, so rational enterprises will choose the third method. Furthermore, green technology innovation can not only reduce total carbon emissions and resource costs, but also make enterprises earn extra profit by selling its surplus quota in the long run [3], as shown in Figure 1.
To sum up, although technology innovation is the optimal choice for maximizing profits in the long run, when faced with an increase in short-term costs or innovation costs, the unpredictability of the future and the incompleteness of information will make the market entities lack motivation to take the initiative to carry out energy conservation and carbon emissions reduction. In order to make enterprises recognize the importance of technological innovation, so as to spontaneously choose this way to achieve the green production targets, it is more necessary to strengthen the government’s policy guidance and implement a reasonable low-carbon policy.
In recent years, with the expansion of the scale of China’s carbon emissions trading market, most scholars have begun to notice the impact of low-carbon technology innovation. Hu et al. [25] built a theoretical model to reflect the behavior of enterprises’ carbon emissions trading and took research and development innovation, productivity and profit margin as the intermediary variables, confirming that the increase in research and development innovation investment is a significant influence channel for improving the level of enterprise risk-taking. However, most studies have only proposed that the carbon emissions trading market has indirectly promoted regional economic transformation through technological innovation [15,29], and few have further proved the specific impact and influencing mechanism of the pilot policy on low-carbon technology innovation.

3. Methodology and Data

3.1. Assumptions

In recent years, some scholars have confirmed that the main way for China to achieve carbon emissions reduction and regional green economic development is to promote technology adoption [6,28,30,31,32]. Against the background of green development becoming the trend of new economy, in order to quickly gain a dominant position in the new market competition, the value creation mode of enterprises is gradually changing to green value creation [3]. Based on all the empirical theories above, the following hypothesis is made:
H1. 
The carbon emissions trading pilot policy can promote the development of low-carbon technology innovation in the areas.

3.2. Description of Study Area

Most of the empirical articles take the seven pilot provinces and areas of China as one treated group and estimate the average policy effect. However, this approach ignores the heterogeneity of the development characteristics and the pilot policy in different provinces and cities. For example, in terms of FDI, due to the superior geographical location and the high degree of opening to the outside world, large amounts of foreign investment have been attracted by Guangzhou; there is a difference of 1103.2 billion RMB lying in Guangzhou and Chongqing, which is the lowest gap in the study interval. In addition, there are also differences in the policy design of carbon emissions trading markets in different pilot areas. The carbon market of Shenzhen uniformly adopts the intension-based quota allocation method, but Chongqing adopts the total-based allocation method, and other carbon markets adopt the hybrid carbon quota allocation method according to different industries [3]. The pilot policy implements carbon emissions reduction targets at the city level, and each pilot city makes low-carbon development plans based on resource endowment and economic development, respectively; the driving effect of low-carbon technology innovation in diverse areas may be different [33]. Therefore, it is more appropriate to select one pilot city as the treated group.
As the first permitted carbon emissions pilot city in China, Beijing has taken multiple measures to actively carry out low-carbon pilot works, playing a leading role of innovation in energy conservation and pollution reduction. Based on historical data, the number of Beijing’s low-carbon technology patents has always been among the top in China. Compared with other provinces and cities in China, Beijing has better infrastructure construction and resource allocation, which means it better meets the strict preconditions of professional theories realization. Therefore, this study selects Beijing as the only treated group, avoiding errors caused by regional heterogeneity, which can improve the accuracy of the results.

3.3. Synthetic Control Method

In order to evaluate the influencing mechanism of the carbon emissions trading market, scholars often choose a variety of policy evaluation methods to conduct research. However, it must be considered that it is difficult to eliminate the influence of unnecessary factors via system dynamics and comparative analysis, and the Difference-In-Differences (DID) method used by most scholars in recent years has subjective arbitrariness in the selection of a control group. Similarly, the Propensity Score Matching Difference-In-Differences (PSM-DID) method is prone to lead to matching errors due to the interlocking of provinces and years [7,8]. Since it is difficult to disentangle the role of the carbon market from the combined effect of multiple policy roles, the Synthetic Control Method (SCM) is used in this study. The Synthetic Control Method calculates the optimal weight based on the data; compared with the Difference-In-Differences method, it has the following advantages: (1) It is suitable for studying the policy effect when the sample size is quite small. (2) It does not need to satisfy the parallel trend assumption. (3) The validity test with which it is paired is also more suitable for the case of small sample sizes. Since the research object of this paper is the panel data of 30 provinces and cities in China, the sample size used is relatively small, so the Synthetic Control Method is more suitable for conducting tests.
The implementation of the carbon emissions trading pilot policy is regarded as a quasi-natural experiment. The Synthetic Control Method is a policy effect evaluation method proposed by Abadie and Gardeazabal (2003) [32]; the basic idea is as follows: By fitting the data of the areas not subject to pilot policy intervention, a control group with similar conditions in all aspects of areas subject to policy intervention is obtained, and the impact of policy can be assessed by comparing trends in data differences between the two groups over the study period.
It is assumed that the data of patent numbers in (K + 1) provinces within time interval T (t ∈ [1,T]) can be collected, among which area i is assumed to implement the pilot policy at T0 (1 ≤ T0 ≤ T) and is used as the treated group; the other K areas which have not implemented the pilot policy serve as control groups.
Formula for change in low-carbon patent numbers generated by the carbon emissions trading pilot policy affecting region i at time t is as follows:
  a i t = Y i t I Y i t N
Y i t I represents the number of patents affected by the pilot policy in area i of the treated group at time t.
Y i t N represents the number of patents that are not affected by the pilot policy in area i at time t. D i t is a dummy variable of whether it is a pilot area, which is 1 if area i has implemented the carbon emissions trading pilot policy at time t and 0 otherwise. Then, the formula for calculating low-carbon patent numbers of area i at time t is as follows:
Y i t = Y i t N + D i t a i t
So, for the control group, Y i t = Y i t N ; for the treated group, a i t = Y i t I Y i t N = Y i t Y i t N . Only Y i t N is unknown for calculating a i t now. The factor model invented by Abadie [34] is used for evaluation:
Y i t N = δ t + θ t Z i + λ t μ i + ε i t
δ t is the time trend;
Z i is the observable (r × 1) dimensional control variable that is not affected by the pilot policy;
θ is the (1 × r) dimension unknown parameter vector;
λ i is the unobservable (1 × F) dimensional common factor vector;
μ i is the unpredictable (F × 1) Victoria city fixed effects;
ε i t is a transitory shock that cannot be predicted and has a mean of zero. According to proof from Abadie et al. [34], under general conditions, if the time before the policy is implemented is longer than the time after the policy is implemented, the following formula can be used as an unbiased estimate of Y i t N :
k = 2 K + 1 w k * Y k t
w k represents the synthetic control contribution rate of the control group to the treated group. Finally, the estimated value of the impact effect a 1 t of the carbon trading pilot policy is obtained:
a ^ 1 t = Y 1 t k = 2 K + 1 w k * Y k t , t [ T 0 + 1 , T ]

3.4. Selection of Variables

(1)
The explained variable is low-carbon technology innovation (Y02). It is believed that patent licensing standards have stability, objectivity and availability of relevant data [6]; the number of patents is a very reliable indicator and can better reflect the innovation level of a region. This study uses the Y02 classification under the Cooperative Patent Classification Method (CPC) in the IncoPat patent database to express low-carbon technological innovation [5,6]. Advanced search instructions ((AD = [20030101 TO 20201231]) AND (CPC = (Y02) AND ((PNC = “CN”)))) are used to screen the applicable conditions, in which the country and address of the applicant are all China, excluding patents applied by foreigners in China.
(2)
The control variables are the level of economic development, industrial structure, foreign direct investment, research and development capital and government intervention. In order to reduce heteroscedasticity, the non-dummy variables in the form of non-ratios are log-transformed. The indicators in RMB are all deflated by price indices using 2004 (the first year of study interval) as the base period.
Level of economic development (GDP). The level of economic development is the core indicator for measuring the economic situation and development level of a region. A region with a higher level has better quality of allocable resources, that is, technological innovation which provides more comprehensive support [27]. This study uses gross domestic product to measure the economic development level.
Industrial structure (Str). When the proportion of tertiary industries such as the financial industry, scientific research and technical service in the industrial structure of a region is greater than that of the secondary industries such as the manufacturing and processing industry, it is more conducive to favor research of clean technology, meaning a greater possibility of investment in low-carbon technology innovation. It is expressed by the ratio of the added value of tertiary industries to the added value of secondary industries.
Foreign direct investment (FDI). Foreign capital is an important way of financing China’s economic development, scientific and technological innovation; it is unrealistic to innovate without opening to the rest of the world [28]. It is expressed by the amount of foreign capital actually utilized by the region.
Research and development capital (R&D). It is widely recognized in research that research funding is an important factor affecting the level of technological innovation [25,35]. The funds used for social research and treatment development include personnel costs, material costs, management costs and other expenses for basic research and applied research, which can directly reflect the amount of social financial support for scientific innovation. It is expressed by the local fiscal expenditure on science and technology.
Government intervention (Gov). Scientific and technological innovation activities in a region cannot be separated from the support and subsidies of the local government. It is expressed by the general public service expenditure of local finance.

3.5. Data Resource

This study takes the years 2005–2020 as the study interval and selects panel data from 30 provinces and cities in China as the initial samples (Hong Kong, Macao, Taiwan and Xizang are not considered due to the serious lack of data). Among them, Beijing is taken as the treated group, and 24 non-pilot provinces and cities are taken as the control group. Data of low-carbon patents are obtained from the IncoPat Patent database (www.incopat.com, accessed on 2 July 2024). The original data of other control variables are mainly from the China Statistical Yearbook and websites of the local bureau of statistics. Table 1 shows the descriptive statistical analysis of the main variables.

4. Results

4.1. Empirical Analysis

This study uses Synth command in Stata to implement the Synthetic Control Method; the empirical results are as follows.
Figure 2 shows the number of low-carbon patents in Beijing and the corresponding synthetic units from 2005 to 2020. The two curves before the implementation of the pilot policy in 2011 are extremely close to each other, and the specific data are shown in Table 2. The difference value of the real Beijing and the synthetic Beijing are both small, with the largest being only 2.394%; this error is within scientific range compared with other existing studies. The control group can better simulate the innovation environment and the evolution path of low-carbon technology before and after the influence of the pilot policy.
The vertical distance between the two curves in Figure 2 indicates the net effects of the pilot policy. It is observed that the trend of the policy changes can be divided into three stages during the research interval: ① Prepared stage of policy implementation (2011–2015): There are little differences in the numbers of patents between the real and synthetic Beijing; this is because China has just issued the notice on pilot works of opening carbon emissions trading markets. The number of market entities was very small and they were all inexperienced, leading to a certain time lag before policy effects. ② Initial stage of policy implementation (2015–2017): The gap between the real and synthetic Beijing is worse than that of the earlier implementation, and the growth rate of the patent number difference slows down slightly. ③ Early stage of policy implementation (2017–2020) The difference in patent numbers is becoming more and more obvious, and the speed of the increase is also faster.
In order to confirm whether the method of division in the three stages above is scientific, this study continues to supplement the trend chart of the patent number difference between the real and synthetic Beijing from 2005 to 2020, that is, the “treatment effect” of the Synthetic Control Method. As shown in Figure 3, the results presented are consistent with the three-stage description, proving the rationality of the three stages of segmentation and the relevance of the policy effect to the length of implementation.
Table 3 lists the optimal weights of the synthetic results along with the corresponding synthetic areas. The optimal weight of Jilin and Zhejiang Provinces is not zero, while the optimal weight of other areas is zero, indicating that the corresponding synthetic units of Beijing is actually obtained through the weighted average of these two provinces.

4.2. Robustness Tests

In order to prove the statistical significance of the conclusions above, this study uses the Placebo Test and Permutation Test to test the robustness of the empirical results [36], so as to verify whether the improvement in low-carbon technology innovation level in the pilot areas is due to the pilot policy or other accidental factors. The difference between the two methods mainly lies in the different analysis units of the control group: the Placebo Test selects the control analysis units that are most similar to the treated group, but the Rank Test selects random control analysis units [37].

4.2.1. Placebo Test

The idea of Placebo Test is to conduct the same synthetic control analysis on certain units in the control group and compare the development gap between this city and the treated group. Since the city did not implement the pilot policy, the same policy effect should not occur as in real Beijing. That is, if the synthetic control results of this city are consistent with those of Beijing, then the research conclusion is not robust; otherwise, it proves that the conclusion is robust [4].
The most appropriate object for the Placebo Test is the city with the largest weight in Beijing; the greater the weight is, the closer the city is to Beijing. According to the results of the Synthetic Control Method above, Jilin and Zhejiang Provinces have the largest weight in the control group; thus, these two provinces were taken as placebo areas for the Placebo Test. Figure 4a,b show the results of the Placebo Test for Jilin and Zhejiang Provinces, respectively. The number of low-carbon patents in the synthetic provinces is significantly larger than that in the real provinces, and the difference in the numbers is not large, which proves the robustness of the conclusions of the Synthetic Control Method.

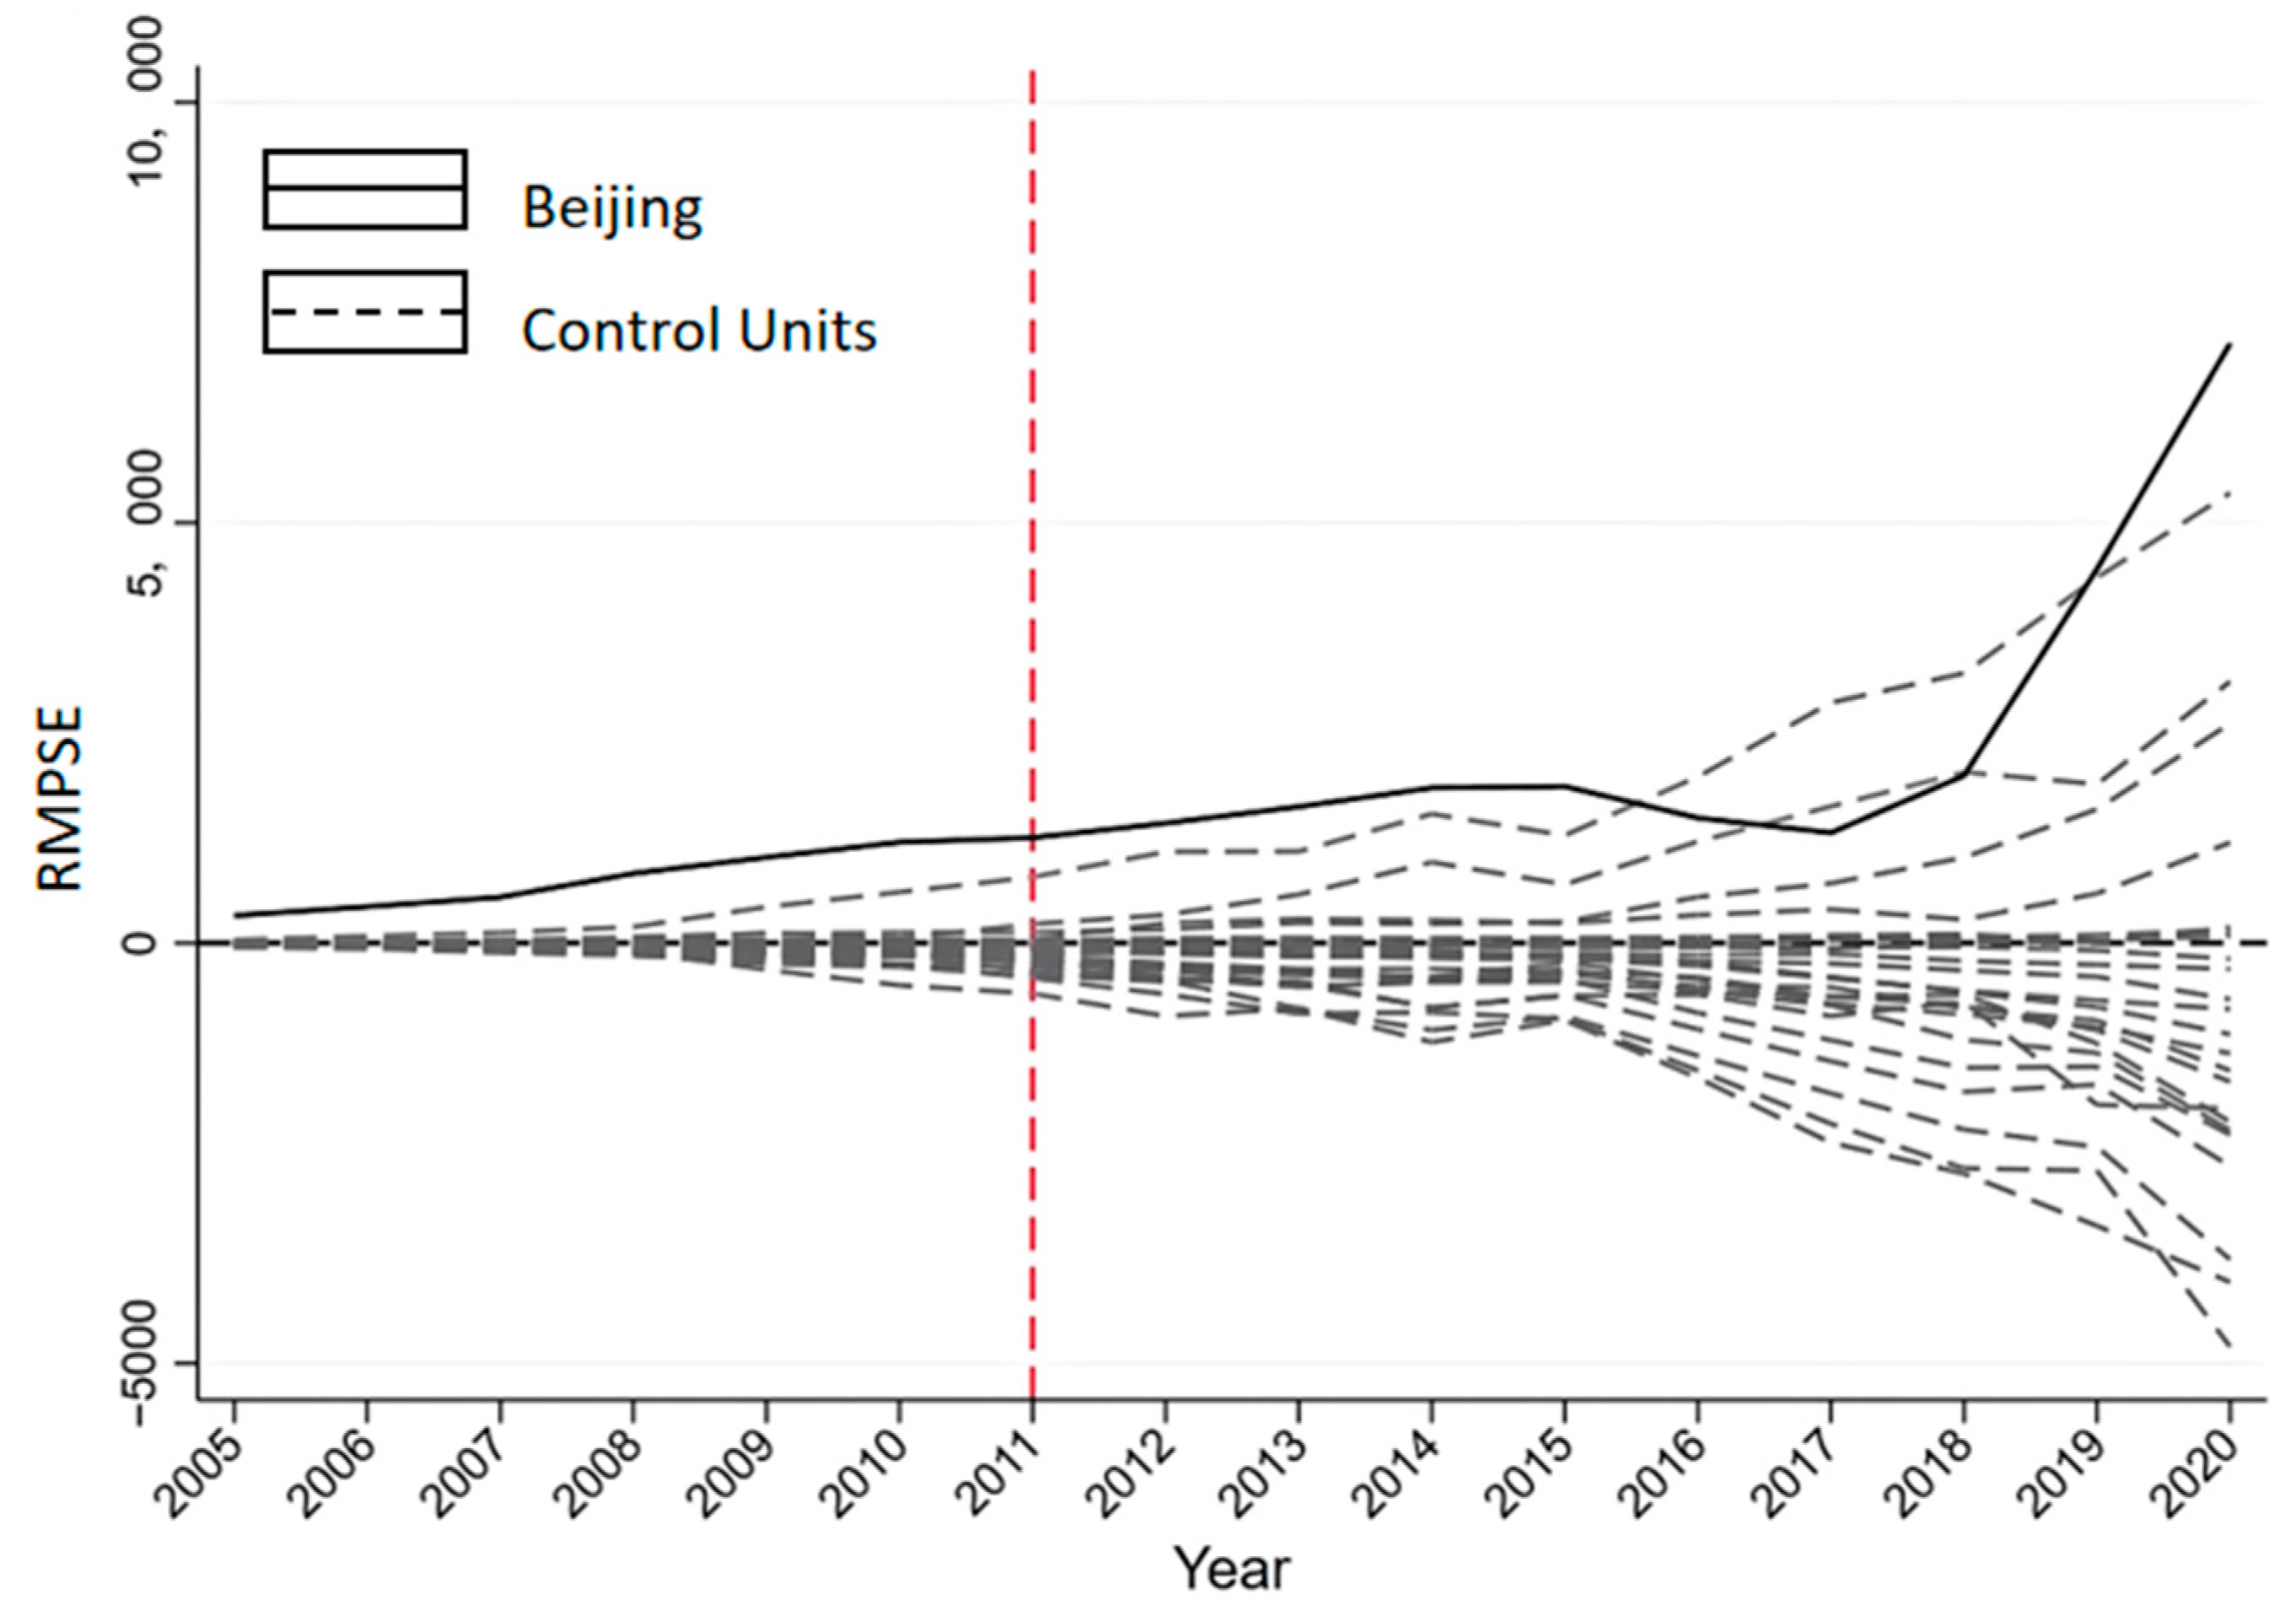
4.2.2. Permutation Test

The idea of the Permutation Test is to assume that all the areas in the control group have also implemented the same pilot policy when the treated group did; the Synthetic Control Method is used to do the same fitting for each group. Based on the ideas above, the counterfactual fitting analysis is carried out on the control group; the ranking test results are shown in Figure 5. The black solid line represents Beijing, and the dotted line represents the qualified provinces and cities in the control group. Except for 2015 to 2017, the number of low-carbon patents in Beijing is continuously higher than that in other provinces and cities, confirming the correct conclusions above again.

5. Discussion

The results are consistent with the related literature on a certain “intermediary role” for low-carbon technology innovation in boosting the carbon emissions trading market. Conversely, a lower number of low-carbon patents probably means a stunted market. Through constructing “a counterfactual surrogate”, the effect of the pilot policy implementation on technology innovation is measured by the difference in numbers of patents. The results are clearly presented in Figure 6, and the main findings are as follows:
(1)
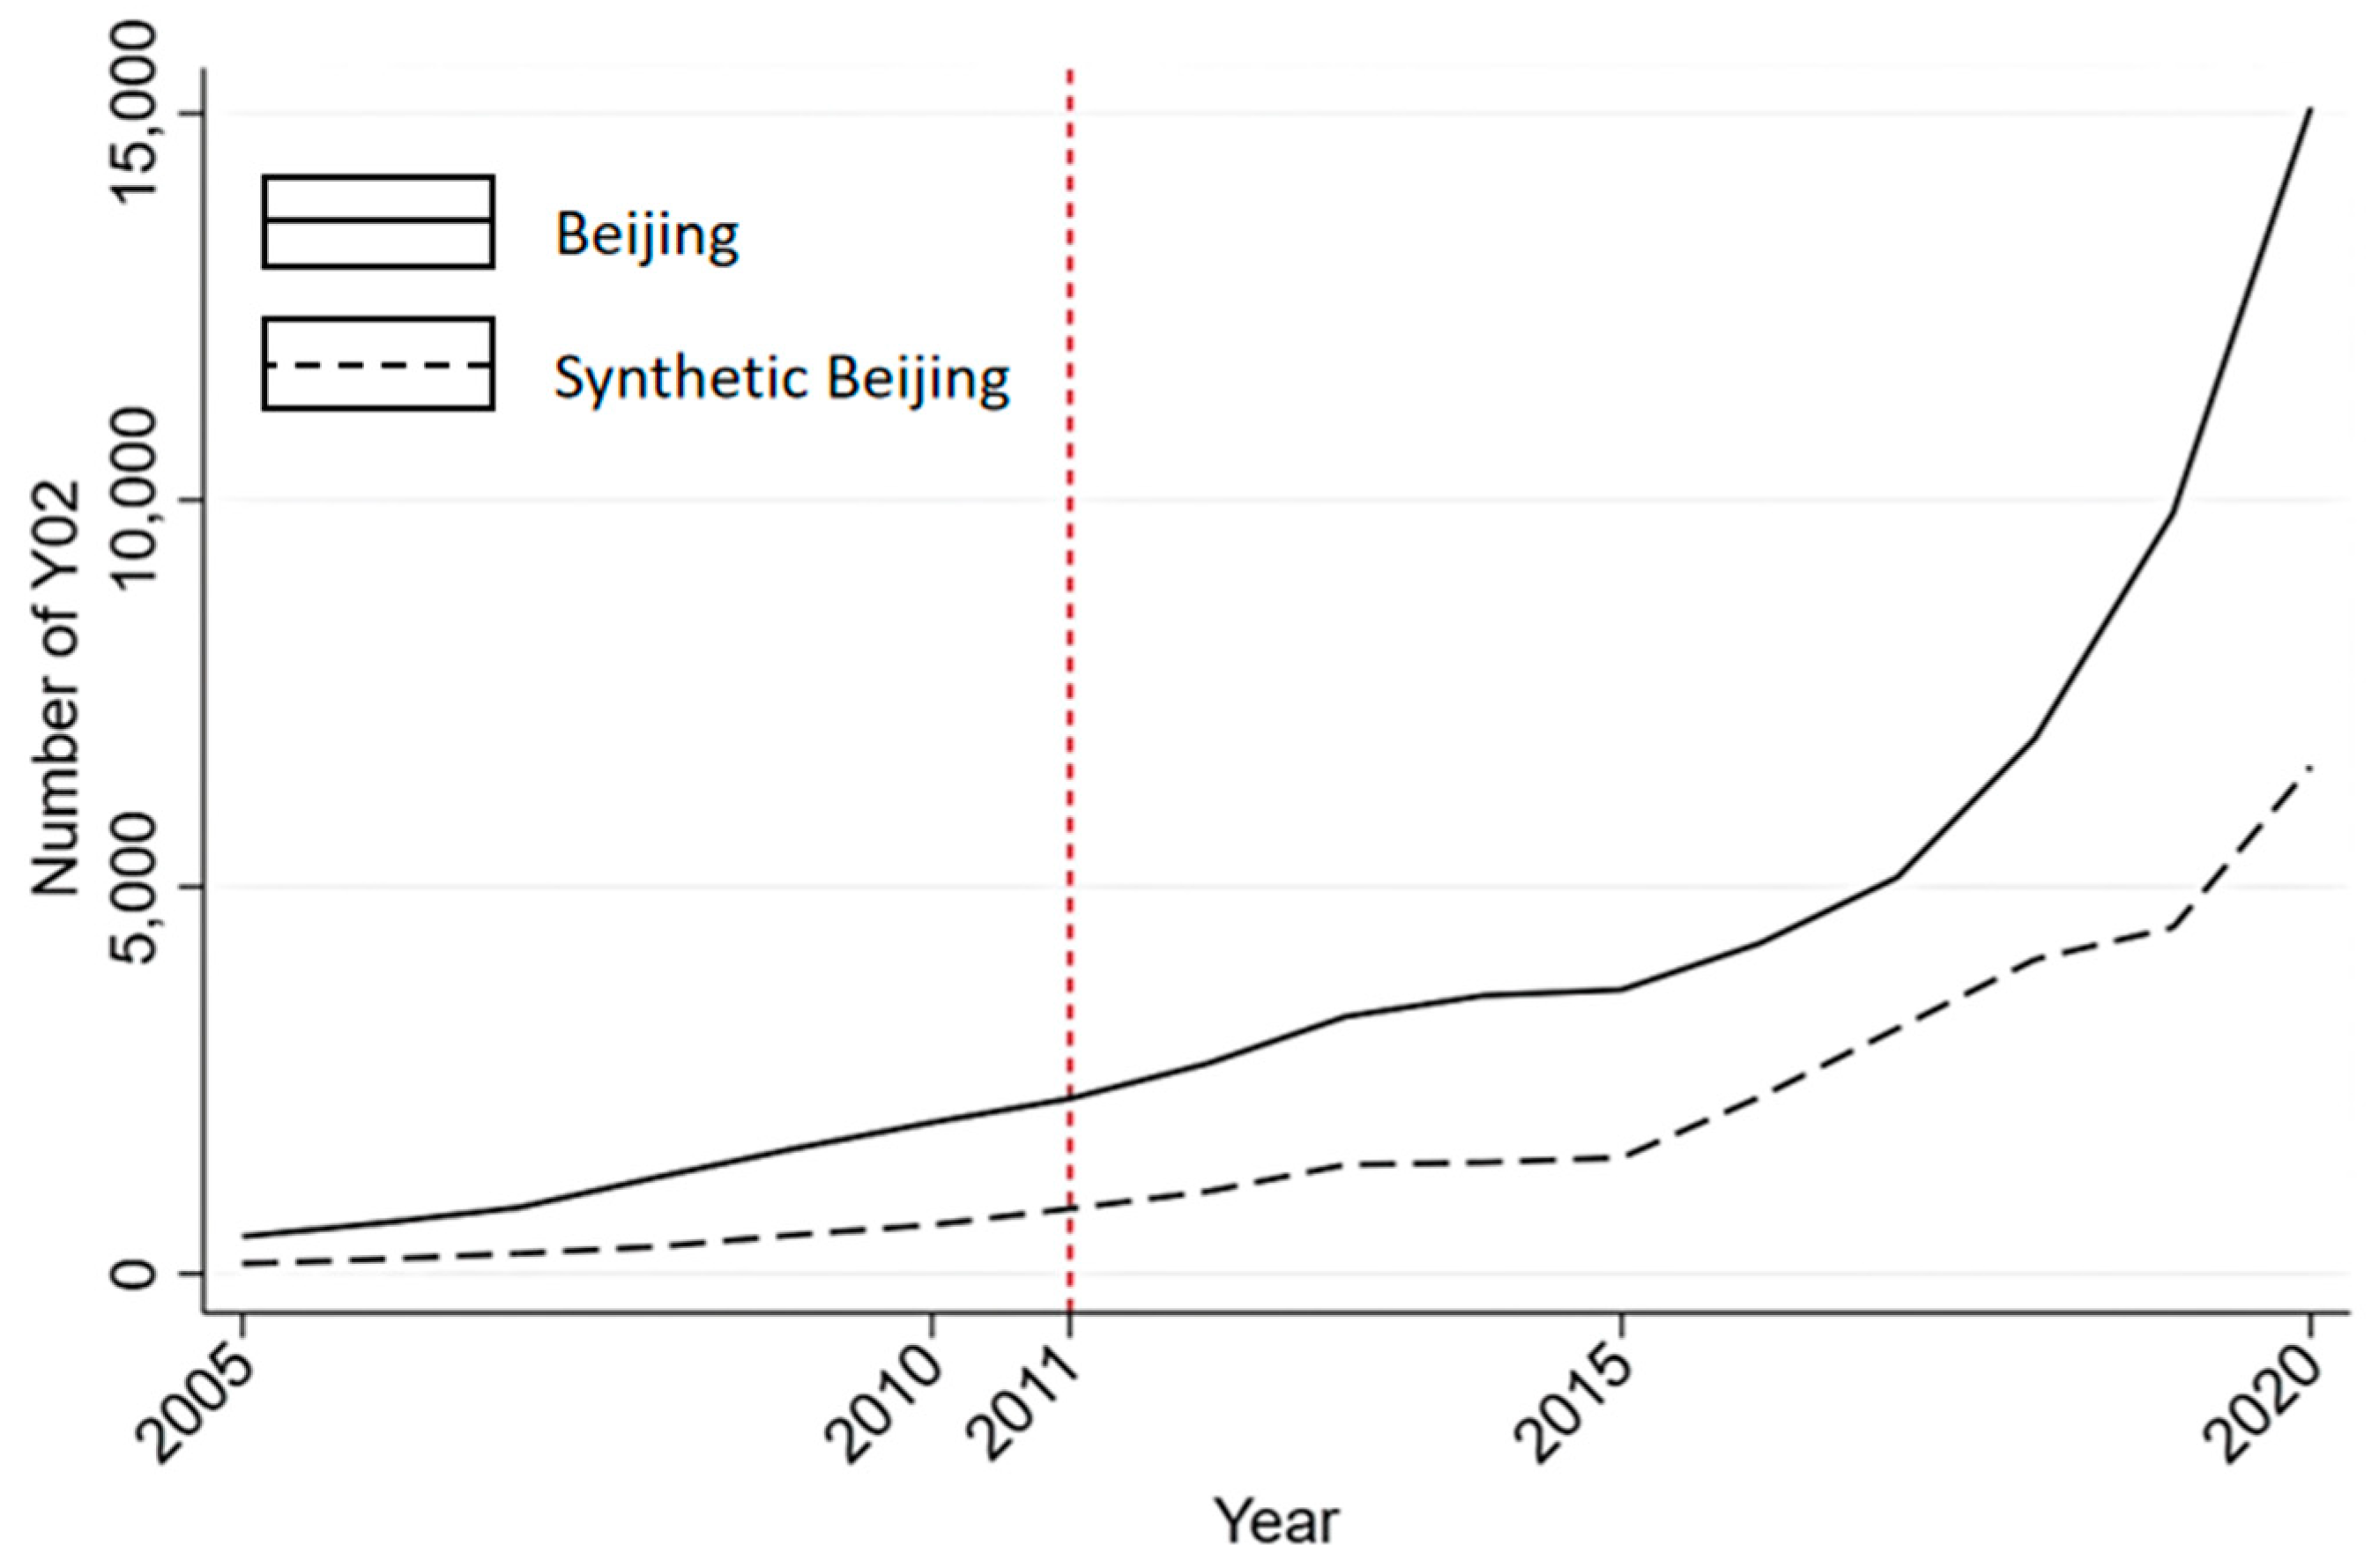
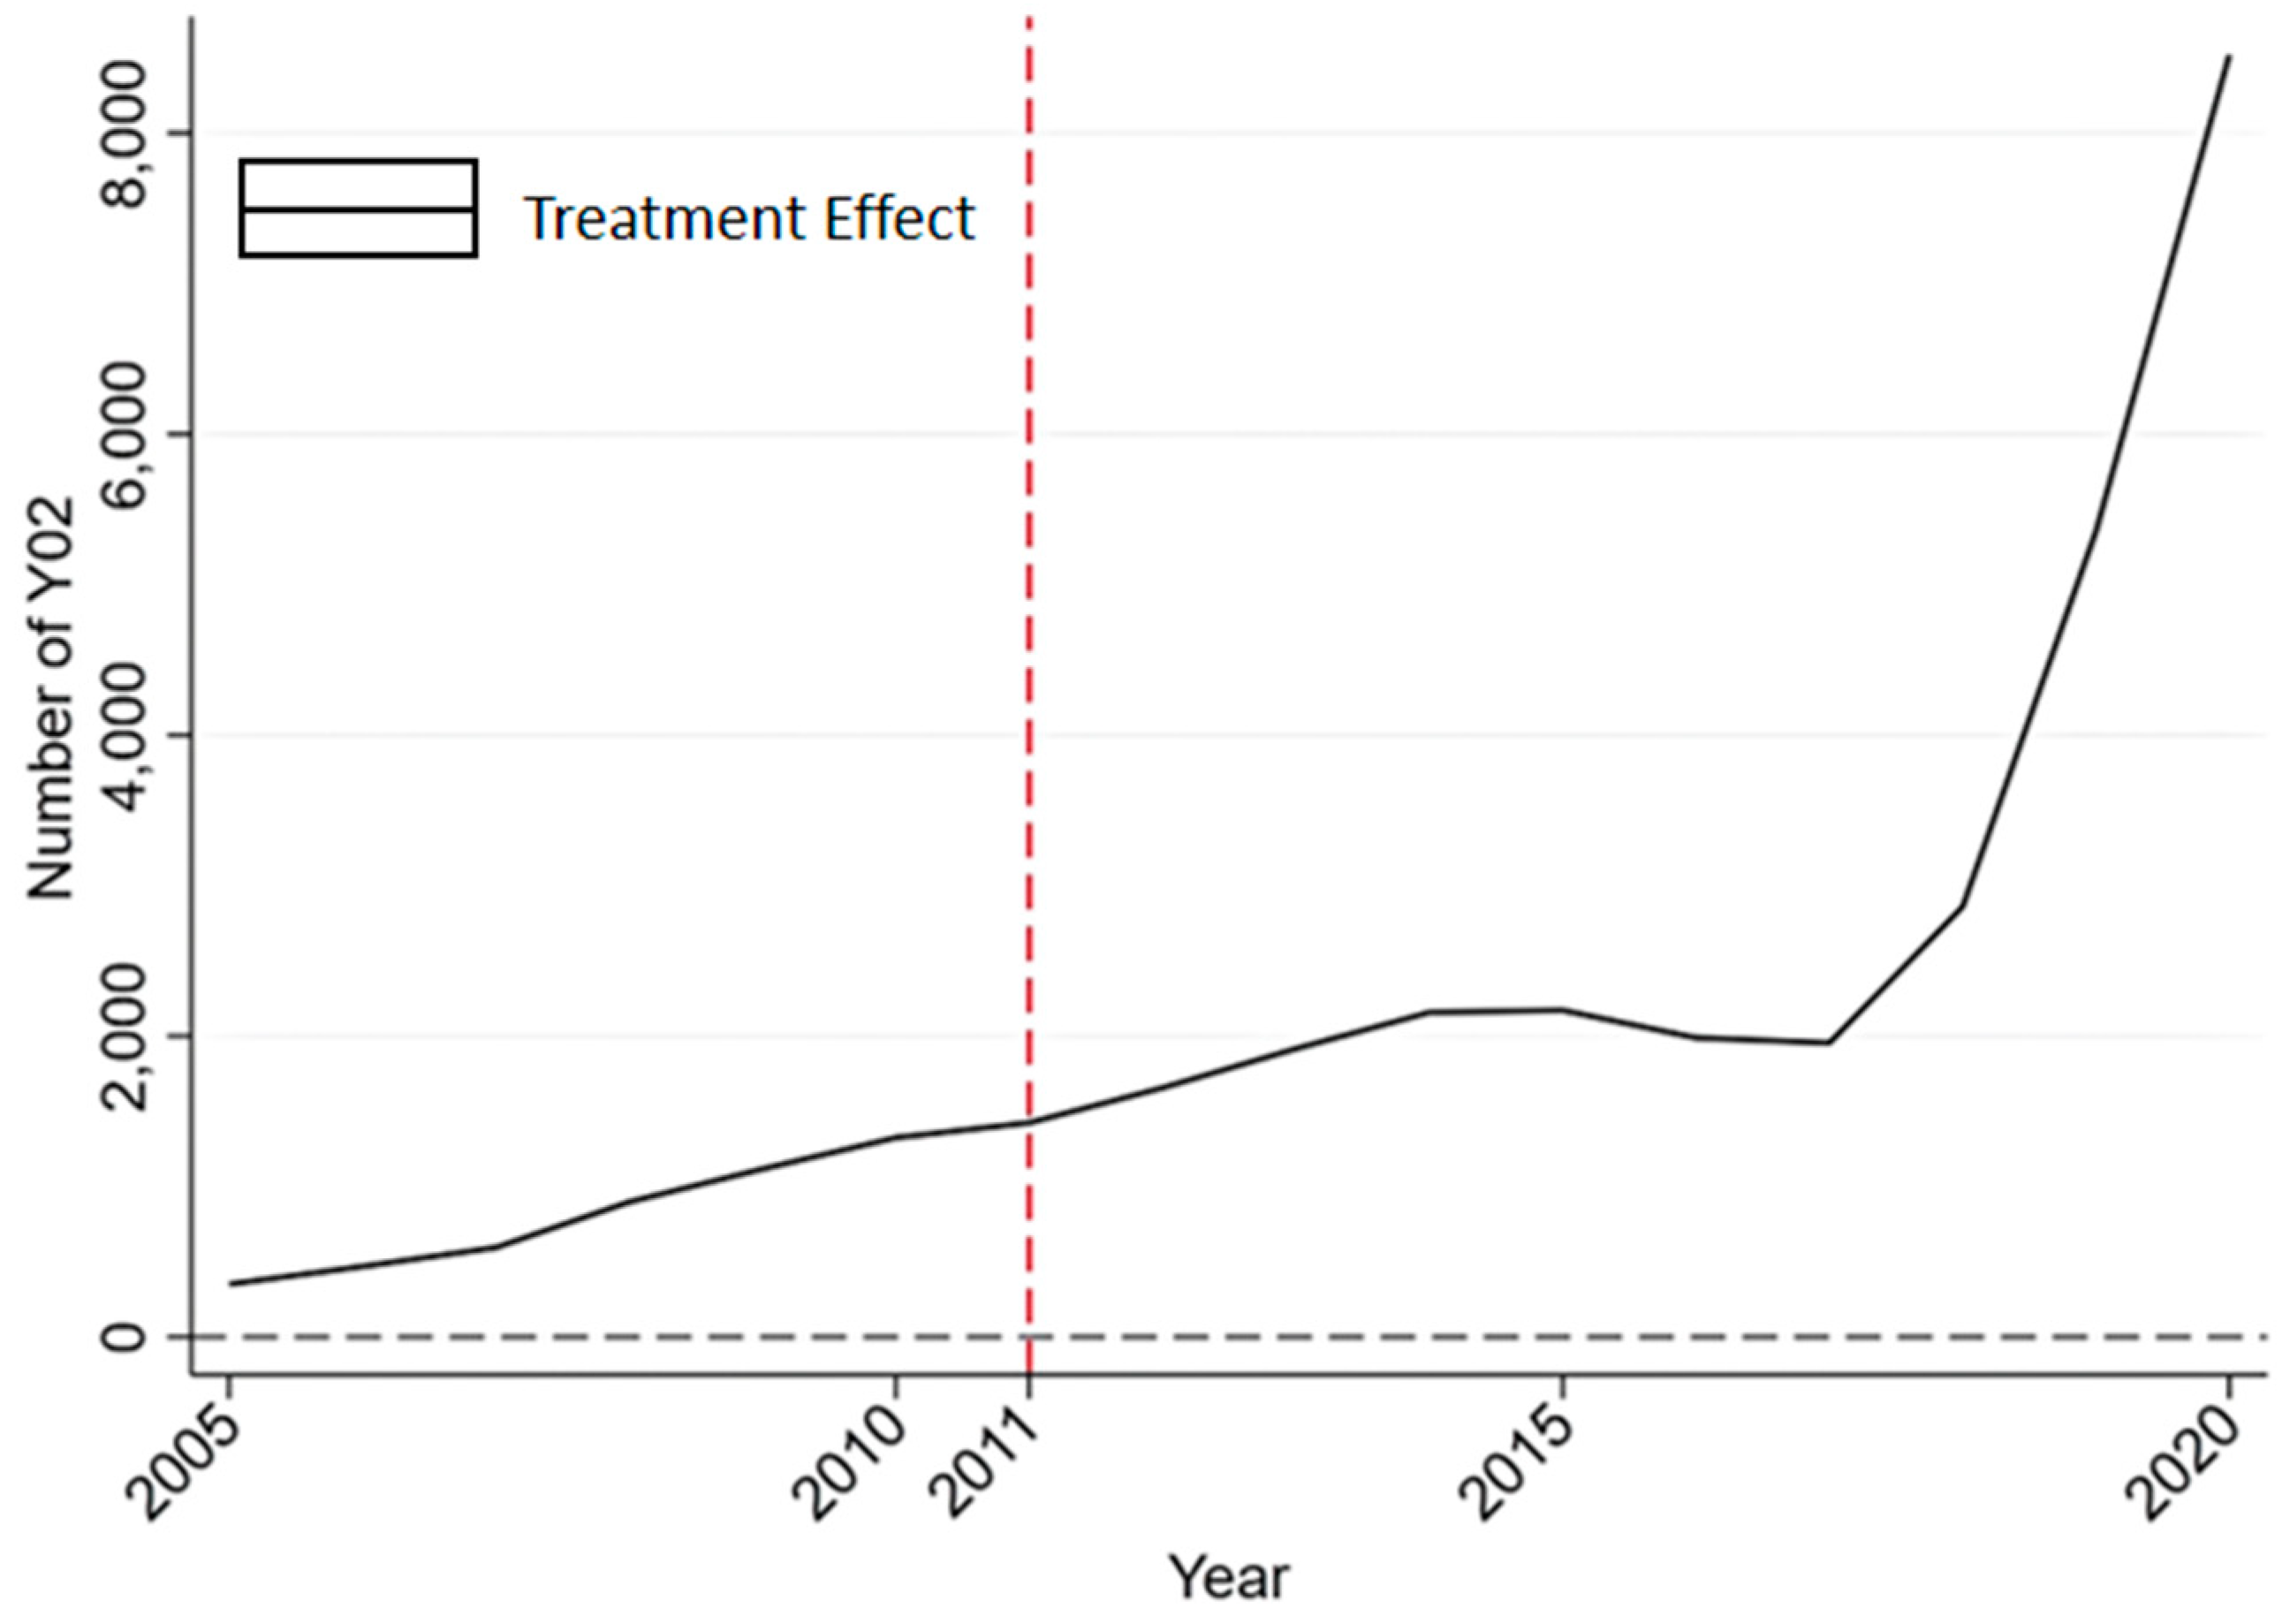
The implementation of the carbon emissions trading pilot policy in Beijing has promoted the level of low-carbon technology innovation in the area. In 2011, as the first carbon trading pilot city in China, Beijing set a leading example in promoting low-carbon technology and advocating environmental protection awareness. The number of low-carbon patents increased year by year; in particular, patents related to climate change adaptation, greenhouse gas capture and traffic pressure relief all ranked among the top in China.
(2)
The impact of the pilot policy has a certain time lag. At the beginning of implementation, which is from 2011 to 2015, the level of low-carbon technology innovation in Beijing improved slowly, which was related to the fact that relevant enterprises needed time to adapt to the new policy. In the initial policy response stage, it takes a period of response time to improve backward production equipment or implement efficient low-carbon technology.
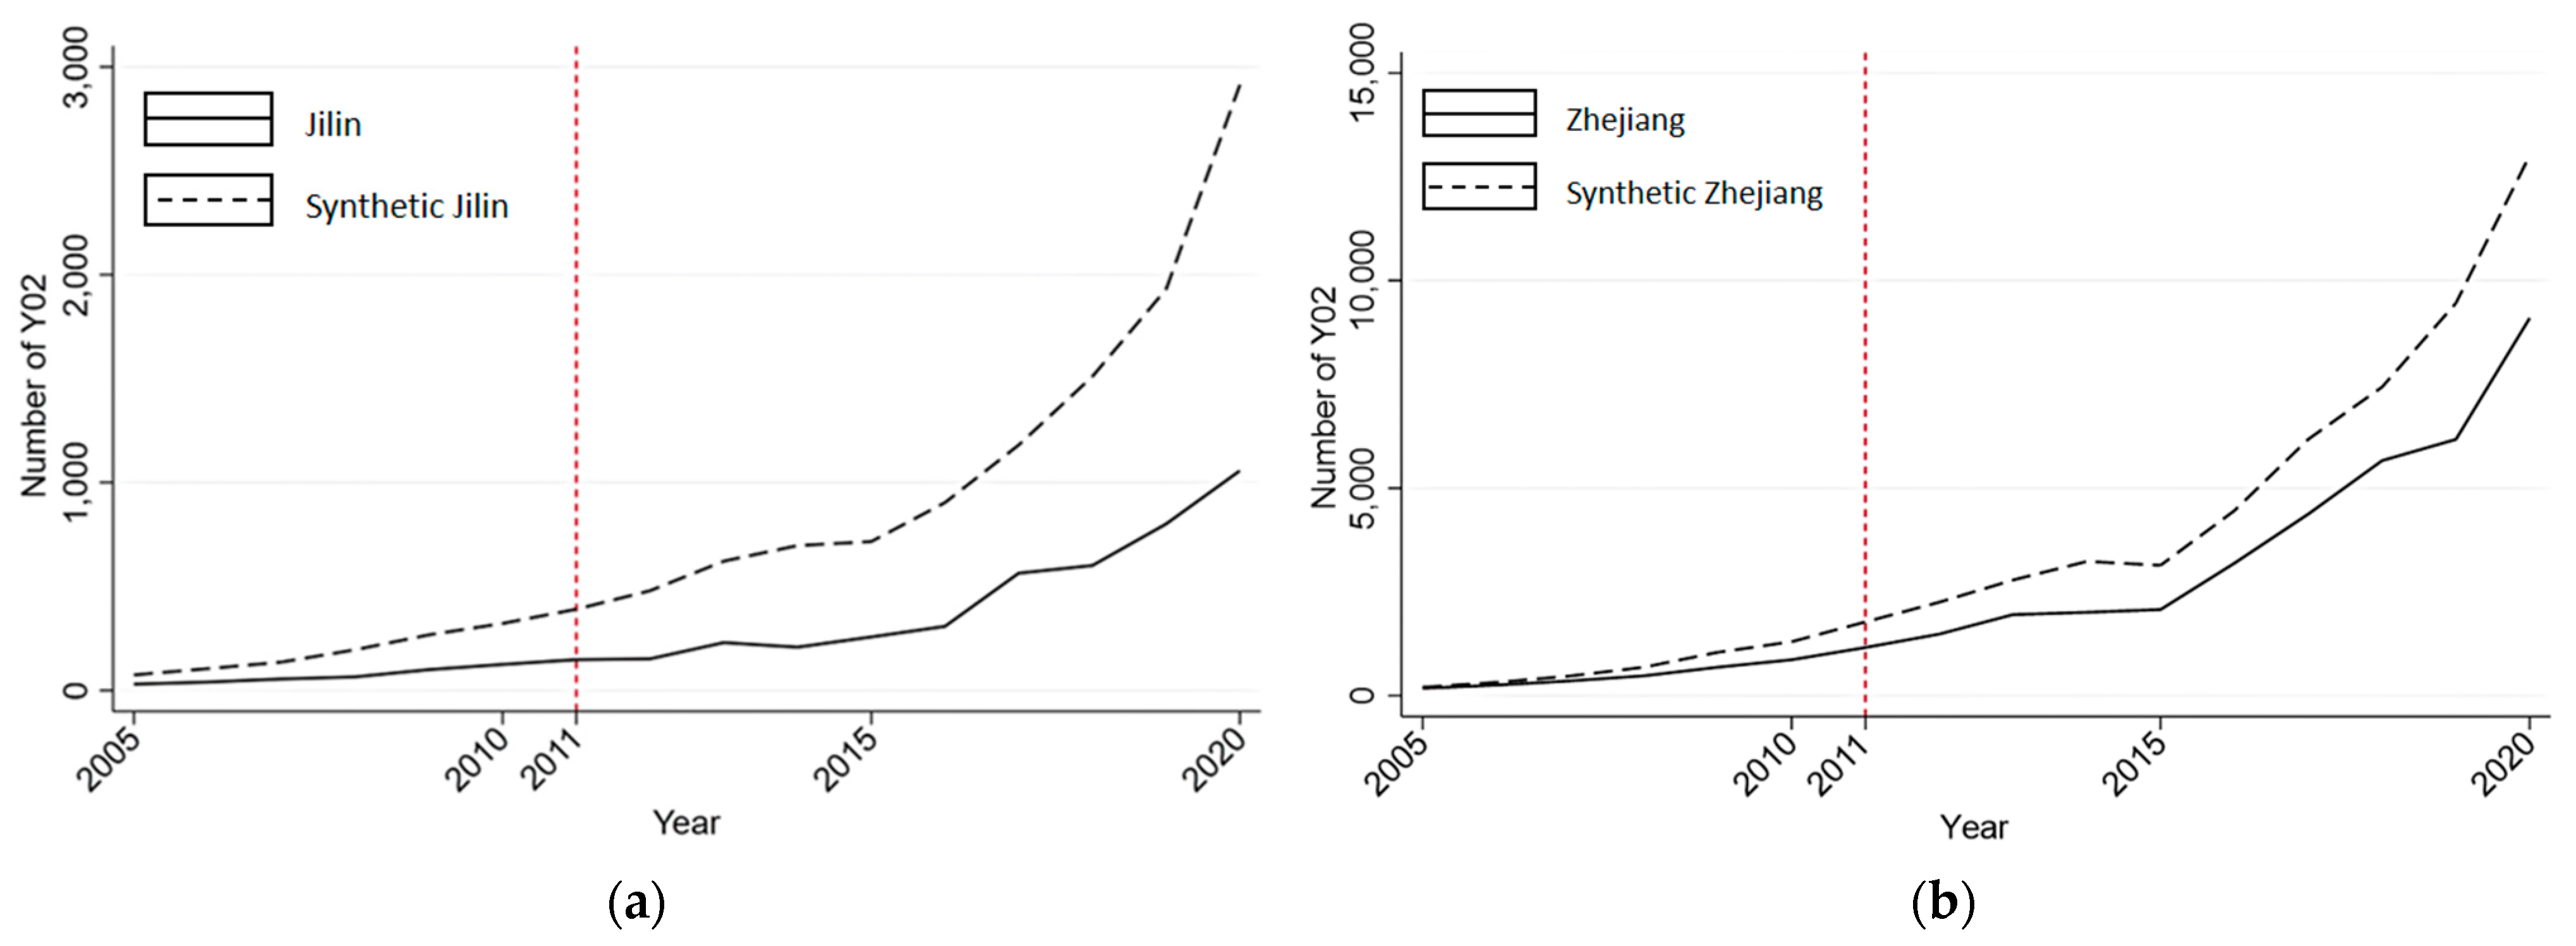
(3)
The effects of the carbon trading pilot policy are vulnerable to the affects from both domestic and foreign carbon markets. By 2015, China had completed the pilot work of opening up seven pilot areas and gradually increased the number of pilot areas such as Fujian and Sichuan Provinces. In addition, during this period, the global financial crisis continued, and the future of the Kyoto Protocol was uncertain. All these factors made low-carbon technology innovation in the early stage of Beijing’s pilot policy relatively sluggish.
Stage 2, which shows an austerity in treatment effect, shares some similarities with the recent literature that advocates the negative influence of carbon trading policies. But the obvious high-rate trend for the treated group in stage 3 indicates that the positive effect will be more stable for a longer execution time.
Furthermore, it can be inferred from the results of this study that, for areas especially with excellent urban construction foundation, the policy effect is more significant. The policy effect is more significant in cities with a high administrative level, large population, low resource dependence, high digitization level and high environmental regulation [33]. In recent years, many scholars have paid attention to the basic regional conditions of China’s development, focusing on the spatial spillover effect of the pilot policy [9,30,38,39,40] and concluded that the eastern region is better than the central and western regions of China in terms of carbon emissions reduction and innovation vitality. As the emphasis of this study is on the relationship between the carbon emissions trading market and low-carbon technology innovation, it does not further classify the differences between different provinces and cities in China. Beijing’s advantage with resources is incomparable to that of other cities in China, so other regions in China should pay more attention to reinforcing the infrastructure construction to promote technological updating, such as training talents and introducing advanced low-carbon technologies.
However, this study also found an obvious gap between China and foreign carbon emissions trading markets; it is possible to obtain an overestimating policy effect due to unobserved factors. In April this year, the average daily trading volume of China was 664,200 tons, while it was 45,297,100 tons in the EU. At present, the carbon price in the EU has reached 100 euros per ton, which is more than 10 times that of China. Therefore, the specific impact of the carbon trading pilot policy on low-carbon technology innovation and emissions reduction needs to be further tested.

6. Conclusions

The level of low-carbon technology innovation is a key factor for promoting the development of the carbon emissions trading market. This study used the Synthetic Control Method to select panel data of 30 provinces and cities in China from 2005 to 2020, and took Beijing as the only treated group to measure the impact of the carbon emissions trading pilot policy.
In the face of China’s special socialist market economy background, the questions of whether the carbon emissions trading policy can play an effective role and what the mechanism is have aroused extensive discussions in academic circles. However, there is no significant difference between the operation mechanism and trading mode of various carbon emissions trading markets, and market entities still weigh the gains and losses between marginal costs and marginal benefits [41]. So, the idea of stimulating the vitality of the carbon market by promoting low-carbon technology innovation is not limited to different countries and areas in the world. The significance of this study lies in providing areas that can devote themselves to developing the carbon emissions trading market with the key thought of indicating the crucial role of technological innovation.
Based on the findings above, wider policy implications for China are suggested as follows:
  • Strengthen the construction of the national carbon emissions trading market and promote the application of low-carbon technology. Cultivate more professional talents and market entities to stimulate innovation vitality; it is also particularly important to issue appropriate policy subsidies to exert the government’s macro-control.
  • Promote coordination and cooperation amongst various regions. Take Beijing and other areas with high levels of low-carbon technology innovation as examples to promote exchanges of experience and industrial coordination. The carbon market is essentially the redistribution of carbon emissions property rights, so regions should negotiate voluntarily and allocate effectively on the basis of clear property rights to improve the liquidity of the carbon emissions trading market [42].
  • Raise carbon prices. Carbon prices reduce greenhouse gas emissions by assigning a monetary cost to carbon emissions [43]; in a market environment of generally low carbon prices in China, the government is supposed to pay more attention to raising carbon prices [44,45].
  • Strengthen the management of policy signals. Improving the response efficiency of the carbon emissions trading market through an open and fair carbon trading platform.
Future studies should focus more on how the internal mechanism of policy impacts differ in various areas of low-carbon technology innovation and how to promote this innovation.

Author Contributions

Writing—original draft, J.Z. (Jiaxin Zhong); Supervision, J.Z. (Jianjun Zhang) and M.F. All authors have read and agreed to the published version of the manuscript.

Funding

This research was funded by the National Key Research and Development Program of China (2021YFE0117900).

Data Availability Statement

The data presented in this study are available on request from the corresponding author or the first author.

Conflicts of Interest

The authors declare no conflicts of interest.

References

  1. Gao, C.; Du, Y.; Zhao, Y.; Jia, Y.; Wu, J. Response of Low Carbon Level to Transportation Efficiency in Megacities: A Case Study of Beijing, China. Land 2024, 13, 1033. [Google Scholar] [CrossRef]
  2. Hong, C.; Burney, J.A.; Pongratz, J.; Nabel, J.E.M.S.; Mueller, N.D.; Jackson, R.B.; Davis, S.J. Global and regional drivers of land-use emissions in 1961–2017. Nature 2021, 589, 554–561. [Google Scholar] [CrossRef]
  3. He, Y.N. Impact and mechanism of carbon trading market on firms’ innovation strategies. China Popul. Resour. Environ. 2022, 32, 37–48. [Google Scholar]
  4. Geng, W.X.; Fan, Y. Does a carbon trading policy contribute to energy intensity reduction?–evidence from the Hubei carbon trading pilot. China Popul. Resour. Environ. 2021, 31, 103–104. [Google Scholar]
  5. Cao, X.; Su, X.E. Has the carbon emissions trading pilot policy promoted carbon neutrality technology innovation? China Popul. Resour. Environ. 2023, 33, 94–104. [Google Scholar]
  6. Wang, W.D.; Wang, D.; Lu, N. Research on the impact mechanism of carbon emissions trading on low-carbon innovation in China. China Popul. Resour. Environ. 2020, 30, 41–48. [Google Scholar]
  7. Yu, X.Y.; Chen, H.Y.; Li, Y. Impact of carbon emission trading mechanism on carbon performance based on synthetic control method. China Popul. Resour. Environ. 2021, 31, 51–61. [Google Scholar]
  8. Tan, J.; Zhang, J.H. Does China’s ETS Force the Upgrade of Industrial Structure—Evidence from Synthetic Control Method. Res. Econ. Manag. 2018, 39, 104–119. [Google Scholar]
  9. Lu, N.; Wang, W.D.; Wang, M.; Zhang, C.J.; Lu, H.L. Breakthrough low-carbon technology innovation and carbon emissions: Direct and spatial spillover effect. China Popul. Resour. Environ. 2019, 29, 30–39. [Google Scholar]
  10. Borghesi, S.; Cainelli, G.; Mazzanti, M. Linking emission trading to environmental innovation: Evidence from the Italian manufacturing industry. Res. Policy 2015, 44, 669–683. [Google Scholar] [CrossRef]
  11. Eskander, S.M.S.U.; Fankhauser, S. The Impact of Climate Legislation on Trade-Related Carbon Emissions 1996–2018. Environ. Resour. Econ. 2023, 85, 167–194. [Google Scholar] [CrossRef]
  12. Haites, E.; Bertoldi, P.; Koenig, M.; Bataille, C.; Creutzig, F.; Dasgupta, D.; Can, S.d.l.R.d.; Khennas, S.; Kim, Y.-G.; Nilsson, L.J.; et al. Contrib. Carbon Pricing Meet. A Mid-Century Net Zero Target. Clim. Policy 2024, 24, 1–12. [Google Scholar] [CrossRef]
  13. Beccarello, M.; Di Foggia, G. Carbon Emissions 1996–2018 Emissions trading system: Bridging the gap between environmental targets and fair competition. Environ. Res. Commun. 2023, 5, e085009. [Google Scholar]
  14. Anderson, H.M.; Gao, J.T.; Turnip, G.; Vahid, F.; Wei, W. Estimating the Effect of an EU-ETS Type Scheme in Australia Using a Synthetic Treatment Approach. Energy Econ. 2023, 125, 106789. [Google Scholar] [CrossRef]
  15. Zhang, X.F. Carbon Market Liquidity and Regional Low-carbon Economic Transition: An Analysis of Dual Mediation Effect Based on Low-carbon Technology Innovation. J. Nanjing Univ. Financ. Econ. 2021, 6, 88–98. [Google Scholar]
  16. Fang, J.C.; Zeng, L.; Zhang, X.L. Can Carbon Emission Trading promote the Low-carbon Transformation of the Regional Energy Structure? Lanzhou Acad. J. 2024, 6, 52–64. [Google Scholar]
  17. Yu, P.; Liu, J.X. Research the Effects of Carbon Trading Market Size on Environment and Economic Growth. China Soft Sci. 2020, 4, 46–55. [Google Scholar]
  18. Chai, S.L.; Sun, R.X.; Zhang, K.; Ding, Y.T.; Wei, W. Is Emissions Trading Scheme (ETS) an Effective Market-Incentivized Environmental Regulation Policy? Evidence from China’s Eight ETS Pilots. Int. J. Environ. Res. Public Health 2022, 19, 3177. [Google Scholar] [CrossRef]
  19. Jia, Y.B. Does carbon emissions trading affect economic growth? Macroeconomics 2017, 12, 72–81. [Google Scholar]
  20. Wang, B.; Xu, P.Y. Carbon Pricing, Dual Financial Friction and Dual Pillar Regulation. J. Financ. Res. 2021, 12, 57–74. [Google Scholar]
  21. Huang, Y.; Liu, L.; Ma, X.; Pan, X. Abatement technology investment and emissions trading system: A case of coal-fired power industry of Shenzhen, China. Clean Technol. Environ. Policy 2015, 17, 811–817. [Google Scholar] [CrossRef]
  22. Yang, J.Q.; Qi, J.Y. Economic consequences and mechanism of China’s carbon trading policy-a literature review. J. Intell. Soc. 2023, 2, 63–92. [Google Scholar]
  23. Li, H.; Zhao, Y.H.; Wang, S.; Lin, J.; Cao, Y.; Shi, Q.; Liu, Y.; Xiao, Y.; Li, J. Scenario Analysis of ETS Revenue Allocation Mechanism of China: Based on A Dynamic CGE Model. Environ. Sci. Pollut. Res. 2019, 26, 27971–27986. [Google Scholar] [CrossRef]
  24. Porter, M.E.; van der Linde, C. Toward a New Conception of the Environment-Competitiveness Relationship. J. Econ. Perspect. 1995, 9, 97–118. [Google Scholar] [CrossRef]
  25. Hu, H.R.; Song, Y.Q. Market-motivated Environmental Regulation and Enterprise Risk-taking: A Case Study of Carbon Emissions Trading Pilot Policy. Mod. Econ. Sci. 2024, 46, 1–16. [Google Scholar]
  26. Wang, G.Y.; Wang, D. Porter Hypothesis, Environmental Regulation and Enterprises’ Technological Innovation--The Comparative Analysis between Central China and Eastern China. China Soft Sci. 2011, 1, 100–112. [Google Scholar]
  27. Yuan, Y.J.; Xie, R.H. Environmental Regulation and the‘Green’ Productivity Growth of China’s Industry. China Soft Sci. 2016, 7, 144–154. [Google Scholar]
  28. Lu, J.; Wang, X.F. The impact of low-carbon pilot policies on technological innovation in Chinese cities. J. China Univ. Geosci. Soc. Sci. Ed. 2019, 19, 128–141. [Google Scholar]
  29. Liu, Y.H.; Li, Y.H.; Wang, W.T. Challenges, opportunities and actions for China to achieve the targets of carbon peak and carbon neutrality. China Popul. Resour. Environ. 2021, 31, 1–5. [Google Scholar]
  30. Wang, W.D.; Lu, N.; Zhang, C.J. Low-carbon technology innovation responding to climate change based on perspective of spatial spillover effect. China Popul. Resour. Environ. 2018, 28, 22–30. [Google Scholar]
  31. Ma, Z.L.; Jin, Z.C. Research on the impact of carbon emission trading policies on green technology innovation. J. Jiangsu Ocean Univ. Humanit. Soc. Sci. Ed. 2024, 22, 110–122. [Google Scholar]
  32. Wu, Q.; Tambunlertchai, K.; Pomchaiwiseskul, P. Examining the Impact and Influencing Channels of Carbon Emission Trading Pilot Markets in China. Sustainability 2021, 13, 5664. [Google Scholar] [CrossRef]
  33. Qian, L.; Wang, M.X.; Xiao, R.Q. The Impact and Spillover Effects of Low-Carbon Pilot Policies on Urban Carbon Neutrality Technological Innovation. Sci. Technol. Prog. Policy 2024, 41, 1–12. [Google Scholar]
  34. Abadie, A.; Gardeazabal, J. The economic costs of conflict: A case study of the Basque country. Am. Econ. Rev. 2003, 93, 113–132. [Google Scholar] [CrossRef]
  35. Wu, Y.B. Measurement on R&D Output Elasticity of China’s Industrial Sector. China Econ. Q. 2008, 3, 869–890. [Google Scholar]
  36. Shang, H.P.; Liu, J.T. Research on state-level new areas driving “curving overtaking” in underdeveloped areas. Stud. Sci. Sci. 2022, 40, 2194–2204. [Google Scholar]
  37. Shang, H.P.; Liu, J.T. Do Policy Innovations in Underdeveloped Regions Promote “Curve Overtaking”?—A SCM Test for Big Data Development Policy Innovation in Guiyang. J. Public Manag. 2021, 18, 34–45. [Google Scholar]
  38. Lin, B.; Guan, C. Evaluation and determinants of total unified efficiency of China’s manufacturing sector under the carbon neutrality target. Energy Econ. 2023, 119, 106539. [Google Scholar] [CrossRef]
  39. Gao, D.; Feng, H.; Cao, Y.J. The spatial spillover of innovation city policy on carbon efficiency: Evidence from China. Singap. Econ. Rev. 2024. [Google Scholar] [CrossRef]
  40. Xiao, Q.; Zhao, Y.C.; Pu, J.W. The impact of dual pilot policy on carbon emission efficiency—Quasi-natural experiments based on low-carbon pilot cities and carbon trading pilot cities. Soc. Sci. Rev. 2024, 39, 45–53. [Google Scholar]
  41. Ha, M.F.; Huang, Y.H. Research on the Effects and Mechanisms of Market-Based Environmental Regulation on Carbon Emission Intensity: Empirical Evidence Based on Carbon Trading Pilot Policies. Ecol. Econ. 2024, 40, 1–15. [Google Scholar]
  42. Ghazouani, T.; Maktouf, S. Impact of natural resources, trade openness, and economic growth on CO2 emissions in oil-exporting countries: A panel autoregressive distributed lag analysis. Nat. Resour. Forum 2024, 48, 211–231. [Google Scholar] [CrossRef]
  43. Wang, M.R.; Kuusi, T. Trade flows, carbon leakage, and the EU Emissions Trading System. Energy Econ. 2024, 134, 107556. [Google Scholar] [CrossRef]
  44. An, Y.F.; Zhou, D.Q.; Yu, J.; Shi, X.P.; Wang, Q.W. Carbon emission reduction characteristics for China’s manufacturing firms: Implications for formulating carbon policies. J. Environ. Manag. 2021, 284, 112055. [Google Scholar] [CrossRef]
  45. Fontagne, L.; Schubert, K. The Economics of Border Carbon Adjustment: Rationale and Impacts of Compensating for Carbon at the Border. Annu. Rev. Econ. 2023, 15, 389–424. [Google Scholar] [CrossRef]
Figure 1. Deviation of the economic theory for the relationship between the carbon emissions trading market and low-carbon technology innovation.
Land 13 01276 g001
Figure 2. Number of low-carbon patents in Beijing and corresponding synthetic units from 2005 to 2020.
Land 13 01276 g002
Figure 3. Policy effect for Beijing and corresponding synthetic units from 2005 to 2020.
Land 13 01276 g003
Figure 4. (a) Number of patents in Jilin Province and corresponding synthetic units from 2005 to 2020; (b) Number of patents in Zhejiang Province and corresponding synthetic units from 2005 to 2020.
Land 13 01276 g004
Figure 5. Permutation test of Beijing.
Land 13 01276 g005
Figure 6. Benefit of carbon emissions trading pilot policy on low-carbon technological innovation.
Land 13 01276 g006
Table 1. Descriptive statistics of variables.
VariableObs.MeanStd. Dev.Min.Max.
Y02400841.5331670.3111.00015,078.000
GDP4008.4100.9066.2139.944
Str4001.1920.7040.5275.244
FDI4004.331.6110.5157.124
R&D4002.5690.8580.6314.381
Gov4005.1210.6003.5225.980
Table 2. Fit and contrast of predictor variables.
VariablesBeijingDifference Value/%
RealSynthetic
GDP8.9649.0780.114
Str3.3140.9202.394
FDI5.7555.7650.01
RD4.3363.4960.84
Gov5.2075.4350.228
Table 3. Weights of Jilin and Zhejiang Provinces.
UnitsJilinZhejiang
Weight0.3160.684
Disclaimer/Publisher’s Note: The statements, opinions and data contained in all publications are solely those of the individual author(s) and contributor(s) and not of MDPI and/or the editor(s). MDPI and/or the editor(s) disclaim responsibility for any injury to people or property resulting from any ideas, methods, instructions or products referred to in the content.

