Article

Assessing Historical LULC Changes’ Effect on Ecosystem Services Provisioning and Their Values in a Mediterranean Coastal Lagoon Complex

by
Anastasia Mirli
1,*,
Dionissis Latinopoulos
1,
Georgia Galidaki
1,
Konstantinos Bakeas
2 and
Ifigenia Kagalou
1,*
1
Department of Civil Engineering, Democritus University of Thrace, 67100 Xanthi, Greece
2
Independent Researcher, 2 7th Merarchias Street, 64200 Chrisoupoli, Greece
*
Authors to whom correspondence should be addressed.
Land 2024, 13(8), 1277; https://doi.org/10.3390/land13081277
Submission received: 5 July 2024 / Revised: 31 July 2024 / Accepted: 10 August 2024 / Published: 13 August 2024

Abstract

:
Urbanization and land claim trends for agriculture have led to land use/land cover (LULC) changes, acting as driving forces for several natural environment alterations. The ecosystem services (ES) concept links ecosystem degradation with direct adverse effects on human welfare, emphasizing the importance of balancing human activities and ecosystem health. LULC changes and their impacts on ES are crucial for nature conservation and decision-making. To support sustainable management, a historical (75-year) assessment of Nestos Delta lagoons was conducted, using aerial photos and satellite images, providing valuable insights into the drivers and trends of these changes. Until 1960, water-related Biomes were affected the most, in favor of agricultural (Nestos River incubation) and urban ones, but anthropogenic activities development rate reduced after land reclamation. Since their inclusion in the Natura 2000 network and designation as a National Park, they have been protected from rapid development. Over the past two decades, they have increased the economic value of their cultural ES, while deteriorating regulating and having a minimal impact on provisioning services, resulting in a cumulative loss exceeding USD 30 million during the study period. This study strongly indicates the vital importance of legislative protection and the integration of the ES approach in priority habitat management.

1. Introduction

Ecosystem services (ES) are defined as the benefits that societies receive from ecosystems [1]. These benefits can be categorized as provisioning (e.g., food, raw material, energy), regulating (e.g., water purification, climate regulation, nutrient cycling) and cultural (e.g., recreation, education, spiritual) [2]. The ES concept implies that ecosystem degradation directly impacts human welfare [2], emphasizing the importance of maintaining a balance between human activities and ecosystem health [3]. As the concept of ES has evolved, it has become apparent that, if properly incorporated in EU and national policies, it can be a valuable tool for strategic planning and decision-making, given that a wide range of systems combine natural and urban environments [4,5]. However, some EU countries cannot embrace the ES concept and treat water systems as water resources, despite fully adopting the EU legislative Water Framework [6].
Since 1997, Costanza et al. [7] have recognized the importance of the monetary valuation of ES in order to ensure that system needs are prioritized. However, for decades, the valuation of ES has been targeted mainly at provisioning ES, excluding those that do not provide non-market benefits [8]. Several studies highlight that it is fundamental during the decision-making process for ES to be assessed financially or using environmental indexes, so that the outcomes of the alternatives can be evaluated [8,9]. Since the first attempt to financially quantify ES [7], a number of methods have been developed targeting different aspects of the studied systems. de Groot et al. [10] demonstrated the financial benefits of ES by highlighting the greater expenses required to replace them if they are lost. On the other hand, Pearce [11] focused on the contingent valuation method, which involves asking individuals how much they would be willing to pay to preserve a particular ES. Considering the methods developed by several scientists, Costanza et al. [12] highlighted the importance of a monetary valuation that can be used on an international scale and suggested the adoption of specific coefficients for ES.
Urbanization and production practices’ intensification due to population growth have led to changes in lifestyle and human needs, causing several land use/land cover (LULC) changes, acting as a critical driving force in the natural environment and altering the ES provided [13,14]. The Mediterranean basin has faced a significant increase over the last 50 years, primarily due to urbanization and agriculture, reflecting the population increase. The Mediterranean Sea is an almost completely enclosed ecosystem of significant importance subject to several anthropogenic pressures, such as urbanization and agriculture [15,16]. Pollution caused by these pressures often leads to a deterioration of the coast and coastal wetlands [16,17]. Water quality will continue to decline, as long as anthropogenic activities and interventions continue without clear and applicable management plans [18,19].
Moreover, climate change is an important pressure on the function of the Mediterranean basin and is expected to become a major driver in the future [16,17]. Thus, Mediterranean water bodies’ management plans must include specific measures to mitigate its effects [20]. Coastal wetlands are the final recipients of the aforementioned pressures and face the highest probability of suffering adverse consequences from hydrological disruption and water quality deterioration, up to their total loss, as a result [21,22]. An important aspect to note is that the Aegean Sea and its coastal zone have been identified as highly burdened areas requiring priority attention regarding management and protection [17,23].
Lagoons are marine transitional water systems that undergo a great deal of dynamic change and are considered among the most productive ecosystems in the world. Because of their role as primary shelters, nursery grounds and habitats for many species, coastal lagoons are considered ecosystems of high biodiversity importance [10]. The Mediterranean lagoons are of particular significance, as other than high productivity and biodiversity, they are also sites where several biogeochemical processes occur (e.g., water regulation, matter cycle regulation, etc.) [15,24]. The high value of these unique systems makes them historical points of reference and development for human communities. Due to their inherent functional traits and distinctive geomorphology [21,25], these systems are frequently the “victims” of nearby development activities [15], leading to LULC changes, as well as the degradation of their ecological characteristics and ES [26]. The direct relationship between LULC and ES has been documented in various systems, including aquatic [27,28] and terrestrial environments [29]. These studies primarily emphasize the effects of LULC changes on supporting and cultural ES. The findings reveal that even minor LULC changes can significantly alter ES [30]. Consequently, given the rapid global increase in LULC changes [31], mapping LULC is a crucial initial step to quantify their spatial and temporal variations precisely [32].
The LULC maps at both local and national scales are crucial for the valuation of ES and the subsequent development of a management plan [33]. The most common approach to quantifying and mapping LULC is remote sensing imagery. Satellite and aerial data have been extensively used for LULC identification, classification and change detection [34,35]. A number of LULC studies conducted locally have chosen to use satellite images (e.g., Landsat) and GIS-based models [36,37,38]. Using satellite images to identify land uses has several drawbacks, particularly when examining historical changes. A common drawback is the coarser spatial resolution of historical satellite data, which results in mixed pixels representing a mixture of LULC and complicates the classification algorithms. Another drawback is the limited number of spectral bands of older satellite imaging instruments, which can hinder the ability to map land uses. In order to create a complete dataset of LULC changes, historical aerial photographs can be used after digitalization, covering a historical period from the early 1940s [39]. Due to their locality, these photos provide the most available and complete landscape record [39]. Aerial and satellite data are typically integrated within a GIS, which facilitates spatial data analysis and allows the quantification of LULC changes over time. Image analysis relies crucially on classification [40] and machine learning algorithms [41,42] to produce LULC maps.
Photo-interpretation of aerial or satellite imagery provides an efficient method to classify complex and heterogeneous landscapes [43] based on the analyst’s experiential, procedural and domain knowledge [44]. Therefore, it offers significant benefits for estimating ES by providing the detailed spatial and temporal information essential for understanding landscape dynamics and their impact on ES. Through the analysis of historical aerial photographs or satellite imagery, photo-interpretation facilitates the mapping of LULC changes over variable time steps, allowing the quantification of ecosystem changes associated with ES provisioning. This historical perspective helps identify key drivers, such as urbanization, deforestation and agricultural expansion, directly influencing ES provisioning [45,46,47]. The photo-interpretation of historical aerial photographs has long been considered an essential method for examining natural ecosystem dynamics [48,49]. Difficulties in determining precise conclusions from aerial photographs [50,51], particularly in areas with complicated topography [52], have been documented. It has been described that different identification methods can be used for different environments [53].
The Nestos Delta (ND) lagoons are part of the Nestos River Basin located in the Eastern Macedonia–Thrace region, which is characterized as a remote, rural region and one of the EU’s poorest regions [54]. Various economic activities are being developed in the ND lagoons area, with primary production (agriculture, fisheries) being the most important income source for locals, followed by advancing summer tourism, which poses an extra threat due to its intensity and seasonality (summer). Numerous studies have examined the ND lagoons’ flora, fauna, biodiversity and chemical status [55,56,57,58], highlighting the area’s ecological significance. Despite this, a knowledge gap exists regarding the lagoons’ hydrology and its link to ecology. Furthermore, it should be noted that there is a lack of knowledge about the interaction between ES and the historical changes that have occurred in the area, as well as the valuation of its ES. Based on the above, the objective was to evaluate the long-term impacts of human activities on landscape changes and their consequent effects on ES, particularly those influencing their economic value. The novelty of this research lies in the historical, political and social dimensions that are being integrated into this first long-term analysis of LULC coupled with ES to close the existing knowledge gap. For this reason, broadly tested and robust methodologies are applied to create solid results that support decision-making. A number of sub-objectives were established to achieve this goal: (1) process historical aerial and satellite images, (2) assess the area’s value, (3) record changes in Ecosystem Services Values (ESV) over time, and (4) recommend land uses for future land planning to achieve environmental conservation on ND lagoons.

2. Materials and Methods

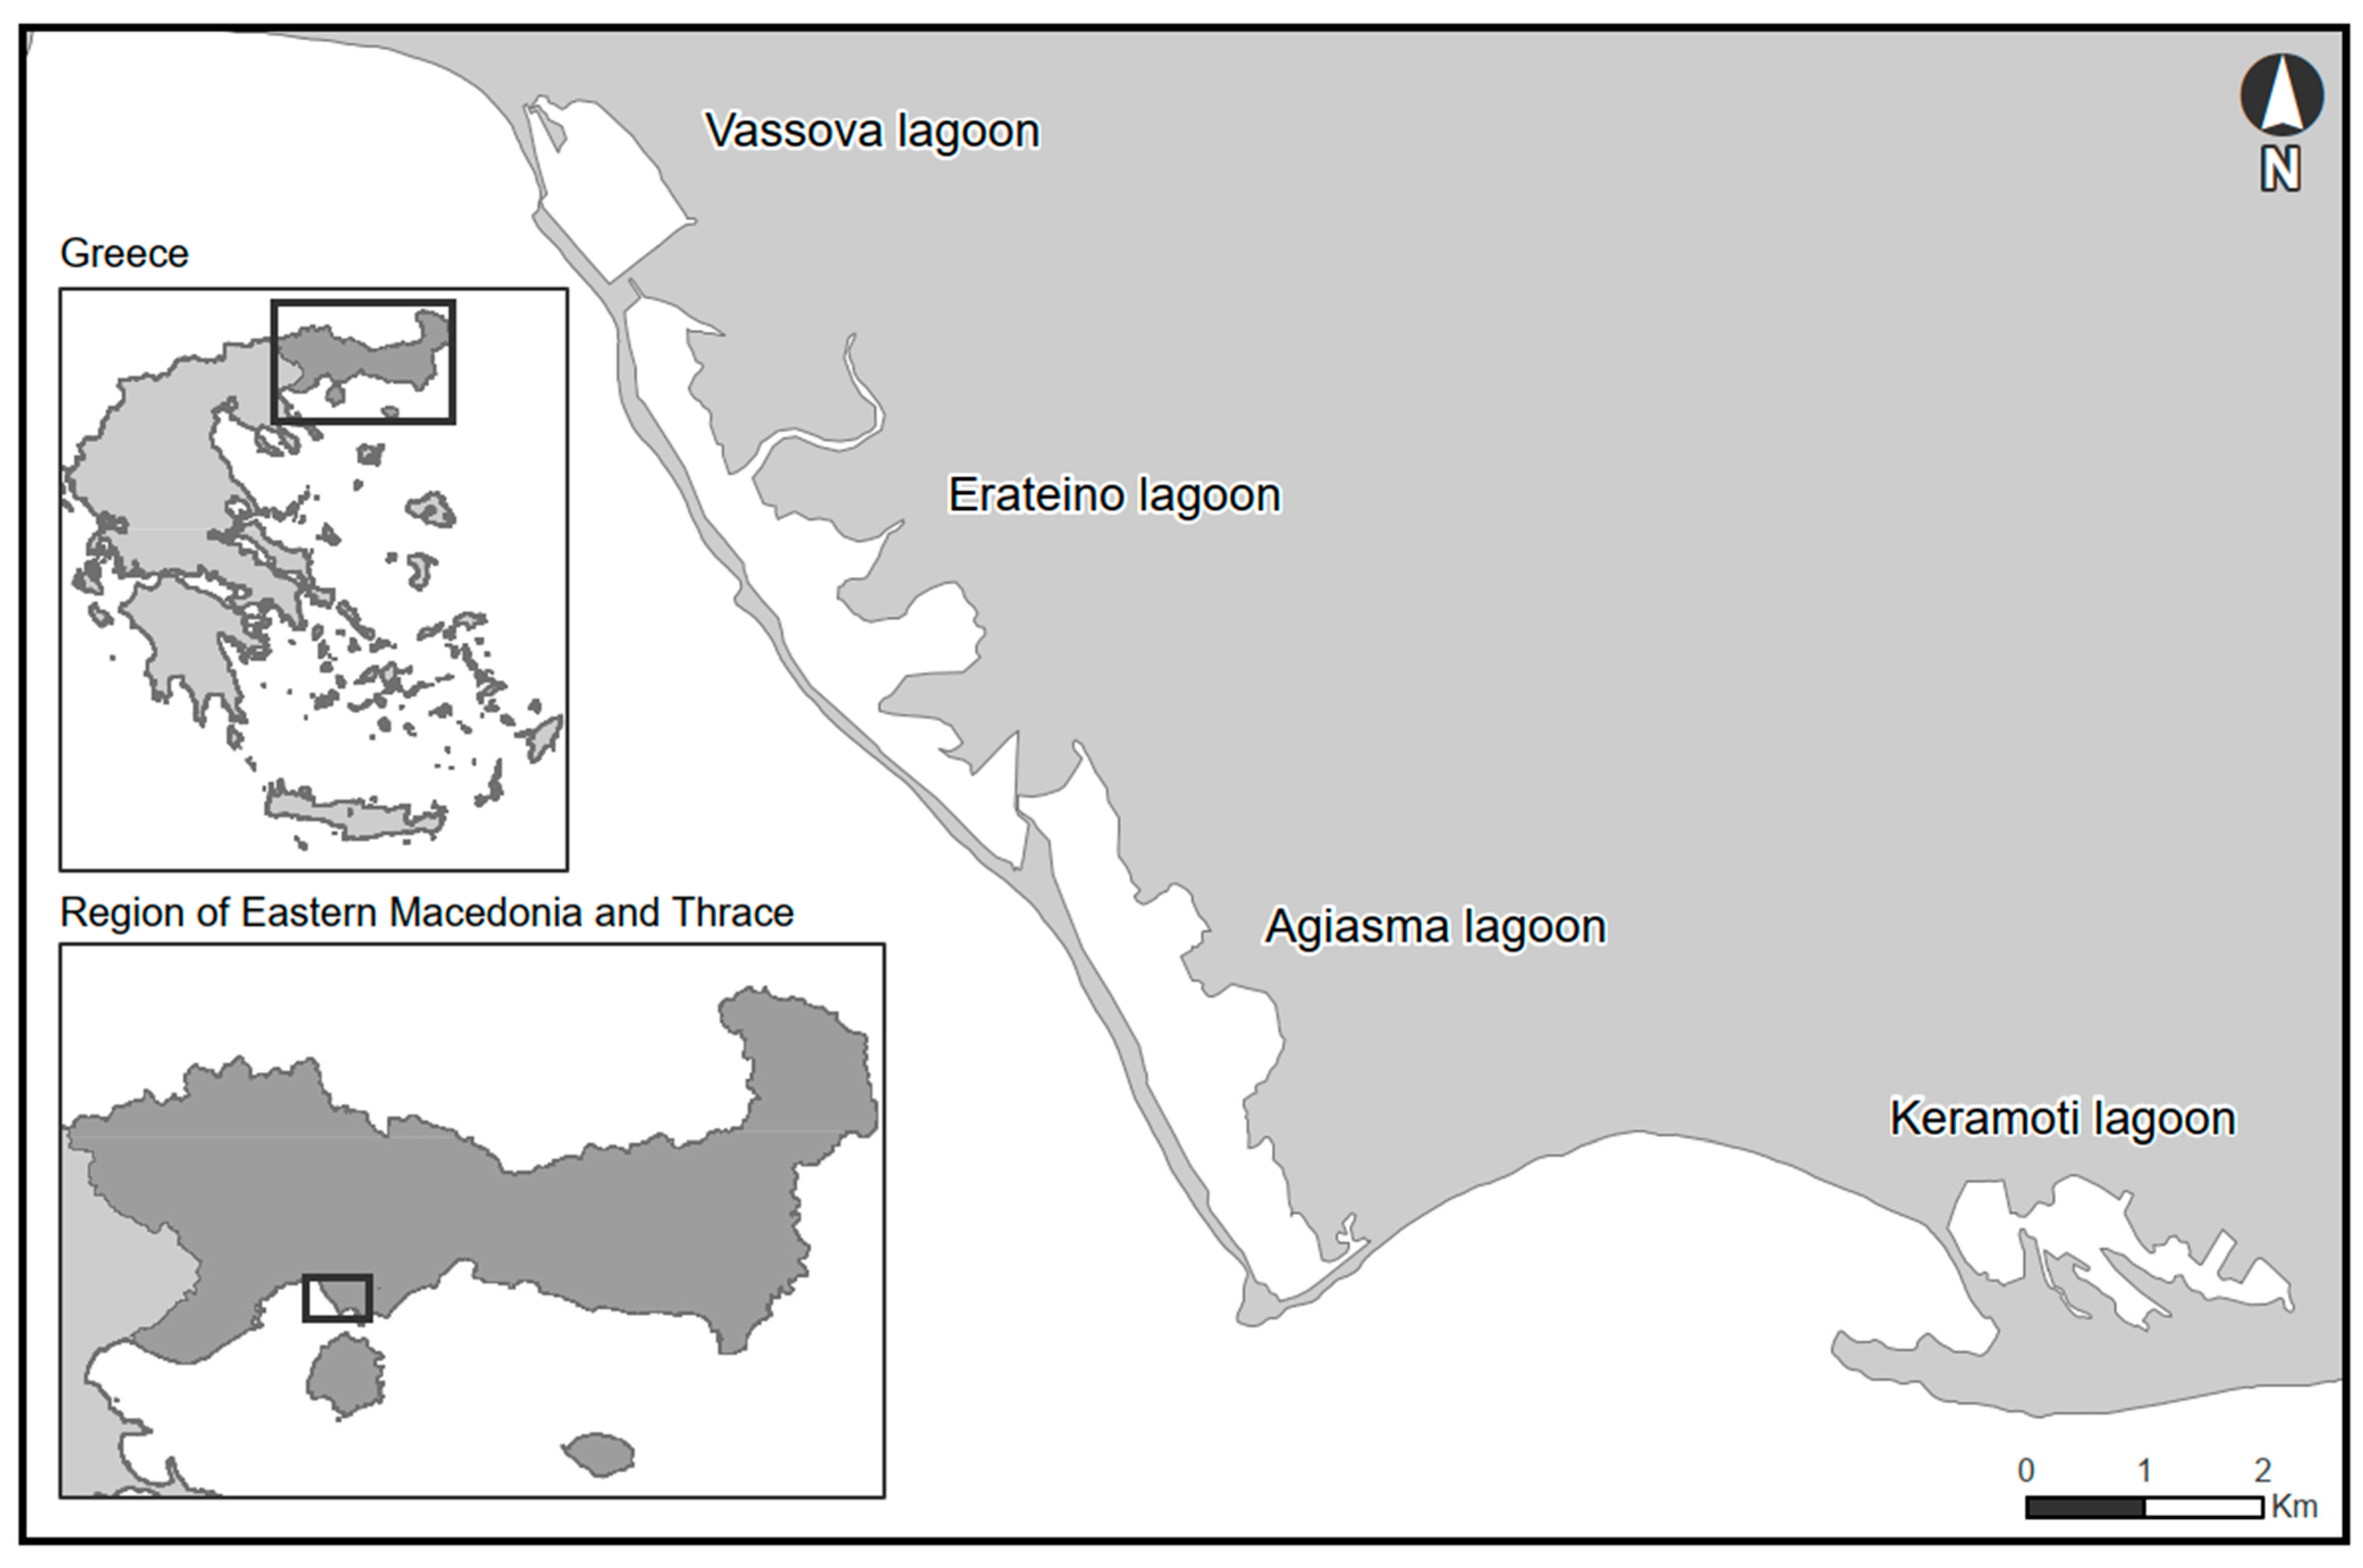
2.1. Nestos Delta Lagoons Study Area

The ND lagoons form a complex of seven non-connected, shallow, polyhaline coastal lagoons located in the North Aegean Sea, on the western bank of the Nestos River Delta (Greece), covering a total area of 8.53 km2. Both the ND and the studied lagoons were formed by the Nestos River and its interactions with the sea. The studied lagoons are Vassova, Erateino, Agiasma and Keramoti, which are used as extensive aquaculture sites (fisheries exploited). Although these lagoons are located close to each other, they exhibit differences in their chemical and ecological status [59] and hydrology (Figure 1). Our study examined the LULC changes and their effects on ES and their values in the ND lagoons and a peripheral zone of 500 m, covering a total area of 37.96 km2.
Throughout the entire study period, the ND was subjected to continuous man-made interventions related to urban development and agriculture (Figure 2). During the pre-analysis of historical events, three major drivers were identified, namely, agricultural growth, urban expansion (accompanied by land works and infrastructure development) and environmental protection legislation aimed at counteracting the adverse effects of the previous two.
The first crucial historical event related to agriculture was the incubation of the Nestos River in 1954. Up to 1960, an above-ground irrigation network was assembled, effectively defining the boundaries of the lagoons. According to data provided by the Directorate of Rural Development and Veterinary of Kavala, following the above interventions, a series of reclamations were carried out between 1967 and 1992 in order to distribute agricultural land around the lagoons.
Along with interventions related to agricultural land, residential activity is gradually developing around the lagoons. The first organized community on the Keramoti lagoon (Figure 2) was established in 1923 [60]. Keramoti is a continuously developing settlement, with notable touristic growth since the 1980s. Additionally, the Agiasma Beach settlement was built in the 1980s on the islet separating Agiasma lagoon from the sea [61]. Moreover, an international airport was built adjacent to the Erateino lagoon in 1981 and continues to operate today.
Despite the aforementioned anthropogenic interventions in the broader area of the ND, the Greek State recognized the high environmental value of the system and included the area as part of the Ramsar Convention in 1971. Subsequently, in 1992, the ND lagoons were designated as a Natura 2000 site (SPA-code GR1150001 and SCI-code GR1150010), because a variety of habitats and rich biodiversity have been recorded, including several endangered species. The study area was first protected by national legislation in 1996, and in 2008, the National Park of Eastern Macedonia–Thrace was established, including the ND lagoons.
It is important to note that the specific lagoons have been extensively exploited for fishing since 1946 by the “Agricultural Fishing Cooperative of Keramoti Lagoons of Kavala”. Several interventions have taken place to facilitate fishing activity, such as artificial depth management, dredging and the construction of fishing facilities (soft engineering).

2.2. LULC Classifications

For the land cover classification of the study area, two orthophotograph mosaics were produced using aerial photography surveys from 1945, 1960, 1974 and 1989 (Hellenic Military Geographical Service) and satellite images from 2002 and 2015 (Google Earth). The spatial resolution of the mosaics ranges between 0.1 and 4 m depending on the year (Table 1), and their scale ranges between 1:1000 and 1:8000, respectively. Image-to-map and image-to-image registration were employed to accurately align and compare the LULC maps. Image-to-image registration involves aligning an aerial photograph with a pre-existing spatial reference, typically a digital map, to ensure that the photograph obtains the correct coordinates. In this case, image-to-image registration involves aligning different images of different times in the same area, which is crucial for detecting changes. Due to the restricted availability of aerial photographs until 1975, we selected mostly mid-season images to avoid discrepancies between warm and cold periods. This seasonal selection was also performed for satellite imagery, where the availability was richer, ensuring homogeneity.
Land cover information was generated through photo-interpretation and delineation of land cover polygons on these orthomosaics. GPS measurements of enduring features, such as the remains of warehouses and livestock farms documented in historical aerial imagery, were gathered during field campaigns and used to assist with the georectification of the images (Table S1). A fixed classification scheme, which included 13 categories of the Corine Land Cover (CLC) 3rd level, was used to ensure maximum compatibility with other studies. The digitizing exercise was implemented on a 1:6000 scale, with a 0.5 ha minimum mapping unit within a Geographic Information System (GIS) environment, as in all other steps of the methodology.
The post-classification comparison approach was used to detect changes between the seven years of reference [62,63,64], setting a (relatively small) 15-year timestep to increase the amount of produced information and enhance the robustness of the results. This widely used technique for quantifying LULC changes involves the comparative analysis of independently produced classifications from different dates [65]. The accuracy of the post-classification comparison is totally dependent on the accuracy of the initial classifications [66]; however, this method has been proven to be adequately reliable when sensors of similar spatial resolution are used [67].

2.3. LULC and ES Evaluation Method

To extract ES value changes out of LULC changes, the Corine land uses classes identified in the study area were assigned to the Biomes proposed by Constanza et al. [68]. Considering the ease of implementation, this approach remains topical and widely applicable for assessing the ES embodied in this study system.
As a result of this study (Table 2), 7 of the 16 categories of Biomes have been identified, and they include the following: Estuaries, Shelf, Temperate/Boreal, Tidal Marsh/Mangroves, Swamps/Floodplains, Cropland and Urban.
For each lagoon within the study area, ecosystem values were calculated by multiplying the surface area of the Biome by the corresponding coefficient (Table 2) using the methodology without parametrization. Following Constanza et al. [12], we selected the 2011 coefficients (in 2007 USD value) presented in the present study without making any monetary adjustments, similar to several long-term studies on Mediterranean systems [69,70]. The ESV were also assessed using the same methodology.
Constanza et al. [12] described two key factors that led us to the selection of the 2011 coefficients. First, the ensemble of Βiomes was evaluated using the 2011 coefficients, resulting in a more comprehensive system evaluation. Second, because a more significant number of surveys were used to obtain the 2011 coefficients, the accuracy of the system’s assessment for the 2011 data is superior to that for the 2007 data.
In this research, the ES correspond to those previously identified by Mirli et al. [71] and are included in all three types of services: (a) Provisioning, (b) Regulating and Supporting and (c) Cultural, as defined in the Millennium Ecosystem Assessment (MA) classification system [5]. It is noted that no Mangroves or Boreal Forest are found in Med areas; thus, the Biomes will be referred to accordingly for the rest of the paper.

2.4. Sensitivity Analysis of Ecosystem Services Values

Given the uncertain value coefficient and the dynamic relationship between LULC and ESV, a sensitivity analysis was conducted to improve the validity of our results by adopting the Sensitivity Coefficient (CS) introduced by Kreuter et al. [72]. Specifically, this analysis was performed to determine the reasonableness of the LULC effect on ESV and the elasticity of the variable correspondence. According to this approach, an adjustment of 50% [73] to the Value Coefficient (VC) of a specific LULC is required to calculate the CS using the following equation:
CS = (ESVj − ESVi)/ESVi/(VCjk − VCik)/VCik
The “i” and “j” refer to the estimated values before and after the adjustment, respectively, while “k” represents the LULC type. A reliable result is obtained when CS < 1, indicating that the impact of LULC changes on ESV is negligible. However, a CS > 1 indicates ambiguous results and a high sensitivity of ESV to changes in LULC. In the present study, the ESV were calculated using a framework corresponding to Biomes; therefore, equivalent Biomes were used, rather than LULC types.

3. Results

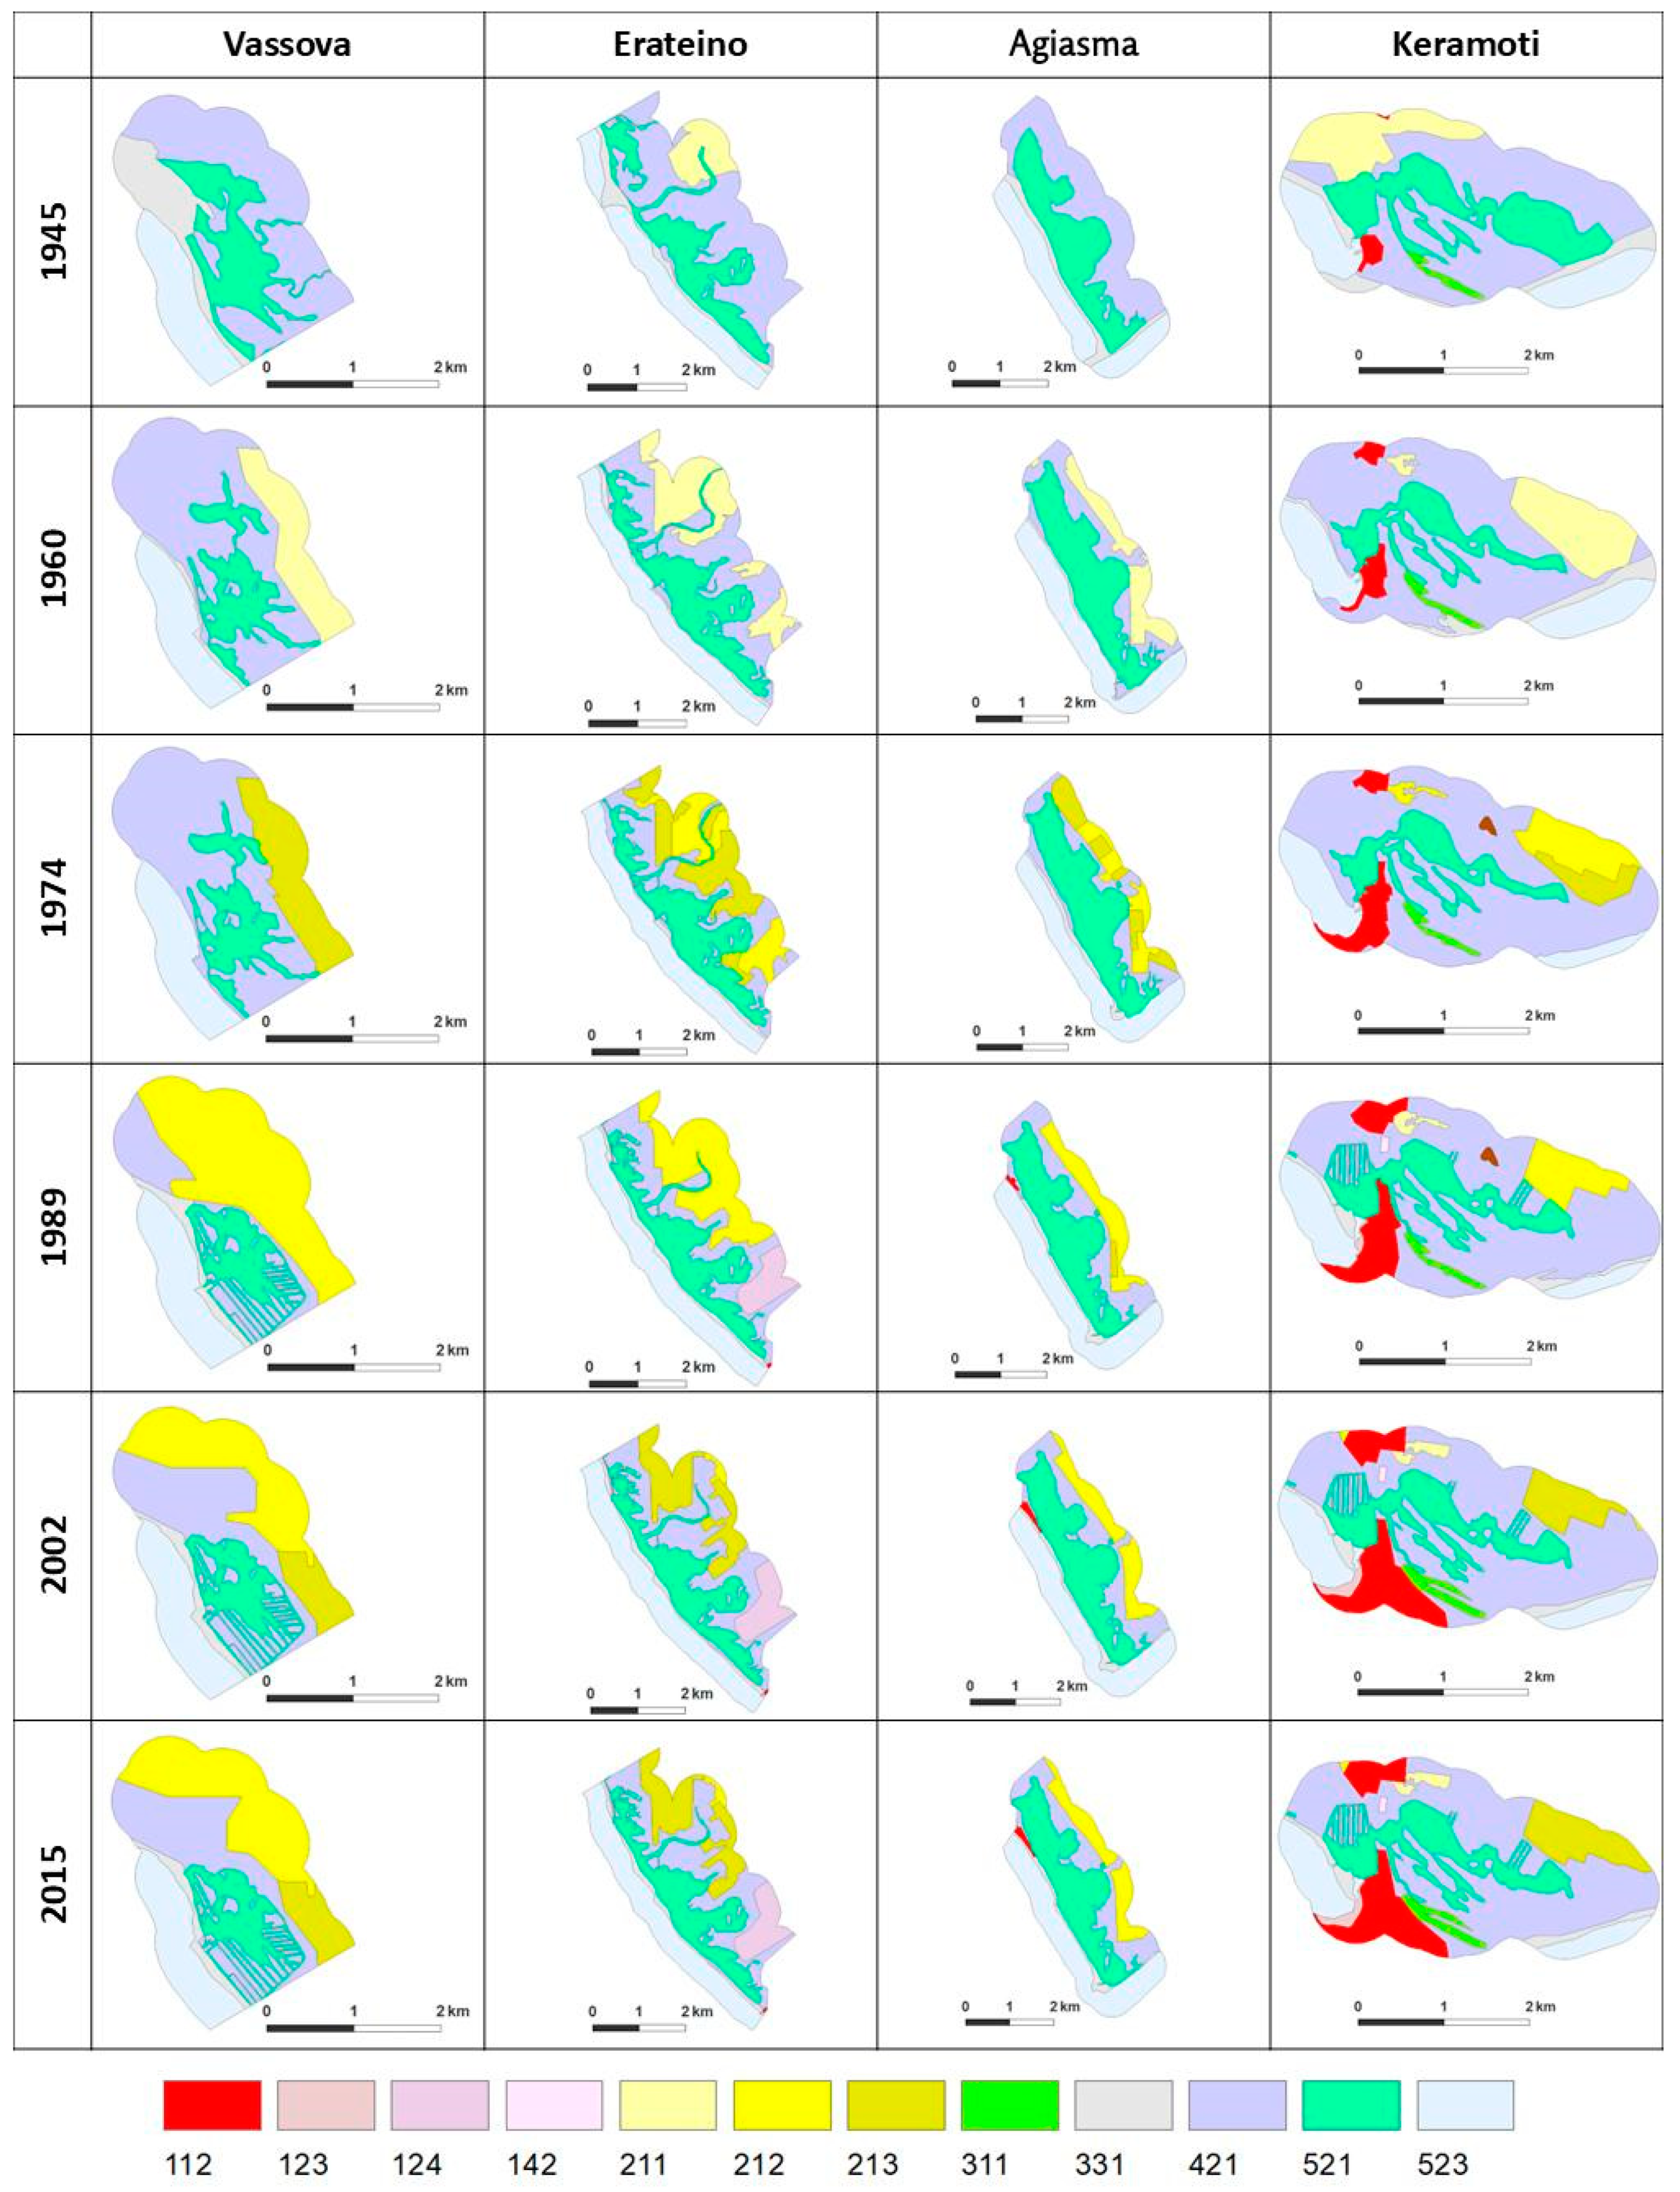
3.1. Land Use Changes

During the photo-interpretation, the number of LULC classes ranged from seven (Vassova lagoon) to eleven (Keramoti lagoon) according to the Corine Land Cover level 3 classification (Table 2). All four lagoons showed a significant increase in man-induced land use in the peripheral zone (1 and 2 CLC 1st level), indicating considerable levels of anthropogenic interventions (urban fabric, networks, agriculture). Notably, all the lagoons exhibited land uses that were associated with the wetland character of the study area. (Figure 3). The Keramoti lagoon exhibited the greatest variety of land uses among the lagoons, including the only Forest Land Use throughout the study period. Furthermore, Dump sites, since 1974, and Sport/leisure facilities, since 1989, have been recorded in the same lagoon. At the Erateino lagoon, the International Airport of Kavala has been recorded since 1989 (Table S2).
According to the assignment of Corine Land Use coding to Biomes, seven Biomes existed within the peripheral zone of the lagoons during the study period (Table 2), four of which are water-related. It should be noted that the Temperate Forest Biome occurs only in Keramoti (Figure 3).
An important result of this research is the change in the lagoon surface area, which is particularly significant since lagoons are a protected habitat. The lagoons experienced surface area losses ranging from −7% to −38%, except the Agiasma lagoon (Table 3). The pattern of changes in each lagoon differed during the study period (Figure 3 and Table S2).
The Tidal Marsh Biome was the most affected, experiencing a significant decline to a detrimental loss (−41 to −73%) across all four lagoons (Table 3). The most noticeable coastline loss was observed between 1945 and 1960, with the declining trend continuing until 1974, particularly in Vassova, where the coastline nearly disappeared (Table S2). For three of the four lagoons (Vassova, Erateino, Keramoti), recovery of the Tidal Marsh Biome was evident in the next time step (1989). This recovery is a significant observation and highlights the resilience of the lagoons. During the remainder of the study period, the coastline of the Vassova and Erateino lagoons slightly declined, while the one of Keramoti slightly increased. In contrast, the Agiasma lagoon experienced partial recovery in 1974, followed by stabilization (Figure 3 and Table S2).
The Swamps/Floodplains Biome is the second most critical, showing a loss of surface area ranging from −31 to −43% (Table 3). Even though the three lagoons are experiencing a decline in this Biome, the trends differ among them. In Erateino and Agiasma, the Biome declined between 1945 and 1974, whereas in Vassova, the decline continued until 1989 before starting to recover. It is worth noting that the Keramoti lagoon is an exception, with an increase of approximately 10%. Specifically, the Swamps/Floodplains Biome surface area of the Keramoti lagoon increased from 1945 to 1974; thereafter, it declined until 2015 (Table S2). Despite this decline, the Biome did not reach its original surface area level, having a total gain of 10%.
The impact of urbanization on the lagoons is an intriguing finding. Vassova lacks any urban characteristics throughout the study period, unlike Keramoti, which displayed urban characteristics as early as 1945 due to the Keramoti settlement, with an increase of over 1000% during the study period. Agiasma also experienced relatively low urban activity after 1989 (Figure 3 and Table 3).
The Cropland Biome displays a distinct pattern compared to the other Biomes, indicating a shift toward agricultural land use (Figure 3 and Table 3). Specifically, in Vassova and Agiasma, the Biome was first recorded in 1960 (Table S2), whereas, in Erateino, it increased by about 83% during the study period. A notable exception, however, is the Keramoti lagoon, with a 35% loss in the Cropland Biome.
An intriguing finding is that Vassova lacks any urban characteristics throughout the study period, unlike Keramoti, which displays an urban character as early as 1945 due to Keramoti settlement, recording an increase of over 1000% during the study period. Agiasma also shows relatively low levels of urban activity after 1989 (Figure 3 and Table 3).

3.2. Biomes and ES Values of Lagoons

Our study indicates that Vassova has suffered the most significant loss in value over the past 80 years, mainly due to the loss of Tidal Marsh and Swamp/Floodplains Biomes. The loss of these Biomes has resulted in a total loss of USD 14.2 million, with its economic value continuing to decline. In contrast, the Keramoti lagoon has shown the least value loss, with a decrease of USD 4.4 million and a continuous declining trend over the same period (Table S3).
The ES values provided by all the lagoons in the study area are declining, primarily due to shoreline loss rather than other anthropogenic interventions (e.g., intensification of agriculture, urban development) (Figure 4). During 1945–1974, systematic coastline loss occurred in the study area. After this period, the system partially regained its lost surface, but since 1989, coastline erosion has recommenced in the three lagoons, while the Keramoti lagoon has experienced erosion again since 2002 (Table S2). The second most significant factor in the decline of lagoon values was the loss of Swamps/Floodplains, which were converted to Cropland Biome. An exception to this trend is the Keramoti lagoon, where Swamps/Floodplains have been altered to Urban Biome (Figure 4).
The shift in Biomes directly affects ES and their values (Figure 5). Waste Treatment was the most severely impacted ES, with a significant loss of −39 to −70% and economic losses ranging from USD 3.5 to USD 9.8 million across all lagoons. Although Habitat/Refugia is not the second most affected ES in economic losses, it ranks second in the decline rate, with losses ranging from −19% to −60%. Regarding economic losses, Erosion Control ranks second, with losses between USD 151 K and USD 1.7 million (Table 4 and Table S4). The study findings indicate that the ES related to agriculture (Soil Formation, Pollination, Food Production, Genetic Resources) are the ones that mainly exhibit an increase.
Our sensitivity analysis, performed separately for each lagoon, has revealed a strong relation between LULC and ESV in our study (CS < 1, Table S5). This confirms the reliability of our results, indicating that changes in LULC have a minimal impact on ESV. The highest sensitivity analysis result is CS = 0.52, which refers to the Swamps/Floodplains Biome in the Keramoti lagoon. While this Βiome showed the highest result among the lagoons (Table S4), indicating some uncertainty, the overall reliability of the results remained unaffected.

4. Discussion

4.1. Land Use/Land Cover Changes Methodology and Limitations

For over 20 years, the study of LULC in the area surrounding the lagoons has been conducted using image-based data [74]. The majority of studies focusing on coastal lagoons have examined how these changes affect ecological and hydrological indicators [38,75,76]. A few studies have examined the impact of LULC on ES and their values [8,77,78], and it is noteworthy that most of them limit the study period to 10 years, restricting the depiction of changes over time. Although the methodology employed in this study is commonly used in inland water systems to assess LULC and ES values, it does not appear to be widely used for coastal lagoon studies, making the comparison of results difficult. As far as the study area is concerned, limited data are available on LULC [79], and this study is the first to document the history of LULC around the protected ND lagoons over an eighty-year period, providing a comprehensive view of the evolution of the system over time.
Interpreting aerial photographs presents several challenges, particularly in identifying the boundaries between lagoons and adjacent swamps/floodplains. As a result of the unique features of the coastal and lagoonal environment, the vast water–land mixture, variable water depth and tidal effects, photo-interpretation can be challenging. Added to this, the mosaics of 1945 and 1960 presented an extra challenge because of their reduced spatial and radiometric resolution. To minimize the adverse effects related to these, GPS measurements of features that have been constantly present since 1945 were used.

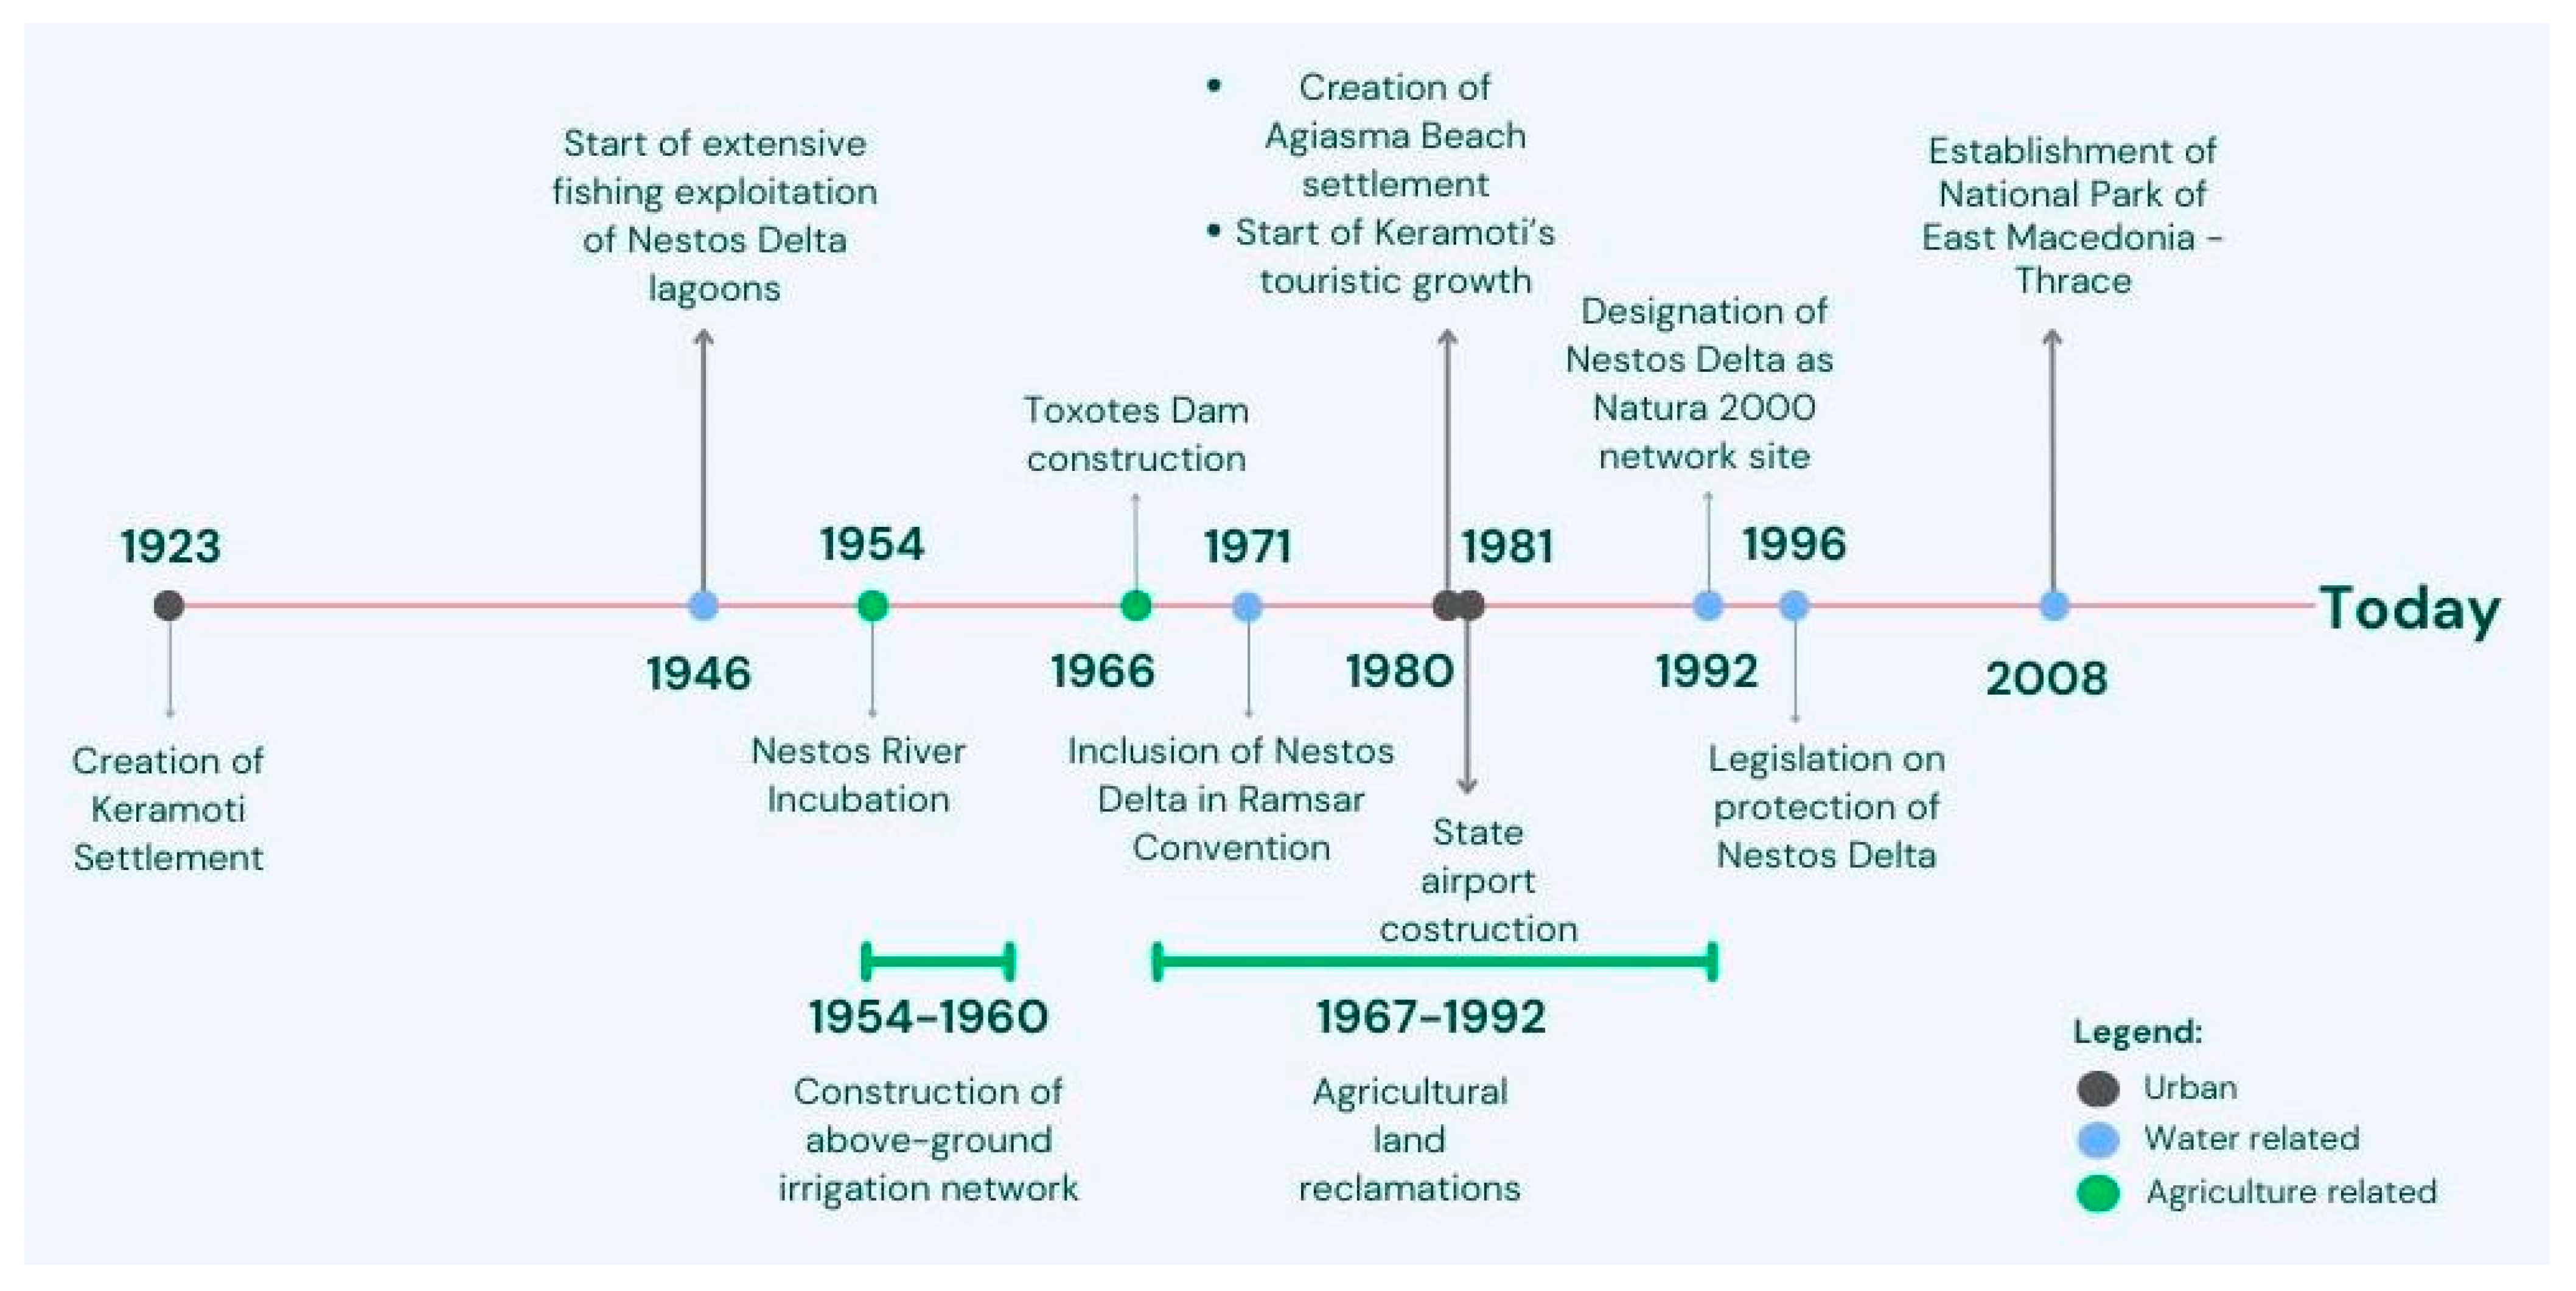
4.2. Key Factors Driving Land Use Changes in ND Lagoons

The Nestos Delta ecosystem experienced substantial changes in the 20th century, significantly impacting the lagoons (Figure 3). Our findings indicate that the most extensive changes in land use around the lagoons, as well as in their size, occurred between 1945 and 1960, which aligns with the findings of Mallinis et al. [79].
One of the major events that set the starting point for LULC changes is the incubation of the Nestos River, which subsequently cut off freshwater supply and reduced sediment flow to the lagoons [59]. As a result of this intervention, wetlands were converted into agricultural land, increasing the pressure on water-related land uses and significantly reducing their total area. Moreover, the shoreline was affected by erosion [80,81]. The first land reform was implemented 13 years after the incubation, creating a milestone for intensifying agriculture around the lagoons [57]. It was not until 1992 that the agricultural land surrounding the lagoon perimeter was finalized as a result of land reform.
Urbanization has had a significant impact on the Keramoti lagoon (Figure 4). The expansion of the residential area and other supporting structures (sports and leisure activities, harbor) has reduced wetland areas, and the system’s economic value has been reduced. Similar findings concerning environmental degradation and loss of economic value have been recorded in other water systems, as well [73,82].

4.3. Biomes and ES Values of Lagoons

The results of the present study highlight the high significance of water-related Biomes in the value of natural systems, especially coastal lagoons, which are the most affected by LULC changes. Similarly, in the Regional Park of Maremma (Tuscany, Italy) [63] and the Keta lagoon complex (Ghana) [83], wetlands are the most affected LULC, resulting in a significant loss of ES Values in the system. Although the intensification of agricultural activities in the peripheral zone of the ND lagoons has a minor positive effect on agriculture-related ES (provisioning and regulating), it appears to heavily reduce the overall value of the system, since the value of wetlands (Swamps and Floodplains) has been lost. This result has been recorded for different types of water systems where agriculture has taken over wetlands, such as the Yangtze River (China) [82]. On the other hand, in Sinaloa State (Mexico), the shift from agricultural land to wetlands significantly increased ESV [8].
During the first time interval (1945–1960), a significant loss of coastline was recorded as the incubation of the Nestos River occurred and the lagoon system separated from the riverine system, interrupting the continuity of freshwater inflows. This reduction caused a total loss of more than USD 40 million in the study area. The loss of the coastline was halted in 1974 and has been followed by a slight restoration. The halting occurred because of repeated flooding along the Nestos River [84], where sediment was transferred into the lagoon. As a result of this natural phenomenon, the system’s value increased by USD 14.5 million (Table S3) and its resistance to erosion was enhanced. While the system is naturally restoring itself to its previous state, the construction of two dams upstream of the Nestos River has led to the resumption of coastline erosion [85,86], resulting in a reduction in the value of the study area.
As an analysis of land use and the correlation of CLC codes to Biomes has not been conducted previously for the area, misidentification was possible. In order to determine whether the ESV equivalent is reasonable and how a change in just one type of LULC may affect the ESV in total, a broadly used sensitivity analysis was employed [70,76,77]. The low values of the results confirmed that the method used was accurate, reliable and robust.
Our mapping of LULC in the Erateino and Agiasma lagoons revealed negligible land use changes since 2002. However, the other two lagoons experienced a slower rate of change, leading to a gradual decline in their value. This underscores the need for long-term monitoring and effective management strategies, supported by research, to prevent further degradation. In particular, the Vassova lagoon has already lost over 50% of its total value, and its rate of decline has not yet stabilized, requiring immediate attention. This situation jeopardizes its future and demands proactive, sustainability-oriented management measures.
For the Erateino and Agiasma lagoons, it is notable that agricultural land was abandoned after 2002, leading to their conversion into Swamps/Floodplains, resulting in a modest increase in value (USD 2.6 million). Many regions of Greece and the EU have experienced the abandonment of agricultural lands [73,87,88]. Several factors have contributed to this phenomenon, including the implementation of the Common Agricultural Policy (1992), the gradual development of environmental awareness and population urbanization. The results of our study are consistent with the findings of a number of European studies indicating that the implementation of environmentally friendly practices in the Common Agricultural Policy, as well as national environment-friendly policies, has led to the observed land abandonment for the recovery of important and fragile ecosystems. [89,90,91].

4.4. Management of the Protected Area

The halting of LULC changes in Erateino and Agiasma and the decline in the rate of LULC changes in the other lagoons are significant aspects that require further investigation. The implementation of the legal framework for protecting the area (declaration as a National Park and establishment of a Management Body) may have contributed to this, since similar phenomena of decline in the rate of LULC changes or even recovery of systems have been observed in numerous National Parks [92,93,94]. Especially in the case of the Thrace River Basin Management Plan, modern ecologically friendly tools like Nature-Based Solutions are envisaged to accelerate functioning and recovery but have yet to be implemented [95].
As outlined in the Ramsar Guidelines [96], management strategies that solely concentrate on conservation actions have not achieved their intended outcomes. This is because they do not adequately consider the needs and perspectives of stakeholders or effectively communicate the significant (both direct or indirect) connection between conservation and sustainable use [97]. A cost–benefit analysis has served as the main rationale for decision-making and the development of management plans for many years [11]. An evolution in management strategies is the ES approach, which takes into account both the monetary value and the ES provided by the system [68]; however, it has not yet been widely adopted. Research indicates that different decision support systems require different methods that advocate for greater stakeholder involvement and awareness-raising initiatives [98]. The active involvement of stakeholders is not just beneficial, but integral to the success of the management process.
The findings of our study express the trend of ES and their values in the ND lagoons. They can become a valuable tool in developing management plans for the broader area of the ND lagoons, which include the three pillars of integrated water resources management (social, economic and environmental aspects). In accordance with the findings of Scholte et al. [97], it is concluded that an understanding of LULC changes in the studied area, as provided by the present study, facilitates the identification of stakeholders and the potential conflicts of interest among them.

5. Conclusions

This study analyzed the impacts of historical LULC changes on ES provisioning and ES values in the Nestos Delta lagoons over a 75-year period. Several significant anthropogenic impacts have been documented, including urbanization, agricultural intensification and tourism development, which have cumulatively contributed to the alteration of lagoon ecosystems.
The study outcomes show substantial LULC changes around the perimeter of the lagoons during the study period (1945–2015), which had a significant impact on this system. Based on a robust methodology that involves the photo-interpretation of aerial photographs, the analysis of satellite images and a sensitivity analysis facilitated by GPS measurements, this study can identify significant shifts in LULC. Several water-related Biomes, including Tidal Marshes, Floodplains and Swamps, have been converted into agricultural lands and urban areas. There has been a noticeable decline in the size of the lagoons and, consequently, a decrease in ESV, primarily due to shoreline erosion and the deterioration of wetland habitats. This study highlights the need to implement a legislative framework to restore some agricultural land to water-related habitats, in order to minimize adverse effects and increase the value of coastal lagoons and the ES in general.
While Vassova, Erateino and Agiasma share a similar trend in LULC change, with negligible urban development, the Keramoti lagoon exhibits a unique pattern. Here, water-related Biomes and agricultural land have declined in favor of urban areas and Temperate Forest. During the first period (1945–1960), the majority of changes occurred, resulting in the greatest economic losses for the system. The system’s economic value decline persisted throughout the study period, with Vassova showing the greatest decrease and Keramoti showing the least impact. According to this study, economic losses from LULC changes range between USD 4.45 and USD 14.3 million, with regulating services being the most significantly affected.
As evidenced by the stabilization of anthropogenic pressures following the designation of the study area as a Natura 2000 site and a National Park, this study highlights the importance of implementing legislative protection. This legislative framework has not only prevented rapid development but also enhanced the economic value of cultural ES without significantly impacting provisioning services. The positive impact of legislative measures emphasizes the need to incorporate ES approaches into environmental management practices to achieve optimal ES values.
Furthermore, the findings emphasize the importance of proactive, long-term management interventions and the continuous monitoring of lagoon ecosystems to ensure their sustainability. As a result of LULC changes and in an attempt to promote the ecological recovery of the lagoons, these strategies play a crucial role in mitigating adverse effects. In order to make informed decisions about the future of wetlands, it is necessary to establish an appropriate decision-making framework, such as a multi-criteria analysis, that allows for the evaluation of all the social, cultural, environmental and economic benefits associated with these ecosystems. Using a participatory approach promotes stakeholder engagement and increases stakeholder awareness, leading to the development of sustainable and effective management strategies. Acknowledging the need for further stakeholder engagement, our scientific team has already conducted a multi-criteria participatory approach study using semi-structured questionnaires (in prep).
This study underscores the importance of understanding the complex interactions between ES and historical LULC changes. It suggests that further research is necessary to address knowledge gaps, which will enhance the effectiveness of conservation strategies tailored to coastal lagoon ecosystems. By refining methodologies and increasing the effectiveness of these strategies, future research can play a crucial role in the sustainable management of these ecosystems.
Limitations of the research linked to the mapping process, namely photo-interpretation and digitization, may arise, because accurate photo-interpretation requires significant expertise and experience to avoid misidentification and achieve a balance between generalization and the simplification of geographical features. Furthermore, this process can be time-consuming and expensive, especially for large or complex areas. Moreover, the availability of aerial photos for such a long period is limited to a single source. Due to the limited data on LULC changes in protected coastal lagoons, further research is necessary to better understand the effects of LULC changes on coastal lagoon ecosystems. A further consideration is that the monetary estimation of ES values cannot represent an 80-year period because inflation and currencies fluctuate, but nevertheless, it represents a trend. However, additional research is needed to determine the methodology’s potential and enable it to be more widely adopted in coastal lagoon studies.
This paper presents a compelling argument favoring the sustainable management of Mediterranean coastal lagoons and provides valuable insights regarding the historical dynamics of LULC change and its implications for ES. These insights are critical for guiding future conservation efforts and safeguarding these critical habitats at both the ecological and economic levels.

Supplementary Materials

The following supporting information can be downloaded at: https://www.mdpi.com/article/10.3390/land13081277/s1, Table S1: GPS measurements used for georectification; Table S2: Land Uses in ha per lagoon for each time step; Table S3: Values Changes in USD in Biomes for each time step; Table S4: ESV Change in USD for each time step; Table S5: Sensitivity analysis results.

Author Contributions

Conceptualization, A.M. and D.L.; methodology, A.M., D.L., K.B. and G.G.; software, A.M., K.B. and G.G.; validation, A.M., K.B. and G.G.; formal analysis, A.M. and G.G.; investigation, I.K.; resources, A.M., K.B. and G.G.; data curation, A.M.; writing—original draft preparation, A.M. and G.G.; writing—review and editing, D.L. and I.K.; visualization, A.M., G.G. and D.L.; supervision, I.K.; project administration, D.L.; funding acquisition, D.L. and I.K. All authors have read and agreed to the published version of the manuscript.

Funding

This research was partially funded by EETAA, private and national funds, and the Eye4Water project, MIS 5047246, implemented under the action: “Support for Research Infrastructure and Innovation” by the Operational Program “Competitiveness, Entrepreneurship and Innovation” in the framework of the Co-financed by Greece and the European Union-European Regional Development Fund.

Data Availability Statement

The sum of data are included in the paper and Supplementary Materials.

Conflicts of Interest

The authors declare no conflicts of interest.

References

  1. Wang, J.; Zhai, T.; Lin, Y.; Kong, X.; He, T. Spatial imbalance and changes in supply and demand of ecosystem services in China. Sci. Total Environ. 2019, 657, 781–791. [Google Scholar] [CrossRef] [PubMed]
  2. Sieber, I.M.; Campagne, C.S.; Villien, C.; Burkhard, B. Mapping and Assessing Ecosystems and Their Services: A Comparative Approach to Ecosystem Service Supply in Suriname and French Guiana. Ecosyst. People 2021, 17, 148–164. [Google Scholar] [CrossRef]
  3. Muthee, K.W.; Mbow, C.; Macharia, G.M.; Leal-Filho, W. Ecosystem services in adaptation projects in West Africa. Int. J. Clim. Chang. Strateg. Manag. 2018, 10, 533–550. [Google Scholar] [CrossRef]
  4. Latinopoulos, D.; Koulouri, M.; Kagalou, I. How historical land use/land cover changes affected ecosystem services in lake Pamvotis, Greece. Hum. Ecol. Risk Assess. Int. J. 2021, 27, 1472–1491. [Google Scholar] [CrossRef]
  5. Maes, J.; Teller, A.; Erhard, M.; Conde, S.; Vallecillo, S.; Barredo, J.I.; Paracchini, M.L.; Abdul Malak, D.; Trombetti, M.; Vigiak, O.; et al. Mapping and Assessment of Ecosystems and Their Services: An EU Wide Ecosystem Assessment in Support of the EU Biodiversity Strategy; Publications Office of the European Union: Luxembourg, 2020; ISBN 978-92-76-17833-0. [Google Scholar]
  6. Costanza, R.; d’Arge, R.; de Groot, R.; Farber, S.; Grasso, M.; Hannon, B.; Limburg, K.; Naeem, S.; O’Neill, R.V.; Paruelo, J.; et al. The value of the world’s ecosystem services and natural capital. Nature 1997, 387, 253–260. [Google Scholar] [CrossRef]
  7. Kagalou, I.; Latinopoulos, D. Filling the Gap between Ecosystem Services Concept and River Basin Management Plans: The Case of Greece in WFD 20+. Sustainability 2020, 12, 7710. [Google Scholar] [CrossRef]
  8. Camacho-Valdez, V.; Ruiz-Luna, A.; Ghermandi, A.; Nunes, P.A.L.D. Valuation of ecosystem services for assessing the impact of land-use changes in the coastal wetlands of Northwest Mexico. Ocean Coast. Manag. 2013, 78, 1–11. [Google Scholar] [CrossRef]
  9. Martinez-Harms, M.J.; Bryan, B.A.; Balvanera, P.; Law, E.A.; Rhodes, J.R.; Possingham, H.P.; Wilson, K.A. Making decisions for managing ecosystem services. Biol. Conserv. 2015, 184, 229–238. [Google Scholar] [CrossRef]
  10. de Groot, R.; Brander, L.; van der Ploeg, S.; Costanza, R.; Bernard, F.; Braat, L.; Christie, M.; Crossman, N.; Ghermandi, A.; Hein, L.; et al. Global Estimates of the Value of Ecosystems and Their Services in Monetary Units. Ecosyst. Serv. 2012, 1, 50–61. [Google Scholar] [CrossRef]
  11. Pearce, D.W. The economic value of forest ecosystems. Ecosyst. Health 2001, 7, 284–296. [Google Scholar] [CrossRef]
  12. Costanza, R.; de Groot, R.; Braat, L.; Kubiszewski, I.; Fioramonti, L.; Sutton, P.; Farber, S.; Grasso, M. Twenty Years of Ecosystem Services: How Far Have We Come and How Far Do We Still Need to Go? Ecosyst. Serv. 2017, 28, 1–16. [Google Scholar] [CrossRef]
  13. Tolessa, T.; Senbeta, F.; Kidane, M. The impact of land use/land cover change on ecosystem services in the central highlands of Ethiopia. Ecosyst. Serv. 2017, 23, 47–54. [Google Scholar] [CrossRef]
  14. Chen, L.; Jin, Z.; Michishita, R.; Cai, J.; Yue, T.; Chen, B.; Xu, B. Dynamic monitoring of wetland cover changes using time-series remote sensing imagery. Ecol. Inform. 2014, 24, 17–26. [Google Scholar] [CrossRef]
  15. Pérez-Ruzafa, A.; Pérez-Ruzafa, I.M.; Newton, A.; Marcos, C. Coastal lagoons: Environmental variability, ecosystem complexity and goods and services uniformity. In Coasts and Estuaries; Elsevier: Amsterdam, The Netherlands, 2019; pp. 253–276. [Google Scholar]
  16. Cataudella, S.; Crosetti, D.; Massa, F. (Eds.) Mediterranean coastal lagoons: Sustainable management and interactions among aquaculture, capture fisheries and the environment. In General Fisheries Commission for the Mediterranean; FAO: Rome, Italy, 2015; Available online: https://openknowledge.fao.org/server/api/core/bitstreams/2b9abb35-bb50-4c9d-bd7c-cbc98d21600c/content (accessed on 23 March 2024).
  17. Coll, M.; Piroddi, C.; Albouy, C.; Ben Rais Lasram, F.; Cheung, W.W.L.; Christensen, V.; Karpouzi, V.S.; Guilhaumon, F.; Mouillot, D.; Paleczny, M.; et al. The Mediterranean Sea under siege: Spatial overlap between marine biodiversity, cumulative threats and marine reserves. Glob. Ecol. Biogeogr. 2012, 21, 465–480. [Google Scholar] [CrossRef]
  18. Ludwig, W.; Dumont, E.; Meybeck, M.; Heussner, S. River discharges of water and nutrients to the Mediterranean and Black Sea: Major drivers for ecosystem changes during past and future decades? Prog. Oceanogr. 2009, 80, 199–217. [Google Scholar] [CrossRef]
  19. Davy, A.J.; Bakker, J.P.; Figueroa, M.E. Human modification of European salt marshes. In Human Impacts on Salt Marshes: A Global Perspective; Sillyman, B.R., Grosholz, E.D., Bertness, M.D., Eds.; University of California Press: Berkeley, CA, USA, 2009; pp. 311–335. [Google Scholar]
  20. Milano, M.; Ruelland, D.; Fernandez, S.; Dezetter, A.; Fabre, J.; Servat, E. Facing climatic and anthropogenic changes in the Mediterranean basin: What will be the medium-term impact on water stress? C. R. Geosci. 2012, 344, 432–440. [Google Scholar] [CrossRef]
  21. Rodríguez-Santalla, I.; Navarro, N. Main Threats in Mediterranean Coastal Wetlands. The Ebro Delta Case. J. Mar. Sci. Eng. 2021, 9, 1190. [Google Scholar] [CrossRef]
  22. Perennou, C.; Beltrame, C.; Guelmami, A.; Vives, P.T.; Caessteker, P. Existing areas and past changes of wetland extent in the Mediterranean region: An overview. Ecol. Mediterr. 2012, 38, 53–66. [Google Scholar] [CrossRef]
  23. Micheli, F.; Saenz-Arroyo, A.; Greenley, A.; Vazquez, L.; Montes, J.A.E.; Rossetto, M.; De Leo, G.A. Evidence that marine reserves enhance resilience to climatic impacts. PLoS ONE 2013, 7, e40832. [Google Scholar] [CrossRef]
  24. Newton, A.; Icely, J.D.; Falcão, M.; Nobre, A.; Nunes, J.P.; Ferreira, J.G.; Vale, C. Sustainable development of coastal lagoons in Europe: A baseline assessment of environmental health and socio-economic status. Estuar. Coast. Shelf Sci. 2018, 200, 217–235. [Google Scholar]
  25. Stefanova, A.; Hesse, C.; Krysanova, V.; Volk, M. Assessment of socio-economic and climate change impacts on water resources in four European lagoon catchments. Environ. Manag. 2019, 64, 701–720. [Google Scholar] [CrossRef]
  26. Newton, A.; Icely, J.; Cristina, S.; Brito, A.; Cardoso, A.C.; Colijn, F.; Riva, S.D.; Gertz, F.; Hansen, J.W.; Holmer, M.; et al. An overview of ecological status, vulnerability and future perspectives of European large shallow, semi-enclosed coastal systems, lagoons and transitional waters. Estuar. Coast. Shelf Sci. 2014, 140, 95–122. [Google Scholar] [CrossRef]
  27. Shoyama, K.; Yamagata, Y. Predicting land-use change for biodiversity conservation and climate-change mitigation and its effect on ecosystem services in a watershed in Japan. Ecosyst. Serv. 2014, 8, 25–34. [Google Scholar] [CrossRef]
  28. Yi, H.; Güneralp, B.; Filippi, A.M.; Kreuter, U.P.; Güneralp, İ. Impacts of land change on ecosystem services in the San Antonio River Basin, Texas, from 1984 to 2010. Ecol. Econ. 2017, 135, 125–135. [Google Scholar] [CrossRef]
  29. Cabral, P.; Feger, C.; Levrel, H.; Chambolle, M.; Basque, D. Assessing the impact of land-cover changes on ecosystem services: A first step toward integrative planning in Bordeaux, France. Ecosyst. Serv. 2016, 22, 318–327. [Google Scholar] [CrossRef]
  30. Schirpke, U.; Kohler, M.; Leitinger, G.; Fontana, V.; Tasser, E.; Tappeiner, U. Future impacts of changing land-use and climate on ecosystem services of mountain grassland and their resilience. Ecosyst. Serv. 2017, 26, 79–94. [Google Scholar] [CrossRef]
  31. Martinez-Harms, M.J.; Bryan, B.A.; Figueroa, E.; Pliscoff, P.; Runting, R.K.; Wilson, K.A. Scenarios for land use and ecosystem services under global change. Ecosyst. Serv. 2017, 25, 56–68. [Google Scholar] [CrossRef]
  32. Mendoza, M.E.; Granados, E.L.; Geneletti, D.; Pérez-Salicrup, D.R.; Salinas, V. Analysing land cover and land use change processes at watershed level: A multitemporal study in the Lake Cuitzeo Watershed, Mexico (1975–2003). Appl. Geogr. 2011, 31, 237–250. [Google Scholar] [CrossRef]
  33. Wang, Y.; Dai, E.; Yin, L.; Ma, L. Land Use/Land Cover Change and the Effects on Ecosystem Services in the Hengduan Mountain region, China. Ecosyst. Serv. 2018, 34, 55–67. [Google Scholar] [CrossRef]
  34. Joshi, N.; Baumann, M.; Ehammer, A.; Fensholt, R.; Grogan, K.; Hostert, P.; Jepsen, M.R.; Kuemmerle, T.; Meyfroidt, P.; Mitchard, E.T.A.; et al. A Review of the application of optical and radar remote sensing data fusion to land use mapping and monitoring. Remote Sens. 2016, 8, 70. [Google Scholar] [CrossRef]
  35. Zhao, Q.; Wen, Z.; Chen, S.; Ding, S.; Zhang, M. Quantifying land use/land cover and landscape pattern changes and impacts on ecosystem services. Int. J. Environ. Res. Public Health 2020, 17, 126. [Google Scholar] [CrossRef] [PubMed]
  36. Paudyal, K.; Baral, H.; Bhandari, S.P.; Bhandari, A.; Keenan, R.J. Spatial assessment of the impact of land use and land cover change on supply of ecosystem services in Phewa watershed, Nepal. Ecosyst. Serv. 2019, 36, 100895. [Google Scholar] [CrossRef]
  37. Gao, G.; Zhang, J.; Liu, Y.; Ning, Z.; Fu, B.; Sivapalan, M. Spatio-temporal patterns of the effects of precipitation variability and land use/cover changes on long-term changes in sediment yield in the Loess Plateau, China. Hydrol. Earth Syst. Sci. 2017, 21, 4363–4378. [Google Scholar] [CrossRef]
  38. Disperati, L.; Virdis, S.G.P. Assessment of land-use and land-cover changes from 1965 to 2014 in Tam Giang-Cau Hai Lagoon, central Vietnam. Appl. Geogr. 2015, 58, 48–64. [Google Scholar] [CrossRef]
  39. Morgan, J.L.; Gergel, S.E.; Coops, N.C. Aerial photography: A rapidly evolving tool for ecological management. BioScience 2010, 60, 47–59. [Google Scholar] [CrossRef]
  40. Attri, P.; Chaudhry, S.; Sharma, S. Remote sensing & GIS based approaches for LULC change detection—A review. Int. J. Curr. Eng. Technol. 2015, 5, 3126–3137. [Google Scholar]
  41. Chachondhia, P.; Shakya, A.; Kumar, G. Performance evaluation of machine learning algorithms using optical and microwave data for LULC classification. Remote Sens. Appl. Soc. Environ. 2021, 23, 100599. [Google Scholar] [CrossRef]
  42. Wang, J.; Bretz, M.; Dewan, M.A.A.; Delavar, M.A. Machine learning in modelling land-use and land cover-change (LULCC): Current status, challenges and prospects. Sci. Total Environ. 2022, 822, 153559. [Google Scholar] [CrossRef] [PubMed]
  43. Antrop, M. Background Concepts for Integrated Landscape Analysis. Agric. Ecosyst. Environ. 2000, 77, 17–28. [Google Scholar] [CrossRef]
  44. Bianchetti, R.A.; MacEachren, A.M. Cognitive themes emerging from air photo interpretation texts published to 1960. ISPRS Int. J. Geo-Inf. 2015, 4, 551–571. [Google Scholar] [CrossRef]
  45. Turner, W.; Rondinini, C.; Pettorelli, N.; Mora, B.; Leidner, A.; Szantoi, Z.; Buchanan, G.; Dech, S.; Dwyer, J.; Herold, M.; et al. Free and open-access satellite data are key to biodiversity Conservation. Biol. Conserv. 2015, 182, 173–176. [Google Scholar] [CrossRef]
  46. Karasov, O.; Külvik, M.; Burdun, I. Deconstructing landscape pattern: Applications of remote sensing to physiognomic landscape mapping. GeoJournal 2021, 86, 529–555. [Google Scholar] [CrossRef]
  47. Delgado-Artés, R.; Garófano-Gómez, V.; Oliver-Villanueva, J.V.; Rojas-Briales, E. Land use/cover change analysis in the Medi-terranean region: A regional case study of forest evolution in Castelló (Spain) over 50 years. Land Use Policy 2022, 114, 105967. [Google Scholar] [CrossRef]
  48. Kadmon, R.; Harari-Kremer, R. Studying long-term vegetation dynamics using digital processing of historical aerial photo-graphs. Remote Sens. Environ. 1999, 68, 164–176. [Google Scholar] [CrossRef]
  49. Rhoades, E.L.; O’Neal, M.A.; Pizzuto, J.E. Quantifying bank erosion on the South River from 1937 to 2005, and its importance in assessing Hg contamination. Appl. Geogr. 2009, 29, 125–134. [Google Scholar] [CrossRef]
  50. Nachtergaele, J.; Poesen, J. Assessment of soil losses by ephemeral gully erosion using high-altitude (stereo) aerial photographs. Earth Surf. Process. Landf. J. Br. Geomorphol. Res. Group 1999, 24, 693–706. [Google Scholar] [CrossRef]
  51. Ries, J.; Marzolff, I. Identification of sediment sources by large-scale aerial photography taken from a monitoring blimp. Phys. Chem. Earth 1997, 22, 295–302. [Google Scholar] [CrossRef]
  52. Gennaretti, F.; Ripa, M.N.; Gobattoni, F.; Pelorosso, L.B.R. A methodology proposal for land cover change analysis using historical aerial photos. J. Geogr. Reg. Plan. 2011, 4, 542. [Google Scholar]
  53. Vandekerckhove, L.; Poesen, J.; Govers, G. Medium-term gully headcut retreat rates in Southeast Spain determined from aerial photographs and ground measurements. Catena 2003, 50, 329–352. [Google Scholar] [CrossRef]
  54. Eurostat News Release. GDP per Capita in EU Regions. 2020 (38/2020). Available online: https://ec.europa.eu/eurostat/documents/2995521/10474907/1-05032020-AP-EN.pdf/81807e19-e4c8-2e53-c98a-933f5bf30f58 (accessed on 8 July 2024).
  55. Kampas, G.; Gkiougkis, I.; Panagopoulos, A.; Pliakas, F.-K.; Diamantis, I. Assessment of a Coastal Aquifer in the Framework of Conjunctive Use of Surface Water and Groundwater—The Case of the River Nestos Western Delta, NE Greece. Hydrology 2022, 9, 172. [Google Scholar] [CrossRef]
  56. Mirli, A.; Kamidis, N.; Latinopoulos, D.; Kagkalou, I. Description of Ecosystem Services of Nestos Delta lagoons, a case study. In Proceedings of the 6th IAHR Europe Congress, Warsaw, Poland, 30 June–2 July 2020. [Google Scholar]
  57. Koutrakis, M.; Sapounidis, A.; Lachouvaris, D.; Chariskos, D.; Mirli, A. Fish assemblages of two adjacent coastal lagoons in river Nestos delta (NE Greece). Management 2010, 16, 171–196. [Google Scholar]
  58. Orfanidis, S.; Pinna, M.; Sabetta, L.; Stamatis, N.; Nakou, K. Variation of structural and functional metrics in macrophyte communities within two habitats of eastern Mediterranean coastal lagoons: Natural versus human effects. Aquat. Conserv. Mar. Freshw. Ecosyst. 2008, 18, S45–S61. [Google Scholar] [CrossRef]
  59. Theocharis, V.; Sylaios, G.; Stamatis, N. Water quality variability in two coastal lagoons in Northern Greece. Fresen. Environ. Bull. 2000, 9, 30–35. [Google Scholar]
  60. The Settlement of Refugees in Macedonia 1912–1924 (Dimitris Lithoxoou). Available online: https://www.lithoksou.net/2020/11/prosfiges-makedonia.html (accessed on 15 March 2024). (In Greek).
  61. National Gazette 882/1993. Available online: https://www.eetaa.gr/eetaa/metaboles/fek/1993/fek_882b_1993.pdf (accessed on 21 March 2024). (In Greek).
  62. Mas, J.-F. Monitoring land-cover changes: A comparison of change detection techniques. Int. J. Remote Sens. 1999, 20, 139–152. [Google Scholar] [CrossRef]
  63. El-Hattab, M.M. Applying post classification change detection technique to monitor an Egyptian coastal zone (Abu Qir Bay). Egypt. J. Remote Sens. Space Sci. 2016, 19, 23–36. [Google Scholar] [CrossRef]
  64. Wu, C.; Du, B.; Cui, X.; Zhang, L. A post-classification change detection method based on iterative slow feature analysis and Bayesian soft fusion. Remote Sens. Environ. 2017, 199, 241–255. [Google Scholar] [CrossRef]
  65. Singh, A. Digital Change Detection Techniques Using Remotely-Sensed Data. Int. J. Remote Sens. 1989, 10, 989–1003. [Google Scholar] [CrossRef]
  66. Coppin, P.; Jonckheere, I.; Nackaerts, K.; Muys, B.; Lambin, E. Digital change detection methods in ecosystem monitoring: A review. Int. J. Remote Sens. 2004, 25, 1565–1596. [Google Scholar] [CrossRef]
  67. Serra, P.; Pons, X.; Saurí, D. Post-classification change detection with data from different sensors: Some accuracy considerations. Int. J. Remote Sens. 2003, 24, 3311–3340. [Google Scholar] [CrossRef]
  68. Costanza, R.; de Groot, R.; Sutton, P.; van der Ploeg, S.; Anderson, S.J.; Kubiszewski, I.; Farber, S.; Turner, R.K. Changes in the global value of ecosystem services. Glob. Environ. Chang. 2014, 26, 152–158. [Google Scholar] [CrossRef]
  69. Fastelli, P.; Marcelli, M.; Guerranti, C.; Renzi, M. Recent Changes of Ecosystem Surfaces and Their Services Value in a Medi-terranean Costal Protected Area: The Role of Wetlands. Thalassas 2018, 34, 233–245. [Google Scholar] [CrossRef]
  70. Aretano, R.; Petrosillo, I.; Zaccarelli, N.; Semeraro, T.; Zurlini, G. People Perception of Landscape Change Effects on Ecosystem Services in Small Mediterranean Islands: A Combination of Subjective and Objective Assessments. Landsc. Urban Plan. 2013, 112, 63–73. [Google Scholar] [CrossRef]
  71. Mirli, A.; Kamidis, N.; Latinopoulos, D.; Kagkalou, I. Assessing the Ecosystem Services of Nestos Delta lagoons—Greece: Coupling with sustainability indicators. Fresenius Environ. Bull. 2022, 31, 8335–8341. [Google Scholar]
  72. Kreuter, U.P.; Harris, H.G.; Matlock, M.D.; Lacey, R.E. Change in ecosystem service values in the San Antonio area, Texas. Ecol. Econ. 2001, 39, 333–346. [Google Scholar] [CrossRef]
  73. Vatitsi, K.; Ioannidou, N.; Mirli, A.; Siachalou, S.; Kagalou, I.; Latinopoulos, D.; Mallinis, G. LULC Change Effects on Environmental Quality and Ecosystem Services Using EO Data in Two Rural River Basins in Thrace, Greece. Land 2023, 12, 1140. [Google Scholar] [CrossRef]
  74. Ruiz-Luna, A.; Berlanga-Robles, C.A. Land use, land cover changes and coastal lagoon surface reduction associated with urban growth in northwest Mexico. Landsc. Ecol. 2003, 18, 159–171. [Google Scholar] [CrossRef]
  75. Li, W.; Lin, K.; Zhao, T.; Lan, T.; Chen, X.; Du, H.; Chen, H. Risk assessment and sensitivity analysis of flash floods in ungauged basins using coupled hydrologic and hydrodynamic models. J. Hydrol. 2019, 572, 108–120. [Google Scholar] [CrossRef]
  76. Rodríguez-Gallego, L.; Achkar, M.; Defeo, O.; Vidal, L.; Meerhoff, E.; Conde, D. Effects of land use changes on eutrophication indicators in five coastal lagoons of the Southwestern Atlantic Ocean. Estuar. Coast. Shelf Sci. 2017, 188, 116–126. [Google Scholar] [CrossRef]
  77. Gaglio, M.; Aschonitis, V.G.; Gissi, E.; Castaldelli, G.; Fano, E.A. Land Use Change Effects on Ecosystem Services of River Deltas and Coastal Wetlands: Case Study in Volano–Mesola–Goro in Po River Delta (Italy). Wetl. Ecol. Manag. 2016, 25, 67–86. [Google Scholar] [CrossRef]
  78. Camacho, V.V.; Ruiz-Luna, A.; Berlanga-Robles, A.C. Effects of land use changes on ecosystem services value provided by coastal wetlands: Recent and future landscape scenarios. J. Coast Zone Manag. 2016, 19, 418. [Google Scholar] [CrossRef]
  79. Mallinis, G.; Emmanoloudis, D.; Giannakopoulos, V.; Maris, F.; Koutsias, N. Mapping and Interpreting Historical Land Cov-er/Land Use Changes in a Natura 2000 Site Using Earth Observational Data: The Case of Nestos Delta, Greece. Appl. Geogr. 2011, 31, 312–320. [Google Scholar] [CrossRef]
  80. Zoidou, M.; Kokkos, N.; Sylaios, G. Dynamics of Water, Salt and Nutrients Exchange at the Inlets of Three Coastal Lagoons. J. Mar. Sci. Eng. 2022, 10, 205. [Google Scholar] [CrossRef]
  81. Sylaios, G.K.; Tsihrintzis, V.A.; Akratos, C.; Haralambidou, K. Quantification of water, salt and nutrient exchange processes at the mouth of a mediterranean coastal lagoon. Environ. Monit. Assess. 2006, 119, 275–301. [Google Scholar] [CrossRef] [PubMed]
  82. Li, X.; Yu, X.; Jiang, L.; Li, W.; Liu, Y.; Hou, X. How important are the wetlands in the middle-lower Yangtze River region: An ecosystem service valuation approach. Ecosyst. Serv. 2014, 10, 54–60. [Google Scholar] [CrossRef]
  83. Duku, E.; Mattah, P.A.D.; Angnuureng, D.B. Assessment of land use/land cover change and morphometric parameters in the keta lagoon complex Ramsar site, Ghana. Water 2021, 13, 2537. [Google Scholar] [CrossRef]
  84. Sylaios, G.; Kamidis, N. Environmental Impacts of Large-Scale Hydropower Projects and Applied Ecohydrology Solutions for Watershed Restoration: The Case of Nestos River, Northern Greece. In The Rivers of Greece. The Handbook of Environmental Chemistry; Skoulikidis, N., Dimitriou, E., Karaouzas, I., Eds.; Springer: Berlin/Heidelberg, Germany, 2017; Volume 59. [Google Scholar] [CrossRef]
  85. Xeidakis, G.S.; Georgoulas, A.; Kotsovinos, N.; Varagouli, E. Human interventions and degradation of the coastal zone of Nestos River Delta, North Aegean Sea, N. Greece. In Geologically Active, Proceedings of the 11th International Congress of the IAEG; CRC Press: Boca Raton, FL, USA, 2010. [Google Scholar]
  86. Andreadaki, M.; Hrissanthou, V.; Kotsovinos, N. Calculation of sediment reduction at the outlet of Nestos river basin due to the dams. In Proceedings of the IV International Symposium on Transboundary Waters Management, Thessaloniki, Greece, 15–18 October 2008; pp. 15–18. [Google Scholar]
  87. Dimopoulos, T.; Helfenstein, J.; Kreuzer, A.; Mohr, F.; Sentas, S.; Giannelis, R.; Kizos, T. Different responses to mega-trends in less favorable farming systems. Continuation and abandonment of farming land on the islands of Lesvos and Lemnos, Greece. Land Use Policy 2023, 124, 106435. [Google Scholar] [CrossRef]
  88. Meyer, M.A.; Früh-Müller, A. Patterns and drivers of recent agricultural land-use change in Southern Germany. Land Use Policy 2020, 99, 104959. [Google Scholar] [CrossRef]
  89. Feehan, J.; di Giuseppe, P.; Garcia, A.A.; Giuliano, G.; Pagés, Y.; Pecenka, R.; Weber, T.M. EU CAP Network Focus Group. Starting Paper: Recovery of Abandoned Agricultural Lands Land Abandonment. Mini Paper 1: Identification and Assessment of Viable Business Models. 2023. Available online: https://eu-cap-network.ec.europa.eu/recovery-abandoned-agricultural-lands_en#section--resources (accessed on 8 June 2024).
  90. Quintas-Soriano, C.; Buerkert, A.; Plieninger, T. Effects of land abandonment on nature contributions to people and good quality of life components in the Mediterranean region: A review. Land Use Policy 2022, 116, 106053. [Google Scholar] [CrossRef]
  91. Perpiña Castillo, C.; Coll Aliaga, E.; Lavalle, C.; Martínez Llario, J.C. An assessment and spatial modelling of agricultural land abandonment in Spain (2015–2030). Sustainability 2020, 12, 560. [Google Scholar] [CrossRef]
  92. Pu, L.; Lu, C.; Yang, X.; Chen, X. Spatio-Temporal variation of the ecosystem service value in Qilian Mountain National Park (Gansu area) based on land use. Land 2023, 12, 201. [Google Scholar] [CrossRef]
  93. Xofis, P.; Spiliotis, J.A.; Chatzigiovanakis, S.; Chrysomalidou, A.S. Long-Term Monitoring of Vegetation Dynamics in the Rhodopi Mountain Range National Park-Greece. Forests 2022, 13, 377. [Google Scholar] [CrossRef]
  94. Li, L.; Tang, H.; Lei, J.; Song, X. Spatial autocorrelation in land use type and ecosystem service value in Hainan Tropical Rain Forest National Park. Ecol. Indic. 2022, 137, 108727. [Google Scholar] [CrossRef]
  95. Mirli, A.; Latinopoulos, D.; Kagalou, I. Knowledge gaps in NBS imple-mentation for managing Water Quality challenges and SDG approaching in a Mediterranean area. In Proceedings of the 39th IAHR World Congress, Granada, Spain, 19–24 June 2022. [Google Scholar] [CrossRef]
  96. Ramsar COP8 Resolution VIII.14. New Guidelines for management planning for Ramsar sites and other wetlands. In Proceedings of the 8th Meeting of the Conference of the Contracting Parties to the Convention on Wetlands (Ramsar, Iran, 1971), Valencia, Spain, 18–26 November 2002.
  97. Scholte, S.S.K.; van Teeffelen, A.J.A.; Verburg, P.H. Integrating socio-cultural perspectives into ecosystem service valuation: A review of concepts and methods. Ecol. Econ. 2015, 114, 67–78. [Google Scholar] [CrossRef]
  98. Alamanos, A.; Rolston, A.; Papaioannou, G. Development of a Decision Support System for Sustainable Environmental Management and Stakeholder Engagement. Hydrology 2021, 8, 40. [Google Scholar] [CrossRef]
Figure 1. Study area: Nestos Delta lagoons.
Land 13 01277 g001
Figure 2. Chronological time-flow representation of Nestos River and Delta historical events.
Land 13 01277 g002
Figure 3. Historical LULC changes in ND lagoons (1945–2015), using CLC codes.
Land 13 01277 g003
Figure 4. Biome transformations in each lagoon at each time step.
Land 13 01277 g004
Figure 5. Graphical representation of the links of Biomes with ES and their reference values.
Land 13 01277 g005
Table 1. Aerial photograph and satellite image details.
YearNo of Pictures UsedPixel (m)Color
194542.6black and white
1960100.3black and white
197480.4black and white
1989170.2black and white
2002Google Earth2color
2015Google Earth4color
Table 2. Correlation of CLC codes to Biomes and their values.
Class NameCLC CodeBiomes2011 Values (USD/Ha/Year)
Discontinuous Urban Fabric112Urban6661
Port Areas123
Airports124
Dump Sites132
Sport And Leisure Facilities142
Non-Irrigated Arable Land211Cropland5567
Permanently Irrigated Land212
Rice Fields213
Broad-Leaved Forest311Temperate/Boreal3137
Beaches, Dunes, Sand Plains331Tidal Marsh/Mangroves193,843
Salt Marshes421Swamps/Floodplains25,681
Coastal Lagoons521Estuaries28,916
Sea And Ocean523Shelf2222
Table 3. Land Use Change in ha and percentage (%) per lagoon (1945–2015).
BiomesVassovaErateinoAgiasmaKeramoti
Estuaries−49.1−38.3−23.0−6.916.14.6−44.2−26.0
Shelf1.11.231.011.836.313.5−28.6−26.9
Temperate 6.071.4
Tidal Marsh−59.8−73.6−29.3−41.3−29.8−44.1−22.6−50.1
Swamps/Floodplains−93.6−34.9−178.0−31.0−175.8−43.032.59.7
Cropland201.7n/a 199.683.4145.4n/a 1−33.9−35.9
Urban 99.8n/a 17.8n/a 190.81010.6
1 Due to the absence of the Biome in 1945, this calculation could not be performed.
Table 4. ES Values changes in USD and percentage (%) per lagoon (1945–2015).
ESVassovaErateinoAgiasmaKeramoti
Climate Regulation95754.8331,3866.37−13,251−3.5570,50524.57
Disturbance Regulation−600,235−48.47−688,517−32.89−684,193−43.24−23,851−1.93
Water Regulation−526,535−34.90−996,463−30.97−985,255−42.98183,6069.84
Water Supply−30,399−14.57−68,487−18.60−49,795−19.99−26,660−11.58
Erosion Control−1,704,050−39.83−1,152,429−11.31−151,005−1.47−1,127,827−21.01
Soil Formation107,239n/a 152,96883.3877,333n/a 1−17,968−35.61
Nutrient Cycling−161,317−24.77−245,149−16.29−230,832−18.73−1339−0.17
Waste Treatment−9,891,851−70.74−5,250,656−39.52−5,299,821−43.50−3,574,230−42.79
Pollination4396n/a 1217183.383170n/a 1−740−35.86
Biological Control−82,384−31.66−163,859−29.15−159,926−39.7829,5279.04
Habitat/Refugia−1,264,288−60.84−944,027−35.10−938,712−42.09−310,552−19.05
Food Production227,39439.8637,5312.46238,60819.97−190,160−21.31
Raw Materials−28,405−16.14−84,819−23.20−73,234−29.3424481.11
Genetic Resources173,351231.0772,87527.71127,729102.04−47,114−26.74
Recreation−334,728−41.53117,2047.72−393,316−34.42587,09165.62
Cultural−189,097−34.34−352,655−29.82−345,944−40.4360,0068.81
1 Due to the absence of the ES in 1945, this calculation could not be performed.
Disclaimer/Publisher’s Note: The statements, opinions and data contained in all publications are solely those of the individual author(s) and contributor(s) and not of MDPI and/or the editor(s). MDPI and/or the editor(s) disclaim responsibility for any injury to people or property resulting from any ideas, methods, instructions or products referred to in the content.

