Article

Identifying Trade-Offs and Synergies of Production–Living–Ecological Functions and Their Drivers: The Case of Yangtze River Urban Agglomerations in China

1
Changjiang Institute of Survey, Planning, Design and Research, Wuhan 430074, China
2
Key Laboratory of Changjiang Regulation and Protection of Ministry of Water Resources, Wuhan 430074, China
3
School of Public Administration, China University of Geosciences, Wuhan 430074, China
4
China Key Laboratory of Rule of Law Research, Ministry of Natural Resources, Wuhan 430074, China
5
Wuhan Economic and Technological Development Zone (Hannan District) Natural Resources and Planning Bureau, Wuhan 430056, China
*
Author to whom correspondence should be addressed.
Land 2024, 13(8), 1322; https://doi.org/10.3390/land13081322 (registering DOI)
Submission received: 16 July 2024 / Revised: 13 August 2024 / Accepted: 13 August 2024 / Published: 21 August 2024
(This article belongs to the Special Issue Urbanization and Ecological Sustainability)

Abstract

:
Urban agglomerations are products of urban development, and their regional spaces and functions are more diverse than other cities, which have very high spatial and functional complexity. It is important to clarify the relationships between production–living–ecological (PLE) functions in urban agglomerations to achieve sustainable development. In this study, we took the Middle Reaches of the Yangtze River Urban Agglomerations (MRYRUA) as an example to construct an evaluation index system of regional PLE functions in urban agglomerations. Then, the Pearson correlation model and geographically weighted regression were applied to investigate the relationships between PLE functions and their driving forces. The results showed that the PLE functions in the MRYRUA increased from 2008 to 2018, with the level of the ecological function being higher than the production and living functions. The relationships among PLE functions were dominated by synergies in most cities, though trade-offs had become more evident in the last few years for the whole study area. Trade-offs and synergies among PLE functions were influenced by both natural and socioeconomic factors, with the latter having a stronger effect. Our findings provide a reference for understanding the spatial variations and trade-offs among PLE functions in MRYRUA as well as for balancing the development of PLE functions.

1. Introduction

With the rapid urbanization and industrialization, the contradiction between the human–land relationships is gradually becoming more prominent [1]. To achieve rapid economic growth, the quality of human life and the environment are often compromised [2]. Generally, as economic development progresses, production functions tend to increase. However, living and ecological functions often decline due to the environmental impacts of production, leading to a growing gap between production–living–ecological (PLE) functions. PLE functions refer to the products and services provided by human–land systems under the integrated action of natural endowment and human activities [3]. As a whole, PLE functions reflect economic, social, and ecological development in the region [4], thereby representing the functioning state of human–land systems from multiple dimensions [5] (Figure 1). As the center for regional economic development, urban agglomerations are becoming diversified and complex human–land systems that require coordinated socioeconomic and environmental development [6,7]. Therefore, exploring sustainable development patterns and coordinating functional relationships has become a hot topic in urban agglomerations [8,9]. China’s urban agglomerations are currently in a new stage of exploring new development models and making great adjustments to the spatial structure and functions. Multiple factors, such as spatial planning, elemental inputs, and land use intensity, play a vital role in the coordinated development of urban PLE functions [10]. The emphasis on one function can lead to the trade-offs of other functions, and the coordinated development of PLE functions puts forward higher requirements for the rational formulation of policies. Therefore, coordinating PLE functions and clarifying their relationships to promote synergistic development have become important paths to alleviate the conflict between humans and nature.
Although there is no clear definition of PLE functions at present, land use functions have been studied extensively. Research on land use functions started with agriculture and then developed to the multi-function of territorial space, as well as exploring the multi-functions of rural development [3], the impact of multi-function change of land use, and scenario simulation and prediction [11,12,13]. Under the impact of rapid urbanization, economic and social development are unbalanced, and land use functions are separated. Therefore, many studies focus on exploring the classification and spatial evolution of land use functions [14]. Since the 19th National Congress of the Communist Party of China, the Chinese government has set out the overall requirements for promoting the coordinated development of production–living–ecological space, so as to effectively promote the construction of urban ecological civilization and sustainable development [15]. Since then, most scholars agree that land use functions can be divided into production, living, and ecological functions [16]. Specifically, the production function of the human–land system produces material for social development, and it is the power and basis for the existence and development of human society. Living function refers to the spatial, material, and spiritual security functions human beings perform through land use, including residence, consumption, and entertainment, all of which represent human survival quality and enhance the production function. Ecological function plays an important role in providing a stable environment and sufficient carrying capacity and is the guarantee of production and living functions [17]. The PLE functions have become a hot topic in the research on optimizing zoning of territorial space and regional sustainable development [18].
The existing studies on the PLE space are focused on the pattern change of territorial space, including the evolution of the PLE space pattern [19], as well as the identification and prediction of the PLE space conflict [15,18]. Additionally, some studies have conducted the evaluation and spatial-temporal change analysis of the PLE functions [20], the analysis of potential conflicts in land use [21], the spatial change of PLE in rural areas [16], the coupling and coordination relationships among PLE functions, etc. [22]. The PLE functions change with the development of human activities and nature, which are influenced by both natural and socio-economic factors. Previous studies have explored the factors affecting the spatiotemporal change of land use functions from the aspects of economic development, social life, environmental restrictions, and geographical location [23].
By exploring the driving factors of the relationships between PLE functions, we can gain a better understanding of the changing territorial spatial functions, identify the potential factors for regional development, and provide references coordinating humans and nature in the region through decision making. There is a complex relationship between PLE functions in terms of synergies and trade-offs [24]. The synergistic relationship indicates that functions promote each other, while the trade-off relationship suggests the enhancement of one function will lead to the weakening of another, showing a mutually inhibiting effect [25]. There is no unified standard for measuring the trade-off and synergistic relationships between multiple functions. The related studies show that the mechanical equilibrium model, spatial autocorrelation model [26], Spearman rank correlation analysis [27], coupled coordination model [4], and the Pearson coefficient method [28] have been used to measure trade-offs and synergistic relationships. The Pearson coefficient method has the advantages of simplicity and low data requirements, which makes it an ideal method for investigating relationships between multiple functions. For example, Zhang et al. [29] adopted the Pearson correlation coefficient method to measure the trade-off and synergistic relationships among land use functions and proposed a scheme to optimize the spatial function partition. Fan et al. [30] discussed the spatial differentiation of 12 sub-functions and analyzed the trade-offs among production function, urban–rural living function, and ecological maintenance function to achieve the purpose of scientific land planning. Thus, the Pearson coefficient method was used in this study to analyze the trade-offs and synergistic relationships among PLE functions.
In addition, PLE functions are studied at a variety of scales, including global, national, provincial, and regional [31,32]. The urban agglomerations, however, were less explored in these studies. To accelerate the high-quality development of urban agglomerations, it is of great significance to have the coordinated allocation of regional spatial resources [33], the balancing of human–land conflicts [34], and the identification of land use conflicts [21] in urban agglomerations, which have practical values for the construction of urban ecological civilization and sustainable development [23]. Scholars tend to focus on small- and medium-sized city agglomerations or individual cities, with very little research on super-large urban agglomerations [35]. Thus, this study was conducted at the scale of urban agglomerations and chose the Middle Reaches of the Yangtze River Urban Agglomerations (MRYRUA) as the study area. As one of the national super-large urban agglomerations, the MRYRUA plays an important strategic role in urbanization development in China. However, the rapid urbanization process of the MRYRUA has seriously damaged the urban ecosystem and threatened the sustainable development process [36].
This further hinders the harmonious development of PLE functions and threatens the sustainable development of humans and the environment. The MRYRUA has seen few studies that quantify the connections and interactions among PLE functions, with most focusing only on the distribution of spatial and temporal characteristics.
To fill the above-mentioned research gaps, we aimed to explore the relationships between PLE functions in the MRYRUA and reveal its driving forces. The specific objectives of this paper are as follows: (1) constructing an evaluation indicator system for assessing PLE functions from the three dimensions of production, living, and ecology; (2) measuring and analyzing the trade-offs and synergies among PLE functions; and (3) revealing the driving factors affecting trade-offs and synergies among PLE functions.

2. Materials and Methods

2.1. Study Area

The MRYRUA covers the three provinces of Hubei, Hunan, and Jiangxi, with diverse and complex terrain (Figure 2). The region is high in the west, with flat, wide plains in the central and northeast, and many tributaries feeding into the Yangtze River from the west and south. The MRYRUA is rich in cultivated land, forest land, water resources, and biodiversity, which contributes to the provision of vital ecosystem services in China [37]. The MRYRUA is the largest urban agglomeration in China, consisting of the Wuhan Metropolis, the Poyang Lake Urban Agglomeration, and the Changsha–Zhuzhou–Xiangtan Urban Agglomeration. With absolute location and resource advantages, the MRYRUA has developed rapidly since the Reform and Opening Up, which also brings problems such as industrial pollution and construction land expansion, resulting in frequent land use transition and land use function imbalance [38]. In 2015, to build the MRYRUA into an urban agglomeration with international influence, the Development Plan of the Middle Reaches of the Yangtze River Urban Agglomerations was proposed, which made higher strategic requirements for the development of the region. Research on the relationships between PLE functions in MRYRUA is urgently required for regional functional balance and social coordination development.

2.2. Data Sources

The socio-economic and agricultural statistics were collected from China’s City Statistical Yearbooks (2009–2019), the China Urban and Rural Construction Statistical Yearbook (2009–2019), and the China Regional Economic Statistical Yearbook (2009–2019). Land-Use/Cover Datasets with a 30 m resolution were downloaded from http://doi.org/10.5281/zenodo.4417810 (accessed on 27 August 2021). Net primary productivity (NPP), elevation, precipitation, road data, and river data were obtained from the Data Center for Resources and Environmental Sciences, Chinese Academy of Sciences (RESDC) http://www.resdc.cn (accessed on 27 August 2021). In addition, Jishou City in Hunan Province and Tianxianqian, Shennongjia, and Enshi Cities in Hubei Province were excluded from the study area due to the lack of data but were retained as no-data areas for the integrity of the map.

2.3. Methods

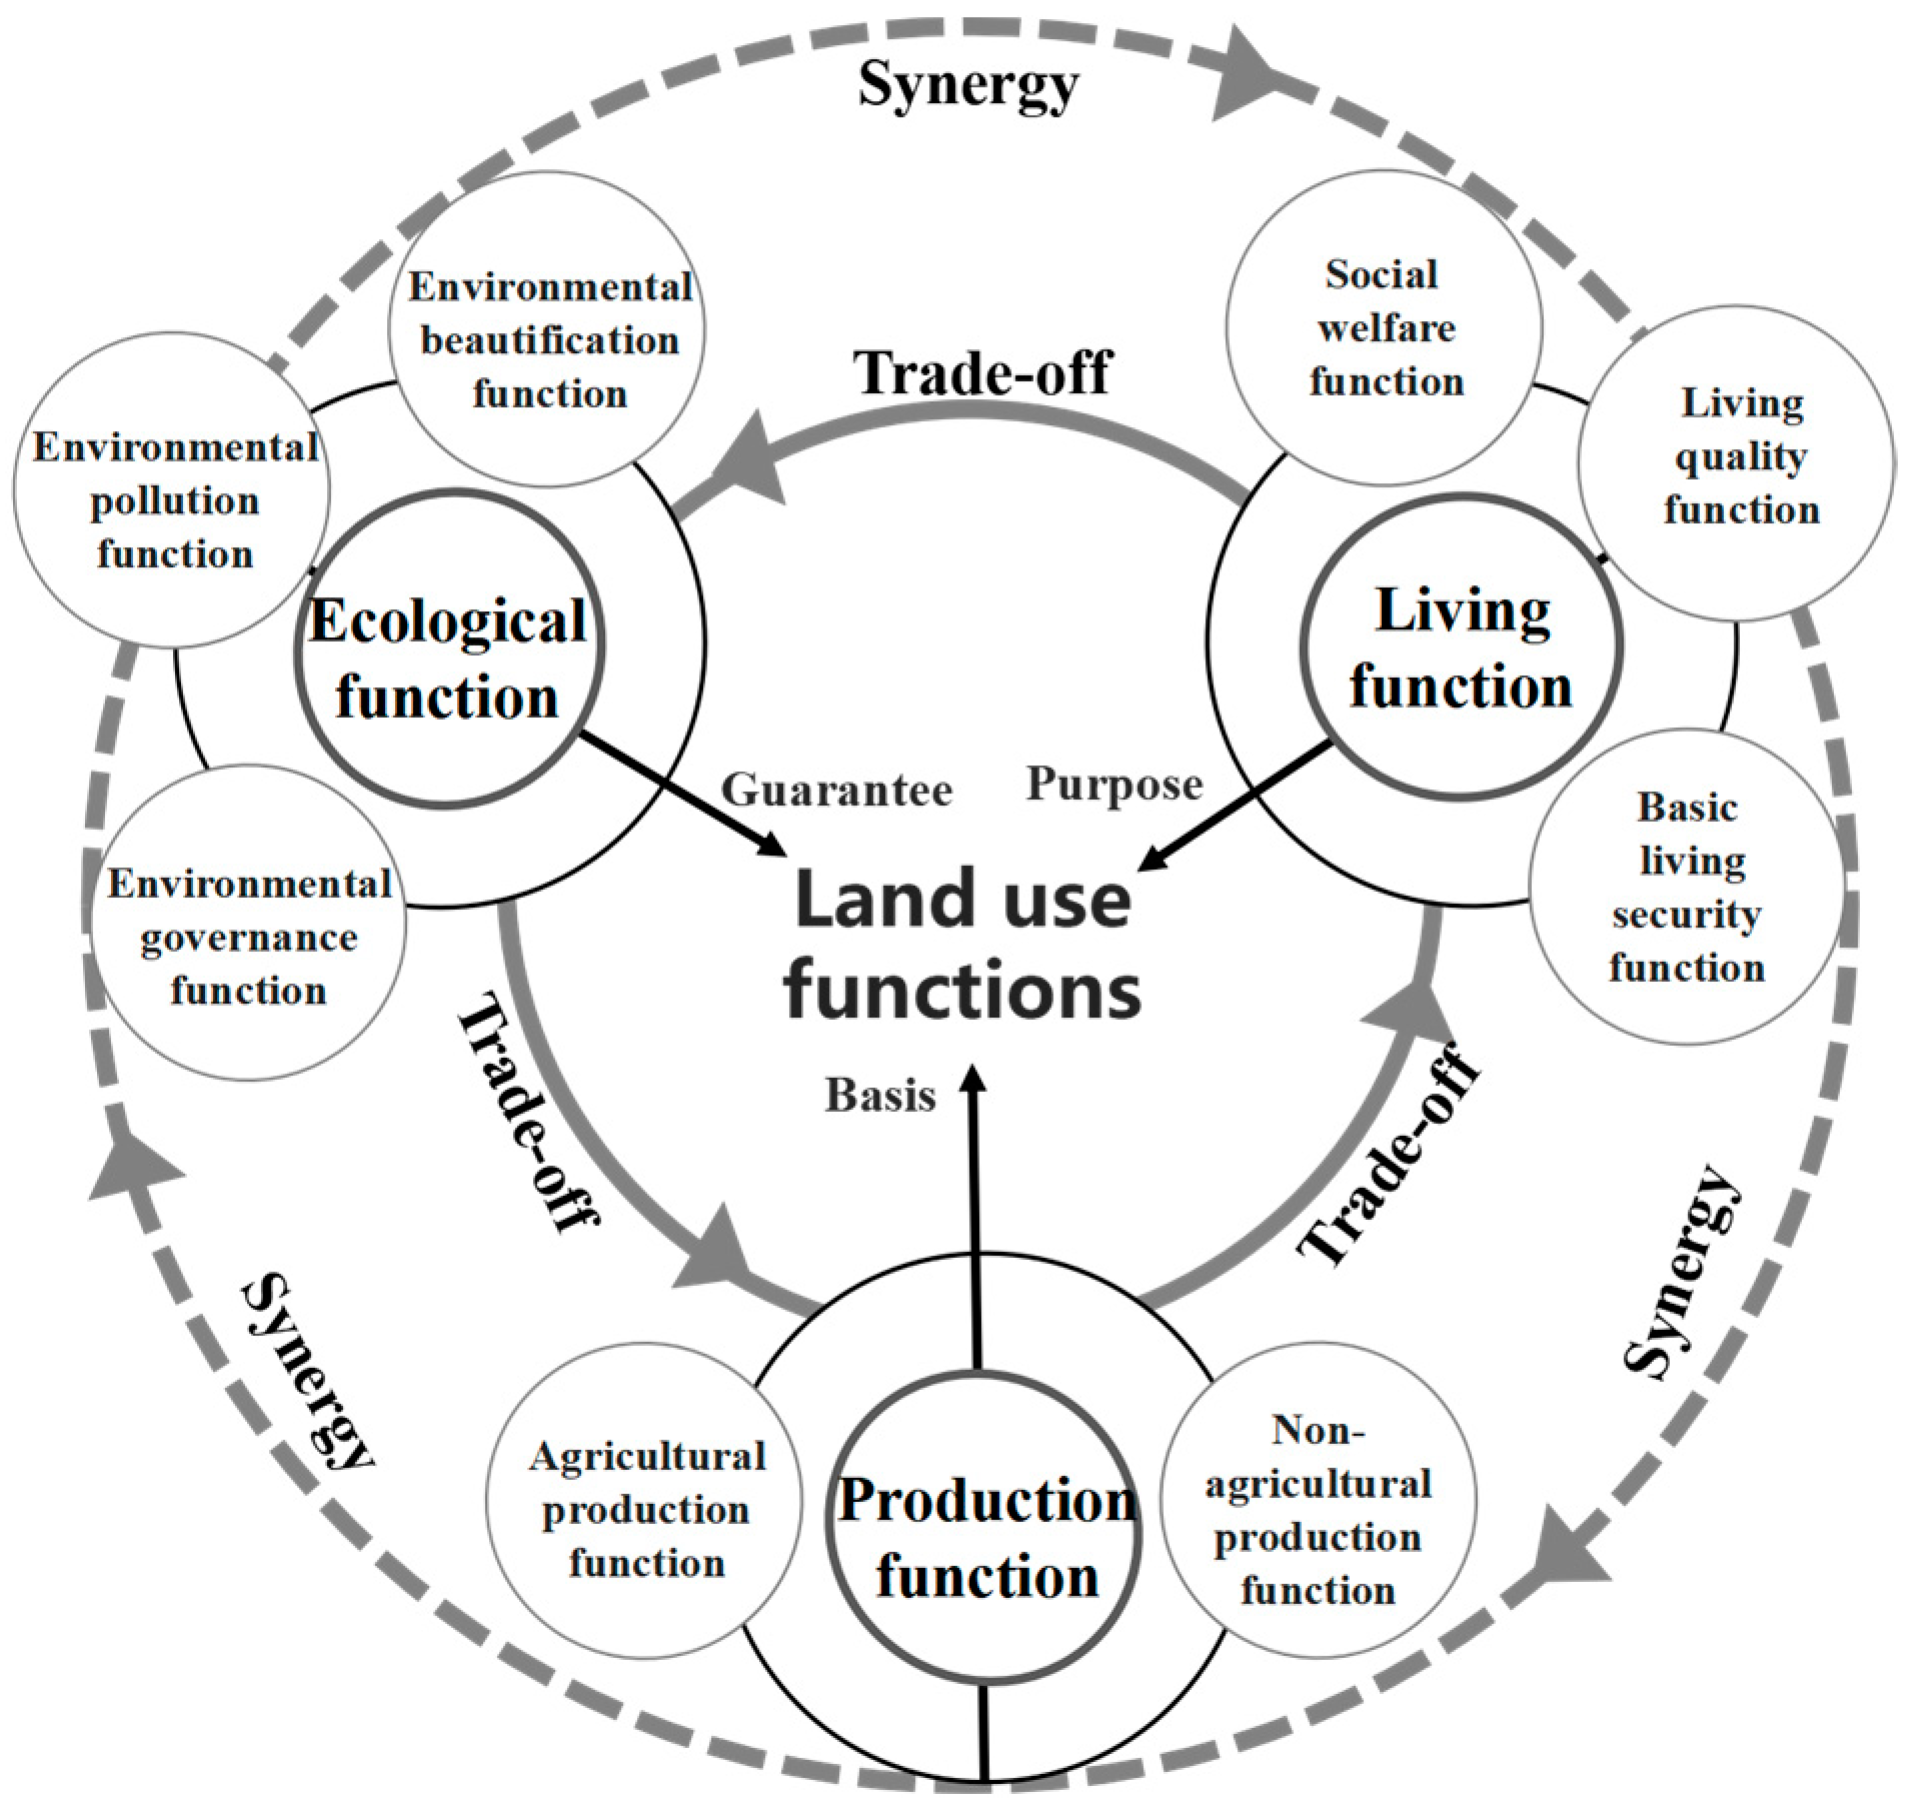
2.3.1. An Indicator System for Assessing PLE Functions

The production function focuses on production activities, including the benefits brought by agricultural and non-agricultural production. The living function focuses on creating a comfortable and safe living environment for human well-being. Environmental pollution, environmental protection, and construction are selected as indicators for measuring ecological function. Drawing on relevant research, we constructed an evaluation index system of PLE functions, which includes eight sub-functions and twenty indicators (Table 1).

2.3.2. PLE Function Evaluation

Before evaluating PLE functions, the initial data for the twenty indicators listed in Table 1 were standardized using the following formula:
Positive   indicator :   y i j = X i j X j m i n X j m a x X j m i n   ( i = 1,2 , 3 , m ; j = 1,2 , 3 , n )
Negative   indicator :   y i j = X j m a x X i j X j m a x X j m i n   ( i = 1,2 , 3 , m ; j = 1,2 , 3 , n )
where y i j is the standardized value; X i j is the initial value of the j-th indicator in year i; X j m i n and X j m a x are the minimum and maximum values of the j-th indicator, respectively; m   is the number of units; and n   is the number of indicators.
Then, the entropy method was adopted to calculate the index weights. It is an objective weight assignment method that determines the weight coefficient based on the information entropy of an index. The smaller the entropy value, the greater the weight, and the greater the impact on the PLE functions of the urban agglomeration, and vice versa. The procedure for calculating the weights can be referred to in the related articles [1]. The formula is as follows:
Q i j = y i j / i = 1 m y i j
E j = k × i = 1 m Q i j × L N Q i j  
where E j is the entropy value of the j-th indicator; k = 1 L N ( m ) . Since Q i j = 0, L N 0 = 0 was treated in the calculation process in this study. Then, the weight for the j-th indicator can be calculated as follows:
w j = 1 E j / j = 1 n ( 1 E j )
where w j is the weight, and 1 E j is the deviation degree of the j-th indicator.
Finally, the values of production, living, and ecological functions can be calculated based on the indicator weights using the following formula:
u n = j = 1 m w j × y i j
where u n represent the value of production, living, and ecological functions, respectively; w j is the weight of the j -th indicator; and y i j is the normalized value of the j -th indicator in the year i.

2.3.3. Trade-Offs and Synergies among PLE Functions

In this study, the Pearson correlation model was applied to identify the trade-offs and synergies between all pair combinations of the production, living, and ecological functions from 2008 to 2018. The trade-off and synergistic relationships between PLE functions were measured according to the direction (positive or negative) of correlation coefficients and the magnitude of their absolute values. The greater the absolute value, the stronger the trade-off/synergistic relationship between the two functions [40]. The Pearson coefficient value can be calculated with the following formula:
P X Y = X E ( X ) Y E ( Y ) X E ( X ) 2 Y E ( Y ) 2
where P X Y is the Pearson correlation coefficients; X and Y are two function variables; and E is the mean value.
In this study, SPSS 27.0 was used to calculate the Pearson correlation coefficient and determine its significance using the T-test. According to the positive and negative coefficients and the magnitude of significance, the trade-off and synergistic relationships between PLE functions were divided into six types (Table 2).

2.3.4. Analysis of the Driving Mechanism

(1)
Selection of driving factors
Combining prior research findings [41], we selected factors from nature and social economy to explore the driving factors of trade-offs and synergies amongst PLE functions. The natural dimension includes topography (e.g., elevation), climate (e.g., precipitation), and net primary productivity, all of which have been demonstrated to have a direct impact on ecological function. Social and economic factors were selected to represent the impact of human behaviors, including geographic locations (e.g., distance to the provincial capital city, road), economic density, and land use degree. Based on the above analyses, eight potential driving factors were selected to investigate their impacts on trade-offs and synergies amongst PLE functions (Table 3).
To further examine how each factor influences the trade-offs and synergies between PLE functions, geographically weighted regression (GWR) was used to reveal the direction and spatial distribution of the impact of each driving factor.
(2)
Geographically Weighted Regression
GWR is a regression model that can detect spatial autocorrelation between variables. It can measure both the magnitude and direction of influence of each driving factor. The expression is as follows:
y k = β 0 ( u k , v k ) + i = 1 n β i ( u k , v k ) x k i + c k
where y k is the weighted regression value of the k-th sample; β 0 is the intercept; ( u k , v k ) is the geographic center coordinate of the k-th sample; β 0 ( u k , v k ) is the constant term; β i ( u k , v k ) is the coefficient of the k-th independent variable of i -th driving factor; x k i is the i -th independent variable of k-th sample; and c k is the error term.

3. Results

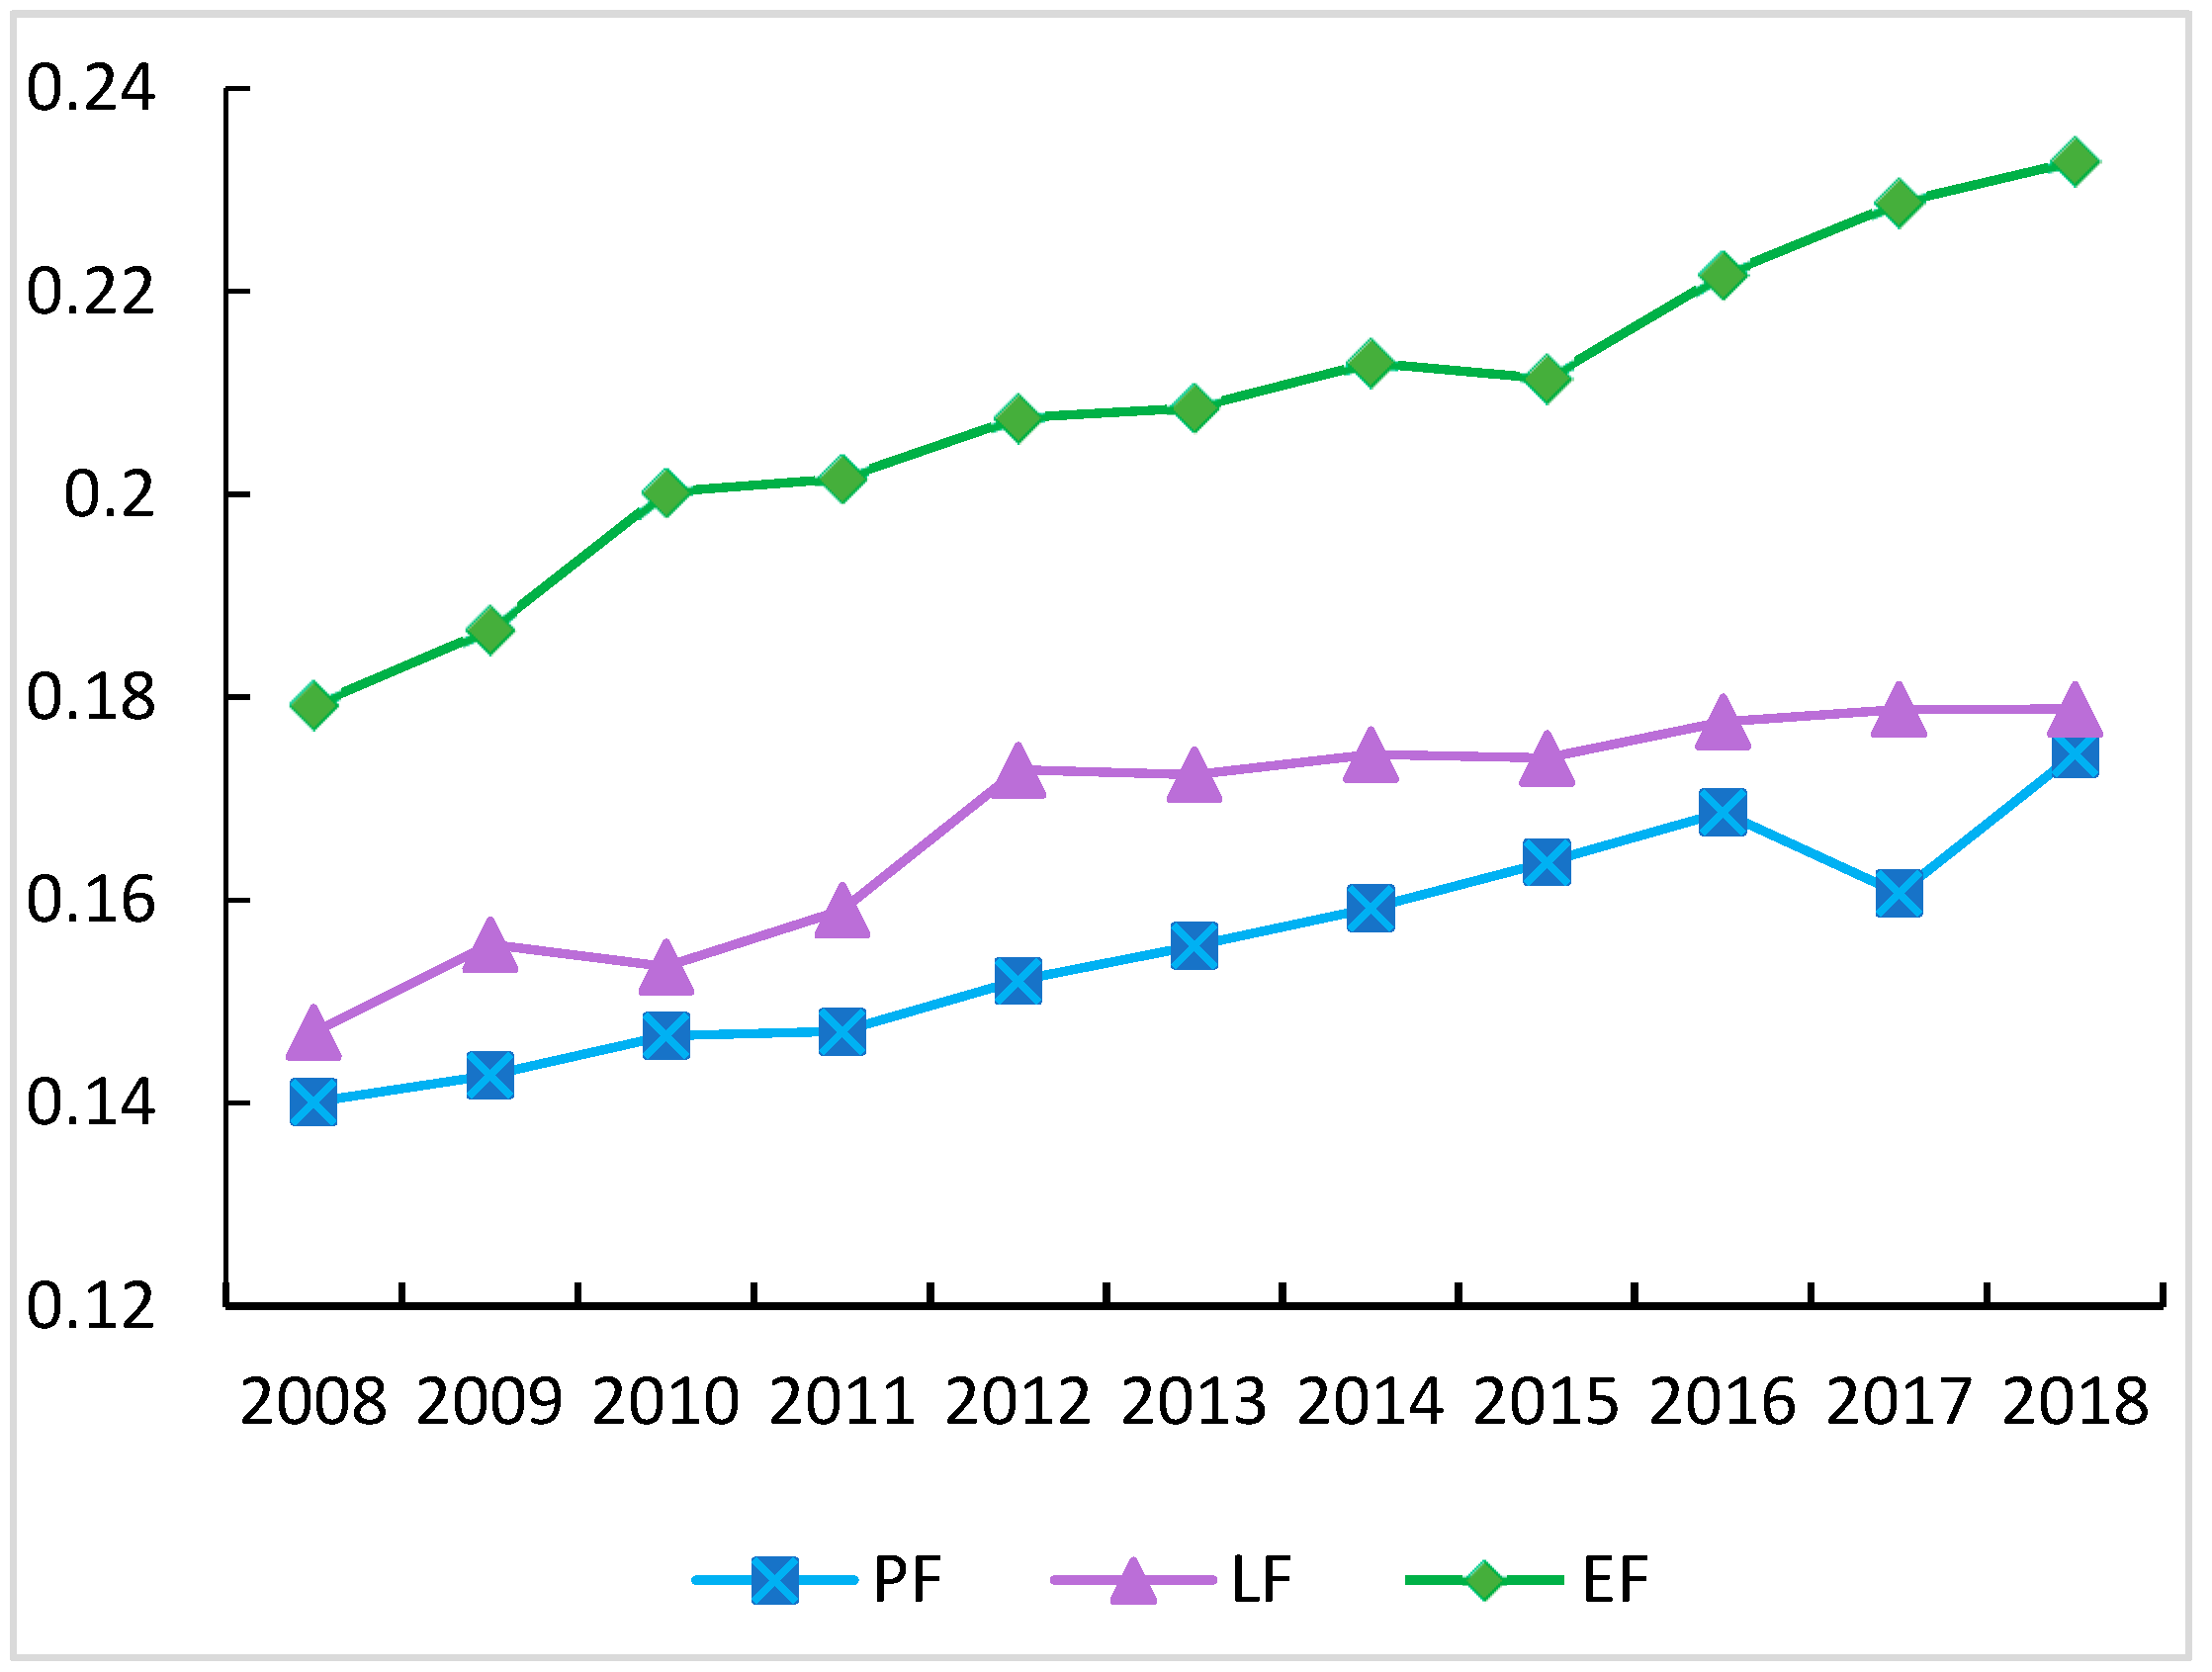
3.1. Spatiotemporal Characteristics of PLE Functions

Figure 3 shows the temporal variation of PLE functions from 2008 to 2018, which exhibited a general upward trend. The average value of the production function increased from 0.14 in 2008 to 0.17 in 2018, the living function increased from 0.15 to 0.18, and the ecological function was the highest, with the lowest score of 0.20 in 2008 and 0.23 in 2018. The increase in the PLE functions was relatively slight, and the trend was relatively stable.
Figure 4 depicts the spatial patterns of PLE functions with three levels of low, medium, and high from 2008 to 2018. Regions with high production function values were mainly distributed in provincial capitals and cities in the west and north of the MRYRUA. For example, Yichang and Xiangyang have large economic volumes, and their production functions have increased from 2012 to 2015. Production functions in most cities reached a medium level from 2015 to 2018, and the proportion of cities with a high level increased from 13.89% in 2015 to 30.56% in 2018. The high value of living function was mainly distributed in the northeast and eastern cities, especially in the southeastern cities of Jiangxi Province. Since 2012, the living function of all cities in the study area has reached a medium level or above, and the number of cities with a high level has steadily increased. The areas with high values of ecological function were mainly distributed in the southeastern and southern cities. By 2018, almost half of the cities had achieved a high level, which indicated that ecological protection was receiving increasing attention in urban agglomerations.

3.2. Spatial Patterns of Trade-Offs and Synergies among PLE Functions

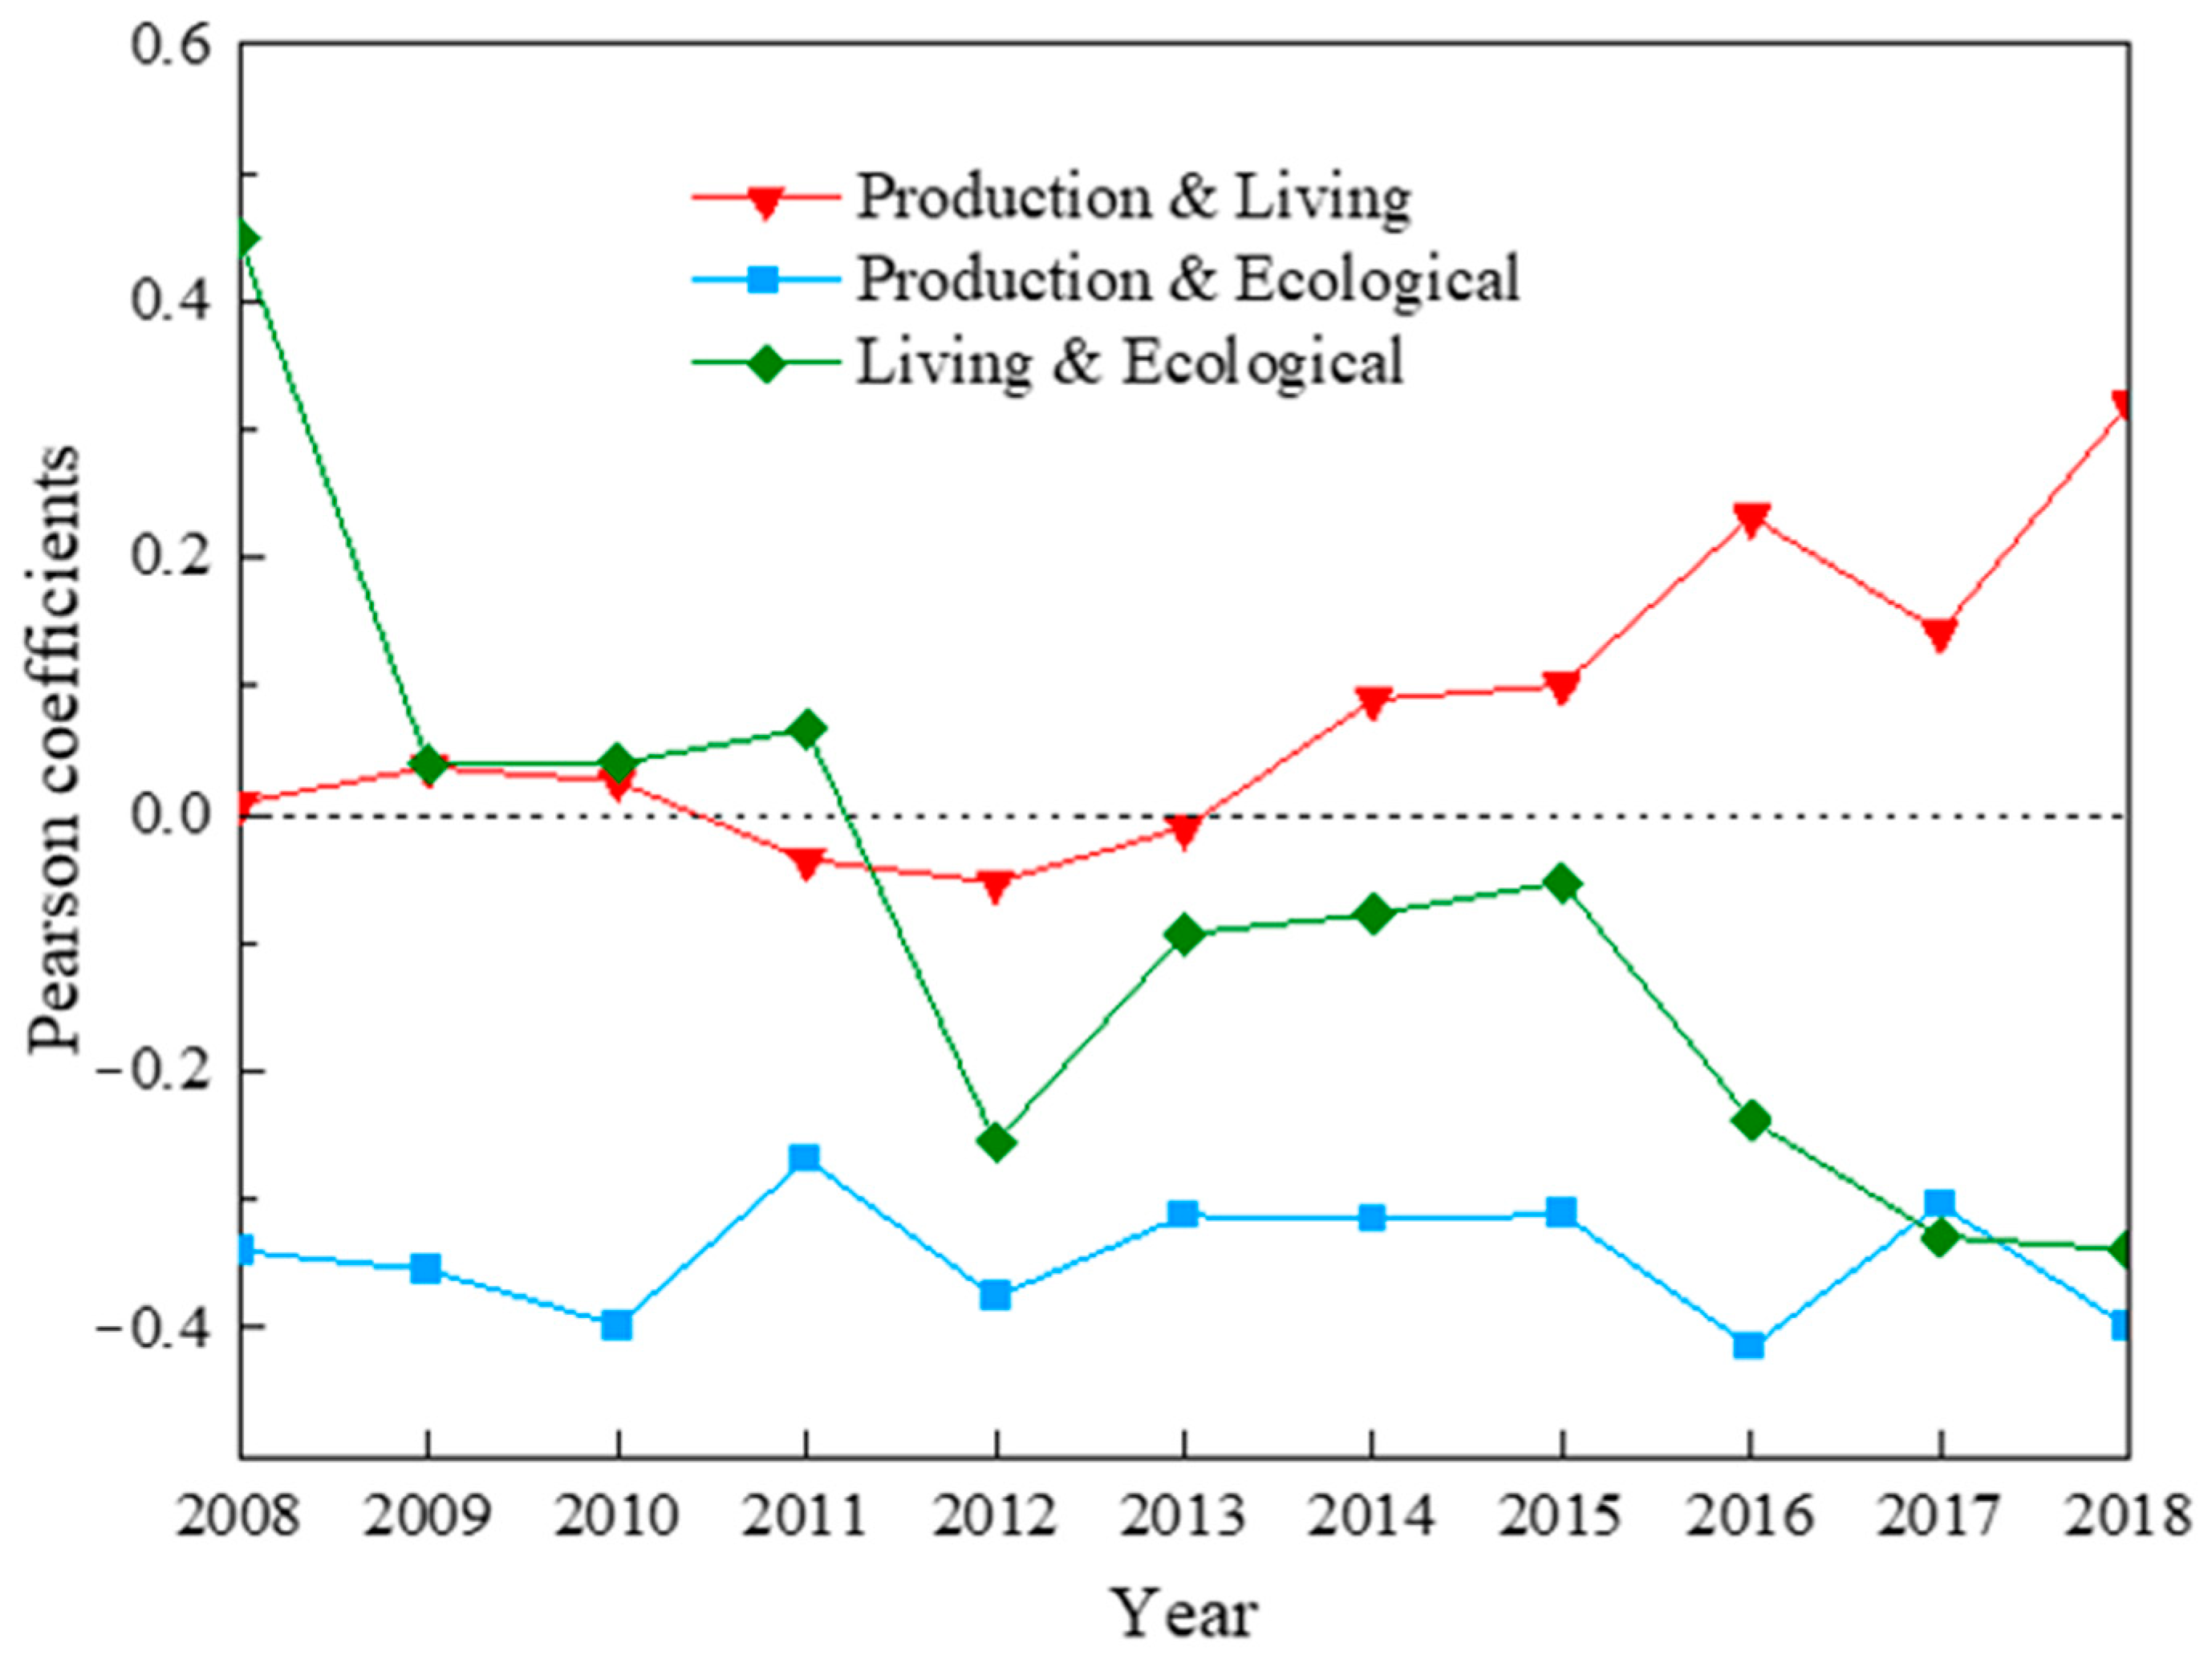
3.2.1. Temporal Change of Trade-Offs and Synergies

Treating the MRYRUA as a control variable, the correlation coefficients between PLE functions were calculated for each year over the study area. The Pearson coefficient revealed that the relationships between each pair of PLE functions in the change of the annual average were mostly trade-offs from 2008 to 2018 (Figure 5). Production and ecological functions were all associated with trade-offs, indicating that production activities will continue to negatively affect the ecological environment during urban agglomeration development, due to the high intensity of production and failure to solve ecological environment problems in a timely manner. The coefficients between production and living functions decreased first and then increased, with trade-offs from 2011 to 2013 and synergies in other years. The relationship between living and ecological functions exhibited the opposite pattern. Based on the fluctuation between living and ecological functions, residents’ living quality does not benefit from ecology, and living spaces squeeze the ecological space. Despite a decrease in trade-offs between living and ecological functions from 2013 to 2015, they failed to break through zero and formed synergies.

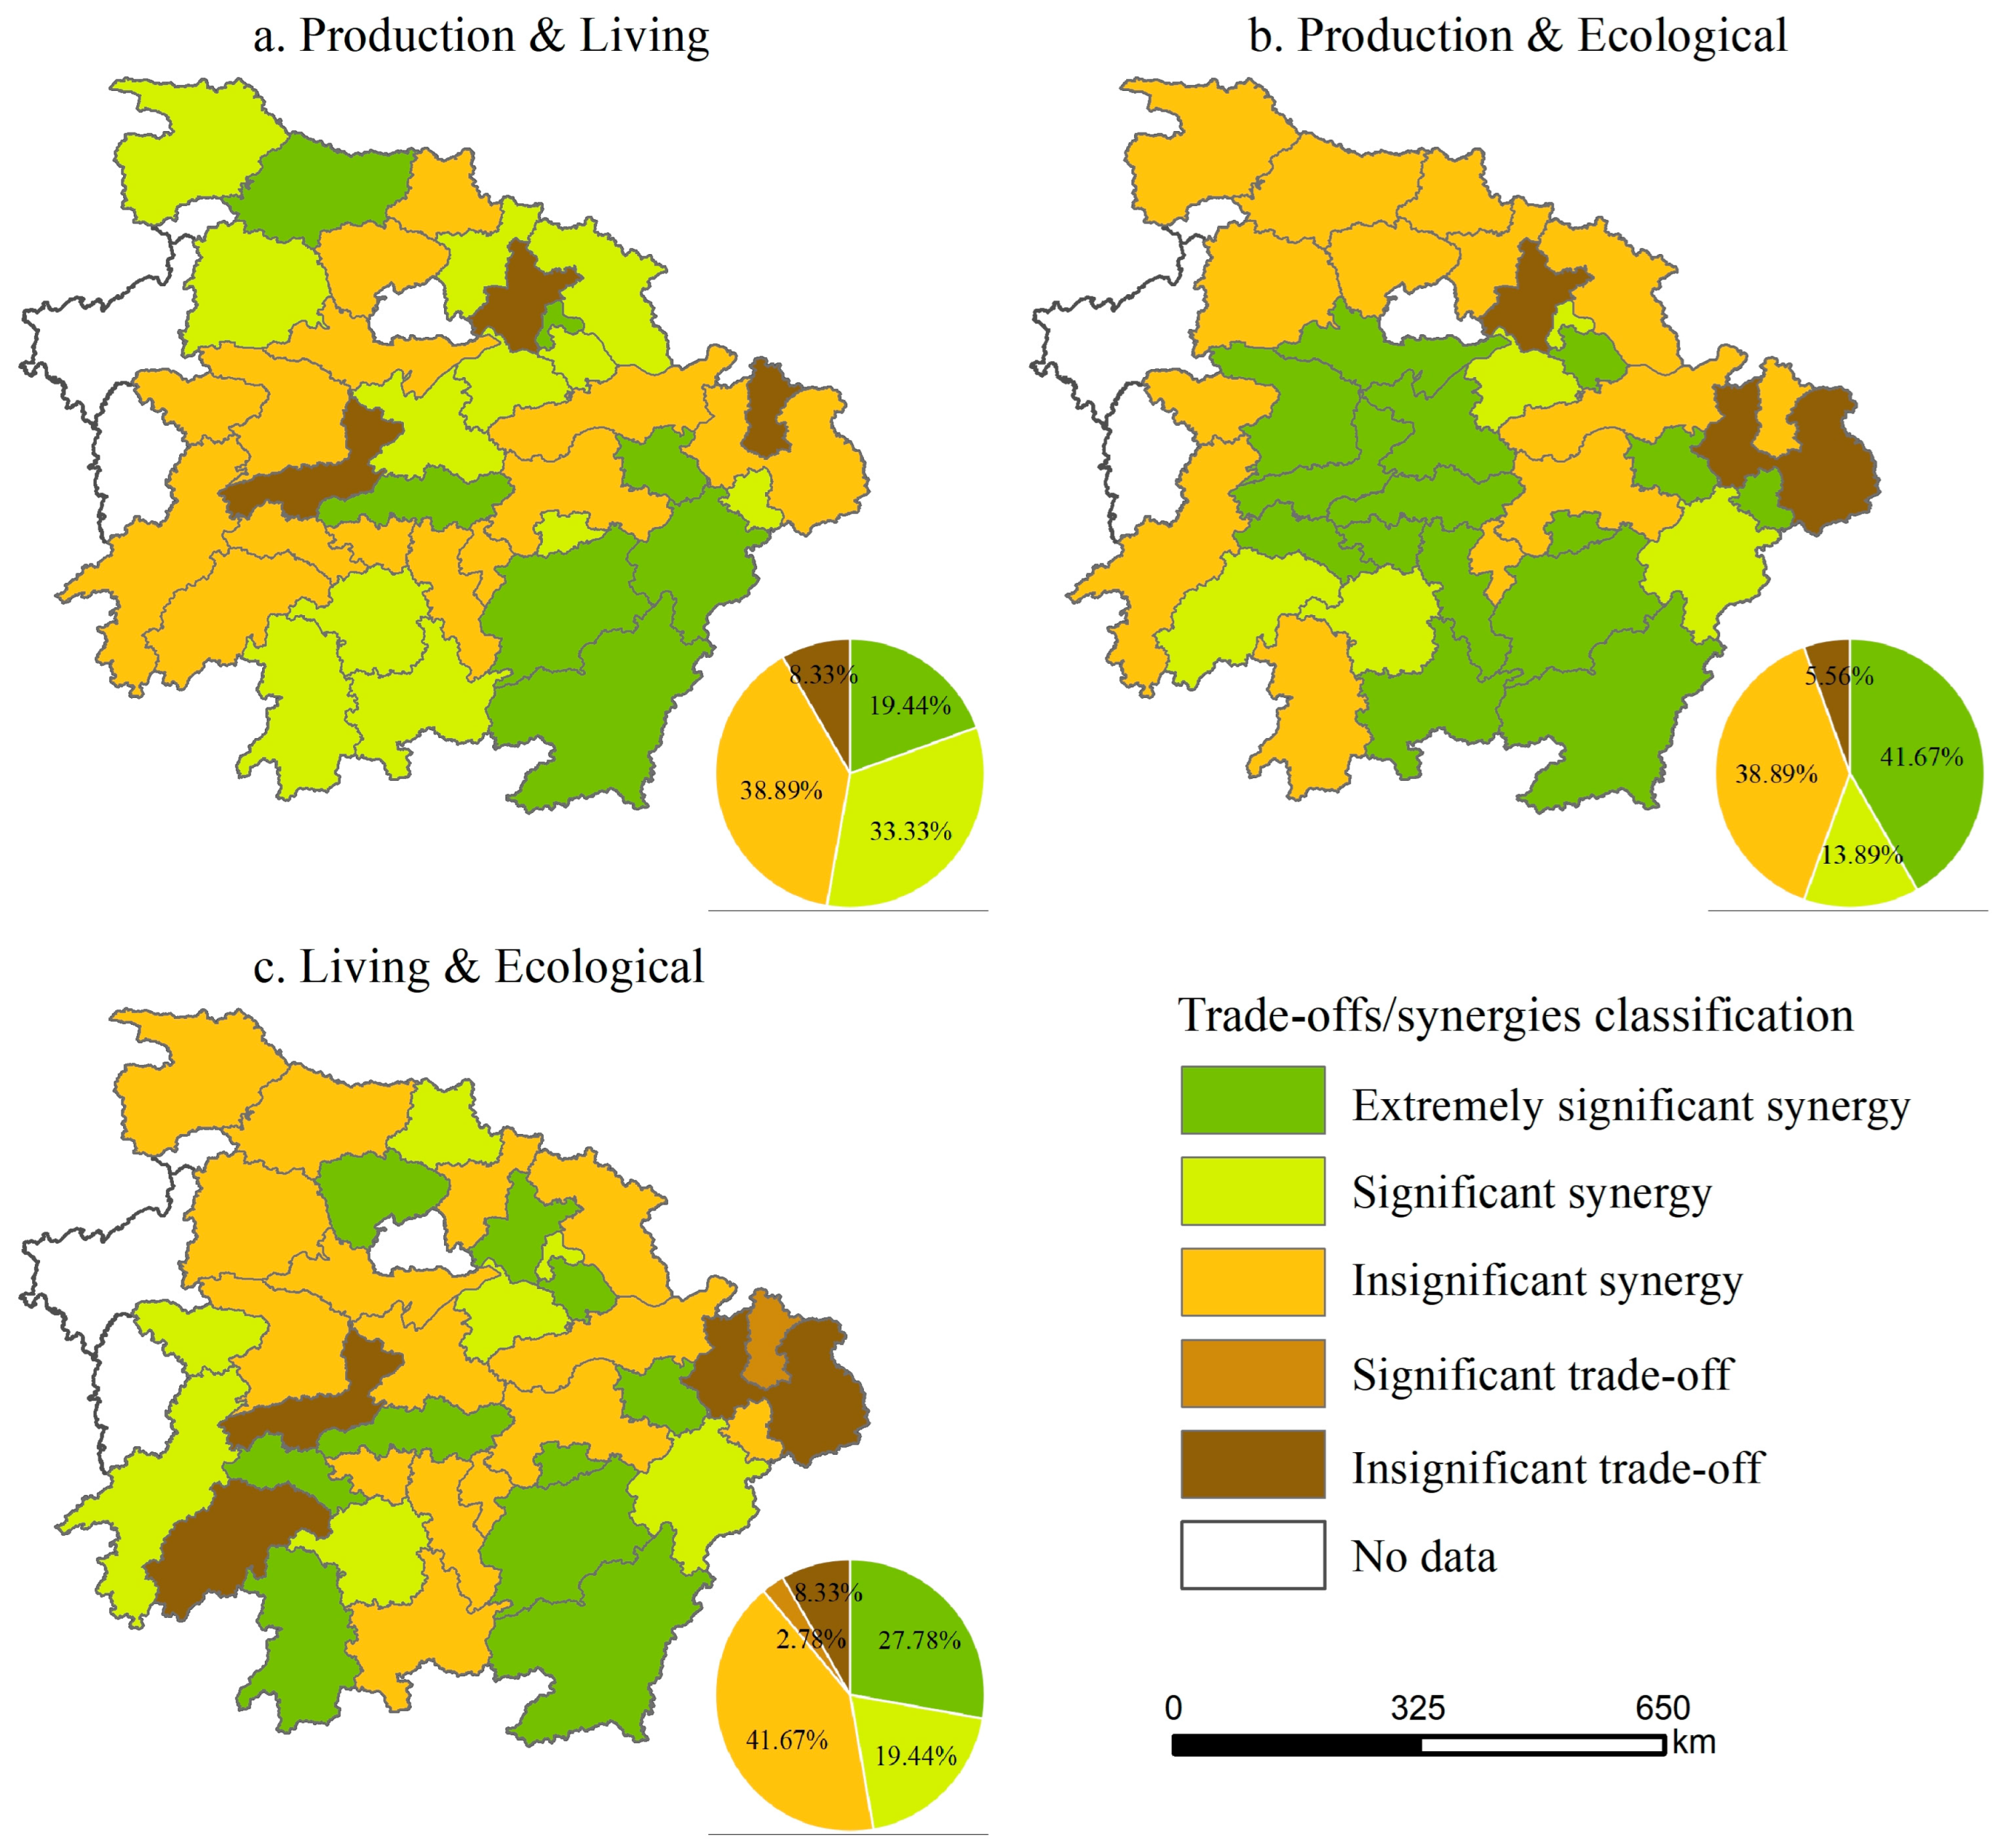
3.2.2. Spatial Distribution Characteristics of Trade-Offs and Synergies

Treating the year as a control variable, the correlation coefficients between PLE functions were calculated for each city over the study period. Figure 6 illustrates the spatial distribution characteristics and the proportion of trade-offs and synergies. The relationships between production and living functions were dominated by insignificant and significant synergies, accounting for 38.89% and 33.33% of the total, respectively, followed by the extremely significant synergy of 19.44%, mainly distributed in the southeast. Insignificant trade-offs accounted for the smallest proportion (8.33%) and were concentrated in Wuhan, Yichang, and Jingdezhen. In the relationship between production and ecological functions, extremely significant synergy accounted for the highest share of 41.67%, significantly higher than that of the production and ecological functions. In contrast, the shares of significant synergy and insignificant trade-off relationships were much lower, at 13.89% and 5.56%, respectively. One of the most notable differences in the relationship between living and ecological functions was the presence of a significant trade-off in Jingdezhen City. Insignificant synergy was the dominant type of relationship between living and ecological function, accounting for 41.67% and occurring mostly in the central cities of the study area.
Overall, it appears that the majority of cities have a primarily synergistic relationship among PLE functions, a much larger proportion than the trade-offs, and no city has an extremely significant trade-off relationship, indicating that the relationships of PLE functions will continue to improve toward a synergistic state.

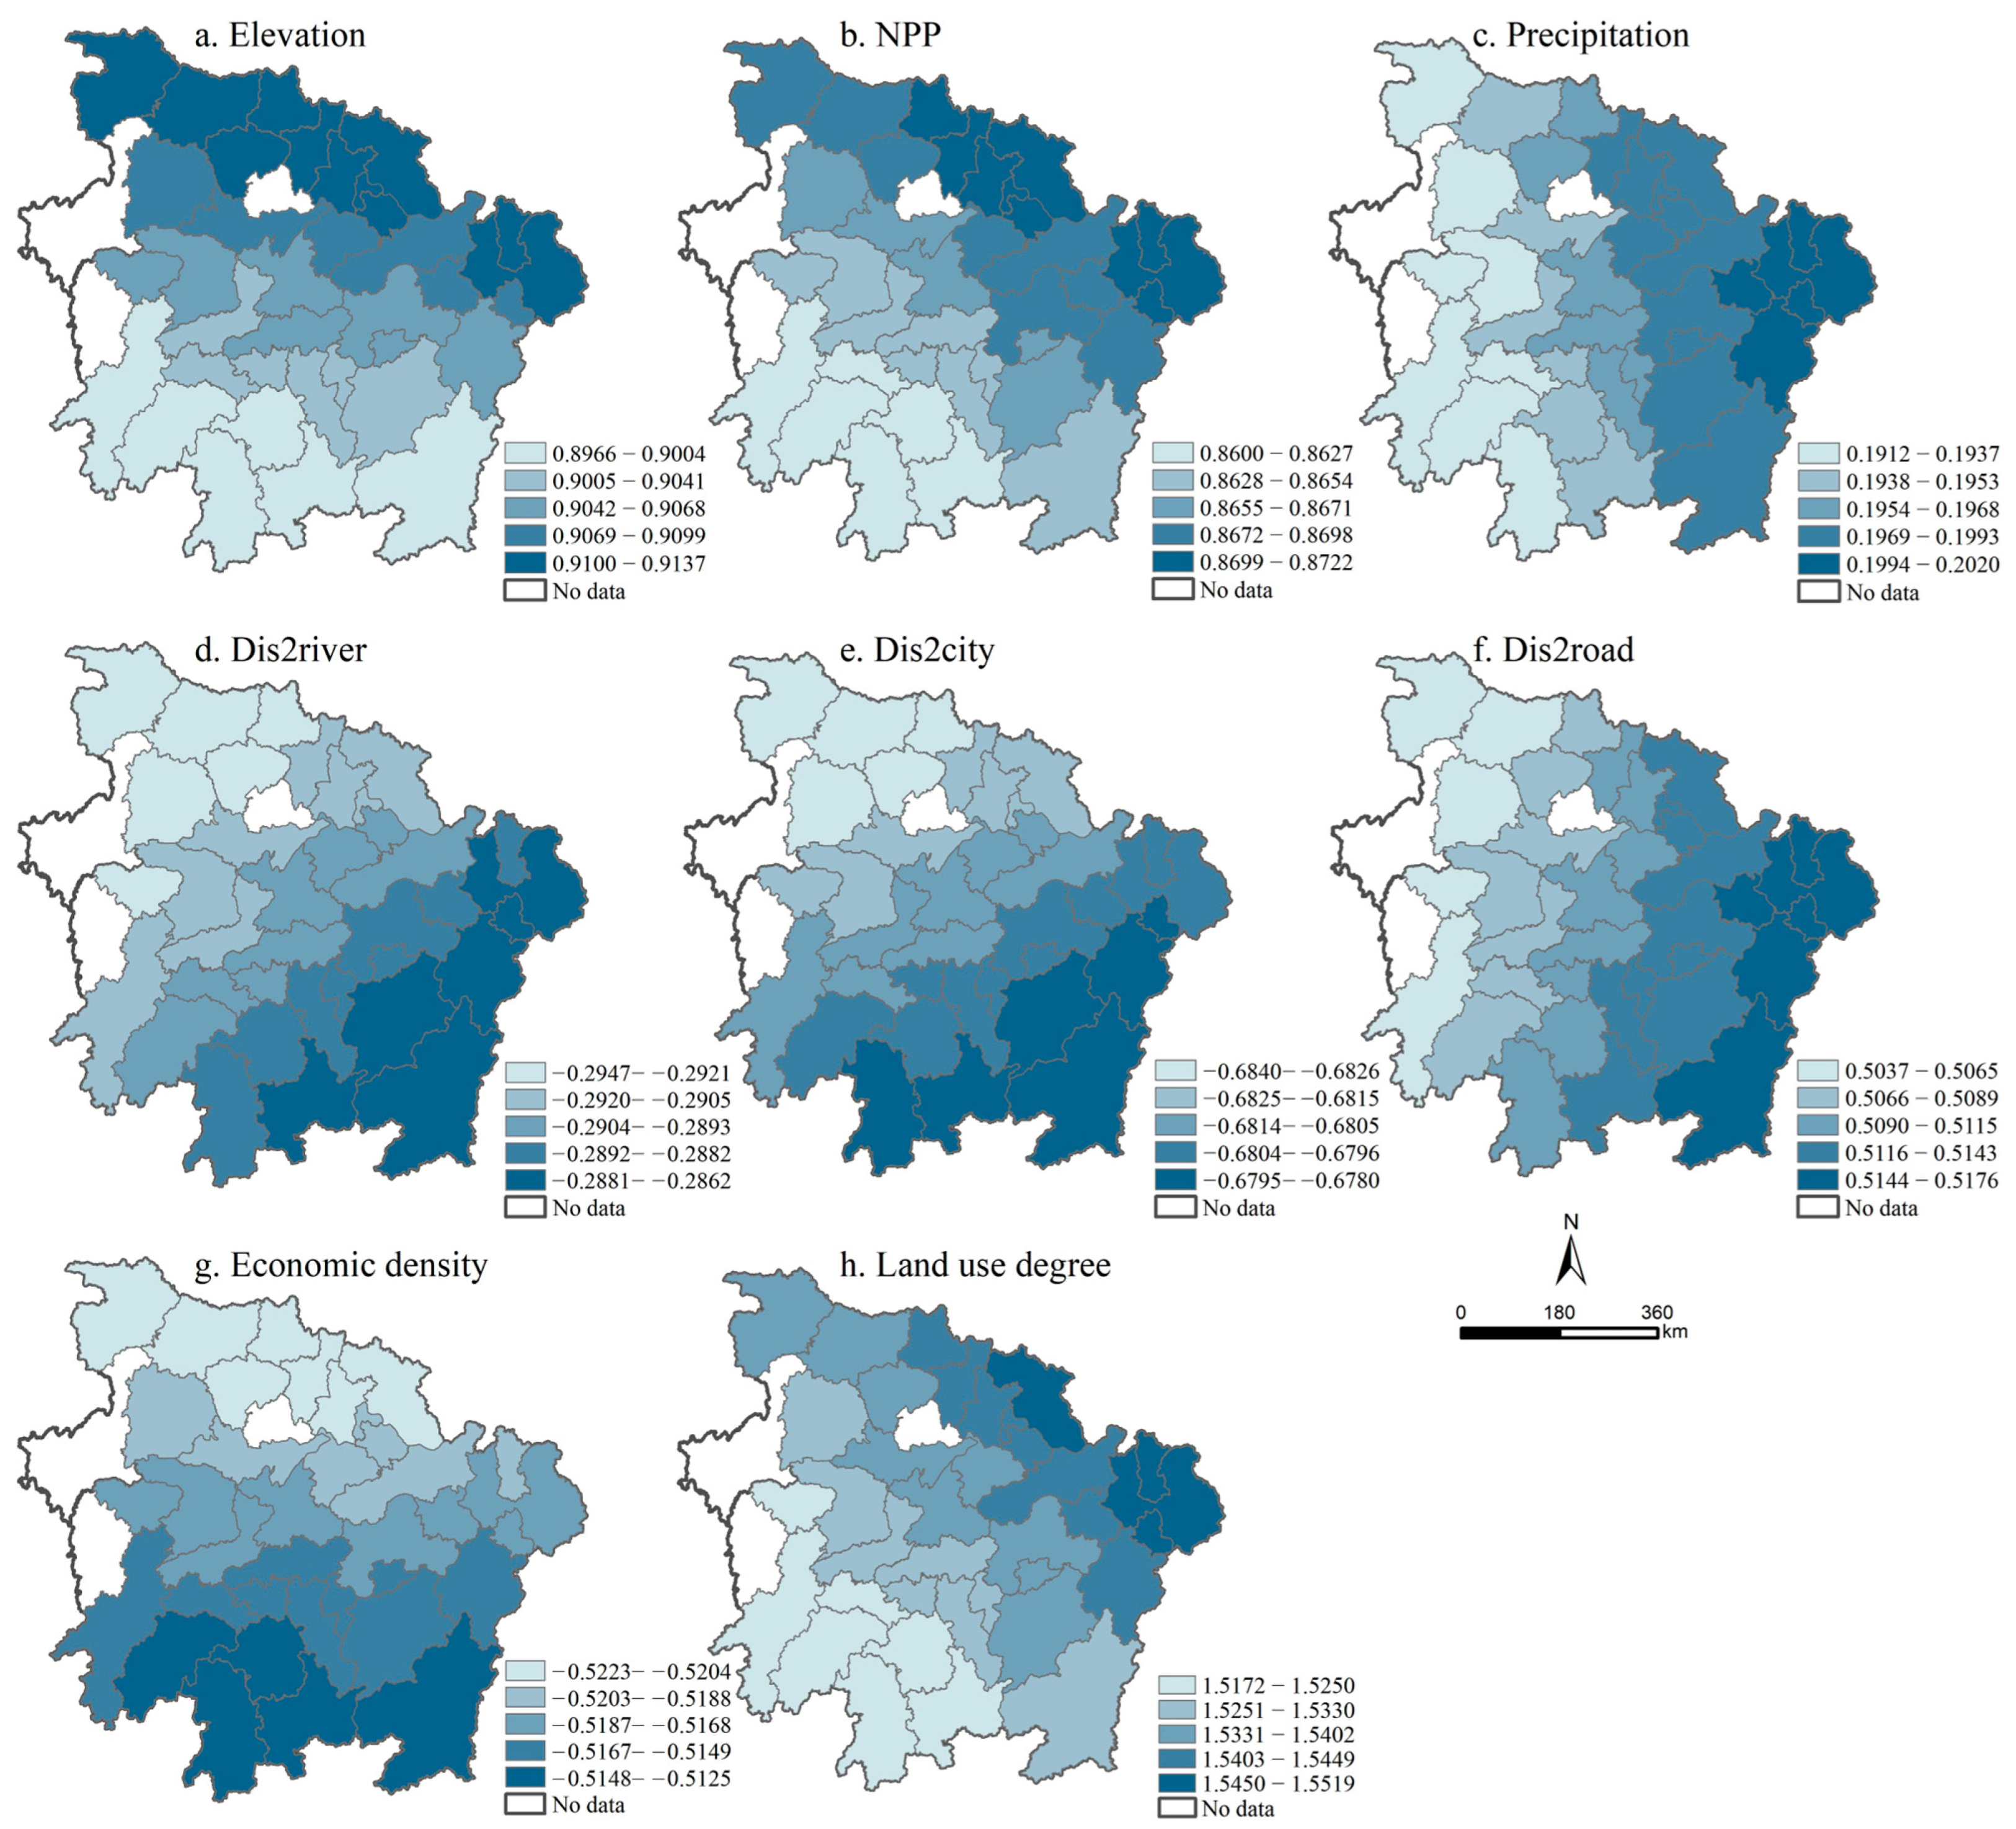
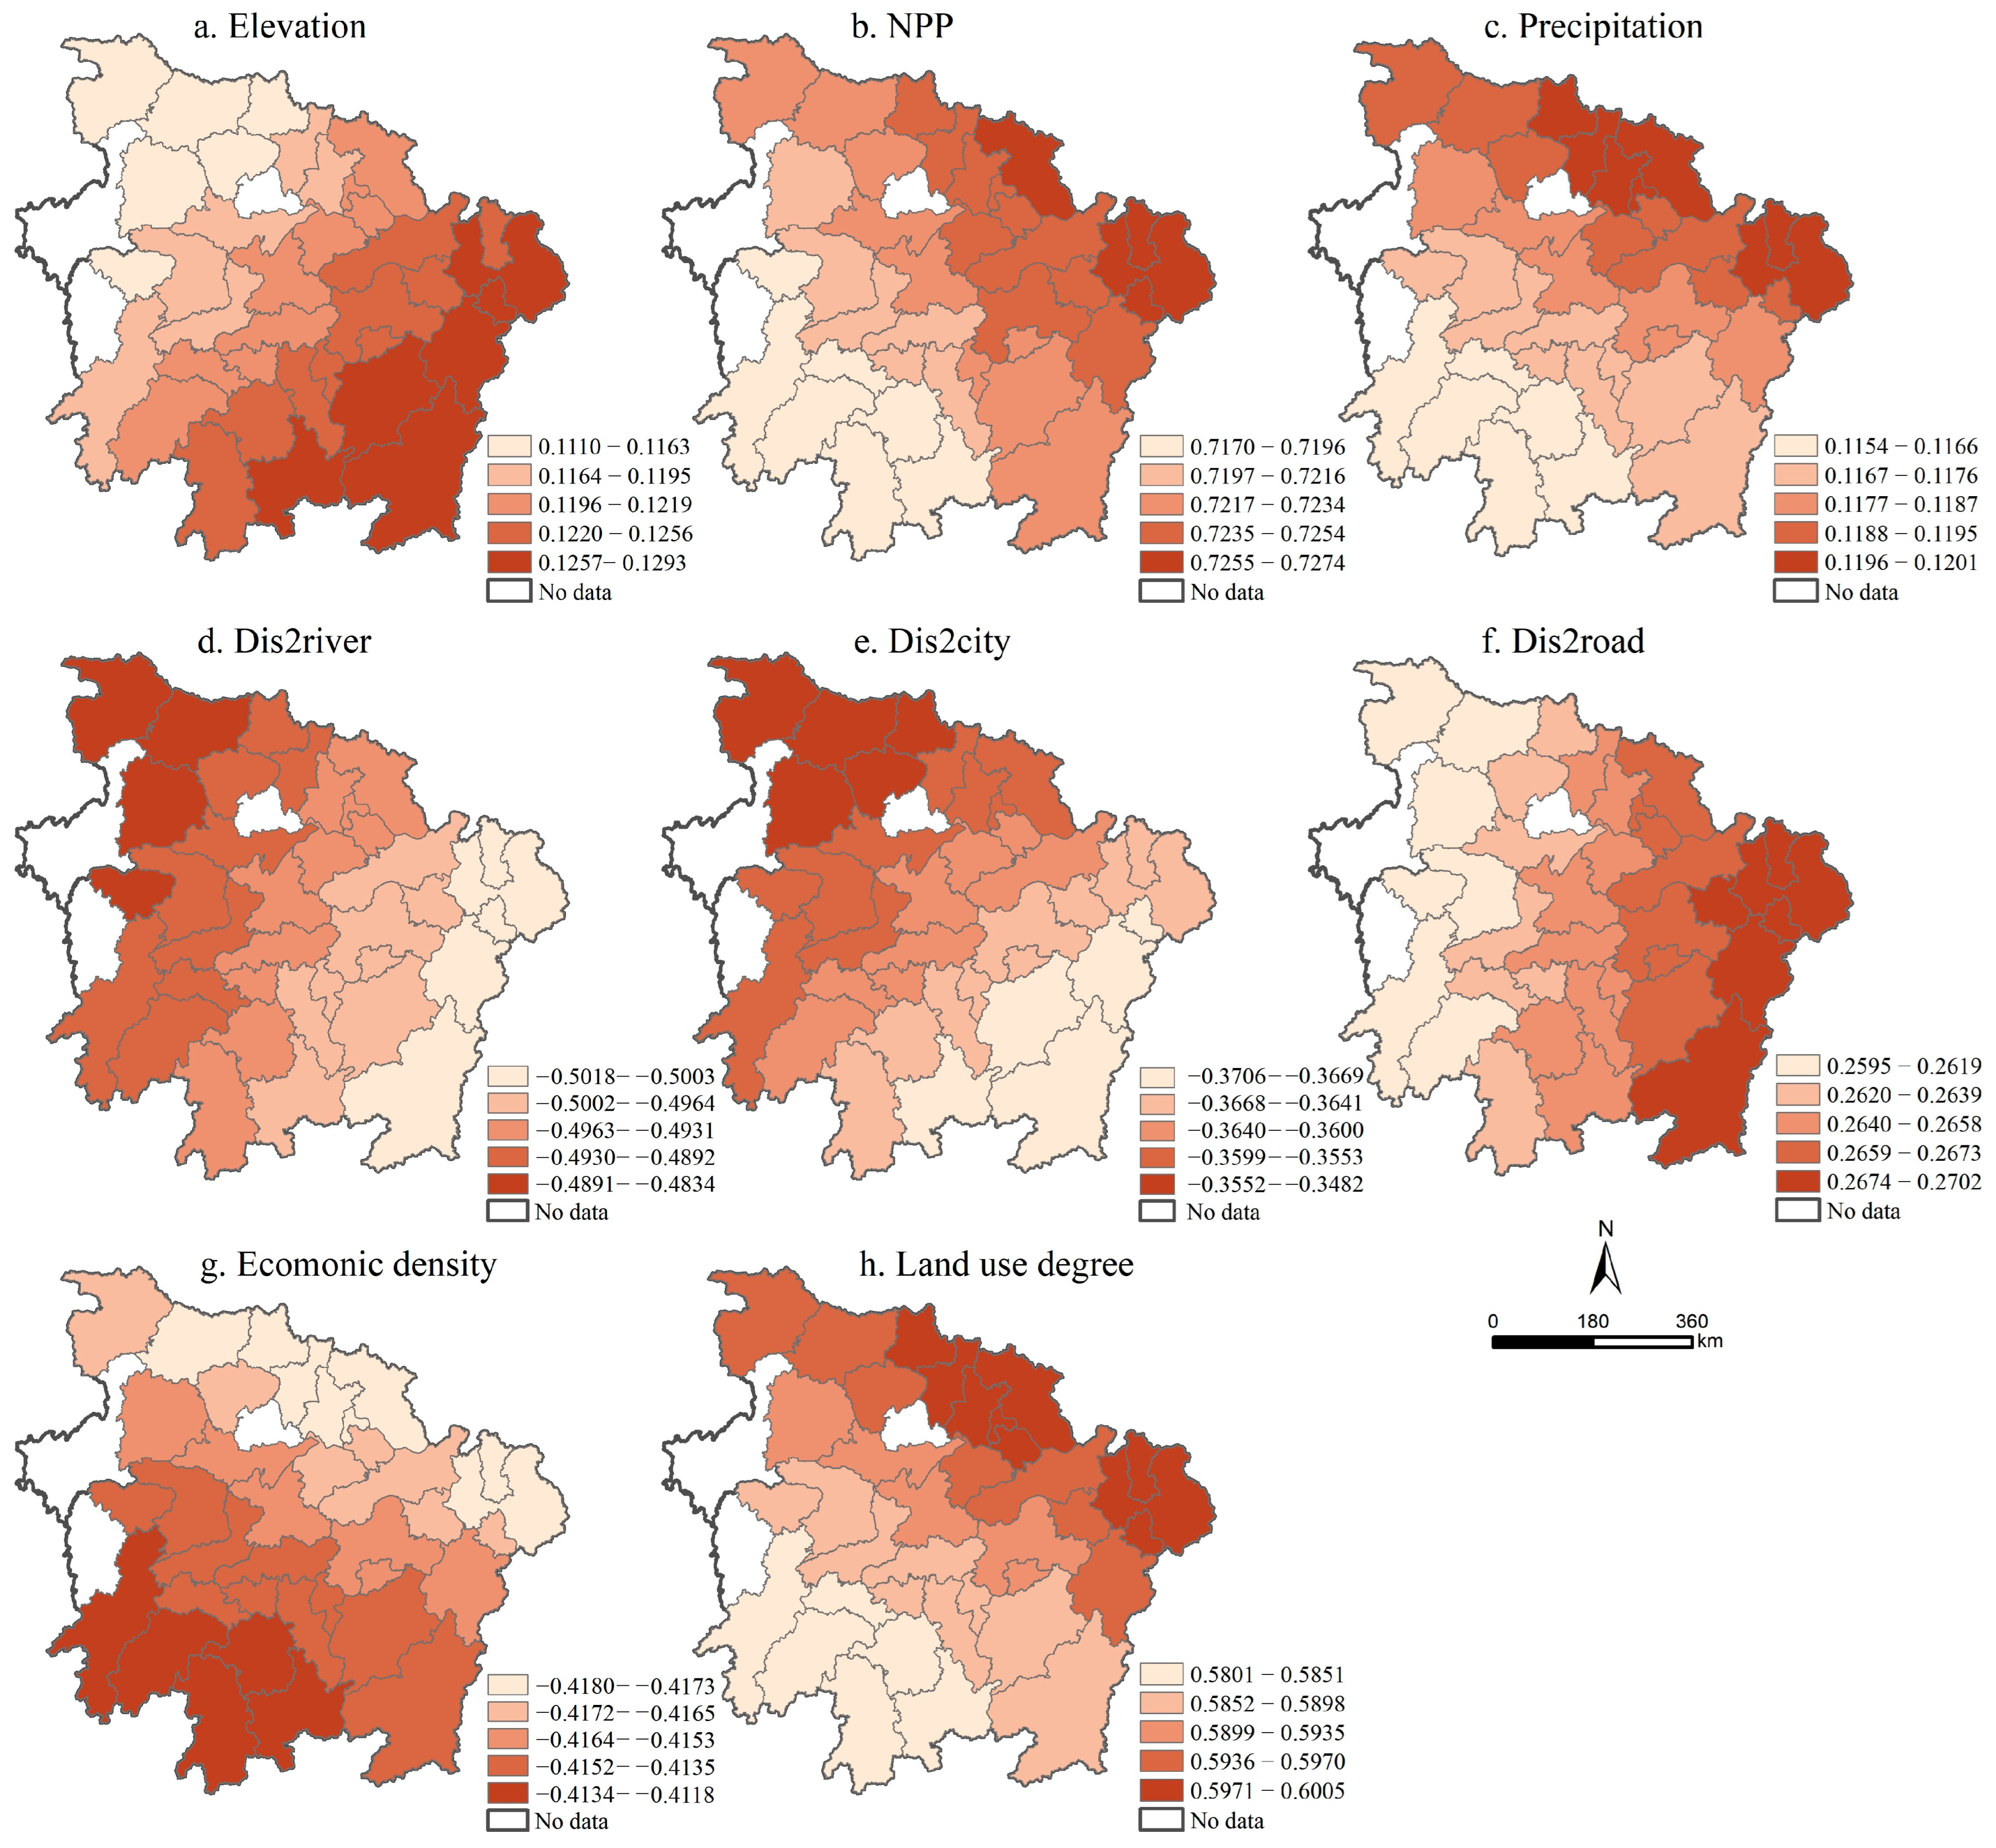
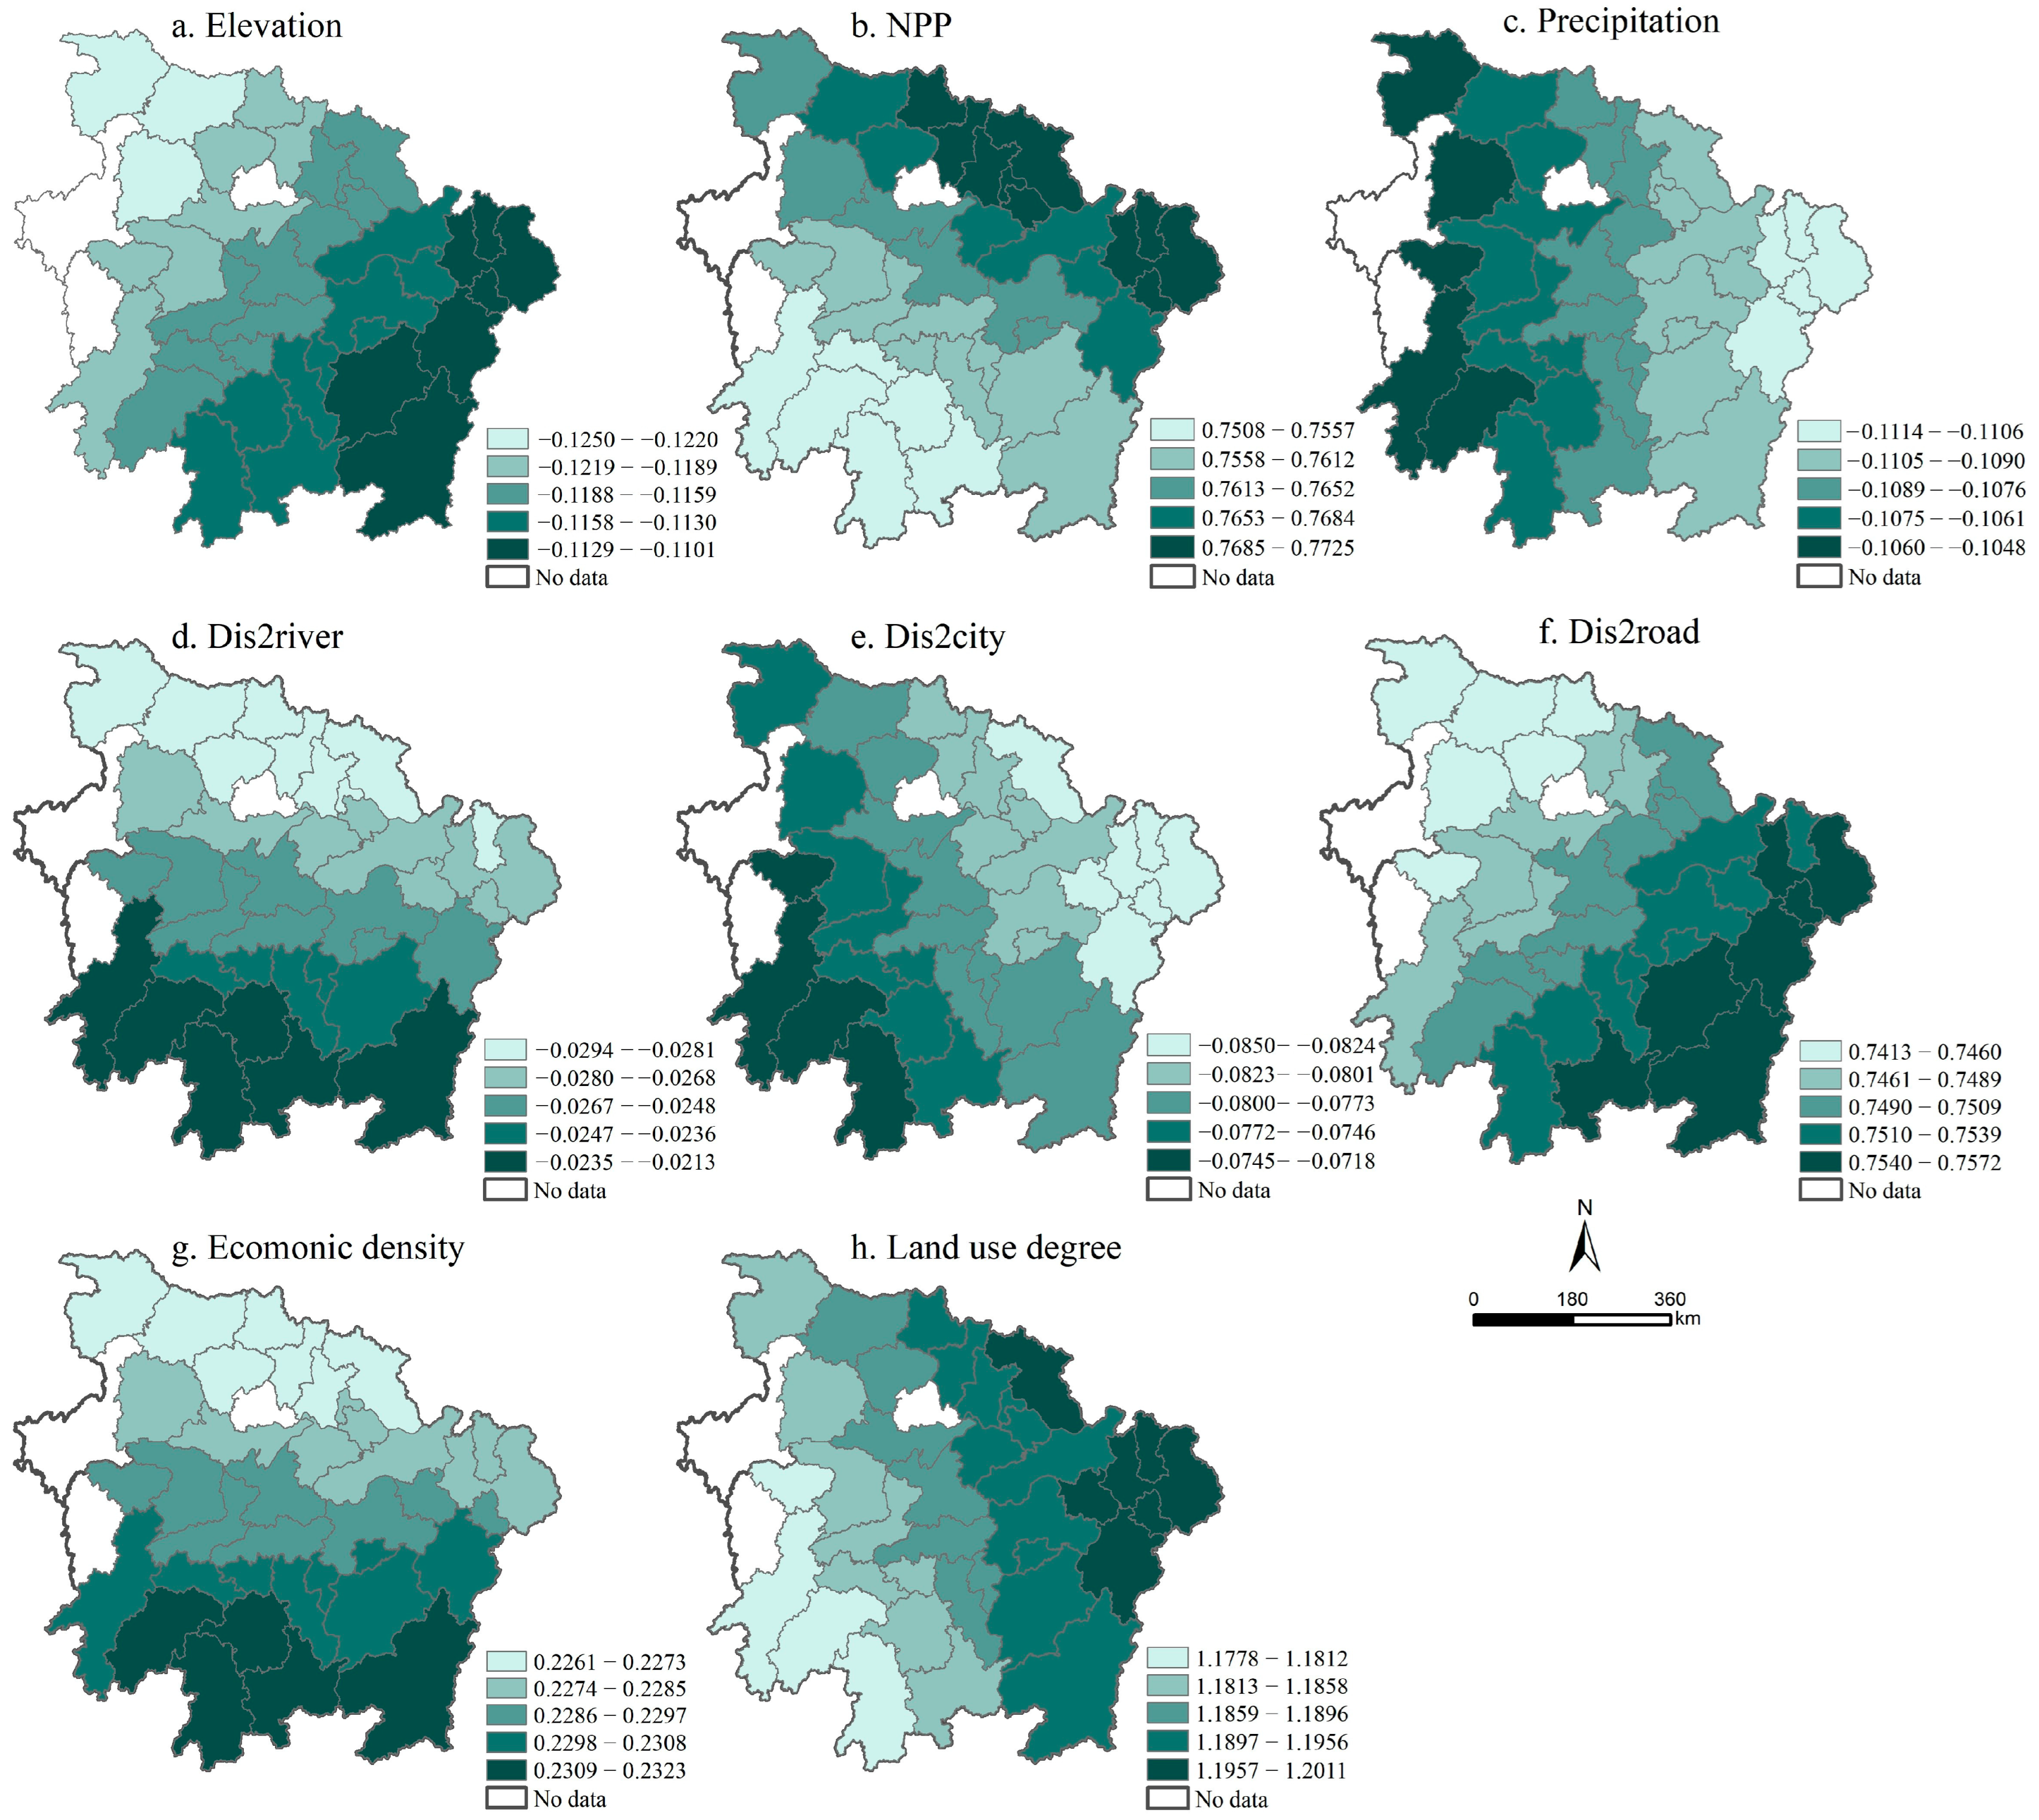
3.3. Driving Forces of the Trade-Offs and Synergies in PLE Functions

According to the results of the GWR (Figure 7, Figure 8 and Figure 9), the spatial distribution of the impact of influencing factors showed clear differences, indicating that the same factor had different impacts on the interactions between different functions.
For the trade-off and synergistic relationships between production and living functions (Figure 7), the spatial distribution of the regression coefficient of elevation and NPP was similar, with a higher coefficient in the northeast and a lower coefficient in the southwest, confirming that flat terrain and conditions conducive to vegetation growth contribute to production and living activities. The distance to rivers had a larger impact on northwestern cities, indicating that the production and living functions in these cities have a greater demand for water resources. The coefficients of distance to city and economic density were negative, indicating that rapid economic development may limit quality of life. According to Figure 7h, land use degree has a greater impact on production and living synergies in northeastern cities.
Both NPP and precipitation showed positive effects on trade-offs and synergies between production and ecological functions (Figure 8), with lower impact in southwest cities, confirming that cities in mountainous areas have greater difficulties coordinating production and ecological functions. Distance to roads, economic density, and land use degree were similar in terms of direction and spatial distribution of impact, with a greater impact on northeast cities, indicating that more developed cities are also more capable of developing green industries and protecting the environment.
According to Figure 9, NPP had the strongest positive impact on trade-offs and synergies between living and ecological functions, with the highest value areas located in the northeast, while all the other natural factors had negative impacts. Among the socio-economic factors, only distance to the city had a negative effect. The result revealed that socio-economic development contributed significantly to the synergy between living and ecological functions. Regarding the magnitude of impact, only elevation was spatially distributed as high in the west and low in the east, while the impact of NPP, precipitation, distance to city, distance to road, and land use degree was high in the east and low in the west.
Overall, most of the natural factors had a positive effect on the trade-offs and synergies between production–living and production–ecological functions. Socio-economic factors affected the trade-offs and synergies between PLE functions in a complex manner, among which the land use degree was a major factor.

4. Discussion

4.1. Spatiotemporal Changes of Trade-Offs and Synergies among PLE Functions

The evolution of spatial patterns in PLE functions highlights the dynamic interplay between the natural environment and human society [44]. From 2008 to 2018, the overall level of PLE functions presented a stable upward trend, with the ecological function maintaining the highest level during the study period, and its increase was more apparent than production and living functions (Figure 3). This might be because MRYRUA emphasizes the importance of ecological functions during its development. Guided by the principle of Conserving the environment and avoiding excessive development, the regional ecological environment has been greatly improved. The spatial evolution of PLE functions showed a feature of ‘point–line–cluster’. Firstly, there was a rise in PLE functions of central cities in MRYRUA like Changsha, Wuhan, and Nanchang, which led to the development of surrounding cities with significant advantages in geography, economics, and policy, and then the surrounding cities contributed to the regional development, thus improving the functions of the whole area. The high-value areas of ecological function were concentrated in the southeast of the study area, especially along the Xiangjiang River and Ganjiang River (Figure 4). Benefiting from ecological protection policies and practices, Poyang Lake and Dongting Lake have high forest coverage, rich species, and conductive ecological environments, and thus Poyang Lake Urban Agglomeration and the Changsha–Zhuzhou–Xiangtan Urban Agglomeration had greater ecological function advantages [45]. In addition, the number of cities with high levels of PLE functions at the same time was decreasing, indicating that PLE functions change over time, and the change in one function was not only influenced by the change in the other but also by the surrounding city’s functions.
To further explore the relationships between PLE functions and the impact on MRYRUA development, the Pearson coefficient was used to calculate the trade-off and synergistic relationships. Based on the average annual coefficient, production and ecological functions were in a trade-off state during the development of urban agglomerations. The improvement of the production function was at the cost of damaging the ecological environment. Strengthening environmental protection will inevitably limit production [46]. Especially in the early stage of urbanization development, the economic growth was still in a relatively extensive stage, so the trade-off was particularly strong. The relationship between living and ecological functions had undergone a process from synergy to trade-offs, while the relationship between production and living functions had shifted in the opposite direction. There was a strong and increasing trade-off relationship between living and ecological functions, which was similar to previous studies in the Yangtze River Delta [17]. The production function and the living function are mutually reinforcing processes over time [35]. Increasing synergy between production and living function indicated that urban transportation accessibility and infrastructure conditions, as well as urban residents’ quality of life, had improved during economic development. The trade-offs between production and ecological functions were the result of continuous adjustment between economic activities and ecological protection. Despite the fact that the trend change of the average annual coefficient indicates most of the years were characterized by trade-offs (Figure 5), overall relationships among PLE functions in each city had a higher proportion of synergy during the study period (Figure 6). This disparity could be attributed to the differences in the development conditions between urban agglomerations as a whole and individual cities. The trade-offs and synergies between PLE functions of urban agglomerations are not simply the sum of the individual cities. Cities have unique development conditions and are better adapted to local conditions so that it will be easier to achieve synergies between PLE functions. Conversely, the whole urban agglomerations, conflicts, and imbalances between each city make it more difficult to achieve synergies. The result illustrates that there is still a need to strengthen coordination between cities in the development of PLE functions.
In this study, we also found that the trade-offs and synergies between PLE functions varied greatly in space. For a more detailed comparison of trade-offs and synergies between cities, the relationships were divided into six categories based on the direction and significance of Pearson coefficients (Figure 6). The degree of functional synergies varies between cities due to differences in investment in productivity, infrastructure, and ecological protection. Often, when cities prioritize economic speed without focusing on quality, production functions are enhanced at the expense of social contradictions and environmental damage, resulting in weakened coordination between living and ecological functions [10]. Our results showed that the PLE functions in most cities exhibited a synergistic relationship, which indicates that these cities have integrated life quality and environmental protection into their urban planning and development while pursuing economic growth. The majority of synergistic relationships, however, were insignificant, with correlation coefficients close to zero, fluctuating between trade-offs and synergies. For such a situation, the intensity of investment in the region and the formulation of policy are particularly important.

4.2. Identifying Driving Factors Affecting Trade-Offs and Synergies among PLE Functions

The trade-offs and synergies among PLE functions in the MRYRUA are complex and driven by a variety of socioeconomic and natural factors [47]. According to our findings, socio-economic factors had a more profound influence on the interrelationships between PLE functions. For example, economic density harmed the relationship between production and living functions, as well as between production and ecological functions. During rapid urbanization, high-intensity economic activities brought about consequences such as traffic congestion, housing tensions, reduced quality of life, and damage to the ecological environment, leading to progressively serious trade-offs between production and living functions, as well as production and ecological functions. In terms of socio-economic factors, construction activities directly change land use patterns, while human and economic activities indirectly influence land use through construction activities [48]. Land use degree had a strong positive effect on the relationships among PLE functions, and the strongest effect was found in the northeast plain and the highly developed cities, which was consistent with previous studies on influencing factors of ecosystems in the Yangtze River and Yellow River basins [49]. We found that land use degree contributed to the growth of synergistic relationships among PLE functions since land use efficiency had been increased as a result of strengthening land use. It is thus crucial to transform extensive land use mode into intensive management, revitalize land resources, and maximize value utilization of scarce resources to promote synergistic relationships among PLE functions.
Also, the role of natural factors in the relationships between PLE functions should not be ignored. Regarding natural factors, NPP reflects the productivity of vegetation and has a direct impact on ecosystem quality [48]. Elevation, as well as distance to rivers, roads, and cities, affect the intensity of human activities, thereby changing land use patterns and indirectly influencing ecosystem quality. All these factors affect the trade-offs and synergies between PLE functions. Natural factors were most influential on the relationship between living and ecological functions among the pairwise relationships. The impact of elevation on the trade-offs between living and ecological functions was most prevalent in mountainous areas. In comparison to the lower altitudes, the higher altitudes have a better ecological environment, but it is not as good for human life. NPP was shown to be a promoter in all relationships between PLE functions, with higher NPP contributing to higher levels of production and ecological functions. Identifying the driving factors of the trade-off and synergistic relationships between PLE functions can guide policy formulation for alleviating the conflicts among agricultural production, urban development, and ecological protection.

4.3. Policy Implications

The evolution process and relationships of PLE functions represent the comprehensive development of urban agglomerations, which are essential for human health, livelihood, and survival. Understanding the interactions and relationships between PLE functions will facilitate the formulation and assessment of spatial policies [22]. Based on our findings, the following policy implications can be made for promoting sustainable urban development in the MRYRUA.
First, there are large differences in the level and spatial distribution of the PLE functions, with ecological functions having the highest values and production functions having the lowest values. This indicates that, while ecology is being paid attention to, it is also necessary to improve human habitat and accelerate the upgrade and transformation of production industries. In agricultural production, we should develop circular agriculture that combines planting and breeding [50], reduce the use of chemical fertilizers and pesticides, appropriately develop large-scale management, and improve the utilization rate of modern farm equipment. In non-agricultural production, we should promote the use of energy-saving and emission-reducing technologies. Taking into account both agricultural and non-agricultural production, these measures could improve production, living, and ecological functions simultaneously.
Second, given the strong trade-off relationship between production and ecological functions in the study area, we should pay special attention to the ecological impact of production activities on regional development. By developing green industries and reducing pollution emissions in production processes, synergies between production and ecological functions should be promoted [32]. The insignificant synergy of PLE functions also implies that it is difficult to achieve extremely significant synergy of PLE functions in highly populated urban agglomerations, so more attention needs to be paid to the balance of PLE functions. To improve the quality of living without damaging the ecological environment, garbage sorting, domestic sewage disposal, and healthcare should be closely monitored [51].
Third, the results of GWR showed that socio-economic factors had a greater impact on the coordination of PLE functions, especially land use degree. It is suggested that decision-makers should pay special attention to the guidance of land use structure [29]; strengthen the protection of land with strong ecological functions such as forest land, grassland, and water area; and strictly control the disorderly expansion of construction land, thereby reducing the negative impact of land use degree on the relationship between PLE functions.

4.4. Limitations and Future Research

This research emphasizes the complex interactions between PLE functions and their importance for sustainable development. The findings of the study provide practical guidance for policymakers in urban agglomerations, emphasizing the need to consider the integrated impact of PLE functions when formulating urban development policies. The methods and conclusions of the study may provide some valuable references for megacities agglomeration around the world. However, the study has several limitations. First, as there are no unified rules for constructing the PLE functions index system [52] as well as limited data availability, the selection of indicators was not comprehensive enough. Second, we focused on the analysis of the relationships between PLE functions, without exploring the impact of sub-functions on the study area. Furthermore, policy plays a crucial role in trade-offs and synergistic relationships among PLE functions, but given the difficulties in quantifying policy factors, we did not consider them in this study. In the future, we will try to improve the index system for measuring PLE functions, investigate the relationships between sub-functions, and include policy factors to explore the PLE functions from a more detailed perspective.

5. Conclusions

Understanding the relationships of trade-offs and synergies among PLE functions, as well as their driving factors, is crucial for the coordinated development of humans and nature in urban agglomerations. We took MRYRUA as an example to explore how PLE functions evolve in response to social development, as well as the interrelationships between these functions. From 2008 to 2018, the PLE functions exhibited a general upward trend, with the level of ecological functions remaining higher than the level of production and living functions. This trend reflected the importance of ecological conservation in the development of urban agglomerations. The spatial distribution of the PLE functions was characterized by the central cities being the highest and exerting profound effects on surrounding cities. Based on the Pearson coefficient, we revealed the trade-offs and synergies between PLE functions. When the MRYRUA was considered as a whole, the relationships of PLE functions were dominated by trade-offs, with production and ecological functions remaining in a stable trade-off state. In addition, we identified six different types of PLE function relationships to distinguish the strength of interactions between functions in different cities. Most cities were in a synergistic state, with insignificant and significant synergies accounting for the largest proportion. According to the analysis of the driving forces, both the natural and socio-economic factors had different magnitudes and directions of influence on trade-offs and synergies between PLE functions. The influence of socio-economic factors was more prominent and important, especially the land use degree, which had the strongest positive influence on the relationships of all functions. The findings of this study may provide some guidance for the in-depth understanding of the land use function development of urban agglomerations and make it easier for policymakers to adjust policies accordingly, as well as to alleviate the conflict between humans and natural environments.

Author Contributions

L.Z. and Y.W. (Yajing Wang) contributed to the conceptualization and methodology of the study; H.Y. and L.X. analyzed the results and carried out the original manuscript; Y.W. (Ying Wang) acquired funding and reviewed and edited the manuscript; Y.B. preprocessed and analyzed the data. All authors have read and agreed to the published version of the manuscript.

Funding

This research was supported by the project of Changjiang Survey, Planning, Design and Research Co., Ltd. (CX2022Z23), and the National Natural Science Foundation of China (grant no. 41901213).

Data Availability Statement

The data that support the findings of this study are available from the corresponding author upon reasonable request.

Conflicts of Interest

The authors declare no conflicts of interest.

References

  1. Liu, Y.S. Introduction to land use and rural sustainability in China. Land Use Policy 2018, 74, 1–4. [Google Scholar] [CrossRef]
  2. Yang, F.S.; Yang, X.M.; Wang, Z.H.; Sun, Y.J.; Zhang, Y.H.; Xing, H.Q.; Wang, Q. Spatiotemporal Evolution of Production-Living-Ecological Land and Its Eco-Environmental Response in China’s Coastal Zone. Remote Sens. 2023, 15, 3039. [Google Scholar] [CrossRef]
  3. Wang, J.Y.; Sun, Q.; Zou, L.L. Spatial-temporal evolution and driving mechanism of rural production-living-ecological space in Pingtan islands, China. Habitat Int. 2023, 137, 102833. [Google Scholar] [CrossRef]
  4. Zhang, X.; Xu, Z. Functional Coupling Degree and Human Activity Intensity of Production–Living–Ecological Space in Underdeveloped Regions in China: Case Study of Guizhou Province. Land 2021, 10, 56. [Google Scholar] [CrossRef]
  5. Liu, C.; Xu, Y.Q.; Huang, A.; Li, Y.X.; Wang, H.; Lu, L.H.; Sun, P.L.; Zheng, W. Spatial identification of land use multifunctionality at grid scale in farming-pastoral area: A case study of Zhangjiakou City, China. Habitat Int. 2018, 76, 48–61. [Google Scholar] [CrossRef]
  6. Li, L.; Ma, S.J.; Zheng, Y.L.; Xiao, X.Y. Integrated regional development: Comparison of urban agglomeration policies in China. Land Use Policy 2022, 114, 105939. [Google Scholar] [CrossRef]
  7. Lin, S.J.; Li, C.; Li, Y.B.; Chen, L.D. Exploring Integrative Development of Urban Agglomeration from the Perspective of Urban Symbiosis and Production-Living-Ecological Function. Land 2024, 13, 258. [Google Scholar] [CrossRef]
  8. Zhang, R.; Chen, S.; Gao, L.; Hu, J.J. Spatiotemporal evolution and impact mechanism of ecological vulnerability in the Guangdong-Hong Kong-Macao Greater Bay Area. Ecol. Indic. 2023, 157, 111214. [Google Scholar] [CrossRef]
  9. Liu, J.M.; Pei, X.T.; Zhu, W.Y.; Jiao, J.Z. Understanding the intricate tradeoffs among ecosystem services in the Beijing-Tianjin-Hebei urban agglomeration across spatiotemporal features. Sci. Total Environ. 2023, 898, 165453. [Google Scholar] [CrossRef]
  10. Gao, Y.L.; Li, H.B.; Song, Y. Interaction Relationship between Urbanization and Land Use Multifunctionality: Evidence from Han River Basin, China. Land 2021, 10, 938. [Google Scholar] [CrossRef]
  11. Xiong, S.W.; Yang, F.; Zhang, J.Y.; Tang, Y.L. An integrated model chain for diagnosing and predicting conflicts between production-living-ecological space in lake network regions: A case of the Dongting Lake region, China. Ecol. Indic. 2024, 166, 112237. [Google Scholar] [CrossRef]
  12. Yin, Y.T.; Xi, F.R. Simulation of the evolution track of future Production-Living-Ecological Space under the framework of comprehensive assessment of climate change: A case study of Heilongjiang Province, China. Environ. Technol. Innov. 2023, 30, 103129. [Google Scholar] [CrossRef]
  13. Zhang, Z.; Li, J.M. Spatial suitability and multi-scenarios for land use: Simulation and policy insights from the production-living-ecological perspective. Land Use Policy 2022, 119, 106219. [Google Scholar] [CrossRef]
  14. Wang, Y.F. Spatial-temporal evolution of “Production-Living-Ecologica” function and layout optimization Strategy in China: A case study of Liaoning Province, China. Environ. Sci. Pollut. Res. 2023, 30, 10683–10696. [Google Scholar] [CrossRef]
  15. Ouyang, X.; Xu, J.; Li, J.Y.; Wei, X.; Li, Y.H. Land space optimization of urban-agriculture-ecological functions in the Changsha-Zhuzhou-Xiangtan Urban Agglomeration, China. Land Use Policy 2022, 117, 106112. [Google Scholar] [CrossRef]
  16. Zou, L.L.; Liu, Y.S.; Yang, J.X.; Yang, S.F.; Wang, Y.S.; Zhi, C.; Hu, X.D. Quantitative identification and spatial analysis of land use ecological-production-living functions in rural areas on China’s southeast coast. Habitat Int. 2020, 100, 102182. [Google Scholar] [CrossRef]
  17. Zhou, D.; Xu, J.C.; Lin, Z.L. Conflict or coordination? Assessing land use multi-functionalization using production-living-ecology analysis. Sci. Total Environ. 2017, 577, 136–147. [Google Scholar] [CrossRef] [PubMed]
  18. Xi, F.R.; Wang, R.P.; Shi, J.S.; Zhang, J.D.; Yu, Y.; Wang, N.; Wang, Z.Y. Spatio-Temporal Pattern and Conflict Identification of Production-Living-Ecological Space in the Yellow River Basin. Land 2022, 11, 744. [Google Scholar] [CrossRef]
  19. Li, C.X.; Wu, J.Y. Land use transformation and eco-environmental effects based on production-living-ecological spatial synergy: Evidence from Shaanxi Province, China. Environ. Sci. Pollut. Res. 2022, 29, 41492–41504. [Google Scholar] [CrossRef]
  20. Wang, A.Y.; Liao, X.Y.; Tong, Z.J.; Du, W.L.; Zhang, J.Q.; Liu, X.P.; Liu, M.S. Spatial-temporal dynamic evaluation of the ecosystem service value from the perspective of “production-living-ecological” spaces: A case study in Dongliao River Basin, China. J. Clean. Prod. 2022, 333, 130218. [Google Scholar] [CrossRef]
  21. Zhang, H.; Wu, S.H.; Dang, Y.X.; Liu, D.; Qiu, L.F. Multi-functional identification of social-ecological landscape in ecologically fragile areas under the background of regional transformation development. Environ. Sci. Pollut. Res. 2023, 30, 19062–19082. [Google Scholar] [CrossRef] [PubMed]
  22. Yang, Y.Y.; Bao, W.K.; Liu, Y.S. Coupling coordination analysis of rural production-living-ecological space in the Beijing-Tianjin-Hebei region. Ecol. Indic. 2020, 117, 106512. [Google Scholar] [CrossRef]
  23. Liu, C.; Xu, Y.Q.; Lu, X.H.; Han, J. Trade-offs and driving forces of land use functions in ecologically fragile areas of northern Hebei Province: Spatiotemporal analysis. Land Use Policy 2021, 104, 105387. [Google Scholar] [CrossRef]
  24. Liu, Y.C.; Jing, Y.D.; Han, S.M. Ecological function zoning of Nansi Lake Basin in China based on ecosystem service bundles. Environ. Sci. Pollut. Res. 2023, 30, 77343–77357. [Google Scholar] [CrossRef]
  25. Wang, Z.J.; Yang, H.; Hu, Y.M.; Peng, Y.P.; Liu, L.; Su, S.Q.; Wang, W.; Wu, J.L. Multifunctional trade-off/synergy relationship of cultivated land in Guangdong: A long time series analysis from 2010 to 2030. Ecol. Indic. 2023, 154, 110700. [Google Scholar] [CrossRef]
  26. Gao, Y.X.; Wang, Z.Q.; Zhang, L.G.; Chai, J. Spatial identification and multilevel zoning of land use functions improve sustainable regional management: A case study of the Yangtze River Economic Belt, China. Environ. Sci. Pollut. Res. 2023, 30, 27782–27798. [Google Scholar] [CrossRef]
  27. Yang, Y.; Li, M.W.; Feng, X.M.; Yan, H.M.; Su, M.R.; Wu, M.W. Spatiotemporal variation of essential ecosystem services and their trade-off/synergy along with rapid urbanization in the Lower Pearl River Basin, China. Ecol. Indic. 2021, 133, 108439. [Google Scholar] [CrossRef]
  28. Lyu, Y.F.; Wang, M.J.; Zou, Y.N.; Wu, C.F. Mapping trade-offs among urban fringe land use functions to accurately support spatial planning. Sci. Total Environ. 2022, 802, 149915. [Google Scholar] [CrossRef]
  29. Zhang, J.; Li, S.N.; Lin, N.F.; Lin, Y.; Yuan, S.F.; Zhang, L.; Zhu, J.X.; Wang, K.; Gan, M.Y.; Zhu, C.M. Spatial identification and trade-off analysis of land use functions improve spatial zoning management in rapid urbanized areas, China. Land Use Policy 2022, 116, 106058. [Google Scholar] [CrossRef]
  30. Fan, Y.T.; Gan, L.; Hong, C.Q.; Jessup, L.H.; Jin, X.B.; Pijanowski, B.C.; Sun, Y.; Lv, L.G. Spatial identification and determinants of trade-offs among multiple land use functions in Jiangsu Province, China. Sci. Total Environ. 2021, 772, 145022. [Google Scholar] [CrossRef]
  31. Jiang, X.T.; Zhai, S.Y.; Liu, H.; Chen, J.; Zhu, Y.Y.; Wang, Z. Multi-scenario simulation of production-living-ecological space and ecological effects based on shared socioeconomic pathways in Zhengzhou, China. Ecol. Indic. 2022, 137, 108750. [Google Scholar] [CrossRef]
  32. Zhang, Y.N.; Long, H.L.; Tu, S.S.; Ge, D.Z.; Ma, L.; Wang, L.Z. Spatial identification of land use functions and their tradeoffs/synergies in China: Implications for sustainable land management. Ecol. Indic. 2019, 107, 105550. [Google Scholar] [CrossRef]
  33. Li, S.N.; Zhao, X.Q.; Pu, J.W.; Miao, P.P.; Wang, Q.; Tan, K. Optimize and control territorial spatial functional areas to improve the ecological stability and total environment in karst areas of Southwest China. Land Use Policy 2021, 100, 104940. [Google Scholar] [CrossRef]
  34. Cao, Y.; Li, G.Y.; Tian, Y.H.; Fang, X.Q.; Li, Y.; Tan, Y.Z. Linking ecosystem services trade-offs, bundles and hotspot identification with cropland management in the coastal Hangzhou Bay area of China. Land Use Policy 2020, 97, 104689. [Google Scholar] [CrossRef]
  35. Zhu, J.; Shang, Z.; Long, C.; Lu, S. Functional Measurements, Pattern Evolution, and Coupling Characteristics of “Production-Living-Ecological Space” in the Yangtze Delta Region. Sustainability 2023, 24, 16712. [Google Scholar] [CrossRef]
  36. Zhao, Y.; Cheng, J.; Zhu, Y.; Zhao, Y. Spatiotemporal evolution and regional differences in the production-living-ecological space of the urban agglomeration in the middle reaches of the Yangtze River. Int. J. Environ. Res. Public Health 2021, 18, 12497. [Google Scholar] [CrossRef]
  37. Chen, W.X. A multi-scale assessment of ecosystem health based on the Pressure-State-Response framework: A case in the Middle Reaches of the Yangtze River Urban Agglomerations, China. Environ. Sci. Pollut. Res. 2022, 29, 29202–29219. [Google Scholar] [CrossRef]
  38. Chen, W.X.; Chi, G.Q.; Li, J.F. The spatial aspect of ecosystem services balance and its determinants. Land Use Policy 2020, 90, 104263. [Google Scholar] [CrossRef]
  39. Wang, D.; Jiang, D.; Fu, J.Y.; Lin, G.; Zhang, J.L. Comprehensive Assessment of Production-Living-Ecological Space Based on the Coupling Coordination Degree Model. Sustainability 2020, 12, 2009. [Google Scholar] [CrossRef]
  40. Govind, A.; Chen, J.M.; Margolis, H.; Ju, W.M.; Sonnentag, O.; Giasson, M.A. A spatially explicit hydro-ecological modeling framework (BEPS-TerrainLab V2.0): Model description and test in a boreal ecosystem in Eastern North America. J. Hydrol. 2009, 367, 200–216. [Google Scholar] [CrossRef]
  41. Chen, Y.; Zhu, M.K. Spatiotemporal Evolution and Driving Mechanism of “Production-Living-Ecology” Functions in China: A Case of Both Sides of Hu Line. Int. J. Environ. Res. Public Health 2022, 19, 3488. [Google Scholar] [CrossRef] [PubMed]
  42. Fan, Y.T.; Jin, X.B.; Gan, L.; Jessup, L.H.; Pijanowski, B.C.; Lin, J.H.; Yang, Q.K.; Lyu, L. Dynamics of spatial associations among multiple land use functions and their driving mechanisms: A case study of the Yangtze River Delta region, China. Environ. Impact Assess. Rev. 2022, 97, 106858. [Google Scholar] [CrossRef]
  43. Zhu, C.M.; Dong, B.Y.; Li, S.N.; Lin, Y.; Shahtahmassebi, A.; You, S.X.; Zhang, J.; Gan, M.Y.; Yang, L.X.; Wang, K. Identifying the trade-offs and synergies among land use functions and their influencing factors from a geospatial perspective: A case study in Hangzhou, China. J. Clean. Prod. 2021, 314, 128026. [Google Scholar] [CrossRef]
  44. Deng, Y.; Yang, R. Influence mechanism of production-living-ecological space changes in the urbanization process of Guangdong Province, China. Land 2021, 10, 1357. [Google Scholar] [CrossRef]
  45. Pan, Z.Z.; He, J.H.; Liu, D.F.; Wang, J.W.; Guo, X.A. Ecosystem health assessment based on ecological integrity and ecosystem services demand in the Middle Reaches of the Yangtze River Economic Belt, China. Sci. Total Environ. 2021, 774, 144837. [Google Scholar] [CrossRef]
  46. Kanter, D.R.; Musumba, M.; Wood, S.L.R.; Palm, C.; Antle, J.; Balvanera, P.; Dale, V.H.; Havlik, P.; Kline, K.L.; Scholes, R.J.; et al. Evaluating agricultural trade-offs in the age of sustainable development. Agric. Syst. 2018, 163, 73–88. [Google Scholar] [CrossRef]
  47. Lu, Q.; Sun, J.; Xiao, Y.; Zhu, S.; Zhu, G.; Liu, J.; Li, X.; Liu, H. The progression traits of spatial conflicts within the production–living–ecological space among varying geomorphological types of mountain–basin areas in karst regions, China. Ecol. Indic. 2024, 166, 112324. [Google Scholar] [CrossRef]
  48. Zhang, S.; Zhao, K.; Ji, S.; Guo, Y.; Wu, F.; Liu, J.; Xie, F. Evolution characteristics, eco-environmental response and influencing factors of production-living-ecological space in the Qinghai–Tibet Plateau. Land 2022, 11, 1020. [Google Scholar] [CrossRef]
  49. Fang, L.L.; Wang, L.C.; Chen, W.X.; Sun, J.; Cao, Q.; Wang, S.Q.; Wang, L.Z. Identifying the impacts of natural and human factors on ecosystem service in the Yangtze and Yellow River Basins. J. Clean. Prod. 2021, 314, 127995. [Google Scholar] [CrossRef]
  50. Zhang, Z.Y.; Liu, Y.F.; Wang, Y.H.; Liu, Y.L.; Zhang, Y.; Zhang, Y. What factors affect the synergy and tradeoff between ecosystem services, and how, from a geospatial perspective? J. Clean. Prod. 2020, 257, 120454. [Google Scholar] [CrossRef]
  51. Mengist, W.; Soromessa, T.; Feyisa, G.L. Landscape change effects on habitat quality in a forest biosphere reserve: Implications for the conservation of native habitats. J. Clean. Prod. 2021, 329, 129778. [Google Scholar] [CrossRef]
  52. Liu, J.; Jin, X.B.; Xu, W.Y.; Fan, Y.T.; Ren, J.; Zhang, X.L.; Zhou, Y.K. Spatial coupling differentiation and development zoning trade-off of land space utilization efficiency in eastern China. Land Use Policy 2019, 85, 310–327. [Google Scholar] [CrossRef]
Figure 1. Synergistic and trade-off relationships among PLU functions.
Land 13 01322 g001
Figure 2. Location and range of the study area. Note: Tianxianqian means Tianmen City, Xiantao City, and Qianjiang City.
Land 13 01322 g002
Figure 3. Temporal variation of PLE functions during 2008–2018. PF is the production function, LF is a living function, and EF is an ecological function.
Land 13 01322 g003
Figure 4. Spatiotemporal patterns of PLE functions in MRYRUA.
Land 13 01322 g004
Figure 5. Temporal variation in trade-offs and synergies between two functions during 2008–2018 in MRYRUA.
Land 13 01322 g005
Figure 6. Spatial distribution of trade-offs and synergies among PLE functions during 2008–2018 in MRYRUA.
Land 13 01322 g006
Figure 7. Spatial distribution of regression coefficients representing the impact of driving factors on trade-offs and synergies between production and living functions.
Land 13 01322 g007
Figure 8. Spatial distribution of regression coefficients representing the impact of driving factors on trade-offs and synergies between production and ecological functions.
Land 13 01322 g008
Figure 9. Spatial distribution of regression coefficients representing the impact of driving factors on trade-offs and synergies between living and ecological functions.
Land 13 01322 g009
Table 1. Indicators and weights for assessing PLE functions.
FunctionsSub-FunctionsIndicatorUnitWeightReference
Production
function
Agricultural
production
function (P1)
Proportion of cultivated land (P11)%0.049[39]
Total output values of agriculture, forestry, animal husbandry, and fishery (P12)108 CNY0.048[22]
Non-
agricultural
production
function (P2)
Real estate development investment (P21)108 CNY0.053[17]
The proportion of the added value of the tertiary industry in GDP (P22)%0.051[39]
Number of employees in the tertiary industry (P23)\0.045[22]
Water used for production and operations (P24)m30.053[16]
Per capita GDP (P25)CNY/
person
0.048[4]
Living
function
Basic living security function (L1)Per capita daily domestic water consumption (L11)L0.052[17]
Proportion of construction land (L12)%0.045[17]
Total retail sales of consumer goods (L13)108 CNY0.041[16]
Social welfare
function (L2)
Education expenditure/government expenditure (L21)%0.052
Number of hospitals and health institutions (L22)\0.047[22]
Living quality function (L3)Population density (L31)person/
km2
0.053[39]
Harmless disposal rate of household garbage (L32)%0.052[4]
Ecological
function
Environmental pollution function (E1)Industrial wastewater discharge (E11)104 t0.052[17]
Industrial sulfur dioxide emissions (E12)t0.053[4]
Environmental governance function (E2)Comprehensive utilization rate of industrial solid waste (E21)%0.052[4]
Centralized treatment rate of sewage treatment plant (E22)%0.052[4]
Environmental beautification function (E3)Greenery coverage in built-up areas (E31)%0.052[4]
Per capita park green space (E32)m2/
person
0.051[4]
Table 2. Classification of trade-offs and synergies between two functions.
TypesClassification Criteria
Positive/Negative CoefficientsSignificance
SynergiesExtremely significant synergy+p ≤ 0.01
Significant synergy+0.01 < p ≤ 0.05
Insignificant synergy+p > 0.05
Trade-offsExtremely significant trade-offp ≤ 0.01
Significant trade-off0.01 < p ≤ 0.05
Insignificant trade-offp > 0.05
Table 3. Description of the driving factors.
Factors TypeIndicatorDescriptionCalculationReference
NaturalElevation (X1)Elevation (m)Extract from DEM[42]
NPP (X2)Net primary productivityArcGIS raster statistics[42]
Precipitation (X3)Annual mean precipitation (mm)ArcGIS raster statistics[43]
Dis2river (X4)Distance to river (m)ArcGIS raster statistics and Euclidean distance[43]
Socio-economicDis2city (X5)Distance to the provincial capital city (m)ArcGIS raster statistics and Euclidean distance[30]
Dis2road (X6)Distance to road (m)ArcGIS raster statistics and Euclidean distance[30]
ED (X7)Economic density
(104 CNY/km2)
GDP/total land area[41]
LUD (X8)Land use degree (\) L = 100 × i = 1 n A i × C i
L is the land use degree, Ai is the grade index of the i-th land use type, and Ci is the percentage of the i-th land use type in the total area
[43]
Disclaimer/Publisher’s Note: The statements, opinions and data contained in all publications are solely those of the individual author(s) and contributor(s) and not of MDPI and/or the editor(s). MDPI and/or the editor(s) disclaim responsibility for any injury to people or property resulting from any ideas, methods, instructions or products referred to in the content.

