Article

Assessment of the Impacts of Climate and Land Use Changes on Water Yield in the Ebinur Lake Basin

1
College of Water Conservancy & Architectural Engineering, Shihezi University, Shihezi 832000, China
2
China Institute of Water Resources and Hydropower Research, Beijing 100038, China
3
School of Civil Engineering, Tianjin University, Tianjin 300072, China
4
College of Management and Economics, Tianjin University, Tianjin 300072, China
*
Authors to whom correspondence should be addressed.
Land 2024, 13(8), 1324; https://doi.org/10.3390/land13081324 (registering DOI)
Submission received: 17 July 2024 / Revised: 17 August 2024 / Accepted: 18 August 2024 / Published: 21 August 2024

Abstract

:
The Ebinur Lake Basin is an ecologically sensitive area in the arid region of northwest China. In recent years, the ecological environment in the basin has continued to deteriorate, and the ecosystem function has been seriously degraded. However, among the functions of the ecosystem in the Ebinur Lake Basin, the water production function is considered to be the core upholding the ecological equilibrium and security of the basin. Water production can reflect the environmental service function, which is essential for the economic vitality and ecological well-being of the basin. The factors that impact water yield are diverse; moreover, of these, climate change and land use conversion are particularly significant. Therefore, understanding how these changes affect water yield will help to formulate proper water management strategies in the basin. Using the InVEST model, this study examined how the water yield evolved and was distributed across the Ebinur Lake Basin between 2000 and 2020 while considering both the temporal and spatial dimensions. Using this foundation, the scenario analysis approach was utilized to explore the impact of climate change and land use conversion on water yield by controlling the variables, and the response of the water yield to climate and land use change was discussed. It was concluded that water yield was on an upward trend from 2000 to 2010, was on a downward trend from 2010 to 2020, and declined from 2000 to 2020 as a whole. Regarding the water yield distribution, higher-water-producing areas were found predominantly in the northwest and southeast and along the higher-altitude rim of the basin. Among the various land categories, the primary types were grassland and unused land, both of which equally and substantially contributed to the water yield, contributing over 85% to the overall water yield. The response of the water yield varied significantly among various land use types when their areas changed, and the land conversion over this period contributed to a slight decline in water yield across the basin. The influence of climate change on water yield in the Ebinur Lake Basin during the study period surpassed that of land use by a wide margin, constituting more than 86% of the total impact. This study can provide relevant information for relevant policies and decisions on the optimal allocation of land use in the Ebinur Lake Basin and can provide scientific development for the comprehensive evaluation of water resources and sustainable development of the basin.

1. Introduction

The ecosystem services that humans rely on depend on interactions among culture, supply, regulation, and other functions [1,2]. Ecosystem functions can be defined as the warrant and fundament of ecosystem services, which are vital for the development of humans and society [3]. According to the 2005 Ecosystem Assessment Report [4], more than half of the ecosystems in the world are in a degraded state, and the degradation of water production can have irreversible impacts on human production and livelihoods. After Costanza [5] published a landmark article on ecosystem services in 1997, many scholars at home and abroad have begun to study ecosystem services in depth [6,7]. With the aggravation of global climate change, water scarcity, and water security, the spatial and quantitative evaluation of regional water yield has turned into a critical area of ongoing research [5,8,9]. Water yield is a vital aspect of ecosystems, particularly in arid regions. It has a significant function within several industries and people’s lives as a resource in the industrial, fisheries, agricultural, and recreational fields [10]. Water yield is related to human development and economic advancement on the one hand and natural geographic conditions and climatic factors on the other [11]. In addition, it has been found that the essential elements impacting the amount of water production are climate variations and alterations in land use [12]. In particular, the influence of climate on a basin’s water yield is achieved by affecting evapotranspiration and precipitation [13,14], while land use indirectly changes the water yield by changing the groundwater in the basin [15]. Therefore, to manage water resources in future development better, understanding and analyzing how the water resources react to alterations in land use and climate variations is essential [16].
There is a need for a model to evaluate ecosystem services, which may involve quantitative and simple methods of the evaluation of ecosystem services, especially the water yield in a given scenario [17,18]. In light of growing concerns about impacts on water productivity due to climate variability and land use transfer, a growing number of researchers have been developing model simulations to enhance the estimation of water production [19,20]. Compared with other models, the InVEST model demonstrates greater stability, can be used to evaluate ecosystem services, and can be used to visualize evaluation results with the help of the GIS platform. Water balance forms the theoretical underpinning of the InVEST model. Therefore, InVEST can quantitatively and dynamically evaluate the water production function of ecosystems based on factors such as soil, climate, and land use [8,9,21]. Because the model is easy to use and the modeling parameters are relatively few, InVEST has been widely used in domestic and foreign research. For example, Marquèsa et al. [22], Leh et al. [20], and Redhead et al. [23] have used the model for related studies. In addition, the outcomes of their investigations that were presented were rather positive in most cases. A number of Chinese scholars have also employed the InVEST water yield module to analyze the features of water yield in some regions. As an example, the water produced and its distribution patterns over time and space in the mountainous areas [24], five major river basins in Shangluo City, Shaanxi Province [25], three parallel river areas (Yunnan, Sichuan, and the Tibetan border) [26], plateau lakes [27], and other areas were scientifically evaluated, and these findings are considered important for the planning of water resources and irrigation in the intended areas.
The Ebinur Lake Basin in northwest China is an area of concern for ecological security issues [28,29]. Currently, there is much research focused on evaluating the worth of ecosystem services [29,30]. While there is ample research on land use transfer in the research area [31], studies focusing on the spatial distribution and mechanisms influencing water production are limited. Therefore, the purpose of this study was to explore the current situation and the characteristics of the spatial and temporal variations in water production in the basin, to clarify the water production characteristics of different vegetation types, and to further analyze the impacts of climate and land use changes on water yield. These will provide a scientific basis for the establishment of ecological barriers and the optimization of water resources in the basin.

2. Materials and Methods
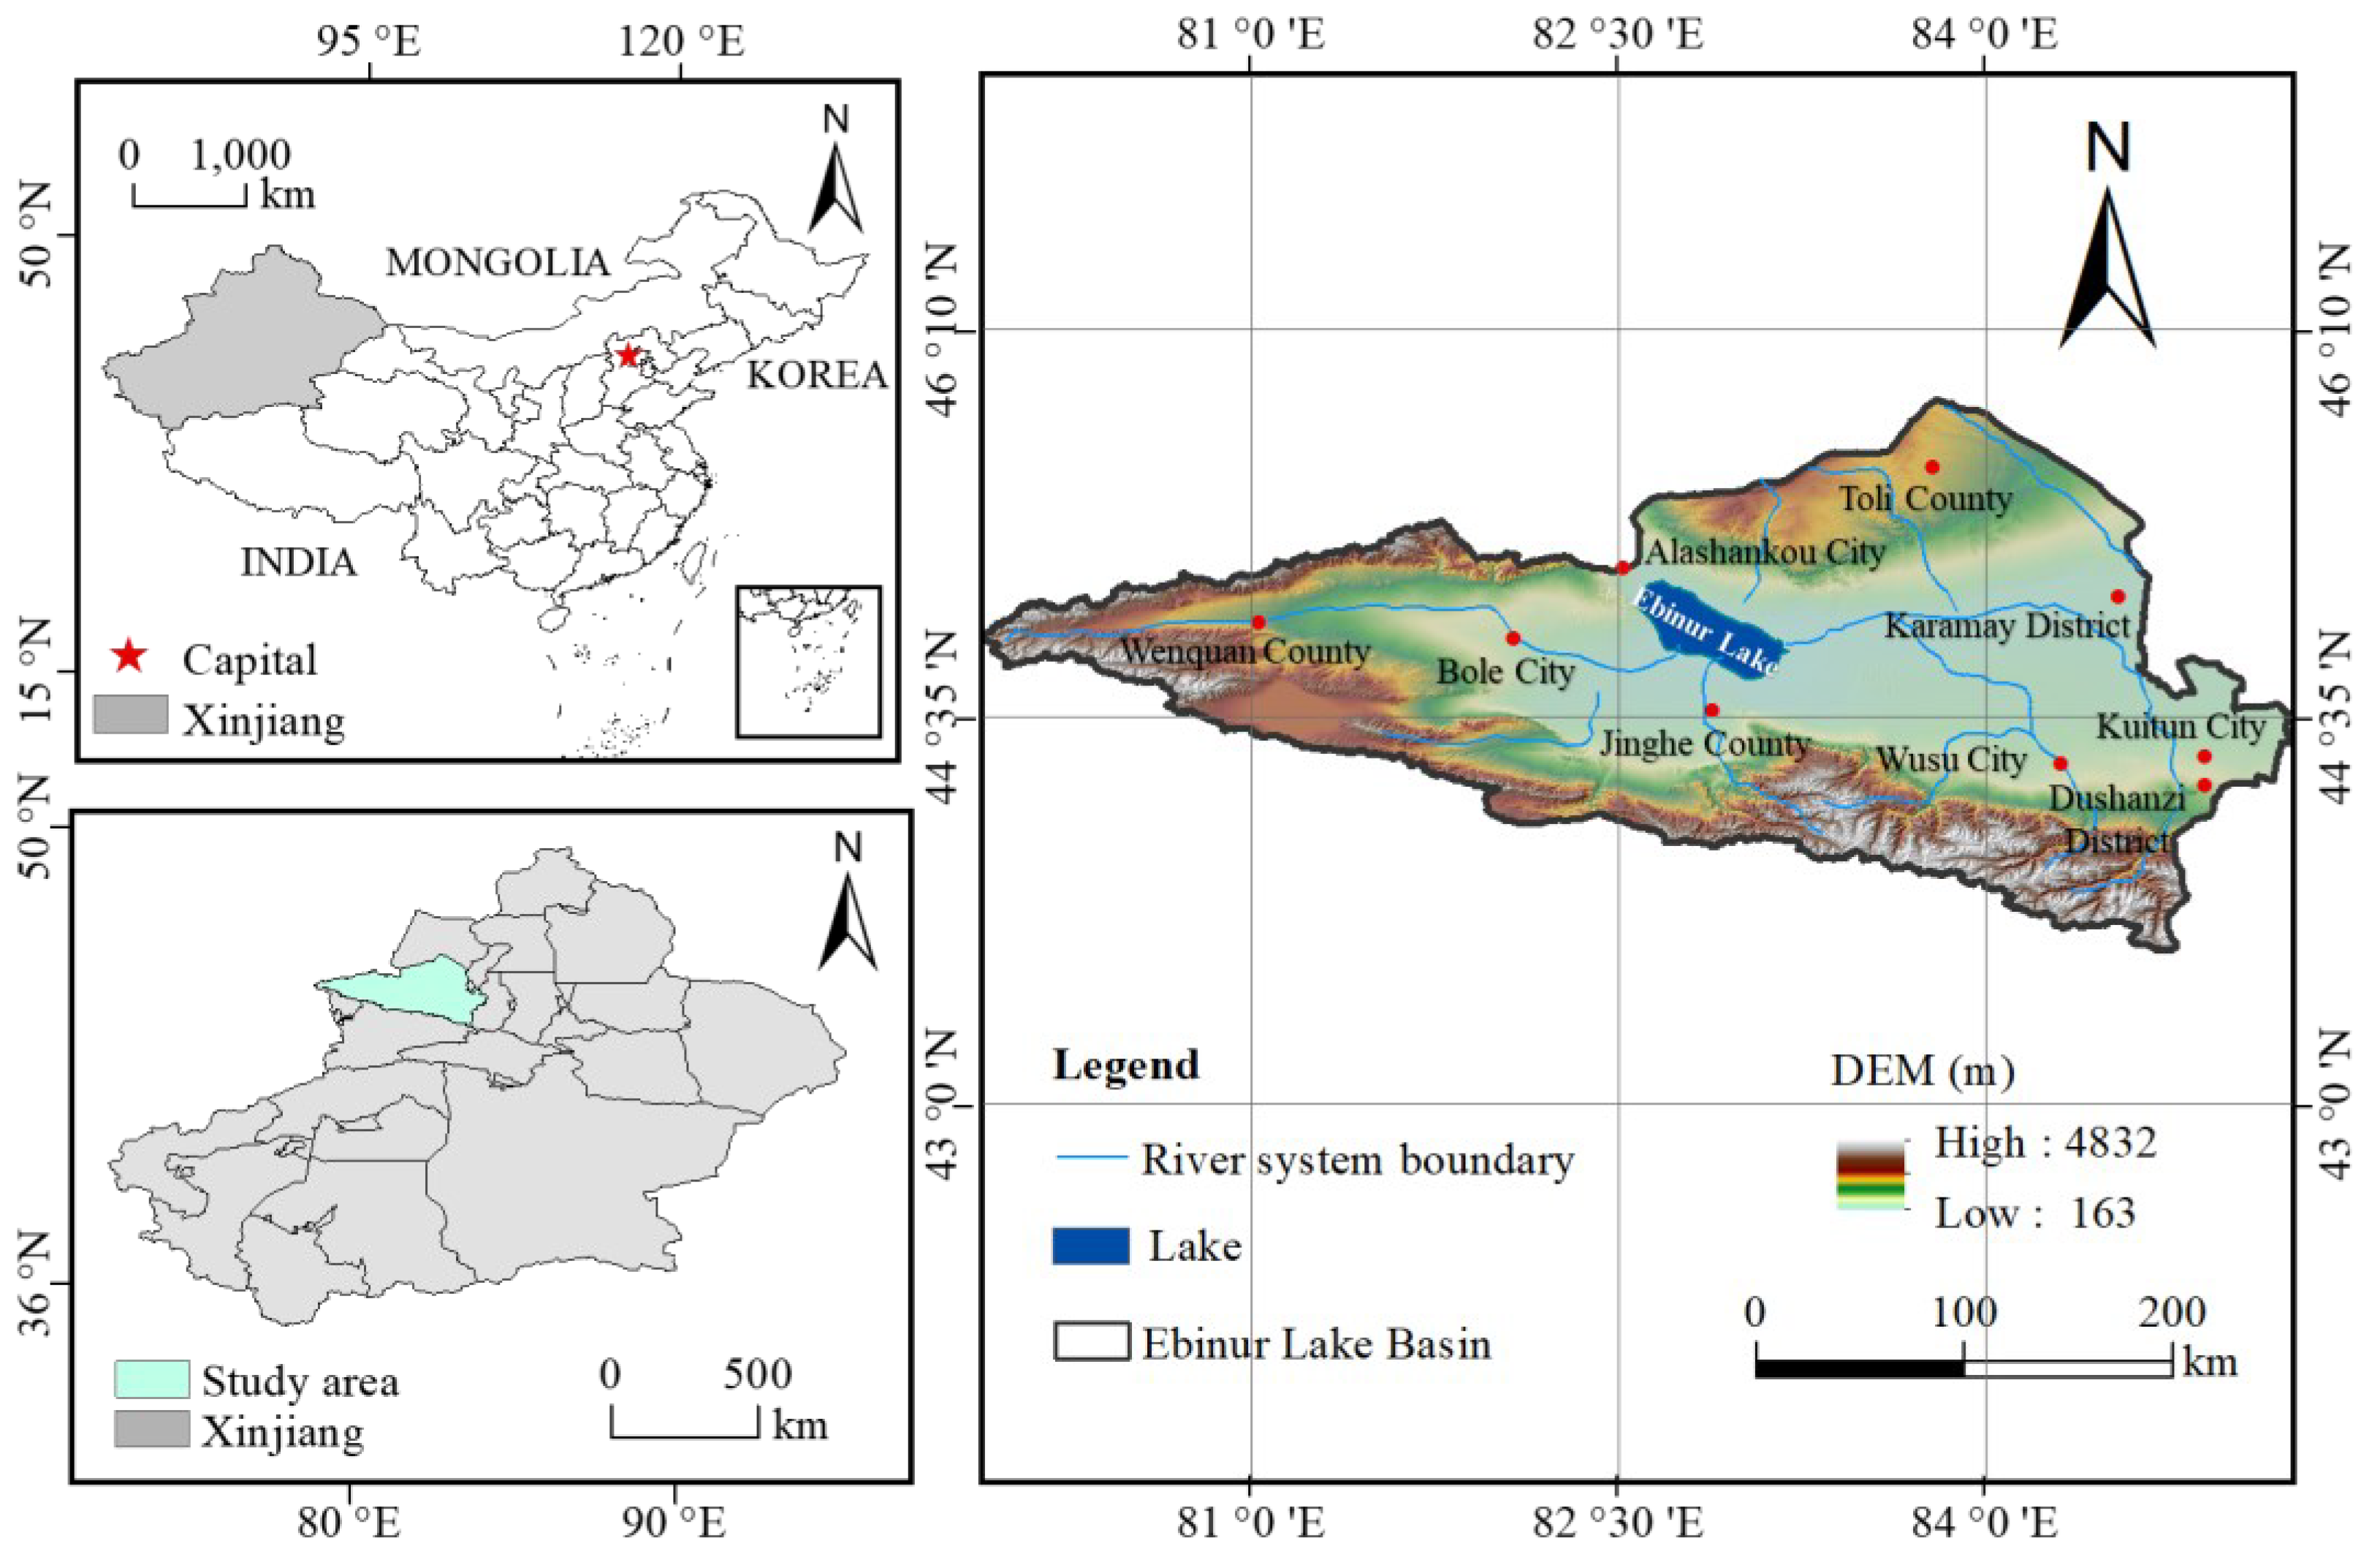
2.1. Study Area

Situated in the northwest of China’s Xinjiang Autonomous Region, the Ebinur Lake Basin ranges from 43°38′ to 45°52′ N and from 79°53′ to 85°02′ E (Figure 1). It is enclosed by mountains on its southern, eastern, and western sides, with the Bortala Valley nestled in its center. The tailing Ebinur Lake in the east is connected to the Junggar Basin on the whole [32]. The entire Ebinur Lake Basin covers approximately 50,621 square kilometers, and its topography mainly includes mountains and plains. Due to the topography, the climate in this area changes drastically. The annual mean temperature is around 8 °C, and there is an annual average of about 2800 h of sunshine. In addition, the region’s annual precipitation is about 100–300 mm, the yearly evaporation is 1300–2000 mm, sunshine is abundant, rainfall is scarce, and evapotranspiration is intense [32,33]. Its ecosystems and water resources are highly vulnerable to climate change, and river runoff in the Ebinur Lake Basin is vital for the sustainable development of the Bortala Autonomous Region. As a result, international organizations have been focusing on issues related to the degradation of the area’s environment [31].

2.2. InVEST Model

The InVEST model (the ecosystem services and trade-off comprehensive valuation model) is an ArcGIS-based ecosystem service assessment tool and an open-source model. At present, different scholars have summarized the advantages of the InVEST model relative to other models [34,35,36]. Firstly, scenario prediction is an important function of the model, as it can be used to predict the changes in different development directions through the setting of data. For example, it can improve its policies and decisions by predicting the scenarios of different interventions and configurations of land use change. Secondly, the InVEST model has a strong spatial expression ability, and the results of its model simulation can be visualized to a higher degree through the ArcGIS platform. Finally, compared with other models, the InVEST model also has the advantages of less input data, a large number of exports, and quantitative analysis of some ecological service functions. From the release of the first edition of InVEST 1.0 in March 2008 to InVEST 3.14.0 used in this study, the model has been constantly innovated and improved, and major breakthroughs and progress have been made in the comprehensiveness of the evaluation content and the independence of the platform. Since InVEST 3.0, the model has an independent platform and interface, and it can be run separately from the ArcGIS platform.
The data and parameters required for the water yield module of the InVEST model include the following: precipitation, evapotranspiration, the depth of the root restriction layer, the available water content of plants, LUCC, watershed boundaries, a biophysical parameter table, and seasonal factor Z. The parameters in the biophysical table can be obtained by consulting the literature, while other data need to be processed using ArcGIS to reach the data format required by the model, followed by inputting these spatial data into the water yield module of the model. Through the operation of the module, a large amount of target data can be output, the corresponding data can be imported into ArcGIS, and visual data, such as a spatial distribution map of water yield, can be obtained.
In the application, the water yield depends on the water balance, whereby the actual evapotranspiration, which includes surface evaporation and vegetation evapotranspiration, is subtracted from the precipitation at the raster level to arrive at a raster-level water yield [18,37]. The modeling algorithm is generated using Equation (1), as follows:
Y x j = 1 A E T x j P x × P x
In Equation (1), Y x j ( m m ) represents the mean water production in the land use unit   x ; A E T x j ( m m ) denotes the effective annual evapotranspiration of the j th land use unit   x ; and P x is the average annual precipitation. Equation (2) adopts Budyko’s coupled hydrothermal balance hypothesis equation [23,38,39], as follows:
A E T x j P x = 1 + ω x R x j 1 + ω x R x j + 1 R x j
where R x j is a dimensionless drying index summed up as the proportion of potential evapotranspiration with respect to precipitation, while ω x is not a physical characteristic of vegetation but serves to transform the proportion of actual plant water supply and annual precipitation. Both of these are dimensionless parameters, and Equations (3) and (4) can reflect the calculation process as follows:
ω x = Z × A W C x p x
R x j = K c × E T 0 x P x
where K c   is the crop evapotranspiration coefficient; E T 0 x (mm/a) is the reference evapotranspiration of unit x ;   Z is an empirical constant that depends on the pattern of precipitation and hydrogeological characteristics of the region and takes a value between 1 and 30; and A W C x (mm) is the water content of vegetation, which depends on the soil characteristics and the depth of the rootage system. It is determined by Equation (5), as follows:
A W C x = M i n R L D x , R D x × P A W C x
where R L D x is an abbreviation for the depth to which any root of a plant species can grow within specific soil because of alterations in either the physical or chemical characteristics of the soil, and R D x stands for the depth up to which 95% of the total root biomass is present in the vegetation type. P A W C x refers to the water content that is actually accessible to plants and is usually determined by Equation (6), as follows:
P A W C x = 54.509 0.132 × S a n d 0.03 × S a n d 2 0.55 × S i l t 0.006 × S i l t 2 0.738 × C l a y + 0.007 × C l a y 2 2.688 × C + 0.501 × C 2
where S a n d ,   S i l t , and C l a y   (%) are the cumulative percentages of sand, silt, and clay in the soil, respectively, and C is the percentage of organic matter in the soil. For more detailed information on the approach, one can refer to the InVEST model’s user manual [40].

2.3. Data Acquisition
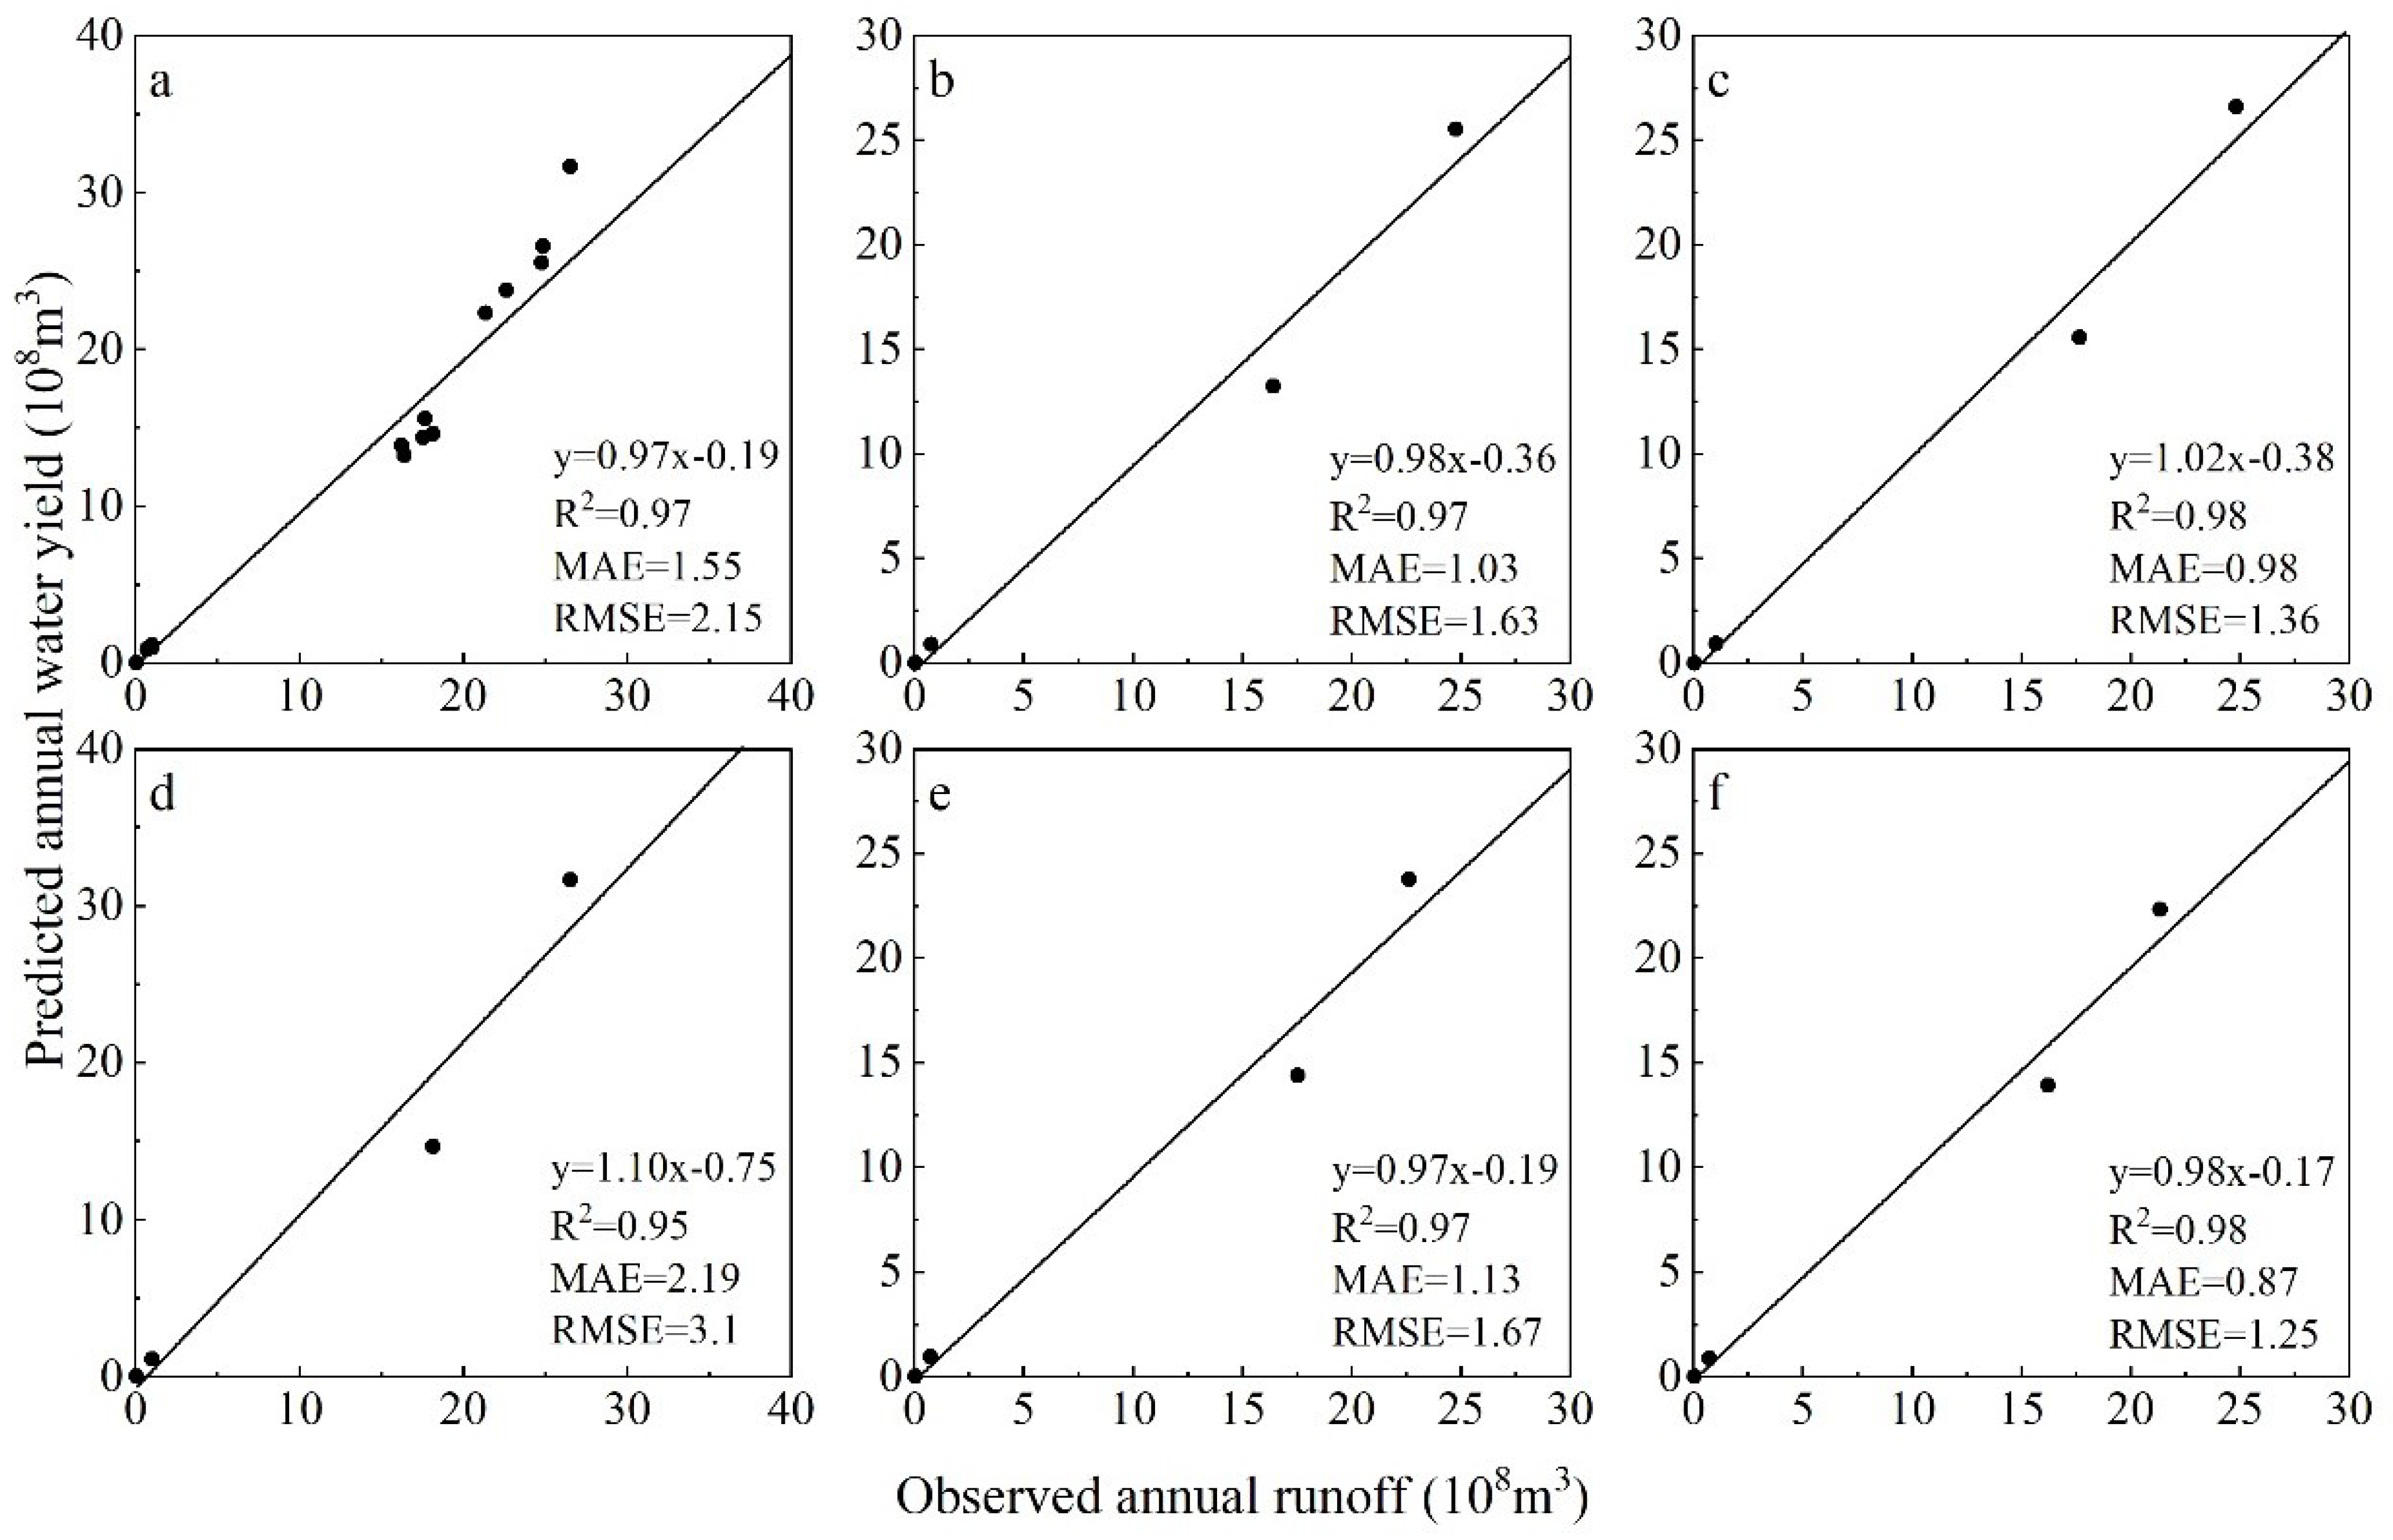
Essential inputs for this study model include the available water content of plants, depth of the root restriction layer, annual precipitation, annual reference evaporation, LUCC, study watershed boundary, and relevant biophysical parameters. The biophysical table includes the vegetation root depth and evapotranspiration coefficient (KC, and its data need to be determined based on the vegetation characteristics of the study area’s flora. All of the spatial data in this study were shadowed to the same coordinate system (WGS_1984_UTM_Zone_50N), and the spatial resolution of the raster data was resampled to 100 m in ArcGIS. Table 1 and Table 2 list the data collection addresses and detailed data descriptions of the collected information.

2.4. Model Rates

In the water yield simulation, the seasonal factor Z was the only parameter that needed to be calibrated. The Ebinur Lake Basin involves a total of four prefecture-level administrative regions, namely, Karamay City, Bortala Mongolian Autonomous Prefecture, Ili Kazak Autonomous Prefecture, and Tacheng area, and the measured surface water resources information of these four prefectures is available. Therefore, the Z parameter could be calibrated based on the measured water volumes of the four prefecture-level administrative regions in the Ebinur Lake Basin in 1990. Then, the robustness of the calibrated model was verified by using the measured values of the surface water resources in 2000, 2005, 2010, 2015, and 2020 to verify the stability of the model simulation performance.
Regarding the validation of the model, this study not only used the three metrics of absolute error ( M A E ) , root-mean-square error ( R M S E ) , and coefficient of determination ( R 2 ) , but also analyzed this with independent sample testing (Table 3). The calculation process of M A E , R M S E , and R 2 can be reflected in Equations (7)–(9), as follows:
M A E = 1 n i = 1 n P i O i
R M S E = 1 n i = 1 n ( P i O i ) 2
R 2 = i = 1 n ( P i O i ) 2 i = 1 n ( O i O ) 2
where O i represents the measured surface water resource volume of different administrative districts, P i is the estimated value of water production in different administrative districts, O i ¯ is the average of the specific surface water resource volume taken, and n is the number of administrative districts.
The Z-value was constantly adjusted, and then each simulated water production value for the four geographical districts was compared with the measured surface water resources in 1990. It was found that, with a calibrated Z-value of 1.3, the simulated values in 1990 were closest to the measured values with the smallest relative error. Figure 2 shows the performance of the calibrated model, showing that R2 was always above 0.9 during all simulations. The value of R2 ranged from 0 to 1, of which that greater than 0.5 is considered to be good performance. Table 3 shows the results of the independent samples test, from which it can be seen that the Levene’s variance chi-square test shows that the p-value is greater than 0.05 for all regions, indicating that it can be assumed that the variance is chi-square for all regions. Subsequently, the independent samples t-test shows that the p-value for all regions is greater than 0.05, which implies that there is no significant difference between the simulated mean and the actual measurements for the four administrative regions for the years 2000, 2005, 2010, 2015, and 2020. Thus, it can be seen that the InVEST model had high prediction accuracy for water yield in the study area.

2.5. Scenario Analysis

The InVEST model allows for the simulation of Ebinur Lake’s water yield during the period from 2000 to 2020. Six scenarios were designed using scenario simulation to comprehend the implications of climate change and land use transfer for water yield (Table 4). Because the InVEST model is based on the principle of water balance, the simulation results are mainly affected by precipitation and actual evapotranspiration, while the actual evapotranspiration is mainly affected by vegetation and land use types, therefore, the climate change scenario in this study was achieved by changing the precipitation data. For the six scenarios, the period 2000–2020 was divided into three time stages of 2000–2020, 2000–2010, and 2010–2020. Then, two scenarios of only climate change and only land use conversion were set at each time stage. The actual situation in the table involved inputting the actually relevant climate and land use data from the corresponding year into the model. For the climate change scenarios in the three time periods, the control of land use data was unchanged, and there was only a change in the climate data, as shown in Table 4, Scenarios S1–S3. The land use conversion scenario referred to the control of the meteorological data in the three time periods, and there was only conversion in the land use data, as shown in Table 4, Scenarios S4–S6. Using this method, we analyzed how climate conditions and land use practices separately influence water yield. Using Scenario 1 as a case in point, the climate was taken from the data for 2020, and the land use was taken from the data for 2000. In contrast to the actual situation in 2000, the land use data were the same, and only the climate data were changed. Therefore, in this scenario, we were able to assess how climate change affected the basin’s water yield during the period from 2000 to 2020. Similarly, in Scenario 4, compared with the real situation in 2000, the climate data were unaltered, with only the land use data being updated to the data in 2020. Thus, this allowed for studying how the land use affected water production in ecosystems between 2000 and 2020. Finally, these six scenarios were compared with the actual scenario to reveal the effects of climate shifts and land use conversion on water yield across three distinct time stages.
Equations (10) and (11) allow for the evaluation of the proportions of climate change and land alteration impacts on variations in water yield across various scenarios [38], as follows:
G c = ( C / C + L ) × 100 %
G L = ( L / C + L ) × 100 %
where G c represents the proportion of climate change towards ecosystem water provision services, G L is the proportionate contribution of land use conversion to the ecosystem water provision service, C stands for the alteration in water production of the respective ecosystem under climate change, and L is the alteration in water production of the respective ecosystem under land use change.

3. Results

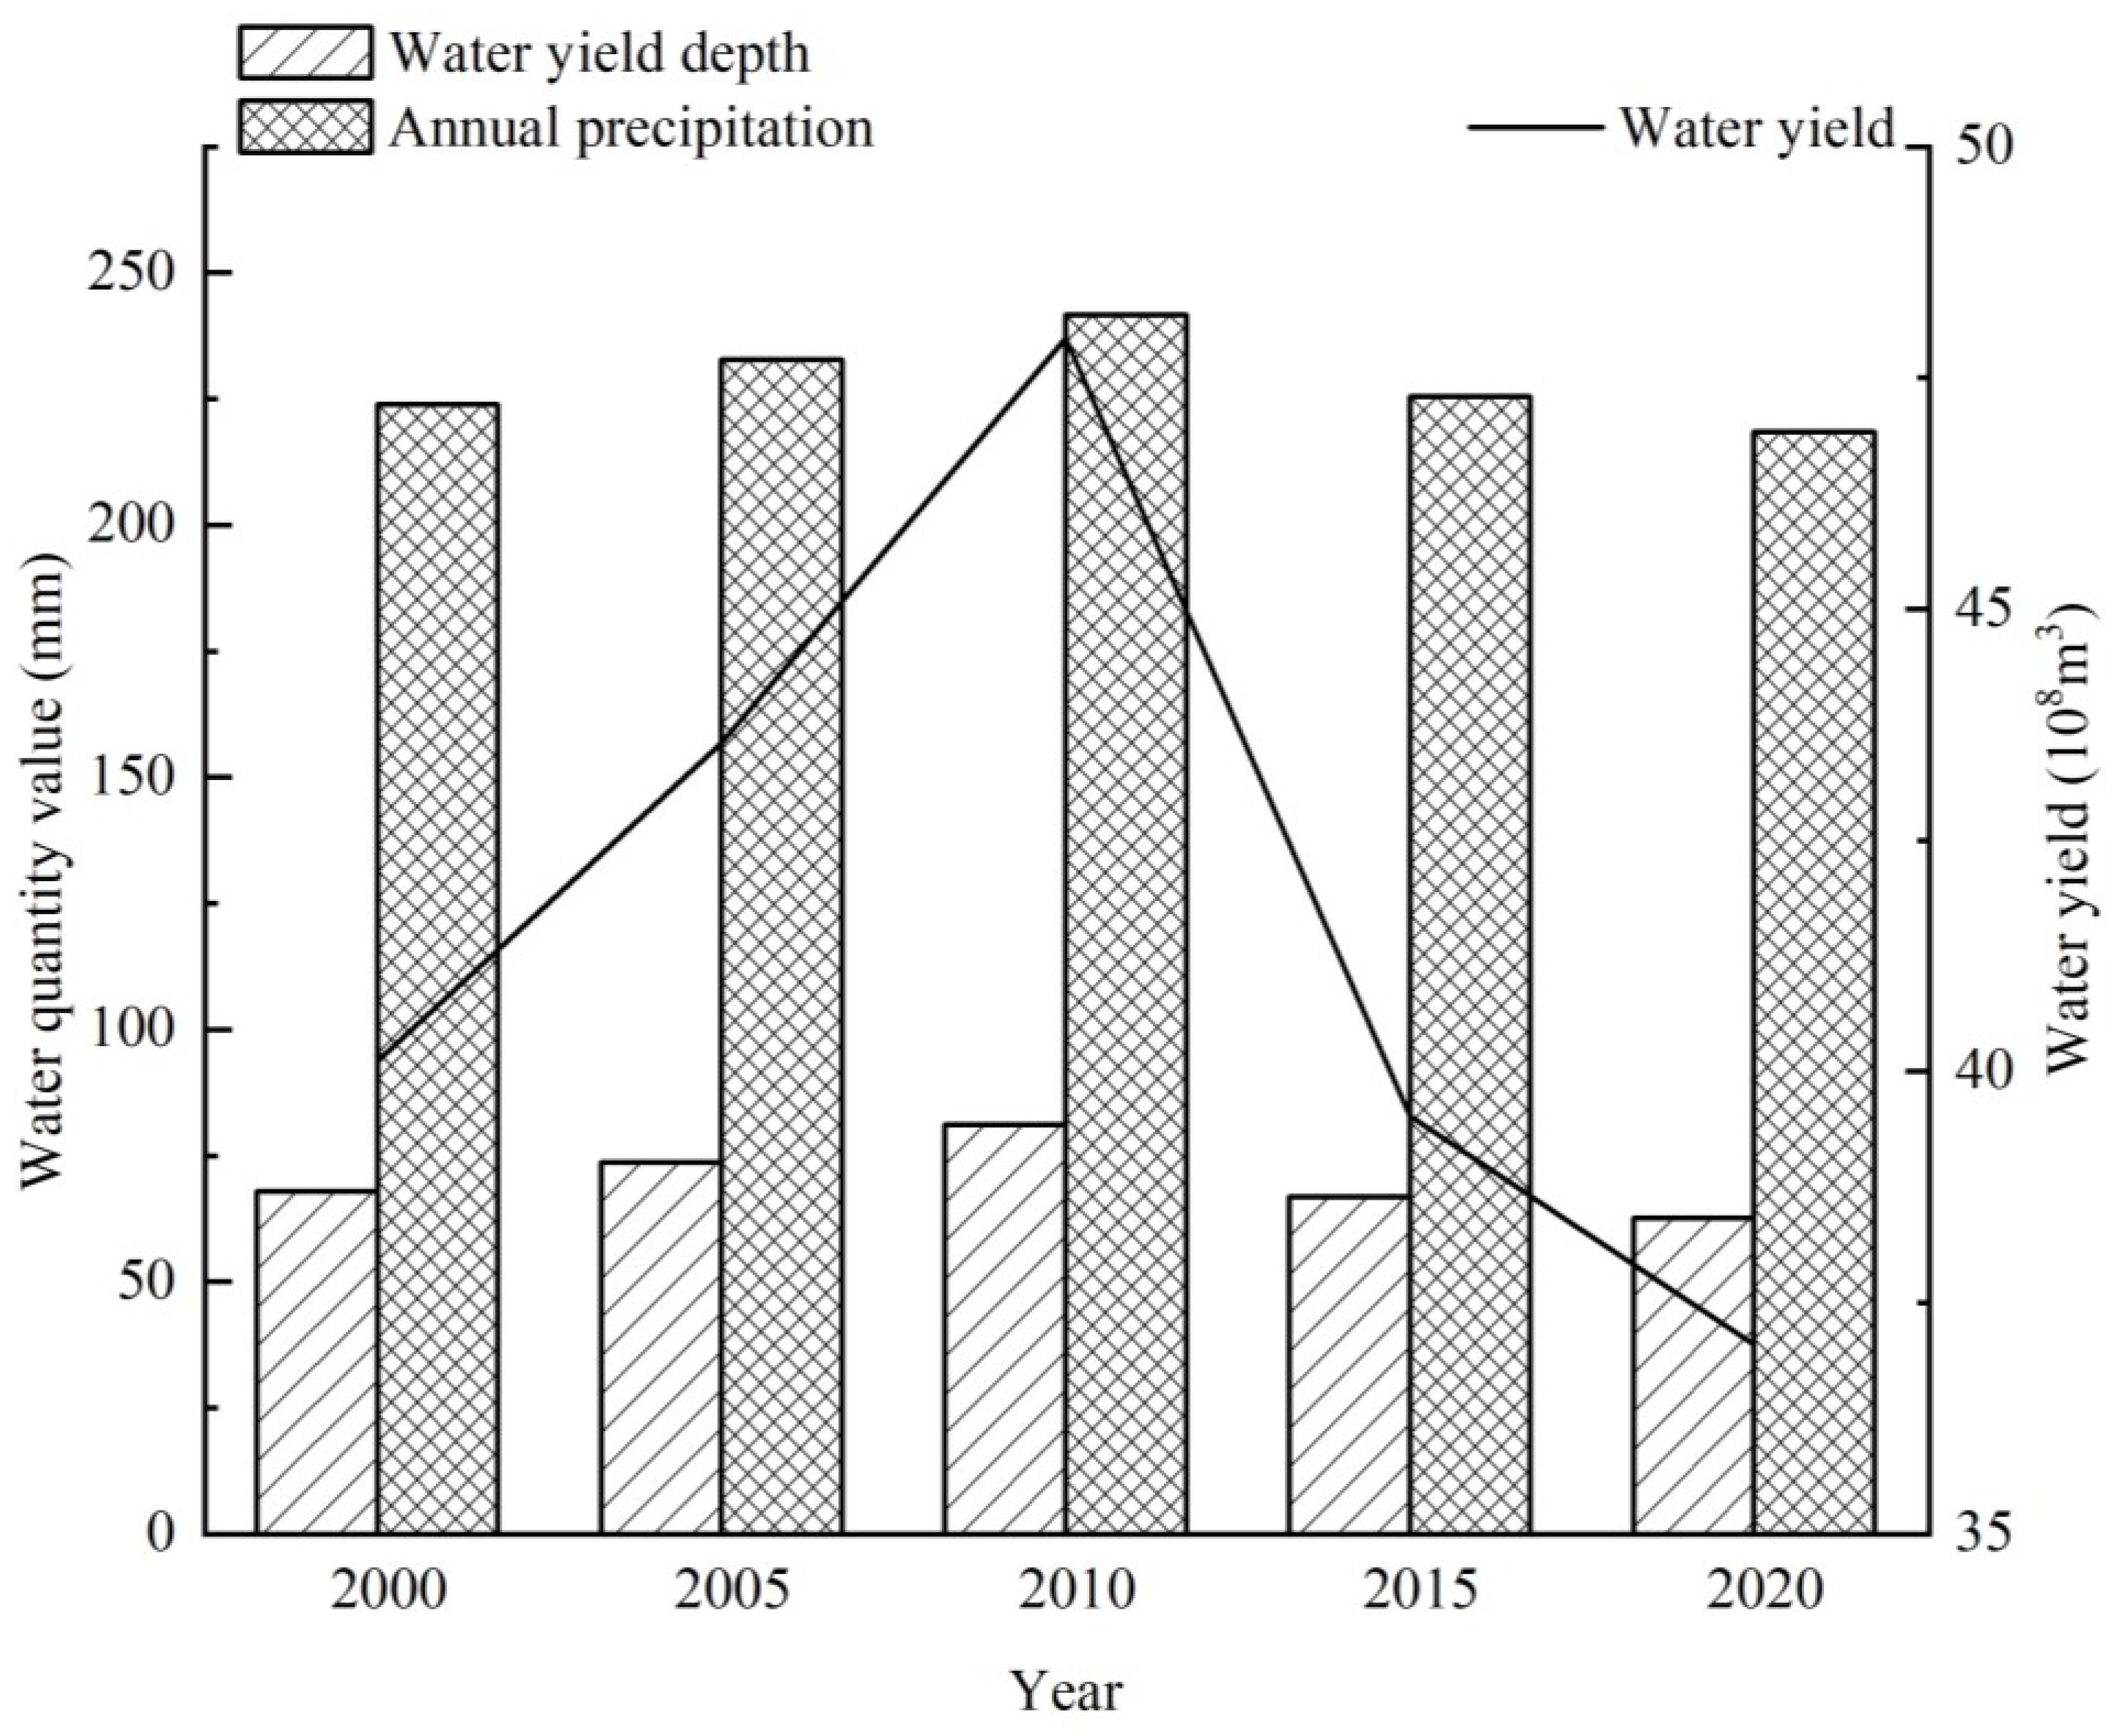
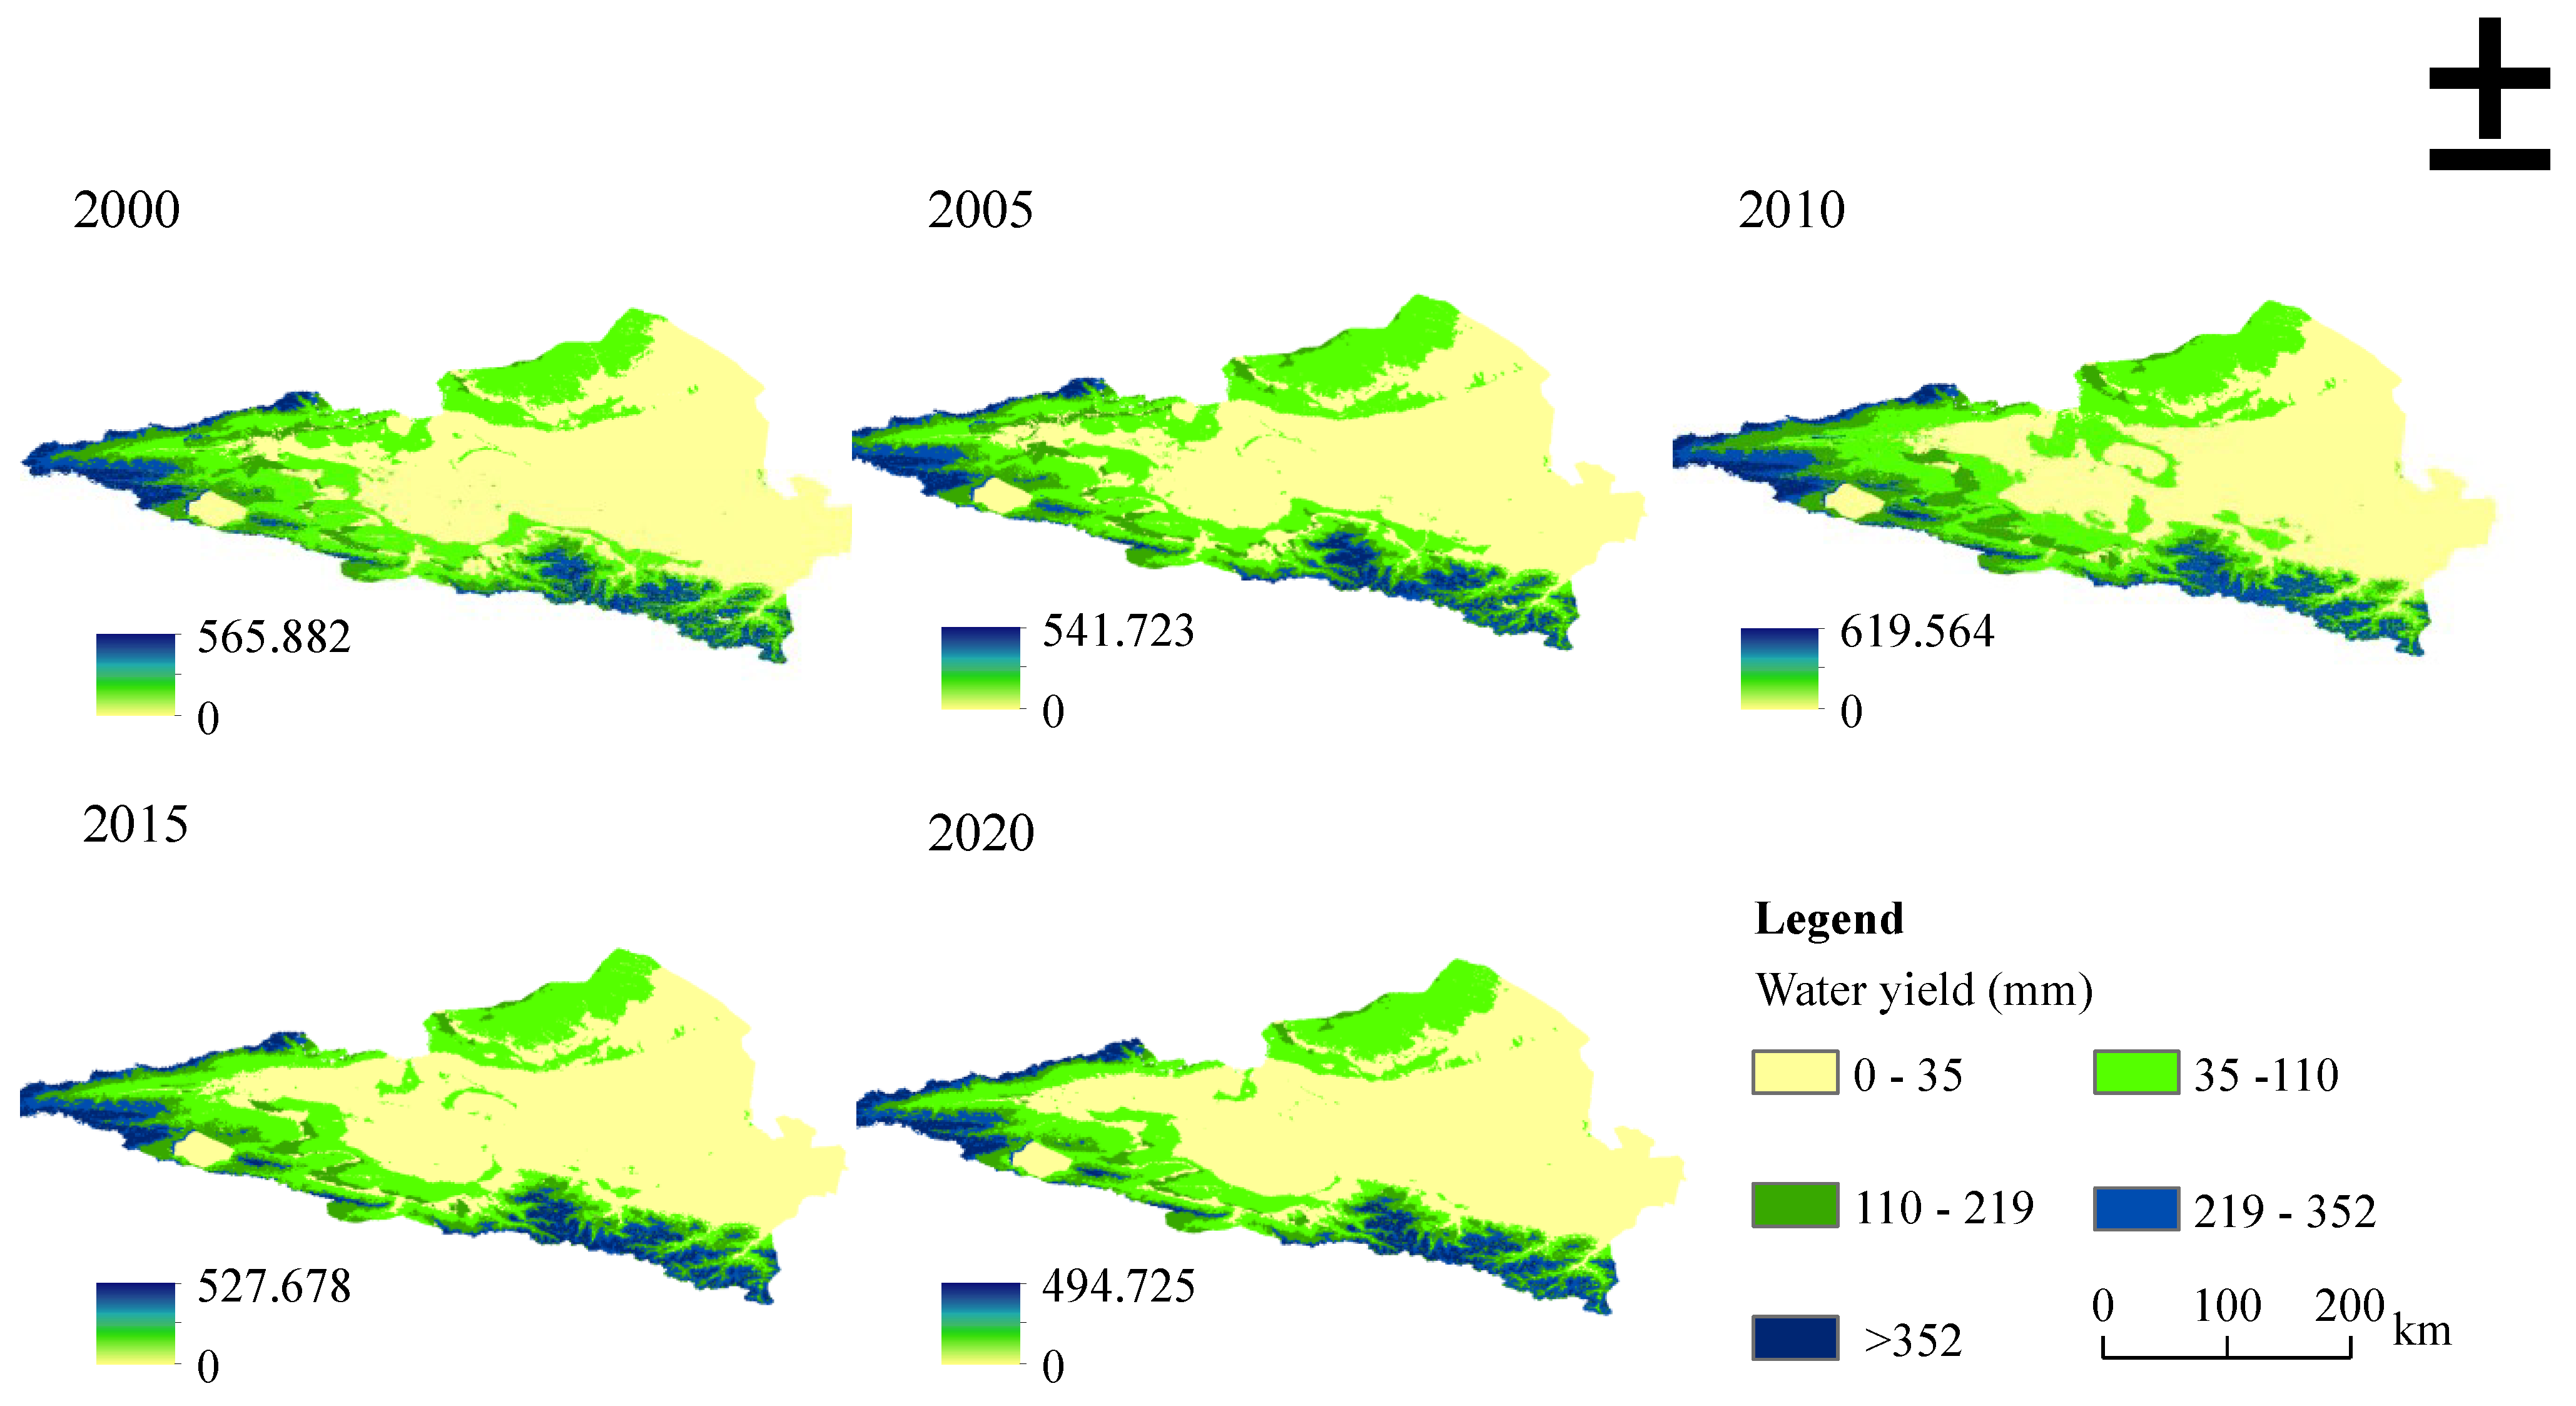
3.1. Temporal and Spatial Dynamics of Water Yield in the Ebinur Lake Basin

From 2000 to 2020, the water yield depth in the Ebinur Lake Basin ranged from 62.68 mm to 81.09 mm. The water production depths in 2000, 2005, 2010, 2015, and 2020 were 67.86 mm, 73.68 mm, 81.09 mm, 66.86 mm, and 62.68 mm, respectively. During this period, the depth of water production showed an inverted ‘V-type’ law of rising first and then falling (Figure 3). The annual water production in the Ebinur Lake Basin was ranked as follows: 2010 (4.793 billion m3) > 2005 (4.355 billion m3) > 2000 (4.011 billion m3) > 2015 (3.952 billion m3) > 2020 (3.705 billion m3). As can be observed in Figure 3 above, the overall water production had a clear trend of change, with the general tendency of growth followed by a decline, and with the highest value occurring in 2010 and the lowest in 2020. From 2000 to 2010, the amount of water production increased by 782 million m3, with an average annual change rate of about 1.95%. Between 2010 and 2020, water production saw a reduction of 1.088 billion m3, and the average annual change rate during this period was 2.27%. Overall, the water production in the region decreased.
The spatial distribution pattern map of the water yield grade (Figure 4) shows the spatial distribution characteristics of the water yield in the Ebinur Lake Basin from 2000 to 2020. By using the standard deviation classification method in the ArcGIS 10.8.1 the water yield of the basin was divided into the following five grades: low, lower, medium, higher, and high. In this figure, we can see how the distribution of high and low water yields was spatially consistent in the basin throughout the study period. The water yield distribution features within the basin exhibited distinct spatial patterns. High water yield values predominated in the western and southeast regions, whereas lower values were predominantly found in the central and eastern regions. Low-grade areas tended to cluster together, while other grade areas were arranged in bands. Furthermore, the water yield tended to be higher in the high-altitude marginal areas of the basin compared with the low-altitude areas. The administrative regions were ranked from high to low water yield as follows: Wenquan County, Wusu City, Jinghe County, Bole City, Toli County, Nileke County, Shuanghe City, Alashankou City, Dushanzi District, Kuitun City, Shawan County, and Karamay District. There was also spatial and temporal coherence when it came to the total water yield of the Ebinur Lake Basin and the water yield of each administrative district for different years.

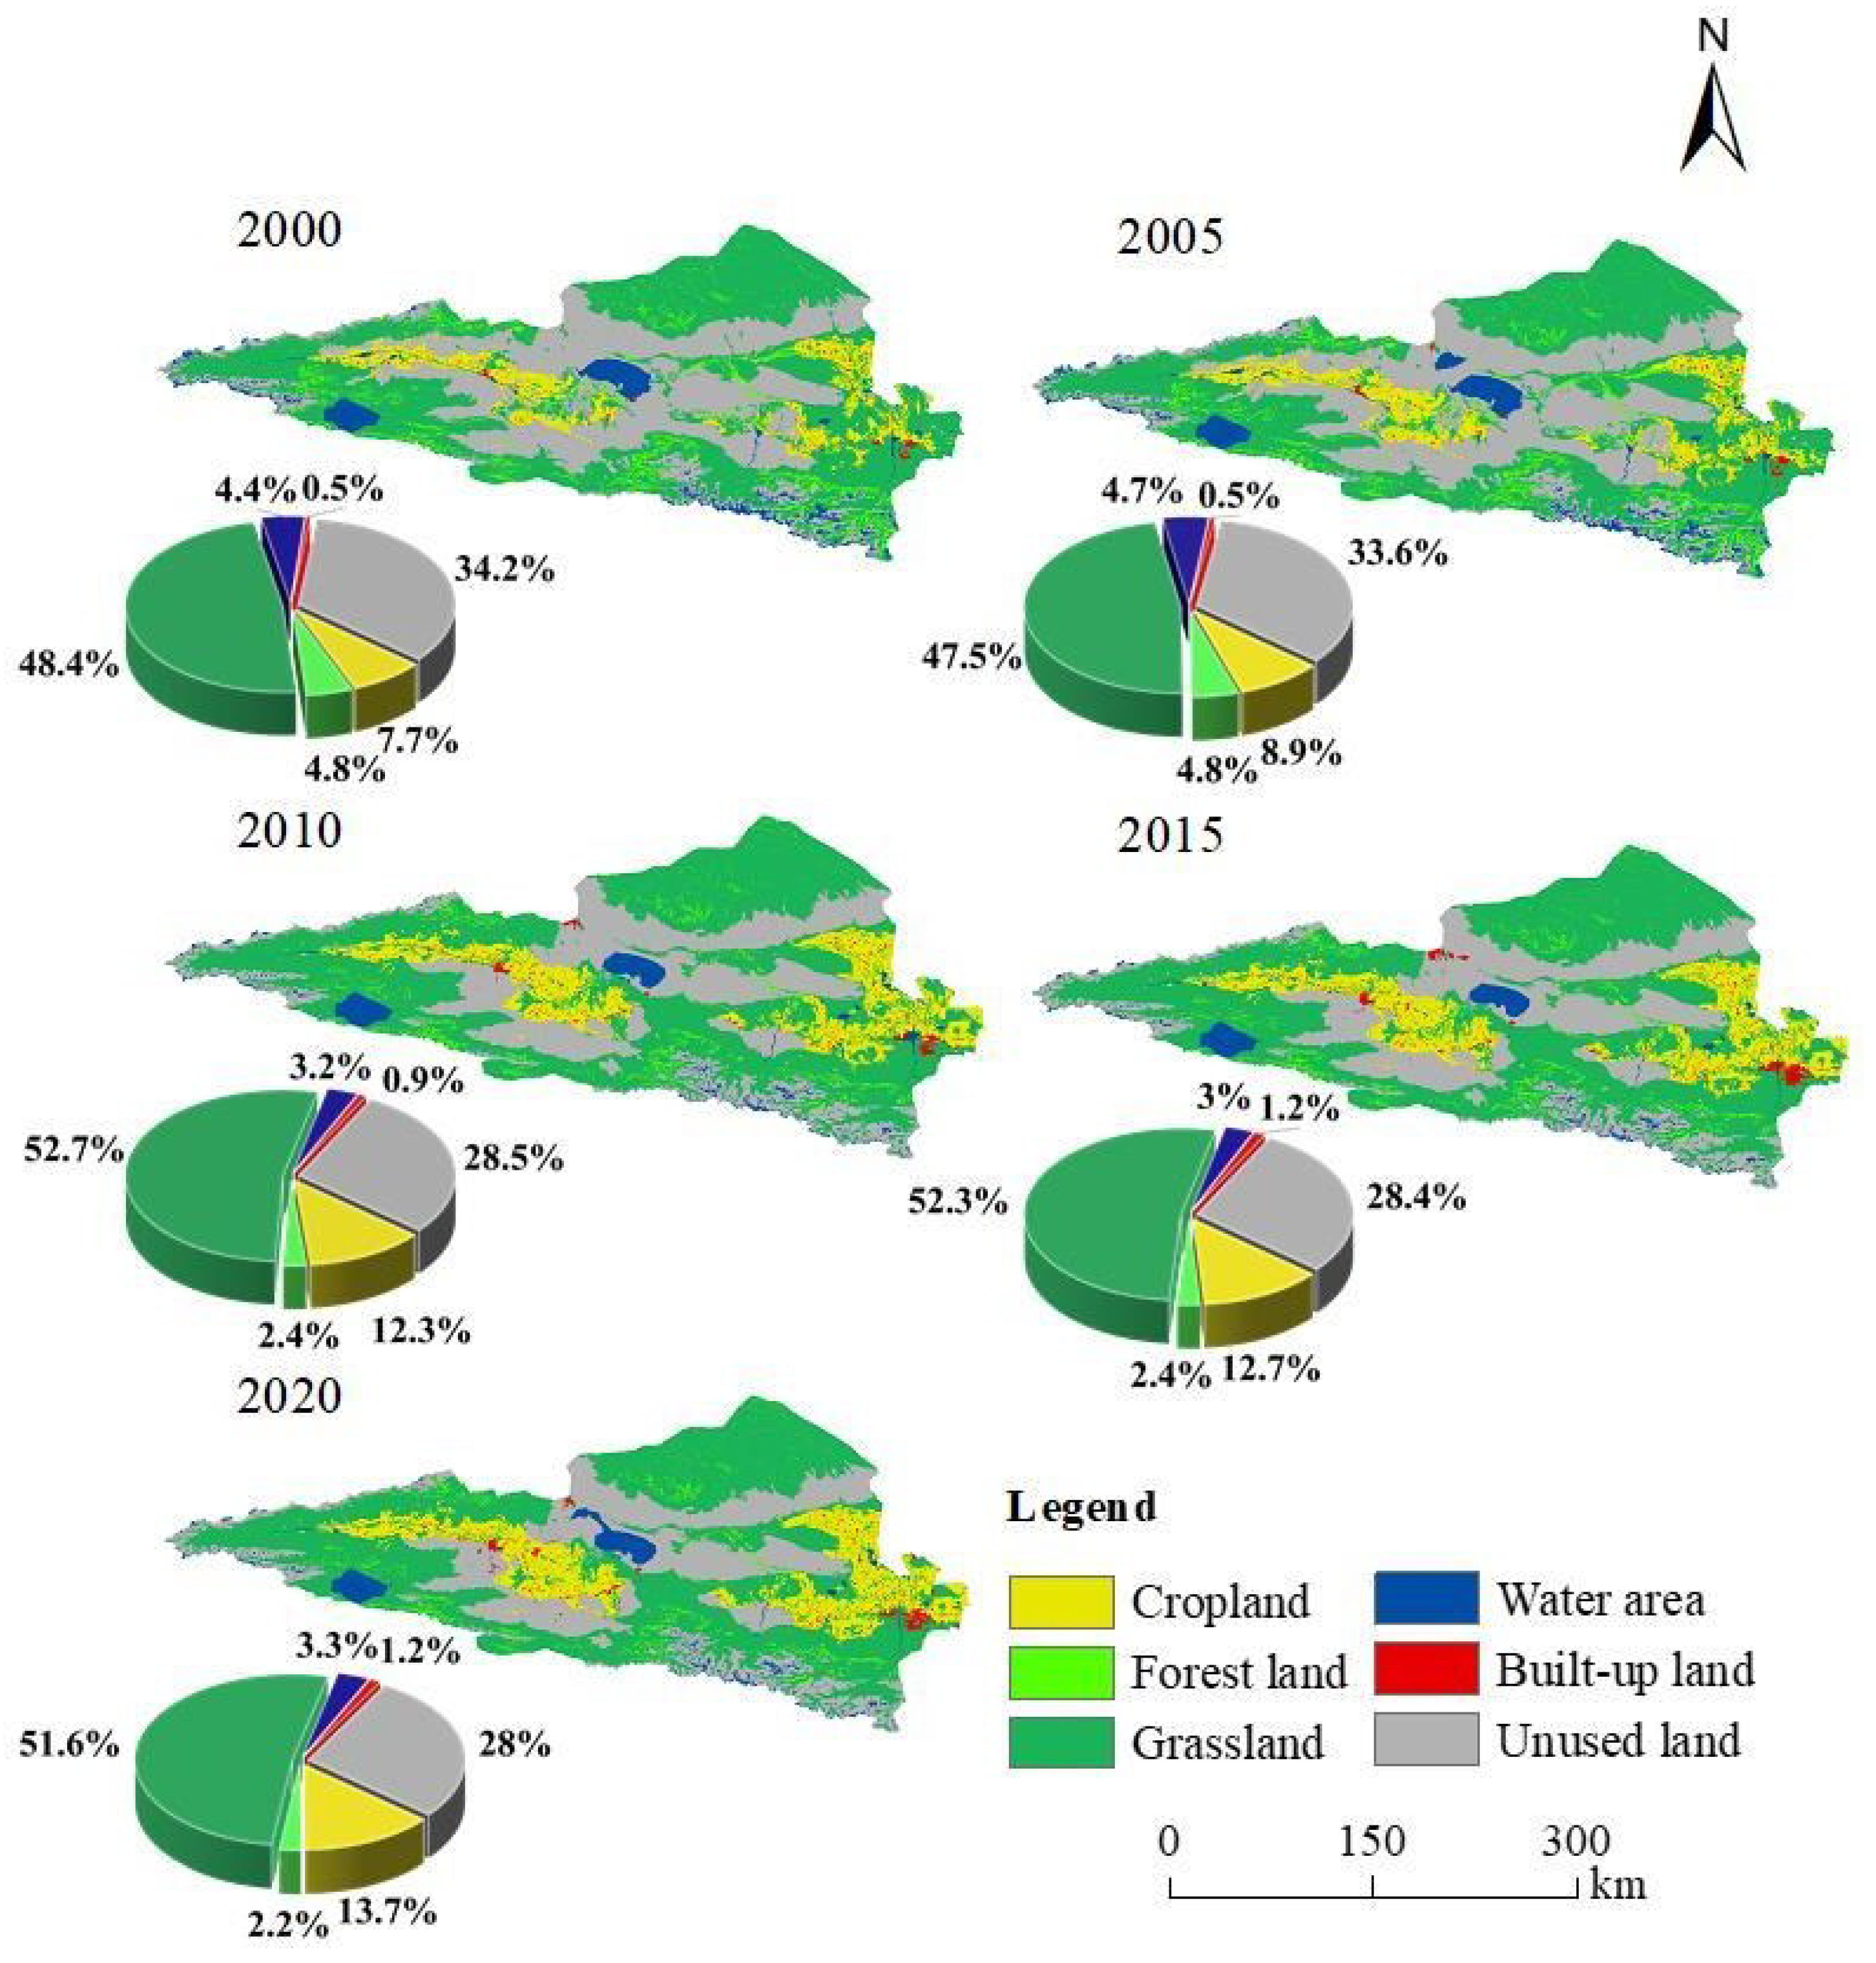
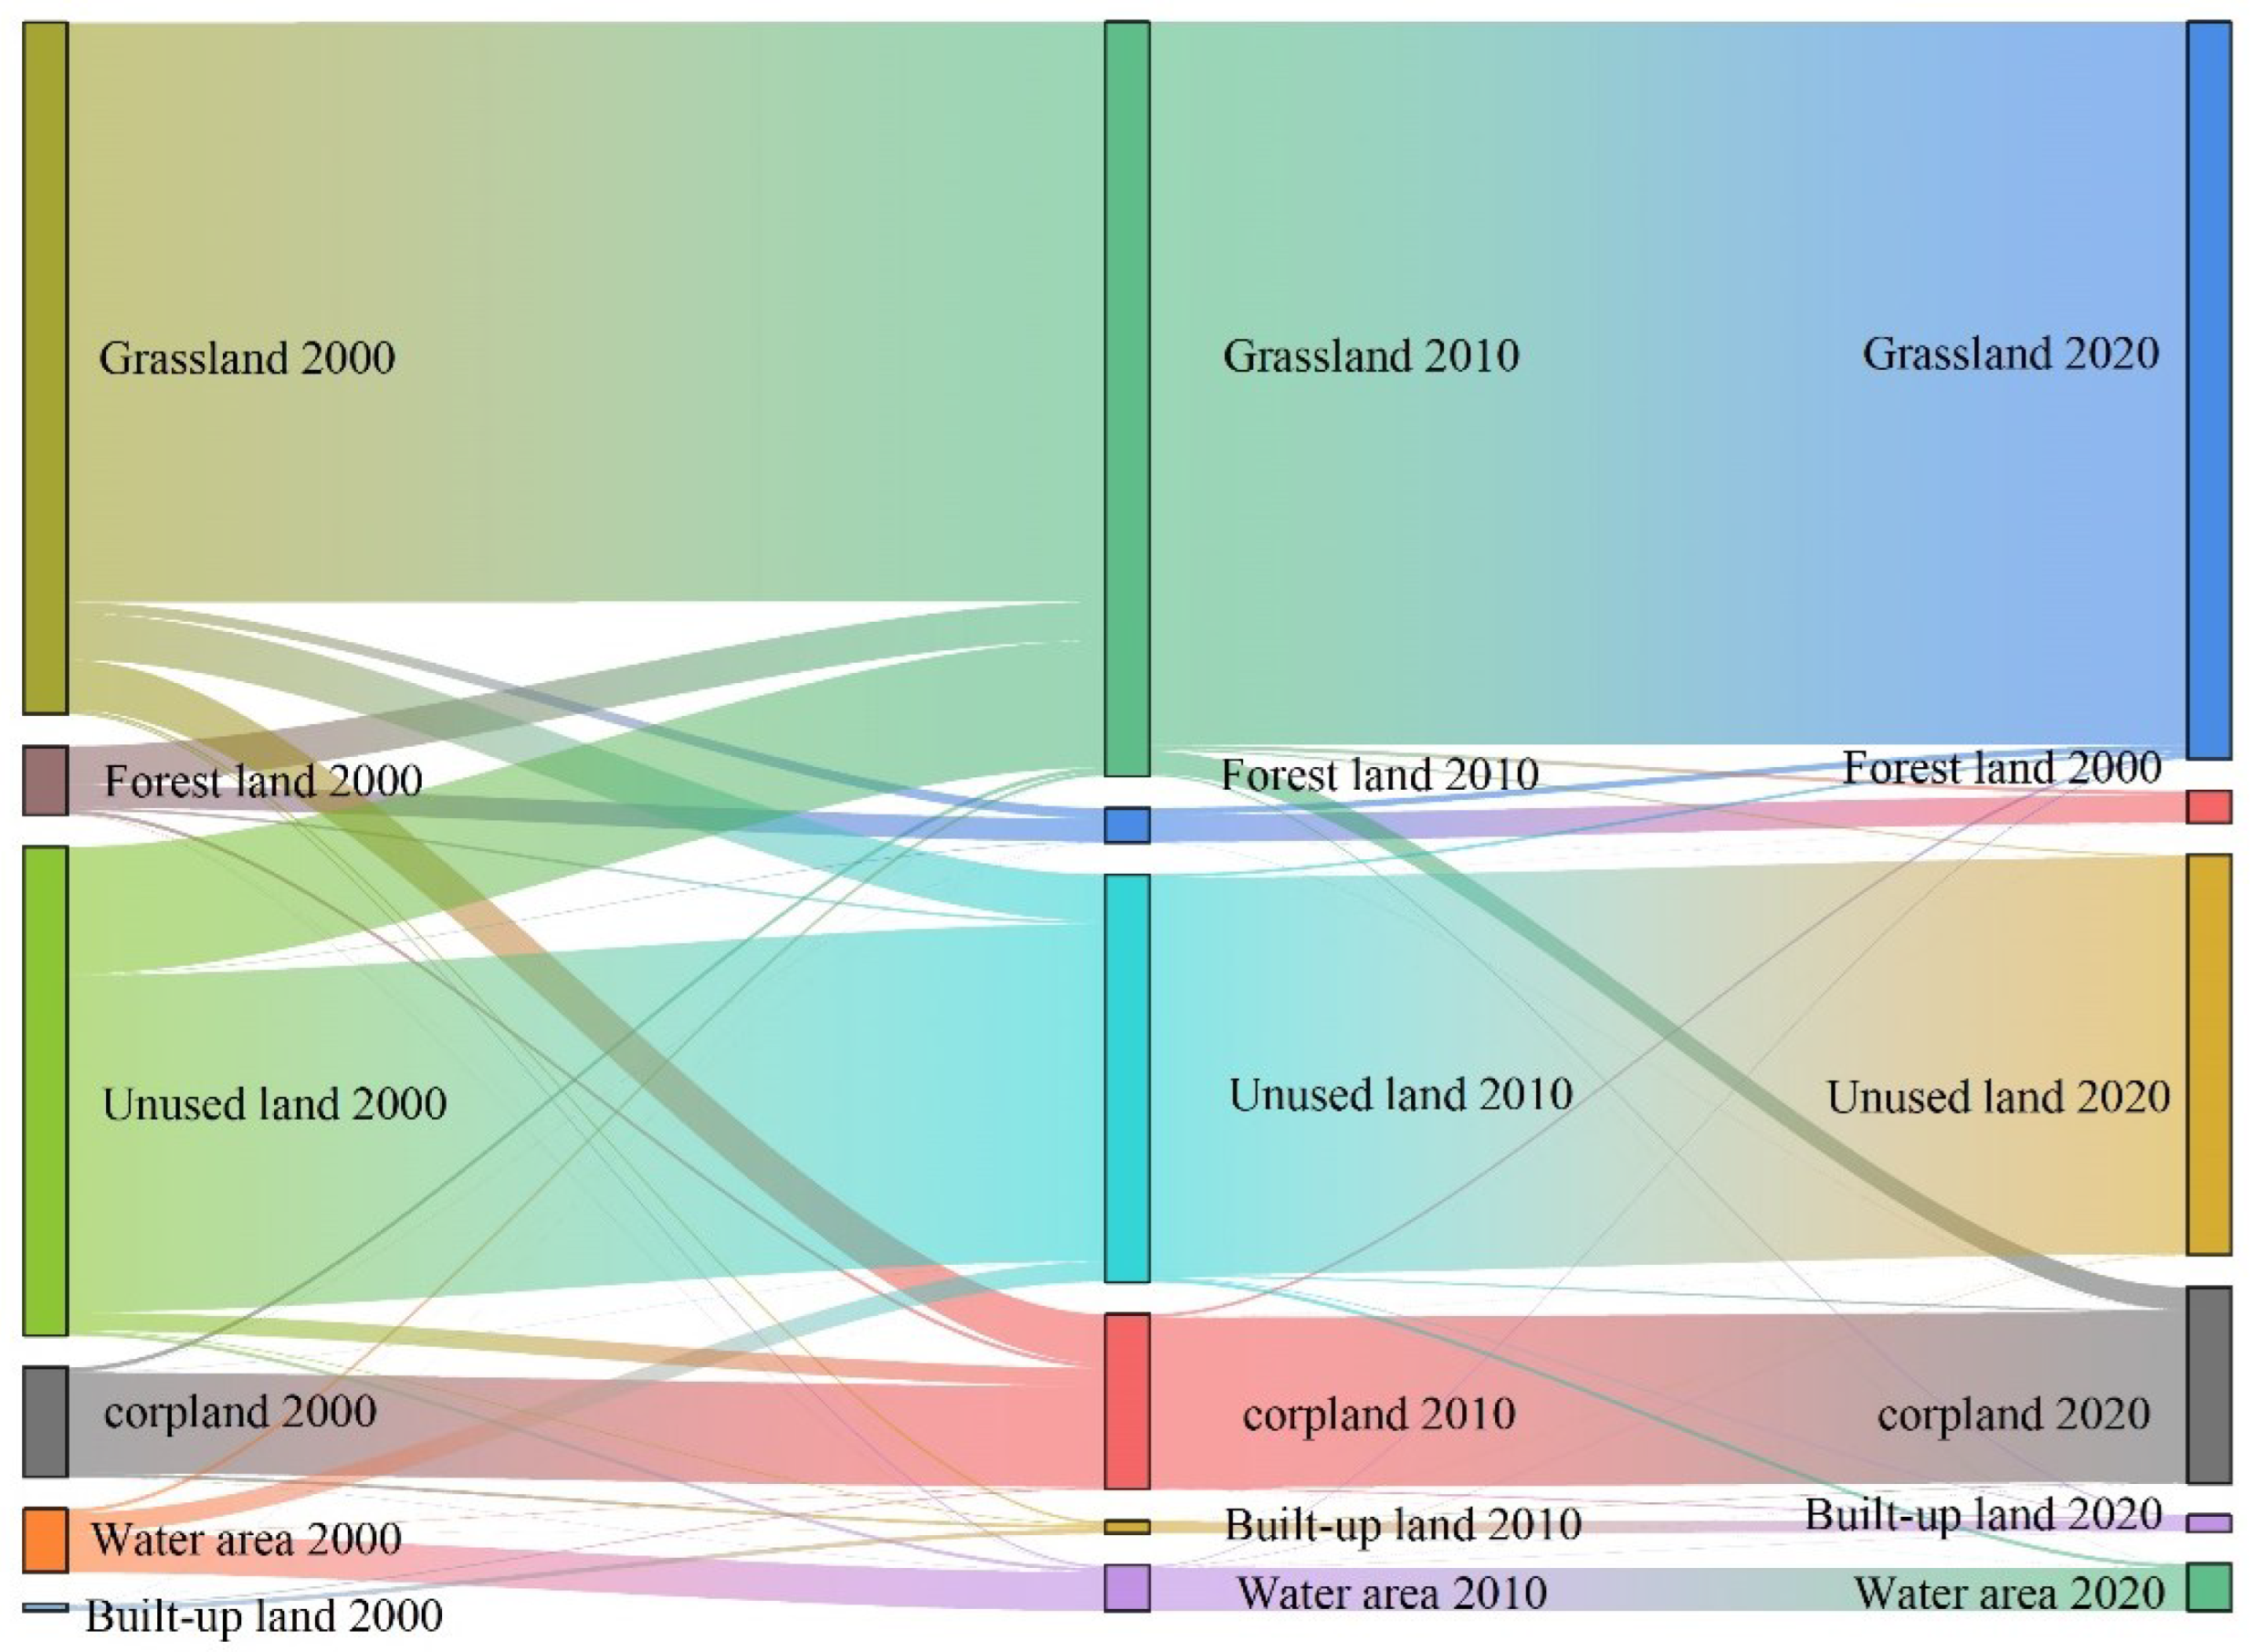
3.2. Analysis of Land Use Change Characteristics during 2000–2020

Figure 5 illustrates the distribution of various land categories within the Ebinur Lake Basin during 2000–2020. The findings indicate that the primary land categories within the study basin consisted predominantly of unused land and grassy terrain, collectively occupying over 80% of the river basin’s total area on an annual average basis. However, the coverage area of other land types was small, and the area of cultivated land, water area, and area of forest land accounted for about 11.06%, 3.72%, and 3.32%, respectivley. The smallest area was that of construction land, accounting for only about 0.86%. Compared with 2000, the area of cropland, built-up land, and grassland increased by 6.59%, 78.53%, and 148.64%, respectively, in 2020. The forested areas experienced a reduction of 53.63%, while water bodies saw a decline of 23.53%, and unused land decreased by 18.04%. In general, the categories of land use underwent a significant transformation.
Against the background of the increase in population and urbanization in the same period from 2000 to 2020, the area of cropland increased, and the area change rate was as follows: 15.31% in 2005, 38.32% in 2010, 3.51% in 2015, and 8.13% in 2020. From the change rate in the area, it can be seen that the rate of increase in cropland increased first and then decreased. The area change rate of forest land was as follows: 0.12% in 2005, −49.79% in 2010, −0.36% in 2015, and −7.42% in 2020. From 2000 to 2020, the forest area increased slightly but began to decrease in the following years. Between 2005 and 2015, the construction area on the land used for development grew rapidly. The change rate of built-up land was as follows: 15.70% in 2005, 60.70% in 2010, 38.16% in 2015, and −3.21% in 2020. The area changes in the remaining three types of land use were small.
The land use transfer matrix (Table 5) and the land use Sangji map (Figure 6) visually illustrate the alterations in the transfer status of various land use types over the course of the investigation period. Table 4 specifically reflects the extent of transformation in land utilization from 2000 to 2020. The main transformation directions of cropland were grassland and construction land, with transfer areas of 161.17 km2 and 175.38 km2, accounting for 43.94% and 47.81% of the total land conversion area. The land type into which forest land was converted was mainly grassland; furthermore, the land type into which grassland was converted was mainly cultivated land, and the transfer area was 2544 km2, accounting for 49.98% of the transfer area. In addition, there were also water areas that were converted into unused land, which may have been due to the reduction in the extent of snow and ice in the mountainous zones of the area. The built-up land was predominantly transformed into cropland, covering 56.88 km2. The unused plots were chiefly repurposed into grasslands, covering 5008.74 km2, which represented 76.84% of the overall transfer area of unused land. Among the six types of land use, cropland saw the most significant increase in area, while the unused land experienced the largest decrease, reflecting impacts from human development and construction efforts.

3.3. Differences in Water Yield by Land Use Type

The characteristics of various types of land use are often different when it comes to their water yield. From the perspective of water yield per unit area (water yield depth) of different land use types (Table 6 and Figure 7), the unused land had the greatest average water yield depth, measuring more than 100 mm. The other three land use categories had lower average water yield depths. In contrast, the average depths for cropland and built-up land were very small at 7.25 mm and 1.55 mm, respectively. Therefore, the most significant water-yielding capacity within the watershed was exhibited by unused land and grassland, followed by forested land and water bodies, and the lowest water-yielding capacity was found in the cropland and built-up land. In terms of water production, almost all of the water yield came from unused land and grassland, constituting over 85% of the overall yield. The forest land and water areas, on the other hand, accounted for only a small portion of the overall yield. Even though the water yield depth was also higher in forest lands and water bodies, they had less of an influence on the total water production because of their small proportion of the area.
In the Ebinur Lake Basin, the extent of the built-up land, as well as the cropland, increased every year. The volume of unused land and forest land decreased every year. The water land and grassland areas fluctuated significantly. Both the water yield depth of a land use type and the area of that type affect the amount of water produced by that land use type. Figure 8 shows that the trend of change in the cropland water yield depth and its area was consistent from 2005 to 2010, with an upward trend and a positive correlation, while the opposite change and a negative correlation were found for the other periods. The water yield depth and its trends of the changes in the area of both forest land and unused land were consistent and positively correlated in the period of 2010–2020. For the grassland type, the trend of both indicators was consistent and positively correlated from 2005 to 2010, and it was negatively correlated with opposite changes only from 2000 to 2005. For the water type, the trends of the water yield and its area were consistent and positively correlated only during 2005–2010, with opposite changes in the other periods. On built-up land, the two trends were consistent in 2005–2010 and 2015–2020, with a negative correlation in the other periods. Factors affecting the relationship between the water yield depth and changes in the area of each type included not only land use changes but also climate change and anthropogenic influences. The quantity of water generated differed among the various land use categories, influenced by factors such as water production depth and area.

3.4. Effects of Climate Change and Land Use Modifications on Water Yield

This study set up climate change scenarios and land use change scenarios to discuss the impacts of the two on water yield, and the climate change scenarios were achieved by changing the precipitation data. Table 7 shows the simulation results. In the real case, water yield decreased by 307 million m3 (7.65%) between 2000 and 2020, increased by 781 million m3 (19.47%) between 2000 and 2010, and decreased by 1088 million m3 (22.71%) between 2010 and 2020. Scenarios 1, 2, and 3 involved changes in the climate element only, and Scenarios 4, 5, and 6 involved changes in the land use element only. Scenario 1 was 3705 million m3, which was a decrease of 305 million (7.62%) compared with the actual scenario of 2000; Scenario 2 was 4931 million m3, which was an increase of 919 million m3 (22.92%) compared with the actual scenario of 2000; Scenario 3 was 3709 million m3, which was a decrease of 1081 million (19.47%) compared with the actual scenario of 2010–2020; and there was a decrease of 1088 million (22.71%) in 2010–2020. Compared with the actual scenario in 2010, it decreased by 1084 million m3 (22.61%). From the above simulation results, it can be stated that climate change significantly affected water yield.
Overall, land use is expected to profoundly affect the hydrological cycle, affecting water yield by influencing evapotranspiration and infiltration processes. The aggregate yearly water yield in Scenario 4 in the absence of climate change was about 3.92 billion m3. This was about 488 million m3 (1.22%) less than that found in 2000. Over this period, the area covered by built-up land, cropland, and grassland increased, whereas forested land, water areas, unused land, and forest areas diminished. Among these, cropland and built-up land underwent the most substantial rise. The annual water yield in Scenario 5 was 3970.2 million m3, which was 0.408 billion m3 (1.02%) less than that found in the actual scenario in 2000. Over this period, there was a substantial increase in built-up land and cropland, a slight uptick in grasslands, and a decline in all other land categories. The annual water production in Scenario 6 was about 4776 million m3, which was 0.15 billion m3 (0.33%) less than that found in the actual scenario in 2010. During this timeframe, the arrangement of land types exhibited a notable rise in cropland and built-up land, a decline in forested and unused areas, and a nearly stable distribution of grassland and water areas. Therefore, a thorough examination of alterations in land utilization and water production during this period reveals that the effect of land use modifications on water production from 2000 to 2020 was negative. Human activities resulted in a growth in the expanse of cropland and built-up land, for example, as well as a decrease in the coverage area of unused land, forest land, and water area, which caused a decline in the amount of water produced. Thus, excessive human activities in the Ebinur Lake Basin damaged the ecology of the area and reduced the water supply capacity to some extent.
From 2000 to 2020, climate change contributed 86.21% of the impact on water yield within the Lake Ebinur Basin, and land use conversion contributed 13.79% of the impact on water yield. From 2000 to 2010, climate change contributed 95.04% of the impact on water yield within the basin, and land use change contributed 4.96% of the contribution to the water yield in the basin. From 2000 to 2020, climate change contributed 98.64%, and land use conversion contributed only 1.36% of the impact on water yield within the basin. The impact of climate variation on water yield in the basin surpassed 85% across all three temporal segments. Obviously, the influence of climate change on water yield was substantial, while the effect of land use conversion on water yield was relatively small. Therefore, this study suggests that climate change is the main factor affecting the water yield in the Ebinur Lake Basin, and research on the impact of climate change on water resources in the basin should be strengthened in the future.

4. Discussion

4.1. Land Use Change and Its Water Yield Characteristics

By exploring the correlation between water yield and land use change in the Ebinur Lake Basin, the land change pattern in the basin can be identified and its influence on the water resource yield can be revealed. Cropland was the most important type that was transferred during this period in terms of spatial distribution, and the largest area that was transferred out was unused land for use mainly as cultivated land and grassland, which was consistent with the research results of Wei et al. [29] and Tang et al. [30]. This study showed that the depth of water production on unutilized land in the Lake Ebinur Basin is higher than that of other land types, due to the better interception of precipitation by the root system and canopy of the woodland vegetation and the greater transpiration and water consumption capacity [41]. Cropland and grassland regulate precipitation according to the same principle as that of forest land. Unused land, on the other hand, can only retain a limited amount of water, and precipitation can subsequently go deeper into the ground or form runoff [42,43], therefore, the capacity to produce water is relatively large. From the total water yield of the different land use types, it was found that the water yield was not only related to the water yield depth on those land types, but also closely related to the area. For example, the water yield depths of grassland and forest land were close, but because the area of grassland was much larger than that of forest land, the water yield of forest land was much smaller than that of grassland. If the area of forest land increases to the same as that of grassland, the total water yield of forest land will surely increase, but the total water yield of the basin will remain almost stable. Because the proportion of forest land increased to the same as that of grassland, the proportion of unused land, cropland, water area, and built-up land naturally decreased. Although the water production capacity of forest land was stronger than that of cropland, it was weaker than that of unused land. Finally, under the comprehensive influence of different land types on water production, the water yield will remain relatively stable. Therefore, the change in total water yield is affected by the comprehensive influence of the linkage between the area of land use types and the depth of water production in the basin. The evolution of land use types in the basin not only changes the area of the various land use types, but a number of studies have also shown that land use change will change the physical and chemical properties of the soil, such as its porosity, bulk density, and organic matter content, and then affect the saturated hydraulic conductivity and water-holding capacity of soil in the basin. For example, Yan et al. [44] studied the effects of porosity and hydraulic conductivity of different land use on the hydraulic characteristics of surface soil, indicating that land use changed the saturated hydraulic conductivity of surface soil. McQueen and Shepherd [45] pointed out that the reclamation of grassland as farmland will affect the properties of the soil, which will lead to an increase in soil bulk density, a decrease in the number of soil macropores, and a significant decrease in hydraulic conductivity. Wahl et al. [46] studied the soil hydraulic characteristics of Pinus densiflora forest in Europe before and after mixed planting with Zelkova schneideriana and pointed out that the soil water-holding capacity decreased after mixed planting. The saturated hydraulic conductivity and water-holding capacity of the soil often restrict the occurrence and development of surface runoff, thus affecting the soil’s water production capacity, which, in turn, affects the water yield of the basin.

4.2. Effects of Climate Change and Land Use on Water Yield

Water production fulfills a crucial regulatory function within the basin and is pivotal for fostering sustainable social, economic, and ecological progress across the entire watershed [41]. This research analyzed the distribution of water yield over space and time in the Ebinur Lake Basin and discussed the influence of climate and land use on water yield. The results provided here emphasize the conclusion that water yield is more influenced by climate change than by transfers in land use. The results are consistent with the results of many other studies using the InVEST model. For example, Lian et al. [47] evaluated the water yield of Qinghai Lake in the alpine region of China and found that the impact of precipitation on water yield is more dominant than that of land use change through scenario analysis. PESSACG et al. [10] evaluated the water yield of the Chubut River Basin, one of the most arid regions in Patagonia, Argentina, and found that changes in precipitation would lead to significant differences in water yield in the basin. Montse Marques et al. [22] assessed the Francoli River Basin in the Mediterranean region of northern Spain, which is highly sensitive to climate change. Hoyer et al. [8] used the InVEST model to evaluate the freshwater ecosystem services in the Tualatin and Yamhill Basins in the United States, and the results showed that the impact of land use change on water yield was small compared to climate change in the entire study area. The results of studies based on other hydrological models were also similar. For example, Legesses et al. [13] evaluated the response of climate change and land use change to hydrology in the Ketar River Basin in tropical Africa based on PRMA hydrology and concluded that the response of water yield to climate change in the region is more sensitive than that of land use change. Based on the SWAT model, Li et al. [48] found that the impacts of land use change and climate change on runoff in the Heihe River Basin in northeastern China were 9.6% and 95.8%, respectively. Stone et al. [49] used the SWAT model to study the impact of climate change on water yield in the Missouri River Basin and confirmed that climate change had a significant impact on water yield. McFarlane et al. [50] used IHACRES and SACRAMENTO models to assess the impact of climate change on water yield and water demand in southwestern Australia and concluded that the impact of climate change on surface water resources in southwestern Australia has been profound since 1975. According to the principle of water balance, water production is determined by precipitation and actual evaporation [9,21]. The actual evaporation is mainly affected by land use, so the climate change elements discussed in this study (precipitation and land use) are important factors affecting the amount of water produced. Precipitation is mainly controlled by natural conditions, and the land use pattern is greatly influenced by human activities, which is a reflection of the interaction between human beings and nature. The impact of land use changes on water yield is lesser because the slow development of land use change and the shifting transitions between different land uses tend to offset each other’s influences on water yield [47]. Climate variability, on the other hand, directly affects surface runoff, which can have a larger effect on the water yield [41]. The process of water production is complex. In addition to the factors influencing water production discussed in this study, there are some factors that were not discussed here, such as meteorological factors, temperature, natural geographical factors, slope, altitude, GDP, population density, social and economic distribution, and other social factors. Therefore, an in-depth discussion of the interaction between these factors and an analysis of how these factors affect the water yield of the basin can be used as the next research focus.

4.3. Limitations of the InVEST Model

According to the validation outcomes, this study’s modeling of the Ebinur Lake Basin was reasonable in that it generally matched the actual situation. However, the self-setting of the model, the complexity of the parameters, and the accuracy of the data still caused the study to have some uncertainties. For example, it was necessary to input parameters such as the evapotranspiration coefficient (KC) and the maximum root depth of plants into the model. These parameters were obtained from the empirical literature. Although this did not change the basic pattern of water yield, it could affect the accuracy of the simulation to a certain extent; moreover, the model is generally used in the study of large-scale regions such as countries, provinces, and basins, and the research and application of small regions need to be developed. Secondly, the InVEST model simplifies the confluence process, does not distinguish between surface runoff and underground runoff, and assumes that all water production reaches the same outlet [41], which is not realistic and will affect the accuracy of a simulation. The InVEST model also assumes that soil properties do not change as a result of changes in vegetation type, and while this is feasible for studies with short simulation periods, long-term changes in vegetation type can have a significant impact on soil properties. Smith et al. [51] showed that the conversion of woodland into cropland reduced the organic matter content of soils by about 24 to 52%. Biro et al. [52] observed that transforming scrubland into cropland resulted in an elevation in sand content and bulk weight. Therefore, it is recommended that long-term studies using the InVEST model should consider the impacts of soil alterations on water yield. In addition, the inputs to the model are only natural data and do not include socioeconomic data, which can increase the uncertainty of the simulation [41]. Although there are still some imperfections in the model that affect its accuracy, the research results can still reflect the current situation of water production in the basin and the response of water production to climate and land use change, which can provide a theoretical basis for water resource management and ecosystem restoration in the Ebinur Lake Basin. In addition, these results provide data support for land use structure adjustment and agricultural policy formulation to alleviate the pressure of water resource production in the basin and realize the sustainable development of water resources and food production there.

5. Conclusions

Using the InVEST model, this research explores how water yield varies over time and is spatially distributed within the Ebinur Lake Basin. On that basis, the scenario analysis method was used to investigate how changes in climate and land use impacted water yield in the basin, with the following conclusions: (1) Changes in water yield within the basin showed distinct characteristics across various temporal and spatial scales. On the time scale, under the joint effects of climate and land use shifts, the water yield in the study area demonstrated a trend of increasing followed by a decline. On the spatial scale, water production varied significantly across the basin. A higher water yield was observed predominantly in the northwestern and southeastern regions, whereas the central and eastern parts exhibited comparatively lower water yields. Areas with lower water yield grades tended to aggregate together, contrasting with higher-grade areas that were distributed in bands. Moreover, areas at higher elevations on the outskirts of the basin typically produced a higher water yield. (2) Throughout the research duration, transformations in land utilization within the watershed were marked by evident upward trajectories in the extent of cropland, grassland, and built-up land. Meanwhile, there was a consistent reduction in unused land surfaces, coupled with volatile declines in both forested areas and water bodies. The primary types of terrain in the basin were grasslands and unused land, which together constituted the predominant sources of the basin’s overall water output, encompassing 85% of the total water yield. During this period of time, the land use categories underwent various degrees of transformation, leading to a modest reduction in the watershed’s water yield. Additionally, the responsiveness of the water yield changes to alterations in land use areas varied notably among the different land use types. (3) By controlling the variables to simulate the water yield across different scenarios, the effects of climate and land use change on water yield were quantitatively analyzed. It was concluded that, from 2000 to 2020, climate change predominantly shaped the water yield in the Ebinur Lake Basin, with an impact of 86.21%, whereas changes in land use played a much smaller role, accounting for only 13.79%.

Author Contributions

Conceptualization, X.Y. and A.L.; methodology, X.Y.; software, X.G.; validation, X.Y. and P.Z.; formal analysis, A.L.; investigation, J.L.; resources, W.Z.; data curation, P.Z.; writing—original draft preparation, X.Y.; writing—review and editing, P.Z.; visualization, J.L.; supervision, X.G.; project administration, A.L; funding acquisition, P.Z. All authors have read and agreed to the published version of the manuscript.

Funding

This research was funded by the National Natural Science Foundation of China (Grant NO.52309041) from P.Z. It was also supported by the Third Xinjiang Scientific Expedition Program (Grant No. 2021xjkk0406).

Data Availability Statement

Data are contained within the article.

Conflicts of Interest

The authors declare no conflict of interest.

References

  1. Daily, G.C. Nature’s Services: Societal Dependence on Natural Ecosystems (1977); Yale University Press: London, UK, 2013. [Google Scholar]
  2. Fu, B.j.; Zhou, G.Y.; Bai, Y.F.; Song, C.C.; Liu, Y.; Zhang, H.Y.; Liu, Y.H.; Zheng, H.; Xie, G.D. Progress of terrestrial ecosystem service function and ecological security geoscience in China. Adv. Earth Sci. 2009, 24, 571–576. [Google Scholar]
  3. Egoh, B.; Rouget, M.; Reyers, B.; Knight, A.T.; Cowling, R.M.; Van Jaarsveld, A.S.; Welz, A. Integrating ecosystem services into conservation assessments: A review. Ecol. Econ. 2007, 63, 714–721. [Google Scholar] [CrossRef]
  4. Reid, W.V.; Mooney, H.A.; Cropper, A.; Capistrano, D.; Carpenter, S.R.; Chopra, K.; Dasgupta, P.; Dietz, T.; Duraiappah, A.K.; Hassan, R.; et al. Ecosystems and Human Well-Being—Synthesis: A Report of the Millennium Ecosystem Assessment; Wageningen University & Research: Wageningen, The Netherlands, 2005. [Google Scholar]
  5. Costanza, R.; d’Arge, R.; De Groot, R.; Farber, S.; Grasso, M.; Hannon, B.; Limburg, K.; Naeem, S.; O’neill, R.V.; Paruelo, J. The value of the world’s ecosystem services and natural capital. Ecol. Econ. 1997, 387, 253–260. [Google Scholar] [CrossRef]
  6. Turner, K.G.; Odgaard, M.V.; Bøcher, P.K.; Dalgaard, T.; Svenning, J.-C. Bundling ecosystem services in Denmark: Trade-offs and synergies in a cultural landscape. Landsc. Urban Plan. 2014, 125, 89–104. [Google Scholar] [CrossRef]
  7. Zhang, W.J.; Sun, X.Y.; Zhou, J. Spatial-temporal trade-off relationship of key ecosystem services in Nansi Lake Basin. Acta Ecol. Sin. 2021, 41, 8003–8015. [Google Scholar] [CrossRef]
  8. Hoyer, R.; Chang, H. Assessment of freshwater ecosystem services in the Tualatin and Yamhill basins under climate change and urbanization. Appl. Geogr. 2014, 53, 402–416. [Google Scholar] [CrossRef]
  9. Xie, Y.C.; Gong, J.; Qi, S.; Wu, J.; Hu, B.Q. Spatial-temporal differentiation of water supply services in Bailong River Basin based on InVEST model. J. Nat. Resour. 2017, 32, 1337–1347. [Google Scholar]
  10. Pessacg, N.; Flaherty, S.; Brandizi, L.; Solman, S.; Pascual, M. Getting water right: A case study in water yield modelling based on precipitation data. Sci. Total Environ. 2015, 537, 225–234. [Google Scholar] [CrossRef]
  11. Lang, Y.; Song, W.; Deng, X. Projected land use changes impacts on water yields in the karst mountain areas of China. Phys. Chem. Earth Parts A/B/C 2018, 104, 66–75. [Google Scholar] [CrossRef]
  12. Yu, J.; Yuan, Y.; Nie, Y.; Ma, E.; Li, H.; Geng, X. The temporal and spatial evolution of water yield in Dali County. Sustainability 2015, 7, 6069–6085. [Google Scholar] [CrossRef]
  13. Legesse, D.; Vallet-Coulomb, C.; Gasse, F. Hydrological response of a catchment to climate and land use changes in Tropical Africa: Case study South Central Ethiopia. J. Hydrol. 2003, 275, 67–85. [Google Scholar] [CrossRef]
  14. Song, W.; Deng, X.; Yuan, Y.; Wang, Z.; Li, Z. Impacts of land-use change on valued ecosystem service in rapidly urbanized North China Plain. Ecol. Model. 2015, 318, 245–253. [Google Scholar] [CrossRef]
  15. Cuo, L.; Beyene, T.K.; Voisin, N.; Su, F.; Lettenmaier, D.P.; Alberti, M.; Richey, J.E. Effects of mid-twenty-first century climate and land cover change on the hydrology of the Puget Sound basin, Washington. Hydrol. Process. 2011, 25, 1729–1753. [Google Scholar] [CrossRef]
  16. Han, Z.; Song, W.; Deng, X.; Xu, X. Trade-offs and synergies in ecosystem service within the three-rivers headwater region, China. Water 2017, 9, 588. [Google Scholar] [CrossRef]
  17. Baker, T.J.; Miller, S.N. Using the Soil and Water Assessment Tool (SWAT) to assess land use impact on water resources in an East African watershed. J. Hydrol. 2013, 486, 100–111. [Google Scholar] [CrossRef]
  18. Yang, D.; Liu, W.; Tang, L.; Chen, L.; Li, X.; Xu, X. Estimation of water provision service for monsoon catchments of South China: Applicability of the InVEST model. Landsc. Urban Plan. 2019, 182, 133–143. [Google Scholar] [CrossRef]
  19. Francesconi, W.; Srinivasan, R.; Pérez-Miñana, E.; Willcock, S.P.; Quintero, M. Using the Soil and Water Assessment Tool (SWAT) to model ecosystem services: A systematic review. J. Hydrol. 2016, 535, 625–636. [Google Scholar] [CrossRef]
  20. Leh, M.D.; Matlock, M.D.; Cummings, E.C.; Nalley, L.L. Quantifying and mapping multiple ecosystem services change in West Africa. Agric. Ecosyst. Environ. 2013, 165, 6–18. [Google Scholar] [CrossRef]
  21. Yin, G.; Wang, X.; Zhang, X.; Fu, Y.; Hao, F.; Hu, Q. InVEST model-based estimation of water yield in North China and its sensitivities to climate variables. Water 2020, 12, 1692. [Google Scholar] [CrossRef]
  22. Marquès, M.; Bangash, R.F.; Kumar, V.; Sharp, R.; Schuhmacher, M. The impact of climate change on water provision under a low flow regime: A case study of the ecosystems services in the Francoli river basin. J. Hazard. Mater. 2013, 263, 224–232. [Google Scholar] [CrossRef] [PubMed]
  23. Redhead, J.; Stratford, C.; Sharps, K.; Jones, L.; Ziv, G.; Clarke, D.; Oliver, T.; Bullock, J. Empirical validation of the InVEST water yield ecosystem service model at a national scale. Sci. Total Environ. 2016, 569, 1418–1426. [Google Scholar] [CrossRef]
  24. Wang, Y.H.; Dai, E.F.; Ma, L. Spatiotemporal and influencing factors analysis of water yield in the Hengduan Mountain region. J. Nat. Resour. 2020, 35, 16. [Google Scholar] [CrossRef]
  25. Chen, S.S.; Liu, K.; Bao, Y.B. Spatial pattern and influencing factors of water conservation service function in Shangluo City. Sci. Geogr. Sin. 2016, 36, 9. [Google Scholar] [CrossRef]
  26. Lin, S.W.; Wu, R.D. Spatial distribution characteristics of ecosystem water supply services in ‘Three Parallel Rivers’ area. West. For. Sci. 2015, 44, 8. [Google Scholar] [CrossRef]
  27. Jing, T.F. Evaluation of Ecosystem Service Function of Plateau Lakes Based on InVest Model. Master’s Thesis, Yunnan Normal University, Yunnan, China, 2017. [Google Scholar]
  28. Wang, P. Pollution Assessment and Health Risk Assessment of Rare Earth Elements in Soil of Ebinhu Watershed. Master’s Thesis, Xinjiang University, Urumqi, China, 2021. [Google Scholar]
  29. Wei, Q.; Abudureheman, M.; Halike, A.; Yao, K.; Yao, L.; Tang, H.; Tuheti, B. Temporal and spatial variation analysis of habitat quality on the PLUS-InVEST model for Ebinur Lake Basin, China. Ecol. Indic. 2022, 145, 109632. [Google Scholar] [CrossRef]
  30. Tang, H.; Halike, A.; Yao, K.; Wei, Q.; Yao, L.; Tuheti, B.; Luo, J.; Duan, Y. Ecosystem service valuation and multi-scenario simulation in the Ebinur Lake Basin using a coupled GMOP-PLUS model. Sci. Rep. 2024, 14, 5071. [Google Scholar] [CrossRef]
  31. Zhang, F.; Yushanjiang, A.; Jing, Y. Assessing and predicting changes of the ecosystem service values based on land use/cover change in Ebinur Lake Wetland National Nature Reserve, Xinjiang, China. Sci. Total Environ. 2019, 656, 1133–1144. [Google Scholar] [CrossRef]
  32. Yushanjiang, A.; Zhang, F.; Yu, H. Quantifying the spatial correlations between landscape pattern and ecosystem service value: A case study in Ebinur Lake Basin, Xinjiang, China. Ecol. Eng. 2018, 113, 94–104. [Google Scholar] [CrossRef]
  33. Hou, Z.; Lv, G.; Jiang, L.J.S. Functional diversity can predict ecosystem functions better than dominant species: The case of desert plants in the Ebinur Lake Basin. Sustainability 2021, 13, 2858. [Google Scholar] [CrossRef]
  34. Bagstad, K.J.; Semmens, D.J.; Waage, S.; Winthrop, R.J.E.s. A comparative assessment of decision-support tools for ecosystem services quantification and valuation. Ecosyst. Serv. 2013, 5, 27–39. [Google Scholar] [CrossRef]
  35. Sharp, R.; Chaplin-Kramer, R.; Wood, S.; Guerry, A.; Tallis, H.; Ricketts, T.; Nelson, E.J.; Ennaanay, D.; Wolny, S.; Olwero, N.; et al. InVEST User’s Guide; The Natural Capital Project, Stanford University, University of Minnesota, The Nature Conservancy, and World Wildlife Fund: Minneapolis, MN, USA, 2018. [Google Scholar] [CrossRef]
  36. Vigerstol, K.L.; Aukema, J.E. A comparison of tools for modeling freshwater ecosystem services. J. Environ. Manag. 2011, 92, 2403–2409. [Google Scholar] [CrossRef]
  37. Canqiang, Z.; Wenhua, L.; Biao, Z.; Moucheng, L.J. Water Yield of Xitiaoxi River Basin Based on InVEST Modeling. J. Resour. Ecol. 2012, 3, 50–54. [Google Scholar] [CrossRef]
  38. Fu, B. On the calculation of the evaporation from land surface. Chin. J. Atmos. Sci. 1981, 5, 23. [Google Scholar]
  39. Zhang, L.; Dawes, W.; Walker, G. Response of mean annual evapotranspiration to vegetation changes at catchment scale. Water Resour. Res. 2001, 37, 701–708. [Google Scholar] [CrossRef]
  40. Sharp, R.; Tallis, H.; Ricketts, T.; Guerry, A.; Wood, S.A.; Chaplin-Kramer, R.; Nelson, E.; Ennaanay, D.; Wolny, S.; Olwero, N. InVEST User’s Guide; Academic Press: Stanford, CA, USA, 2014; Volume 306. [Google Scholar]
  41. Lang, Y.; Song, W.; Zhang, Y. Responses of the water-yield ecosystem service to climate and land use change in Sancha River Basin, China. Phys. Chem. Earth 2017, 101, 102–111. [Google Scholar] [CrossRef]
  42. Li, S.; Yang, H.; Lacayo, M.; Liu, J.; Lei, G. Impacts of land-use and land-cover changes on water yield: A case study in Jing-Jin-Ji, China. Sustainability 2018, 10, 960. [Google Scholar] [CrossRef]
  43. Ruan, H.; Zou, S.; Yang, D.; Wang, Y.; Yin, Z.; Lu, Z.; Li, F.; Xu, B. Runoff simulation by SWAT model using high-resolution gridded precipitation in the upper Heihe River Basin, Northeastern Tibetan Plateau. Water 2017, 9, 866. [Google Scholar] [CrossRef]
  44. Jiang, Y.; Shao, M.A. Effects of soil structural properties on saturated hydraulic conductivity under different land-use types. Soil Res. 2014, 52, 340–348. [Google Scholar] [CrossRef]
  45. McQueen, D.; Shepherd, T. Physical changes and compaction sensitivity of a fine-textured, poorly drained soil (Typic Endoaquept) under varying durations of cropping, Manawatu Region, New Zealand. Soil Tillage Res. 2002, 63, 93–107. [Google Scholar] [CrossRef]
  46. Wahl, N.A.; Bens, O.; Schäfer, B.; Hüttl, R. Impact of changes in land-use management on soil hydraulic properties: Hydraulic conductivity, water repellency and water retention. Phys. Chem. Earth Parts A/B/C 2003, 28, 1377–1387. [Google Scholar] [CrossRef]
  47. Lian, X.H.; Qi, Y.; Wang, H.W.; Zhang, J.L.; Yang, R. Assessing Changes of Water Yield in Qinghai LAKE Watershed of China. Water 2019, 12, 11. [Google Scholar] [CrossRef]
  48. Li, Z.; Liu, W.; Zhang, X.; Zheng, F. Impacts of land use change and climate variability on hydrology in an agricultural catchment on the Loess Plateau of China. J. Hydrol. 2009, 377, 35–42. [Google Scholar] [CrossRef]
  49. Stone, M.C. Impacts of climate change on missouri rwer basin water yield. JAWRA J. Am. Water Resour. Assoc. 2001, 37, 1119–1129. [Google Scholar] [CrossRef]
  50. Mcfarlane, D.; Stone, R.; Martens, S.; Thomas, J.; Silberstein, R.; Ali, R.; Hodgson, G. Climate change impacts on water yields and demands in south-western Australia. J. Hydrol. 2012, 475, 488–498. [Google Scholar] [CrossRef]
  51. Smith, P.; House, J.I.; Bustamante, M.; Sobocká, J.; Harper, R.; Pan, G.; West, P.C.; Clark, J.M.; Adhya, T.; Rumpel, C. Global change pressures on soils from land use and management. Glob. Chang. Biol. 2016, 22, 1008–1028. [Google Scholar] [CrossRef]
  52. Biro, K.; Pradhan, B.; Buchroithner, M.; Makeschin, F. Land use/land cover change analysis and its impact on soil properties in the northern part of Gadarif region, Sudan. Land Degrad. Dev. 2013, 24, 90–102. [Google Scholar] [CrossRef]
Figure 1. Map of the location of the Ebinur Lake Basin in the northwestern border area of Xinjiang, China. Clockwise from the top left: Map of China showing the location of the Xinjiang Uygur Autonomous Region; map of the study region within Xinjiang; and map of the study area (Vector data sources: Geospatial Data Cloud, https://www.gscloud.cn, accessed on 15 June 2024).
Land 13 01324 g001
Figure 2. Fitting of the observed and simulated values. (a) Simulation performance of the model in all periods. (b) Simulation performance in 2000. (c) Simulation performance in 2005. (d) Simulation performance in 2010. (e) Simulation performance in 2015. (f) Simulation performance in 2020.
Land 13 01324 g002
Figure 3. Comparative analysis of water yield data in Ebinur Lake Basin, 2000–2020.
Land 13 01324 g003
Figure 4. Spatial distribution of the water yield in the Ebinur Lake Basin.
Land 13 01324 g004
Figure 5. Spatial distribution of various land utilization zones across the Ebinur Lake Basin spanning from 2000 to 2020.
Land 13 01324 g005
Figure 6. Sankey Diagram—three-phase land use transfer.
Land 13 01324 g006
Figure 7. Ratio of water yield generated by each land use type to overall water yield between the years 2000 and 2020.
Land 13 01324 g007
Figure 8. Linkage characteristics of the water yield depth and change in the area of each type at the level of land use type.
Land 13 01324 g008
Table 1. Biophysical parameters of land use.
Land UseRoot Depth (mm)KC
Cropland22000.8
Forest land54001
Grassland28000.7
Water area1001
Built-up land1000.3
Unused land4000.1
Kc represents the evapotranspiration coefficient of vegetation.
Table 2. Input data and their acquisition addresses.
DataData Type and ResolutionData Source
PrecipitationRaster 1000 m × 1000 mNature Earth System Science Data Center
(http://www.geodata.cn, accessed on 16 June 2024)
Reference EvapotranspirationRaster 1000 m × 1000 mNature Earth System Science Data Center
(http://www.geodata.cn, accessed on 16 June 2024)
World Soil DatabaseRaster 1000 m × 1000 mNational Cryosphere Desert Science Data Center
(https://www.crensed.ac.cn, accessed on 20 June 2024)
Plant Available Water FractionRaster 1000 m × 1000 mNature Earth System Science Data Center
(http://www.geodata.cn, accessed on 20 June 2024)
LUCCRaster 30 m × 30 mResource and Environmental Science Data Platform)
(http://www.geodata.cn, accessed on 10 May 2024)
Table 3. Independent sample testing.
RegionType of VarianceLevene’s Test for Equality of Variancest-Test for Equality of Means
FSig (P)tDfSig (P) (Two-Tailed)
KaramayEqual variance assumed3.0280.120.94480.373
Equal variance not assumed 0.9445.7230.383
BortalaEqual variance assumed0.6970.4281.06980.316
Equal variance not assumed 1.0696.3560.324
Ili valleyEqual variance assumed2.9090.1261.39880.200
Equal variance not assumed 1.3987.1930.204
TachengEqual variance assumed0.090.772−1.55380.159
Equal variance not assumed −1.5537.9890.159
Levene’s Test for Equality of Variances refers to testing the degree to which two sets of data are equal in variance; Sig (significance); Df (degree of freedom).
Table 4. Scenario settings for climate and land use.
Actual SituationClimate Change
Scenarios
Land Use Change
Scenarios
200020102020S1S2S3S4S5S6
Climate200020102020202020102020200020002010
LUCC200020102020200020002010202020102020
Table 5. The land use transfer matrix of the Ebinur Lake Basin from 2000 to 2020.
Land Use Area/km22020Area of
Transfer Out
2000CroplandForest LandGrasslandWater AreaBuilt-Up LandUnused Land
Cropland 9.83161.1713.20175.387.26366.84
Forest land208.20 1625.8919.798.54116.311978.73
Grassland2544.23397.77 47.37189.081912.065090.51
Water area37.173.67168.89 9.04815.701034.47
Built-up land56.880.505.780.46 3.9167.53
Unused land1090.9937.175008.74283.0098.37 6518.28
Area of transfer in3937.46448.936970.48363.83480.412855.2415,056.35
Table 6. Water yield of different land uses from 2000 to 2020.
YearLUCCLand UseWater YieldWater Yield Depth (mm)
(Yield per Unit Area)
Area (km2)Pct (%)Yearly Output (108 m3) Pet (%)
2000Cropland4547.387.700.360.907.90
Forest land2853.134.831.754.3960.73
Grassland28,580.6548.3919.0147.8266.76
Water area2624.364.441.894.7874.50
Built-up land277.770.470.0040.011.45
Unused land20,186.0934.1716.7142.0884.28
2005Cropland5243.658.880.380.887.23
Forest land2856.514.841.914.4566.65
Grassland28,064.3555.0620.6547.8773.91
Water area2768.385.431.984.6073.72
Built-up land321.380.630.0020.010.78
Unused land19,819.8238.8818.242.1993.47
2010Cropland7253.1312.270.811.6911.12
Forest land1434.262.421.172.3576.46
Grassland31,161.7152.7323.8450.2276.80
Water area1883.153.180.952.0152.07
Built-up land516.460.870.020.014.23
Unused land16,847.8228.5120.7543.71126.04
2015Cropland7508.0312.710.471.196.21
Forest land1429.052.420.902.3062.01
Grassland30,895.3452.2819.2349.1262.49
Water area1745.602.950.912.3454.24
Built-up land713.551.210.0050.010.71
Unused land16,802.6828.4317.6345.02107.34
2020Cropland7508.0312.710.310.833.79
Forest land1429.052.420.772.0957.18
Grassland30,895.3452.2817.9248.6059.01
Water area1745.602.950.922.5047.78
Built-up land713.551.210.0040.010.59
Unused land16,802.6828.4316.9545.96103.50
Table 7. The water yield of different land types in different scenarios.
LUCCActual ConditionsClimate ChangeLand Use Change
200020102020S1S2S3S4S5S6
Cropland0.360.810.310.220.620.290.490.460.86
Forest land1.751.160.771.602.030.850.810.901.00
Grassland19.0023.8417.9217.6023.1117.8419.4319.3623.19
Water area1.890.950.921.721.890.930.950.950.95
Built-up land0.000.020.000.000.020.000.010.010.03
Unused land16.7220.7516.9515.7221.1817.0117.5717.6620.57
Total40.1147.9337.0536.8748.8436.9139.2639.3447.33
Disclaimer/Publisher’s Note: The statements, opinions and data contained in all publications are solely those of the individual author(s) and contributor(s) and not of MDPI and/or the editor(s). MDPI and/or the editor(s) disclaim responsibility for any injury to people or property resulting from any ideas, methods, instructions or products referred to in the content.

