Abstract
Neighborhood sustainability assessment (NSA) systems assess neighborhood sustainability through different themes. Most NSA systems originated from developed countries, with limitations in assessing micro-level transportation infrastructure. The NSA systems lack alignment with Indian regulations and policies and have limitations in assessing informal transportation modes, affordability, and street-vending-related issues. This research developed the sustainable transportation assessment index (SusTAIN) framework to assess mixed-use neighborhoods in India and overcome the limitations of NSA systems. The method was to identify and evaluate qualitative and quantitative indicators and sub-indicators from NSA systems, Indian transportation regulations and policies, and transportation system studies from the literature. Indicators were integrated into the four subthemes of (i) accessibility, (ii) mobility nodes and network, (iii) external factors associated with mobility, and (iv) land-use and socioeconomic factors’ assessment. The authors evaluated the framework through the Geographical Information System (GIS), site surveys, and benchmark values from the literature. This research demonstrated the interrelationship of indicators and the sub-indicators between them. Finally, the authors discussed the SusTAIN composite index formation method. The framework is vital for the local application of national sustainable urban development policies. The SusTAIN framework application enables local governments to evaluate the transportation sustainability of neighborhoods and identify potential optimization areas.
1. Introduction
The neighborhood sustainability assessment (NSA) system enables benchmarking and comprehensive assessment of neighborhood sustainability [1]. NSA systems evaluate neighborhood sustainability based on themes and indicators. The NSA varies in sustainability assessment theme, indicator type, and weight, and is limited in assessing contextual issues [2,3]. Comparative analysis studies of three NSA systems: Leadership in Energy and Environmental Design for Neighborhood Development (LEED–ND), USA, German Sustainable Building Council for Urban Districts (DGNB–UD), Germany, and Green Rating for Integrated Habitat Assessment for Large Development (GRIHA–LD), showed that they assessed neighborhood sustainability in terms of the following ten major themes: (1) site planning and ecology, (2) buildings, (3) water, (4) waste management, (5) energy, (6) economy, (7) transport, (8) community, (9) innovation, and (10) governance and monitoring [3]. Each theme has variable importance in each NSA, as the scores assigned to a particular theme vary from system to system. These NSA systems prioritize sustainability issues related to their countries of origin. LEED–ND places significant emphasis on transportation, allocating the highest weight of 27.24% to address urban sprawl and transportation challenges, compared to DGNB–UD with 11.2% and GRIHA–LD with 6% [3]. All NSA systems include multiple indicators directly or indirectly associated with the transportation theme [1]. However, transportation varies intrinsically between different contexts, and multiple aspects influence transportation (geography, topology, climate, urban form, densities, culture, economy, and available technology); hence, the assessment indicators and measures must be tailored, rather than adapted from global certifications. Comparative assessment of the NSA systems revealed that the transportation theme has shortcomings in viability and relevance to different contexts [4]. Although LEED–ND and DGNB–UD are applied globally, they incorporate regulations and standards pertinent to their countries of origin, creating challenges when applying them to Indian neighborhoods. Despite being an Indian system, GRIHA–LD lacks alignment with Indian regulations, policies, and standards, a significant gap that the SusTAIN framework overcame. The SusTAIN framework aligned each indicator with Indian central, state, and local policies. The United States of America and Germany, the countries of origin of LEED–ND and DGNB–UD, respectively, are developed countries with well-established transportation infrastructure. However, in India, fundamental infrastructural issues need to be focused on and assessed at the primary level; therefore, the SusTAIN framework focuses on critical micro-level transportation infrastructure issues in the Indian context. Furthermore, the SusTAIN framework addresses the management of temporal road activities and street vendor encroachments, which are not considered in existing NSA systems. The NSA systems acknowledge only formal public and private transportation routes with fixed stations, routes, and schedules, and have limitations in considering informal transportation services [1]. Conventional informal mobility and new shared mobility services serve large populations in India, providing last-mile connectivity, and are closely linked with informal livelihood. Similarly, the indicators associated with ‘transportation affordability’, ‘interactive facade’, ‘street aspect and street enclosure ratio’, and ‘temporary shelter for urban poor’, included in the SusTAIN framework, are significant factors in developing countries, such as India, that were unexplored by NSA systems.
Transportation is crucial for neighborhood sustainability assessment and is interrelated with the abovementioned themes. Transportation themes evaluate more external elements, compared to the elements of enclosed buildings. Consequently, they must underscore the importance of involving stakeholders from the surrounding areas in the development process. New townships and housing schemes in developing countries are often designed from an urban sustainability approach, applying the NSA system to planned neighborhoods. However, there has been a limited assessment approach for existing neighborhoods, particularly from a transportation perspective [4]. Transportation theme-related studies at the neighborhood level were conducted with a specific approach considering the travel behavior and perception of residents, accessibility assessment, and walkability [5,6,7,8]. In the present research, the authors have selected the transportation theme to develop a new context-based sustainable transportation assessment index (SusTAIN) framework for neighborhood sustainability assessment in Indian mixed-use neighborhoods. Frameworks serve as valuable tools to clarify the concepts of sustainable development, and are instrumental in assessing sustainability [9]. This SusTAIN framework consists of indicators and sub-indicators grouped under four subthemes of (A) accessibility, (B) mobility, (C) external factors associated with mobility, and (D) land-use and socioeconomic factors’ assessment. Sustainable urban development on a neighborhood scale aims to meet the needs of its residents, while avoiding unsustainable economic, social, and environmental impacts at the neighborhood scale, at a local level, and in a broader context [2]. Neighborhood-level assessments provide effective tools for integrating urban sustainability principles [10]. Valid and reliable indicator systems are essential in assessing urban sustainability at the neighborhood level. Despite their advantages, NSA tools have limitations in addressing context-based issues. A theme-specific assessment was advocated to overcome these limitations. This approach allows for a more targeted evaluation of sustainability issues relevant to specific neighborhoods. Adopting a theme-specific assessment approach can enhance the effectiveness of NSA tools and facilitate more targeted interventions for sustainable neighborhood developments.
Transportation systems significantly impact society, the economy, and the environment. Efficient networks enhance accessibility to essential services, while inadequate transportation infrastructure can cause social exclusion. Economically, adequate transportation reduces logistical costs and stimulates growth, whereas congestion and inefficiencies impose economic burdens. Environmentally, transportation contributes to pollution and climate change, necessitating sustainable solutions, such as electric vehicles and public transit. Investing in efficient, accessible, eco-friendly transportation is crucial for enhancing mobility, economic prosperity, and environmental sustainability.
1.1. The Urban Transportation Sector in India
The rapidly expanding Indian transportation sector heavily relies on fossil energy carriers as fuels, contributing 6.5% to the national gross domestic product (GDP). The 2012 Rio+20 report emphasized the need to promote an integrated approach to policymaking across various spatial scales for transportation services and systems, to foster sustainable development [11]. The number of registered vehicles has witnessed an annual growth rate of 9.9% from 2009 to 2019, resulting in 296 million registered vehicles in India [12]. Notably, 90% of carbon dioxide (CO2) emissions from transportation in India originate from the road sector [13]. Statistical projections suggest that the total daily passenger trips in 87 major urban centers in India will more than double, from around 229 million in 2007 to approximately 482 million in 2031 [14]. Over 48% of Indians commute by cycling or walking, covering 70% of urban trips within a 5 km radius. However, 27% of motorized transport trips occupy 75% of the right-of-way (RoW), indicating a disproportionate use of street space [15]. Notably, 90% of women use public transport or walking as their primary mode of transport. Indian cities have the potential to become the non-motorized capital of the world by enhancing cycling and pedestrian environments. Improving the quality of pedestrian and cycling infrastructure can enhance connectivity to public open spaces, contributing to the revitalization of urban areas and improving human well-being.
1.2. Sustainable Development and Transportation
Concerning the various interpretations of and approaches to sustainable development, it is a demanding task to articulate how transport planning can contribute to sustainability [16]. The 2030 Agenda for Sustainable Development and the 17 World Sustainable Development Goals emphasize the importance of transportation for sustainable redevelopment [17]. The transportation theme is coherent with the sustainable development goals #3, #7, #9, #11, #12, and #13: health, energy efficiency, resilient infrastructure, sustainable, safe, and resilient cities, responsive consumption and production patterns, and action against climate change, respectively. Specifically, target 3.6 emphasizes the safety of road and traffic accidents [17]. The global commitment to a sustainable global future, green development, and acceleration of inclusive and resilient growth from local to global levels was emphasized during the 2023 G20 Summit, with the theme “One Earth, One Family, One Future”, in India [18].
Transportation plays a significant economic role, and is integral to the production chain across all geographic scales [19].
1.3. Sustainable Transportation Definition
In practice and research, the definition of sustainable transportation varies, and derives from social, environmental, and economic dimensions of sustainability [20]. Sustainable transportation, as defined by the Center for Sustainable Transportation, meets basic access needs while ensuring safety and promoting human and ecosystem health. It emphasizes equity, affordability, efficiency, and a variety of transport modes, all while supporting economic vitality. The system aims to minimize emissions, waste, and resource consumption, ensuring that these remain within the planet’s capacity to absorb them. Additionally, it prioritizes the sustainable use of resources, efficient land use, recycling, and noise reduction [11]. Sustainable transportation systems need to successfully address and meet minimum requirements regarding effectiveness and impacts on economic development, ecological integrity, and the social quality of life [20]. A sustainable transport system is accessible, safe, eco-friendly, and affordable [21]. Sustainable transportation planning underscores the multifaceted impacts of transportation-related decisions on society, necessitating the consideration of objectives and impacts throughout the planning process [21]. At the urban scale, road networks and other transportation modes play pivotal roles in shaping social sustainability and enhancing the quality of life for urban residents [22,23]. Achieving sustainable transportation requires an integrated approach that encompasses technology adoption strategies, land-use planning, regulatory development, and interventions for mobility management. In specific research studies, a framework for transport planning grounded in sustainable development principles is essential to understand the influence of various national planning systems [16]. By adopting such a framework, planners can better account for the diverse social, economic, and environmental factors, leading to more effective and equitable transportation solutions.
1.4. Indicator-Based Frameworks
The framework delineates a system’s components and their interactions, forming the foundation of a comprehensive approach to sustainable development. Indicators are organized and linked to specific themes or subthemes to facilitate assessment, aligning with the overarching assessment objectives. These frameworks also structure identified indicator combinations, and clarify indicator application [11]. They highlight how different contexts, such as spatial scale, institutional settings, policy goals, or task portfolios, can influence the framing and measurement of sustainability. By providing an outer boundary and an internal structure, frameworks enable the effective derivation and utilization of information. Theoretical frameworks furnish the basis for selecting and combining individual indicators into meaningful composite indicators that are tailored to specific purposes [24]. Despite the importance of performance measurement in planning and implementing sustainable solutions, cities have yet to adopt or implement performance measurement systems. In summary, frameworks are pivotal in guiding sustainable development efforts by organizing indicators, elucidating contextual influences, and facilitating effective performance measurement for informed decision-making.
The primary objective of this research was to develop a framework to assess transportation at the neighborhood scale in mixed-use neighborhoods within Indian cities. The ultimate goal was to create the SusTAIN framework, an indicator-based tool designed to identify relevant indicators to measure sustainability in transportation at the neighborhood level. These indicators were selected based on specific needs identified and captured in the definitions of sustainable transportation systems.
The theme-specific indicators draw the attention of policymakers and decision-makers to specific priority concerns in the transport field. In contrast, general sustainability indicators incorporating various transport-related issues provide the overall picture of transport activities [19]. The transportation theme assessment can be made possible at various spatial scales, from the regional level to the neighborhood and individual transportation project scale. For this reason, neighborhood-level indicators were selected to be incorporated into the neighborhood program of gathering statistics, and their measurements should be summarized and integrated into the neighborhood sustainability assessment and planning processes. Sustainable transportation indicators and related data collection practices will allow more comprehensive and integrated analysis and enable decision-makers to understand how specific policies and planning decisions affect sustainability goals. Accordingly, the indicators should be selected so that the necessary data collection can be feasible, and of adequate quality [25]. Predetermined sets of sustainable transportation indicators can be descriptive, and should be accepted considering the political, organizational, and economic environment. The indicators selected depend on the indicator application, framework perspective, and purpose of the sustainability goals across the system [11]. Appropriate indicators for transportation will vary, depending on the ultimate goal and scale of the analysis, although common indicators can often apply to several goals and scales of analysis [26].
1.5. Literature on NSA Systems, Indian Regulations, Policies, Codes of Conduct, Guidelines, Transportation Studies, and Accessibility Assessment
1.5.1. Literature on NSA Systems
More than forty NSA systems are operational globally [27], including LEED–ND, DGNB–UD, and GRIHA–LD, the well-known systems, as well as the Building Research Establishment Environmental Assessment Method (BREEAM) for Communities, UK; Comprehensive Assessment System for Built Environment Efficiency (CASBEE–UD), Japan; Ecocity, European Union, and Green Mark for Districts, Singapore, used worldwide for neighborhood sustainability assessment.
Previous research by the authors on the comparative analysis of three NSA systems indicated that themes are considered high-level issues or sustainability concerns [3]. Theme-specific assessment addresses the issues associated with the NSA system. The indicators covered under the transportation theme from the LEED–ND, DGNB–UD, and Indian systems, such as GRIHA–LD, were considered in the SusTAIN framework developmental process.
1.5.2. Literature on Indian Regulations, Policies, Codes of Conduct, and Guidelines
Post-independence, the Indian government and NGOs formulated various urban development and transportation policies. These regulations and policies, sourced from central, state, and local authorities, as well as NGOs, are crucial for researching future mobility frameworks in India [28]. The main objective is to understand the Indian transportation scenario and identify sustainable transportation indicators for developing the SusTAIN framework [28,29,30]. The review also explores the feasibility of integrating this framework with existing policies, as follow: Air (Prevention and Control of Pollution) Act, 1981 [31]; Environment (Protection) Act, 1986 [32]; Noise Pollution (Regulation and Control) Rules, 2000 [33]; Motor Vehicles Act, 1988 [34]; National Auto Fuel Policy, 2003 [35]; National Policy on Biofuels, 2018 (Amended in 2022) [36]; National Road Safety Policy, 2010 [37]; Protection of Livelihood and Regulation of Street Vending Act, 2014 [38]; Rights of Persons with Disabilities Act, 2016 [39]. The National Urban Transport Policy (NUTP), 2006, emphasizes high-capacity public transport systems, shifting from personal to public transport, integrating transport with land-use planning, and promoting equitable road space allocation, innovative financing, and non-motorized transport [40]. It was the foundation for subsequent policies, such as the Smart Cities Mission, 2015 [41], Green Urban Mobility Scheme, 2017 [42], and the National Policy on Transit-Oriented Development (TOD), 2017 [43]. The Draft Maharashtra Urban Mobility Policy, 2017 [44], aligns with central policies, emphasizing efficient, equitable, and environmentally sound urban transport systems. The URDPFI Guidelines, 2015 [45], provide detailed guidelines for urban planning at various scales. NGOs, such as the Institute for Transportation and Development Policies (ITDP) and the World Resources Institute (WRI), contribute to sustainable transportation policy interventions and developed the Complete Street Policy Framework 2019 [15,46]. This literature review highlights the comprehensive framework of policies and guidelines that assisted in formulating the SusTAIN framework, addressing the integration of land use and transportation to achieve sustainable urban mobility. Refer to Table S1 of the Supplementary Materials for a summary of the regulations, policies, standards, codes of conduct, and guidelines.
1.5.3. Literature on Transportation Studies
Extensive research on sustainable transportation focuses on methodologies for developing and accessing transportation frameworks. The composite index method for sustainability assessment is widely used at various spatial scales, including state, city, neighborhood, and project levels [5,11]. Jeon et al. evaluated transportation indicators within a composite index considering social, environmental, and economic sustainability [47]. The United Nations ESCAP monograph series introduced the Sustainable Urban Transport Index (SUTI) for the Asia Pacific region [17]. Illahi et al. developed a sustainable transportation attainment index for Indian states using multivariate analysis [48]. El Dessouki’s Neighborhood Mobility Index (NMI) measures neighborhood congestion [22], and Bahadure et al. created an index for mixed-use neighborhoods based on travel behavior and resident perceptions [5]. Indicator-based assessments for land-use and travel behavior were conducted by Kitamura et al. and Crane et al. [49,50], while Srinivasan used a mixed-method approach to measure the impact of neighborhood spatial patterns on travel behavior [51]. Literature reviews and theoretical studies highlight critical issues and methodologies for selecting and assessing indicators at different spatial scales [11,19,52,53,54,55,56]. Litman documented best practices in index and indicator identification [25]. Simulation models for urban sustainability, integrating land use and transportation, were explored by Maoh et al., while Zegras examined sustainable urban mobility within the urban context and the role of the built environment [26,57]. Mongkut et al. used the Analytical Hierarchy Process (AHP) and GIS for decision-making in transportation [58]. Lautso et al. demonstrated the SPARTACUS project, a strategic urban planning system using a land-use transport model and urban sustainability indicators [59]. Dur used GIS for an integrated land-use and transportation index [10], while Marti et al. developed an indicator-based measurement system for transport and built environment integration [60]. The OECD (1999) integrated environmental concerns into urban transportation policies, developing the Pressure-State-Response (PSR) model for indicator identification [61]. Refer to Table S2 of the Supplementary Materials for detailed transportation studies.
1.5.4. Literature on Accessibility Assessment
‘Accessibility’ is defined as the extent to which transport systems and land use enable individuals to reach their desired destinations [21,62,63]. The ultimate goal of most transportation activity is accessibility; thus, evaluating accessibility is crucial for sustainability assessment from a transportation perspective [62]. Accessibility indicates neighborhood performance, with the ease of access determining neighborhood sustainability [64]. The 15 min neighborhood concept is based on the accessibility of essential amenities and facilities within a 15 min walk or bike ride, contributing to sustainability goals [65]. Accessibility assessment guides decision-makers in identifying areas with insufficient services, and assigns land uses, redistributing services and amenities, and evaluating the performance of transportation systems [66]. Neighborhood-scale assessment offers a detailed analysis of the qualitative character of the local area, rather than larger spatial levels [67]. The literature on accessibility assessment employs diversified approaches, considering the spatial scale of assessment, the method of assessment, and accessibility to various destinations. An integrated GIS-based approach to accessibility assessment has been applied to city and neighborhood levels. Some studies focused on specific destination types in accessibility assessment, examining all possible factors affecting accessibility to particular destinations, such as food, urban parks, schools, and transport [68,69,70]. A framework for translating the concept of accessibility into measurable metrics provides planners and policymakers with a powerful tool to determine the need for, and the effectiveness of, alternative land-use and transportation policies [71]. Refer to Table S3 of the Supplementary Materials for detailed accessibility assessment studies.
2. Materials and Methods
The method of the SusTAIN framework development was to synthesize theoretical, conceptual, and contextual aspects of urban transportation under the sustainable neighborhood paradigm. The methodology (Figure 1) of this research is divided into the following two phases:
- Phase 1: The introduction discusses the need for the transportation theme-specific assessment, definition of sustainable transport and framework, literature on NSA systems, Indian regulations, policies, transportation systems, and accessibility assessment.
- Phase 2: The sustainable transportation assessment index (SusTAIN) development method for mixed-use neighborhoods in India is, in brief, subdivided into five sub-sections:
- 2A—Selection of the study area: mixed-use neighborhood in Kalyan Dombivli city, India.
- 2B—Selection and finalization of sustainable transport indicators and sub-indicators and their benchmark values based on the literature analysis of existing NSA systems, Indian regulations, policies, codes of conduct, and guidelines at different spatial urban scales.
- 2C—Reorganization of 25 sustainable transport indicators and 81 sub-indicators into the following four subthemes: (A) accessibility, (B) mobility nodes and networks, (C) external factors associated with mobility, and (D) land-use and socioeconomic factors’ assessment.
- 2D—Assessment of indicators and sub-indicators against their benchmark values.
- 2E—Normalization, weighting, aggregation, and SusTAIN calculation.
- Phase 2: The method of the sustainable transportation assessment index (SusTAIN) for mixed-use neighborhoods is explained in detail.
An indexing method was utilized to represent transportation sustainability measures. Through the development of the SusTAIN framework, the research sought to provide a comprehensive approach to understanding and improving transportation within mixed-use neighborhoods, transforming these areas into sustainable living environments. Individual indicators cannot explain sustainability in transportation. To cover the multi-dimensional approach of transportation sustainability, the composite indicator or index is recommended [48]. An index (or composite indicator) is a synthesis of indicators. The indicators can be combined into indices or a single index, which offers a comprehensive measure of progress toward the goal [26]. Formalizing indicators that necessitate the aggregation of several data points or variables results in an index. The SusTAIN framework was developed by adopting the OECD’s composite indicator methodology for index formation [61]. The framework was developed with a mixed method of indicator assessment, including a site survey, questionnaire, and administrative records. An open-source Quantum Geographic Information System (QGIS) was also used to collect and analyze the relevant data required to assess indicators and provide visual representation.
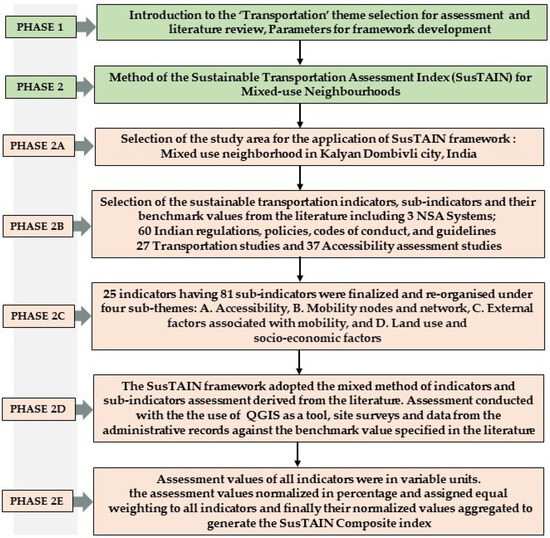
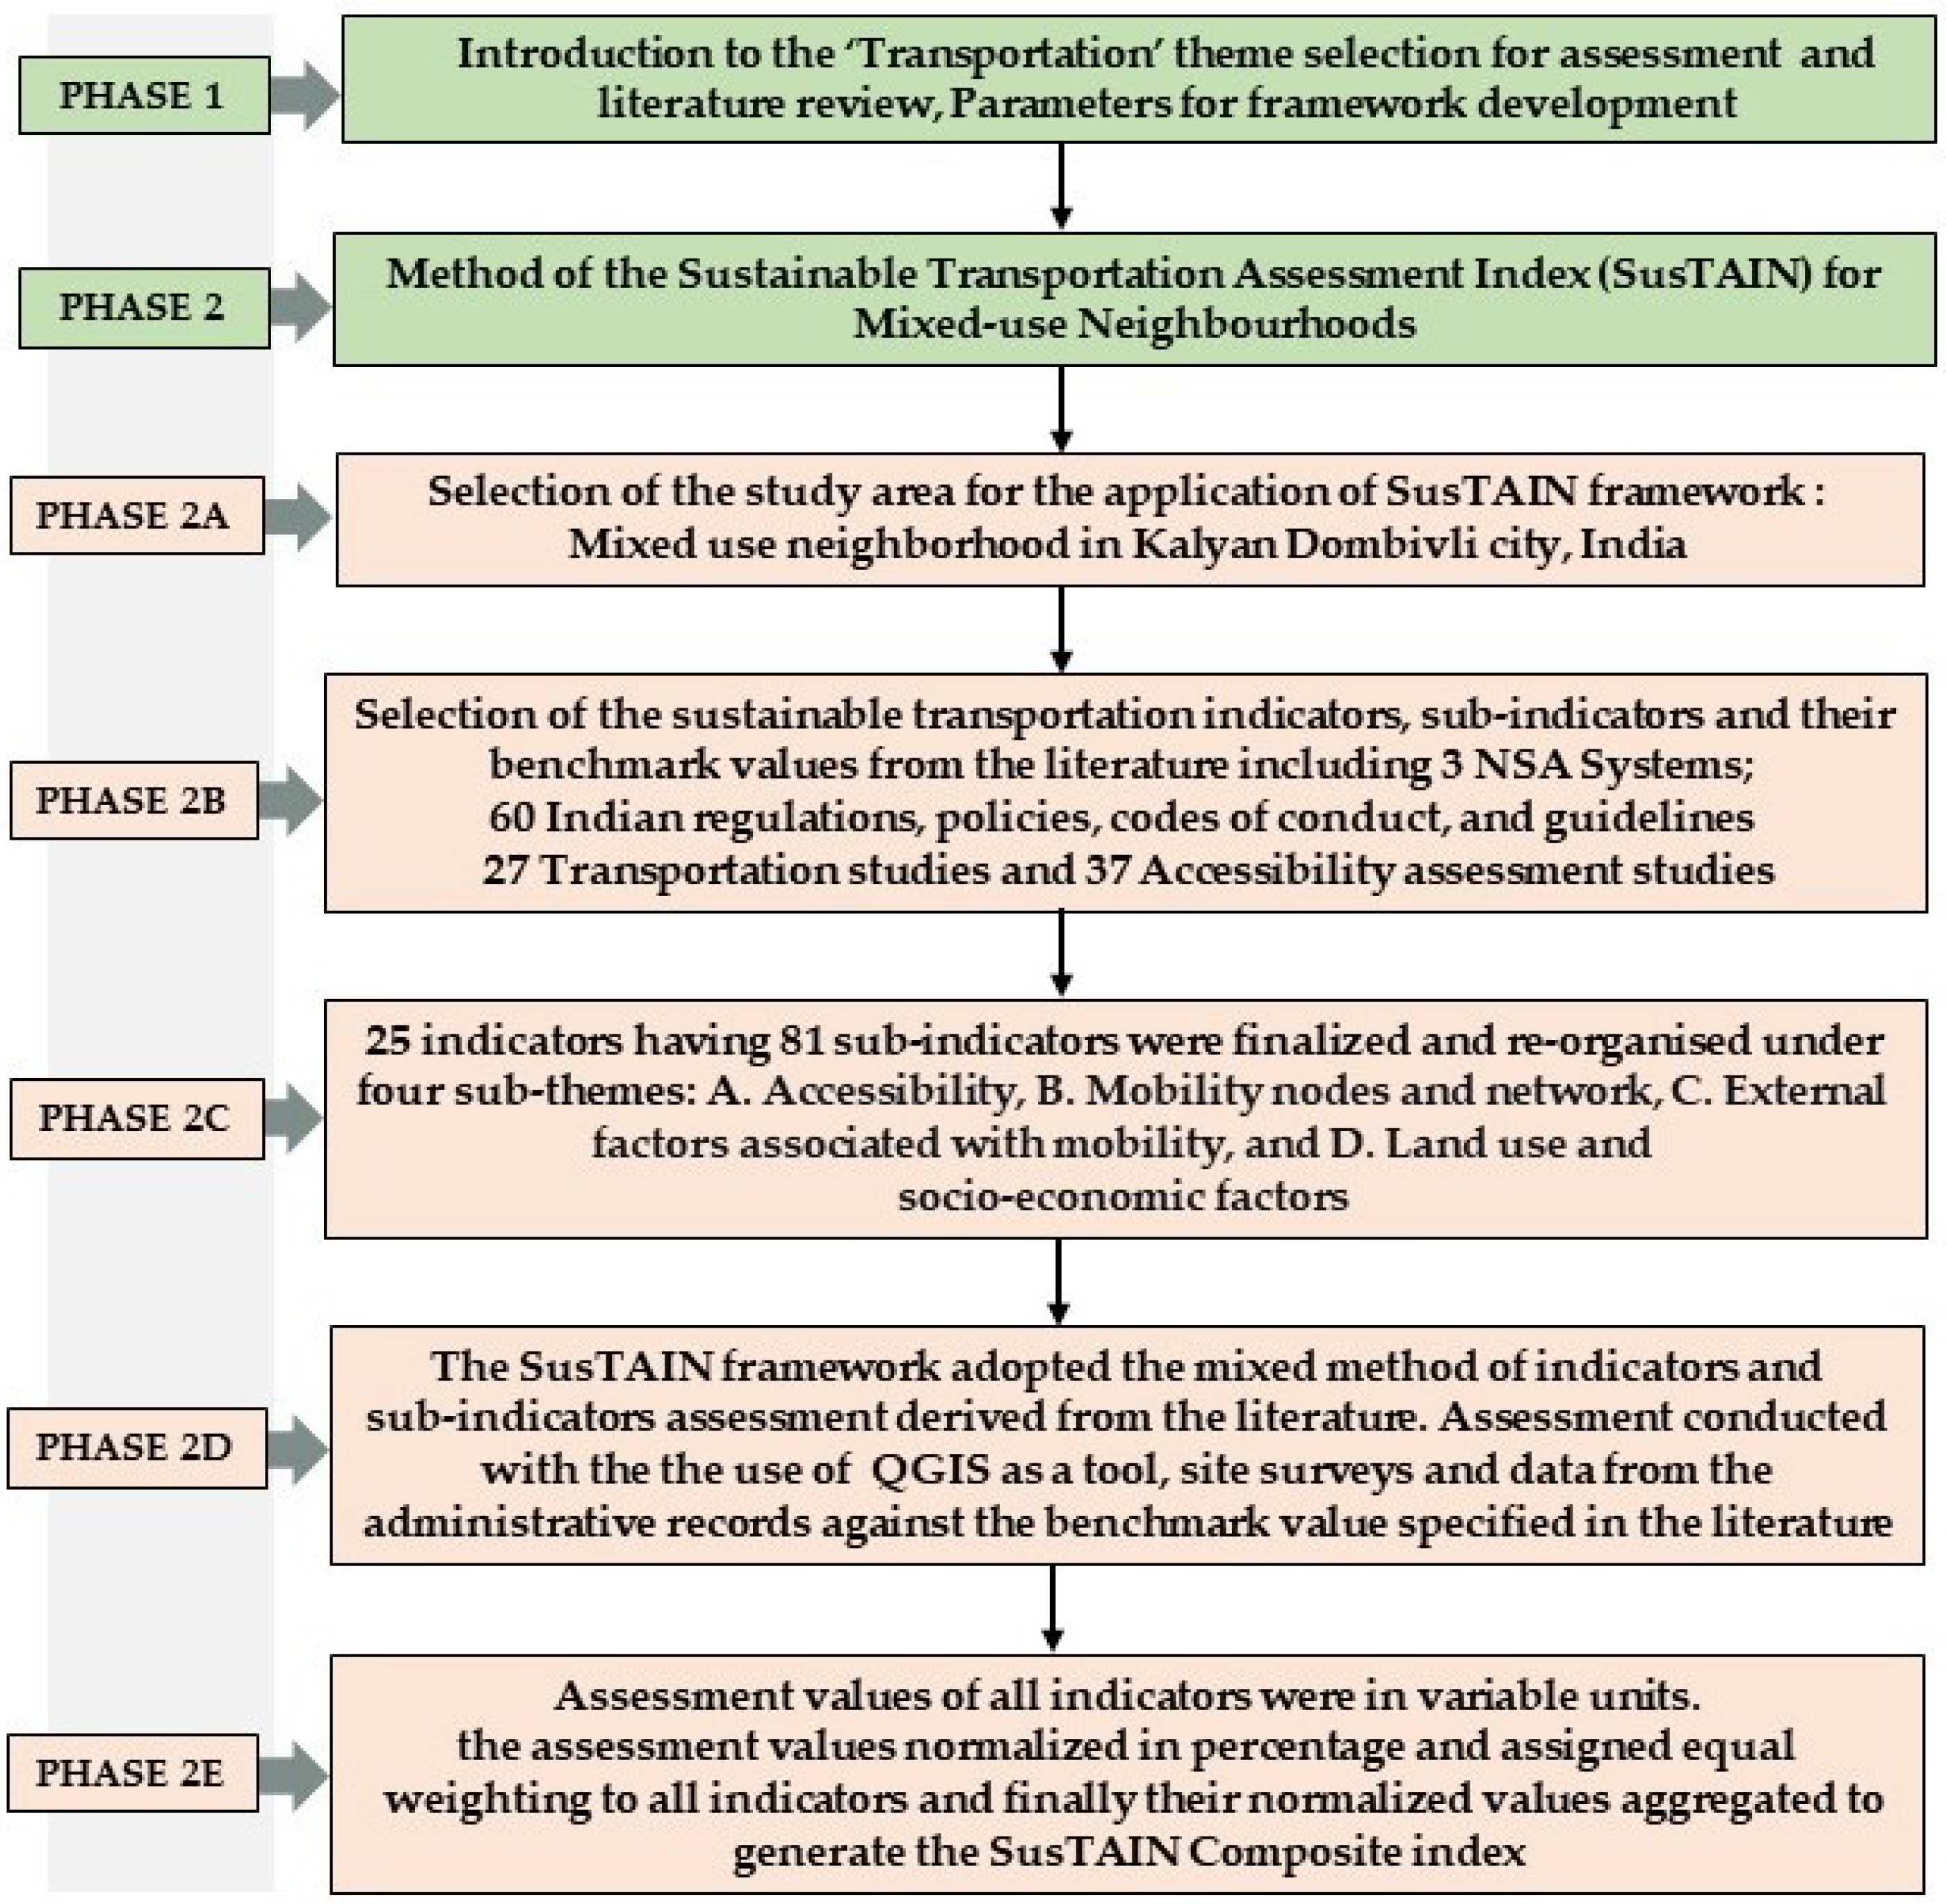
Figure 1.
The method of development of the SusTAIN framework.
Figure 1.
The method of development of the SusTAIN framework.
2.1. Phase 2A—Selection of the Study Area: A Mixed-Use Neighborhood in Kalyan Dombivli City, India
To apply the SusTAIN framework, the study area selected was from the municipal limits of Kalyan Dombivli City (KDMC), which is around 48 km from central Mumbai. The location of Dombivli is 19.218433° N, 73.086718° E. Kalyan Dombivli, a rapidly developing twin city within the Mumbai Metropolitan Region, is emerging as a key residential hub due to escalating land prices and limited habitable spaces in Mumbai [72]. Regional infrastructure projects, notably the Mankoli six-lane bridge over the Ulhas River, have significantly enhanced connectivity, reduced travel time, and bolstered economic activity. The city’s older, congested regions, particularly those along the northern edge bordered by the Ulhas River, are undergoing urban transformation. Low-rise residential chawls are being replaced by mixed-use, mid-rise developments, and this urbanization process is creating opportunities for new street network connections to the riverfront. Despite these developments, there is a lack of research on Kalyan Dombivli, particularly concerning transportation at the neighborhood scale. Ward 60, a representative mixed-use neighborhood, captures the urban characteristics of both Kalyan Dombivli and the broader Mumbai Metropolitan Region. This suggests that the SusTAIN framework could serve as a model for similar urban areas.
A ward is the smallest urban unit in India, and the geographical area of KDMC is subdivided into 122 wards. The decision to consider the administrative boundary was based on the availability and reliability of statistical data in India, such as demographics, building information, and other resource data, which were typically organized by ward or administrative unit. These data are readily accessible for research purposes. In the case of Ward 60, the boundary is well-defined by surrounding road networks, making it a clear district or neighborhood for study. The mixed-use neighborhood, ‘Ward 60’, which has an area of 158,140 m2, closely aligns with the ideal size of the neighborhood unit concept. Accordingly, Ward 60 was selected to apply the SusTAIN framework, as shown in Figure 2a–d. To understand the functionality, a 1200 m radius area from the center of Ward 60 was considered as a study area. Ward 60 is the old residential core area of Dombivli, which has transformed into a high-density, mixed-use neighborhood near the suburban railway station. The urban workshop studies on Kalyan Dombivli City drew attention to the parking, accessibility, and public transportation issues in the Dombivli west area; therefore, to analyze the accessibility issues, the area was selected for this study [73].
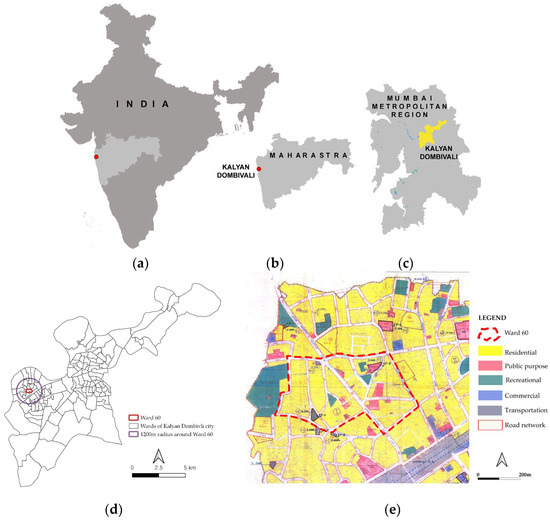
Figure 2.
(a–c) Location of Kalyan Dombivli City in Mumbai Metropolitan Region within Maharashtra state in India. (d) Wards of Kalyan Dombivli City, with the ‘Ward 60’ neighborhood and a 1200 m circle radius from the center of ‘Ward 60’ demarcated as the study areas. Source: Generated by the authors based on the maps and data provided by KDMC (General Elections 2015, India). (e) Showing the land-use map of Ward 60 (the land-use map and land-use categories are part of a draft development plan of Kalyan taken from the KDMC website). Note: the mixed-use spaces included the residential land use. It was not specifically mentioned in the land-use plan.
2.2. Phase 2B: Selection and Finalization of Sustainable Transport Indicators and Sub-Indicators
The selection of relevant indicators included research and exploration, evaluation, and selection of literature associated with the transportation theme [74]. The extensive literature referred to by the authors was the primary basis of the SusTAIN framework development. The literature was identified by searching for articles and reports on sustainable transportation systems. The keywords used were sustainable transportation systems, transportation frameworks, walkability, mobility, accessibility, transportation policies, Indian transportation policies, transportation regulations, neighborhood transportation, and transportation assessment systems: three NSA systems, twenty-seven national and international reference studies on transportation systems, and thirty-seven accessibility studies. Similarly, sixty references analyzed and evaluated in the framework of this research included seven regulations with one regulation amendment, twenty-four policies, seven codes of conduct, nineteen guidelines, and two other literature studies related to policies listed with specified references (Table S1). The literature contributed to the indicator selection process and played a significant role in identifying the benchmark values and assessment methods of the corresponding indicators and sub-indicators, which assisted in the assessment process. The volume of indicators and sub-indicators under the umbrella of sustainable transportation was substantial [52,54]. Analyzing and synthesizing indicators’ overlap, frequency of appearance in the referred literature, and regrouping under the specific subthemes were crucial to defining the structure of the SusTAIN framework.
In this research, the authors selected the indicators under the framework, considering the focus of the referred literature, and their frequency of use in the literature. Table 1 shows the indicators and their frequency of reappearance in the referred literature for transportation assessment.

Table 1.
List of 25 indicators organized under the subthemes and their reappearance in the number of referred works in the literature of NSA systems, Indian regulations, policies, codes of conduct, and guidelines, global transportation system studies, and accessibility studies. Literature studies and their relevance to the indicators and sub-indicators are represented in Table S4 of the Supplementary Materials.
One of the selection parameters was the role of indicators in the sustainability domain, and the social, economic, and environmental indicators under the transportation theme were included in the framework [52,54,75]. The scientific method of indicator selection was discussed in the literature [76]. The SusTAIN framework supports an integrated and multi-dimensional approach to indicator selection [75,77,78]. Jain et al. demonstrated the systematic indicators’ selection methodologies for transportation systems for Indian cities [54,75].
The criteria-based selection approach prioritized key indicator selection criteria documented in the literature. Indicators should be measurable, context-specific, comprehensive, policy-relevant, sensitive, interpretable, and forecastable, while aligning with local needs and priorities [11,54,75,76]. They must present issues in a quantified, easily understood, and contextually relevant manner. Assessment data should be collected from cost-effective, reliable sources or through primary surveys, with minimal time lag between data collection and changes in the phenomenon under study. Indicators must provide relevant information to guide policy changes aimed at achieving sustainability goals and be sensitive to system stresses. Additionally, indicators with controversial desired directions should be avoided to ensure coherence.
Indian cities and neighborhoods are characterized by socioeconomically diverse users with multiple modes of transportation choices. Hence, diversification in sustainable mobility indicators is required for an integrated framework [77]. The existing situation of mixed-use neighborhoods was another indicator selection parameter. The SusTAIN framework was developed for neighborhood sustainability assessment; therefore, the indicators and sub-indicators at the neighborhood spatial scale were considered in the framework development.
All indicators under the transportation theme from LEED–ND, DGNB–UD, and GRIHA–LD NSA systems were included in the SusTAIN framework. Indicators were included and evaluated based on their relevance to the regulations and policy targets [54].
The literature analysis revealed the recurring appearance of specific keywords, and the indicators corresponding to these keywords were incorporated into the SusTAIN framework. The framework included the most commonly identified indicators, categorized under keywords, such as walkability, bicycle and mobility infrastructure, public transportation, urban form, urban mobility, accessibility and its subcategories (such as accessibility to particular destinations), land-use and transport integration, accidents and fatalities, and air pollution. Indicators related to safety were frequently considered in the literature.
2.3. Phase 2C: Reorganization of Indicators and Sub-Indicators
Similar to the indicator selection methodology mentioned in Section 2.2., all subthemes covering corresponding sets of indicators frequently mentioned in the literature under the transportation umbrella were considered for subtheme identification, as represented in Table 2. The set of indicators affects the particular phenomenon, concerns, or actions grouped under a common goal, represented as subthemes. Broad processes or dimensions measured by indicators assist in including them in the subtheme. Each indicator is under a relevant subtheme, and the sub-indicators are set under the indicator based on their theoretical relationship. Multiple indicators measure the particular subtheme included in that subtheme. Within the SusTAIN framework, ten indicators were individually evaluated (without sub-indicators), while fifteen indicators were evaluated based on the aggregated value of assessment of corresponding sub-indicators (in total, eighty-one sub-indicators distributed under fifteen indicators), contributing to the corresponding subtheme assessment. Table 1 shows that the SusTAIN framework was structured into twenty-five indicators distributed into the four subthemes of (A) accessibility, (B) mobility node and network, (C) external factors associated with mobility, and (D) land-use and socioeconomic factors. The mobility node and network assessment subtheme had seven indicators, while the others had six under each subtheme, contributing to micro-level sustainability assessment.
Table 2.
The four subthemes organized under the transportation themes and their reappearance in the number of referred literature studies of NSA systems, Indian regulations, policies, codes of conduct, and guidelines, global transportation system studies, and accessibility studies. Refer to Table S4 of the Supplementary Materials for the relevant literature references associated with the four subthemes.
2.4. Phase 2D: Indicator Assessment Methodology
Indicators and sub-indicators were measured based on their type and unit. A unit or measurement scale is how an indicator or variable is measured or categorized. Measurement scales are usually classified as nominal, ordinal, interval, and ratio, and can range from scientific measurement units to customized scales developed for a specific context [11]. The indicator results should be comparable. The data collected for indicator evaluation should be from authentic sources, feasible to collect, accessible, and transparent. The authors used mixed methods of data collection and indicator measurement, including Google Maps, QGIS, direct observations through site surveys, questionnaires, and data from administrative records. The data collected by the author through multiple sources were further evaluated and analyzed through an integrated method of data analysis, including QGIS, along with scientific and mathematical calculations. The SusTAIN framework consisted of 10 standalone indicators (without sub-indicators) and 15 indicators with 81 sub-indicators, which determined the assessment of those 15 indicators.
Indicator measurement facilitated the definition of the precise amount of increase or decrease in impact. Each indicator had benchmark values and measurement units. The indicator assessment depends on the type of individual indicators. The GIS method was used in accessibility assessment, street network and connectivity assessment, urban form, and land-use assessment, focusing on accessibility to land-use and building use destination evaluation through different transportation modes [52].
2.4.1. Subtheme A: Accessibility Assessment
The ultimate goal of most transportation activity is accessibility; therefore, the sustainability assessment accessibility measures are crucial for sustainability assessment [62]. Accessibility indicates neighborhood performance, where ease of access determines neighborhood sustainability [64]. The six neighborhood destinations represented in Table 3 were documented as indicators under the accessibility assessment subtheme.
Table 3.
The building use destinations represented under each destination type.
The following method was used for the accessibility assessment of land-use and building use destinations, as indicated in Figure 3. In the literature, the accessibility analysis using GIS software was extensively explored [6,10,69,79,80,81,82]. The method adopted in this research for selected Indian neighborhoods was based on literature analysis and modified for the local conditions and factors relevant to the Indian context [79].
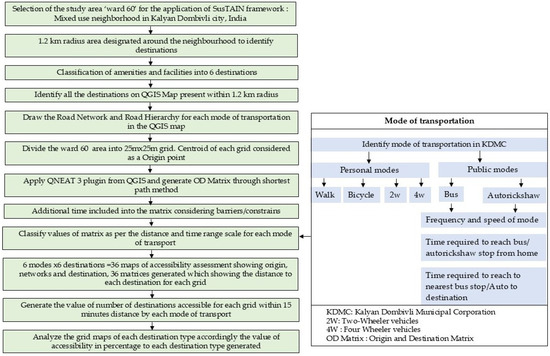
Figure 3.
The method of development of the SusTAIN framework.
The open-source QGIS 3.22.1. software was used as a tool for accessibility assessment. The neighborhood base map with the road network was prepared using QGIS. The selected neighborhood area on the QGIS map was divided into a 25 m × 25 m grid using the Research tool function of QGIS 3.22.1. The centroid of each grid was generated through the geometry tool to obtain residential addresses as ‘origin points’ for analysis. The centroid of each grid was designated as the neighborhood address. Rather than randomly picking points, this equal grid division ensured comprehensive neighborhood coverage.
A circle of a 1200 m radius from the tentative center of the neighborhood was designated as the study area extent. This distance, walkable within 15 min, aligns with the 15 min city concept, emphasizing that essential infrastructure should be reachable within 15 min [83,84]. All crucial destinations within this radius, where inhabitants made necessary trips to fulfill daily needs, were documented through Google Maps and site surveys. Accessibility from the centroid grid points to each destination type was then analyzed. Table 3 above shows the destinations categorized under specific building use types.
The accessibility analysis considered various attributes, including modes of transportation, frequency, speed, and routes, which were documented through Google Maps and site surveys. Data on the frequencies and routes of formal transportation modes were obtained from local transport service providers. The modes of transportation were categorized into public transport (buses and IPT, such as shared autorickshaws) and private transport (walking, bicycles, two-wheelers, and four-wheelers). Peak and non-peak hour information was generated through site surveys.
The scale of distances was considered to evaluate accessibility within specific ranges of ≤200, 200–400, 400–500, 500–600, 600–700, 700–800, 800–900, 900–1000, 1000–1200, and ≥1200 m. For example, the number of hospitals accessible from each centroid point was documented and analyzed.
Accessibility Assessment through Walking as a Mode of Transport from Origin to Destination
Version 3.22.1 of QGIS used the QNEAT3 plugin with an origin–destination matrix to calculate the shortest traveling distance from housing to each land-use and building destination, and the distance to the nearest public transport stop [85]. The output was generated in maps and the attribute table matrix. The distance of each grid point to all hospitals within a 1200 m radius was documented in the matrix. The number of hospitals accessible to each grid through the actual shortest distance along the road network corridors, within a range of ≤200, 200–400, 400–500, 500–600, 600–700, 700–800, 800–900, 900–1000, 1000–1200, and ≥1200 m, was generated from the matrix. The next step focused on standardizing the results obtained by assigning values in the range 0 to 10, depending on the distance to walk between the destination point and the nearest grid centroid. The average walking speed of a human is 4.7 km/h [86]. Accordingly, the time required for the walk was calculated according to the range of distances presented in Table 4.
Table 4.
The 10% to 100% scale represents the accessibility analysis through walking as a mode of transport. Accordingly, each grid in the ward map received the accessibility score through ‘walking’ as a mode of transport.
Figure 4 represents an example of the accessibility assessment methodology for Ward 60, showing the accessibility analysis by ‘walking’ as a mode of transportation from the neighborhood, with 253 centroid points of a 25 m × 25 m grid within the neighborhood boundary as addresses, and 63 hospitals and clinics identified on Google Maps. Of all hospitals, the number of hospitals in the given range of distances (≤200, 200–400, 400–500, 500–600, 600–700, 700–800, 800–900, 900–1000, 1000–1200, and ≥1200 m) was documented. Accordingly, 10% to 100% scores were assigned to each grid area. The maximum number of hospitals accessible by walking within the shortest distance to the particular grid was considered the most accessible grid area to hospitals and clinics.
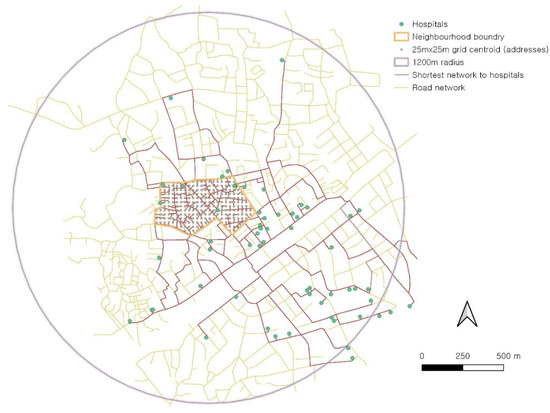
Figure 4.
The accessibility assessment through walking as a mode of transportation, considering the shortest-distance path to the 63 hospitals, which were located within a radius of 1200 m from the center of Ward 60.
Accessibility Assessment through Public Transport as a Mode of Transport from Origin to Destinations
For public transport (bus) as a mode of transportation, the total distance to destinations was calculated by summing three components: (d1) the distance from housing to the nearest bus stop, (d2) the distance traveled along the bus routes to the bus stop near the destination (as public transport routes are fixed), and (d3) the distance from the bus stop near the destination to the final destination within the same bus route network. Network analysis with the QNEAT 3 plugin was performed for each of these three components to obtain the resultant value of the shortest distance to the destination. The matrix to access the destinations was prepared for all public transport modes. Accordingly, the accessibility assessment value was assigned to each grid block.
A similar process was followed for all destination types, considering walking as a mode of transportation to reach a particular destination. For other modes of transportation, the ‘speed of vehicle’ parameter was considered during the assessment process. The aggregated value of the score received for each grid area, considering all private and public modes of transportation, was the resultant accessibility score of the respective grid area.
Limitation of Accessibility Assessment
In the present research, the accessibility assessment was based on the destination proximity opportunities through road networks. The assessment did not consider user preferences for mode of transportation travel behavior, and ignored individual choices of time-budget, weathering conditions, personal choice of intermediate visits to different destinations, impermanent travel constraints, and unforeseen circumstances during travels. The implications of personal transportation choices and unforeseen travel circumstances that limit the validity of accessibility assessment results can be minimized through extensive research requiring personal travel data. Such detailed, empirical data can be obtained through methods such as personal interviews, site surveys, travel diaries, etc. [87].
2.4.2. Subtheme B: External Factors Associated with Mobility Assessment
B1—Accessibility to mobility nodes:
The accessibility assessment method for three sub-indicators under the B1 indicator follows the same approach of ‘accessibility assessment’ mentioned in Section 2.4.1.
B2—Road public transport infrastructure, includes three sub-indicators,
B3—road assessment for vehicular and mixed traffic, comprises 17 sub-indicators,
B4—parking provision within the neighborhood, includes three sub-indicators,
B5—walkability and pedestrian infrastructure assessment, comprises 22 sub-indicators, while
B6—bicycle infrastructure assessment, includes four sub-indicators. Data for assessing all the above indicators and sub-indicators were collected through site surveys and questionnaires. The aggregated values of all sub-indicators provided the value for the respective indicators. Table S4 of the Supplementary Materials lists the sub-indicators, methods of assessment, and benchmark values.
B7—Road network connectivity:
The road network connectivity index is the link node ratio that can quantify how well the road network was connected to the destinations calculated through QGIS [26,88,89]. A link is a roadway or pathway segment between two nodes, a street between two intersections, or from a dead end to an intersection. The endpoint of a link is either an actual node, or a dangling node [88]. Road intersection density measures the number of intersections (nodes) per unit land area [90]. Higher road and intersection densities enhance the neighborhood’s connectedness [51]. Road density was calculated using the total road length per neighborhood unit area [89]. Road length is the total road length within the neighborhood. According to the United Nations Habitat recommendation, 20 km of road/ km2 is recommended for sustainable neighborhoods, and it can be calculated through QGIS Software [91].
2.4.3. Subtheme C: External Factors Associated with Mobility Assessment
C1—Safety and surveillance indicators:
C1.1—Fatalities in accidents per lakh of population. The World Health Organization (WHO), in their Status Report 2009, reaffirmed the understanding of road traffic injuries as a worldwide health and development issue [92]. Severe injuries in accidents per lakh (100,000) of the population were generated through the traffic police department and the police department of the city authority. Accidents with less than two fatalities were considered a benchmark value.
C1.2—Intelligent transport systems and surveillance measures:
According to the IT Act 2000, intelligent transport systems and surveillance measures in public spaces and CCTV cameras in the city were installed for surveillance, as mentioned in the Act. The CCTV camera surveillance measures on the street and in public spaces were installed according to the types of activities, accident-prone areas, and essential surveillance locations within the neighborhood. More than 75% of the area should be equipped with intelligent transport measures.
C1.3—Interactive street façade and active street edge:
Interactive street façades and active street edges, primarily characterized by mixed-use land-use development, are road safety determinants. If more than 75% of the street length within the neighborhood was equipped with an active frontage, it was considered a safe neighborhood:
C1.4—Air pollution due to vehicles (PM, O3, NO2, SO2, and CO):
Air pollution from vehicles is caused by particulate matter (PM), ozone (O3), nitrogen dioxide (NO2), sulfur dioxide (SO2), and carbon monoxide (CO). These pollutants were measured by taking the readings for 24 h, except O3, which was measured for 8 h, using air pollution detector devices. Random-sample surveys and surveys conducted at traffic junctions during peak and non-peak hours within the neighborhood were used to collect air quality readings. The values of air quality data were compared with the desirable air quality benchmark values.
C1.5—Noise pollution due to vehicles:
The average noise pollution level was documented using a decibel meter within the neighborhood during peak and non-peak hours, with readings specifically conducted at traffic junctions. The noise level data received through the survey were compared with the desirable noise level data.
C2—Frequency of public transport:
The public transportation stops were documented within the neighborhood. According to the route of each public transportation mode, the average frequency of public transportation modes was measured in the time interval (minutes).
C3—Electronic services in transportation:
The evaluation of the indicator C3 was based on the presence of the following electronic services in transportation: ticketing system (mobile booking, travel chip card, or buying tickets using a bank card or mobile banking app), use of transportation application to check schedule and ticket booking, Wi-Fi availability at bus stops and in public spaces, and availability of real-time information. The indicator was evaluated by the presence or absence of such services.
C4—Weathering condition protections:
C4.1—The street canopies sub-indicator was evaluated based on their presence and absence in the neighborhood. There were no particular benchmark values for the sub-indicator, whereas the weathering condition protections were recommended at signalized intersection crossings, high-activity areas, and above the sitting places on footpaths. Similarly, for the sub-indicator C4.1—presence of night shelters—one shelter per lakh city population should be planned, and the shelter location is recommended near the railway station area.
C5—Fuel consumed in transportation:
C5.1—Fuel consumed in public transport (bus and auto; average total number of buses and autorickshaw moving data generated from the transport service), and C5.2—average annual fuel consumed by two-wheelers and four-wheelers. The number of two-wheelers and four-wheelers and their daily trips’ data for the neighborhood were collected through the site survey, and annual fuel consumption values were generated based on the generated data.
C6—Population and dwelling density:
C6.1—The gross population density was measured by the entire population or number of residents within a neighborhood, divided by the area of the neighborhood. The data of total residents within each neighborhood ward were gathered from the administrative record of the city authority. The total area of the ward was calculated using the QGIS map of the neighborhood:
C6.2—Dwelling density within the neighborhood:
The data related to the total number of dwellings within the neighborhood can be generated through the administrative record of the city authority:
2.4.4. Subtheme D: Land-Use and Socioeconomic Factors’ Assessment
D1—Urban form assessments:
These were conducted through the three sub-indicators. D1.1—Average parcel or block size: The parcel size or urban block size is a key indicator of walkable neighborhoods and cities. A block is an enclosed polygon area bounded by features such as publicly accessible motorized or mixed-traffic roads, or streams on all sides [93]. The average parcel or block size was calculated from a GIS map of the neighborhood, where street networks were documented through the open street map. Small blocks were 100–120 m, mid-sized blocks were 120–260 m, and large blocks were 400–450 m [94].
D1.2—Average household size:
Household size refers to the number of individuals living together in a household:
D1.3—The street aspect ratio (relationship between building height and street width):
The aspect ratio was crucial to analyze the shading and wind flows [91]. An appropriate street aspect ratio gives pedestrians a feeling of safety. The aspect ratio is the ratio of the mean height of the buildings to the width of the street. The value of the street aspect ratio of 1:2 was recommended [91]. The street hierarchy plan was prepared based on the road width, and the average height of adjacent buildings was documented through site visits. The street aspect ratio was calculated for each street width type using the following formula:
D2—Land-use assessment:
D2.1—The land-use mix ratio illustrated a pattern of combination and segregation of different land uses within the geographic area (neighborhood). The entropy index was calculated to analyze the land-use mix, considering the variety of land uses within the neighborhood area [5]. The entropy index was calculated using the following formula for the nth number of land uses:
where, y is the total area of all land uses in square meters, x1 and x2 are the different types of land-use area in square meters, and n is the total number of land uses in the mix.
The entropy index value ranges from 0 to 1, where 0 corresponds to homogeneous land uses, and 1 represents the equal distribution of all land uses within the neighborhood area. Existing land uses were mapped through inspection of the existing land-use map provided by the city authority and validated by the site survey.
D2.2—Land occupied by a road network within the neighborhood:
This was calculated by mapping all road networks with their road width, and the total area was calculated from the map using the ‘area command’ from QGIS software. Similarly, from the QGIS map, D2.3—land use other than roadways—was calculated by deducting the road network area from the total neighborhood land-use area.
D3—Building floor area ratio (FAR):
There were no such benchmark values fixed for the FAR. It was calculated using the following formula: the value of FAR varied per city regulation, plot size, and the width of the adjacent road:
D4—Open space availability per household:
The open space availability per household was calculated using the following equation:
D5—Affordability of public transport:
Affordability of public transportation is considered as the ability to make necessary journeys (to work, school, health, and other social services, and visit other family members or urgent journeys), without curtailing other essential activities [95]. According to the wage charges in April 2024 specified by the Ministry of Labor and Employment, the average minimum per capita income in India was 522 rupees per day [96]. The following formula calculated the affordability index for traveling through public transportation [95]:
D6—Average employment within the neighborhood:
Average employment density measures the number of employees within a designated geographic area divided by the size of the designated area:
2.5. Phase 2E: Normalization, Weighting, Aggregation, and the SusTAIN Index Calculation
2.5.1. Normalization of Indicators
The indicators have a unique measurement method with different units. The normalization process converts these diverse units into a standard, comparable scale, facilitating the inclusion of indicators in an aggregate sustainability score [24,97]. Several methods are available for normalization, and these include ranking, standardization (or z-score), min.–max., distance to a reference country, categorical scales, indicators above and below the mean, cyclical indicators (OECD), balance of opinions (EC), and percentage of annual differences over consecutive years. This research used a two-tier ‘categorical scales’ method, employing a 10-point scale: 90–100% (very high), 80–90% (high), 70–80% (medium–high), 60–70% (medium), 50–60% (medium–low), 40–50% (low), 30–40% (very low), 20–30% (poor), and 10–20% (very poor). This approach ensures a standardized assessment, making evaluation and comparison of the sustainability of different neighborhoods easier.
where, = assessment score of an indicator, in percentage.
2.5.2. Indicator Weighting
A weight is a coefficient attached to an indicator, indicating its importance relative to other indicators [98]. Equal weighting is the most common scheme in developing composite indicators [24]. The equal weighting method used for this research assumed that all indicators contributed equally to the SusTAIN framework.
2.5.3. Indicator Aggregation
The final step in composite indicator calculation was aggregation. The linear aggregation method is the most widely used, understandable, and easy to incorporate in composite index formation [24]. The authors incorporated the linear aggregation method, widely recognized in the literature as the most prevalent method among linear, geometric, and multi-criteria aggregation methods [24,98]. All indicators under a specific subtheme were aggregated to produce an individual sub-thematic assessment value, and all indicators across the four subthemes were aggregated to form a mixed-use neighborhood aggregate, which was subsequently converted into the SusTAIN composite index.
where, X = normalized score of an indicator, in percentage, and I25 = aggregated score of all 25 indicators.
2.5.4. Composite Index
The composite indicator is an aggregate metric derived from a group of indicators and sub-indicators selected to define a multi-dimensional, generally complex concept, using mathematical and statistical inference tools [24]. The term index was previously defined as a composite indicator, combining multiple indicators/parameters developed for a context-specific application [11]. Aggregating indicators to produce an index or composite indicator is linked to applying multi-criteria decision-making (MCDM) methods. According to the SusTAIN framework, 25 indicators were evaluated for the neighborhood:
where, I25 = aggregated score of all 25 indicators from Equation (12).
3. Results and Discussion
This research systematically developed the SusTAIN framework to assess neighborhood sustainability from a transportation perspective in Indian mixed-use neighborhoods (‘Wards’). The framework organized indicators into four main subthemes of (A) accessibility, (B) mobility nodes and network, (C) external factors associated with mobility, and (D) land-use and socioeconomic factors’ assessment critical to evaluating neighborhood sustainability. The study emphasized the complexity and multi-dimensional nature of the assessment of sustainability, advocating a diverse methodology that incorporates theoretical insights and practical data collection techniques. Benchmark values for indicators were established through a comprehensive literature review, supplemented by international studies, where necessary. The SusTAIN framework’s application at the neighborhood scale involved a mixed-method approach of integrating data from multiple sources, including Google Maps, site surveys, administrative records, and secondary literature, contributing to a robust evaluation of sustainability indicators. The accessibility assessment subtheme incorporated multiple parameters to provide a comprehensive evaluation. These indicators included: (a) identification of destinations, (b) different modes of transportation, (c) frequency of public transportation modes, (d) shortest network distance to the destination, which calculates the shortest path using the transportation network to reach the destination, thus identifying the most efficient routes, and (e) impedance due to contextual situations, which accounts for factors such as traffic congestion, road conditions, and other situational impediments that can affect travel time and accessibility. The aggregated accessibility assessment value, considering all modes of transportation to all destinations, provides a resultant value expressed in temporal dimensions (measured in the time required to reach a destination), and was graphically represented on QGIS maps. The accessibility was represented in percentage scale in the range of 10% to 100%, where the minimum score of 10% indicated poor accessibility, whereas 100% was the maximum accessibility score.
The mobility nodes and networks subtheme encompassed the maximum number of indicators and sub-indicators, aiming to evaluate public transport and street infrastructure and bicycle and pedestrian infrastructure in detail for a micro-level assessment. The sub-indicator B2.3 (bus parking facility) was evaluated at the city level, because bus parking facilities might be located outside the specific study area of a neighborhood, potentially in a different neighborhood. This approach ensures a thorough and accurate assessment of the bus parking infrastructure, accounting for its impact on, and relevance to, the overall mobility within the city.
The indicator B4—on-street and off-street parking—had no specific benchmark value, because parking management within a neighborhood depends on several factors, including space requirements, multimodal integration, and the number of existing parking locations. Consequently, only space standards were considered for this indicator. The actual value of the indicator can be determined through a site survey, which allows for a precise and context-specific assessment of parking needs and availability.
QGIS was used to assessed indicators and sub-indicators A1, A2, A3, A4, A5, A6, B1, B7, D1.1, and D2.2, based on the data generated through the site survey and secondary sources. Other indicators and sub-indicators from the framework were assessed through site visits, surveys, and secondary data sources. The noise and air pollution due to vehicle sub-indicators were measured by measuring instruments through a site survey. The ‘mixed assessment’ method was adopted for an overall assessment of the SusTAIN framework.
The output of each indicator evaluation had different units of measurement, which were normalized and presented on a categorical scale of 10 in percentage, from 10% to 100%, to represent the assessment in a comprehensible format. All indicators were considered crucial in the assessment process. Aggregated scores of all indicators under all subthemes resulted in the SusTAIN index calculation, which was the outcome of the research.
The primary aim of this research was to establish the SusTAIN framework through theoretical and statistical analysis. The SusTAIN framework was evaluated by applying it to the neighborhoods of Kalyan Dombivli City, as described in Section 2.2. The decision to select Kalyan Dombivli for the SusTAIN framework application was based on site visits and an understanding of regional and local settings. In future research, the framework will be evaluated and applied to Ward 60 of Kalyan Dombivli and potentially other neighborhoods in the city. The SusTAIN framework will be validated through its application, and various surveys and experiments will be conducted, as outlined in the research methodology. The application of the SusTAIN framework was beyond the scope of this manuscript and will be published as a separate research study.
3.1. Interrelationships and Interdependencies between Indicators and Sub-Indicators
The interrelationship between indicators and sub-indicators is crucial to determining the framework’s effectiveness in achieving sustainability goals. The interrelationship between indicators and sub-indicators assists in verifying the appropriateness of indicator selection. Software-based tools were used to represent interrelationships. Relationships between indicators can be quantified using the Analytical Hierarchy Process (AHP) and Bayesian network models [75]. Jain et al. used the Prajek 3.12 software to study interrelationship networks [54]. The method of representing the indicators and sub-indicators’ interrelationships in the form of the matrix was derived from the literature analysis [99].
Interrelationships between indicators and sub-indicators demonstrate the interdependencies and influence of indicators and sub-indicators. The SusTAIN framework consisted of ten standalone indicators (without sub-indicators) and fifteen indicators (having eighty-one sub-indicators). The interrelationship was established based on the literature studies, showing individual indicators or sub-indicators with all other 90 indicators and sub-indicators (a 91 × 91 matrix, representing 8281 entries). The interrelationship was expressed in the numerical format of 0 and 1. The number 0 indicates the absence of interrelationship, while the number 1 indicates the presence of interrelationship. Table S5 of the Supplementary Materials documents the interrelationship matrix, and Figure 5a–d show the graphical representation of the interrelationship in the hierarchical network using the ‘ggraph library’ in ‘R’ software version 4.4.0 through the Hierarchical Edge Bunding data visualization method [100].
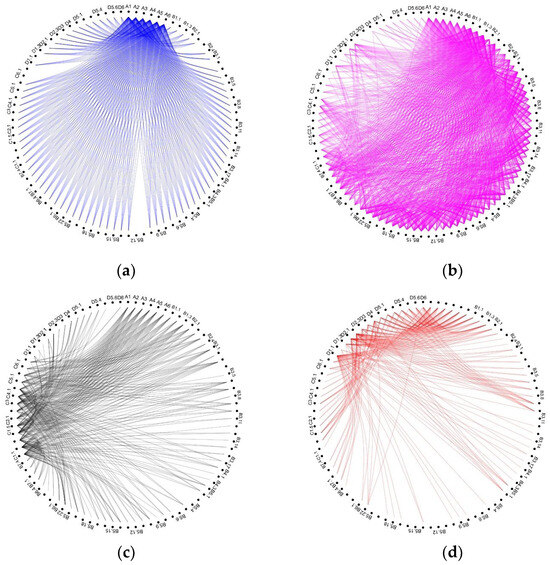
Figure 5.
(a–d) The interrelationship of accessibility subtheme indicators: mobility nodes and network, external factors associated with mobility, and land use and socioeconomic factor subthemes’ indicators and sub-indicators, with all other indicators and sub-indicators.
An interrelationship matrix was established based on the impact and dependency of an indicator or sub-indicator on other indicators and sub-indicators. For example, ‘fuel consumption’ and ‘affordability of transportation’ indicators were interrelated because the fuel consumed during traveling affects the transportation cost. Even though both indicators can be evaluated independently, one can influence the value of the other. Another example of sub-indicator dependency was the ‘presence of continuous footpath’ and ‘appropriate height of footpath’. Both indicators have interrelationships because of their dependency. The height of the footpath can only be evaluated if a ‘presence of continuous footpath’ sub-indicator exists in the framework.
The interrelationship score of each indicator or sub-indicator was the sum of scores within each row of the matrix, showing the aggregated interrelationship score with all other 90 indicators and sub-indicators. The score for each entry was normalized in percentage to visualize the standardized interrelationship value:
where, B = indicator or sub-indicator, Ai = indicators or sub-indicators excluding ‘B’, and 90 is the total number of indicators and sub-indicators excluding ‘B’.
According to Table S5 of the Supplementary Materials and Figure 5a–d, all indicator and sub-indicator interrelationship matrixes showed that the sub-indicator B1.3—accessibility to the suburban railway station—had the highest interrelationship score, of 97.80%, of all indicators and sub-indicators, followed by accessibility indicators (A1–A6), which had the highest interrelationship score of 94.51% each. Sub-indicators B1.1 and B1.2, from the mobility nodes and network assessment subtheme, had the highest interrelationship with all indicators and sub-indicators, as B1.1—accessibility to the bus stop—and B1.2—accessibility to IPT stops—are highly desirable, with interrelationship scores of 82.42% and 78.02%, respectively, and the indicators from all other subthemes were highly dependent on them.
The SusTAIN framework had sub-indicators under the indicators B2—road public transport infrastructure assessment (B2.1 and B2.2), B3—road assessment for vehicular and mixed traffic (B3.1, B3.2, B3.3, B3.4, B3.6, B3.7, B3.8, B3.9, B3.11, B3.12, B3.13, and B3.17), and B5—walkability and pedestrian infrastructure (B5.2, B5.4, B5.5, B3.4, B5.7, B5.9, B5.10, B5.13, B5.14, B5.15, B5.21, and B5.22), as well as B6.1, C1.2, and D6, which earned around a 40–60% interrelationship score. The interrelationship score showed a moderate interrelationship between indicators and sub-indicators. The range of sub-indicators from the mobility node and network assessment theme were interrelated and influenced other subthemes, which is reflected in the moderate interrelationship score between them.
The broad range of sub-indicators from the mobility nodes and network assessment subtheme (B2.3, B2.4, B3.2, B3.5, B3.10, B3.14, B3.15, B3.16, B4, B5.3, B5.6, B5.9, B6.2, B6.4, and B7), external factors affecting the mobility subtheme (C1.1, C1.3, C1.4, C1.5, C2, C3, and C4), and land-use and socioeconomic factors subtheme (D1.1 and D1.4) had interrelationship scores in the range of 20–40%, showing that the public and private parking, traffic signals and signage, height of footpath, curb, curb-related sub-indicators, and bicycle infrastructure, road network connectivity, safety and surveillance, frequencies of public transport, electronic services in transportation, weathering condition protections, average parcel size, land-use mix ratio, and open space availability per person indicators and sub-indicators, had average interrelationships between all the indicators and sub-indicators.
Ultimately, those with less than a 20% interrelationship score included indicators and sub-indicators B5.12, B6.3, C5, C6, D1, D2.3, D3, D5, and D6. B5.12—appropriate grating around the trees along/on the footpath to protect tree roots and to maintain footpath conditions, and B6.3—presence of bicycle shop sub-indicators, are sub-indicators dependent on their respective indicators, having limited interrelations. Meanwhile, the C5—fuel consumed in transportation, C6—population and dwelling density, D1—urban form, D2.3—land use other than roadways, D3—building floor area ratio, D5—affordability of public transport, and D6—average employment per household indicators could have weak interrelationships with the other indicators and sub-indicators. These indicators and sub-indicators had a less than 20% interrelationship score, and were interrelated with the accessibility theme indicators, because land use, urban form, and transportation integration contribute to neighborhood sustainability. Otherwise, the above indicators and sub-indicators had limited interrelation and less influence on indicators and sub-indicators from the other subthemes, excluding the accessibility subtheme.
The interrelationship matrix (Table S5 of the Supplementary Materials) elucidates how the indicators and sub-indicators mutually influenced the framework, identifies micro-level sustainability issues, and aids in prioritizing assessments based on framework structure. While interrelationship scores reveal indicator and sub-indicator connections, they do not directly impact the assessment scores of individual indicators or sub-indicators.
The interrelationship analysis demonstrated that the ‘accessibility from housing to destinations’ and ‘accessibility to mobility nodes’ showed the strongest interrelationships with all indicators and sub-indicators. This finding underscores the importance of prioritizing the accessibility subtheme in the assessment process, rather than relying solely on a population-based approach in infrastructure planning. By emphasizing accessibility, the assessment can more effectively evaluate the efficient application of land-use and transportation integration policies [6].
Although the existing situation has been evaluated through the SusTAIN framework, future mobility needs and central-level policies for future mobility trends need to be analyzed accordingly. New research avenues will be opened for studies related to future urban mobility.
The SusTAIN framework has multiple applications. It can assist the local authorities and stakeholders in documentation, budget allocation, tracking the transportation-related interventions, and modifying the existing and new neighborhood-level policies. The comprehensive approach ensured that all sustainable transportation aspects were addressed, facilitating informed decision-making and effective resource management.
3.2. Limitations and Challenges
The SusTAIN framework has limitations in assessing freight transportation networks and systems. The accessibility assessment subtheme methodology did not consider the personal choices of mode of transportation, time-budget, weathering conditions, intermediate visits to different destinations, impermanent travel constraints, and unforeseen circumstances during travel, because such situations are difficult to analyze with the current practice of assessment.
To apply the SusTAIN framework to multiple neighborhoods, an extensive data collection mechanism needs to be established to collect data for assessment, and data generated during the survey and analysis process need to be streamlined and organized for a transparent assessment process.
Mixed-use neighborhoods with cultural, geographical, and contextual significance (e.g., heritage precincts, coastal neighborhoods, and tourist sites) should be assessed considering their priorities and unique nature, which can be challenging and limiting for the SusTAIN framework’s application.
4. Conclusions
The SusTAIN framework addresses the limitations of NSA systems by incorporating extensive indicators and sub-indicators to cover a multi-dimensional approach in transportation assessment for mixed-use neighborhoods, performing micro-level assessments to identify the specific needs of each neighborhood. This research significantly contributed to the existing knowledge of neighborhood sustainability assessment. The SusTAIN framework was developed based on a comprehensive literature review, including NSA systems, transportation systems, accessibility assessments, and Indian urban development and transportation regulations, policies, codes of conduct, and guidelines. The SusTAIN framework methodology included the selection of 25 indicators with 81 sub-indicators, their benchmark values, and assessment methods derived from the literature. These indicators were organized under four subthemes of (A) accessibility, (B) mobility nodes and networks, (C) external factors associated with mobility, and (D) land-use and socioeconomic factors’ assessment. Each indicator was assigned equal importance, and the normalized, aggregated assessment value of the SusTAIN index was calculated. A mixed-method approach was used for indicator assessment, including GIS, site surveys, and secondary data collection from administrative records. The open-source QGIS software served as an analytical tool for data analysis, providing the capability to visualize transportation-related issues and sustainability conditions. This visualization can assist in future scenario planning and optimization representation. The SusTAIN framework research systematically and consistently organizes performance measurement benchmarks to incorporate sustainability operations and strategies, enhancing financial decision-making processes for neighborhoods. In turn, this can improve the quality of life, and preserve natural resources. The performance of the existing NSA system under the transportation theme can be evaluated by comparing the application of the SusTAIN framework with the current NSA system application in the Indian context. By examining the interrelationship between indicators and sub-indicators, it became evident that enhancing accessibility could lead to improvements across multiple sustainability dimensions.
The SusTAIN framework can assist in applying central policies at a neighborhood scale, bridging the gap between policy formulation and implementation. Since cities are dynamic, the sustainability assessment process is temporal, requiring periodic reassessment to keep the SusTAIN framework updated.
With advances in technology, automation, and their applications in neighborhoods and cities, as well as updates to regulations and policies, the framework can adapt to technological, regulatory, and policy-level changes. The development of the SusTAIN framework represents a journey of progress for local actions aimed at achieving global sustainable development goals.
Supplementary Materials
The following supplementary information can be downloaded at: https://www.mdpi.com/article/10.3390/land13081325/s1. Table S1: List of publications, including Indian urban development regulations, policies, codes of conduct, standards, and guidelines publications, with their publication type and brief content of the publications. Table S2: List of publications, including transportation studies, with their references, spatial scale of the study area, and method of study. Table S3: List of accessibility studies with their references, the spatial scale of the study area, and the method of study and theme of the research. Table S4: List of indicators and sub-indicators of the SusTAIN framework, with references from the literature, sustainability domain relevance, unit of measurement, benchmark value, scoring logic, and measurement method. Table S5: Matrix showing the interrelationship between all indicators and sub-indicators of the SusTAIN framework.
Author Contributions
Conceptualization, S.B. and T.S.; methodology, S.B. and T.S.; validation, S.B. and T.S.; formal analysis, S.B.; investigation, S.B.; resources, S.B. and T.S.; data curation, S.B. and T.S.; writing—original draft preparation, S.B. and T.S.; writing—review and editing, S.B. and T.S.; visualization, S.B.; supervision, T.S. All authors have read and agreed to the published version of the manuscript.
Funding
This work was supported by the National Research Foundation of Korea (NRF), funded by the Korean government, Ministry of Science and ICT (MSIT; RS-2024-00346177).
Data Availability Statement
No new data were created or analyzed in this study. Data sharing is not applicable to this article.
Conflicts of Interest
The authors declare no conflicts of interest.
References
- Gouda, A.A.; Masoumi, H.E. Sustainable transportation according to certification systems: A viability analysis based on neighborhood size and context relevance. Environ. Impact Assess. Rev. 2017, 63, 147–159. [Google Scholar] [CrossRef]
- Yigitcanlar, T.; Kamruzzaman, M.; Teriman, S. Neighborhood Sustainability Assessment: Evaluating Residential Development Sustainability in a Developing Country Context. Sustainability 2015, 7, 2570–2602. [Google Scholar] [CrossRef]
- Bahale, S.; Schuetze, T. Comparative Analysis of Neighborhood Sustainability Assessment Systems from the USA (LEED–ND), Germany (DGNB–UD), and India (GRIHA–LD). Land 2023, 12, 1002. [Google Scholar] [CrossRef]
- Bahadure, S.; Kotharkar, R. Framework for measuring sustainability of neighbourhoods in Nagpur, India. Build. Environ. 2017, 127, 86–97. [Google Scholar]
- Bahadure, S.; Kotharkar, R. Assessing Sustainability of Mixed Use Neighbourhoods through Residents’ Travel Behaviour and Perception: The Case of Nagpur, India. Sustainability 2015, 7, 12164–12189. [Google Scholar] [CrossRef]
- Yenisetty, P.; Bahadure, P. Measuring Accessibility to Various ASFs from Public Transit using Spatial Distance Measures in Indian Cities. ISPRS Int. J. Geo-Inf. 2020, 9, 446. [Google Scholar] [CrossRef]
- Das Mahapatra, G.; Mori, S.; Nomura, R. Reviewing the Universal Mobility of the Footpaths in the Centers of Historic Indian Cities through Field Survey. Sustainability 2023, 15, 8039. [Google Scholar] [CrossRef]
- Gupta, K.; Roy, A.; Luthra, K.; Maithani, S.; Mahavir. GIS based analysis for assessing the accessibility at hierarchical levels of urban green spaces. Urban For. Urban Green. 2016, 18, 198–211. [Google Scholar] [CrossRef]
- Becker, J. How Frameworks Can Help Operationalize Sustainable Development Indicators. World Futures 2007, 63, 137–150. [Google Scholar] [CrossRef]
- Dur, F. The Integrated Land Use and Transportation Indexing Model: Assessing the Sustainability of The Gold Coast, Australia; Queensland University of Technology: Brisbane City, Australia, 2012. [Google Scholar]
- Gudmundsson, H.; Hall, R.P.; Marsden, G.; Zietsman, J. Sustainable Transportation; Springer: Berlin/Heidelberg, Germany, 2016. [Google Scholar]
- Ministry of Road Transport and Highways, Government of India. Road Transport Yearbook 2017-18–2018-19; Ministry of Road Transport and Highways, Government of India: New Delhi, India, 2021. Available online: https://morth.nic.in/sites/default/files/RTYB-2017-18-2018-19.pdf (accessed on 13 August 2024).
- Kumar, M.; Shao, Z.; Braun, C.; Bandivadekar, A. Decarbonizing India’s Road Transport: A Meta-Analysis of Road Transport Emissions Models; The International Council on Clean Transportation: Washington, DC, USA, 2022. [Google Scholar]
- Mani, A.; Pai, M.; Aggarwal, R. Sustainable Urban Transport in India: Role of the Auto-Rickshaw Sector; World Resources Institute and EMBARQ: Mumbai, India, 2012. [Google Scholar]
- Institute for Transportation and Development Policy. Complete Streets Policy Framework; ITDP: New York, NY, USA, 2019. [Google Scholar]
- Hermelin, B.; Henriksson, M. Transport and Mobility Planning for Sustainable Development. Plan. Pract. Res. 2022, 37, 527–531. [Google Scholar] [CrossRef]
- United Nations Economic and Social Commission for Asia and the Pacific. Monograph Series on Sustainable and Inclusive Transport: Assessment of Inclusive Transport Systems; United Nations Publication: Bangkok, Thailand, 2017. [Google Scholar]
- Prime Minister’s Office, Press Information Bureau, Government of India. New Delhi G20 Summit Will Chart a New Path in the Human-Centric and Inclusive Development, New Delhi, India 8 September 2023. Available online: https://www.pib.gov.in/PressReleaseIframePage.aspx?PRID=1955587 (accessed on 31 May 2024).
- Dobranskyte-Niskota, A.; Perujo, A.; Pregl, M. Indicators to Assess Sustainability of Transport Activities Part 1, Review of the Existing Transport Sustainability Indicators Initiatives and Development of an Indicator Set to Assess Transport Sustainability Performance; European Comission-Joint Research Centre, Institute for Environment and Sustainability, Transport and Air Quality Unit: Ispra, Italy, 2007; Available online: https://data.europa.eu/doi/10.2788/54736 (accessed on 13 August 2024).
- Jeon, C.M.; Amekudzi, A. Addressing Sustainability in Transportation Systems: Definitions, Indicators, and Metrics. J. Infrastruture Syst. 2005, 11, 31–50. [Google Scholar] [CrossRef]
- Litman, T. Well Measured Developing Indicators for Sustainable and Livable Transport Planning; Victoria Transport Policy Institute: Victoria, BC, Canada, 2023. [Google Scholar]
- EIDessouki, W.M. Development of a Neighborhood Mobility Index for Assessing Mobility Disparities in Developing Countries with Application to the Greater Cairo Area, Egypt. Sustainability 2022, 14, 15846. [Google Scholar] [CrossRef]
- Goldman, T.; Gorham, R. Sustainable urban transport: Four innovative directions. Technol. Soc. 2006, 28, 261–273. [Google Scholar] [CrossRef]
- Organization of Economic Co-operation and Development (OECD). Handbook on Constructing Composite Indicators: Methodology and User Guide; OECD Publications: Paris, France, 2008. [CrossRef]
- Litman, T. Sustainable Transportation Indicators a Recommended Research Program for Developing Sustainable Transportation Indicators and Data; Victoria Transport Policy Institute: Victoria, BC, Canada, 2008; pp. 1–13. [Google Scholar]
- Zegras, P.C. Sustainable Urban Mobility Exploring the Role of the Built Environment; Massachusetts Institute of Technology: Cambridge, MA, USA, 2005. [Google Scholar]
- Sharifi, A.; Dawodu, A.; Cheshmehzangi, A. Neighborhood sustainability assessment tools: A review of success factors. J. Clean. Prod. 2021, 293, 125912. [Google Scholar] [CrossRef]
- Ponkshe, A. ORF Occasional Paper: Policy Making Towards Green Mobility in India; Observer Research Foundation: New Delhi, India, 2020. [Google Scholar]
- Verma, A.; Harsha, V.; Subramanian, G.H. Evolution of Urban Transportation Policies in India: A Review and Analysis. Transp. Dev. Econ. 2021, 7, 25. [Google Scholar] [CrossRef]
- Baindur, D. Urban Transport in India: Challenges and Recommendations; Indian Institute of Human Settelement Bangalore: Bengaluru, India, 2015. [Google Scholar]
- Government of India. The Air (Prevention and Control of Pollution) Act, 1981; Government of India: New Delhi, India, 1981.
- Department of Environment, Forests & Wildlife, Ministry of Environment and Forests, Government of India. The Environment (Protection) Act, 1986; Department of Environment, Forests & Wildlife, Ministry of Environment and Forests, Government of India: New Delhi, India, 1986.
- Central Pollution Control Board, Ministry of Environment and Forest and Climate Change, Government of India. The Noise Pollution (Regulation and Control) Rules, 2000; Central Pollution Control Board, Ministry of Environment and Forest and Climate Change, Government of India: New Delhi, India, 2000.
- Ministry of Road Transport & Highways, Government of India. The Motor Vehicales Act, 1988; Ministry of Road Transport & Highways, Government of India: New Delhi, India, 1988.
- Government of India. Auto Fuel Vision and Policy 2025, Report of Expert Committee; Government of India: New Delhi, India, 2014. Available online: https://mopng.gov.in/en/refining/auto-fuel-vision (accessed on 13 August 2024).
- Ministry of Petroleum and Natural Gas, Government of India. National Policy on Biofuels 2018 Amendment, 2022; Ministry of Petroleum and Natural Gas, Government of India: New Delhi, India, 2022. Available online: https://mopng.gov.in/files/article/articlefiles/Notification-15-06-2022-Amendments-in-NPB-2018.pdf (accessed on 13 August 2024).
- Government of India, Ministry of Transport and Highways. National Road Safety Policy 2010; Government of India, Ministry of Transport and Highways: New Delhi, India, 2010.
- Urban Development Department, Government of India. The Street Vendors (Protection of Livelihood and Regulation of Street Vending) Act, 2014; Urban Development Department, Government of India: New Delhi, India, 2014.
- Department of Empowerment of Persons with Disabilities, Government of India. The Rights of Persons with Disabilities Act, 2016; Department of Empowerment of Persons with Disabilities, Government of India: New Delhi, India, 2016.
- Ministry of Housing and Urban Affairs, Government of India. National Urban Transport Policy; Ministry of Housing and Urban Affairs, Government of India: New Delhi, India, 2006.
- Ministry of Urban Development Government of India. Smart Cities Mission Statement and Guidelines; Ministry of Urban Development Government of India: New Delhi, India, 2015.
- Service, B.E.N. Government Plans Rs. 70000 Crore Green Mobility Scheme in 103 Cities. The New Indian Express, 16 March 2017. [Google Scholar]
- Ministry of Housing and Urban Affairs, Government of India. National Transit Oriented Development (TOD) Policy. Available online: https://mohua.gov.in/upload/whatsnew/59a4070e85256Transit_Oriented_Developoment_Policy.pdf (accessed on 31 May 2024).
- Government of Maharastra. Draft Maharashtra Sustainable Urban Transport Policy; Government of Maharastra: Mumbai, India, 2017.
- Town and Country Planning Organisation, Ministry of Urban Development, Government of India. Urban and Regional Development Plans Formulation and Implementation (URDPFI) Guidelines; Government of India: New Delhi, India, 2015; Volume I.
- Smart City Mission, Ministry of Housing and Urban Affairs, Government of India; The Institute for Transportation and Development Policy (ITDP). Complete Street: Evaluation Metric; Ministry of Urban Affairs and ITDP: New Delhi, India, 2019.
- Jeon, C.M.; Amekudzi, A.A.; Guensler, R.L. Sustainability assessment at the transportation planning level: Performance measures and indexes. Transp. Policy 2013, 25, 10–21. [Google Scholar] [CrossRef]
- Illahi, U.; Mir, M.S. Sustainable Transportation Attainment Index: Multivariate analysis of indicators with an application to selected states and National Capital Territory (NCT) of India. Environ. Dev. Sustain. 2020, 23, 3578–3622. [Google Scholar] [CrossRef]
- Kitamura, R.; Mokhtarian, P.L.; Laidet, L. A micro-analysis of land use and travel in five neighborhoods in the San Francisco Bay Area. Transportation 1997, 24, 125–158. [Google Scholar]
- Crane, R.; Crepeau, R. Does Neighborhood Design Influence Travel? A Behavioral Analysis of Travel Diary and GIS Data. Transp. Res. Part D Transp. Environ. 1998, 3, 225–238. [Google Scholar] [CrossRef]
- Srinivasan, S. Linking Land Use and Transportation: Measuring the Impact of Neighborhood-Scale Spatial Patterns on Travel Behavior; Massachusetts Institute of Technology: Cambridge, UK, 2000. [Google Scholar]
- Karjalainen, L.E.; Juhola, S. Urban transportation sustainability assessments: A systematic review of literature. Transp. Rev. 2021, 41, 659–684. [Google Scholar] [CrossRef]
- Ramani, T.; Zietsman, J.; Eisele, W.; Rosa, D.; Spillane, D.; Bochner, B. Developing Sustainable Transportation Performance Measure for TXDoT’S Strategic Plan Technical Report; Texas Transportation Institute: College Station, TX, USA, 2009; pp. 146–154. [Google Scholar]
- Jain, D.; Tiwari, G. Sustainable mobility indicators for Indian cities: Selection methodology and application. Ecol. Indic. 2017, 79, 310–322. [Google Scholar] [CrossRef]
- Johnston, R.A. Indicators for Sustainable Transportation Planning. Transp. Res. Rec. J. Transp. Res. Board 2008, 2067, 146–154. [Google Scholar] [CrossRef]
- Gilbert, R.; Irwin, N.; Hollingworth, B.; Blais, P. Sustainable Transportation Performance Indicators (STPI); National Center for Sustainable Transportation: Washington, DC, USA, 2002. [Google Scholar]
- Maoh, H.; Kanaroglou, P. A tool for evaluating urban sustainability via integrated transportation and land use simulation models. Environ. Urbain Urban Environ. 2009, 3, 28–46. [Google Scholar]
- Mongkut, P.; Nattapon, S. Evaluation of Alternatives in Transportation Planning Using Multi Stakeholders Multi-Objectives AHP Modeling. In Proceedings of the Eastern Asia Society for Transportation Studies, 5th Conference in Fukuoka, Fukuoka, Japan, 29 October–1 November 2003; Volume 4, pp. 1613–1628. Available online: https://www.researchgate.net/profile/Mongkut-Piantanakulchai/publication/228426663_Evaluation_of_alternatives_in_transportation_planning_using_multi-stakeholders_multi-objectives_AHP_modeling/links/00b495170ef3578dff000000/Evaluation-of-alternatives-in-transportation-planning-using-multi-stakeholders-multi-objectives-AHP-modeling.pdf (accessed on 13 August 2024).
- Lautso, K.; Toivanen, S. SPARTACUS System for Analyzing Urban Sustainability. Transp. Res. Rec. 1999, 1670, 35–46. [Google Scholar]
- Marti, C.M.; Bertolini, L.; Weidmann, U. Measuring public transport and built environment integration at the neighborhood scale: Towards a quantitative assessment methodology. In Proceedings of the WSTLUR 2017, Brisbane, Australia, 3–6 July 2017. [Google Scholar]
- Organization of Economic Co-operation and Development (OECD). Indicators for the Integration of Environmental Concerns into Transport Policies; OECD: Paris, France, 1999.
- Geurs, K.T.; van Wee, B. Accessibility evaluation of land-use and transport strategies: Review and research directions. J. Transp. Geogr. 2004, 12, 127–140. [Google Scholar] [CrossRef]
- Hansen, W.G. How Accessibility Shapes Land Use. J. Am. Inst. Plan. 1959, 25, 73–76. [Google Scholar] [CrossRef]
- Sarika Bahadure, T.K. Measuring Urban Accessibility Using Complete Spatial Randomness. In Proceedings of the 7th Annual Internation Conference on Architecture and Civil Engineering (ACE 2019), Singapore, 27–28 May 2019. [Google Scholar]
- Litman, T. Evaluating Accessibility for Transport Planning Measuring People’s Ability to Reach Desired Services and Activities; Victoria Transport Policy Institute: Victoria, BC, Canada, 2023. [Google Scholar]
- Geurs, K.; van Eck, J.R. Accessibility Measures: Review and Applications: Evaluation of Accessibility Impacts of Land-Use Transport Scenarios, and Related Social and Economic Impacts; Urban Research Centre, Utrecht University: Utrecht, The Netherlands, 2001. [Google Scholar]
- Susan Handy, K.C. Evaluating Neighborhood Accessibility: Possibilities and Practicalities. J. Transp. Stat. 2001, 4, 67–78. [Google Scholar]
- Järv, O.; Tenkanen, H.; Salonen, M.; Ahas, R.; Toivonen, T. Dynamic cities: Location-based accessibility modelling as a function of time. Appl. Geogr. 2018, 95, 101–110. [Google Scholar] [CrossRef]
- Wang, S.; Wang, M.; Liu, Y. Access to urban parks: Comparing spatial accessibility measures using three GIS-based approaches. Comput. Environ. Urban Syst. 2021, 90, 101713. [Google Scholar] [CrossRef]
- Adhvaryu, B.; Mudhol, S.S. Visualising public transport accessibility to inform urban planning policy in Hubli-Dharwad, India. GeoJournal 2022, 87, 485–509. [Google Scholar] [CrossRef]
- Handy, S.L.; Niemeier, D.A. Measuring accessibility: An exploration of issues and alternatives. Environ. Plan. A Econ. Space 1997, 29, 1175–1194. [Google Scholar]
- Kapur, A.S.; Kumar, P.; Areendran, G.; Raj, K.; Rinos, M.H.M.; Suresh, V.M. Feasibility analysis of Kalyan-Dombivli smart city using Analytical Hierarchy Process (AHP). In Proceedings of the 9th International Symposium, “Promoting Multidisciplinary Academic Research and Innovation”, Oluvil, Sri Lanka, 27–28 November 2019. [Google Scholar]
- KRVIA; B.I.U.C.B.a. KRVIA Local Dissemination Workshop, 13–17 September 2017: Local Area Planning Kalyan Dombivli. Available online: https://mdl.donau-uni.ac.at/binucom/pluginfile.php/766/mod_page/content/6/170916_parmar.pdf (accessed on 22 June 2024).
- Garau, C.; Pavan, V. Evaluating Urban Quality: Indicators and Assessment Tools for Smart Sustainable Cities. Sustainability 2018, 10, 575. [Google Scholar] [CrossRef]
- Niemeijer, D.; de Groot, R.S. A conceptual framework for selecting environmental indicator sets. Ecol. Indic. 2008, 8, 14–25. [Google Scholar] [CrossRef]
- Organization of Economic Co-operation and Development (OECD). OECD Environmental Indicators: Towards Sustainable Development; OECD Publications: Paris, France, 2001.
- Tiwari, G.; Jain, D. Accessibility and safety indicators for all road users: Case study Delhi BRT. J. Transp. Geogr. 2012, 22, 87–95. [Google Scholar] [CrossRef]
- Meyar-Naimi, H.; Vaez-Zadeh, S. Sustainable development based energy policy making frameworks, a critical review. Energy Policy 2012, 43, 351–361. [Google Scholar] [CrossRef]
- Yigitcanlar, T.; Sipe, N.; Evans, R.; Pitot, M. A GIS-based land use and public transport accessibility indexing model. Aust. Plan. 2007, 44, 30–37. [Google Scholar] [CrossRef]
- Miller, P.; de Barros, A.G.; Kattan, L.; Wirasinghe, S.C. Analyzing the sustainability performance of public transit. Transp. Res. Part D Transp. Environ. 2016, 44, 177–198. [Google Scholar] [CrossRef]
- Witten, K.; Hiscock, R.; Pearce, J.; Blakely, T. Neighbourhood access to open spaces and the physical activity of residents: A national study. Prev. Med. 2008, 47, 299–303. [Google Scholar] [CrossRef]
- Badland, H.; Donovan, P.; Suzanne, M.; Melody, O.; Chaudhury, M.; Karen, W. Assessing neighbourhood destination access for children: Development of the NDAI-C audit tool. Environ. Plan. B Plan. Des. 2015, 42, 1148–1160. [Google Scholar] [CrossRef]
- Khavarian-Garmsir, A.R.; Sharifi, A.; Hajian Hossein Abadi, M.; Moradi, Z. From Garden City to 15-Minute City: A Historical Perspective and Critical Assessment. Land 2023, 12, 512. [Google Scholar] [CrossRef]
- Caselli, B.; Carra, M.; Rossetti, S.; Zazzi, M. Exploring the 15-minute neighbourhoods. An evaluation based on the walkability performance to public facilities. Transp. Res. Procedia 2022, 60, 346–353. [Google Scholar] [CrossRef]
- QGIS Development Team. QGIS Geographic Information System; QGIS Association, 2021; Available online: http://qgis.org (accessed on 13 August 2024).
- Murtagh, E.M.; Mair, J.L.; Aguiar, E.; Tudor-Locke, C.; Murphy, M.H. Outdoor Walking Speeds of Apparently Healthy Adults: A Systematic Review and Meta-analysis. Sports Med. 2021, 51, 125–141. [Google Scholar] [CrossRef] [PubMed]
- Pyrialakou, V.D.; Gkritza, K.; Fricker, J.D. Accessibility, mobility, and realized travel behavior: Assessing transport disadvantage from a policy perspective. J. Transp. Geogr. 2016, 51, 252–269. [Google Scholar] [CrossRef]
- Tresidder, M. Using GIS to Measure Connectivity: An Exploration of Issues; School of Urban Studies and Planning, Portland State University: Portland, OR, USA, 2005. [Google Scholar]
- Knight, P.L.; Marshall, W.E. The metrics of street network connectivity: Their inconsistencies. J. Urban. Int. Res. Placemaking Urban Sustain. 2014, 8, 241–259. [Google Scholar] [CrossRef]
- John Wagai, R.N. The Street Connectivity Index (SCI) of Six Municipalities in Jalisco State, Mexico; United Nations Human Settlements Programme (UN-Habitat): Nairobi, Kenya, 2016. [Google Scholar]
- Salat, S. Implementation Process, Integrated Guidelines for Sustainable Neighbourhood Design; United Nations Environment Programme: Nairobi, Kenya, 2021. [Google Scholar]
- Transport and Safety: System, Approaches and Implementation; Springer Nature: Singapore, 2021.
- Koti Marg, K.; Puram, R. Manual for Planning and Development of Urban Roads and Streets; Indian Roads Congress: New Delhi, India, 2018. [Google Scholar]
- Zhang, L.; Menendez, M. Modeling and Evaluating the Impact of City Block Size on Traffic Performance. J. Urban Plan. Dev. 2020, 146, 04020021. [Google Scholar] [CrossRef]
- Ministry of Urban Development, Government of India; Center of Excellence in Urban Transport, CEPT University. Service Level Benchmark in Urban Transport for Indian Cities; Ministry of Urban Development, Government of India and Center of Excellence in Urban Transport, CEPT University: Ahmedabad, India, 2013.
- Office of Chief Labour Commissioner (C), Ministry of Labour and Employment, Government of India. VDA Order 2024: No. 1/7(5)/2024-LS-II; Office of Chief Labour Commissioner (C), Ministry of Labour and Employment, Government of India: New Delhi, India, 2024. Available online: http://clc.gov.in/clc/node/745 (accessed on 12 June 2024).
- Pareto, A. Normalization (of an Indicator) in Composite Indicator Construction. In Encyclopedia of Quality of Life and Well-Being Research; Springer: Dordrecht, The Netherlands, 2021; pp. 1–2. [Google Scholar]
- Greco, S.; Ishizaka, A.; Tasiou, M.; Torrisi, G. On the Methodological Framework of Composite Indices: A Review of the Issues of Weighting, Aggregation, and Robustness. Soc. Indic. Res. 2018, 141, 61–94. [Google Scholar] [CrossRef]
- Chatziioannou, I.; Nikitas, A.; Tzouras, P.G.; Bakogiannis, E.; Alvarez-Icaza, L.; Chias-Becerril, L.; Karolemeas, C.; Tsigdinos, S.; Wallgren, P.; Rexfelt, O. Ranking sustainable urban mobility indicators and their matching transport policies to support liveable city Futures: A MICMAC approach. Transp. Res. Interdiscip. Perspect. 2023, 18, 100788. [Google Scholar] [CrossRef]
- Holtz, Y. Introduction to Hierarchical Edge Bunding with R. Available online: https://r-graph-gallery.com/309-intro-to-hierarchical-edge-bundling.html (accessed on 10 June 2024).

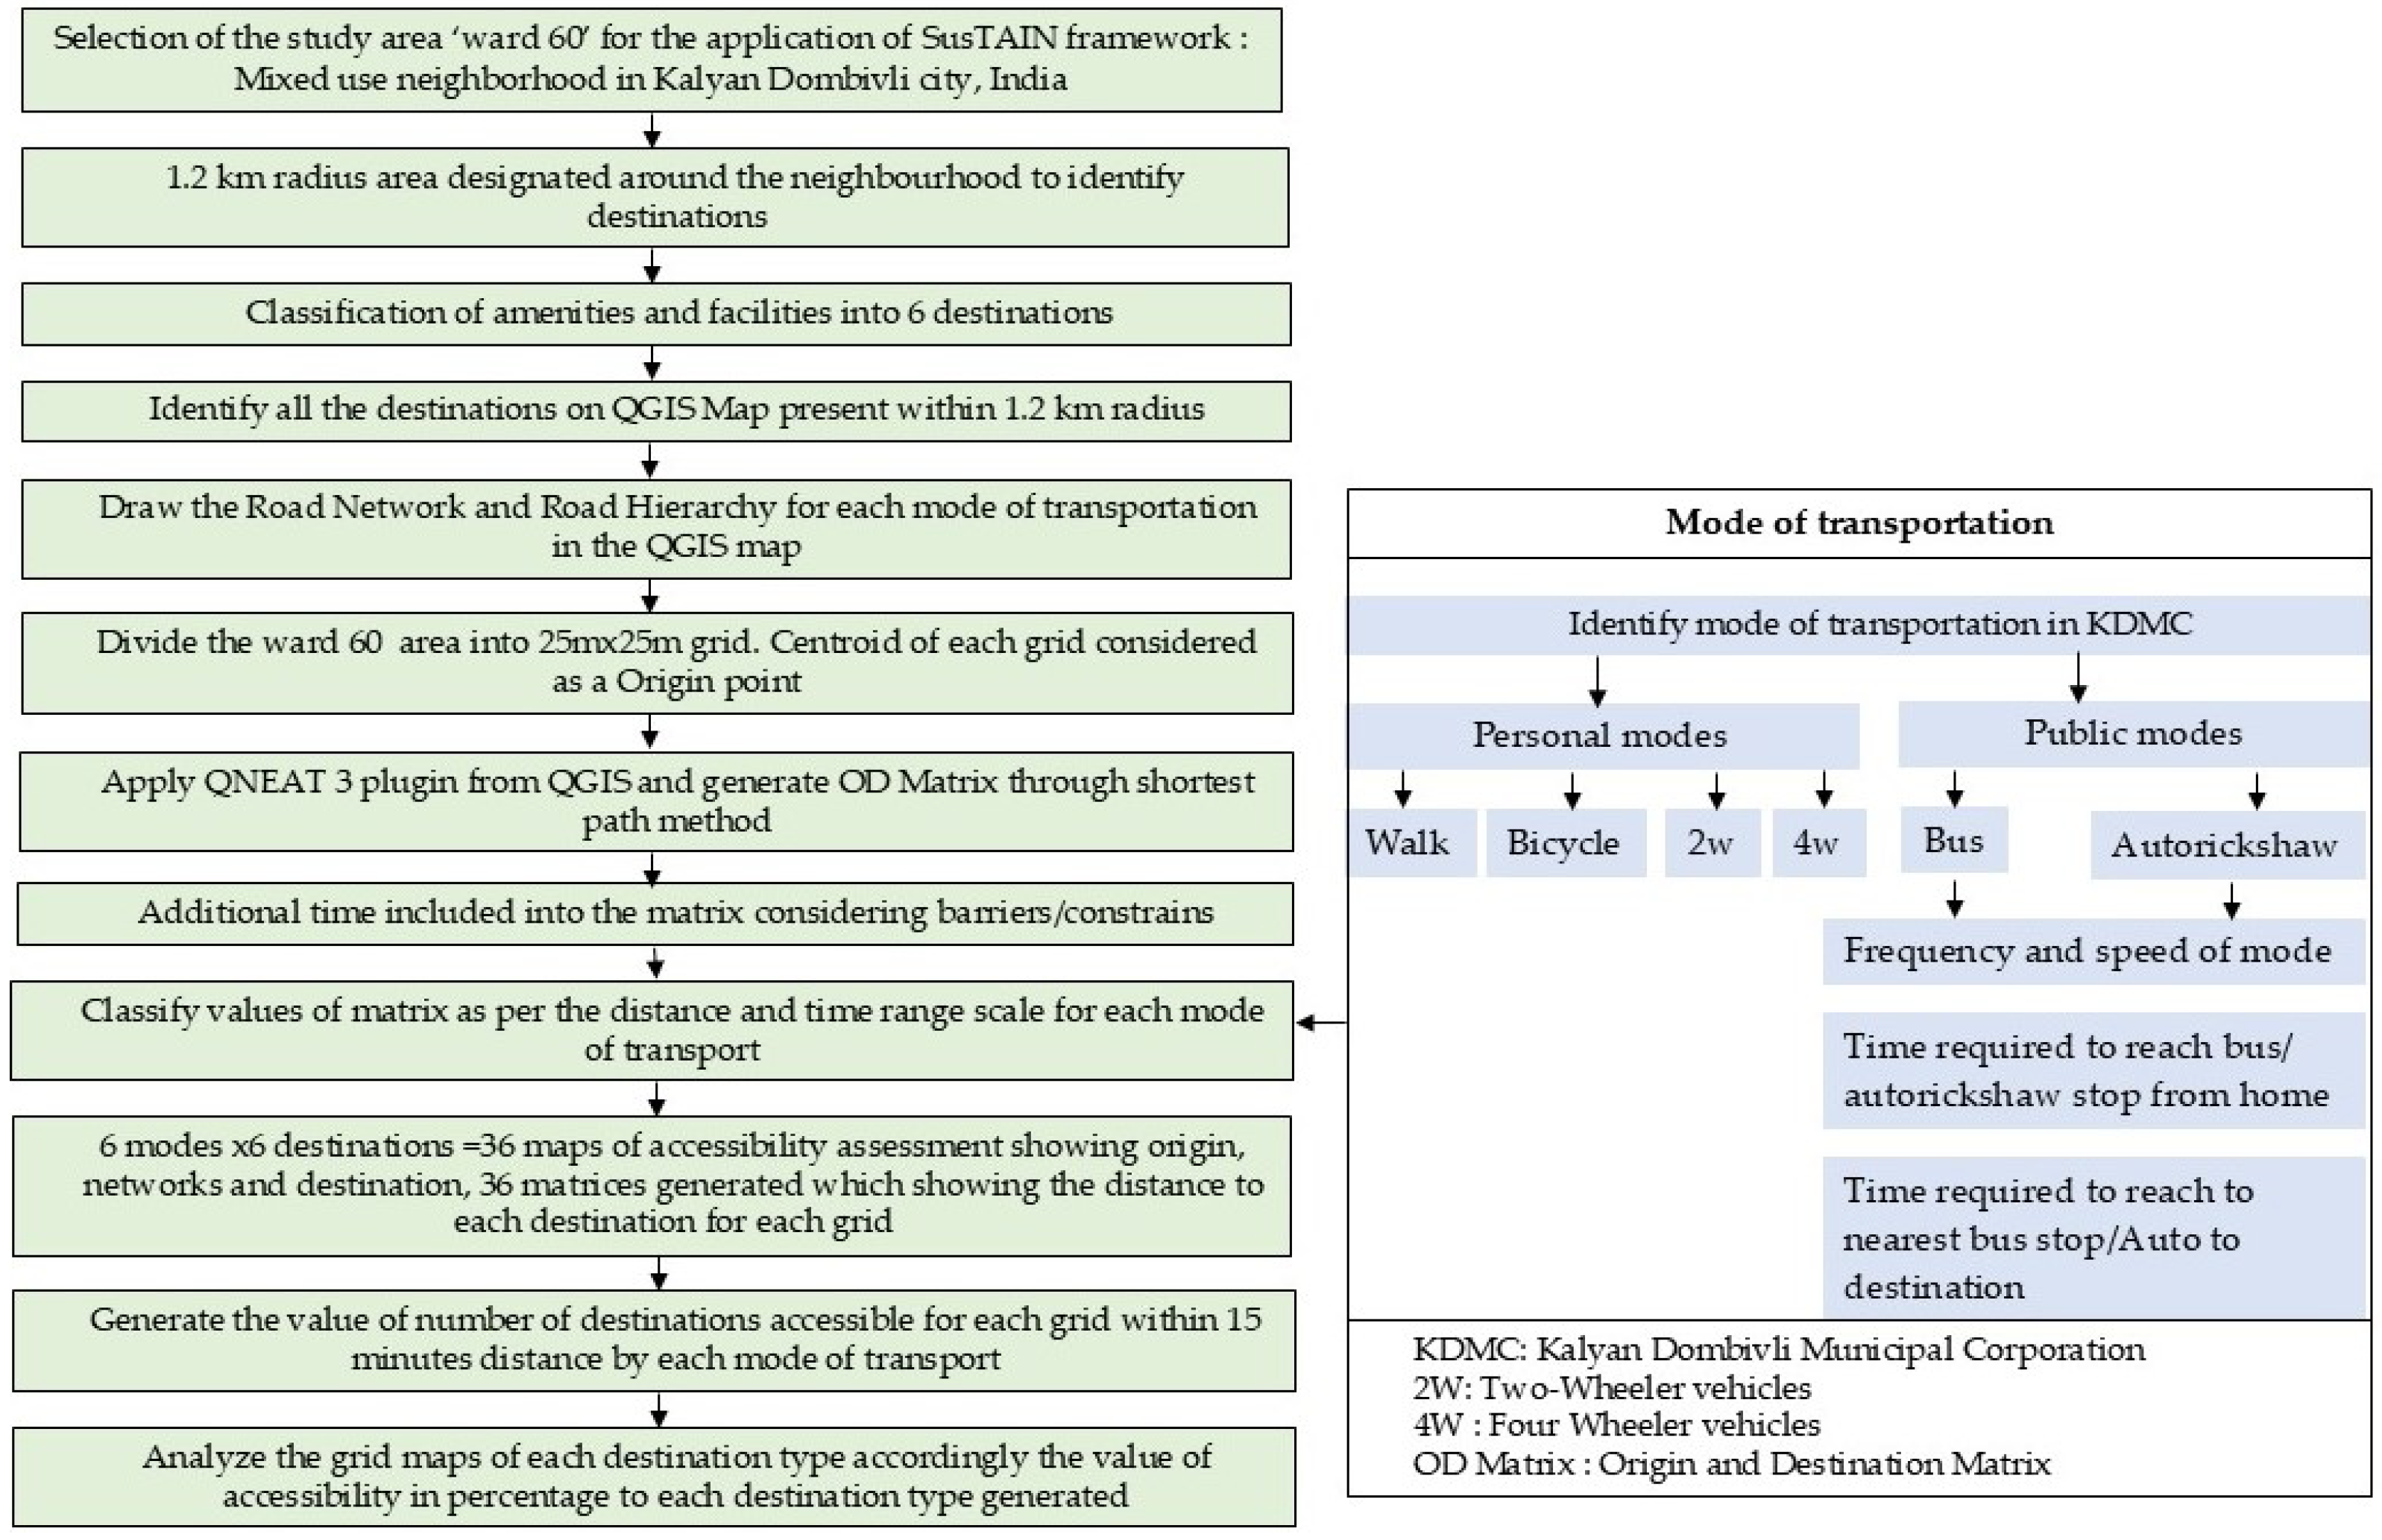


Disclaimer/Publisher’s Note: The statements, opinions and data contained in all publications are solely those of the individual author(s) and contributor(s) and not of MDPI and/or the editor(s). MDPI and/or the editor(s) disclaim responsibility for any injury to people or property resulting from any ideas, methods, instructions or products referred to in the content. |
© 2024 by the authors. Licensee MDPI, Basel, Switzerland. This article is an open access article distributed under the terms and conditions of the Creative Commons Attribution (CC BY) license (https://creativecommons.org/licenses/by/4.0/).