


Investigating the Dynamic Change and Driving Force of Vegetation Carbon Sink in Taihang Mountain, China


Abstract
1. Introduction
2. Materials and Methods
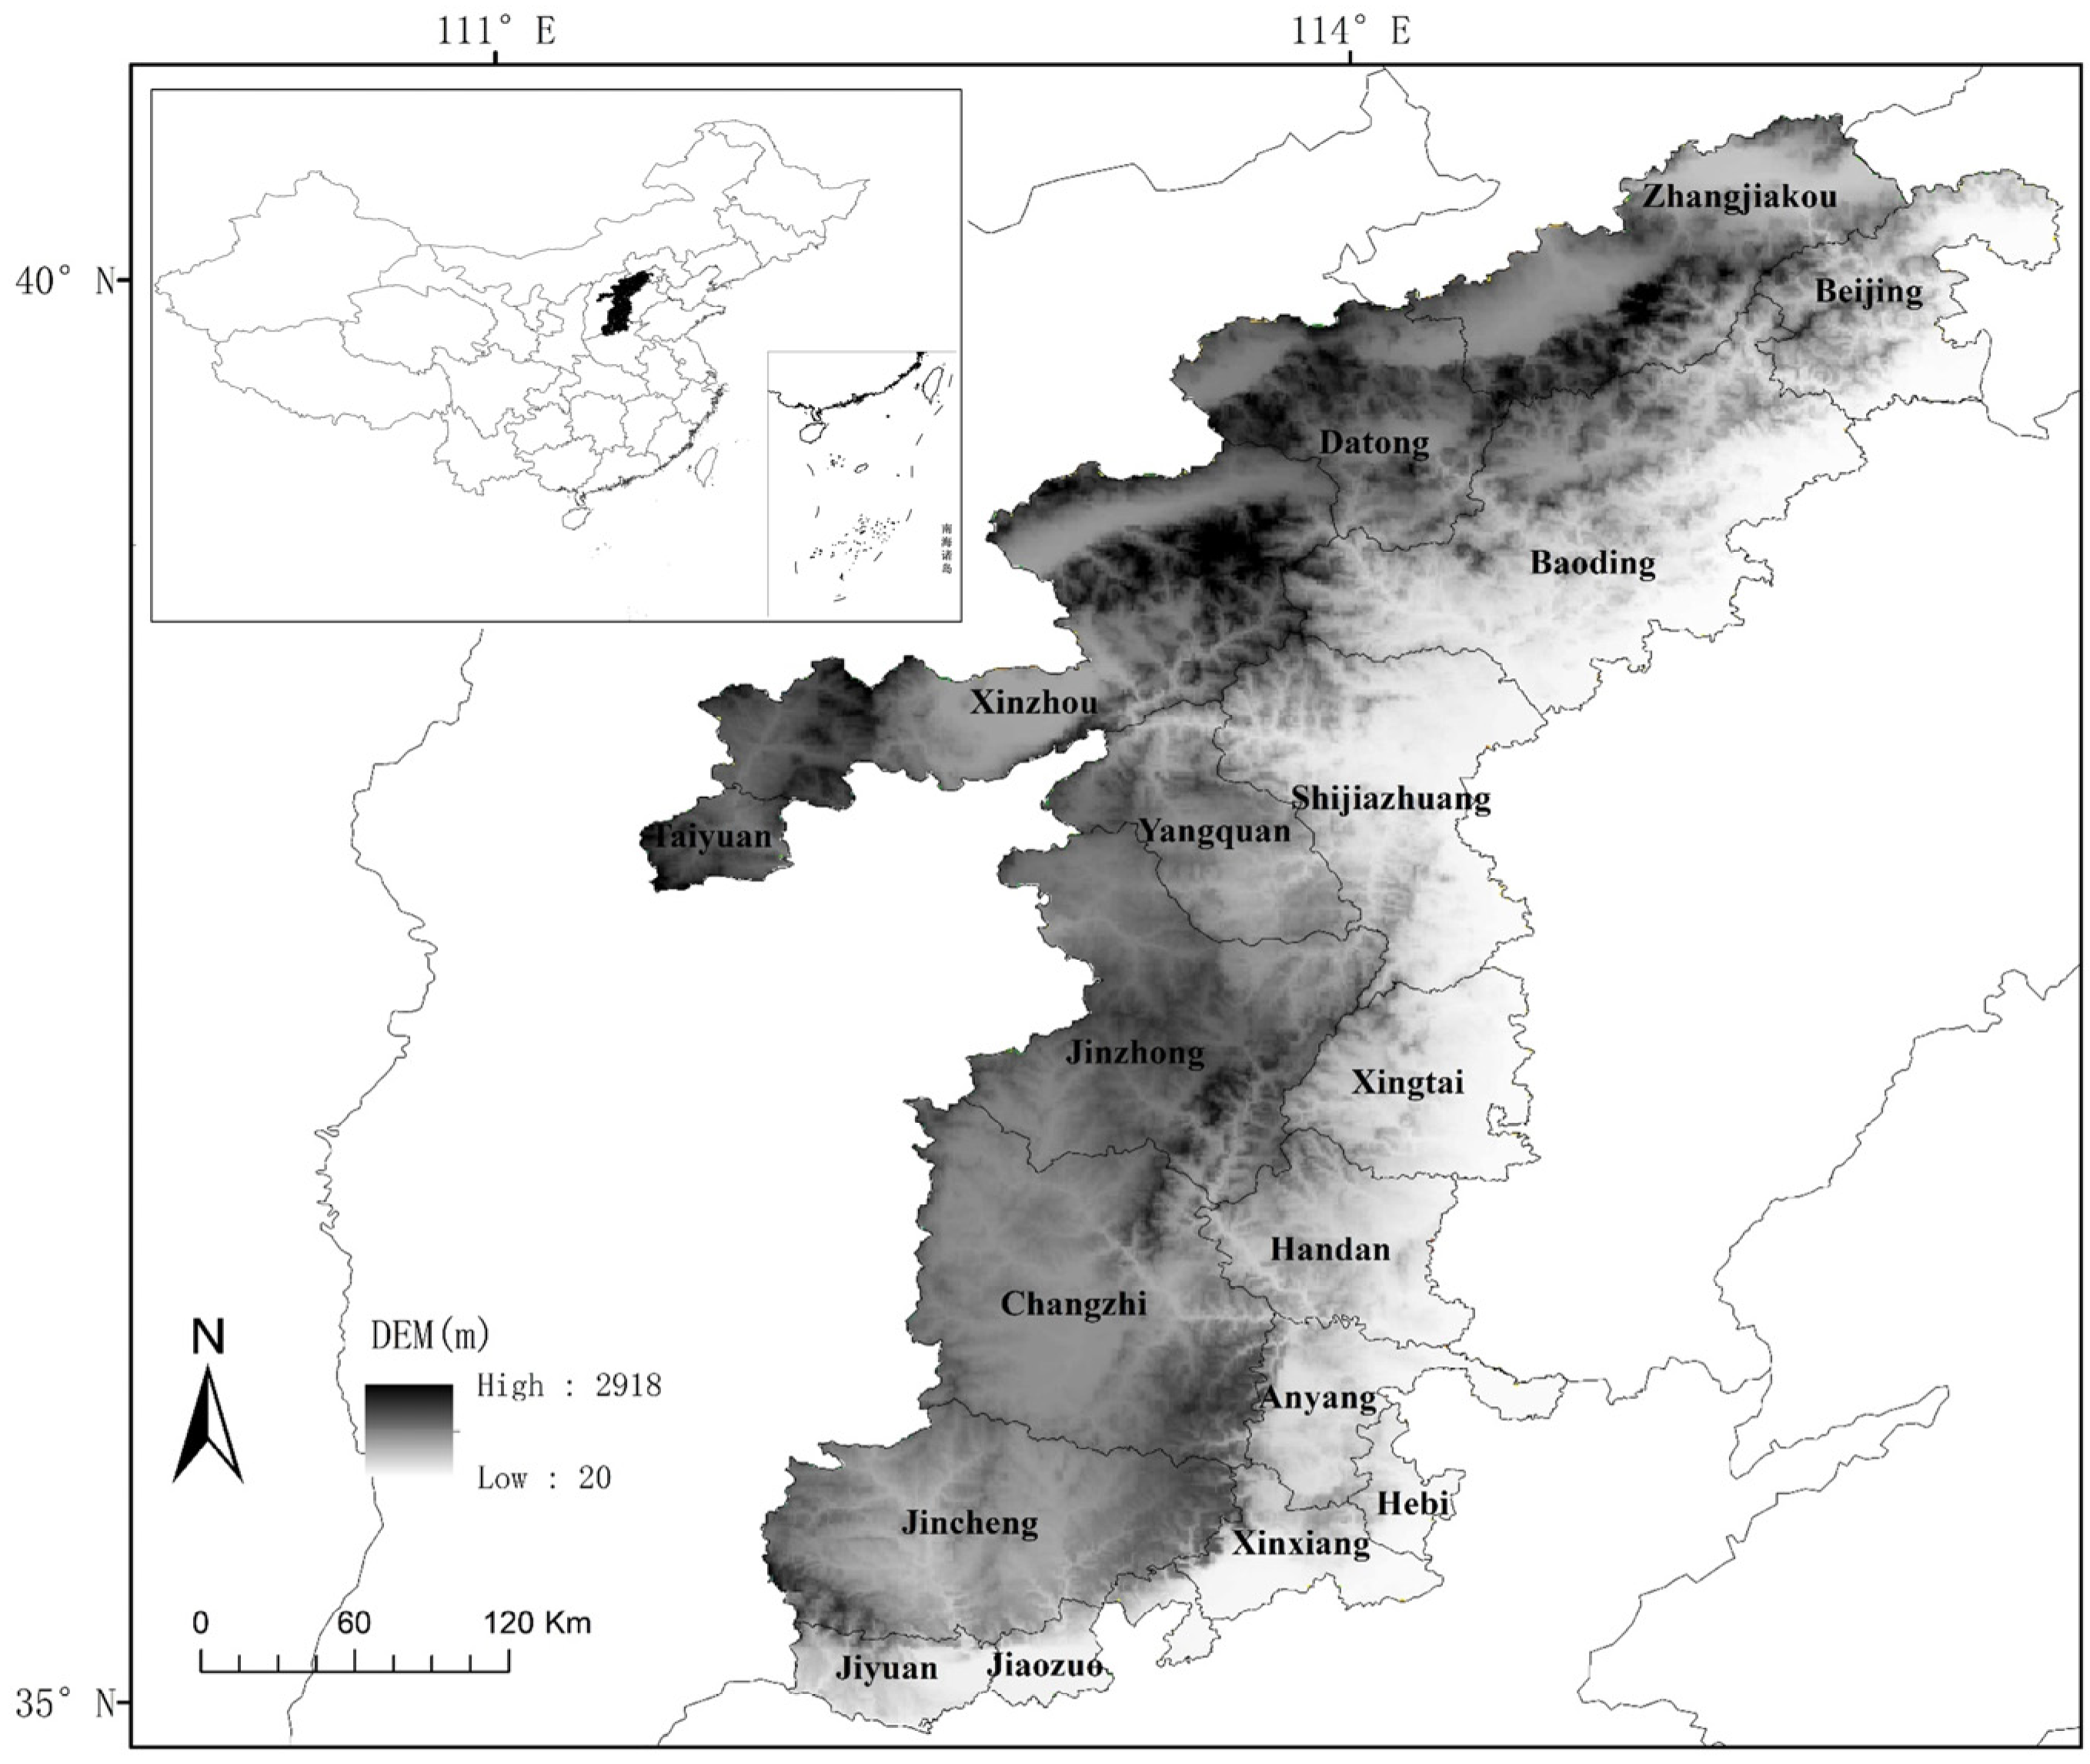
2.1. Study Area
2.2. Data Sources
2.3. Model and Method
2.3.1. NEP Estimation Model
2.3.2. Analysis of Inter-Annual Trends
2.3.3. Optimal Parameter-Based Geographic Detector
2.3.4. Multiple Regression Residual Analysis
2.4. Selection of Impact Factors
3. Results
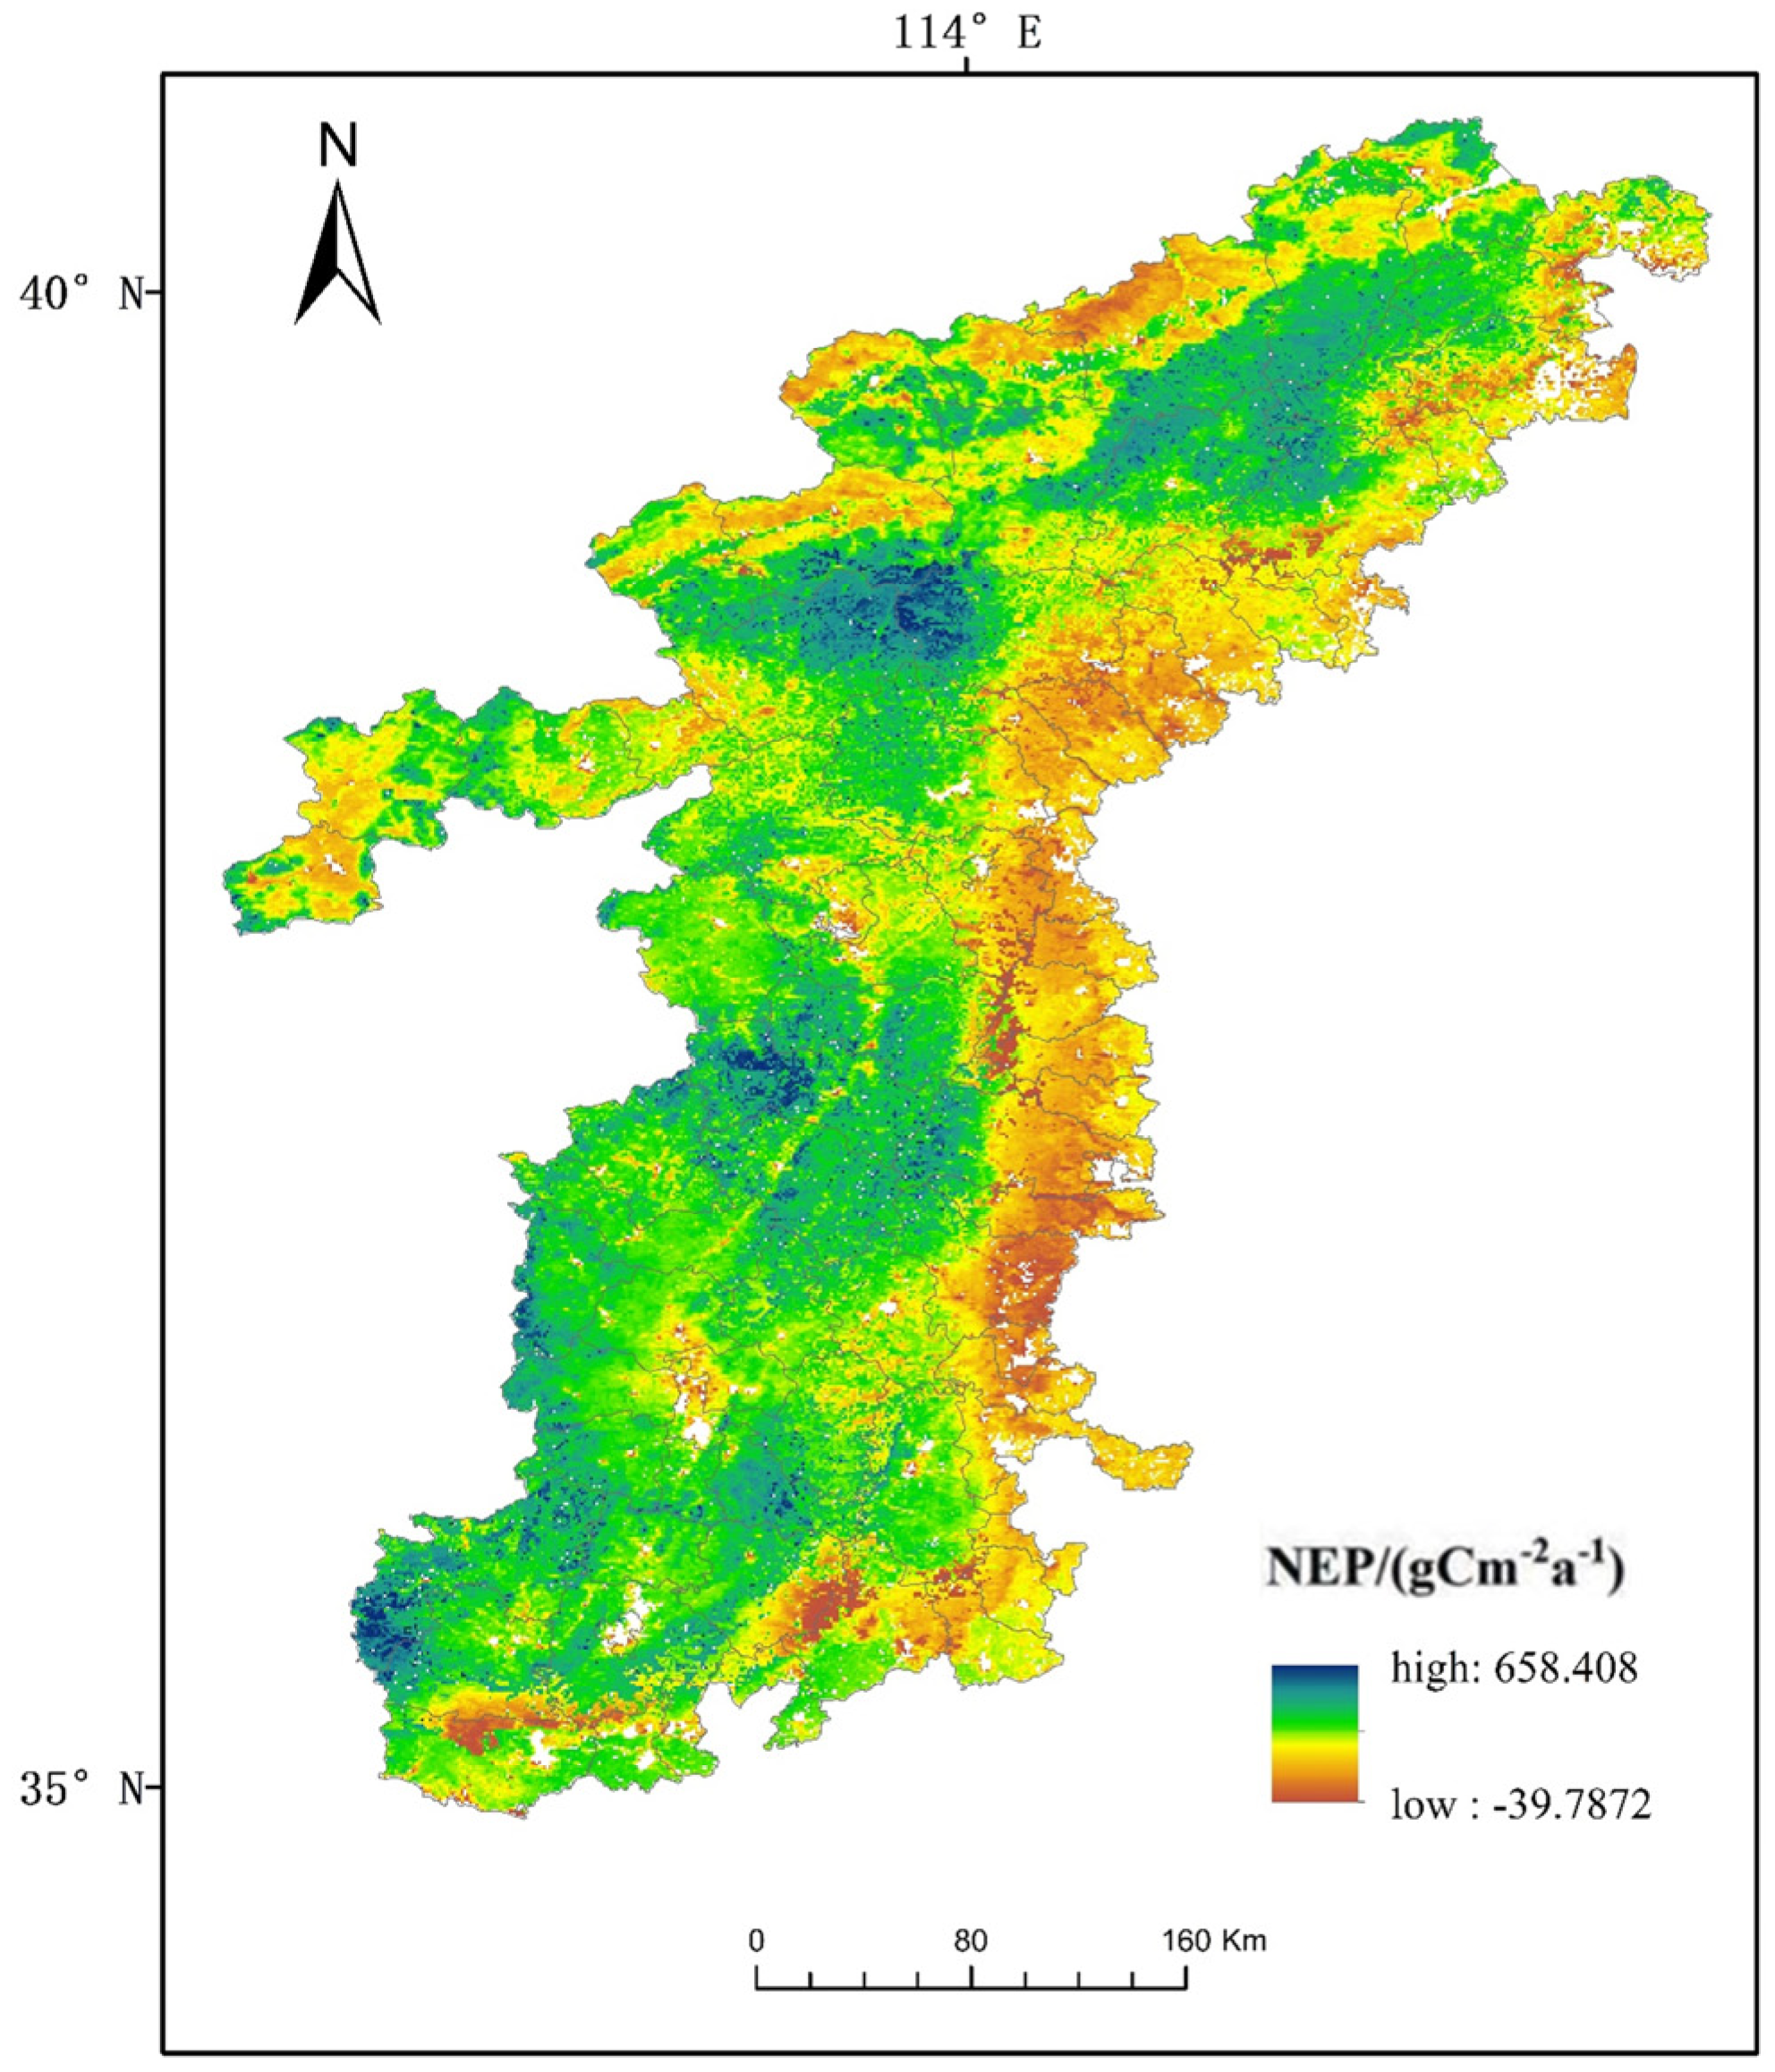
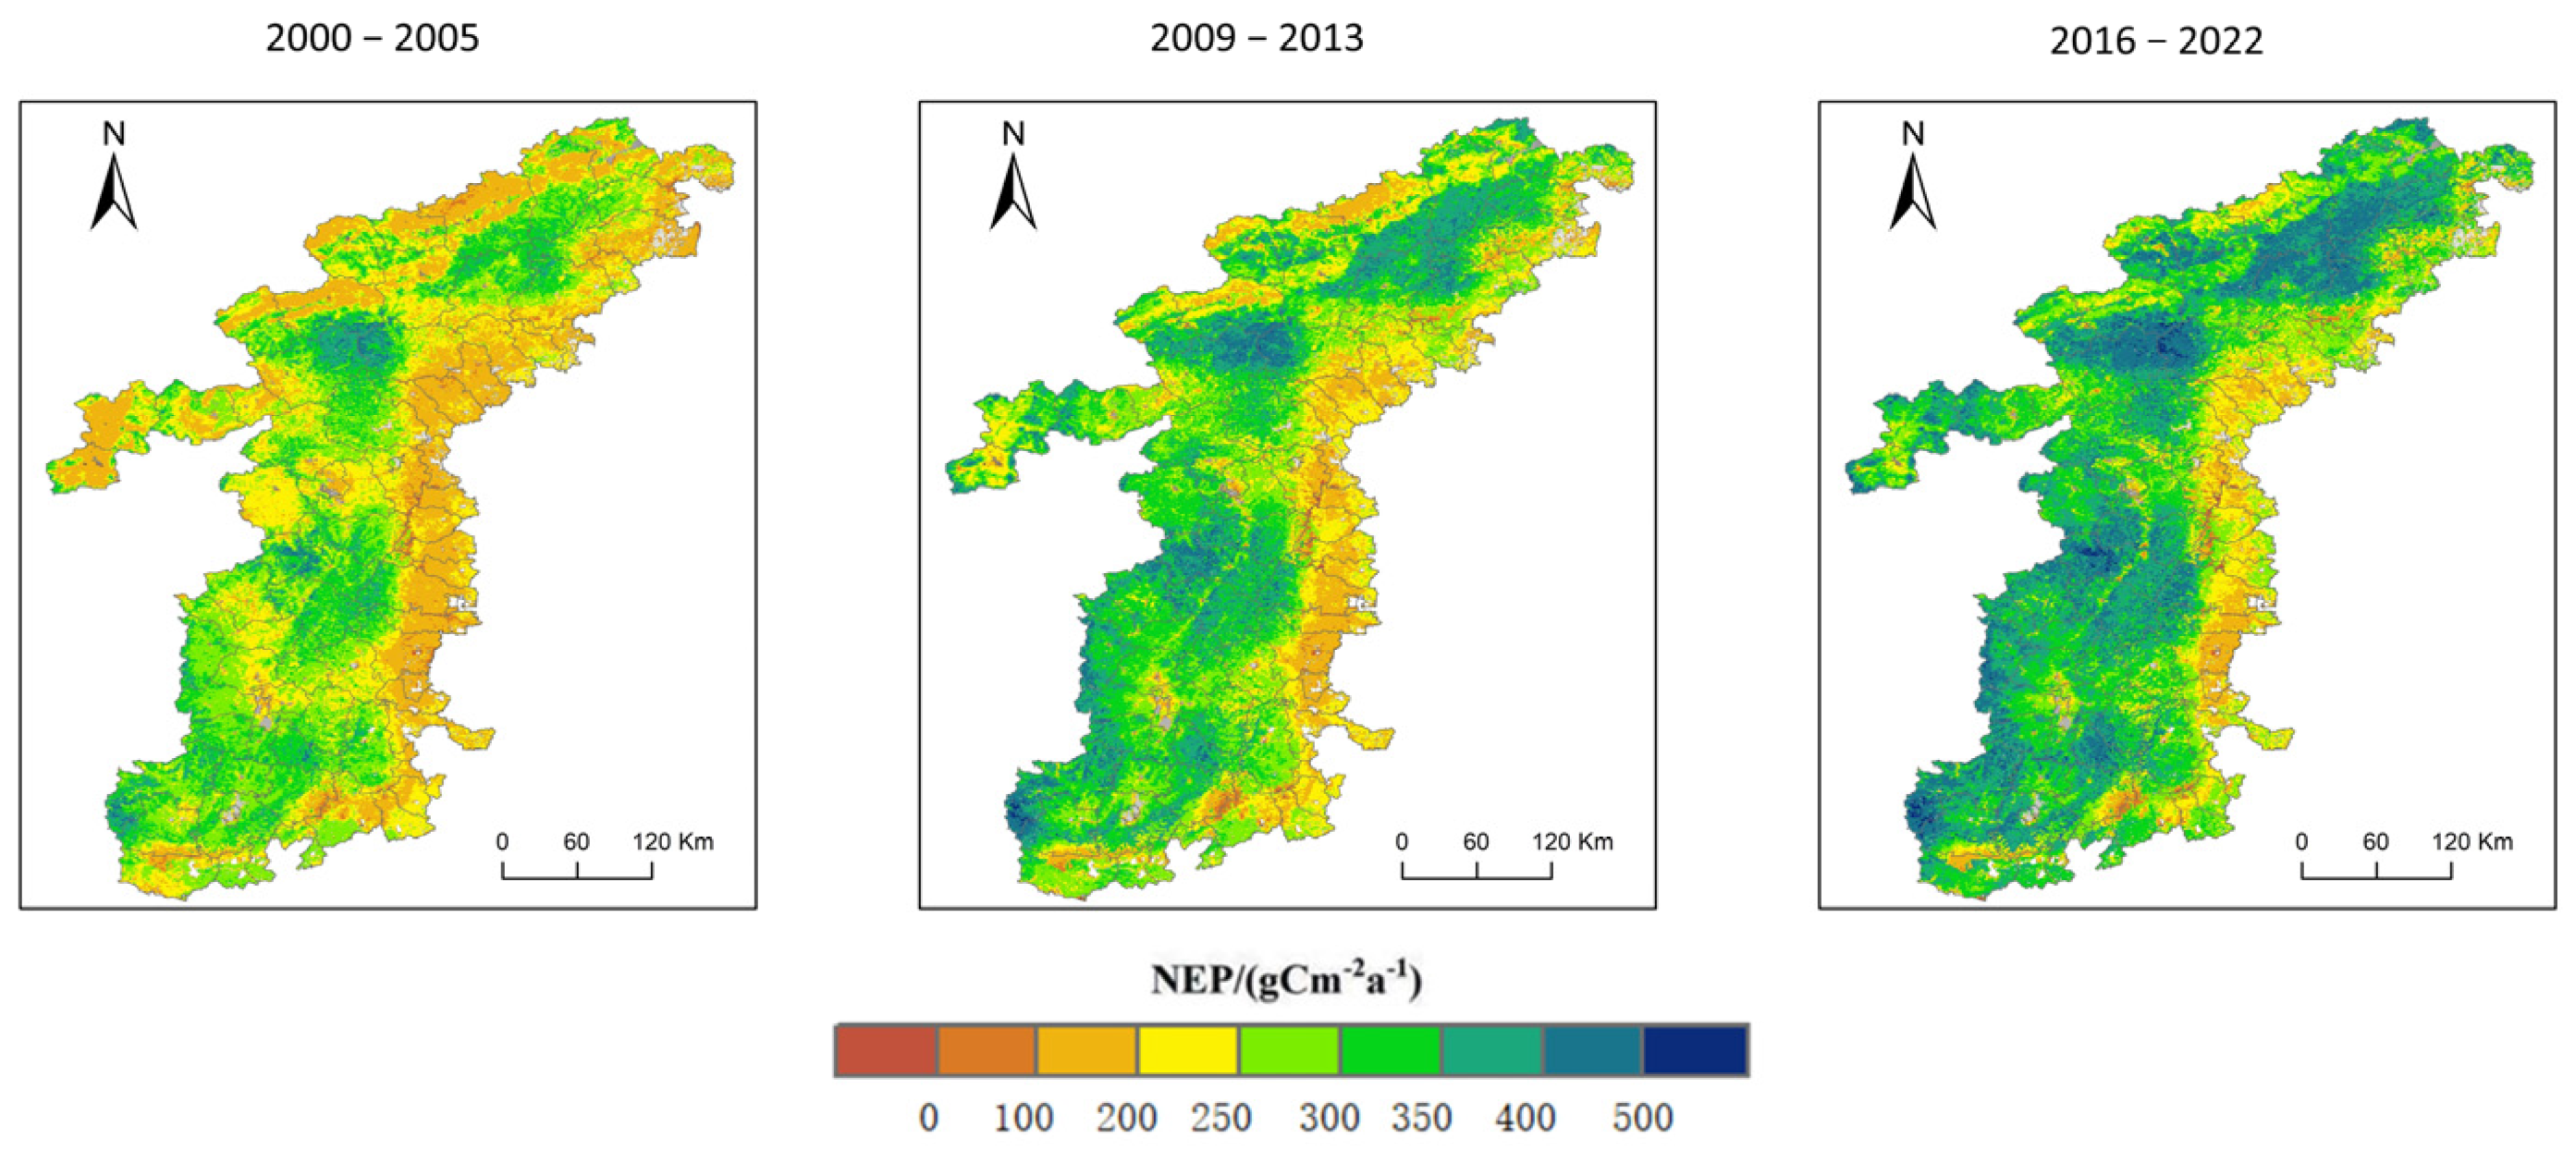
3.1. Spatial and Temporal Characteristics of NEP
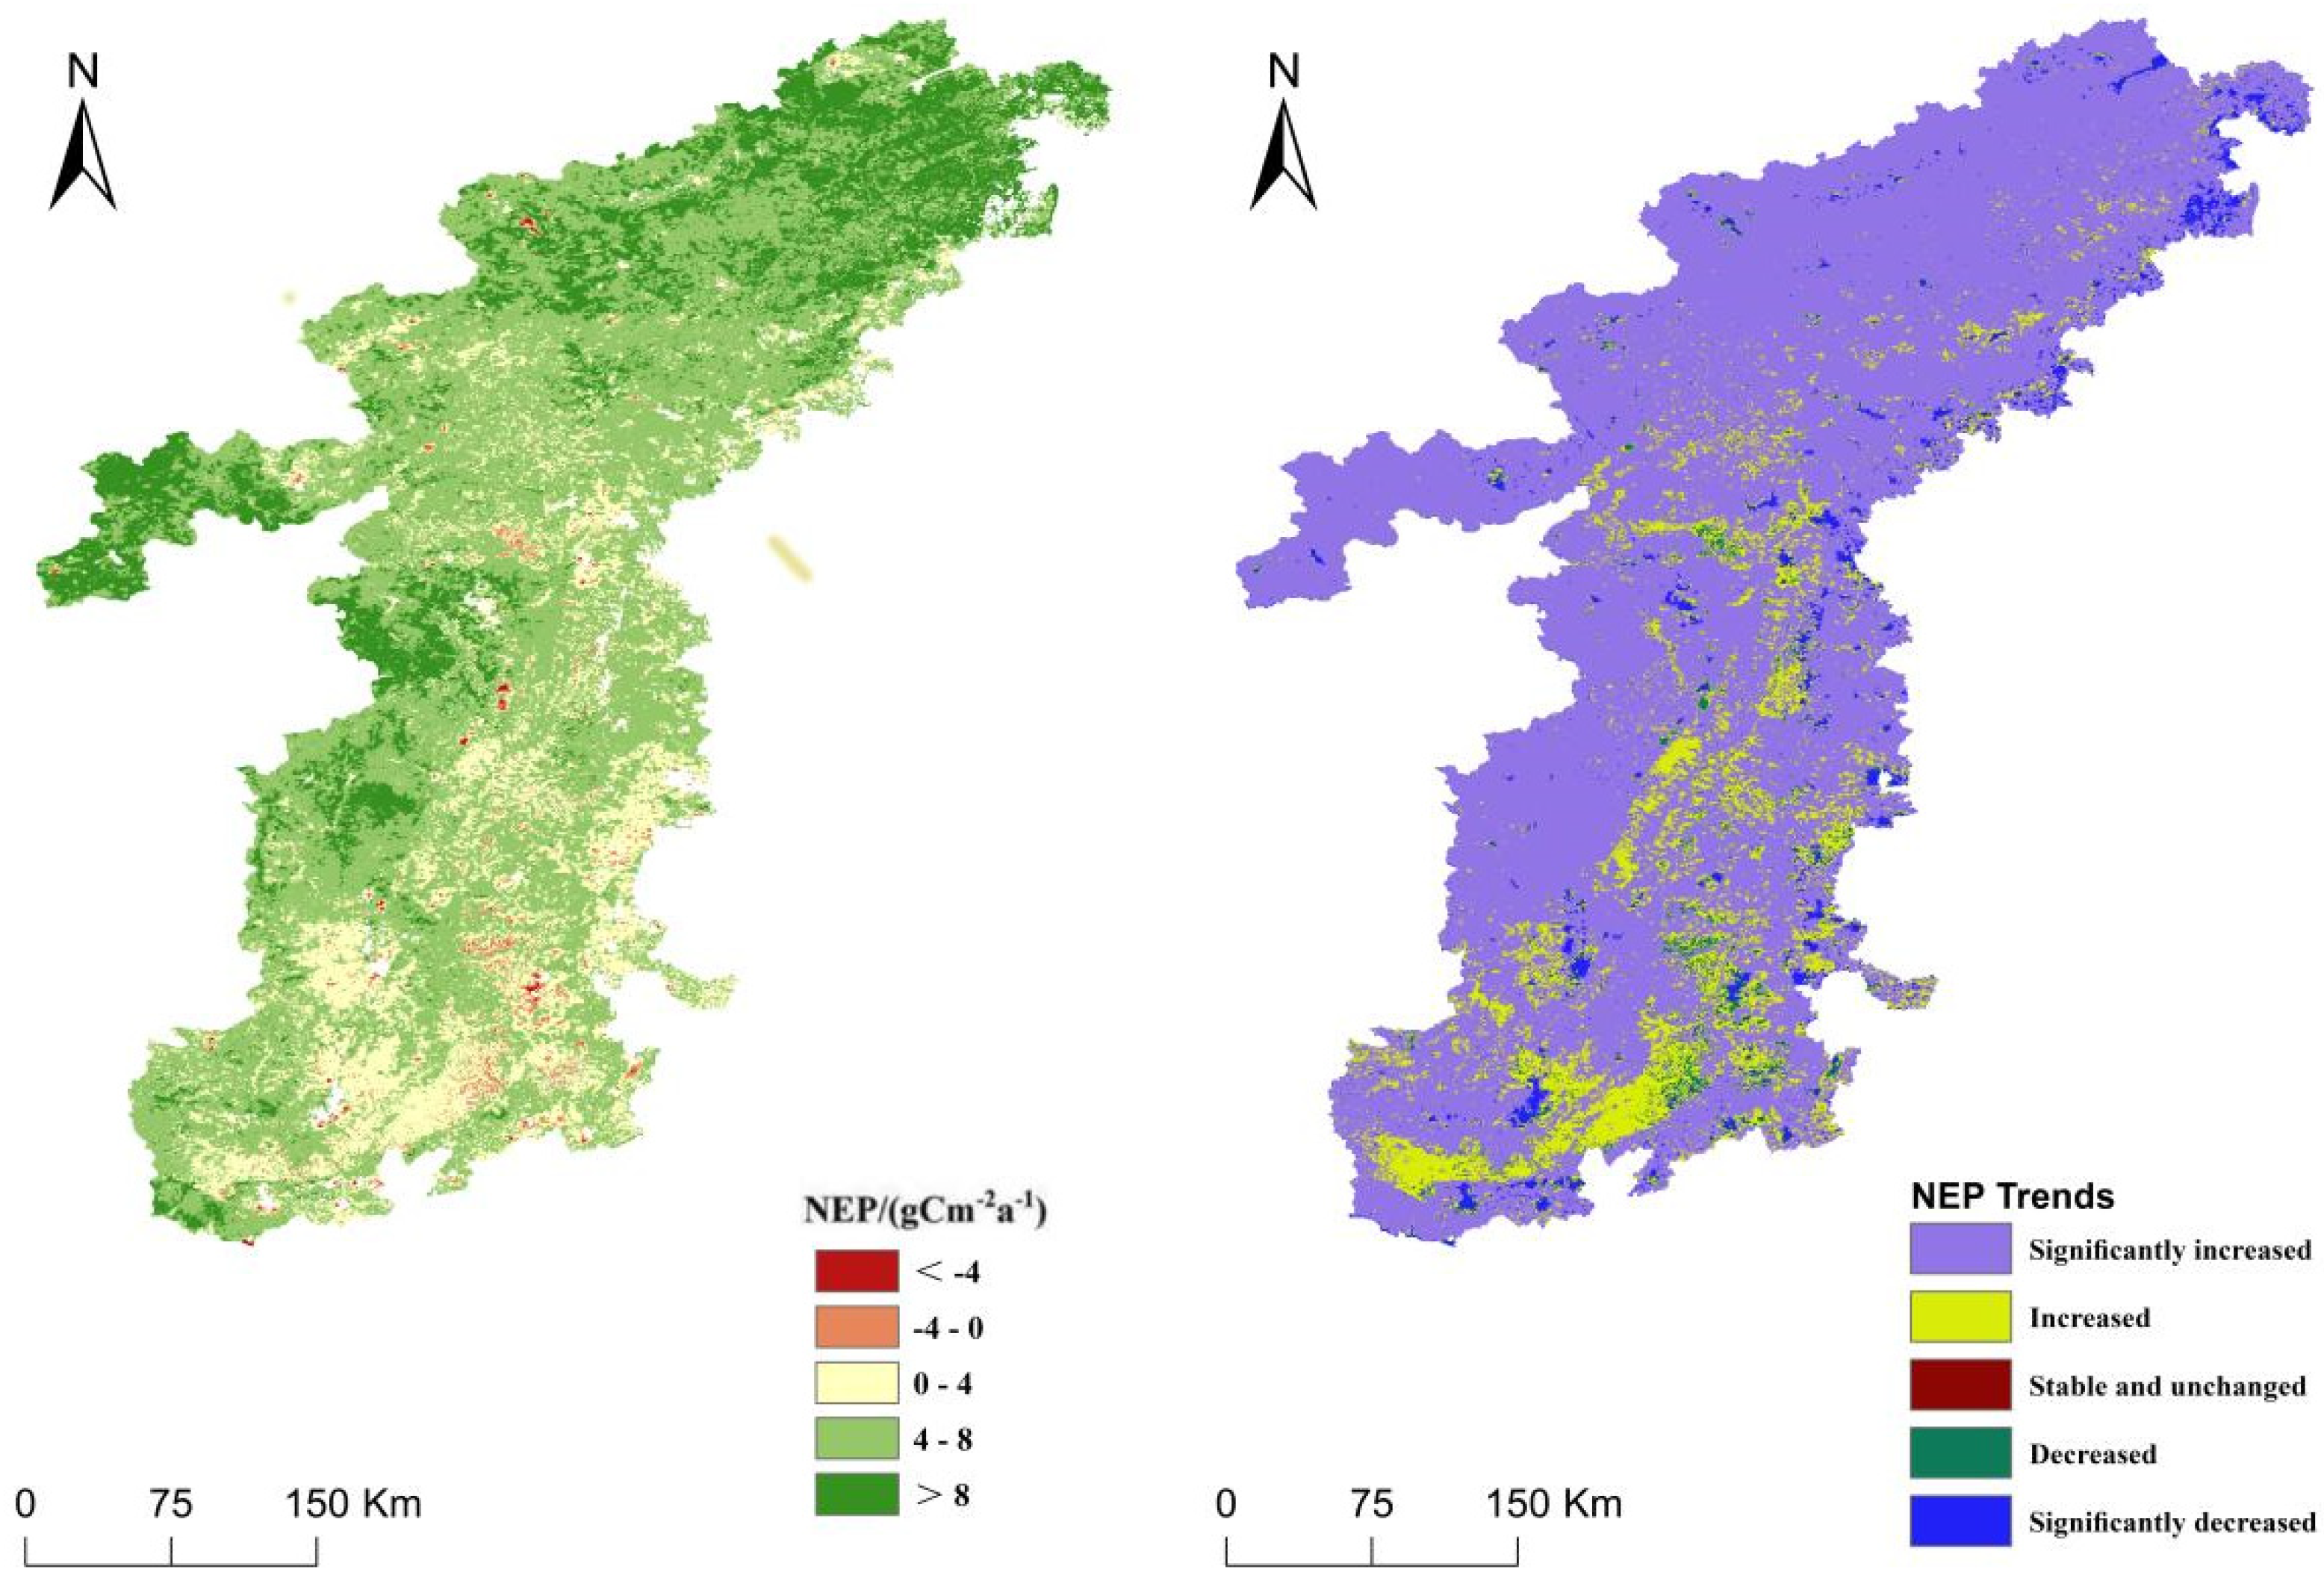
3.2. The Changing Trend in NEP
3.3. Driving Analysis of Influencing Factors
3.3.1. Impact Analysis of Natural Factors on NEP
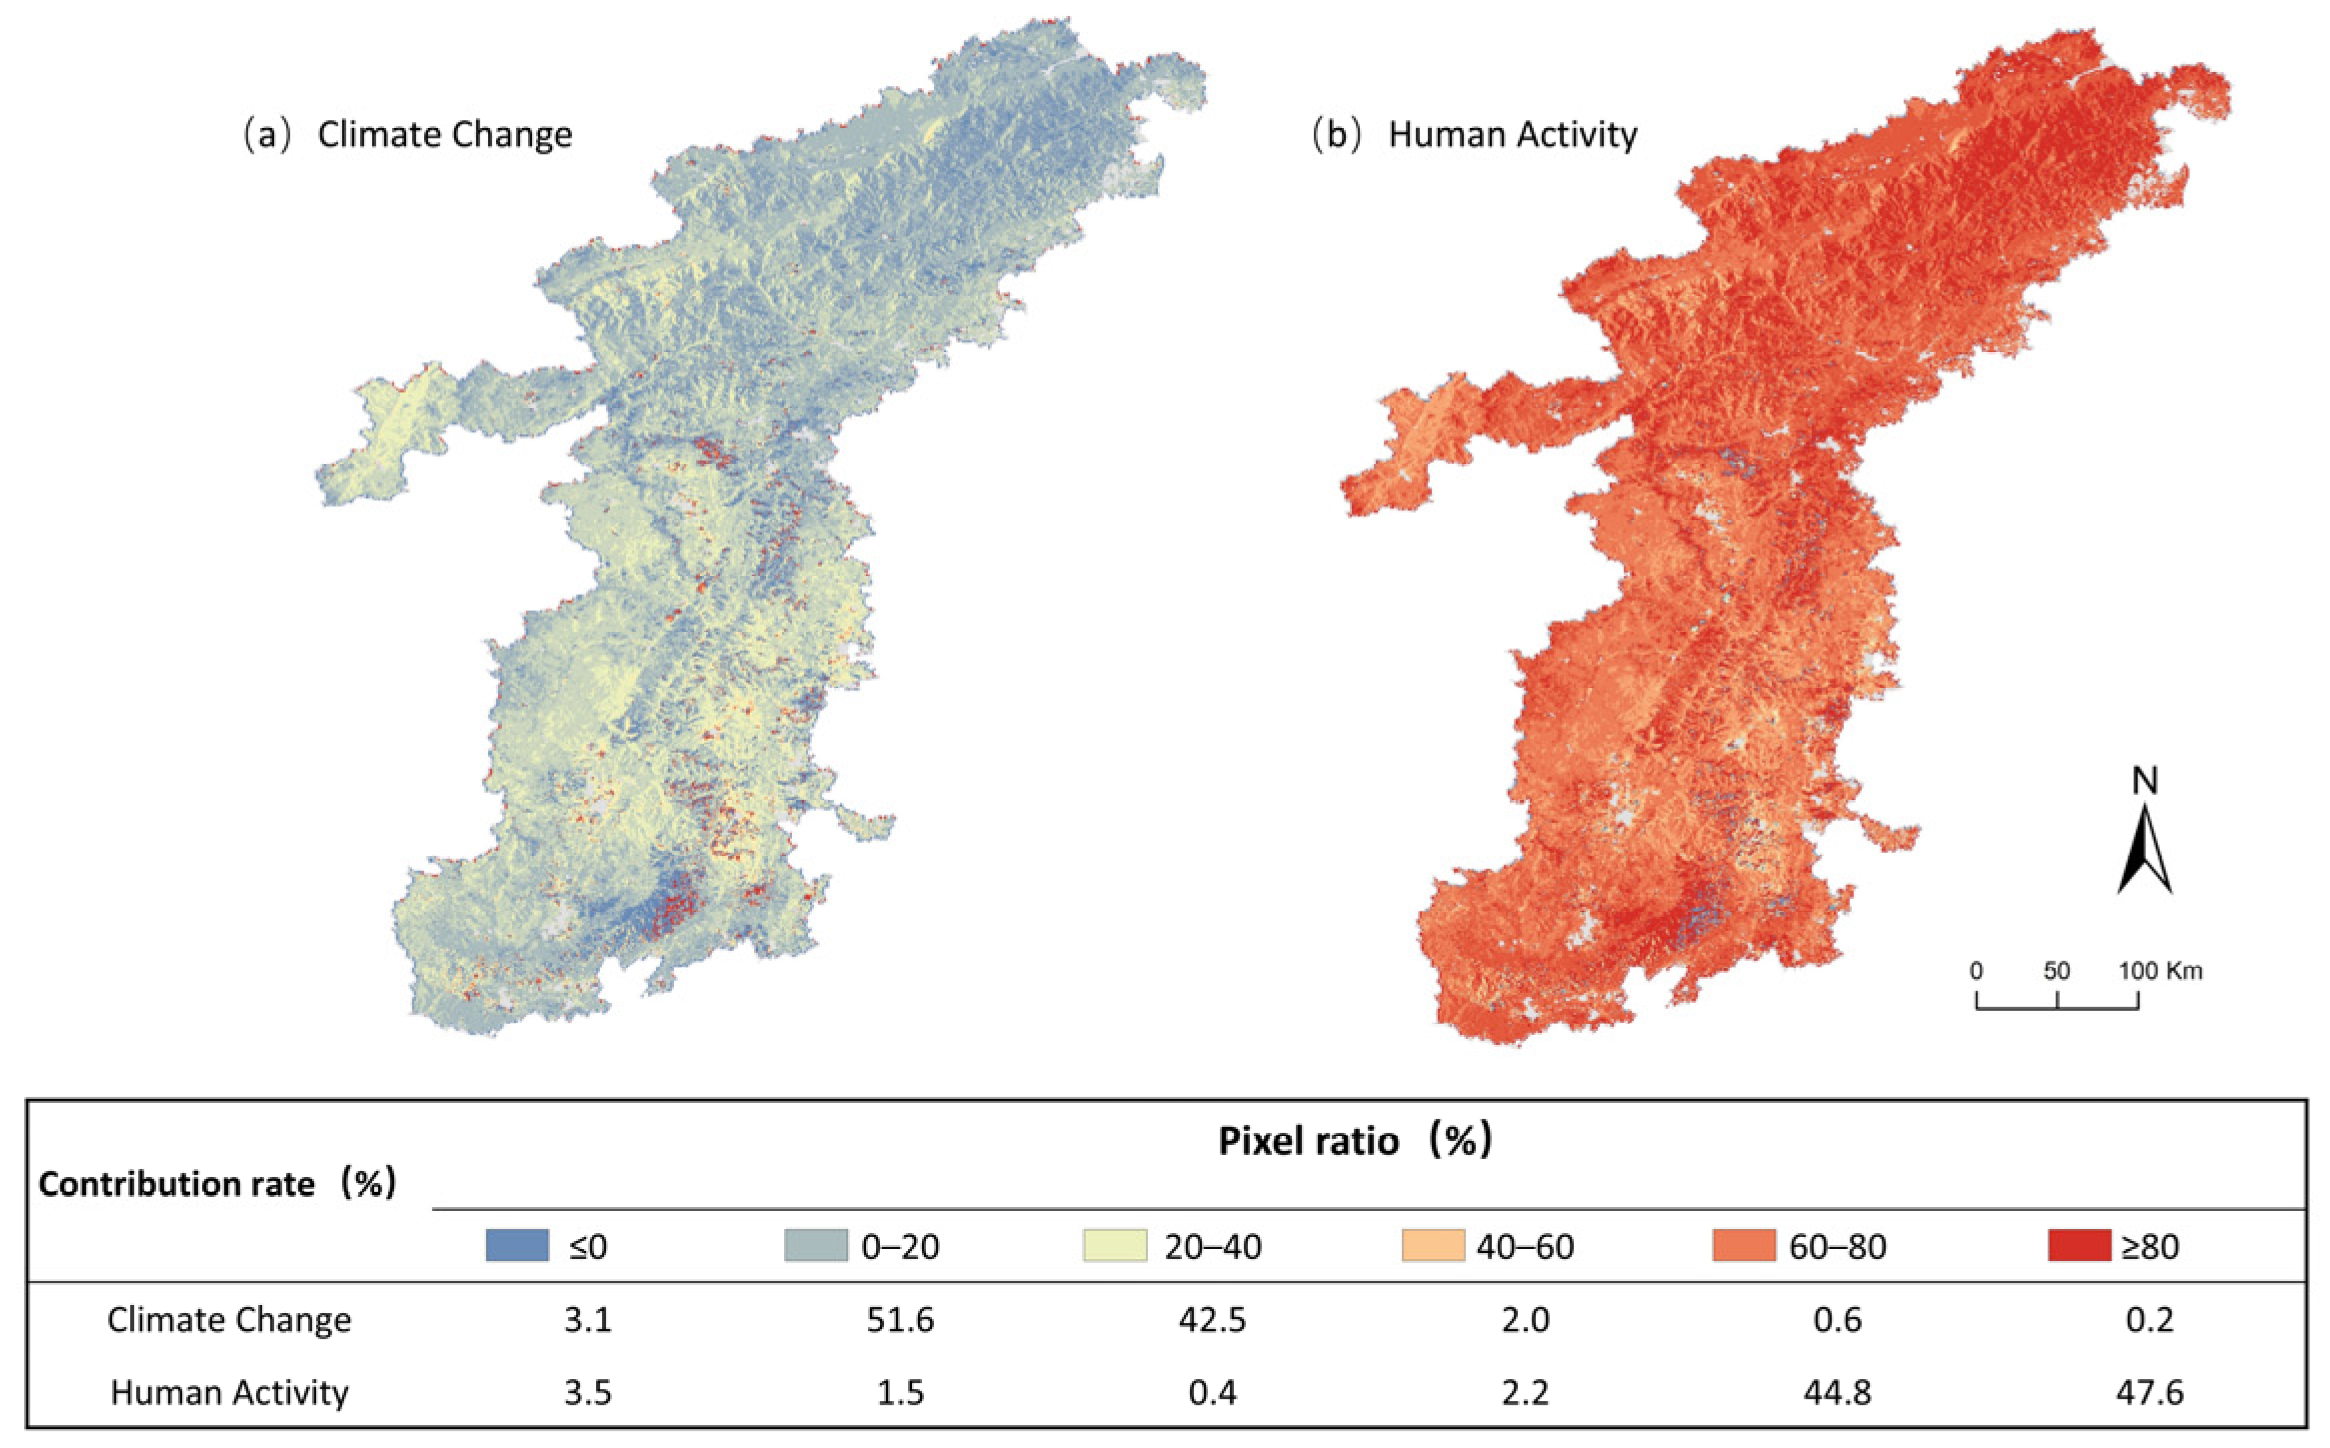
3.3.2. Analysis of Climate Change and Human Activity Drivers of the NEP
4. Discussion
4.1. Characteristics of Spatial and Temporal Evolution of Vegetation Carbon Sinks
4.2. Driving Analysis of Carbon Sink Factors
4.3. Shortcomings and Future Improvements of This Study
5. Conclusions
- From 2000 to 2022, the trend of NEP growth in the Taihang Mountains was obvious, and the average value of NEP in the Taihang Mountains was 289 gC·m−2·a−1, showing the characteristics of high in the northeast and low in the west and centre of the country in the spatial distribution, with a trend of gradual increase from the northeast to the southwest. Combined with geographic features, regional differences in DEM and vegetation types were found to be important factors for the spatial heterogeneity of the vegetation carbon sink.
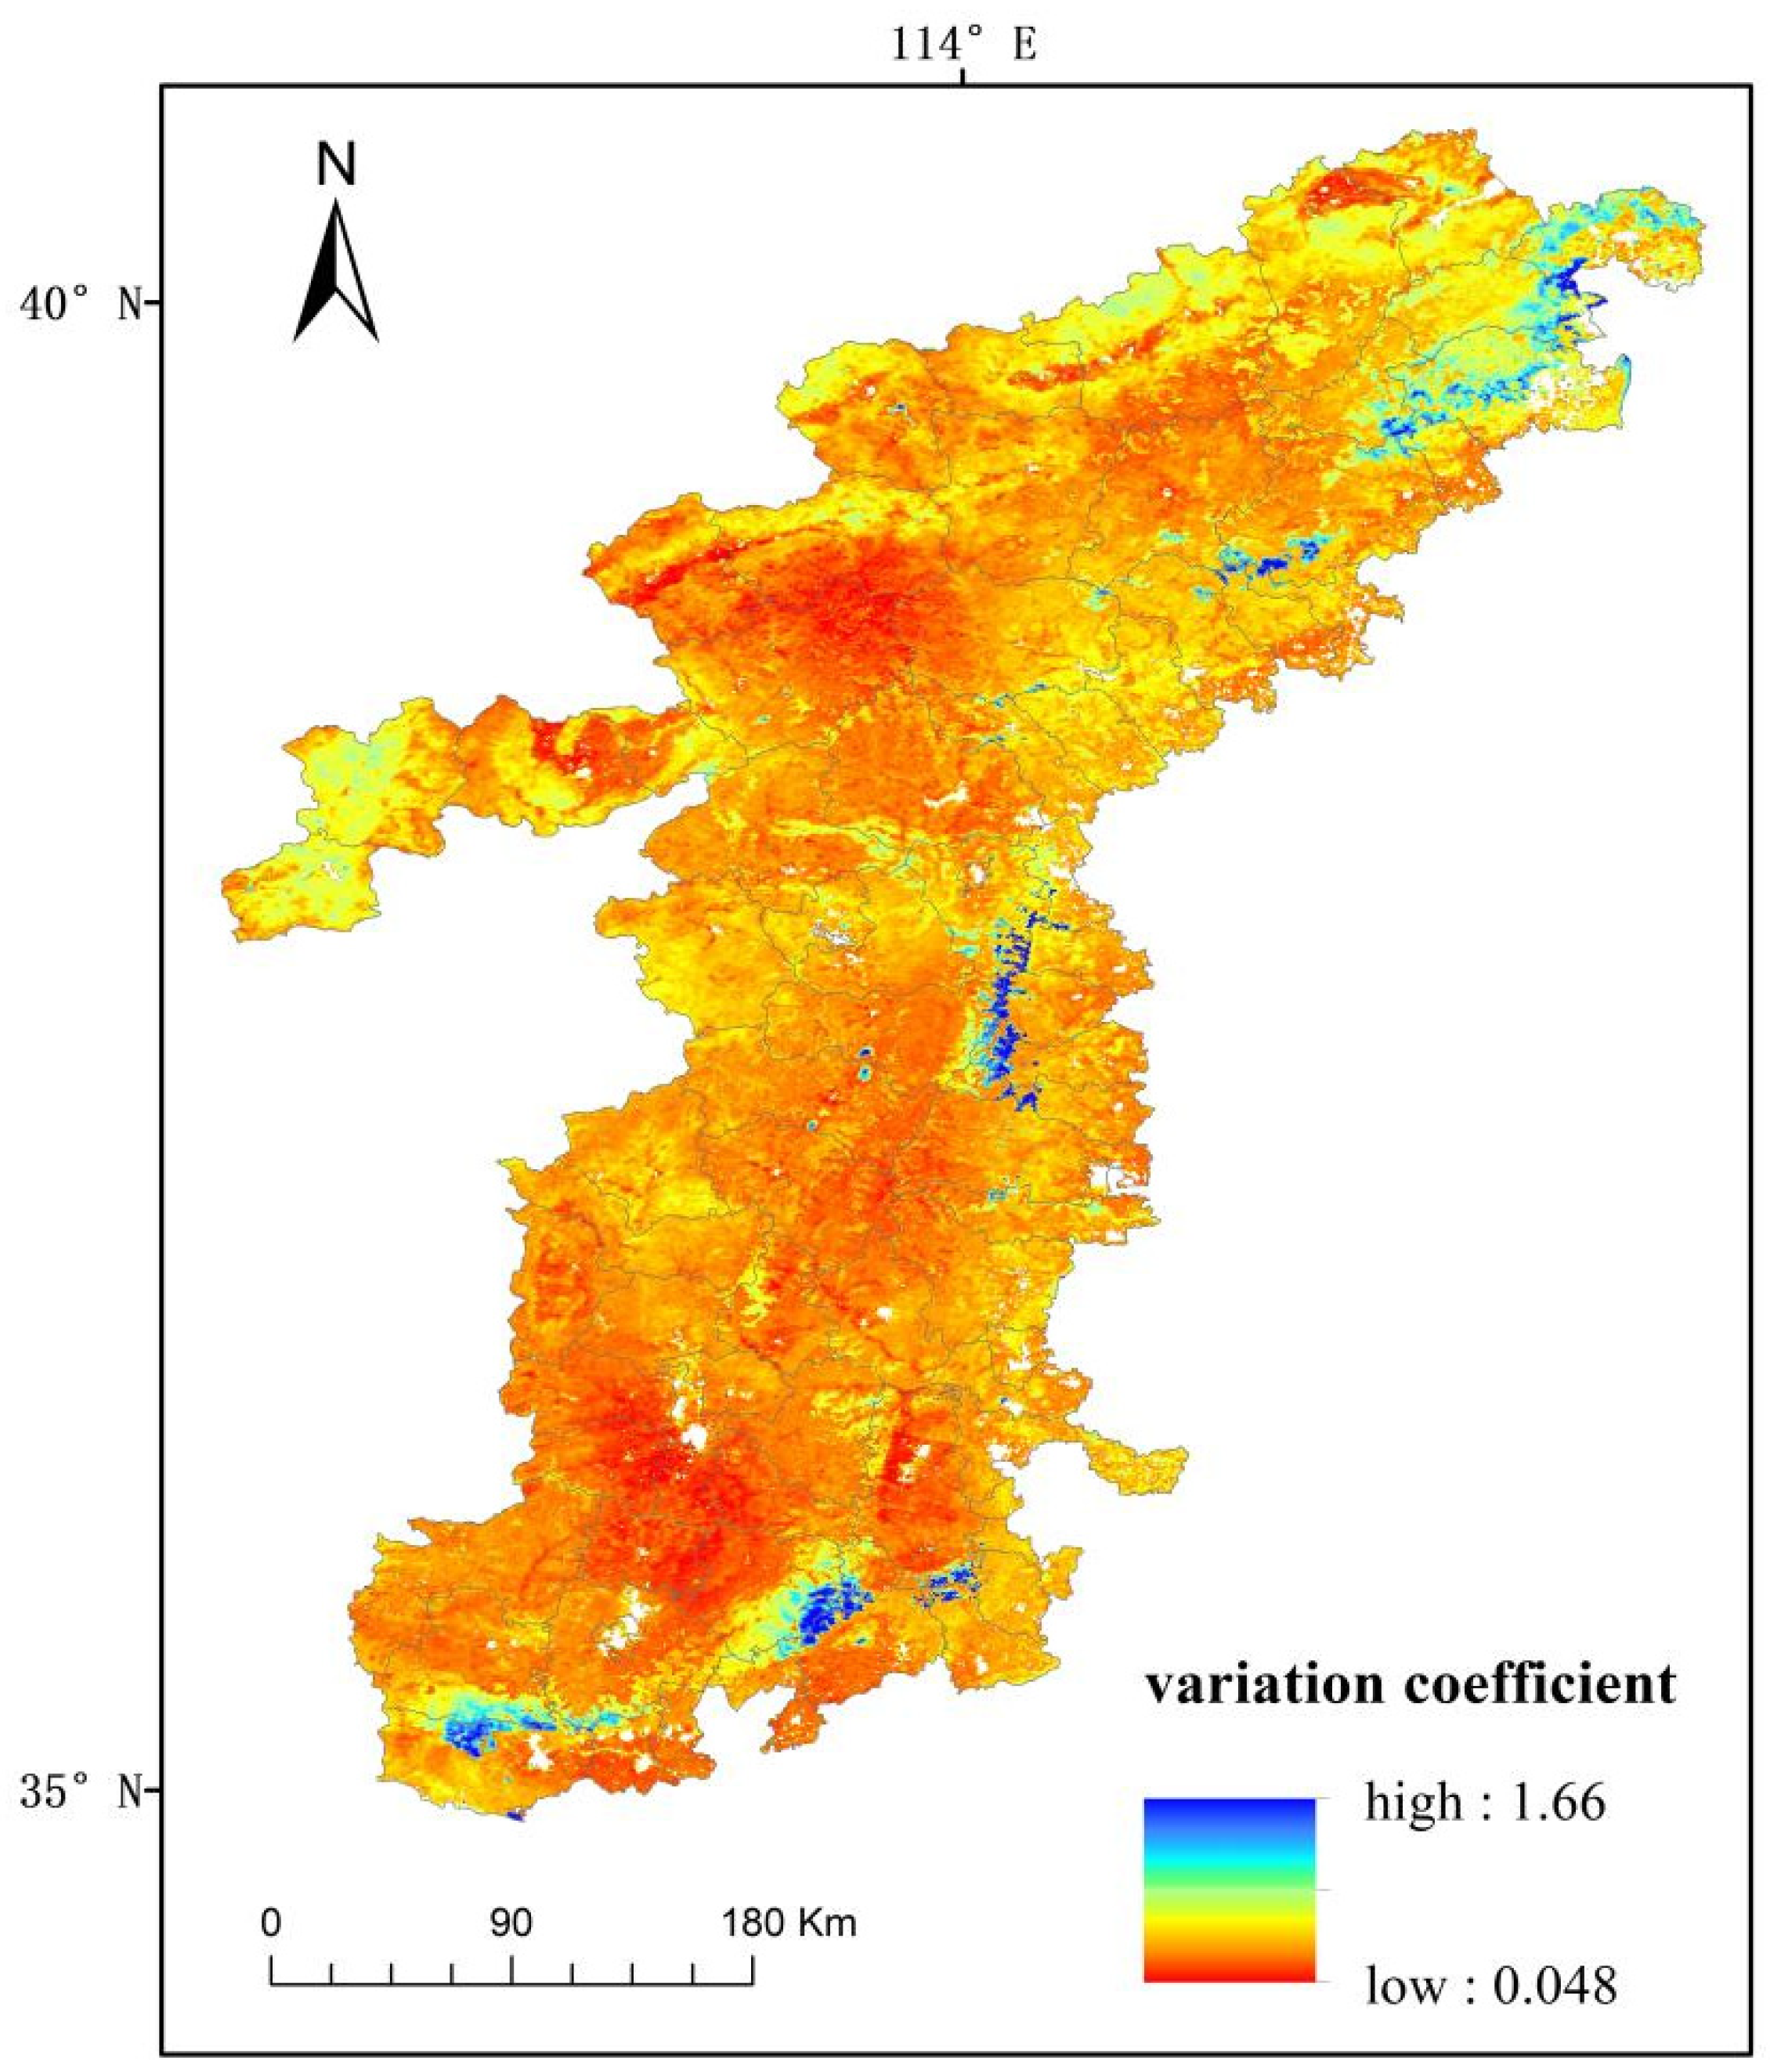
- Over the 23 years from 2000 to 2022, the vegetation carbon sink in the Taihang Mountains region as a whole showed an increasing trend, and the area of the eastern low carbon sink area evolved over time and shrank. In addition, the vegetation carbon sink in the Taihang Mountains region had less fluctuation over time and was more stable.
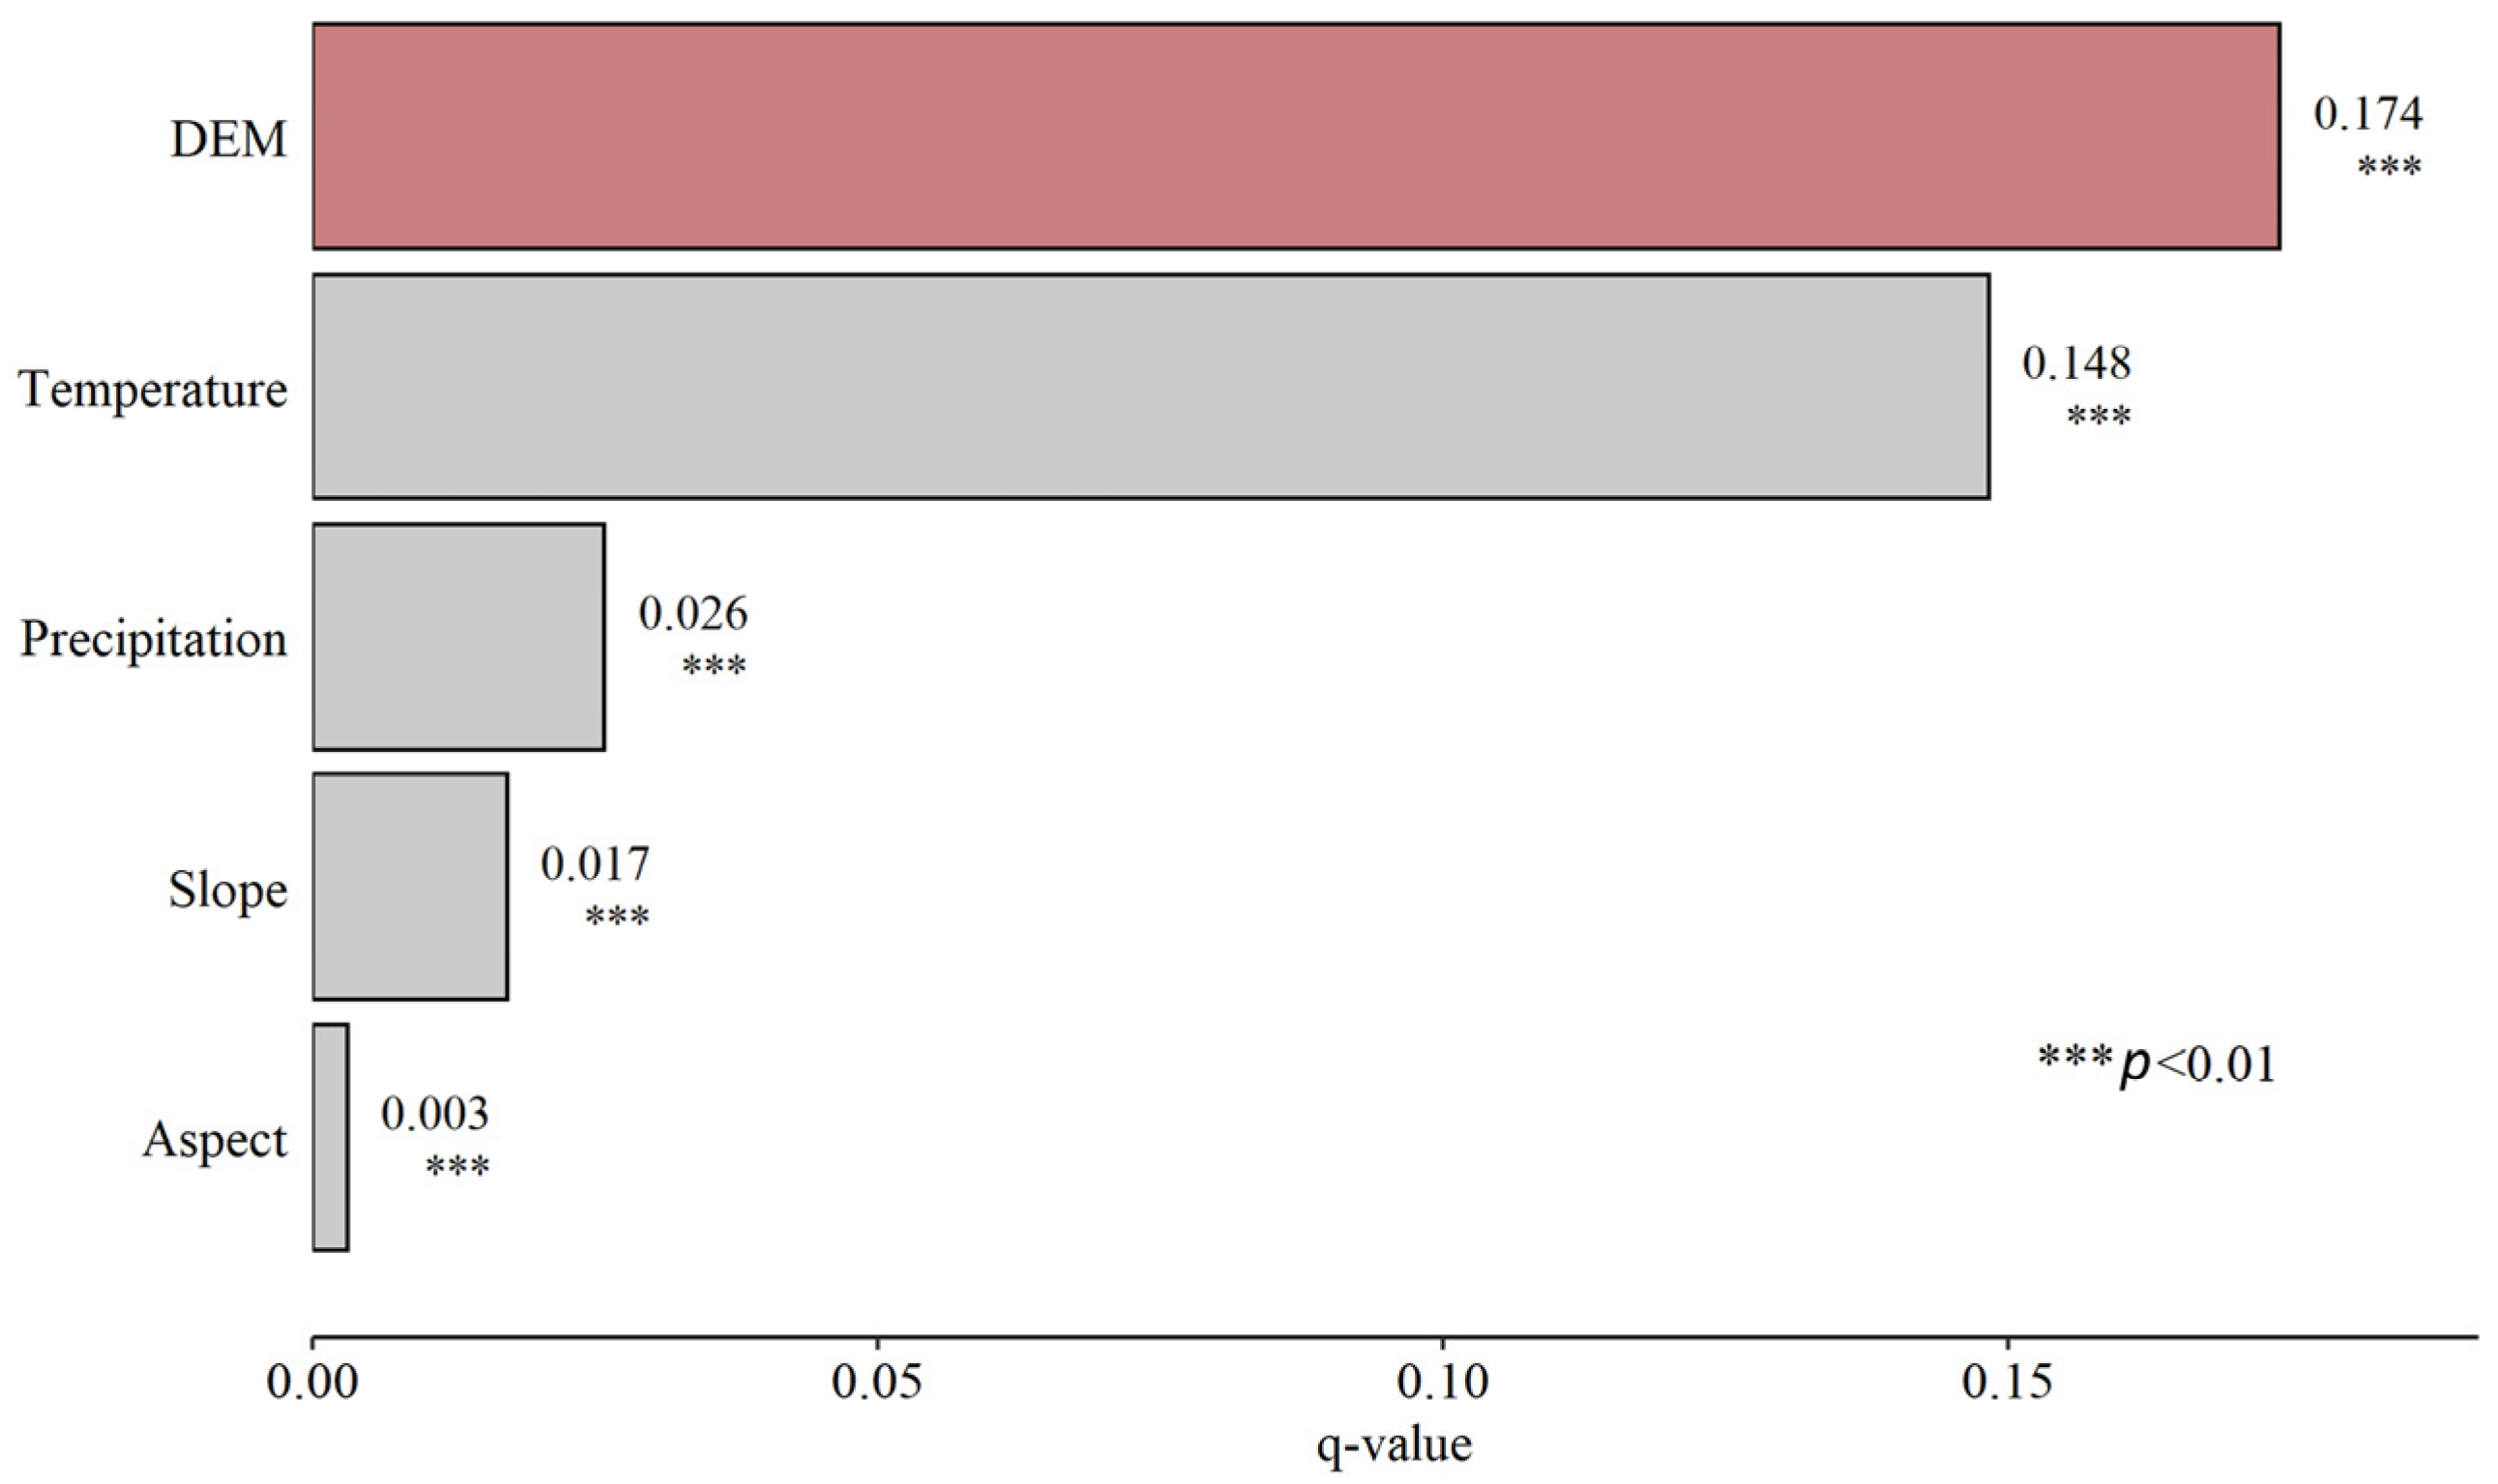
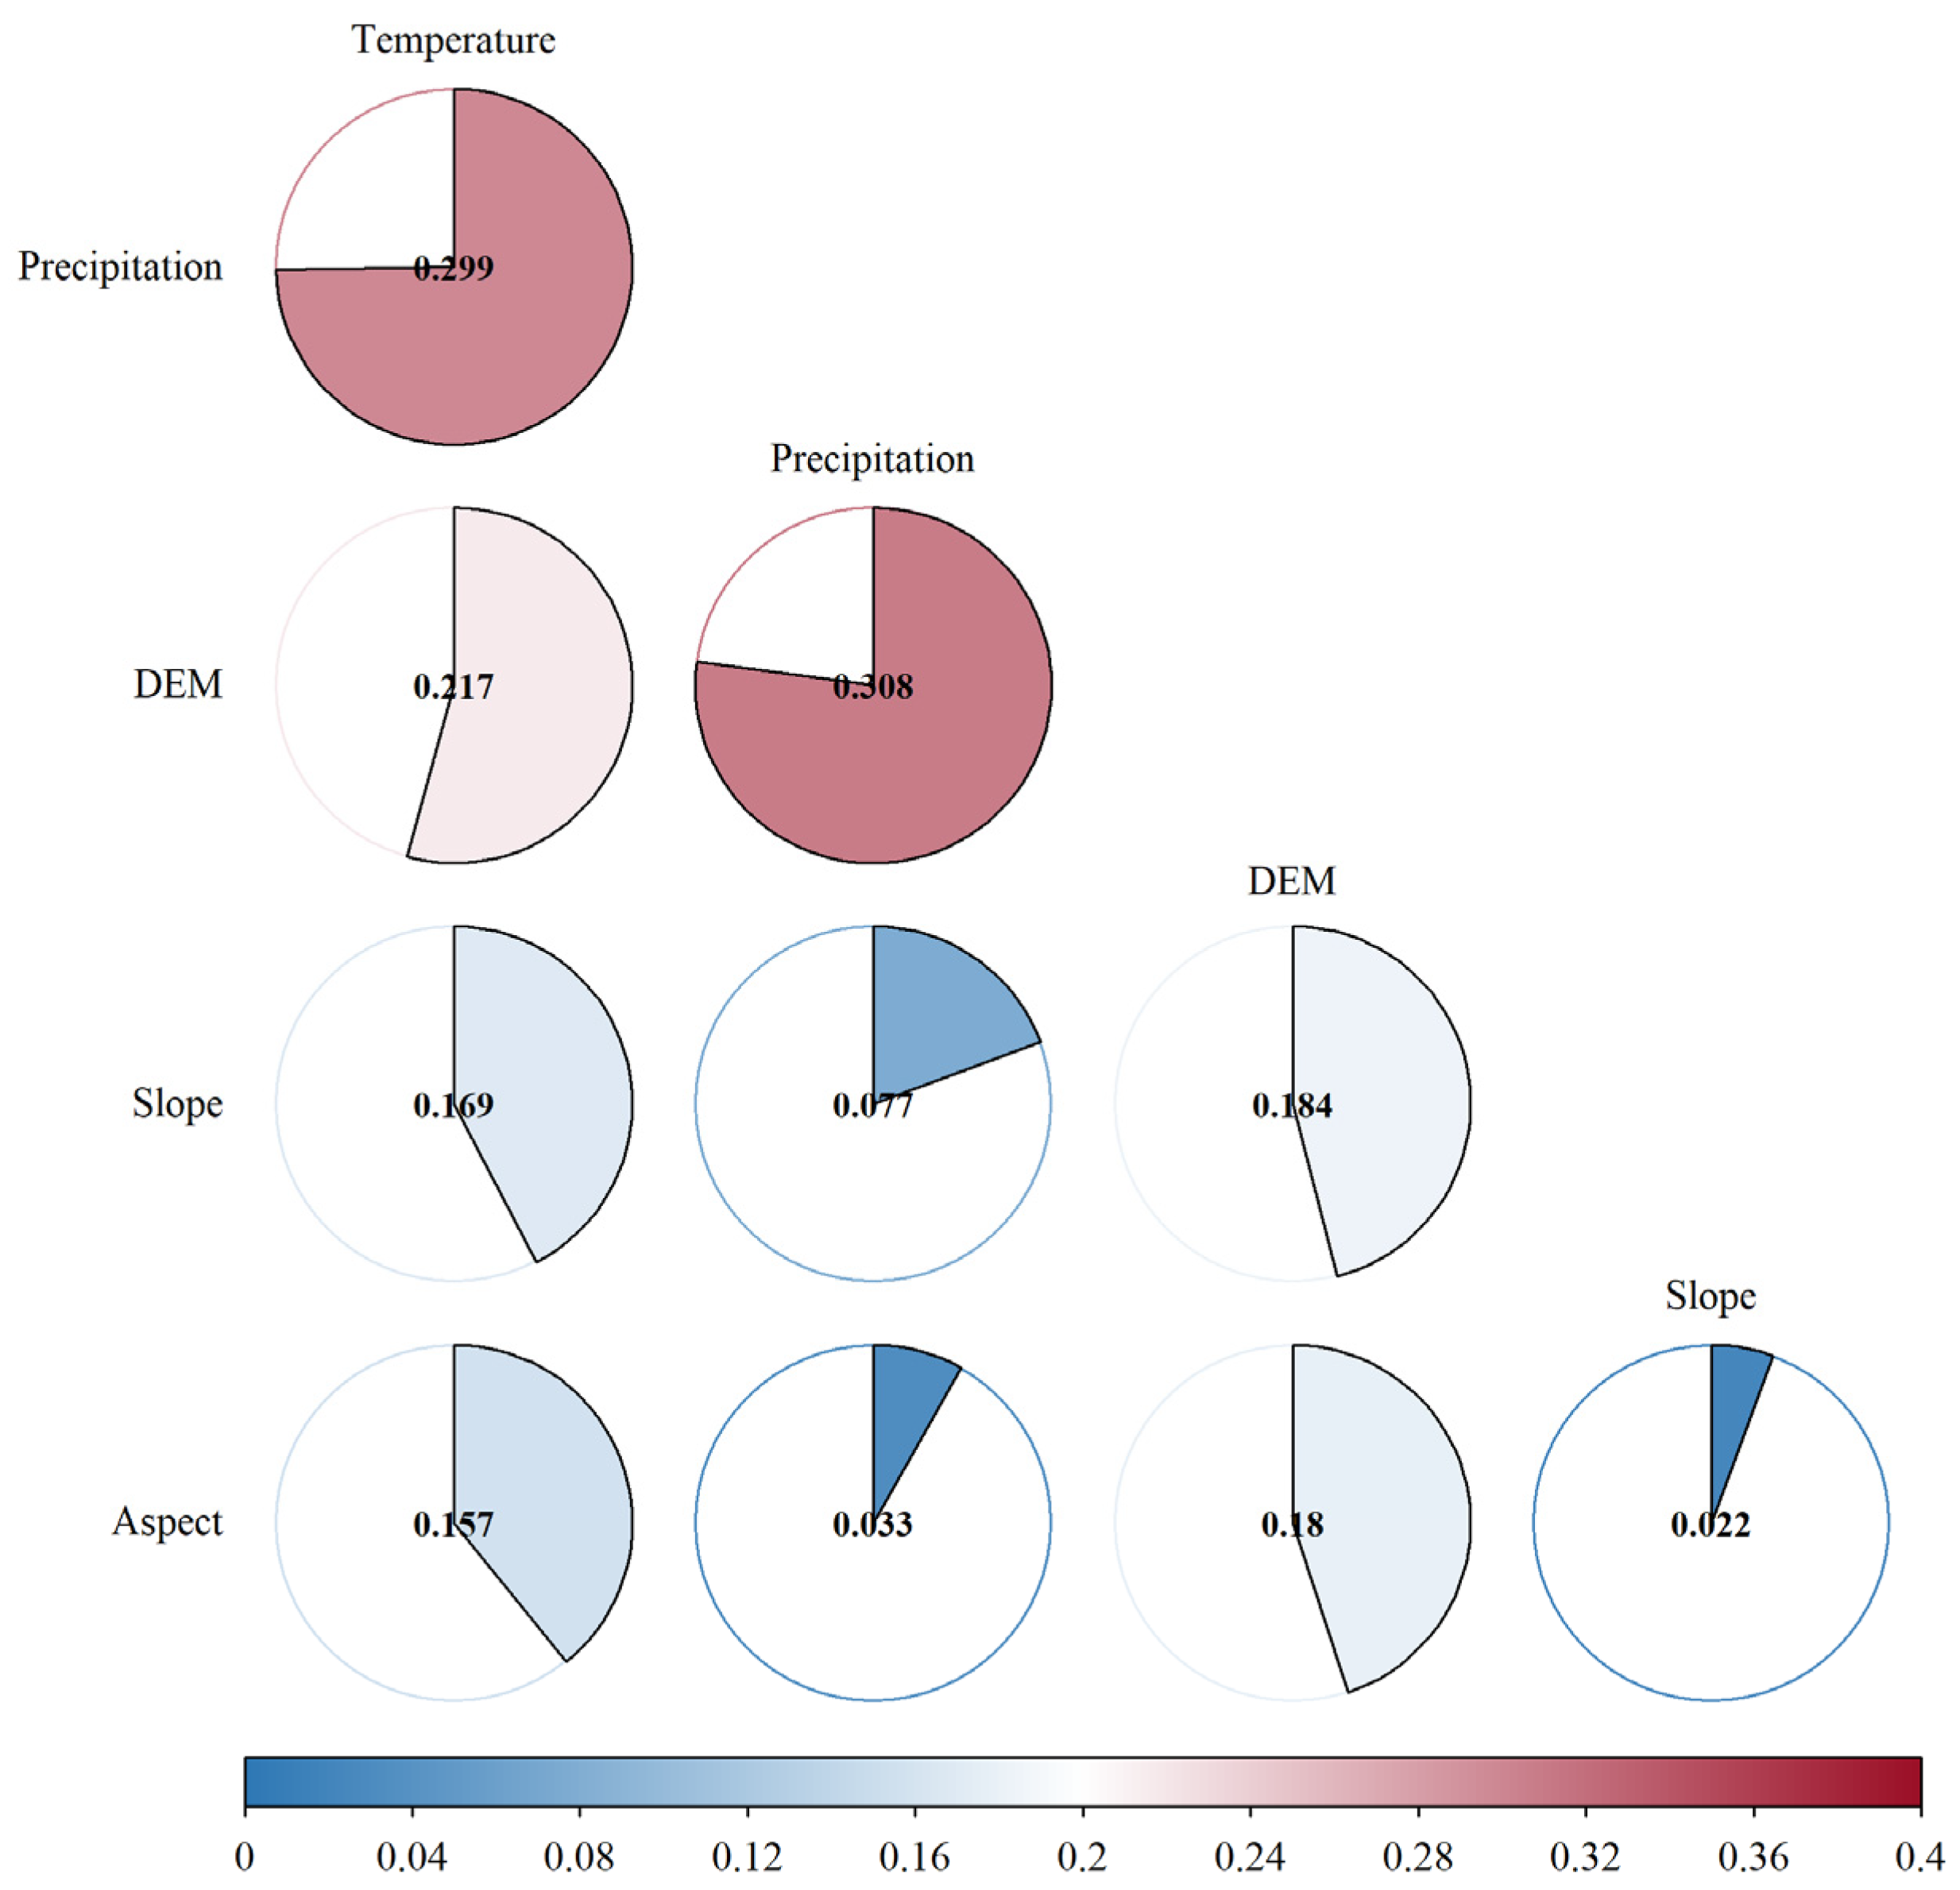
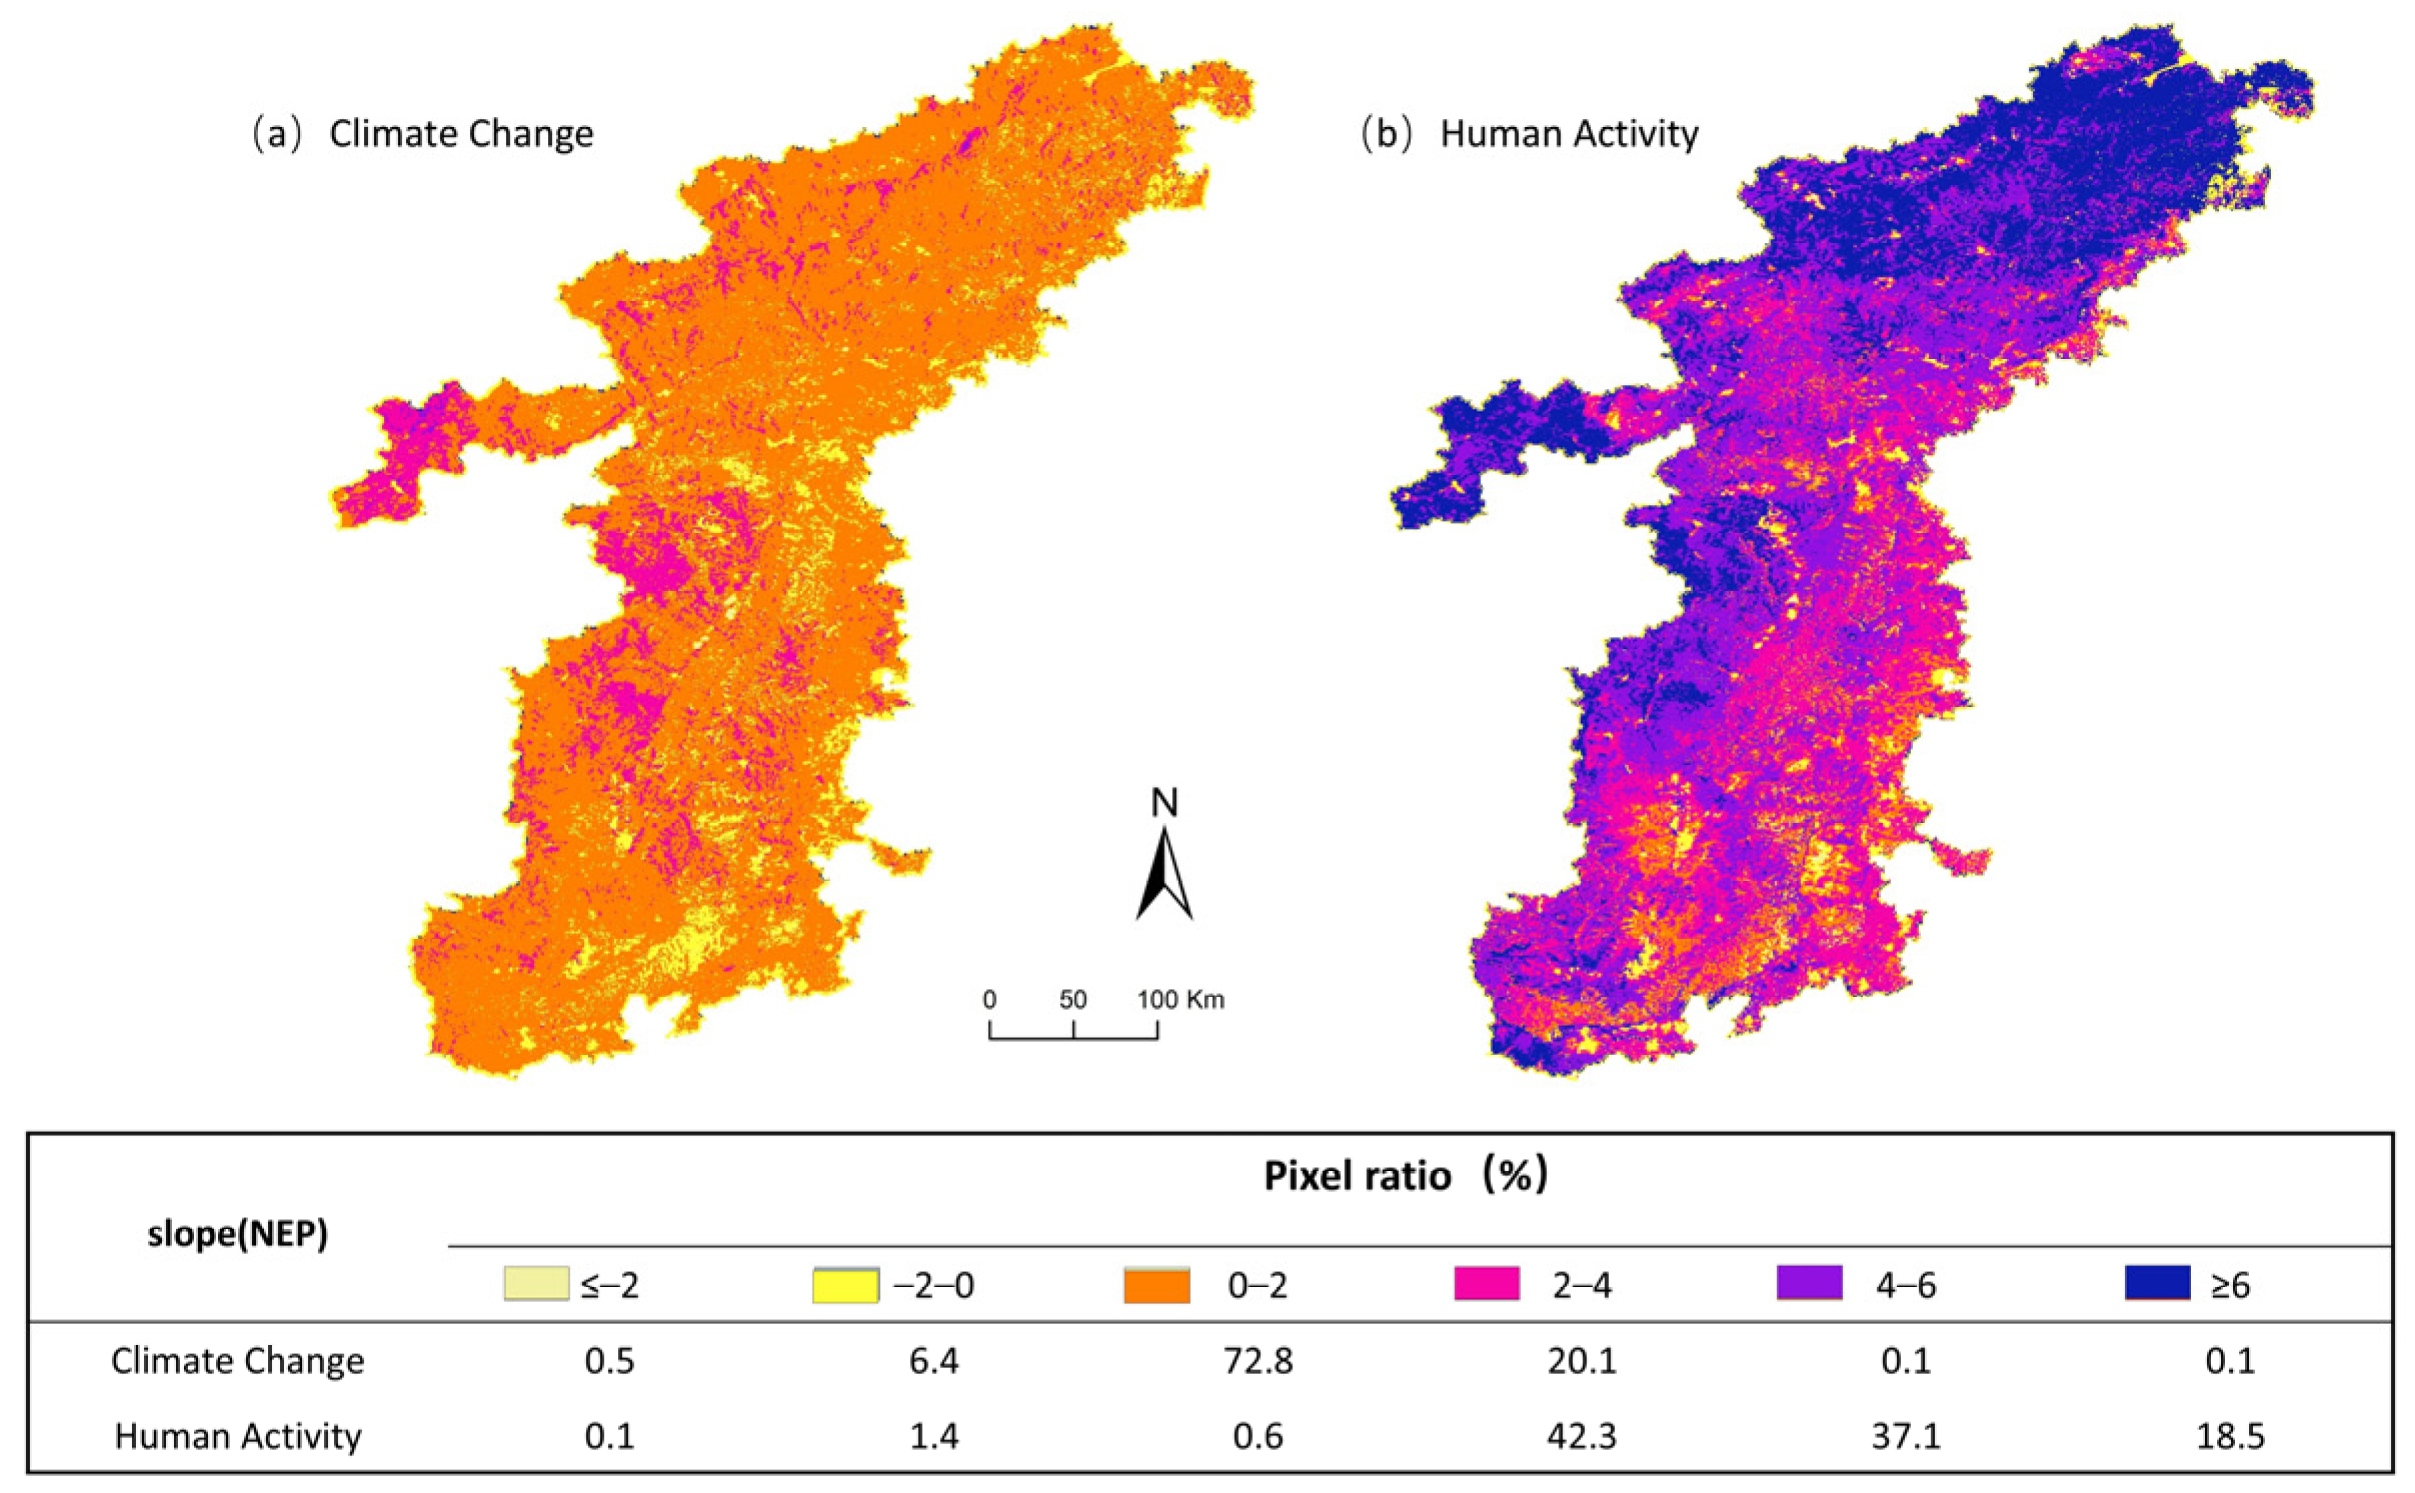
- Vegetation carbon sinks in the Taihang Mountains are influenced by a variety of natural factors, of which the explanatory power of each natural factor is as follows: DEM (0.174) > temperature (0.148) > precipitation (0.026) > slope (0.017) > slope direction (0.003). The explanatory power of natural factors on vegetation carbon sequestration is significantly stronger than that of single factors in both pairwise interactions, with the interaction between DEM and precipitation having the strongest explanatory power. In addition, compared with climate change factors such as temperature and precipitation, the contribution of anthropogenic activities to NEP changes within more than 90% of the Taihang Mountain area is above 60%, indicating that the contribution of NEP changes is basically driven by anthropogenic activities and that human activities drive NEP changes in the Taihang Mountain area more significantly. The contribution of anthropogenic activities to NEP change is significantly higher than that of climate change, showing a strong promoting role.
Author Contributions
Funding
Data Availability Statement
Conflicts of Interest
| 1. | https://ladsweb.modaps.eosdis.nasa.gov/ accessed on 18 March 2024. |
| 2. | https://www.geodata.cn/ accessed on 18 March 2024. |
References
- Rogelj, J.; Schaeffer, M.; Meinshausen, M.; Knutti, R.; Alcamo, J.; Riahi, K.; Hare, W. Zero emission targets as long-term global goals for climate protection. Environ. Res. Lett. 2015, 10, 105007. [Google Scholar] [CrossRef]
- Cai, A.-Z.; Ru, G.; Zhang, Y.-H.; Jiang, W. Status and trends of carbon emissions research at the county level in China. Adv. Clim. Change Res. 2024, 15, 338–352. [Google Scholar] [CrossRef]
- Gan, T.; Zhou, Z.; Li, S.; Tu, Z. Carbon emission trading, technological progress, synergetic control of environmental pollution and carbon emissions in China. J. Clean. Prod. 2024, 442, 141059. [Google Scholar] [CrossRef]
- Su, L. Research on the Strategy of Integrating Carbon Peak and Carbon Neutrality into the Overall Layout of Ecological Civilization Construction. Environ. Prot. 2021, 49, 6–9. [Google Scholar]
- Purre, A.-H.; Pajula, R.; Ilomets, M. Carbon dioxide sink function in restored milled peatlands—The significance of weather and vegetation. Geoderma 2019, 346, 30–42. [Google Scholar] [CrossRef]
- Wang, Q.; Zheng, H.; Zhu, X.; Yu, G. Primary estimation of Chinese terrestrial carbon sequestration during 2001–2010. Sci. Bull. 2015, 60, 577–590. [Google Scholar] [CrossRef]
- Lyu, J.; Fu, X.; Lu, C.; Zhang, Y.; Luo, P.; Guo, P.; Huo, A.; Zhou, M. Quantitative assessment of spatiotemporal dynamics in vegetation NPP, NEP and carbon sink capacity in the Weihe River Basin from 2001 to 2020. J. Clean. Prod. 2023, 428, 139384. [Google Scholar] [CrossRef]
- Lou, H.; Yang, S.; Shi, X.; Zhang, J.; Pan, Z.; Li, C.; Zhang, Y.; Zhou, B.; Li, H.; Shi, Y.; et al. Whether the enhanced terrestrial vegetation carbon sink affect the water resources in the middle-low latitude karst areas of China. J. Hydrol. 2023, 620, 129510. [Google Scholar] [CrossRef]
- Li, J.; Chen, Y.; Gang, C.; Zhang, J. Monitoring of Vegetation Spatial Pattern, Diversity and Carbon Source/Sink Changes in Arid Grazing Ecosystem of Xinjiang, China by Ecological Survey and 3S Technology. Procedia Environ. Sci. 2011, 10, 1974–1979. [Google Scholar] [CrossRef]
- Li, S.; He, S.; Xu, Z.; Liu, Y.; von Bloh, W. Desertification process and its effects on vegetation carbon sources and sinks vary under different aridity stress in Central Asia during 1990–2020. Catena 2023, 221, 106767. [Google Scholar] [CrossRef]
- Peng, B.; Zhou, Z.; Cai, W.; Li, M.; Xu, L.; He, N. Maximum potential of vegetation carbon sink in Chinese forests. Sci. Total Environ. 2023, 905, 167325. [Google Scholar] [CrossRef]
- Xue, P.; Zhang, M.; Wang, K.; Feng, D.; Liu, H.; Liang, C.; Jiao, F.; Gong, H.; Xu, X.; Wang, Z. How hydrothermal factors and CO2 concentration affect vegetation carbon sink over time and elevation gradient. J. Clean. Prod. 2024, 449, 141800. [Google Scholar] [CrossRef]
- Kashyap, R.; Kuttippurath, J.; Kumar, P. Browning of vegetation in efficient carbon sink regions of India during the past two decades is driven by climate change and anthropogenic intrusions. J. Environ. Manag. 2023, 336, 117655. [Google Scholar] [CrossRef] [PubMed]
- Li, Z.; Chen, Y.; Zhang, Q.; Li, Y. Spatial patterns of vegetation carbon sinks and sources under water constraint in Central Asia. J. Hydrol. 2020, 590, 125355. [Google Scholar] [CrossRef]
- Li, Z.; Chen, Y.; Zhang, Q.; Li, Y. Spatial patterns of vegetation carbon sinks and sources dataset in Central Asia. Data Brief 2020, 32, 106200. [Google Scholar] [CrossRef]
- Wei, X.; Yang, J.; Luo, P.; Lin, L.; Lin, K.; Guan, J. Assessment of the variation and influencing factors of vegetation NPP and carbon sink capacity under different natural conditions. Ecol. Indic. 2022, 138, 108834. [Google Scholar] [CrossRef]
- Fang, J.-Y.; Guo, Z.; Piao, S.; Chen, A.P. Estimation of carbon sinks in terrestrial vegetation in China from 1981 to 2000. Sci. Sin. Terrae 2007, 6, 804–812. [Google Scholar]
- Liu, F.; Zeng, Y. Analysis of the spatio-temporal variation of vegetation carbon source/sink in Qinghai Plateau from 2000–2015. Acta Ecol. Sin. 2021, 41, 5792–5803. [Google Scholar]
- Yang, H.; Chen, W. Spatio-temporal pattern of urban vegetation carbon sink and driving mechanisms of human activities in Huaibei, China. Environ. Sci. Pollut. Res. 2022, 29, 31957–31971. [Google Scholar] [CrossRef] [PubMed]
- Xu, X.; Jiao, F.; Lin, D.; Liu, J.; Zhang, K.; Yang, R.; Lin, N.; Zou, C. Carbon sink trends in the karst regions of Southwest China: Impacts of ecological restoration and climate change. Land 2023, 12, 1906. [Google Scholar] [CrossRef]
- Li, W.; Zhou, J.; Xu, Z.; Liang, Y.; Shi, J.; Zhao, X. Climate impact greater on vegetation NPP but human enhance benefits after the Grain for Green Program in Loess Plateau. Ecol. Indic. 2023, 157, 111201. [Google Scholar] [CrossRef]
- Xu, X.; Liu, H.; Lin, Z.; Gong, H. Relationship of abrupt vegetation change to climate change and ecological engineering with multi-timescale analysis in the karst region, Southwest China. Remote Sens. 2019, 11, 1564. [Google Scholar] [CrossRef]
- Pan, J.; Wen, Y. Estimation and spatial-temporal characteristics of carbon sink in the arid region of northwest China. Acta Ecol. Sin. 2015, 35, 7718–7728. [Google Scholar]
- Wang, C.; Liu, Y.; Li, Z. Effects of ecological water conveyance on the spatial pattern of vegetation carbon sources/sinks in the lower reaches of Tarim River. Arid Land Geogr. 2021, 44, 729–738. [Google Scholar]
- Yun, Y.; Zhao, J. Spatial pattern of vegetation carbon sinks based on MODIS-NDVI data: A case study in Shiyang River Basin, China. Mt. Res. 2018, 36, 644–653. [Google Scholar]
- Zhang, J.; Liu, C.; Hao, H.; Sun, L.; Qiao, Q.; Wang, H.; Ning, Y. Spatial-temporal change of carbon storage and carbon sink of grassland ecosystem in the Three-River Headwaters Region based on MODIS GPP/NPP data. Environ. Sci. 2015, 24, 8–13. [Google Scholar]
- Zhang, J.; Zhang, Y.; Qin, Y.; Lu, X.; Cao, J. The spatiotemporal pattern of grassland NPP in Inner Mongolia was more sensitive to moisture and human activities than that in the Qinghai-Tibetan Plateau. Glob. Ecol. Conserv. 2023, 48, e02709. [Google Scholar] [CrossRef]
- Mei, W.; Dong, H.; Qian, L.; Yan, J.; Hu, Y.; Wang, L. Effects of anthropogenic disturbances on the carbon sink function of Yangtze River estuary wetlands: A review of performance, process, and mechanism. Ecol. Indic. 2024, 159, 111643. [Google Scholar] [CrossRef]
- Wang, S.; Li, X.; Ji, M.; Zhang, J.; Tanveer, M.; Hu, Z. Is constructed wetlands carbon source or carbon sink? Case analysis based on life cycle carbon emission accounting. Bioresour. Technol. 2023, 388, 129777. [Google Scholar] [CrossRef]
- Peltoniemi, M.; Palosuo, T.; Monni, S.; Mäkipää, R. Factors affecting the uncertainty of sinks and stocks of carbon in Finnish forests soils and vegetation. For. Ecol. Manag. 2006, 232, 75–85. [Google Scholar] [CrossRef]
- He, Y.; Li, X.-R.; Yang, X.-F.; Tang, H. The estimation of actual and potential carbon sequestration in Typical Steppe in Xilingol County, Inner Mongolia. Acta Agrestia Sin. 2021, 29, 2274. [Google Scholar]
- Han, F.; Kasimu, A.; Wei, B.; Zhang, X.; Aizizi, Y.; Chen, J. Spatial and temporal patterns and risk assessment of carbon source and sink balance of land use in watersheds of arid zones in China—A case study of Bosten Lake basin. Ecol. Indic. 2023, 157, 111308. [Google Scholar] [CrossRef]
- Li, J.; Shen, J.; Song, J. Analysis of the spatial and temporal evolution and drivers of net carbon efficiency of plantations in China. J. Clean. Prod. 2024, 445, 141346. [Google Scholar] [CrossRef]
- Chen, X.; Zeng, Y. Spatial and temporal variability of the net primary production (NPP) and its relationship with climate factors in subtropical mountainous and hilly regions of China: A case study in Hunan province. Acta Geogr. Sin. 2016, 71, 35–48. [Google Scholar]
- Chen, L.-C.; Guan, X.; Li, H.-M.; Wang, Q.-K.; Zhang, W.-D.; Yang, Q.-P.; Wang, S.-L. Spatiotemporal patterns of carbon storage in forest ecosystems in Hunan Province, China. For. Ecol. Manag. 2019, 432, 656–666. [Google Scholar] [CrossRef]
- Qu, S.; Wang, L.; Lin, A.; Yu, D.; Yuan, M.; Li, C. Distinguishing the impacts of climate change and anthropogenic factors on vegetation dynamics in the Yangtze River Basin, China. Ecol. Indic. 2020, 108, 105724. [Google Scholar] [CrossRef]
- Qu, S.; Wang, L.; Lin, A.; Zhu, H.; Yuan, M. What drives the vegetation restoration in Yangtze River basin, China: Climate change or anthropogenic factors? Ecol. Indic. 2018, 90, 438–450. [Google Scholar] [CrossRef]
- Cao, Y.; Sun, Y.; Jiang, Y.; Wang, J. Analysis on temporal-spatial variations and driving factors of net ecosystem productivity in the Yellow River Basin. Ecol. Environ. 2022, 31, 2101. [Google Scholar]
- Zhu, M.; Zhou, Z.; Wu, X.; Liu, R.; Zheng, J.; Wang, J.; Wan, J. Response of vegetation carbon sequestration potential to the effectiveness of vegetation restoration in karst ecologically fragile areas in Guizhou, southwest China. Ecol. Indic. 2024, 158, 111495. [Google Scholar] [CrossRef]
- Bao, G.; Bao, Y.; Qin, Z.; Xin, X.; Bao, Y.; Bayarsaikan, S.; Zhou, Y.; Chuntai, B. Modeling net primary productivity of terrestrial ecosystems in the semi-arid climate of the Mongolian Plateau using LSWI-based CASA ecosystem model. Int. J. Appl. Earth Obs. Geoinf. 2016, 46, 84–93. [Google Scholar] [CrossRef]
- Huang, C.; Sun, C.; Nguyen, M.; Wu, Q.; He, C.; Yang, H.; Tu, P.; Hong, S. Spatio-temporal dynamics of terrestrial Net ecosystem productivity in the ASEAN from 2001 to 2020 based on remote sensing and improved CASA model. Ecol. Indic. 2023, 154, 110920. [Google Scholar] [CrossRef]
- Zeng, J.; Zhou, T.; Wang, Q.; Xu, Y.; Lin, Q.; Zhang, Y.; Wu, X.; Zhang, J.; Liu, X. Spatial patterns of China’s carbon sinks estimated from the fusion of remote sensing and field-observed net primary productivity and heterotrophic respiration. Ecol. Inform. 2023, 76, 102152. [Google Scholar] [CrossRef]
- Luo, Y.; Zhou, M.; Jin, S.; Wang, Q.; Yan, D. Changes in phylogenetic structure and species composition of woody plant communities across an elevational gradient in the southern Taihang Mountains, China. Glob. Ecol. Conserv. 2023, 42, e02412. [Google Scholar] [CrossRef]
- Yang, Y. Evolution of habitat quality and association with land-use changes in mountainous areas: A case study of the Taihang Mountains in Hebei Province, China. Ecol. Indic. 2021, 129, 107967. [Google Scholar] [CrossRef]
- Qi, F.; Liu, J.; Gao, H.; Fu, T.; Wang, F. Characteristics and spatial–temporal patterns of supply and demand of ecosystem services in the Taihang Mountains. Ecol. Indic. 2023, 147, 109932. [Google Scholar] [CrossRef]
- Zhou, J.; Zhang, T.; Li, J.; Feng, P. Simulation of gross primary productivity and impact of drought in Liulin watershed of Taihang mountains over 2000–2020. Ecol. Model. 2024, 489, 110629. [Google Scholar] [CrossRef]
- Luo, T.; Zeng, J.; Chen, W.; Wang, Y.; Gu, T.; Huang, C. Ecosystem services balance and its influencing factors detection in China: A case study in Chengdu-Chongqing urban agglomerations. Ecol. Indic. 2023, 151, 110330. [Google Scholar] [CrossRef]
- Zhao, X.; Tan, S.; Li, Y.; Wu, H.; Wu, R. Quantitative analysis of fractional vegetation cover in southern Sichuan urban agglomeration using optimal parameter geographic detector model, China. Ecol. Indic. 2024, 158, 111529. [Google Scholar] [CrossRef]
- Wang, G.; Peng, W.; Zhang, L.; Zhang, J. Quantifying the impacts of natural and human factors on changes in NPP using an optimal parameters-based geographical detector. Ecol. Indic. 2023, 155, 111018. [Google Scholar] [CrossRef]
- Song, Y.; Wang, J.; Ge, Y.; Xu, C. An optimal parameters-based geographical detector model enhances geographic characteristics of explanatory variables for spatial heterogeneity analysis: Cases with different types of spatial data. GIScience Remote Sens. 2020, 57, 593–610. [Google Scholar] [CrossRef]
- Ge, W.; Deng, L.; Wang, F.; Han, J. Quantifying the contributions of human activities and climate change to vegetation net primary productivity dynamics in China from 2001 to 2016. Sci. Total Environ. 2021, 773, 145648. [Google Scholar] [CrossRef]
- Yan, Y.; Liu, X.; Wen, Y.; Ou, J. Quantitative analysis of the contributions of climatic and human factors to grassland productivity in northern China. Ecol. Indic. 2019, 103, 542–553. [Google Scholar] [CrossRef]
- Fang, X.; Zhang, C.; Wang, Q.; Chen, X.; Ding, J.; Karamage, F. Isolating and quantifying the effects of climate and CO2 changes (1980–2014) on the net primary productivity in arid and semiarid China. Forests 2017, 8, 60. [Google Scholar] [CrossRef]
- Zhu, G.; Qiu, D.; Zhang, Z.; Sang, L.; Liu, Y.; Wang, L.; Zhao, K.; Ma, H.; Xu, Y.; Wan, Q. Land-use changes lead to a decrease in carbon storage in arid region, China. Ecol. Indic. 2021, 127, 107770. [Google Scholar] [CrossRef]
- Zhang, D.; Zhao, Y.; Wu, J. Assessment of carbon balance attribution and carbon storage potential in China’s terrestrial ecosystem. Resour. Conserv. Recycl. 2023, 189, 106748. [Google Scholar] [CrossRef]
- Lei, J.; Cui, W.; Zhu, J.; Zhang, R.; Zhao, J.; Zhang, J.; Zhang, X.; Sun, Z. Analysis of varying patterns and driving factors of GPP in Hainan Island during the past 20 years. J. Trop. Biol. 2024, 15, 42–51. [Google Scholar]
- Chen, L.; Liu, G.; Feng, X. Estimation of net primary productivity of terrestrial vegetation in China by remote sensing. Journal of Integrative. Plant Biol. 2001, 43, 1191. [Google Scholar]
- Xu, W.T.; Lin, J.Y.; Qiu, L.P.; Zhang, F.; Lai, R.W. Analysis of spatiotemporal characteristics and influencing factors of NPP in Chinese fir forests in Fujian Province. For. Engin. 2022, 38, 27–37. [Google Scholar]
- Xue, M.; Chen, Y.; Jia, L.; Wang, X.; Yan, M.; Tian, X. Estimation of net primary productivity by beps model-a case study in Fujian province. In Proceedings of the 2017 IEEE International Geoscience and Remote Sensing Symposium (IGARSS), Fort Worth, TX, USA, 23–28 July 2017. [Google Scholar]
- Ren, H.; Zhou, G. Measuring the impacts of anthropogenic activities on Inner Mongolian temperate grassland. Land Degrad. Dev. 2018, 29, 2942–2950. [Google Scholar] [CrossRef]
- Zhou, Y.-T.; Yan, J.-X.; Liu, J.; Wang, Y. Spatio-temporal Variation of NEP in Ecological Zoning on the Loess Plateau and Its Driving Factors from 2000 to 2021. Environ. Sci. Technol. 2023, 45, 2806–2816. [Google Scholar]
- He, T.; Dai, X.; Li, W.; Zhou, J.; Zhang, J.; Li, C.; Dai, T.; Li, W.; Lu, H.; Ye, Y.; et al. Response of net primary productivity of vegetation to drought: A case study of Qinba Mountainous area, China (2001–2018). Ecol. Indic. 2023, 149, 110148. [Google Scholar] [CrossRef]
- Wei, F.; Xiang, M.; Deng, L.; Wang, Y.; Li, W.; Yang, S.; Wu, Z. Spatiotemporal Distribution Characteristics and Their Driving Forces of Ecological Service Value in Transitional Geospace: A Case Study in the Upper Reaches of the Minjiang River, China. Sustainability 2023, 15, 14559. [Google Scholar] [CrossRef]
- Zhang, Y.; Zhang, C.; Wang, Z.; Chen, Y.; Gang, C.; An, R.; Li, J. Vegetation dynamics and its driving forces from climate change and human activities in the Three-River Source Region, China from 1982 to 2012. Sci. Total Environ. 2016, 563, 210–220. [Google Scholar] [CrossRef] [PubMed]
- Xue, P.; Liu, H.; Zhang, M.; Gong, H.; Cao, L. Nonlinear characteristics of NPP based on ensemble empirical mode decomposition from 1982 to 2015—A case study of six coastal provinces in southeast China. Remote Sens. 2021, 14, 15. [Google Scholar] [CrossRef]
- Wang, S.; Zhang, B.; Yang, Q.; Chen, G.; Yang, B.; Lu, L.; Shen, M.; Peng, Y. Responses of net primary productivity to phenological dynamics in the Tibetan Plateau, China. Agric. For. Meteorol. 2017, 232, 235–246. [Google Scholar] [CrossRef]
- Zhao, D.; Cai, J.; Shen, S.; Liu, Q.; Lan, Y. Nature-based solutions: Assessing the carbon sink potential and influencing factors of urban park plant communities in the temperate monsoon climate zone. Sci. Total Environ. 2024, 950, 175347. [Google Scholar] [CrossRef]
- Yang, C.; Li, G.; Yan, L.; Wu, J.; Li, J.; Liu, S.; Lu, Y. Effects of different vegetation types on ecosystem respiration in semiarid Loess Hilly Region, Central Gansu Province, China. Ecol. Indic. 2022, 145, 109683. [Google Scholar] [CrossRef]
- Dong, S.; Du, S.; Wang, X.-C.; Dong, X. Terrestrial vegetation carbon sink analysis and driving mechanism identification in the Qinghai-Tibet Plateau. J. Environ. Manag. 2024, 360, 121158. [Google Scholar] [CrossRef] [PubMed]
- You, C.; Wang, Y.; Tan, X.; Cui, E.; Zhang, B.; Bian, C.; Chen, B.; Xu, M.; Han, X.; Xia, J.; et al. Inner Mongolia grasslands act as a weak regional carbon sink: A new estimation based on upscaling eddy covariance observations. Agric. For. Meteorol. 2023, 342, 109719. [Google Scholar] [CrossRef]


| Data Types | NPP | Meteorological Data | Topographic Data | Land Use Data |
|---|---|---|---|---|
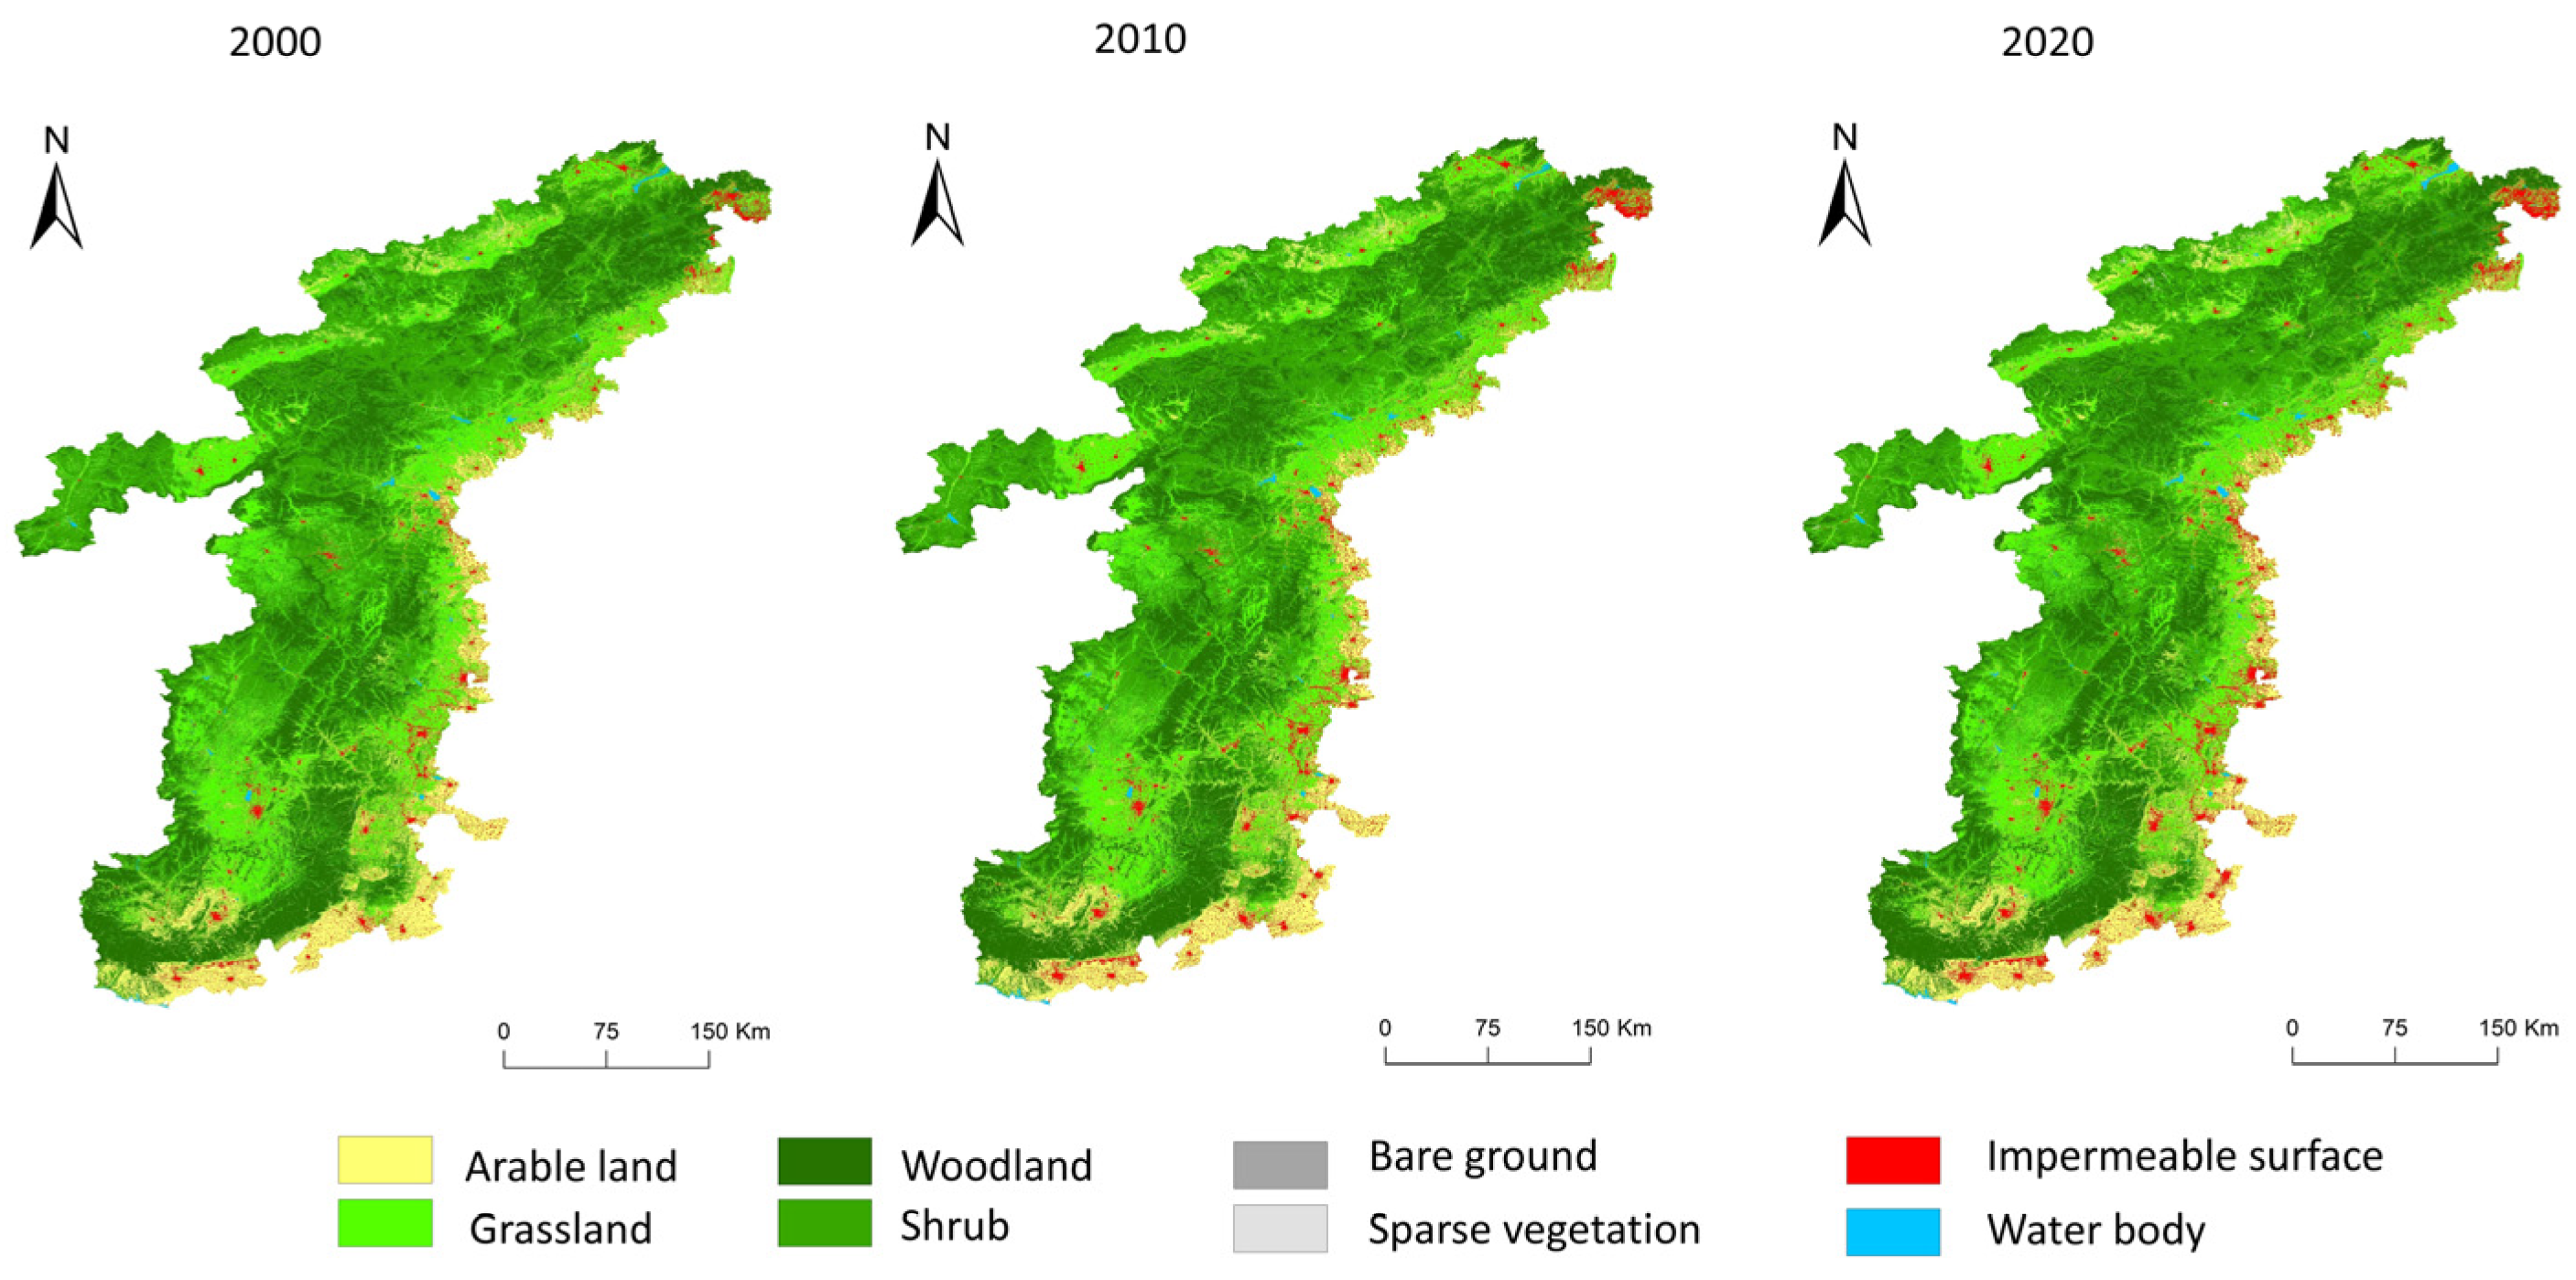
| Data Sources | MODIS Terra NPP data from the NASA Data Centre1 (MOD17A3HGF) | Temperature and precipitation data from the National Earth System Science Data Centre2, with a temporal resolution of 1 m and a spatial resolution of 1 km, both spanning the period 2000–2021. | Digital Elevation Model (DEM) data from NASA’s SRTM with a spatial resolution of 30 m; slope gradient and slope aspect data calculated based on the elevation data. | Derived from three phases of land use data for 2000, 2010 and 2020 at a resolution of 1 km from the Centre for Resource and Environmental Science and Data of the Chinese Academy of Sciences. |
| Slope | |Z| | Trend Type | Trend Feature |
|---|---|---|---|
| Slope > 0 | ≥2.58 | 2 | Significantly increased |
| ≥1.96 | 1 | increased | |
| <1.96 | 0 | Stable and unchanged | |
| Slope < 0 | ≥1.96 | −1 | decreased |
| ≥2.58 | −2 | Significantly decreased |
| Slope (NEP) | ≤−2 | −2–0 | 0–2 | 2–4 | 4–6 | ≥6 |
|---|---|---|---|---|---|---|
| Degree of Impact | Moderate inhibition | Slight inhibition | Slight contribution | Moderate contribution | Clear-Cut contribution | Extremely obvious contribution |
Disclaimer/Publisher’s Note: The statements, opinions and data contained in all publications are solely those of the individual author(s) and contributor(s) and not of MDPI and/or the editor(s). MDPI and/or the editor(s) disclaim responsibility for any injury to people or property resulting from any ideas, methods, instructions or products referred to in the content. |
© 2024 by the authors. Licensee MDPI, Basel, Switzerland. This article is an open access article distributed under the terms and conditions of the Creative Commons Attribution (CC BY) license (https://creativecommons.org/licenses/by/4.0/).
Share and Cite
Qu, Q.; Jian, S.; Chen, A.; Xiao, C. Investigating the Dynamic Change and Driving Force of Vegetation Carbon Sink in Taihang Mountain, China. Land 2024, 13, 1348. https://doi.org/10.3390/land13091348
Qu Q, Jian S, Chen A, Xiao C. Investigating the Dynamic Change and Driving Force of Vegetation Carbon Sink in Taihang Mountain, China. Land. 2024; 13(9):1348. https://doi.org/10.3390/land13091348
Chicago/Turabian StyleQu, Qiushi, Sihui Jian, Anguo Chen, and Chiwei Xiao. 2024. "Investigating the Dynamic Change and Driving Force of Vegetation Carbon Sink in Taihang Mountain, China" Land 13, no. 9: 1348. https://doi.org/10.3390/land13091348
APA StyleQu, Q., Jian, S., Chen, A., & Xiao, C. (2024). Investigating the Dynamic Change and Driving Force of Vegetation Carbon Sink in Taihang Mountain, China. Land, 13(9), 1348. https://doi.org/10.3390/land13091348