Abstract
Species distribution models (SDMs) have been widely used to project how species respond to future climate changes as forecasted by global climate models (GCMs). While uncertainties in GCMs specific to the Tibetan Plateau have been acknowledged, their impacts on species distribution modeling needs to be explored. Here, we employed ten algorithms to evaluate the uncertainties of SDMs across four GCMs (ACCESS-CM2, CMCC-ESM2, MPI-ESM1-2-HR, and UKESM1-0-LL) under two shared socioeconomic pathways (SSP2-4.5 and SSP5-8.5) at two time stages. We selected two endemic species of the Tibetan Plateau, Gentiana yunnanensis and G. siphonantha, distributed in the Hengduan Mountain regions of the southeast plateau and northeast plateau regions, respectively, as case studies. Under the two SSPs and two time periods, there are significant differences in the distribution areas of G. yunnanensis predicted by different GCMs, with some showing increases and others showing decreases. In contrast, the distribution range trends for G. siphonantha predicted by different GCMs are consistent, initially increasing and then decreasing. The CMCC-ESM2 model predicted the largest increase in the distribution range of G. yunnanensis, while the UKESM1-0-LL model predicted the greatest decrease in the distribution range of G. siphonantha. Our findings highlight that the four selected GCMs still lead to some variations in the final outcome despite the existence of similar trends. We recommend employing the average values from the four selected GCMs to simulate species potential distribution under future climate change scenarios to mitigate uncertainties among GCMs.
1. Introduction
The Tibetan Plateau and the adjacent mountain regions, renowned for their complex terrain, play a significant role in climate regulation, harbor extraordinarily high species richness, and are one of the world’s major biodiversity hotspots [1,2]. This region hosts diverse ecosystems and numerous endemic and rare species, providing irreplaceable ecosystem services and functions to humanity [3,4]. However, climate change poses a significant threat to biodiversity on the Tibetan Plateau, where climate warming is occurring at approximately twice the global average rate [5,6,7,8,9,10]. This dramatic climate change is expected to cause species to shift their distributions, potentially leading to extinctions, altered community compositions, biodiversity loss, and substantial damage to ecosystem services and functions [3,6,7,8,11,12,13,14,15]. Therefore, it is crucial to assess species’ responses to climate change on the Tibetan Plateau to inform conservation strategies and mitigate potential ecological impacts.
Species distribution models (SDMs) are widely used to forecast species’ responses to climate change using simulations of the future climate. Consequently, accurate climate simulation is the first step for modeling future species range shift. To facilitate the comparison of global coupled climate models within a unified framework, the World Climate Research Programme (WCRP) initiated the Coupled Model Inter-comparison Project (CMIP). Global climate models (GCMs) from CMIP are commonly used to simulate historical climate and project future climate under various emission scenarios [16]. Despite improvements in CMIP6, such as enhanced physical processes and higher spatial resolution [10], systematic biases remain, especially in high-altitude areas with complicated topography and limited observed climate data, like the Tibetan Plateau [17,18]. For instance, several GCMs (e.g., IPSL-CM6A-LR, CanESM5, FGOALS-g3, NorESM2-LM, E3SM-1-1, E3SM-1-1-ECA, KACE-1-0-G, GISS-E2-1-G, MIROC6, MCM-UA-10, and MIROC-ES2L) show relatively large biases in simulating temperatures, while others (e.g., NorCPM1 and MCM-UA-1-0 GCMs) have biases in rainfall simulation [17]. Some models, such as BCC-CSM2-MR and CMCC-CM2-SR5, capture the ecosystem response to climate well in regions other than the Tibetan Plateau [19]. However, certain GCMs demonstrate better performance in simulating the Tibetan Plateau’s climate. Models like MPI-ESM1-2-HR, ACCESS-CM2, UKESM1-0-LL, CMCC-ESM2, NESM3, CESM2, and HadGEM3-GC3.1-LL perform well in simulating temperatures [18,20]. For precipitation simulation, the MRI-ESM2-0, MPI-ESM1-2-HR, NorESM2-LM, EC-Earth3-Veg, and CanESM5 models show good performance [17].
Previous studies on species distribution in the Tibetan Plateau have used various approaches to mitigate the uncertainties from future climate simulation. Some studies employed averaged data from numerous GCMs [21,22,23], such as a study predicting potential range shift of 151 plant species in the Hengduan Mountains and their surrounding areas using averaging data from 19 GCMs under CMIP5 [21]. Some studies selected specific sets of GCMs, like a study utilizing five CMIP5 models to predict the response of the endemic seed plants to future climate change in the Tibetan Plateau [22,23]. Others relied on only a single GCM reported to simulate the Tibetan Plateau’s climate well [24,25]. Despite these diverse approaches, none of these studies thoroughly explored the uncertainties resulting from different GCM selections, highlighting a gap in understanding how model choice impacts species distribution predictions in this region.
To address potential systematic biases in future climate simulation for the Tibetan Plateau, we selected four CIMP6 GCMs (ACCESS-CM2, CMCC-ESM2, MPI-ESM1-2-HR, and UKESM1-0-LL) that have demonstrated good performance in simulating temperature or precipitation in this region and are available from public databases [17,18,20,26]. The limited selection balances accuracy with computational efficiency. We focus on two Gentiana species endemic to the Tibetan Plateau, G. yunanensis (Hengduan Mountain regions of the southeast plateau) and G. siphonantha (the northeast of the plateau). Gentiana species have a long history of medicinal use in Tibet, with various pharmacological benefits [27,28]. Using species distribution modeling with ten algorithms, we assessed the uncertainties of GCMs in projecting range shift of these two species under two shared socioeconomic pathways for the future periods of 2041–2060 and 2081–2100.
2. Materials and Methods
2.1. Study Area
The study area encompassed the Tibetan Plateau (77° E to 106° E and 24° N to 41° N) (Figure 1). This region boasts significant glacial permafrost with an average altitude exceeding 4000 m [3]. The complex interplay of atmospheric circulation and topography results in the diverse climate conditions observed across the Tibetan Plateau, ranging from cold–arid in the north to warm–humid in the southeast [29]. Vegetation distribution varies accordingly, with forests dominating the southern regions and grassland and desert steppes prevalent in the north [30].
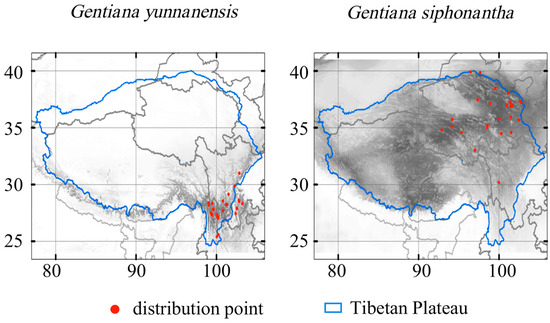
Figure 1.
Occurrences of the two species and their habitat suitability in the current climate. Color from white to black represents suitability from 0 to 1.
2.2. Species Data
G. yunnanensis grows in dry grasslands, meadows, shrublands, and riverbanks, at altitudes ranging from 1800 to 4500 meters in the Hengduan Mountainous Region in the southeast of the Tibetan Plateau, and the flowering and fruiting period is from August to October [31]. It is used in ethnic medicine for heat-clearing, detoxification, cough suppression, and throat moistening [32]. G. siphonantha grows on mountain slopes, roadsides, alpine meadows, shrublands, and in forests, at altitudes ranging from 2300 to 4400 meters in the northeast of the plateau, and the flowering and fruiting period is from July to September [31]. It is traditionally used as a local medicinal herb for dispelling wind-dampness, clearing damp-heat, and relieving pain [33].
We collected distribution records of G. yunnanensis and G. siphonantha from herbarium specimens sourced from the National Specimen Information Infrastructure (NSII, http://www.nsii.org.cn/, accessed on November 2021). A total of 586 specimen records were obtained, with 294 records of G. yunnanensis and 292 records of G. siphonantha. To ensure the accuracy of the distribution data, the collected specimens were carefully screened, with records containing unclear information, coordinates out of bounds, or duplicates being removed. For those specimens lacking coordinate information, we used the recorded locality, habitat, and altitude of the specimen to determine coordinates with the aid of tools, such as the Baidu Map picking coordinate system (https://api.map.baidu.com/lbsapi/getpoint/index.html, accessed on November 2021) and Google satellite maps. The final data include 31 valid records of G. yunnanensis and 27 valid records of G. siphonantha at a spatial resolution of 30 arc seconds (Figure 1).
2.3. Climate and Environment Data
We obtained 19 bioclimatic variables from the WorldClim global climate database (https://worldclim.org/, ver. 2.1, accessed on 23 February 2023) under the current climate at a spatial resolution of 30 arc seconds. This dataset was generated from a temporal range of 1970–2000. We cropped this global dataset to the study area using the crop function from the raster package in R [34].
We selected four variables: the maximum temperature of the warmest month (Bio_05), the minimum temperature of the coldest month (Bio_06), the wettest season precipitation (Bio_16), and the driest season precipitation (Bio_17). These extreme climatic variables have significant implications for plant survival and distribution. Moreover, the absolute values of the Pearson correlation coefficients of these variables with each other are less than 0.8, mitigating the influence of multicollinearity on species distribution modeling (Figure A1).
We also included soil coarse fragment volume, obtained from the SoilGrids database (https://www.isric.org/explore/soilgrids, accessed on 22 April 2019), to enhance the predictive performance of the SDM. This variable was found to be closely associated with Gentiana species distribution [35]. The absolute values of its Pearson correlation coefficients with the four aforementioned climate variables are all below 0.75.
2.4. Global Climate Models
To assess the uncertainties of GCMs on species distribution modeling in the Tibetan Plateau, we utilized four high-resolution GCMs (ACCESS-CM2, CMCC-ESM2, MPI-ESM1-2-HR, and UKESM1-0-LL) under two available shared socioeconomic pathways (medium radiative forcing scenario SSP2-4.5 and high radiative forcing scenario SSP5-8.5) and two future time periods (2041–2060 and 2081–2100). These four GCMs were evaluated to have good performance in simulating the spatial distribution of climate in the Tibetan Plateau. The bioclimatic variables for the above future scenarios were generated using monthly future temperature and precipitation and obtained from the WorldClim global climate database too.
To generate an ensemble future climate, we used the “Mosaic To New Raster” tool in ArcMap 10.8 to average the data of Bio_05, Bio_06, Bio_16, and Bio_17 originating from the four GCMs.
2.5. Species Distribution Modeling
For species with fewer distribution points, the performance of ensembles of small models (ESMs) is superior to that of standard SDMs [36]. Therefore, we chose to use the ESM approach for species distribution prediction with the R package “ecospat” [37]. Six modeling methods were selected, including artificial neural networks (ANNs), generalized additive models (GAMs), generalized linear models (GLMs), multivariate adaptive regression (MARS), maximum entropy (MaxEnt), and random forest (RF). These methods were chosen as they represent a diverse range of model types and have been commonly applied in species distribution modeling studies [21,22,23,38,39].
For different models, we used varying numbers of pseudo-absence points according to [40]. Specifically, for GLM and GAM, the number of pseudo-absence points was set to 16 times the number of presence points. For the other four models (ANN, MARS, MaxEnt, and RF), the number of pseudo-absence points was set to 2 times the number of presence points. And all pseudo-absence points were generated using a random sampling method. Species occurrences and pseudo-absence points were divided into calibration and validation datasets using 10-fold cross-validation, repeated 3 times. Then, the Boyce index and Somer’s D index were used as weights for the ecospat.ESM.Modeling function and ecospat.ESM.EnsembleModeling function, thus completing the calibration and ensemble of the bivariate models. Finally, the model performance was evaluated using the Receiver Operating Characteristic curve (AUC) and Boyce index.
As ESMs including different modeling techniques did not clearly improve model performance compared to single-technique ESMs [36], we selected the best models for each species for subsequent species distribution predictions based on the AUC evaluation results. The ecospat.ESM.Projection and ecospat.ESM.EnsembleProjection functions were used to project and predict species habitat suitability with the previously constructed ESMs. Then, the ecospat.ESM.threshold function was used to extract thresholds for binary projections.
3. Results
3.1. Model Performance
According to the AUC evaluation results, for G. yunnanensis, the Boyce-weighted GLM performed the best, while for G. siphonantha, the Boyce-weighted MaxEnt performed the best. The Boyce evaluation results were inconsistent with the AUC evaluation results. However, based on the Boyce evaluation, the best model for G. siphonantha was the Somer’s D-weighted MARS. Since this result did not align with the empirical data, the Boyce evaluation results were not used as the criterion for model selection.
3.2. Current Potential Distribution
We calculated the climatic niche for each species, represented by the average values of four variables used in the species distribution modeling (Bio_5, Bio_6, Bio_16, and Bio_17), as well as the mean annual temperature (Bio_1) and annual precipitation (Bio_12) at each distribution point, and the maximum and minimum values were also retained (Table 1). Both species inhabit typical alpine regions with mean annul temperatures less than 10 °C. However, G. siphonantha grows in areas having shorter growing seasons with much cooler (Bio_1 < 0 °C) and drier climates (Bio_12 < 400 mm) compared to G. yunnanensis.

Table 1.
Climatic niche represented by mean and range (in brackets) of each climate variable for two Gentiana species.
Under the current climate, the habitat suitability is especially high in the Hengduan Mountain regions with extension to the Himalayas for G. yunnanensis (Figure 1). The potential distribution for G. siphonantha is primarily located in the north of Yunnan and the south of Sichuan, with sporadic distribution in the southeastern part of Tibet (Figure 1).
3.3. Future Potential Distribution Simulations
3.3.1. Impacts of GCMs on SDM
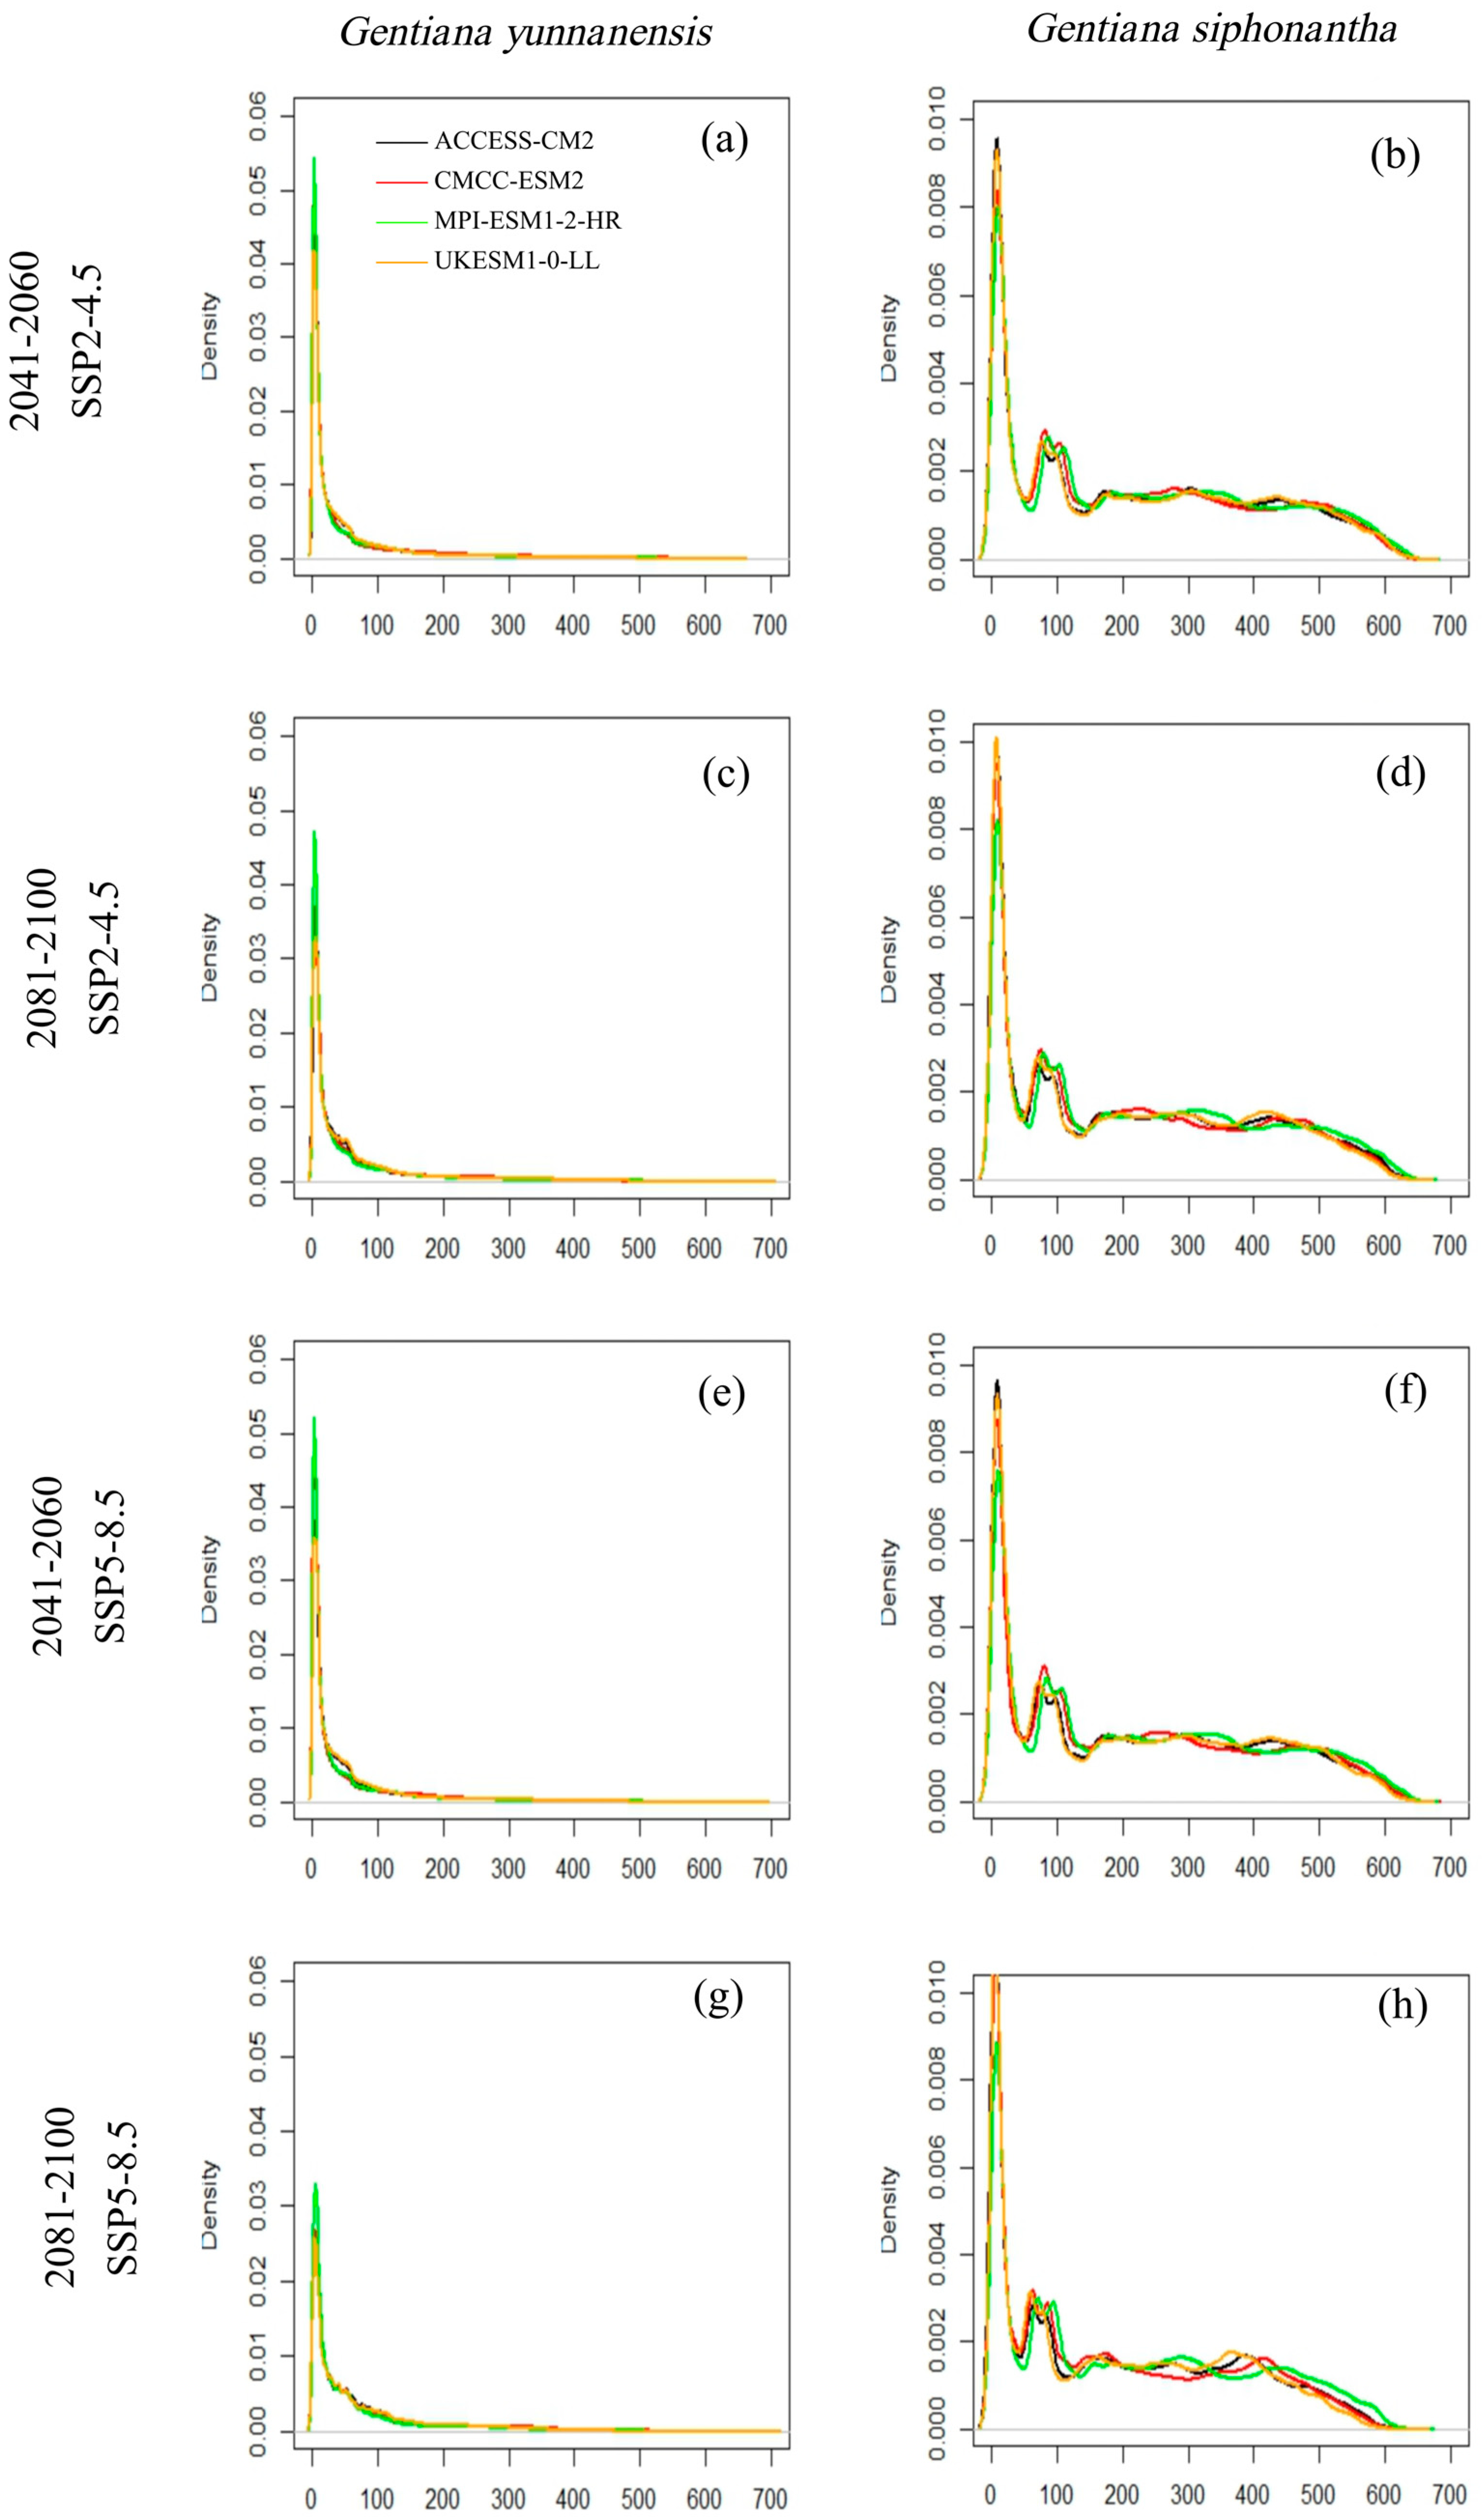
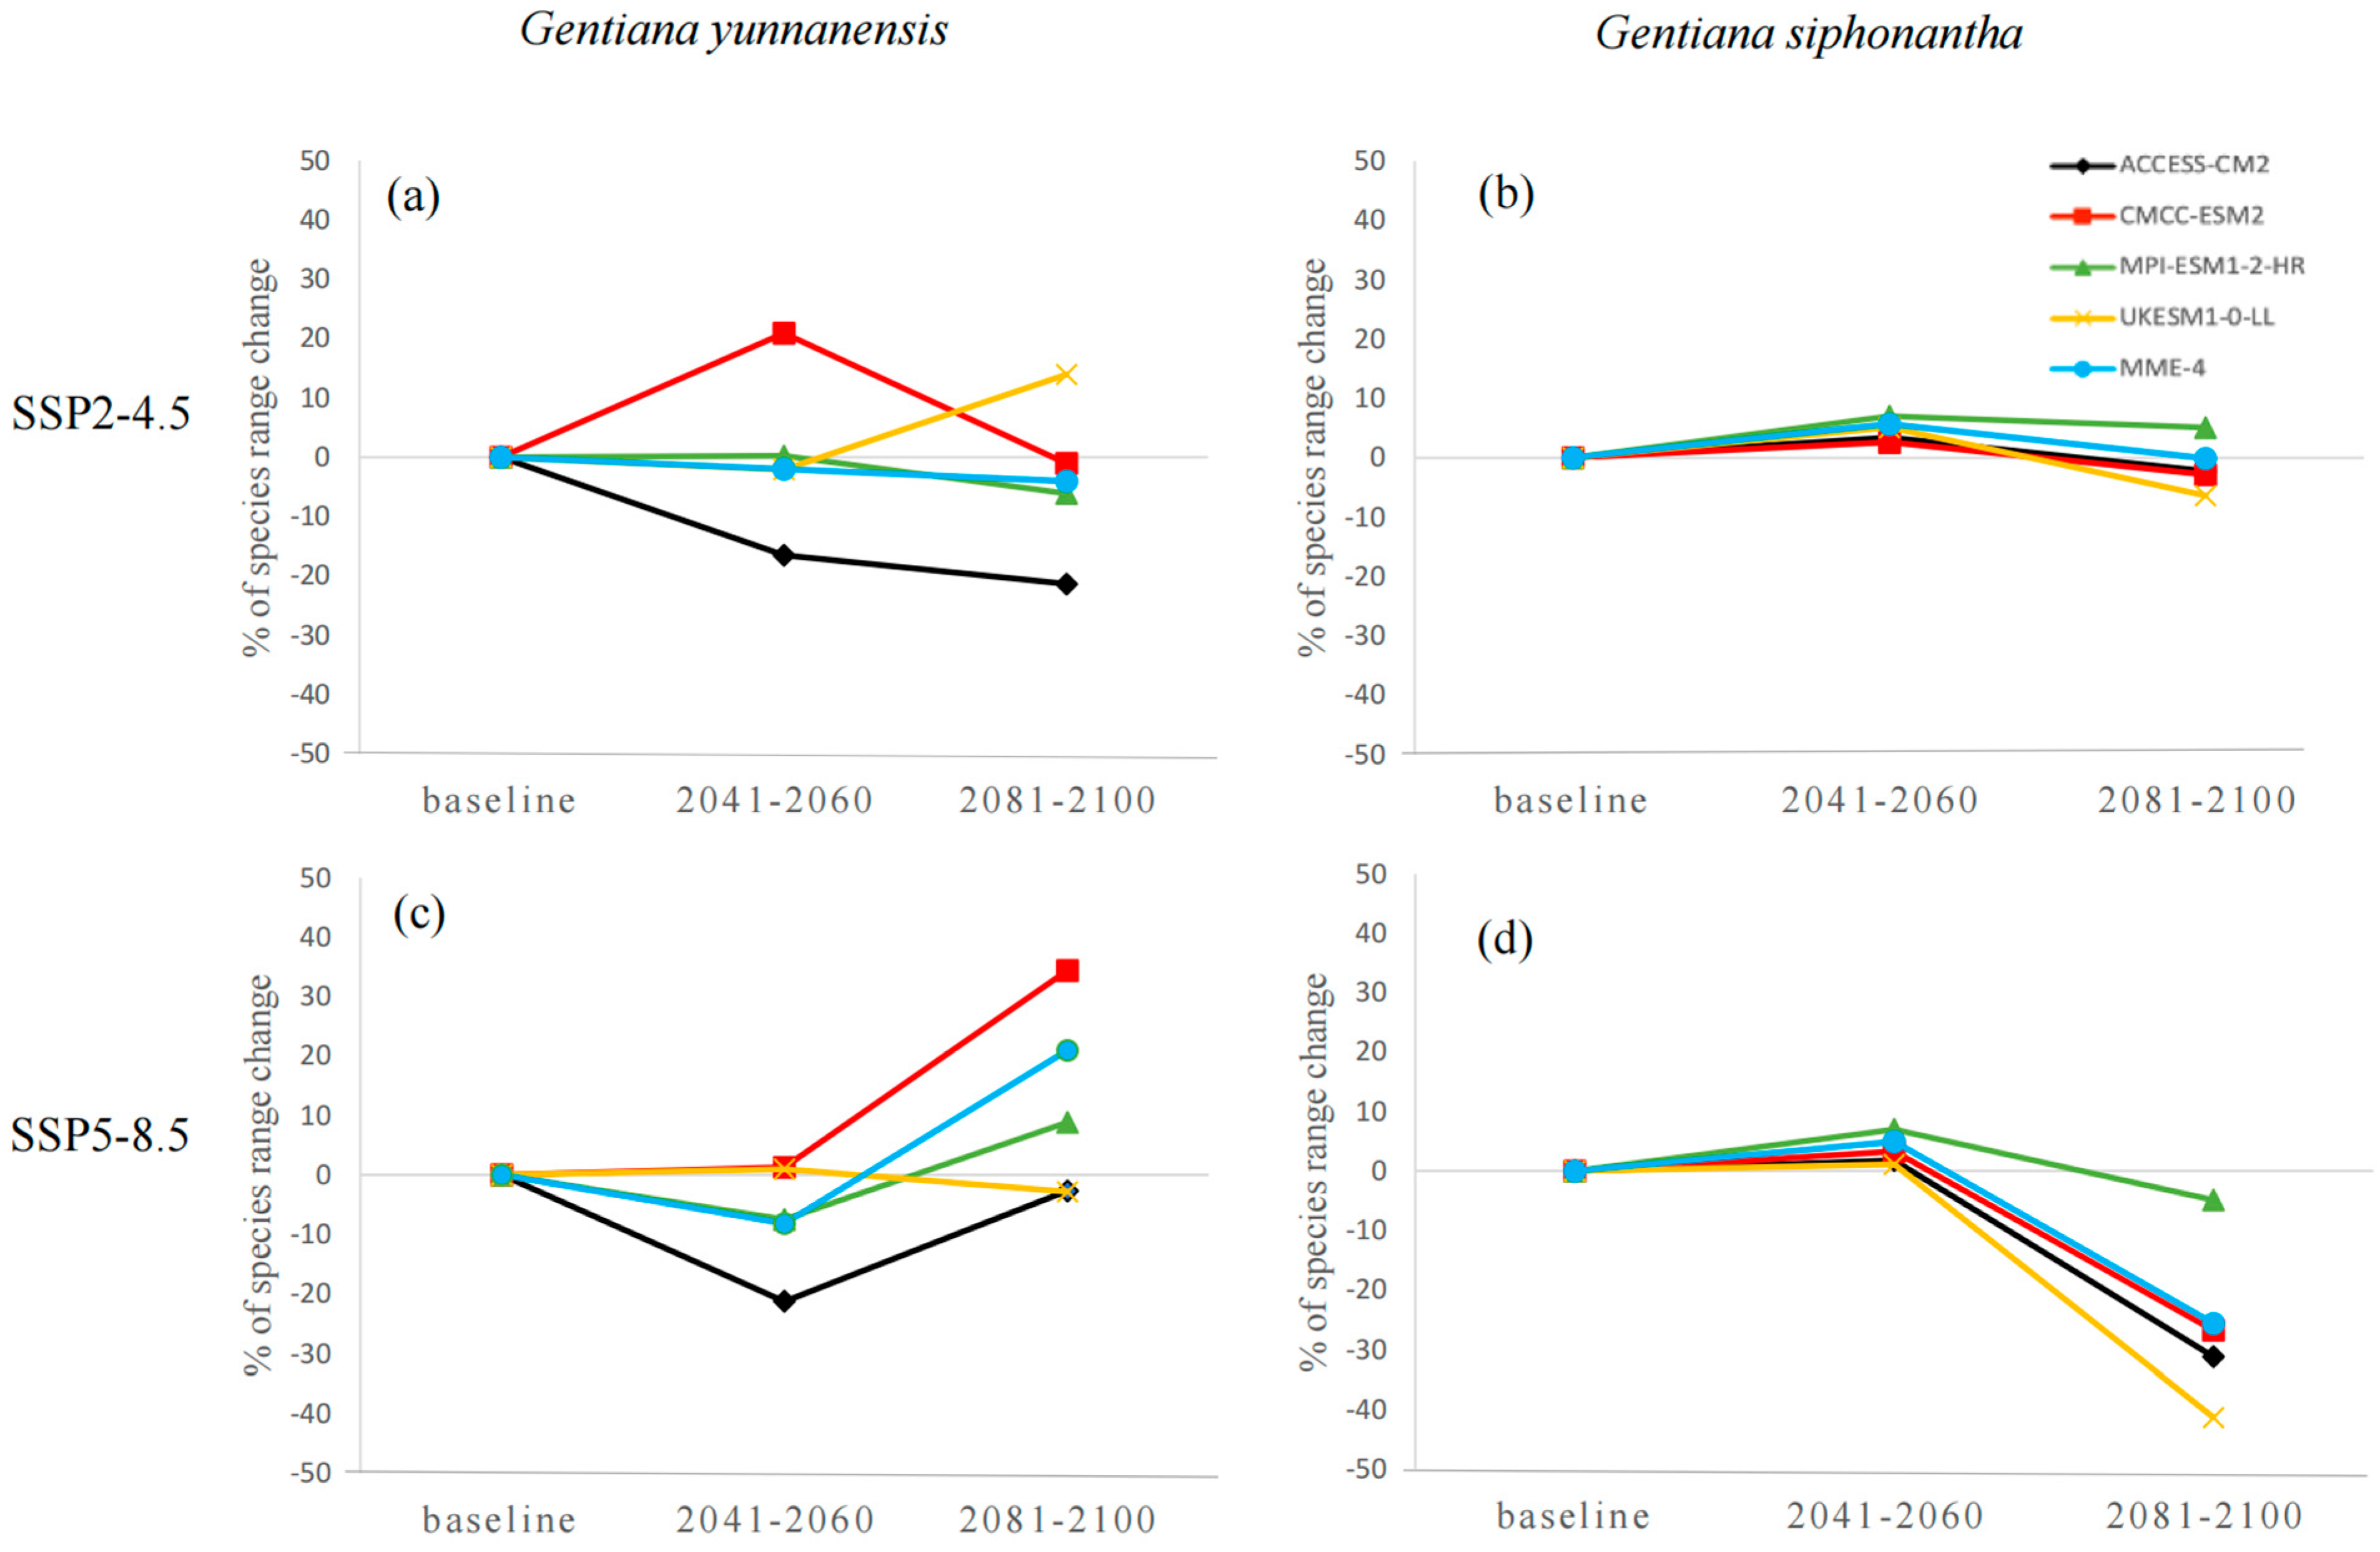
The habitat suitability varies across different GCMs and SSP scenarios for both species, and the discrepancies are relatively more apparent for G. siphonantha (Figure 2). For G. yunnanensis, compared to the current climate, the ACCESS-CM2 and CMCC-ESM2 models show the greatest changes, while the ensemble climate model (MME-4) and MPI-ESM1-2-HR models exhibit similar changes (Figure 3a,c). Among the four GCMs, the CMCC-ESM2 model predicts the largest increase in range size under the SSP2-4.5 scenario during the 2081–2100 period, whereas the ACCESS-CM2 model predicts the largest decrease in range size under the SSP5-8.5 scenario during the same period (Table A1). In contrast, the suitable range for G. siphonantha generally shows an initial expansion followed by contraction under most scenarios, and most of the projected future suitable areas have decreased range sizes compared to the present (Table A2).
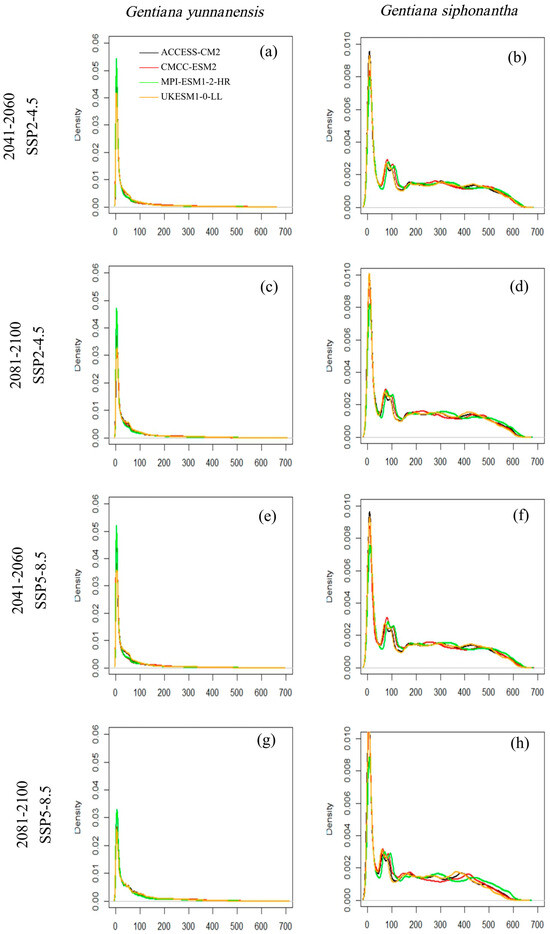
Figure 2.
(a–h) The probability density (y-axis) of habitat suitability (x-axis) for four GCMs and two SSPs for Gentiana yunnanensis and G. siphonantha.
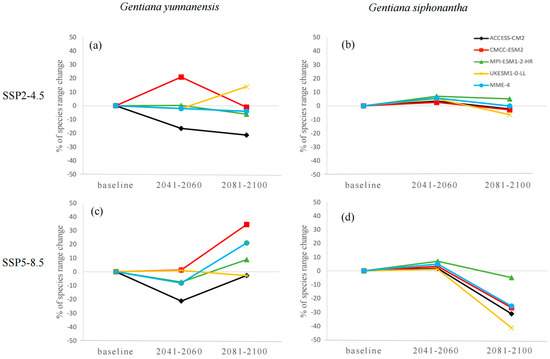
Figure 3.
(a–d) Variations in the potential distribution range of two species.
3.3.2. Range Shift under Future Climate Change with MME-4
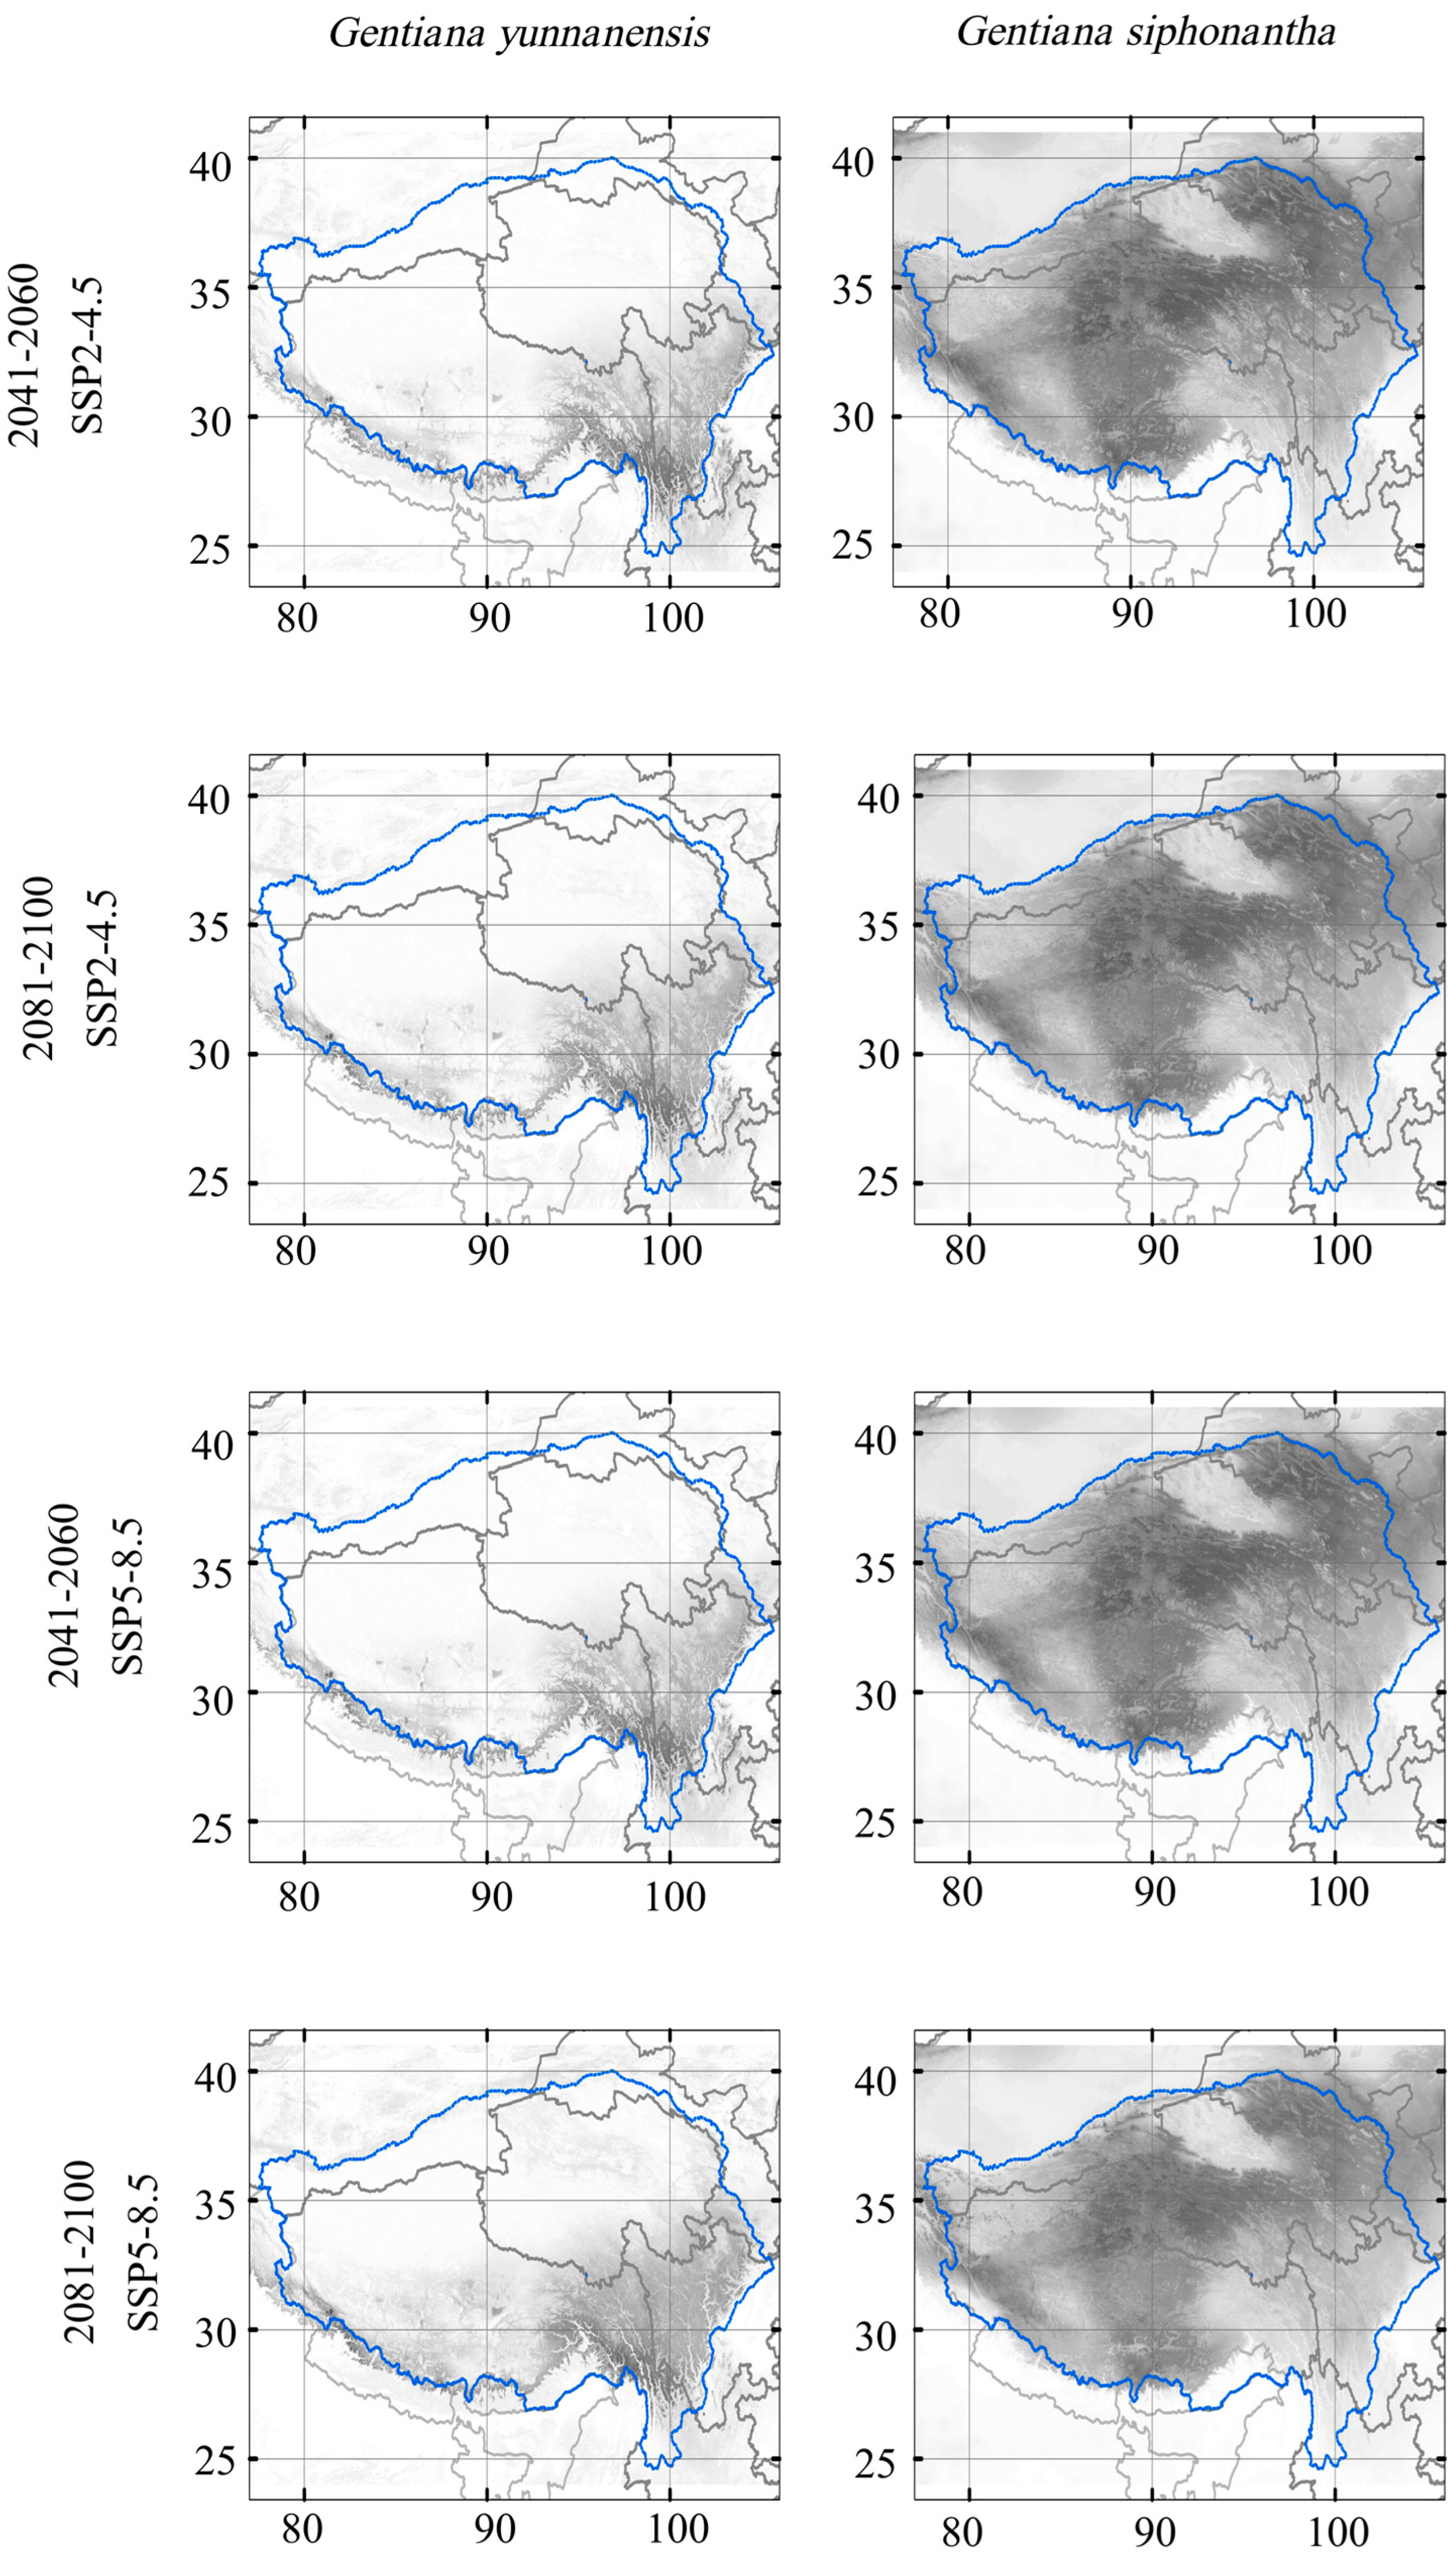
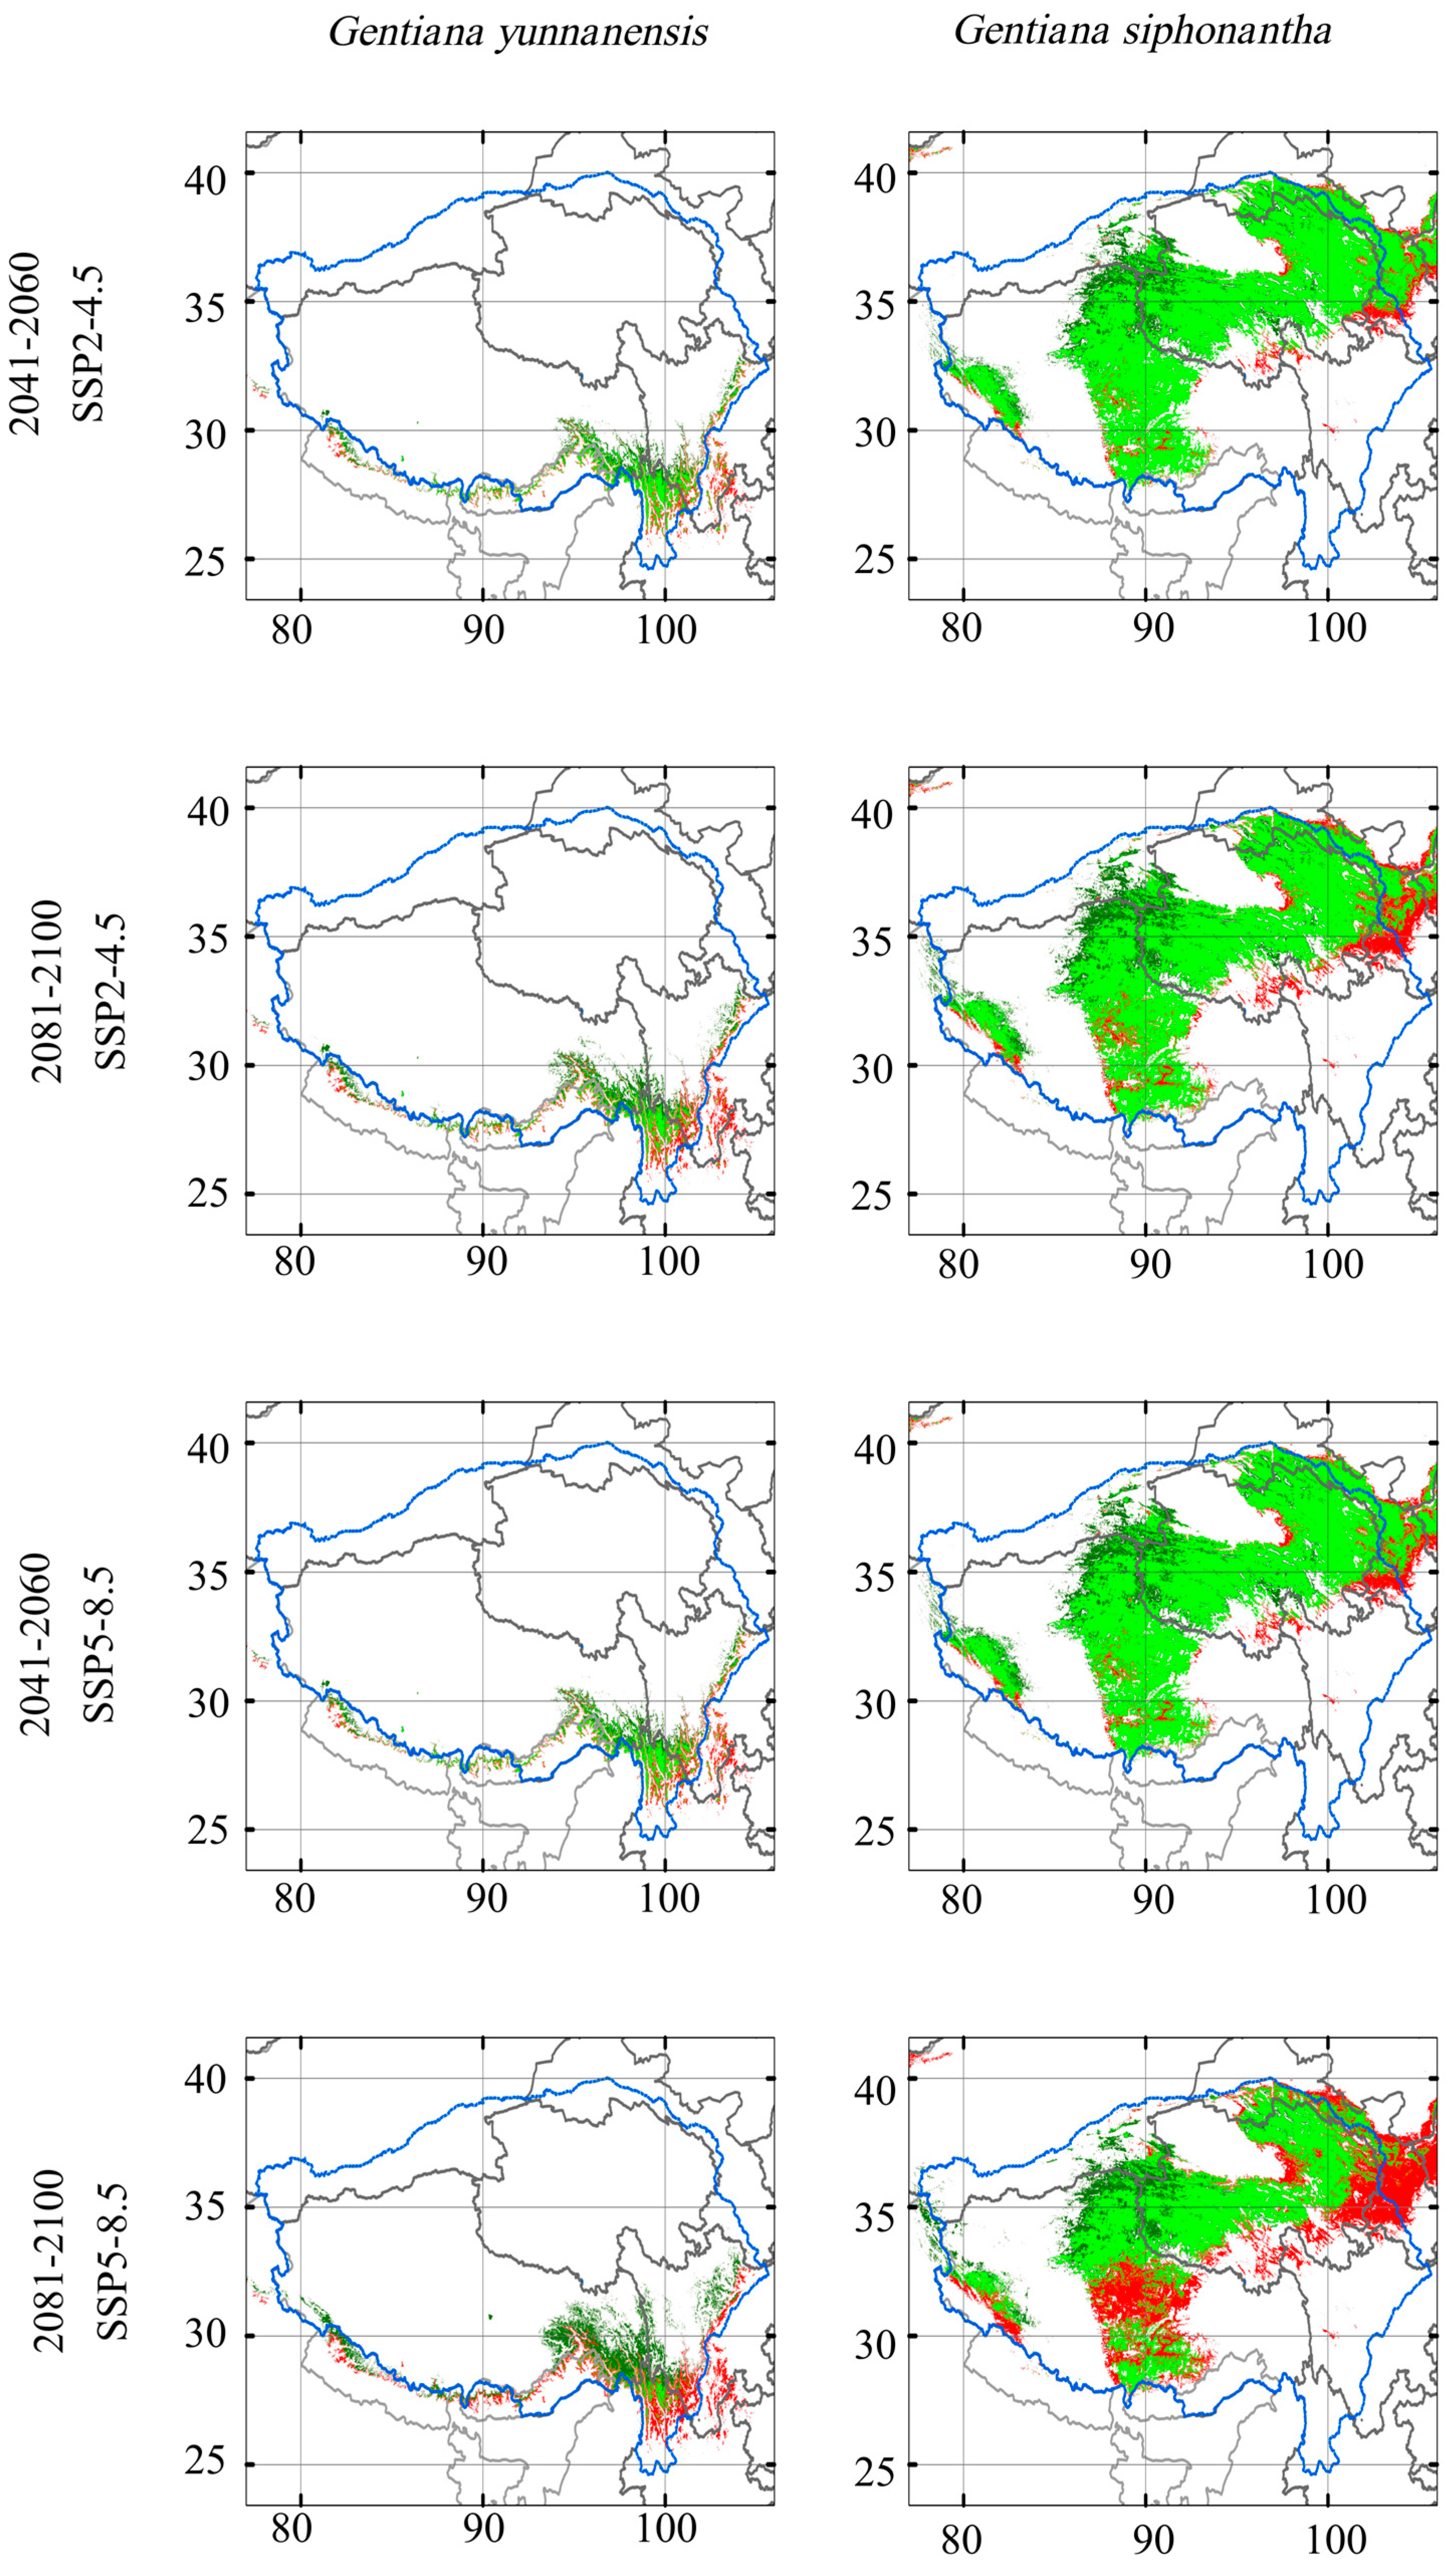
Our results based on MME-4 data predicted a northwestward shift in the suitable area for G. siphonantha and G. yunnanensis under both climate change scenarios and two periods (Figure 4 and Figure 5). Potential suitable area loss increases through time and most grievously under the SSP5-8.5 scenario (Table 2). Over 70% of present suitable areas will be lost in the period of 2081–2100 under SSP5-8.5 for G. yunnanensis, while the loss of suitable areas for G. siphonantha is relatively less severe, at less than 40%. However, at the same time, the increase in suitable habitat range for G. yunnanensis is significantly greater than that for G. siphonantha (Table 2). The changes in suitable area for G. yunnanensis, including both increases and decreases due to various GCM simulations, are generally larger than those for G. siphonantha, resulting in more overall changes in the final suitable area (Table A1 and Table A2). For both species (Figure 5), the areas of increased potential habitat are primarily found in its north and west part, while areas of contraction are mainly observed in its south and east part. Successful migration is the key to future range size expansion, and the magnitude of migration in the high-development pathway (SSP5-8.5) is greater than that in the moderate-development pathway (SSP2-4.5).
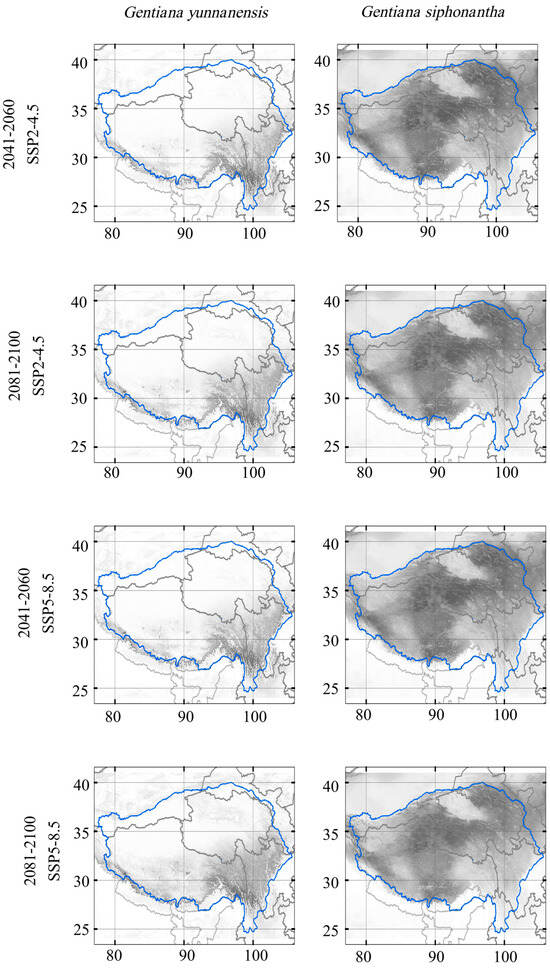
Figure 4.
Projected habitat suitability of the two species in the future scenarios. Color from white to black represents suitability from 0 to 1. The blue circle represents the Tibetan Plateau region.
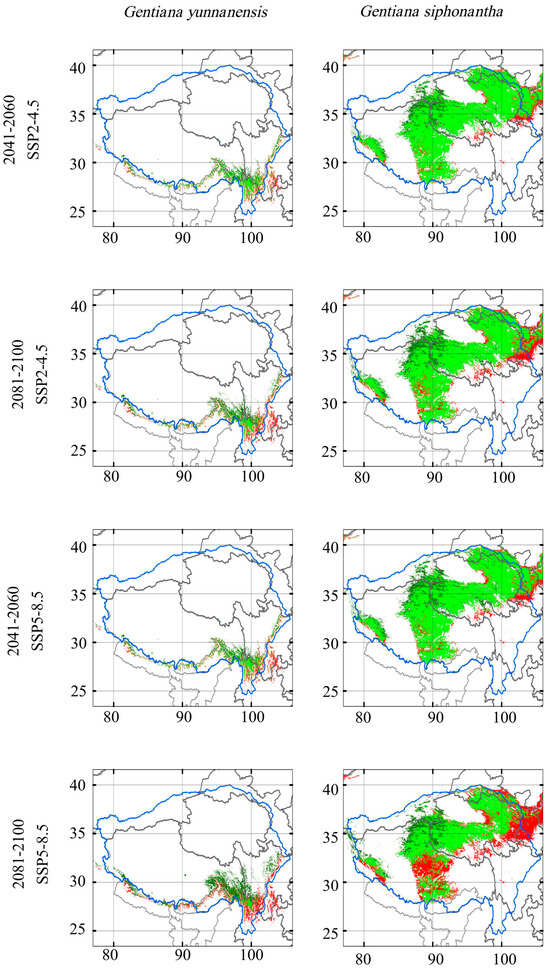
Figure 5.
Simulated potential distribution range shift in the future based on MME-4 data. A value of 1 (red) indicates a suitable area that exists in the current scenario but is lost in the future scenario; 0 (light green) indicates a suitable area that exists in the current scenario and remains in the future scenario; −1 (white) indicates an area that is not suitable in both the current and future scenarios; and −2 (dark green) indicates an area that is not suitable in the current scenario but becomes suitable in the future scenario. The blue circle represents the Tibetan Plateau region.
Table 2.
Changes in potential suitable areas under MME-4.
4. Discussion
This study specifically examined the uncertainties associated with the selection of GCMs and SSPs in projecting the future distributions of two alpine plant species, G. yunnanensis and G. siphonantha, on the Tibetan Plateau. The results demonstrate the variability in the projected future habitat suitability across different GCMs and SSP scenarios. The mean value of the four GCMs (MME-4) indicates that habitat area changes for both species are minimal under the SSP2-4.5 scenario. However, under the SSP5-8.5 scenario, habitat area changes are more significant, with G. yunnanensis increasing by approximately 20% and G. siphonantha decreasing by about 25%. The findings of this study indicate that the potential habitats of both G. yunnanensis and G. siphonantha are projected to shift northwards over time, consistent with the expected migration of alpine species in response to climate warming. However, the species in southern mountainous region might face higher extinction risk due to the limited climatic suitable areas and the mountains hindering their northward dispersal [41,42]. Meanwhile, the large high-altitude regions in the northern part provide large suitable areas for the species to move northward. Continued monitoring and adaptive management strategies will be crucial to ensure the long-term persistence of these vulnerable species under the projected climate changes.
These findings highlight the importance of considering multiple climate models and scenarios when forecasting species’ future distributions, as reliance on a single GCM or SSP can introduce significant biases [38,43]. In this study, the CMCC-ESM2 model predicted the largest increase in the suitable distribution range of G. yunnanensis under the two SSP scenarios, while the ACCESS-CM2 model predicted the greatest decrease. For G. siphonantha, the MPI-ESM1-2-HR model predicted the largest increase in the suitable distribution range, while the UKESM1-0-LL model predicted the greatest decrease. However, the changes for G. siphonantha were not as pronounced as those for G. yunnanensis. These results emphasize the uncertainties associated with different GCMs in species distribution modeling across different carbon emission scenarios and two time periods. This highlights the need for careful GCM selection to avoid overestimating or underestimating the potential impacts of climate change, regardless of the selected SSP scenario or timeframe. Previous studies based on only a single GCM should be interpreted with caution, as they may not accurately capture the full range of potential outcomes [38,43,44].
The selection of GCMs can affect the simulation of species’ future distributions and consequently impact the determination of conservation priorities and the assessment of the extinction risk of species. For example, the future shifts in the hotspots for rare saproxylic beetles were predicted using five GCMs under different future scenarios, revealing that the existing protected areas would be inadequate for their conservation [45]. Similarly, the geographic distribution of Manihot walkerae was predicted using three GCMs and two carbon emission scenarios to identify areas suitable for future conservation efforts [46]. Our research demonstrates that the forecasted species distribution can vary across different GCMs, sometimes even producing contradictory results, which poses significant challenges for conservation planning. Therefore, when using GCMs for modeling future species distributions and planning conservation priority area, it is crucial to first screen for appropriate GCMs and consider their uncertainties.
Ensemble climate data from a carefully selected subset of GCMs can help to mitigate the uncertainties of different GCMs because this approach has demonstrated better performance in simulating the seasonality and spatial distribution of climate [26,47]. Ensemble GCMs can help mitigate biases present in climate simulations of individual models, balancing out extreme scenarios. This is particularly important in complex environments like the Tibetan Plateau, where the climate system is influenced by the interplay of high elevation, topographic heterogeneity, multiple monsoon systems, diverse land cover and land use patterns, and climatic extremes. And only sparse weather data coverage is available here. This complexity poses substantial challenges for climate scientists, making it difficult to develop accurate and reliable climate projections for the region. This underscores the importance of carefully selecting and combining multiple climate models in an ensemble approach, as discussed earlier, to better represent the inherent uncertainties and complexities of the Tibetan Plateau’s climate system. By doing so, researchers and policymakers can develop more robust and reliable projections to guide decisions related to climate change adaptation, resource management, and environmental conservation in this critically important region.
Despite the valuable insights provided by this study, we acknowledged several limitations that have been suggested to have influence on the accuracy of species distribution models in previous studies [36,48]. First of all, the two studied species, being nearly threatened or vulnerable, have limited occurrence records and restricted distributions. Although we used the ensembles of small models method, potential overfitting may still occur during the modeling process. The results also varied across different modeling techniques. Future research should explore strategies like small ensemble models to address the challenges of modeling distributions for rare or poorly sampled species. Second, due to limited computational resources, we were only able to model two species. Our findings revealed contrasting future distribution ranges between species in southern mountain regions and northern plateau regions. However, the generality of these patterns needs to be verified in future studies involving a larger number of species to better guide conservation planning. Third, we considered only four available GCMs in this study. While these models provided valuable insights, the guidance on selecting the most appropriate GCMs from a diverse set remains to be explored.
5. Conclusions
Against the background of ongoing global climate change, this study selected the Qinghai–Tibet Plateau endemic species G. yunnanensis and G. siphonantha as examples to assess the uncertainties associated with predicting species distribution by using multiple GCMs. Our findings highlight that despite similar overall trends, the four GCMs still led to some variations in the final outcomes under different carbon emission scenarios and time periods. Therefore, when establishing species distribution models, it is important to incorporate multiple GCMs to better capture the potential distribution and the associated uncertainties. This approach is vital for developing robust conservation and management strategies in the face of climate change. Ensemble climate data from four GCMs predicted a northwestward shift in the suitable area for G. siphonantha and G. yunnanensis under both climate change scenarios and two periods. Successful migration is the key to species survival and range size expansion in the future.
Author Contributions
Conceptualization, X.C. and X.X.; methodology, Y.S. and S.Z.; validation, Y.S. and S.Z.; writing—original draft preparation, Y.S. and S.Z.; writing—review and editing, X.C. and X.X.; supervision, X.C. and X.X. All authors have read and agreed to the published version of the manuscript.
Funding
This research was funded by the Scientific and Technological Innovation Project of China Academy of Chinese Medical Sciences (CI2021A03908), the National Natural Science Foundation of China (82173930), and the Natural Science Foundation of Sichuan Province (2023NSFSC1280).
Data Availability Statement
Species distribution data and associated codes used in the study are openly available at https://github.com/Xiaoting-Xu/Uncertainty-Assessment-of-SDM-on-the-Tibetan-Plateau.
Acknowledgments
We would like to thank Chunlin Chen and Lei Zhang from Sichuan University for providing distribution data from their field investigation.
Conflicts of Interest
The authors declare no conflicts of interest.
Appendix A

Figure A1.
Pearson correlation analysis plot between 19 bioclimatic variables.
Figure A1.
Pearson correlation analysis plot between 19 bioclimatic variables.
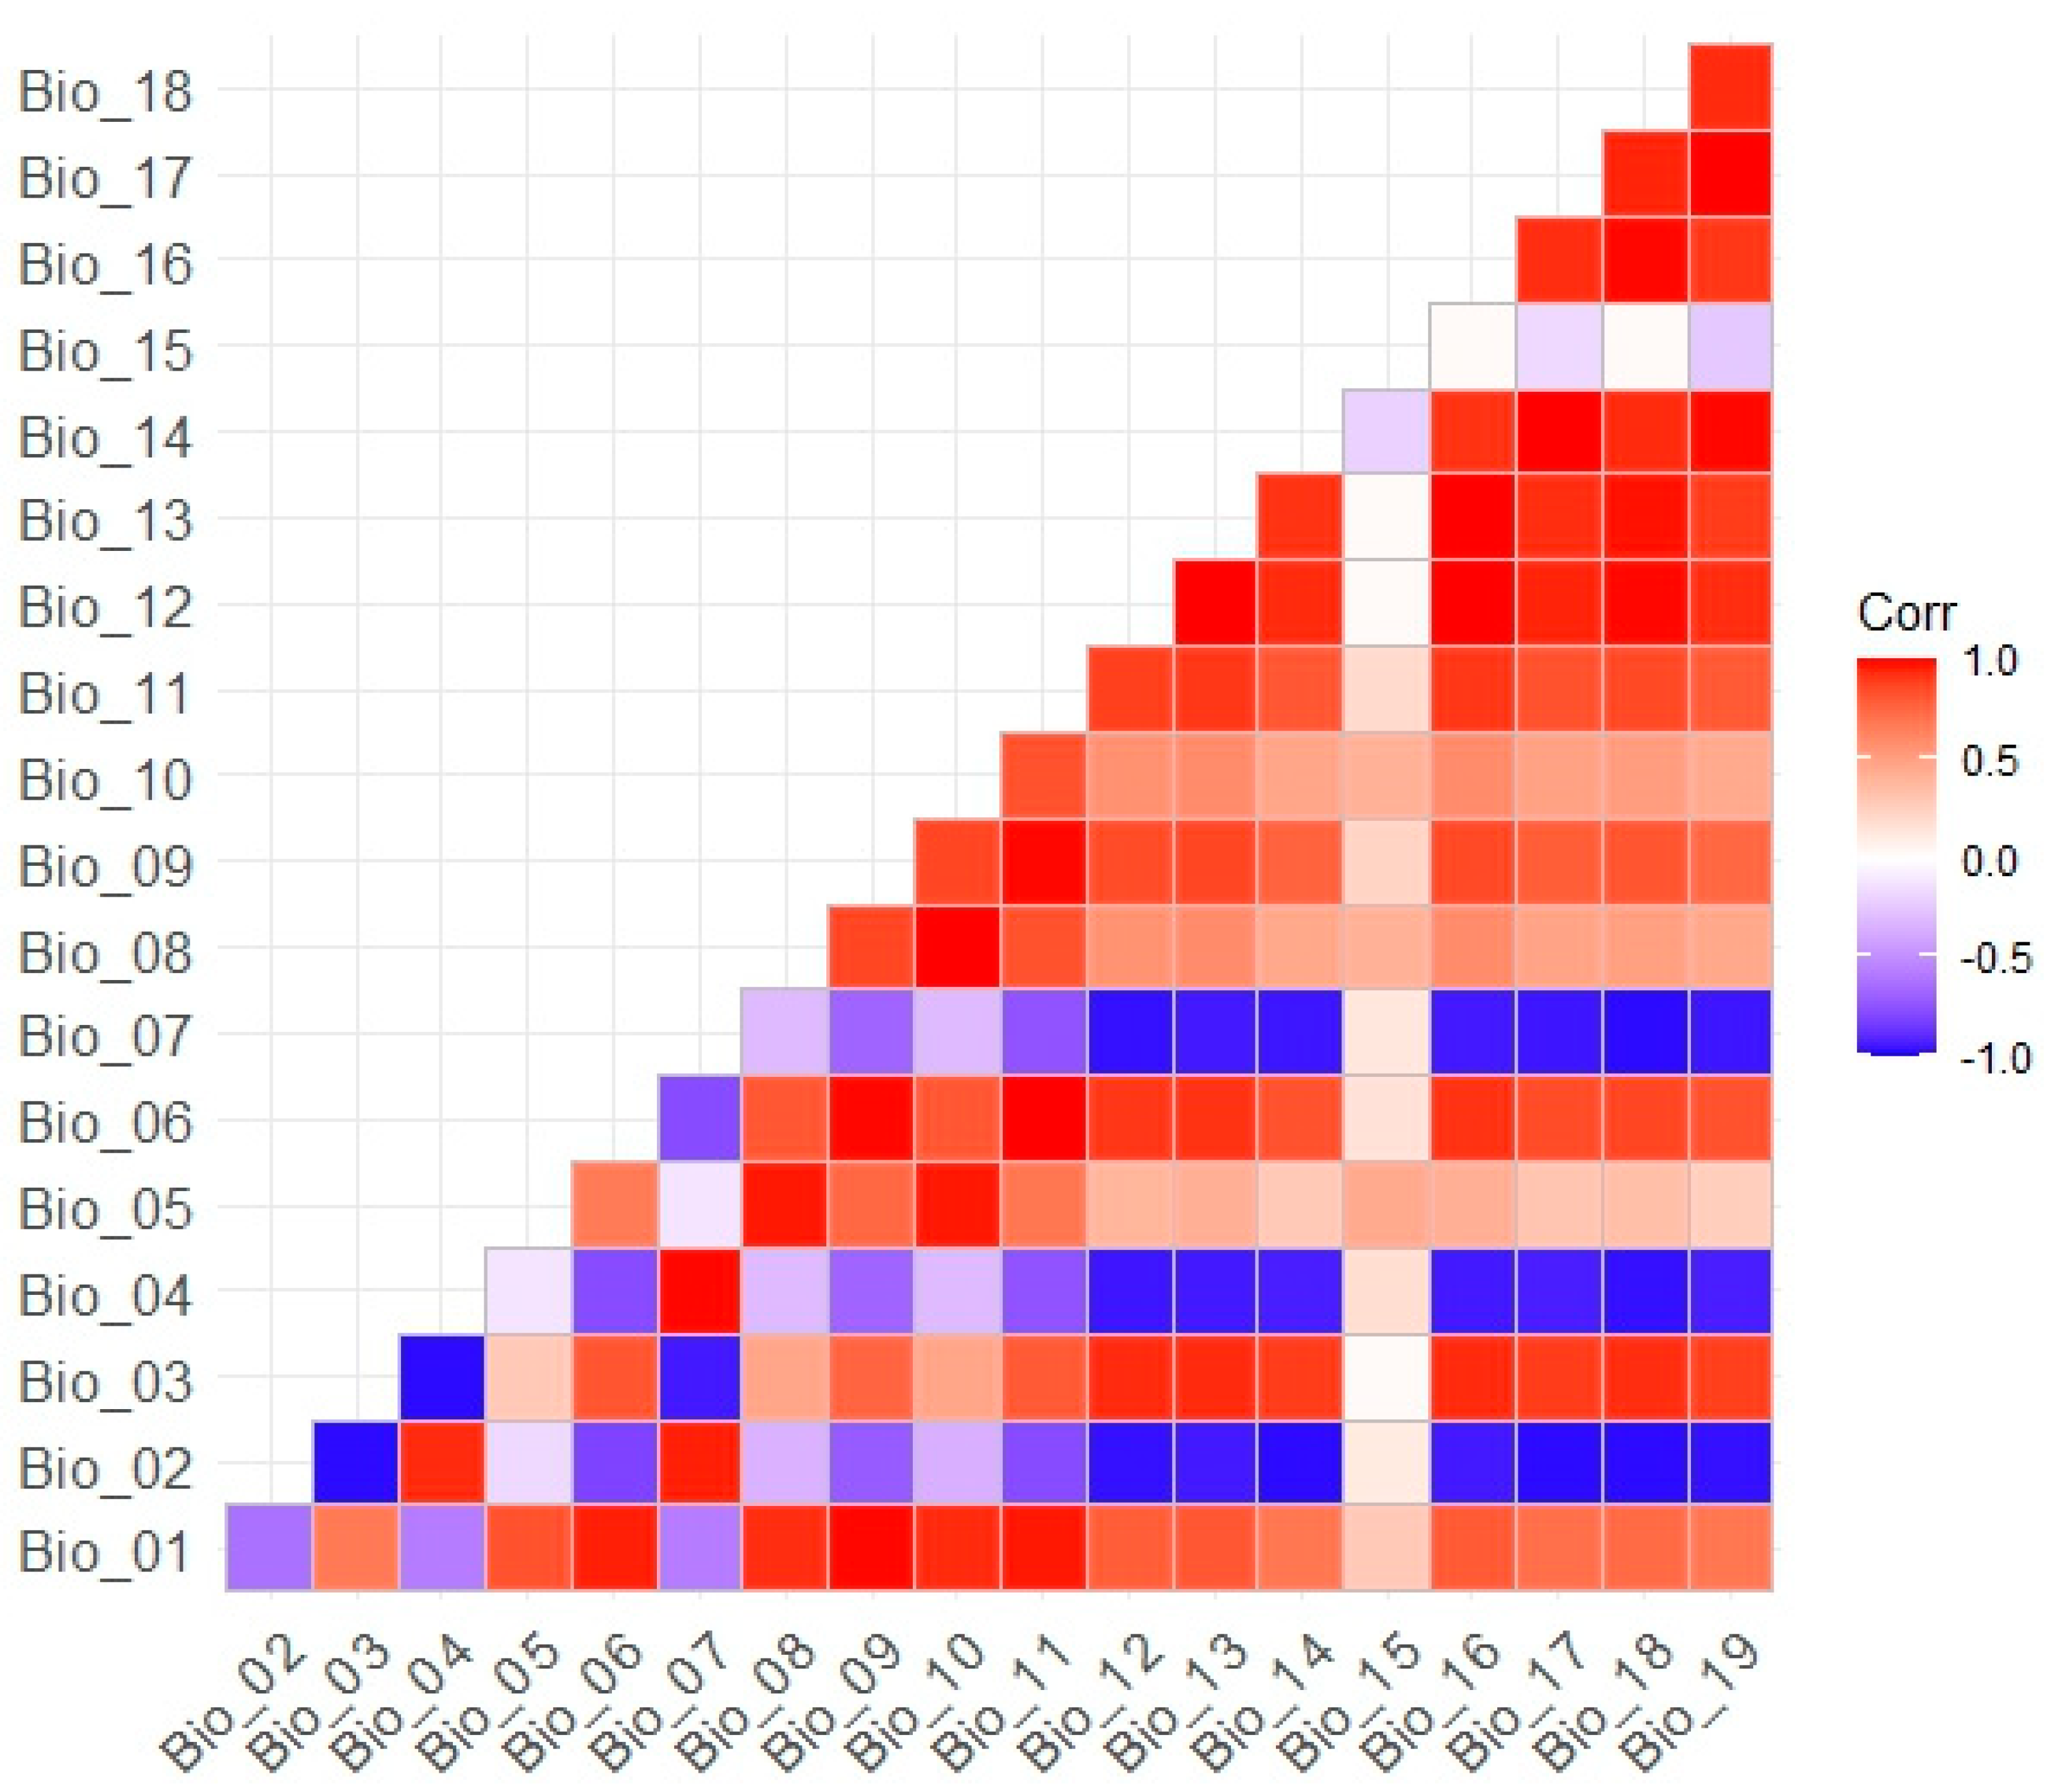
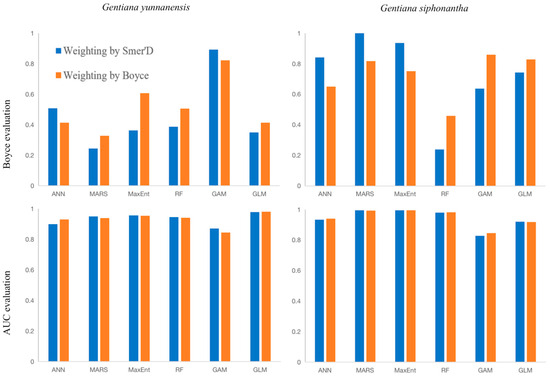
Figure A2.
Comparison of AUC and Boyce index assessment for 6 algorithms.
Figure A2.
Comparison of AUC and Boyce index assessment for 6 algorithms.


Figure A3.
The distribution of G. siphonantha simulated by the Somer’s D-weighted MARS (black indicates species presence; white indicates absence).
Figure A3.
The distribution of G. siphonantha simulated by the Somer’s D-weighted MARS (black indicates species presence; white indicates absence).
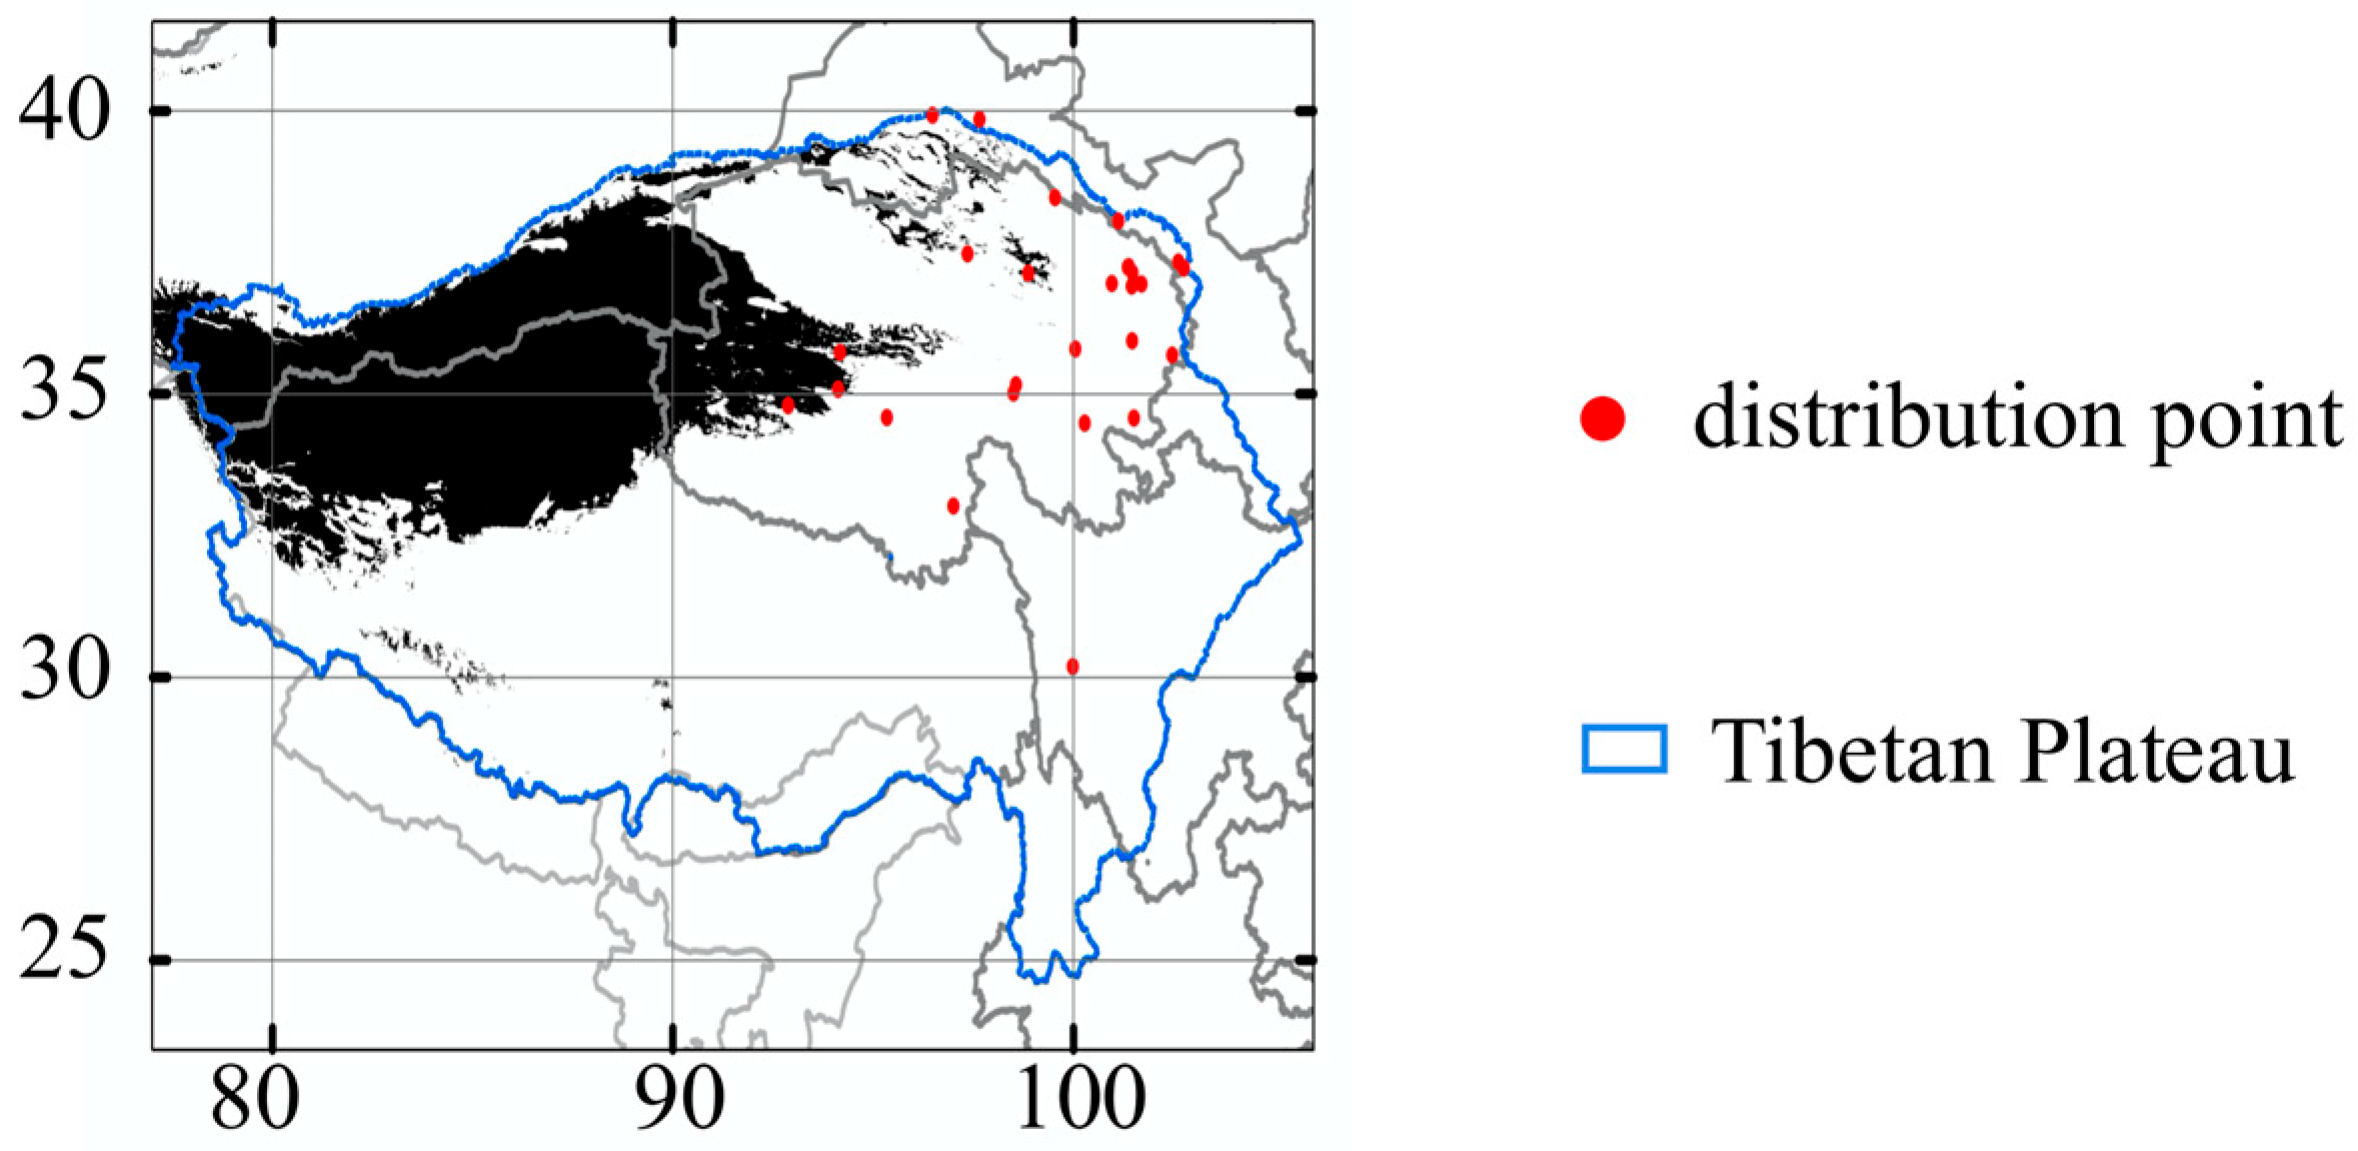
Table A1.
Changes in potential suitable areas under different climate scenarios for G. yunnanensis.
Table A1.
Changes in potential suitable areas under different climate scenarios for G. yunnanensis.
| GCM | Period | SSP | PercLoss * | PercGain ** | SRC *** |
|---|---|---|---|---|---|
| ACCESS-CM2 | 2041–2060 | SSP2-4.5 | 48.044 | 31.524 | −16.52 |
| 2041–2060 | SSP5-8.5 | 52.977 | 31.693 | −21.284 | |
| 2081–2100 | SSP2-4.5 | 60.382 | 39.043 | −21.339 | |
| 2081–2100 | SSP5-8.5 | 82.395 | 79.704 | −2.691 | |
| CMCC-ESM2 | 2041–2060 | SSP2-4.5 | 36.285 | 57.186 | +20.901 |
| 2041–2060 | SSP5-8.5 | 42.388 | 43.684 | +1.296 | |
| 2081–2100 | SSP2-4.5 | 56.526 | 55.463 | −1.063 | |
| 2081–2100 | SSP5-8.5 | 75.51 | 109.853 | +34.342 | |
| MPI-ESM1-2-HR | 2041–2060 | SSP2-4.5 | 26.371 | 26.623 | +0.252 |
| 2041–2060 | SSP5-8.5 | 33.978 | 26.487 | −7.491 | |
| 2081–2100 | SSP2-4.5 | 38.659 | 32.557 | −6.102 | |
| 2081–2100 | SSP5-8.5 | 67.043 | 75.848 | +8.805 | |
| UKESM1-0-LL | 2041–2060 | SSP2-4.5 | 52.019 | 49.915 | −2.104 |
| 2041–2060 | SSP5-8.5 | 61.284 | 62.254 | +0.969 | |
| 2081–2100 | SSP2-4.5 | 67.6 | 81.549 | +13.949 | |
| 2081–2100 | SSP5-8.5 | 90.564 | 87.737 | −2.827 |
* PercLoss (%): The proportion of the number of pixels existing in the current simulation but not existing in the future to the total number of pixels existing in the current simulation. ** PercGain (%): The proportion of the number of pixels that do not exist in the current simulation but exist in the future to the total number of pixels that exist in the current simulation. *** SRC (%): Species Range Change, SRC = PercGain − PercLoss.
Table A2.
Changes in potential suitable areas under different climate scenarios for G. siphonantha.
Table A2.
Changes in potential suitable areas under different climate scenarios for G. siphonantha.
| GCM | Period | SSP | PercLoss * | PercGain ** | SRC *** |
|---|---|---|---|---|---|
| ACCESS-CM2 | 2041–2060 | SSP2-4.5 | 11.835 | 15.244 | +3.409 |
| 2041–2060 | SSP5-8.5 | 14.424 | 16.181 | +1.757 | |
| 2081–2100 | SSP2-4.5 | 18.563 | 16.316 | −2.247 | |
| 2081–2100 | SSP5-8.5 | 43.152 | 11.929 | −31.223 | |
| CMCC-ESM2 | 2041–2060 | SSP2-4.5 | 9.645 | 12.267 | +2.622 |
| 2041–2060 | SSP5-8.5 | 10.643 | 13.915 | +3.272 | |
| 2081–2100 | SSP2-4.5 | 19.096 | 16.265 | −2.831 | |
| 2081–2100 | SSP5-8.5 | 40.618 | 13.833 | −26.784 | |
| MPI-ESM1-2-HR | 2041–2060 | SSP2-4.5 | 5.414 | 12.431 | +7.016 |
| 2041–2060 | SSP5-8.5 | 7.447 | 14.406 | +6.959 | |
| 2081–2100 | SSP2-4.5 | 8.826 | 13.909 | +5.083 | |
| 2081–2100 | SSP5-8.5 | 20.353 | 15.44 | −4.912 | |
| UKESM1-0-LL | 2041–2060 | SSP2-4.5 | 13.209 | 18.332 | +5.122 |
| 2041–2060 | SSP5-8.5 | 18.672 | 19.768 | +1.097 | |
| 2081–2100 | SSP2-4.5 | 25.129 | 18.764 | −6.365 | |
| 2081–2100 | SSP5-8.5 | 54.606 | 13.273 | −41.333 |
* PercLoss (%): The proportion of the number of pixels existing in the current simulation but not existing in the future to the total number of pixels existing in the current simulation. ** PercGain (%): The proportion of the number of pixels that do not exist in the current simulation but exist in the future to the total number of pixels that exist in the current simulation. *** SRC (%): Species Range Change, SRC = PercGain − PercLoss.
References
- Li, Q.; Xue, Y.K. Simulated impacts of land cover change on summer climate in the Tibetan Plateau. Environ. Res. Lett. 2010, 5, 12. [Google Scholar] [CrossRef]
- Shang, W.; Duan, K.Q.; Li, S.S.; Ren, X.J.; Huang, B. Simulation of the dipole pattern of summer precipitation over the Tibetan Plateau by CMIP6 models. Environ. Res. Lett. 2021, 16, 014047. [Google Scholar] [CrossRef]
- Cao, X.Y.; Zhou, B.R.; Zhou, H.K.; Qiao, B.; Yan, Y.Q.; Zhao, T.; Cheng, Q.; Zhao, H.F.; Yu, H.Y. Research progress on the impact of climate change on vegetation ecosystem in the Tibetan Plateau. J. Arid Meteorol. 2022, 40, 1068–1080. [Google Scholar] [CrossRef]
- Lu, C.X.; Xie, G.D.; Xiao, Y.; Yu, Y.J. Ecosystem diversity and economic valuation of Qinghai-Tibet Plateau. Acta Ecol. Sin. 2004, 24, 2749–2755. [Google Scholar]
- Li, Y.C.; Li, M.Y.; Li, C.; Liu, Z.Z. Optimized Maxent Model Predictions of Climate Change Impacts on the Suitable Distribution of Cunninghamia lanceolata in China. Forests 2020, 11, 302. [Google Scholar] [CrossRef]
- Nunez, S.; Arets, E.; Alkemade, R.; Verwer, C.; Leemans, R. Assessing the impacts of climate change on biodiversity: Is below 2 °C enough? Clim. Chang. 2019, 154, 351–365. [Google Scholar] [CrossRef]
- Thuiller, W. Biodiversity—Climate change and the ecologist. Nature 2007, 448, 550–552. [Google Scholar] [CrossRef]
- Liu, H.Y.; Mi, Z.R.; Lin, L.; Wang, Y.H.; Zhang, Z.H.; Zhang, F.W.; Wang, H.; Liu, L.L.; Zhu, B.A.; Cao, G.M.; et al. Shifting plant species composition in response to climate change stabilizes grassland primary production. Proc. Natl. Acad. Sci. USA 2018, 115, 4051–4056. [Google Scholar] [CrossRef] [PubMed]
- Shen, M.G.; Piao, S.L.; Jeong, S.J.; Zhou, L.M.; Zeng, Z.Z.; Ciais, P.; Chen, D.L.; Huang, M.T.; Jin, C.S.; Li, L.Z.X.; et al. Evaporative cooling over the Tibetan Plateau induced by vegetation growth. Proc. Natl. Acad. Sci. USA 2015, 112, 9299–9304. [Google Scholar] [CrossRef]
- Zhou, M.P.; Yu, Z.B.; Gu, H.H.; Ju, Q.; Gao, Y.Y.; Wen, L.; Huang, T.K.; Wang, W. Evaluation and projections of surface air temperature over the Tibetan Plateau from CMIP6 and CMIP5: Warming trend and uncertainty. Clim. Dyn. 2023, 60, 3863–3883. [Google Scholar] [CrossRef]
- Hu, H.W.; Wei, Y.Q.; Wang, W.Y.; Chen, Z.N. Potential spatial distributions of Tibetan antelope and protected areas on the Qinghai-Tibetan Plateau, China. Biodivers. Conserv. 2024, 33, 1845–1867. [Google Scholar] [CrossRef]
- Karuno, A.P.; Mi, X.; Chen, Y.H.; Zou, D.H.; Gao, W.; Zhang, B.L.; Xu, W.; Jin, J.Q.; Shen, W.J.; Huang, S.; et al. Impacts of climate change on herpetofauna diversity in the Qinghai-Tibetan Plateau. Conserv. Biol. 2023, 37, 15. [Google Scholar] [CrossRef] [PubMed]
- Liu, D.T.; Chen, J.Y.; Sun, W.B. Distributional responses to climate change of two maple species in southern China. Ecol. Evol. 2023, 13, 11. [Google Scholar] [CrossRef]
- He, X.; Burgess, K.S.; Gao, L.M.; Li, D.Z. Distributional responses to climate change for alpine species of Cyananthus and Primulaendemic to the Himalaya-Hengduan Mountains. Plant Divers. 2019, 41, 26–32. [Google Scholar] [CrossRef] [PubMed]
- You, J.L.; Qin, X.P.; Ranjitkar, S.; Lougheed, S.C.; Wang, M.C.; Zhou, W.; Ouyang, D.X.; Zhou, Y.; Xu, J.C.; Zhang, W.J.; et al. Response to climate change of montane herbaceous plants in the genus Rhodiola predicted by ecological niche modelling. Sci. Rep. 2018, 8, 12. [Google Scholar] [CrossRef]
- Cui, T.; Li, C.; Tian, F.Q. Evaluation of Temperature and Precipitation Simulations in CMIP6 Models Over the Tibetan Plateau. Earth Space Sci. 2021, 8, e2020EA001620. [Google Scholar] [CrossRef]
- Zhu, Y.Y.; Yang, S.N. Evaluation of CMIP6 for historical temperature and precipitation over the Tibetan Plateau and its comparison with CMIP5. Adv. Clim. Chang. Res. 2020, 11, 239–251. [Google Scholar] [CrossRef]
- Hu, Q.; Hua, W.; Yang, K.Q.; Ming, J.; Ma, P.; Zhao, Y.; Fan, G.Z. An assessment of temperature simulations by CMIP6 climate models over the Tibetan Plateau and differences with CMIP5 climate models. Theor. Appl. Climatol. 2022, 148, 223–236. [Google Scholar] [CrossRef]
- Zhang, C.; Qi, W.; Dong, J.W.; Deng, Y. How the CMIP6 climate models project the historical terrestrial GPP in China. Int. J. Climatol. 2022, 42, 9449–9461. [Google Scholar] [CrossRef]
- Jin, C.X.; Jiang, C.; Zhang, X.Y. Evaluation and Projection of Temperature in Southwestern China by CMIP6 Models. Chin. J. Agrometeorol. 2022, 43, 597–611. [Google Scholar] [CrossRef]
- Liang, Q.L.; Xu, X.T.i.; Mao, K.S.; Wang, M.C.; Wang, K.; Xi, Z.X.; Liu, J.Q. Shifts in plant distributions in response to climate warming in a biodiversity hotspot, the Hengduan Mountains. J. Biogeogr. 2018, 45, 1334–1344. [Google Scholar] [CrossRef]
- Yan, Y.J.; Li, Y.; Wang, W.J.; He, J.S.; Yang, R.H.; Wu, H.J.; Wang, X.L.; Jiao, L.; Tang, Z.Y.; Yao, Y.J. Range shifts in response to climate, change of Ophiocordyceps sinensis, a fungus endemic to the Tibetan Plateau. Biol. Conserv. 2017, 206, 143–150. [Google Scholar] [CrossRef]
- Yan, Y.J.; Tang, Z.Y. Protecting endemic seed plants on the Tibetan Plateau under future climate change: Migration matters. J. Plant Ecol. 2019, 12, 962–971. [Google Scholar] [CrossRef]
- Li, J.M.; Ehlers, T.A.; Werner, M.; Mutz, S.G.; Steger, C.; Paeth, H. Late quaternary climate, precipitation δ18O, and Indian monsoon variations over the Tibetan Plateau. Earth Planet. Sci. Lett. 2017, 457, 412–422. [Google Scholar] [CrossRef]
- Lamsal, P.; Kumar, L.; Aryal, A.; Atreya, K. Future climate and habitat distribution of Himalayan Musk Deer Moschus chrysogaster. Ecol. Inform. 2018, 44, 101–108. [Google Scholar] [CrossRef]
- Peng, Y.Z.; Duan, A.; Hu, W.T.; Tang, B.; Li, X.Y.; Yang, X.Y. Observational constraint on the future projection of temperature in winter over the Tibetan Plateau in CMIP6 models. Environ. Res. Lett. 2022, 17, 034023. [Google Scholar] [CrossRef]
- Wang, C.J.; Wang, Z.M.; Wang, W.H.; Peng, X.J. Advances in chemical components and pharmacology of genus Gentiana. China J. Chin. Mater. Medica 2009, 34, 2987–2994. [Google Scholar]
- Mirzaee, F.; Hosseini, A.; Jouybari, H.B.; Davoodi, A.; Azadbakht, M. Medicinal, biological and phytochemical properties of Gentiana species. J. Tradit. Complement. Med. 2017, 7, 400–408. [Google Scholar] [CrossRef] [PubMed]
- Zheng, D. The system of physico-geographical regions of the Qinghai-Xizang (Tibet) Plateau. Sci. China Ser. D 1996, 39, 410–417. [Google Scholar]
- Zhang, H.; Sun, J.; Xiong, J.N. Spatial-Temporal Patterns and Controls of Evapotranspiration across the Tibetan Plateau (2000–2012). Adv. Meteorol. 2017, 2017, 7082606. [Google Scholar] [CrossRef]
- Editorial Committee of Flora of China, Chinese Academy of Sciences. Gentianaceae in Flora Reipublicae Popularis Sinicae; Science Press: Beijing, China, 1988; Volume 62, pp. 14–75. [Google Scholar]
- Zhou, W.; Qin, Y.M.; Liu, X.L. Distribution and Evaluation of Medicinal Gentian Resources in Yunnan. Yunnan J. Tradit. Chin. Med. Mater. Medica 2015, 36, 81–83. [Google Scholar]
- Zhao, Z.L.; Su, J.; Wang, Z.H. Pharmacognostical studies on root of Gentiana siphonantha. Chin. Tradit. Herb. Drugs 2006, 37, 1875–1878. [Google Scholar]
- Hijmans, R.J. Raster: Geographic Data Analysis and Modeling. R package version 3.6.23. 2023. Available online: https://cran.r-project.org/package=raster (accessed on 22 August 2024).
- Wai, T.H.; Liang, X.; Xie, H.; Liu, L.; Pan, Y.; Xu, Y.; Zhao, L.; Xu, X. Global richness patterns of alpine genus Gentiana depend on multiple factors. Ecol. Evol. 2024, 14, e11366. [Google Scholar] [CrossRef] [PubMed]
- Breiner, F.T.; Guisan, A.; Bergamini, A.; Nobis, M.P. Overcoming limitations of modelling rare species by using ensembles of small models. Methods Ecol. Evol. 2015, 6, 1210–1218. [Google Scholar] [CrossRef]
- Di Cola, V.; Broennimann, O.; Petitpierre, B.; Breiner, F.T.; D’Amen, M.; Randin, C.; Engler, R.; Pottier, J.; Pio, D.; Dubuis, A.; et al. ecospat: An R package to support spatial analyses and modeling of species niches and distributions. Ecography 2017, 40, 774–787. [Google Scholar] [CrossRef]
- Lee, S.; Qi, J.Y.; McCarty, G.W.; Yeo, I.Y.; Zhang, X.S.; Moglen, G.E.; Du, L. Uncertainty assessment of multi-parameter, multi-GCM, and multi-RCP simulations for streamflow and non-floodplain wetland (NFW) water storage. J. Hydrol. 2021, 600, 126564. [Google Scholar] [CrossRef]
- Chauvier, Y.; Descombes, P.; Gueguen, M.; Boulangeat, L.; Thuiller, W.; Zimmermann, N.E. Resolution in species distribution models shapes spatial patterns of plant multifaceted diversity. Ecography 2022, 2022, e05973. [Google Scholar] [CrossRef]
- Liu, C.; Newell, G.; White, M. The effect of sample size on the accuracy of species distribution models: Considering both presences and pseudo-absences or background sites. Ecography 2019, 42, 535–548. [Google Scholar] [CrossRef]
- Trew, B.T.; Maclean, I.M.D. Vulnerability of global biodiversity hotspots to climate change. Glob. Ecol. Biogeogr. 2021, 30, 768–783. [Google Scholar] [CrossRef]
- Zu, K.L.; Wang, Z.H.; Zhu, X.Y.; Lenoir, J.; Shrestha, N.; Lyu, T.; Luo, A.; Li, Y.Q.; Ji, C.J.; Peng, S.J.; et al. Upward shift and elevational range contractions of subtropical mountain plants in response to climate change. Sci. Total Environ. 2021, 783, 146896. [Google Scholar] [CrossRef]
- Gholami, H.; Lotfirad, M.; Ashrafi, S.M.; Biazar, S.M.; Singh, V.P. Multi-GCM ensemble model for reduction of uncertainty in runoff projections. Stoch. Environ. Res. Risk Assess. 2023, 37, 953–964. [Google Scholar] [CrossRef]
- Keilman, N. Modelling education and climate change. Nat. Sustain. 2020, 3, 497–498. [Google Scholar] [CrossRef]
- Della Rocca, F.; Bogliani, G.; Breiner, F.T.; Milanesi, P. Identifying hotspots for rare species under climate change scenarios: Improving saproxylic beetle conservation in Italy. Biodivers. Conserv. 2019, 28, 433–449. [Google Scholar] [CrossRef]
- Garza, G.; Rivera, A.; Barrera, C.S.V.; Martinez-Avalos, J.G.; Dale, J.; Arroyo, T.P.F. Potential Effects of Climate Change on the Geographic Distribution of the Endangered Plant Species Manihot walkerae. Forests 2020, 11, 689. [Google Scholar] [CrossRef]
- McSweeney, C.F.; Jones, R.G.; Lee, R.W.; Rowell, D.P. Selecting CMIP5 GCMs for downscaling over multiple regions. Clim. Dyn. 2015, 44, 3237–3260. [Google Scholar] [CrossRef]
- Barbet-Massin, M.; Jiguet, F.; Albert, C.H.; Thuiller, W. Selecting pseudo-absences for species distribution models: How, where and how many? Methods Ecol. Evol. 2012, 3, 327–338. [Google Scholar] [CrossRef]

Disclaimer/Publisher’s Note: The statements, opinions and data contained in all publications are solely those of the individual author(s) and contributor(s) and not of MDPI and/or the editor(s). MDPI and/or the editor(s) disclaim responsibility for any injury to people or property resulting from any ideas, methods, instructions or products referred to in the content. |
© 2024 by the authors. Licensee MDPI, Basel, Switzerland. This article is an open access article distributed under the terms and conditions of the Creative Commons Attribution (CC BY) license (https://creativecommons.org/licenses/by/4.0/).