Article

Territorial Spatial Resilience Assessment and Its Optimisation Path: A Case Study of the Yangtze River Economic Belt, China

1
Hubei Provincial Key Laboratory for Geographical Process Analysis and Simulation, Academy of Wuhan Metropolitan Area, College of Urban and Environmental Sciences, Central China Normal University, Wuhan 430079, China
2
School of Resource and Environmental Sciences, Wuhan University, Wuhan 430079, China
3
School of Geographical and Environmental Sciences, Guizhou Normal University, Guiyang 550025, China
*
Author to whom correspondence should be addressed.
Land 2024, 13(9), 1395; https://doi.org/10.3390/land13091395
Submission received: 2 August 2024 / Revised: 27 August 2024 / Accepted: 28 August 2024 / Published: 30 August 2024
(This article belongs to the Special Issue Spatial Optimization and Sustainable Development of Land Use)

Abstract

:
Along with the rapid development of urbanization and industrialization, the carrying capacity of territorial space has been confronted with a serious crisis. Faced with many uncertain risks and unknown disruptions, it is important to proactively address the uncertainty of future developments in planning and to improve territorial spatial resilience (TSR). Based on the connotation of TSR, we build an assessment framework for TSR containing urban, agricultural and ecological space from three dimensions, including element, structure and function. Using a variety of methods such as the source-sink landscape index, land suitability assessment, and cropland pressure index, we assessed the TSR of the Yangtze River Economic Belt (YREB) from 2000 to 2020 and comprehensively analysed its spatial and temporal evolutionary characteristics. Through data analysis, we observe that the urban spatial resilience (RU) decreases and then increases, while the agricultural spatial resilience (RA) and the ecological spatial resilience (RE) show an increasing trend. The spatial clustering in TSR is apparent, and the distribution of hot and cold spots in RA and RE is reversed in the east–west direction. The changes in TSR are influenced by a combination of RU, RA and RE, which show unique geographical characteristics. Based on the average level and overall evolution of TSR, we divided the study area into five type zones and proposed development strategies for each of them.

1. Introduction

Territorial space is the spatial carrier of human activities. Rational development of territorial space is a prerequisite for the sustainable development of a country or region [1]. Under the background of global environmental change, China’s territorial spatial pattern, which has experienced rapid urbanisation and industrialisation, has changed dramatically. The disorderly exploitation of urban, agricultural and ecological space by human beings has triggered problems such as environmental pollution, resource shortage and ecological damage [2]. Moreover, the imbalance within the territorial space and the different requirements of urban development for the functioning of the territorial space limits its sustainable development. Therefore, upgrading the functions of the territorial spatial system and enhancing its resilience has become a consensus for development in many countries [3,4].
To address these problems, western countries carried out extensive spatial planning practices after the 20th century and established a relatively comprehensive spatial planning system, intending to improve the territorial space use efficiency and promote coordinated regional development [5,6]. In this process, the concept of resilience was introduced into ecology by Holling [7], and has gradually been widely used in various fields such as disaster and public safety, agricultural management, community building, urban planning and economic management [8,9,10]. Building resilient territorial space is significant to sustainable economic and social development. TSR is a new attempt to combine resilience planning with territorial spatial research. China has made territorial spatial planning the primary basis for all types of development, protection and construction activities, as well as a spatial blueprint for sustainable development [11]. In particular, ‘enhancing the spatial resilience of the national territory’ is one of the guiding requirements in the code of practice for territorial and spatial planning at the provincial level. The 14th Five-Year Plan of China proposed the construction of ‘resilient cities’ for the first time, emphasising the prominence of ecology and safety in urban construction. Under the background of territorial spatial planning, linking urban economic development with the protection of arable land and ecological environment restoration to give targeted guidance in the process of planning practice is an important research topic.
Previous studies related to TSR have focused on its conceptual and theoretical exploration, quality assessment, evolutionary process and planning practice. Specifically, TSR is the capacity of the territorial space to absorb the impact generated by endogenous and exogenous factors and move towards a new dynamic equilibrium [12]. In risky societies, endogenous complexity and external uncertainty exacerbate the vulnerability of territorial space and may contribute to regional or urban–rural development imbalances [13]. At the same time, territorial space can adapt and recover from natural disasters and human activity disturbances. Many studies measure the magnitude of this capacity using the composite index method [14], principal component analysis [15] and semi-structured expert interviews [16] to evaluate the resilience of territorial space in a given region quantitatively or qualitatively. For example, Assumma et al. (2024) [17] assess TSR in the Champagne-Ardenne region of France in terms of social, technological, environmental, economic, and regional development capacities. Some studies tend to systematically analyse TSR from the perspective of spatial structure and landscape morphology [18,19]. On this basis, research on the functions, security, vulnerability and ecological restoration of territorial space has become increasingly rich [20,21,22,23]. Moreover, scholars continue to explore directions for incorporating resilience concepts into territorial spatial planning [24,25]. For example, spatial planning in Poland aims at increasing the resilience of spatial structures to natural and socio-economic threats [26]; and the Netherlands emphasises the importance of proactively addressing risks in spatial planning decisions, in particular concerning climate perturbations and flood risks [27]. Exploring ecological protection and restoration methods for territorial space under the resilience perspective, especially in countries that have experienced large-scale urban expansion, can provide new feasible paths for promoting the high-quality development of territorial space [28]. At present, international research on spatial resilience evaluation methods has matured, involving economic [29], ecological [30], infrastructure [31] and agricultural system resilience [32]; diversified community resilience evaluation and enhancement research have also been enriched [33]. However, most of the existing studies tend to focus on the resilience of a single subsystem of territorial space, which may be unable to capture the complex evolutionary characteristics of TSR under the influence of human activities. Therefore, based on the need to optimise the structure and enhance the function of territorial space, a comprehensive exploration of the spatio-temporal correlation and enhancement path of TSR is urgently needed.
As a development belt coordinating east, middle and west China, the YREB has experienced rapid urbanisation in recent decades, accompanied by a large number of land use changes and landscape transformations. Therefore, we take the YREB as a case study to investigate the spatial heterogeneity and evolutionary law of TSR and try to explore a reasonable optimisation path. Our specific research objectives are to (1) quantify TSR in different years and clarify its spatial evolution trend; (2) reveal the clustering characteristics and combination types of multi-dimensional TSR; and (3) propose optimisation paths for different types of TSR. The main contributions of this study are as follows. Firstly, we constructed a TSR assessment framework that included urban, agricultural and ecological space. The spatiotemporal heterogeneity characteristics of TSR in the YREB were explored using the three dimensions of elements, structure and function. It is a comprehensive view that highlights the integrity and interactivity of TSR. Compared with the common unidimensional indicators in previous studies, the framework can reflect the TSR characteristics more effectively and show the problems of territorial space more accurately. These provide empirical insights for prefecture-level city-scale TSR research. Secondly, we divided the study area into functional zones based on the combination of TSR and dynamic changes. Few previous studies have carried out functional zoning of a territorial space from a resilience perspective. Functional zoning can accurately identify the strengths and weaknesses of regional TSR and provide theoretical support and a practical reference for territorial spatial planning zoning. Thirdly, we examined the response history of TSR at different stages, based on which we explored the optimisation path of TSR under different combination modes. Previous studies have paid less attention to the coordination between TSR dimensions and lacked the dissection of the co-evolutionary process, which is insufficient to propose a comprehensive optimisation strategy. Our study will provide valuable theoretical references for promoting resilient territorial space construction.

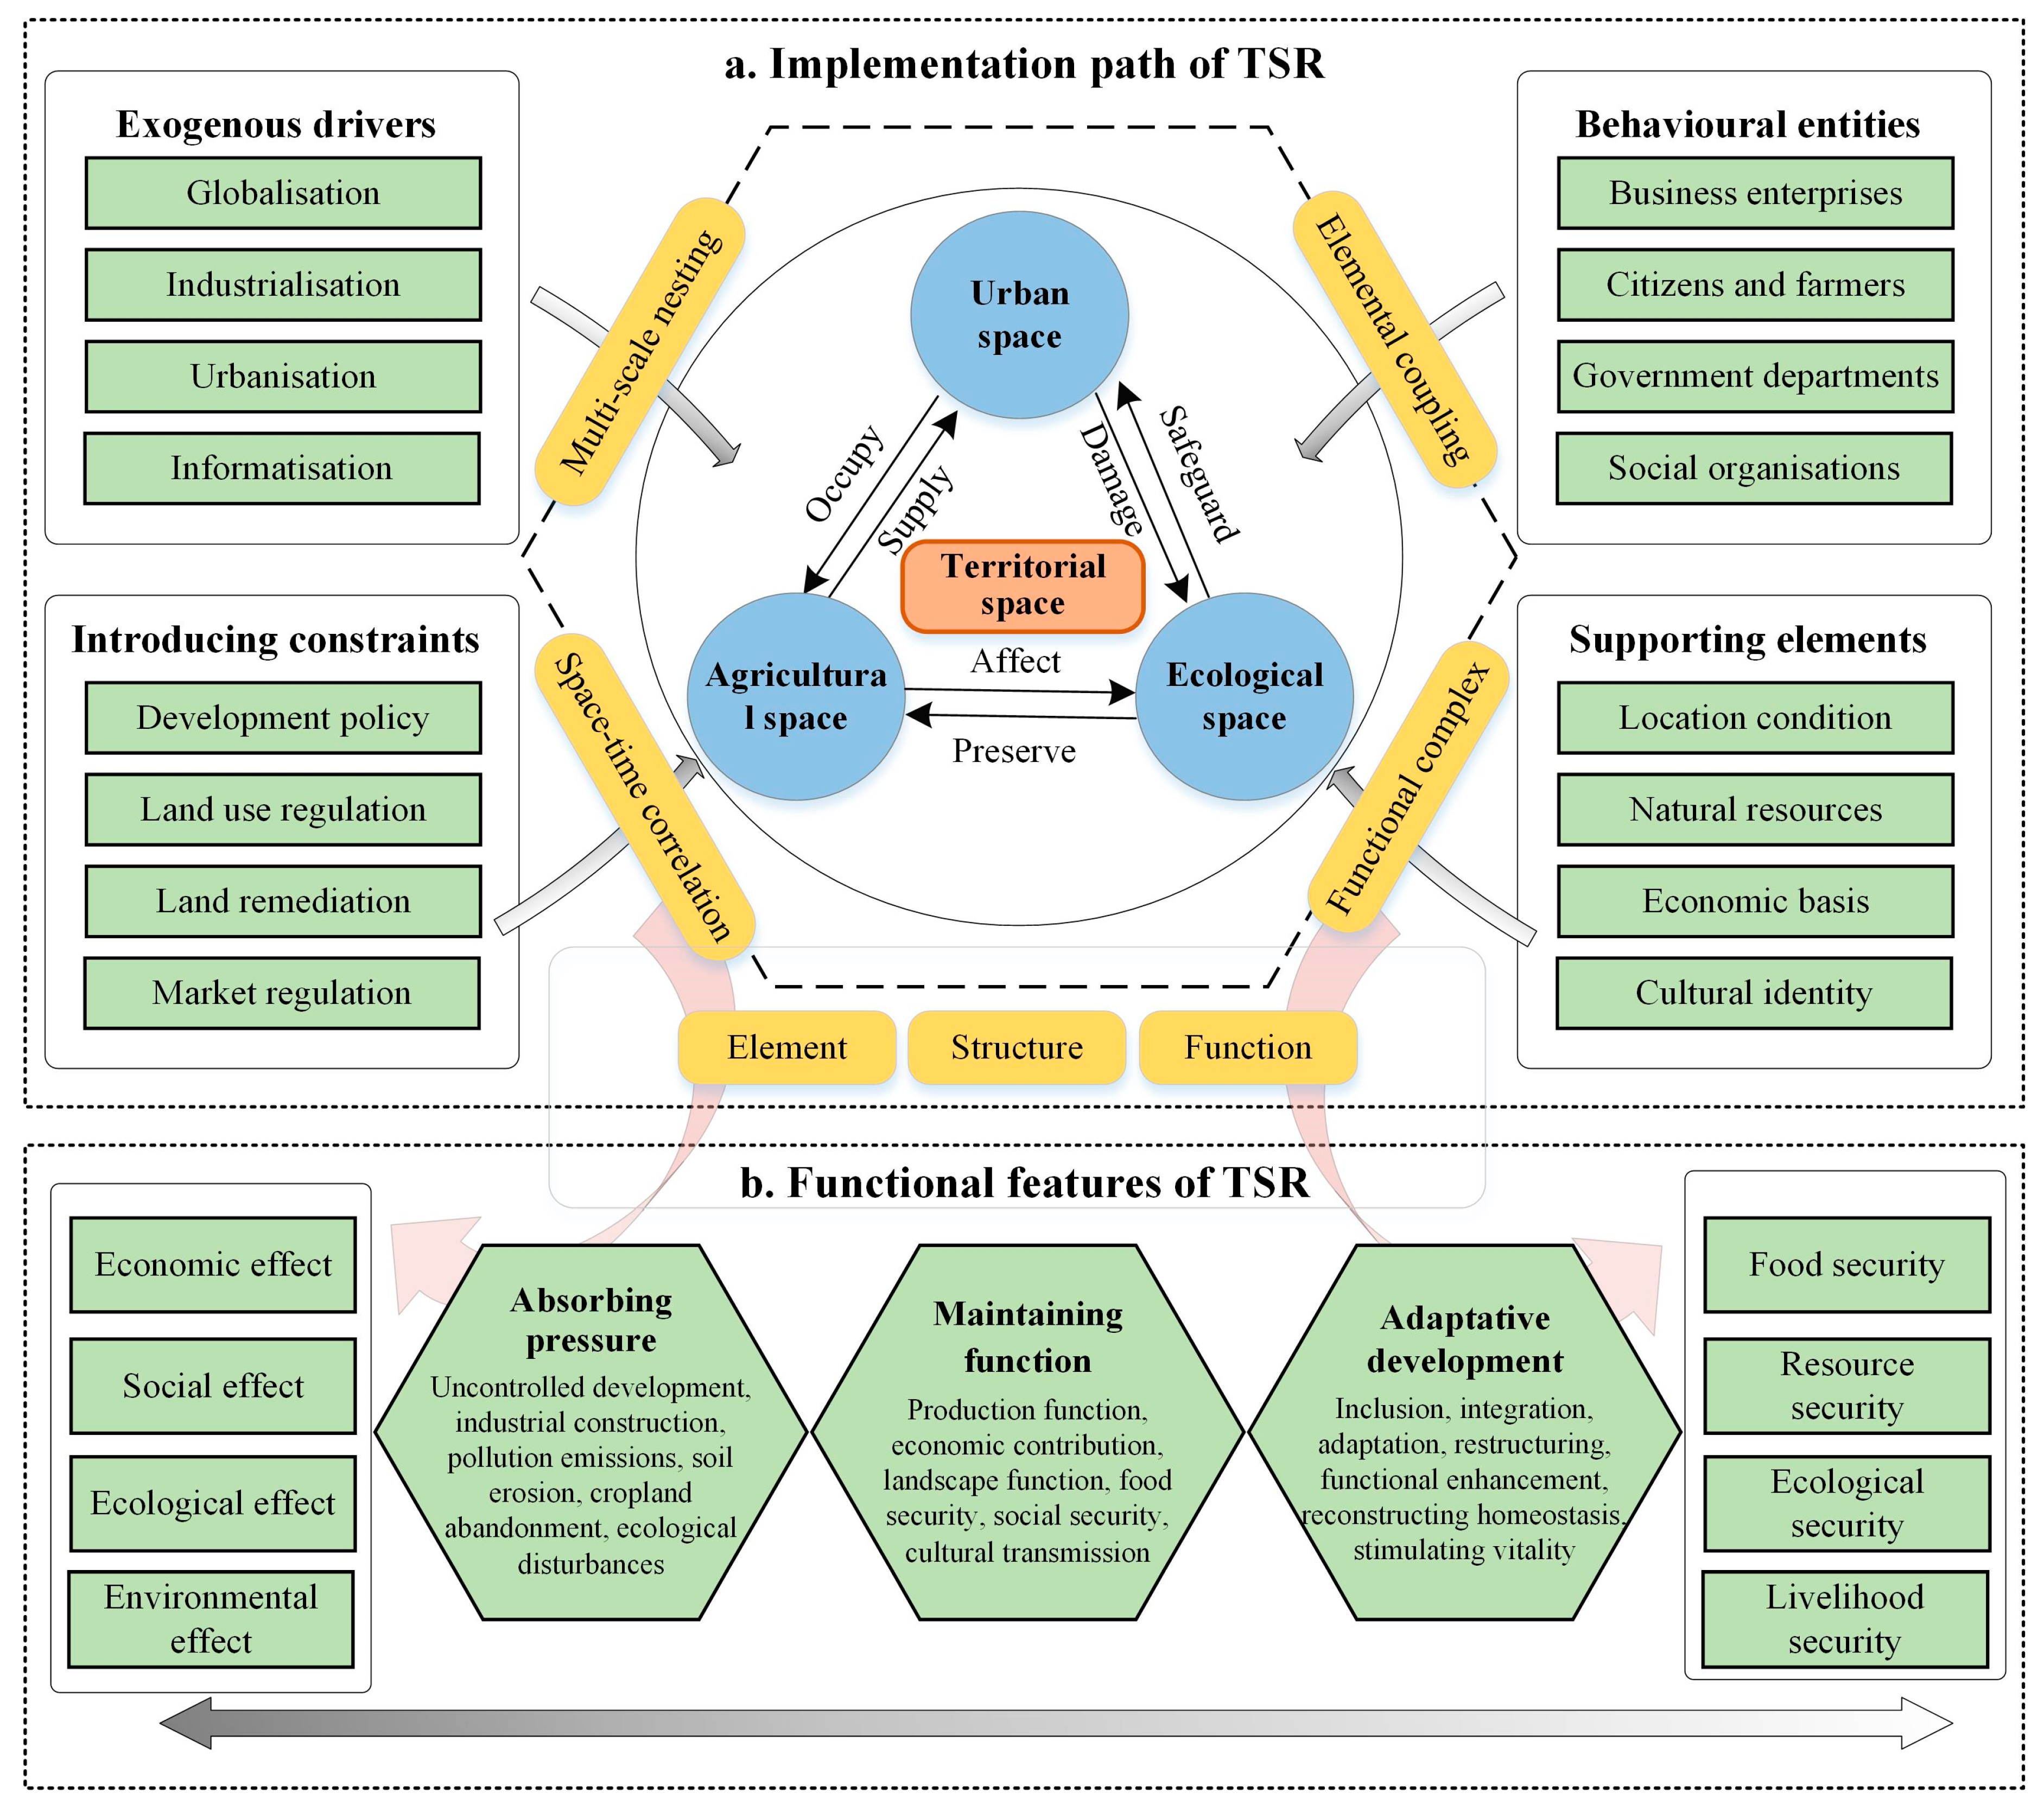
2. Theoretical Framework

2.1. The Connotations of TSR

Territorial space is a complex formed by coupling natural ecosystems and human social systems; it is characterized by nested scales, coupled elements, spatial and temporal correlations and functional composites [34]. Resilience was introduced to ecology by Holling [7]; it pertains to the ability of an ecosystem to maintain its organisation and return to a stable state after a major disturbance. Territorial spatial resilience (TSR) is the ability of territorial space to maintain stability when disturbed by multiple risks, recover from damage and adapt to co-evolution with the environment [35]. The realisation of TSR relies on the stability and adaptability of the territorial spatial system’s elements, structures and functions (Figure 1a). Driven by exogenous factors such as globalisation, industrialisation, urbanisation and informatisation, the territorial spatial system is affected and disturbed by various factors such as business enterprises, citizens and farmers, government departments and social organisations. By relying on specific location conditions, natural resources, economic base and cultural characteristics, the territorial spatial system is guided and constrained by development policies, land use regulation, remediation projects and market regulation [36]. In this process, the scale and attributes of the elements of the territorial spatial system change and the spatial structure and form transform, affecting the output and supply of its various functions and leading to the continuous evolution of the territorial spatial system. Territorial space is divided into three categories, namely, urban, agricultural and ecological space, according to the attributes of spatial elements and main functions [37]. Urban space mainly carries urban economic, social, political and cultural functions, agricultural space mainly carries agricultural production and rural life functions, and ecological space mostly provides ecological services or products. The territorial space system is a structured spatial organisation of three types of elements, namely, urban space, agricultural space and ecological space, forming various types of territorial functions [38]. TSR is realised in the functioning of the three types of spaces and their optimal coordination with each other [39].
TSR is embodied in the process of transformation of the three types of spatial elements, structural transformation and functional transformation, exhibiting characteristics such as robustness, restorability, redundancy and adaptability (Figure 1b). It is jointly influenced by economic resilience and social resilience and simultaneously provides support for the realisation of economic and social resilience. Specifically, TSR is characterised by the ability to withstand the specific pressures generated by the production and living activities of the actors under the action of exogenous drivers [40]. It can rely on the combined action of guiding constraints and supporting elements to maintain its main functions and adapt to changes in response to external socio-economic development to satisfy human needs continually [41]. Moreover, TSR evolution has obvious externalities, generates complex economic, social, ecological and environmental effects and has a decisive impact on food security, resource security, ecological security and livelihood security.

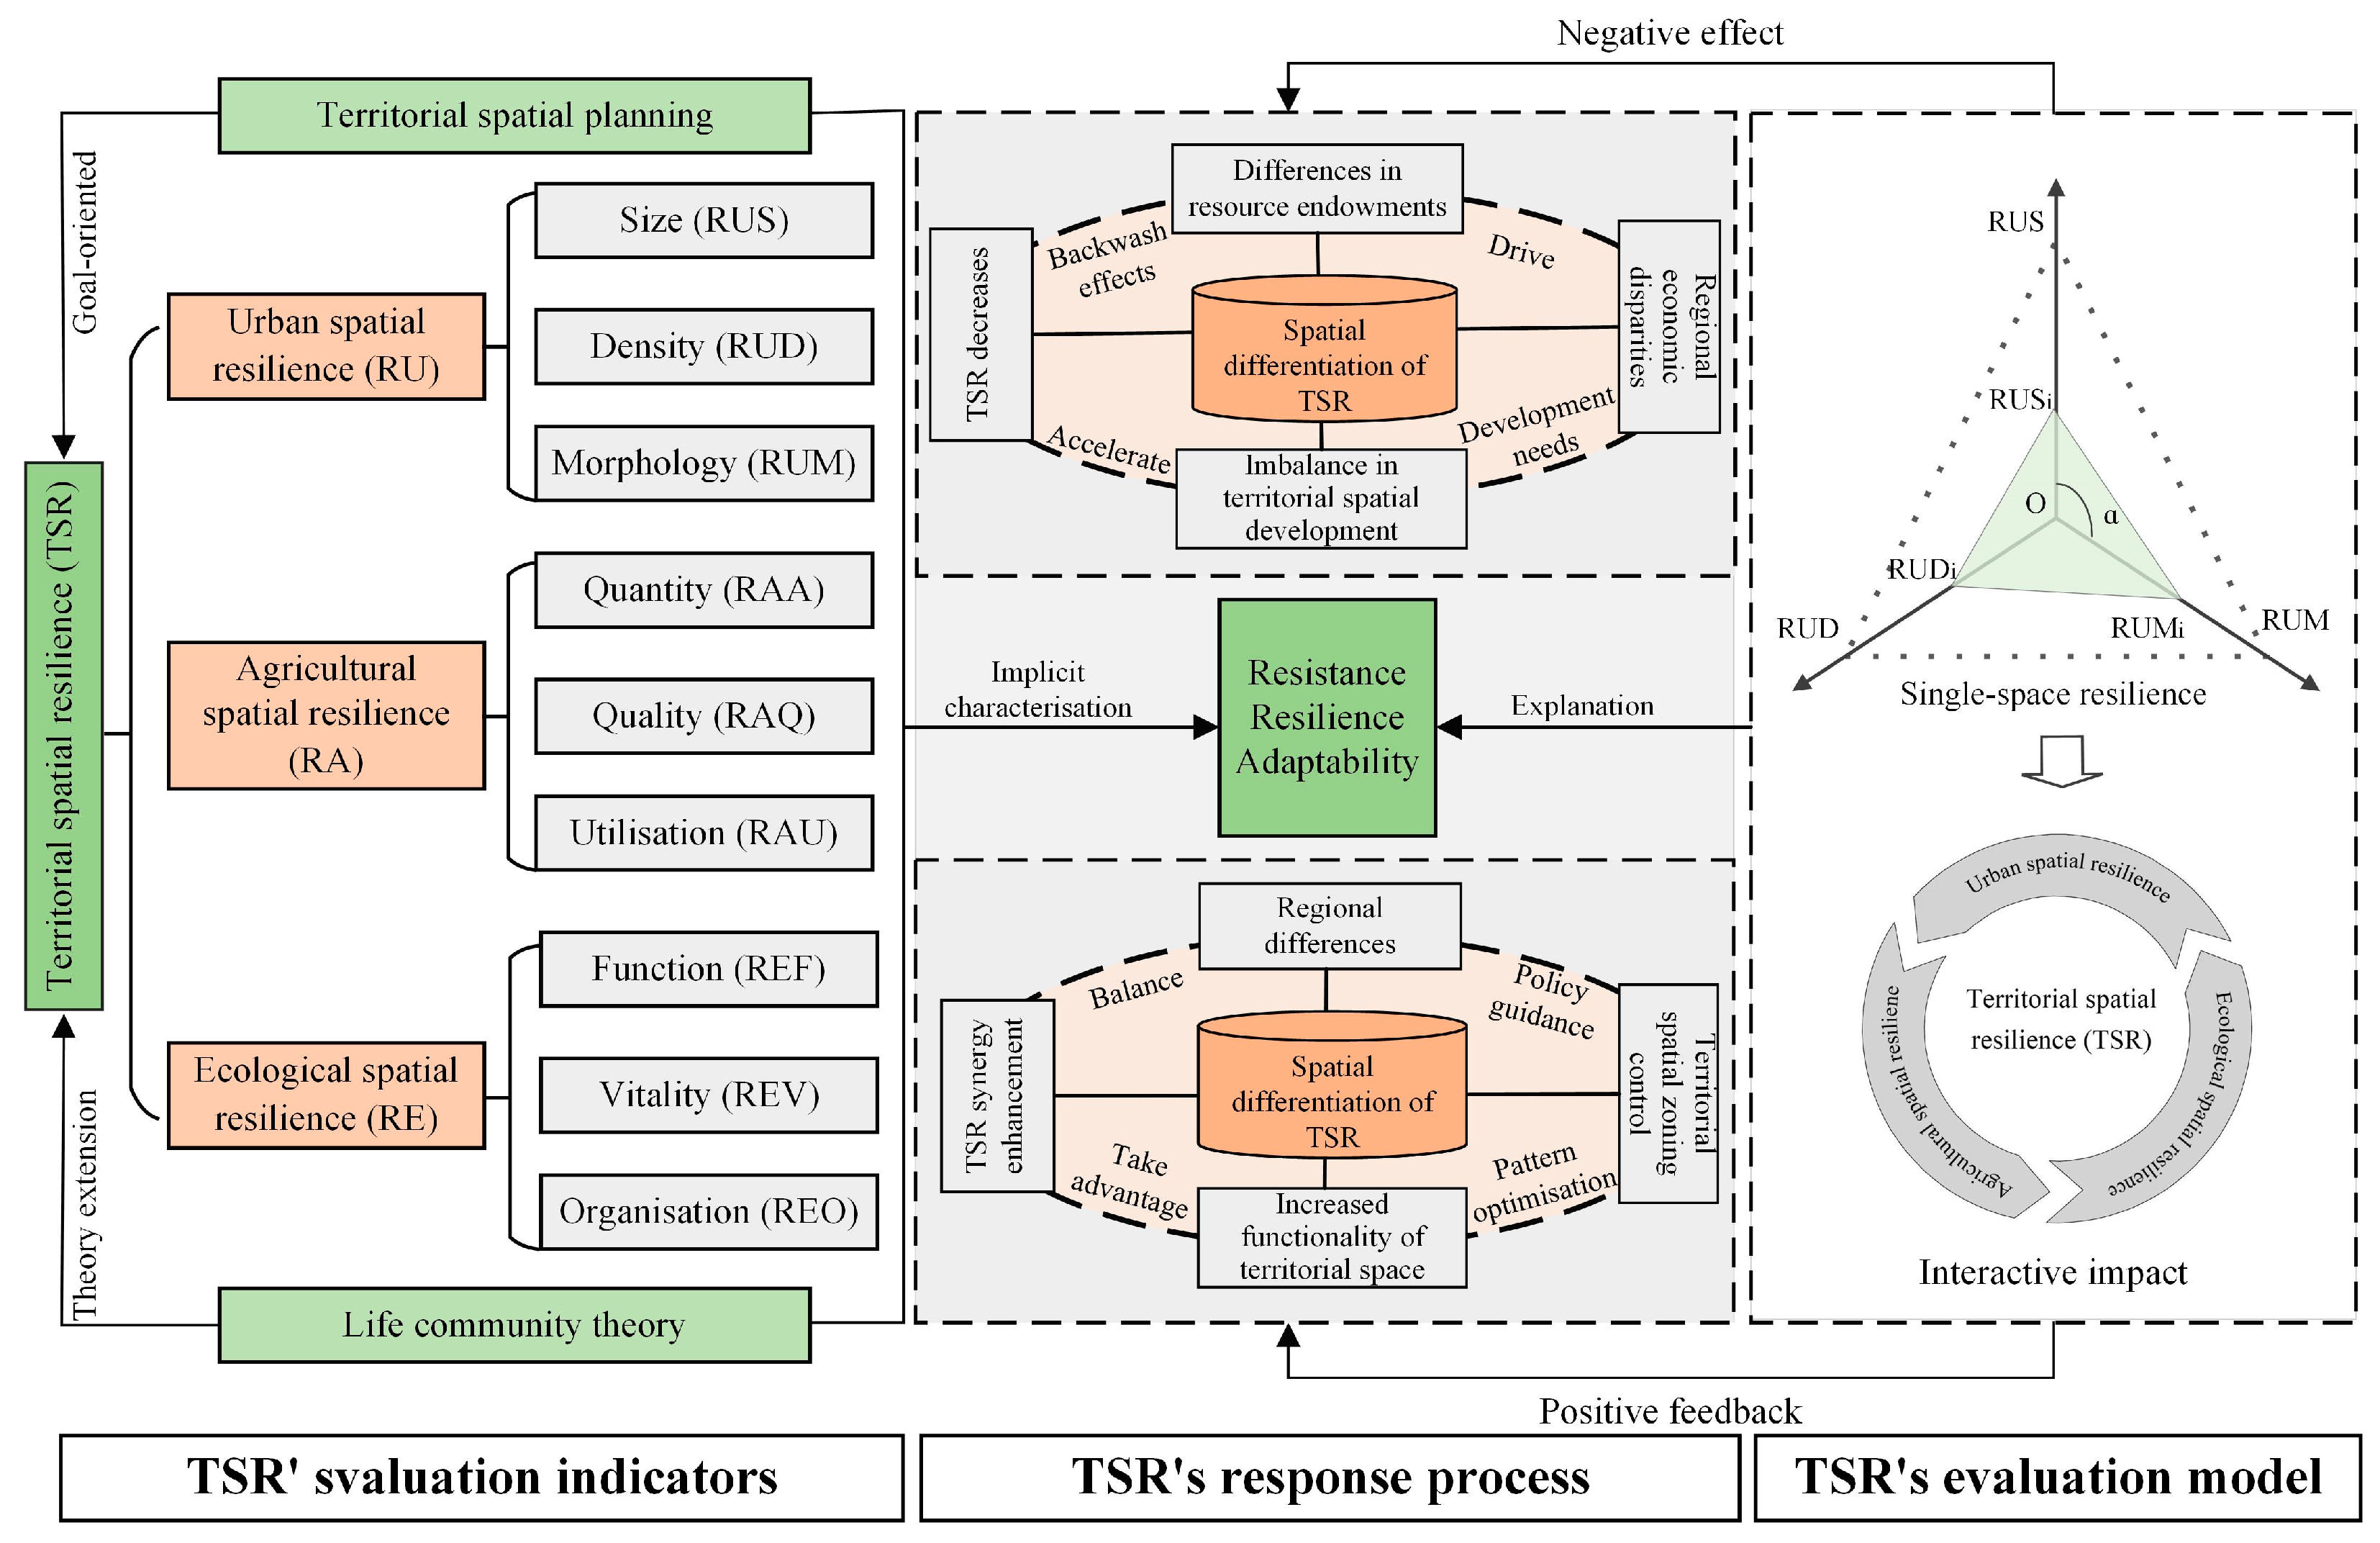
2.2. Technical Framework for TSR Assessment

The assessment of TSR should focus on the elements’ scale, attributes and spatial structure characteristics of the territorial spatial system, as well as the realisation of the dominant functions. For urban space, scale is measured by built-up area, structure is evaluated by spatial form, and function is assessed by economic and population carrying density [42]. For agricultural space, element is measured by arable land quality, structure is assessed by arable land quality, and function is evaluated by arable land utilisation. For ecological space, the element is assessed by vitality, the structure is assessed by landscape pattern and ecological services assess the function (Figure 2).
As urban, agricultural and ecological spaces influence and constrain each other, the interaction of the three makes the TSR evolution characterised by multidimensional linkages. If urban space expands unchecked, the encroachment of neighbouring arable land and ecological landscapes will lessen the connectivity of the city’s blue–green infrastructure, and their carbon sink benefits and ability to withstand construction disturbances will be weakened [43], leading to a decrease in urban spatial resilience (RU). At different spatial scales and environmental gradients, the quality of arable land shows differentiated characteristics, while population growth and economic development have continuously aggravated the pressure on arable land and triggered land degradation of varying degrees [44]. In this context, areas with low agricultural spatial resilience (RA) are vulnerable to strong shocks due to external impacts, such as natural disasters and the hollowing out of rural populations, which can threaten food security and social stability. Ecological space has self-regulating stability, which is mainly reflected in the integrity and sustainability of ecosystems, the fulfilment of ecological functions and the provision of ecological services [45]. In the context of global change, urban expansion and agricultural pollution have caused problems such as damage to ecological space, over-consumption of natural resources and fragmentation of ecological landscapes, decreasing ecological spatial resilience (RE) [46]. On the contrary, if targeted interventions are taken for territorial spatial governance, then highly resilient urban, agricultural and ecological space will form an interconnected positive feedback adjustment mechanism to promote positive interactions among systems of mountains, rivers, forests, fields, lakes, grasses and sands [47].
We built a model to measure the level of each dimension of TSR. Taking RU as an example, the origin represents the initial state of undeveloped urban space. The three axes represent element, structure and function, and the points representing the state of the regional RU system fall on the axes. The length of the straight line between the origin and the coordinate points is the standardised value of the indicator. The area formed by the three indicator values is the RU. With this model, we can obtain single-space resilience. Under the constraints of territorial spatial planning, urban space, agricultural space and ecological spatial resilience will gradually form their respective areas of strength [48]. A territorial spatial system that satisfies the maximisation of social, ecological and economic benefits will achieve functional optimisation and regional coordination [49]. High RU can promote urban economic development, provide funds and technology for agricultural development, improve the efficiency of arable land use, and thus improve RA. The improvement of RA reduces the encroachment of human activities on ecological space and is conducive to the improvement of RE. At the same time, high RE can provide ecological products for urban space, meet residents’ demand for a high-quality environment, and promote the improvement of RU. The territorial space with multi-dimensional high resilience characteristics can lead to the synergistic progress of the regional TSR as a whole.
This study attempts to combine resilience theory with the dynamic process of coordinated development of territorial space, comprehensively consider the interactive influence characteristics of urban, agricultural and ecological spaces, and construct a technical framework for the assessment of TSR.

3. Materials and Methodology
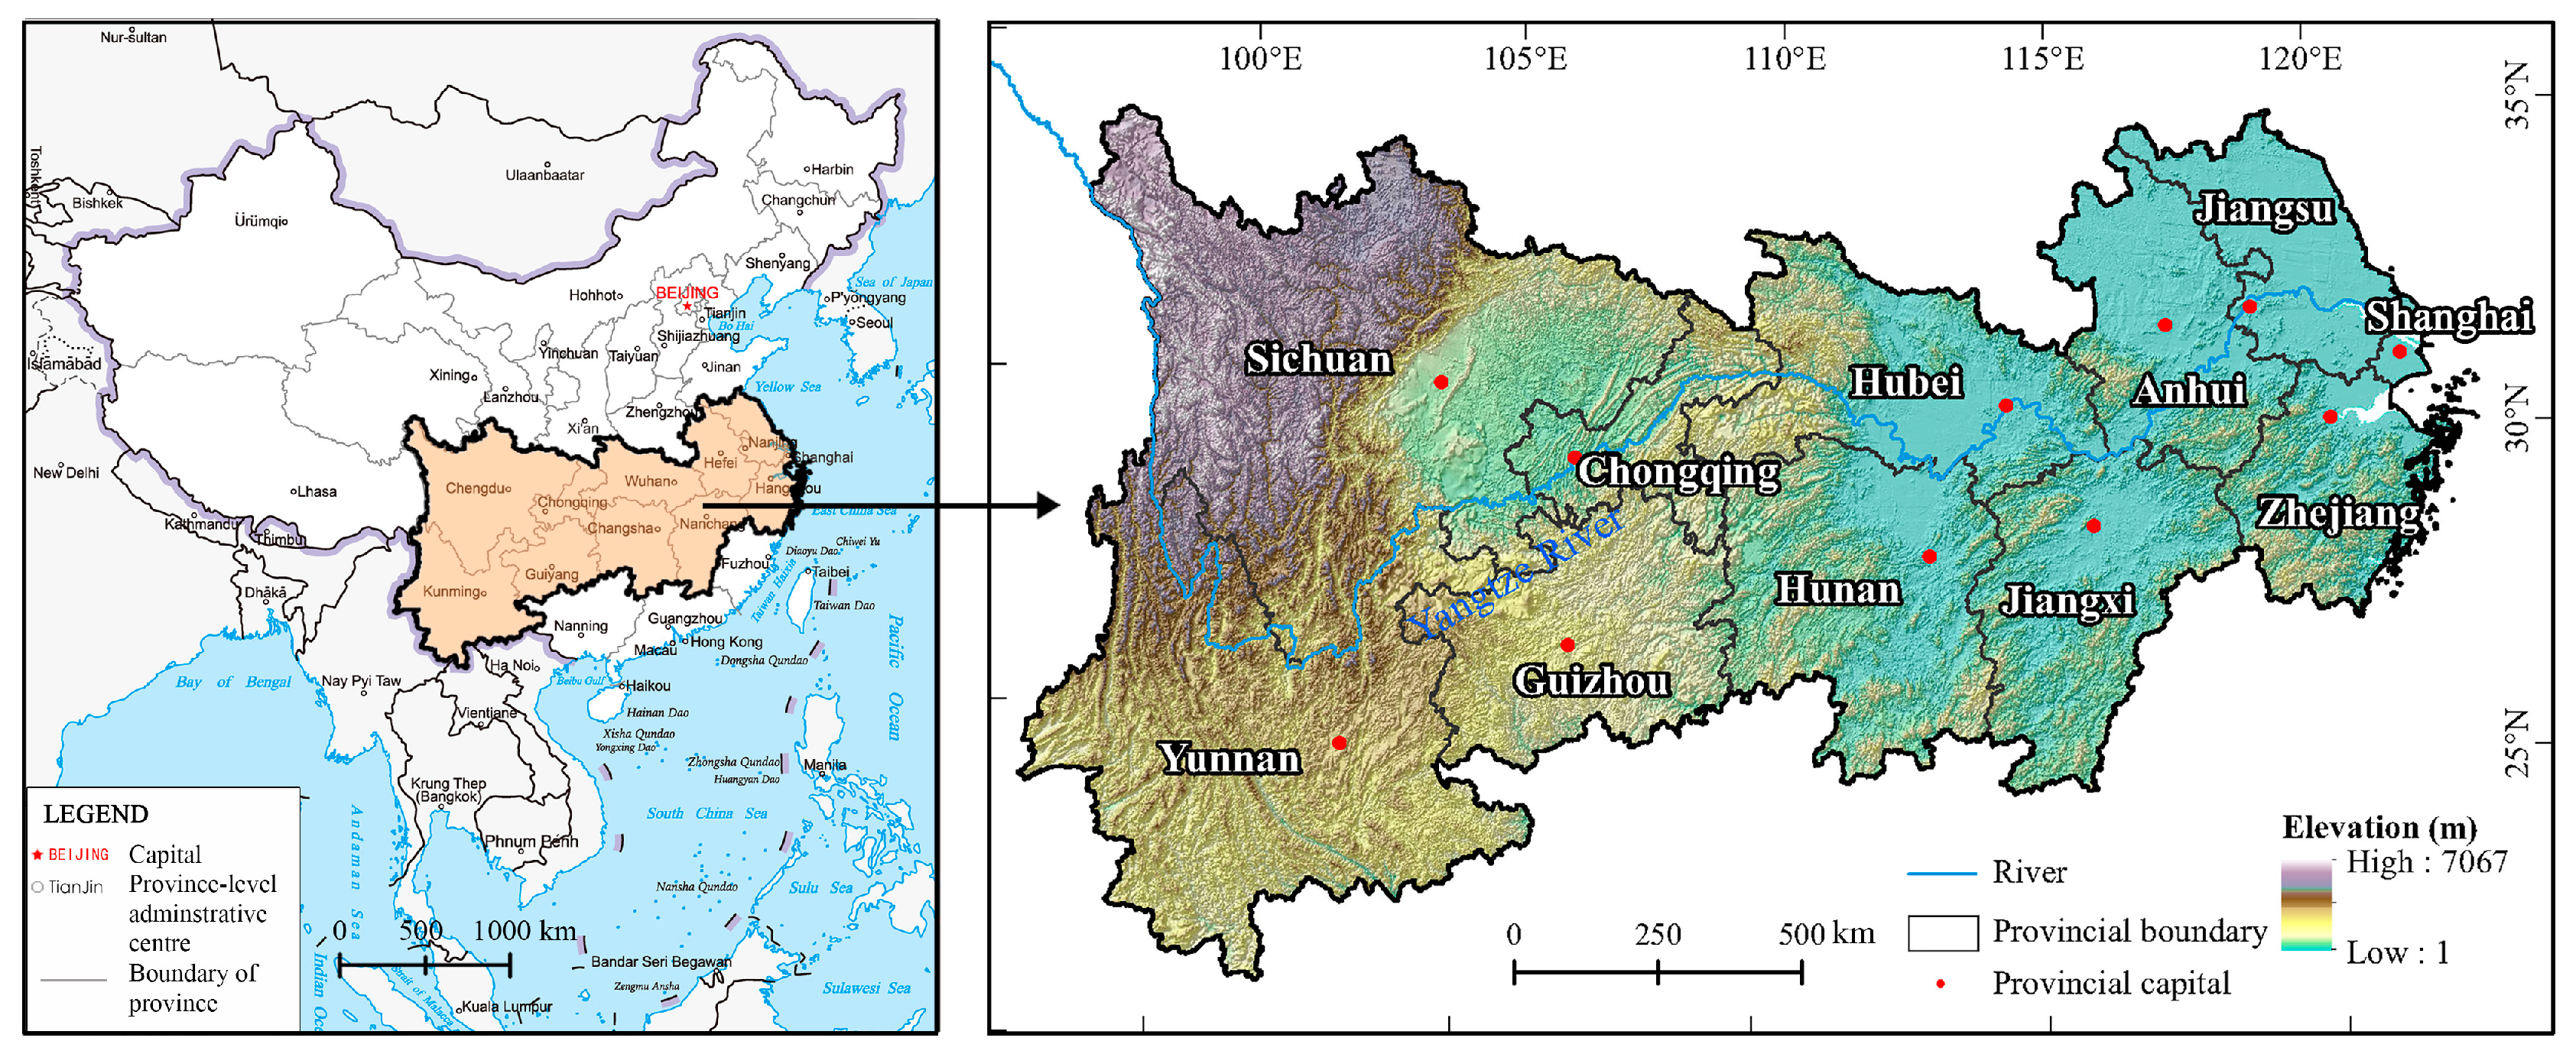
3.1. Study Area

The YREB covers 11 provinces and municipalities (Figure 3), with a total area of 2,052,300 km2. The YREB’s gross domestic product (GDP) reached 56 trillion yuan in 2022, accounting for 45% of the country’s total. Owing to its favourable climate and varied topography, the YREB is rich in agricultural resources and supports national food security as an important commodity grain base in China [50]. Moreover, ecological restoration is a prerequisite for the high-quality development of the YREB. According to the concept of ‘ecological priority, green development’, the shortage of resources, loss of arable land and environmental pollution that accompany urban expansion must be solved urgently [51]. The level of TSR has a direct impact on the region’s capacity for sustainable development. The optimisation of territorial spatial patterns and resilience enhancement in YREB should be promoted to achieve coordinated development of the economy, society and ecology.

3.2. Data Source

We used multiple sources of spatial data and statistics in our study. (1) Land use raster data and normalised difference vegetation index (NDVI) data for 2000, 2010 and 2020 were obtained from the Resource and Environment Data Centre of the Chinese Academy of Sciences, with a spatial resolution of 30 m and 1 km, respectively (https://www.resdc.cn/, accessed on 22 October 2022). The DEM data used are SRTM1 elevation data derived from the USGS with a spatial resolution of 30 m. (2) The spatial data on administrative division boundaries, road networks and water systems were extracted from the standard map service of the National Geographic Information Public Service Platform of the Ministry of Natural Resources (https://www.tianditu.gov.cn/, accessed on 8 January 2023). (3) Socioeconomic data such as resident population and GDP of prefecture-level cities were obtained from the China Urban Statistical Yearbook. We obtained data on arable land and sown area from provincial and municipal statistical yearbooks, and some missing values were supplemented based on data from the National Agricultural Census. (4) Meteorological data used for the study were analysed and processed using daily precipitation products from the China Meteorological Administration. Soil quality data were downloaded from the World Soil Database at a resolution of 1 km.

3.3. Methods

3.3.1. Measurement of TSR

Based on the theoretical framework, according to the classification of urban, agricultural and ecological, we have systematically summarised the TSR measurement methods, as shown in Table 1.
(1) Measuring RU. With reference to the urban resilience assessment framework proposed by existing studies [52,53], we construct a resilience assessment system for urban space from the three dimensions of size, density and morphology.
We used a size resilience index to describe the relationship between the scale of urban construction and the appropriate scale. Ecological infrastructure (EI) indicates the enduring capacity of the natural landscape to support the city and can be used as a constraint to maintain RU. When the built-up area of a city spreads unchecked and minimum ecological infrastructure is not guaranteed, the city’s ability to develop sustainably is compromised [54]. Thus, we measure the magnitude of the city’s level of scale resilience through the relationship between the suitable built-up land boundary under EI constraints and the current state of built-up land. After taking into account the restrictive impacts of ecological functional areas such as mountains, forests and wetlands, spatial superimposition of elements, such as topography, slope, water system, road network, extent of built-up area, and land use type, the suitable construction land boundary that meets the minimum level of ecological safety needs to be obtained. When the built-up area of a city exceeds the area suitable for construction, it signifies that the resources of urban construction space have been exhausted.
Density resilience indicates the RU level in terms of construction density and intensity of human activity. Appropriate urban density is conducive to sustainable urban development, while excessively extreme urban density can lead to development problems. Thus, the combined value of GDP per capita and population density is used to characterise urban density resilience.
According to the source–sink theory of landscape ecology, the negative impacts of built-up land can be reduced by ecological land [55]. A well-mixed and balanced distribution of built-up and ecological land can improve urban resilience in terms of form. The accessibility of built-up land to ecological space was measured by extracting two landscape types, namely, sources and sinks, where sources include built-up land and sinks include woodlands, grasslands and watersheds. We calculated the minimum cost distance from each source raster to the nearest sink and averaged all the minimum cost distances in a prefecture-level city to obtain the average distance index. Finally, we compare it with the average value of the whole study area to obtain the morphological resilience index.
(2) Measuring RA. Agricultural spatial resilience is an important support for achieving stable agricultural production functions and sustainable use of arable land resources [56]. At present, the reduction in the area of arable land, the decline in the quality of arable land, the degradation of farming conditions and the uneven distribution of agricultural resources are seriously affecting the sustainable development of agricultural space [57]. Based on the above, we constructed an assessment system for agricultural spatial resilience in three dimensions: quantity, quality and utilisation.
We used the cropland pressure index to reflect the quantitative characteristics of agricultural space. We used the average agricultural suitability to reflect the qualitative characteristics and production conditions of the agricultural space. The study used the average land value of production to reflect the degree of intensification of agricultural space. In general, farmland with mechanised operations, good management techniques and marketable produce have a high average value of production.
(3) Measuring RE. Maintaining healthy ecosystems is essential to achieving sustainable development of territorial space. Strong ecosystem services, sustained dynamism and stable organisational structures characterise resilient ecological spaces. Based on the evaluation framework of ecosystem health [58], we constructed an assessment system of ecological spatial resilience from the three dimensions of function, vitality and organisation.
We used ecosystem service values to measure the functional characteristics of ecological space [59]. To measure the interactions between different ecosystems objectively, we consider the role of spatial proximity of various land use types. The ecosystem services of the raster are determined by a combination of its land use type and the land use types of its four neighbours. Ultimately, the functional resilience of each city’s ecological space is quantified as the sum of ecosystem service values. The NDVI characterised the ecological space’s vitality level. The organisation of the ecological space was quantitatively assessed using the integrated landscape pattern index.
(4) Measuring dimensions of TSR. This study applies the polygon method to measure TSR in each dimension. The length of the straight line between the origin and the vertex of the polygon is the standardised value of the indicator, and the area of the polygon is the value of the spatial resilience sub-dimension of the territorial space.
R i = 1 6 sin α A a × A b + A b × A c + A c × A a
where  R i  is the TSR index in each dimension,  A a ~ A c  are the standardised values of the indicators and  α  is the angle between the indicators.

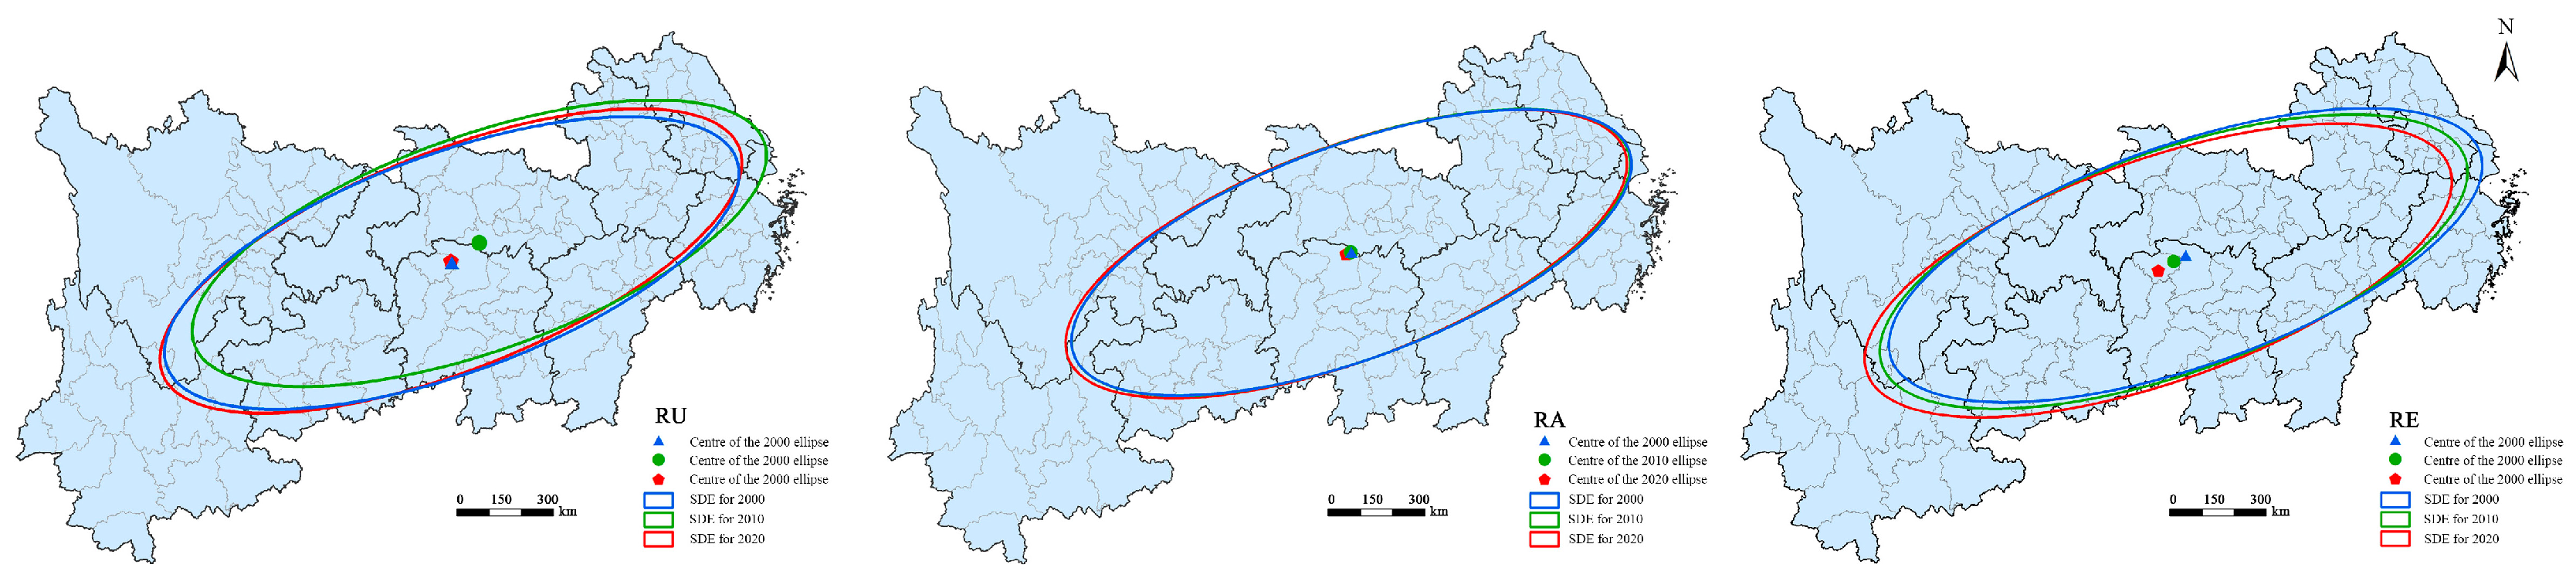
3.3.2. Standard Deviation Ellipse

We used the standard deviation ellipse (SDE) to reveal the overall characteristics of the spatial distribution and the spatio-temporal evolution process of TSR. The centre of the SDE is the mean centre of the spatial distribution of geographic elements, its azimuth reflects the overall trend of the distribution of the elements, and the long and short semi-axes indicate the direction and extent of the distribution of the elements, respectively. The calculation formulas are as follows:
S D E x = i = 1 n w i x i i = 1 n w i
S D E y = i = 1 n w i y i i = 1 n w i
σ x = i = 1 n w i x i ¯ c o s θ w i y i ¯ s i n θ i = 1 n w i 2
σ y = i = 1 n w i x i ¯ s i n θ w i y i ¯ c o s θ i = 1 n w i 2
where  S D E x , S D E y  is the centre of SDE,  n  is the total number of cities in the study area,  σ x  and  σ y  represent the standard deviation of the two axes,  θ  is the azimuth of the ellipse,  x i , y i  represents the coordinates of the spatial location of each element and  w i  is the weight.

3.3.3. Getis-Ord Gi* Statistics

Getis-Ord Gi* statistics was used to identify spatial clustering characteristics of TSR. The formula is defined as follows:
G i * = j = 1 n W i j X j / j = 1 n X j
Z G i * = j = 1 n W i j X j j = 1 n W i j S n j = 1 n W i j 2 j = 1 n W i j 2 n 1
where  W i j  is the spatial weight,  X j  is the magnitude of variable  X  at city  j x ¯  is the sample mean and  S  is the sample variance. For positive z-scores that are statistically significant, the higher the z-score, the tighter the clustering of hot spots. Conversely, the lower the z-score, the tighter the clustering of cold spots.

4. Results

4.1. Spatiotemporal Analysis of TSR

The distribution of RU at different stages shows differentiated characteristics (Figure 4). Low-level districts are mainly located near provincial capitals or large cities that are the first to urbanise, while high-level districts are mostly located at provincial borders. Specifically, in 2000, the high level of RU was concentrated in the borders of five provinces and municipalities, Hubei, Hunan, Chongqing, Sichuan and Guizhou. The low level was mainly in the plains of the middle and lower reaches of the Yangtze River, central and western Sichuan and the northern part of Yunnan Province. Influenced by the national regional development policy, urbanisation and industrialisation in the lower reaches of the Yangtze River are earlier than in the middle and upper reaches of the Yangtze River, so areas with a relatively lagging urbanisation process and suitable location for development show great potential for development; that is, they have higher RU. In 2010, along with the implementation of the strategy of the rise of central China and the development of western China, the construction of cities in the middle reaches of the Yangtze River and the Chengdu–Chongqing region accelerated, so RU declined. Meanwhile, the Yangtze River Delta (YRD) region gradually transformed towards optimising the structure of economic growth and improving the comprehensive carrying capacity of cities. The development patterns of the YRD, the middle reaches of the Yangtze River and the Chengdu–Chongqing urban agglomeration in 2020 have been relatively stable, while the provincial border areas of Hunan, Guizhou and Yunnan have a low intensity of urban space utilisation and sufficient developable reserve land resources.
The RA of the YREB has experienced a gradual upward change process, showing a distribution of low in the west and high in the east. Given the strict constraints of natural conditions, agricultural suitability has obvious regional characteristics. Although the pressure on arable land increases in most cities as the population grows, the comprehensive agricultural production capacity also rises, resulting in an overall upward trend in RA. From 2000 to 2020, RA in the middle and lower reaches of the Yangtze River is consistently dominated by a high level, with its scope expanding over time. In contrast, RA in the upper reaches of the Yangtze River, bounded by the western part of Hunan province in Hubei, is predominantly a low-level area. Significant changes are reflected in the decrease in RA in Zhejiang Province mainly because Zhejiang Province is one of the main grain marketing areas in China and the pressure on its arable land increases with urban development.
RE exhibits a pattern of spatial differentiation between the high west and the low east, which has been strengthening over time, creating an apparent spatial mismatch with RA. Areas in the upper reaches of the Yangtze River with high RE tend to have low RA, while the middle and lower reaches of the Yangtze River, where high values of RA are dense, are prone to have low values of RE. In 2020, a significant decline in RE was observed in the YRD region, with most of the remaining regions experiencing increases. The differences between regions are gradually expanding, forming a distribution characteristic of the highest in the west, the second highest in the centre and the lowest in the east. The middle and lower reaches of the Yangtze River need to be given more consideration in the future to achieve coordinated development of the ecological environment, the economy and society to improve the TSR.

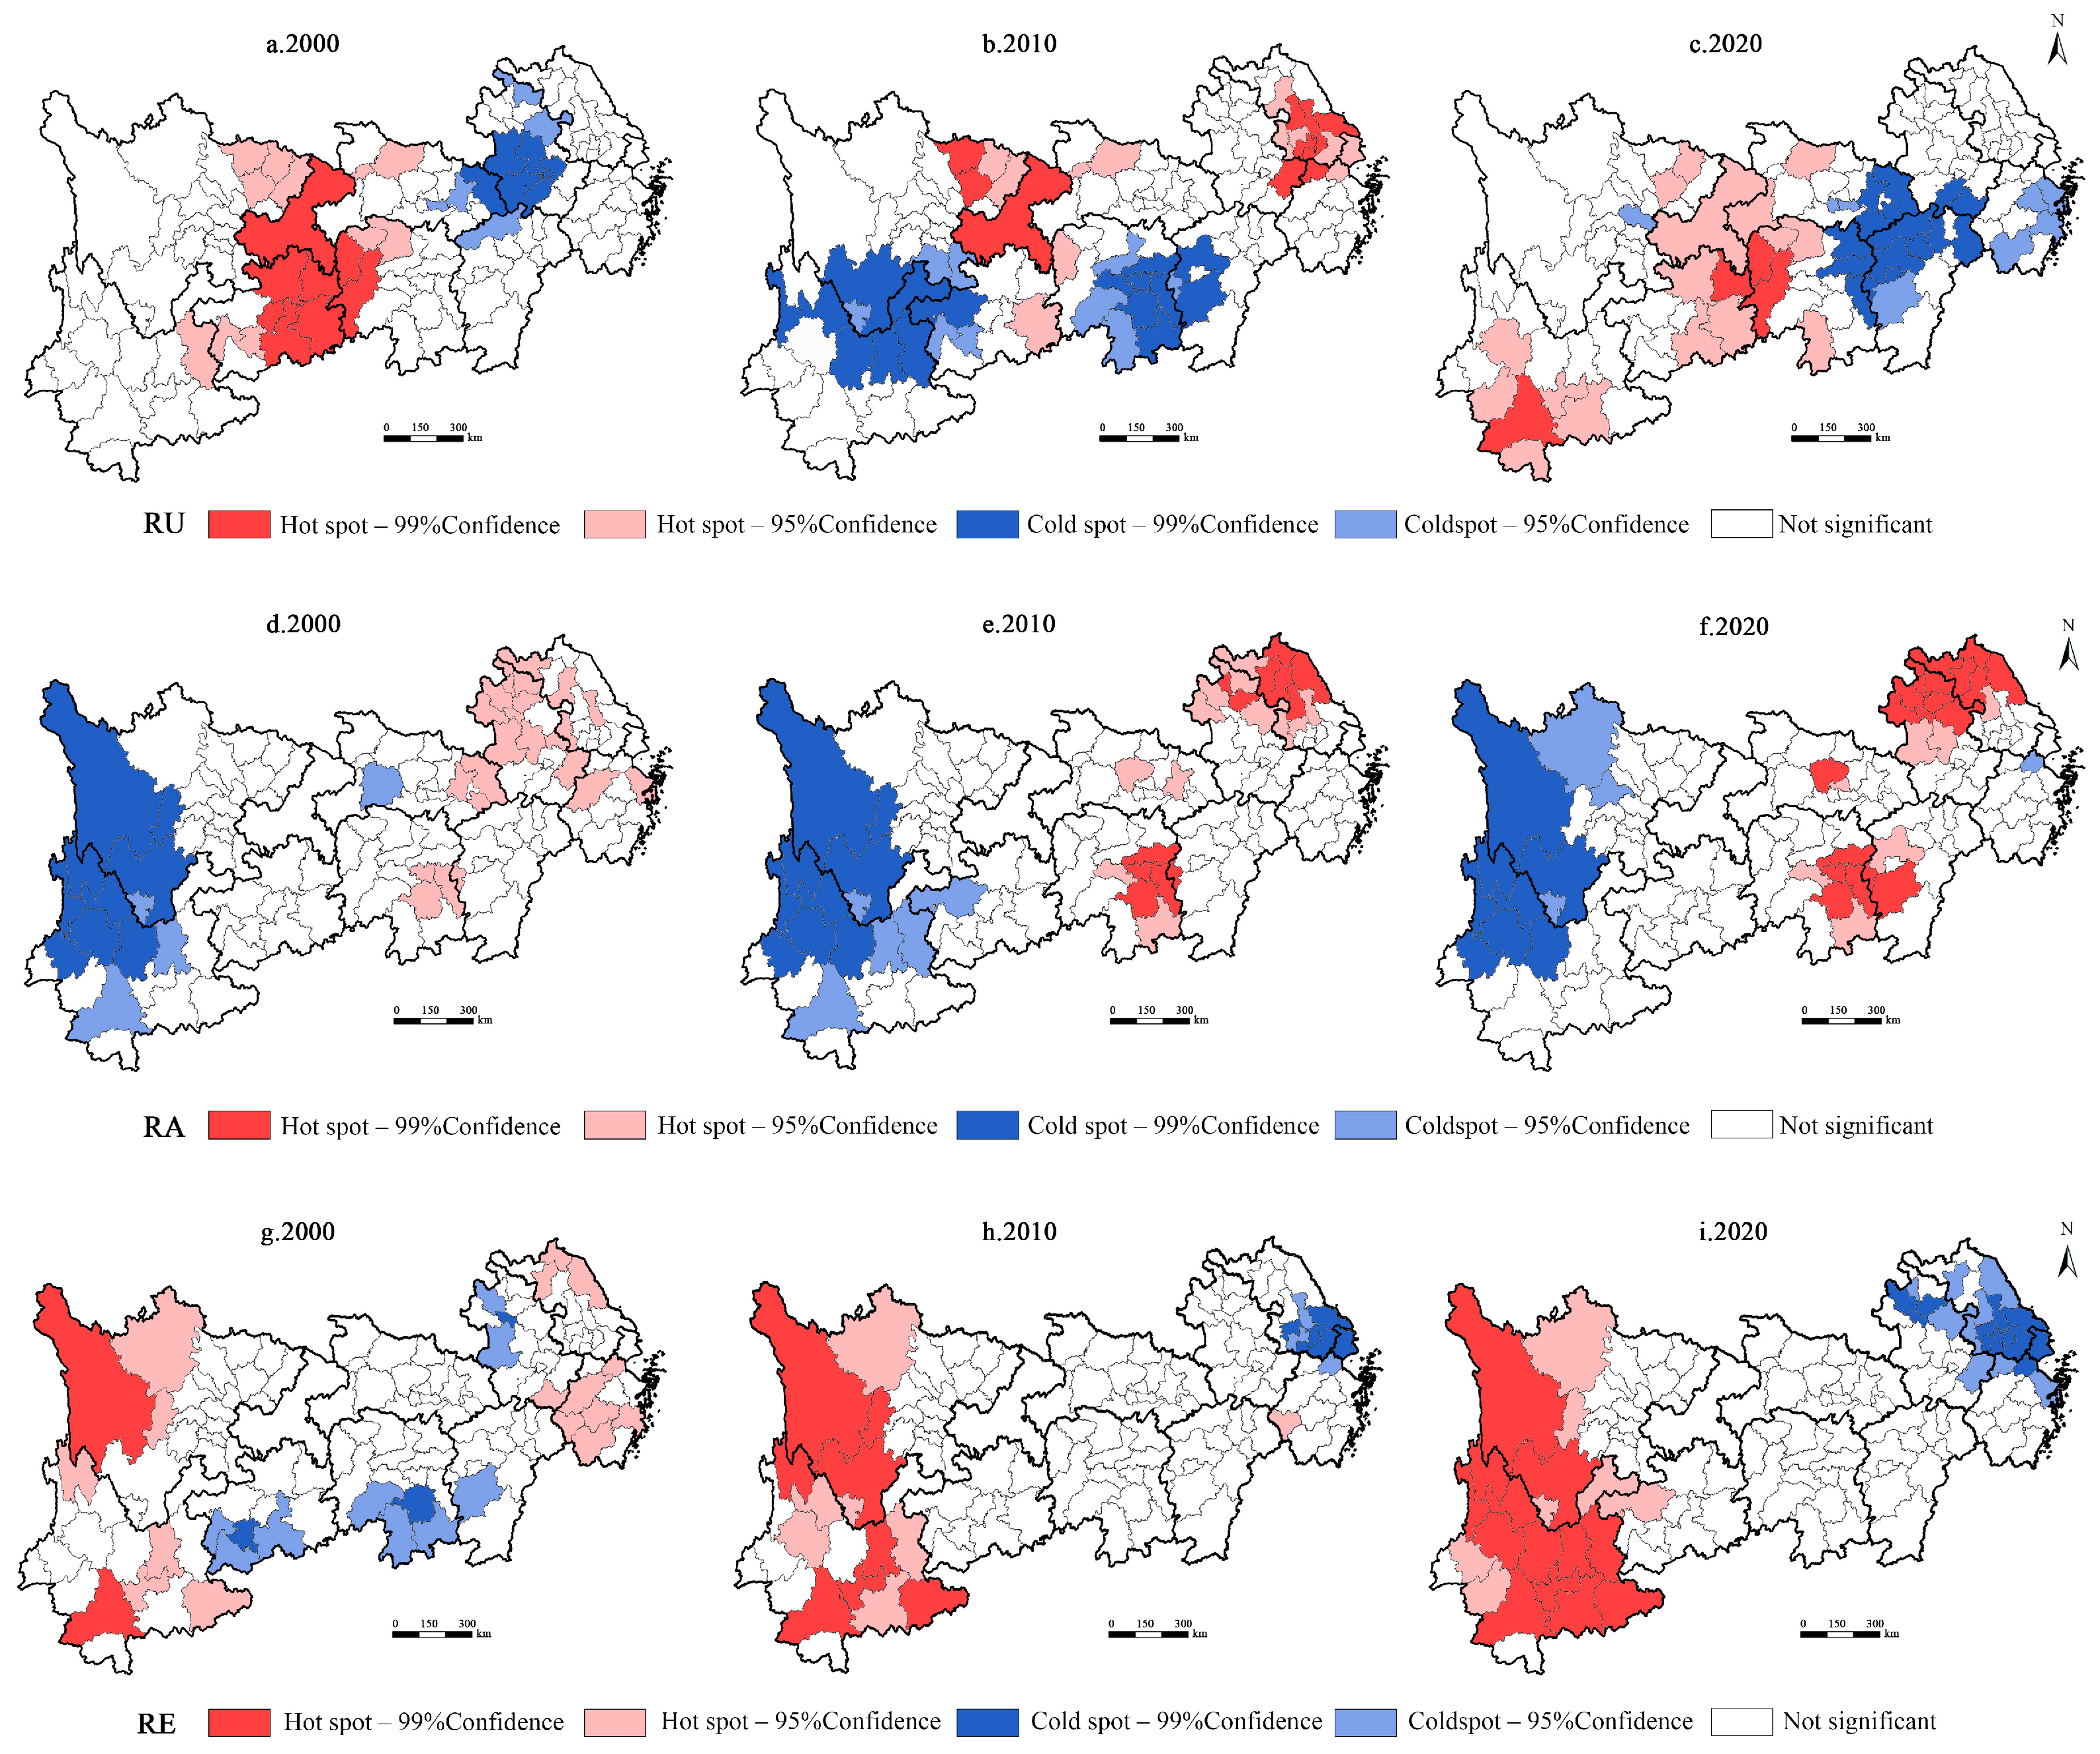
4.2. Spatial Clustering Characteristics of TSR

The results of the SDE analysis are shown in Figure 5. From 2000 to 2020, the centre of the RU in the YREB moved first to the northeast and then to the southwest, and its azimuth first increased and then decreased, changing from 70.01° to 68.57°. The centre of RA has shifted slightly to the southwest. Given that RA primarily depends on the endowment differences in natural conditions, although RA has increased or decreased in some areas, these changes have not been deemed significant in the whole study area. The centre of RE gradually shifted to the south–west direction from 2000 to 2020. The standard deviation of the short axis gradually increases, indicating that the RE distribution tends to be discrete in the south–north direction. The standard deviation of the long axis gradually decreases, indicating that the RE distribution tends to contract in the southeast–northwest direction. This decrease is mainly due to the accelerated development of the urban agglomeration in the middle reaches of the Yangtze River, which poses a certain threat to the ecological environment.
We further reveal the spatial clustering characteristics of the TSR of the YREB through Getis-Ord Gi* statistics (Figure 6). The 2000 RU hot spot areas are concentrated along the borders of Chongqing, Guizhou and Hunan provinces, where urbanisation is lagging. Cold spot areas are concentrated in Anhui and eastern Hubei provinces, where construction land is concentrated and population density is high. In 2010, two main hot spot distribution areas were formed. In addition to Chongqing and its neighbouring areas, where hot spot distribution was formed earlier, the hot spot cluster in the YRD region was formed with Shanghai as the core to drive the quality of urbanisation in the surrounding areas. In 2020, hot spot areas were mainly clustered in western Hunan, eastern Guizhou and southern Yunnan, with a distinct cold spot area forming within the junction of Hubei, Hunan and Jiangxi. In recent years, the integrated development of the urban agglomerations in the middle reaches of the Yangtze River has contributed to the spread of urban space, causing territorial space to carry higher pressure for economic activities. There is ample suitable land for building in the traditional agricultural areas of the Midwest Junction, but urban economic and population growth is weak, so the hotspot clustering effect of the RU has diminished.
During the study period, the number of hot spots of RA gradually increased, and two centralised distribution areas centred on Anhui–Suzhou and Hunan–Jiangxi gradually formed, indicating a positive mutual reinforcement of RA among prefecture-level cities. The cold spot areas of RA were mainly concentrated in the mountainous areas of Sichuan and Yunnan Provinces, with the number increasing and then decreasing over time. Poor agricultural growing conditions and frequent geological disasters are the main reasons restricting the growth of RA. The clustering trend of RA low in the west and high in the east is intensifying, mainly because of topography and climate. The middle and eastern parts of the YREB have flat topography and abundant precipitation, so the agricultural economy is well developed. In contrast, the western region is mostly mountainous, with fragmented arable land, which is not conducive to agricultural production, so RA is low.
In contrast to the RA, the RE hotspot areas continue to concentrate in areas with little disturbance from human activities, such as Sichuan and Yunnan. Cold spot areas were scattered in southern Guizhou, Hunan Province and northwestern Anhui Province in 2000 and then clustered towards Shanghai and the surrounding areas. Despite the government’s increased demand for ecological protection in the YREB, the eastern coastal cities are facing increasing population pressure, and the conflict between economic development and ecological protection is significant, showing a growing concentration of cold spots. A mismatch is identified between economic development and ecological construction in the YRD region, and the protection and control of the quality of the ecological environment should be strengthened in the development of territorial space.

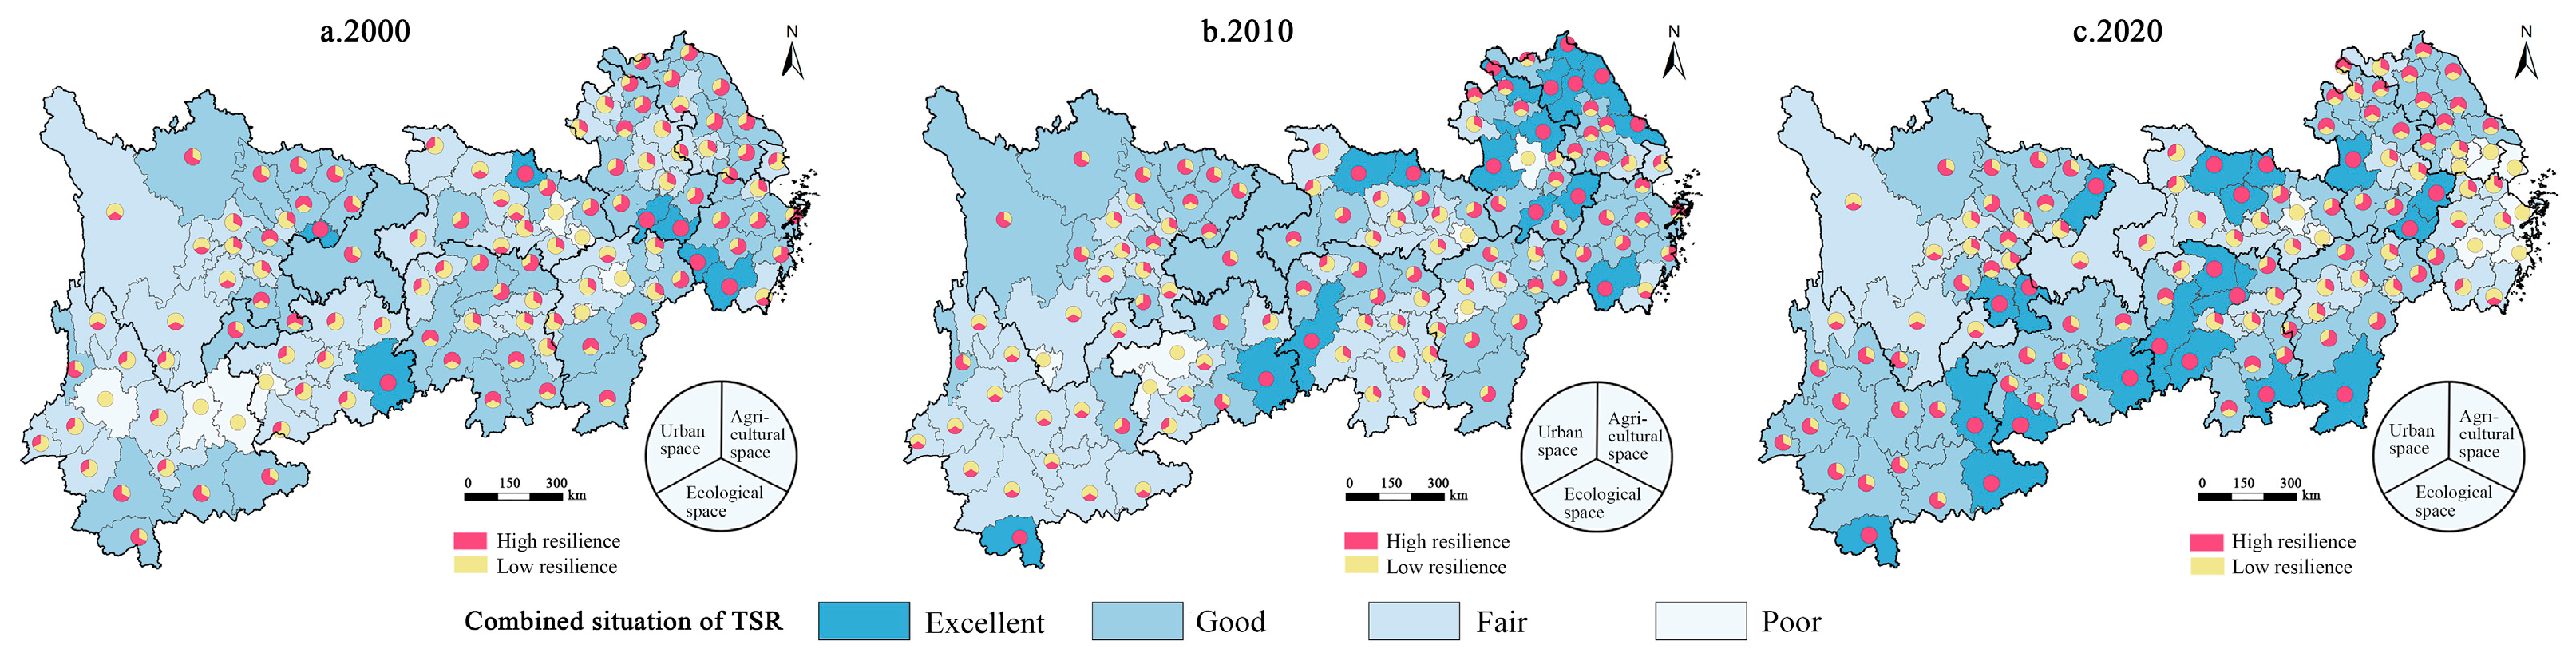
4.3. Functional Classification of TSR in the YREB

We analysed the combining forms of the three types of resilience. Taking the average of the whole YREB as a judgement criterion (Table 2), we define each spatial resilience greater than the average as high resilience and the rest as low resilience. We levelled the city according to the combination of the dimensions, setting areas with high values in all three dimensions RU, RA and RE as excellent, areas with high values in any two dimensions as good, areas with high values in only one dimension as fair and the rest as poor.
As shown in Figure 7, only seven cities in the YREB in 2000 had an excellent combination of TSR. They are mainly located in the north of Zhejiang Province and the south of Anhui Province, which have strong resilience and high development potential in territorial space. Approximately 52.8% of the cities have a good TSR combination, with the most notable development of RA and RE in harmony. A prosperous agricultural economy and stable ecological landscape structure are important reasons for their grouped layout. A total of 62 cities have fair TSR combinations. Cities with high RU are mainly located in the Yunnan–Guizhou region and the Hubei–Hunan border. Cities with high RA are the most widely distributed, and those with high RE are mainly located in the western part of Sichuan Province and the central part of Hubei Province. The number of regions with excellent and good TSR combinations increased in 2010, and the types with excellent combinations were scattered in Jiangsu and Anhui provinces. The total number of fair combination areas decreased to 54, the concentrated RU–RA combination areas of high-value in southern Hunan Province were transformed into single RA high-value areas, and some cities in central and western Yunnan Province were transformed from RU high-value areas to RE high-value areas. The phenomena are all related to the massive expansion of urban construction land from 2000 to 2010. In implementing new-type urbanisation and ecological civilisation, a marked improvement is found in the TSR combination in the YREB. Approximately 60.8% of TSR combinations were excellent or good in 2020. The RU–RE combination is concentrated in Yunnan, Guizhou and Sichuan, and the RU–RA combination is grouped in Jiangsu and Anhui. The type of poor combination in this period is mainly found in cities with a high level of economic development.
Taking the mean values of RU, RA and RE from 2000 to 2020 as the classification basis, we applied the K-means function to divide spatial units with high similarity into the same interval for TSR functional classification. When the value of k is 5, the sum of squares within the group is characterised by a strong inflexion point. Thus, the study area is divided into five functional types, including three dominant types of RU, RA and RE and two combined lagging types of RU–RA and RU–RE (Figure 8). The clustering results passed the significance test.
RU dominant regions are cities with sufficient land for suitable construction and maintain a medium level of RA and RE, which can be properly strengthened with infrastructure to stimulate urban vitality. The RA dominant regions are concentrated in the middle and lower plains of the Yangtze River, which have the strongest agricultural suitability, medium level of RU and the lowest level of RE. Such cities should accelerate the resolution of agricultural productivity inefficiencies to alleviate the pressure on ever-increasing arable land. At the same time, they should focus on building green infrastructure to enhance the carrying capacity of the ecological environment. The RE dominant region is concentrated in the predominantly mountainous western area, which has the highest level of RE, higher level of RU and lower level of RA. These areas should continue to strengthen the synergistic restoration of ecological corridors and ecological functional areas, enhance the ability of mountains to withstand soil erosion and stabilise the ecological service functions of forest, grass and water systems. The RU–RA lagging areas are distributed in a more dispersed chain, with RU and RA at low-to-medium levels and RE at high-to-medium levels. Such cities should focus on development strategies that optimise urban form. Simultaneously, they should promote the development of traditional agriculture towards the integration of agro-tourism, modern urban agriculture, agro-entertainment and other industries. RU–RE lag zones have the potential for agricultural development, but their ecological regulation capacity is weakened with excessive urban development. Improving the quality of urban agglomeration development is the main direction for the optimal development of this category of cities.

5. Discussion

5.1. Response of TSR to Urban–Agricultural–Ecological Space in Different Stages

The changes in TSR are caused by the combined effect of RU, RA and RE. This effect is phased and spatially varied, driving a spiralling trend in TSR.
During the period of rapid economic and social development (2000–2010), when cities were in a state of expansion, the evolution of TSR in the YREB was mainly dominated by RU, with relatively little change in RA and RE. Although territorial spatial management began to explore structural optimisation in that period, irrational urban space development and unsound policy systems still led to a series of problems. Moreover, regional economic development and natural environment differences exacerbate structural differences in the evolution of TSR patterns. Strongly influenced by human activities, the RU in the YREB has experienced a process of decreasing and then increasing, which can be corroborated by the results of existing studies [60]. It has been shown that rapid urbanisation and industrialisation are the main factors leading to changes in TSR during this period [61]. Given its economic and policy advantages, Zhejiang Province has increased its urban development during this period, making its RU lower than the average level of the YREB. However, the combination of TSR in most cities in Zhejiang Province is generally in poor condition in the later period due to the shrinkage of agricultural and ecological space triggered by early urban spatial expansion. Although the implementation of the strategy of western development and the rise of central China has promoted the urbanisation of the central and western provinces, there are still shortcomings such as a weak industrial base and a lack of prominent location advantages, so the RU has declined. The phenomenon suggests a correlation between functional areas. A low level of resilience in a single space has an impact on the resilience of other spaces.
During the period of coordinated economic and social development (2011 to the present), urbanisation has transitioned from rapid growth to a focus on high-quality development. Concurrently, the TSR of the YREB has shifted from being RU-dominant to the development to a mode emphasizing the protection mode of the simultaneous rise of RA–RE. The spatial resilience of 36.2% of the cities in the YREB is on an upward trend, with the number of cities with a good combination increasing from 46.2% to 60.8%, but the causes of the improvement vary from place to place. Wu et al. (2023) [62] found a gradual rise in RUs in the LRD after 2013. Ye et al. (2022) [63] provided similar evidence for the YREB. This is influenced by a number of factors, including nature, economics and policy. Natural geographic features have laid the foundation for RA and RE, and improved agricultural technology and stronger ecological protection have contributed to higher RA and RE. The upward trend in the Yunnan–Guizhou region is the most significant, as evidenced by the significant increase in RE. The high ecological vulnerability of the Yunnan–Guizhou region is a major factor limiting its development, and the long-term implementation of ecological restoration projects has improved the natural environment and increased the level of RE. Even if the expansion of urban and agricultural space is limited, its TSR has continued to develop to a high level. Moreover, the implementation of strict arable land protection policies in the middle and lower reaches of the Yangtze River has contributed to the intensification of urban and agricultural spaces. In addition, policy factors play an important role. The development plan of the city in that period called for strengthening the composite use of various types of land space, so the combination of RU and RA or RU and RE became better. The interaction of RU, RA and RE is critical in influencing changes in TSR. Significant evidence for this view can be found in the study on homestead space utilisation by Qu et al. (2023) [11]. Thus, in the process of rationally optimising the spatial layout of the territory, the crux of the problem that hinders the enhancement of TSR must be identified to promote the enhancement of RU and RA under the premise of guaranteeing ecological function.

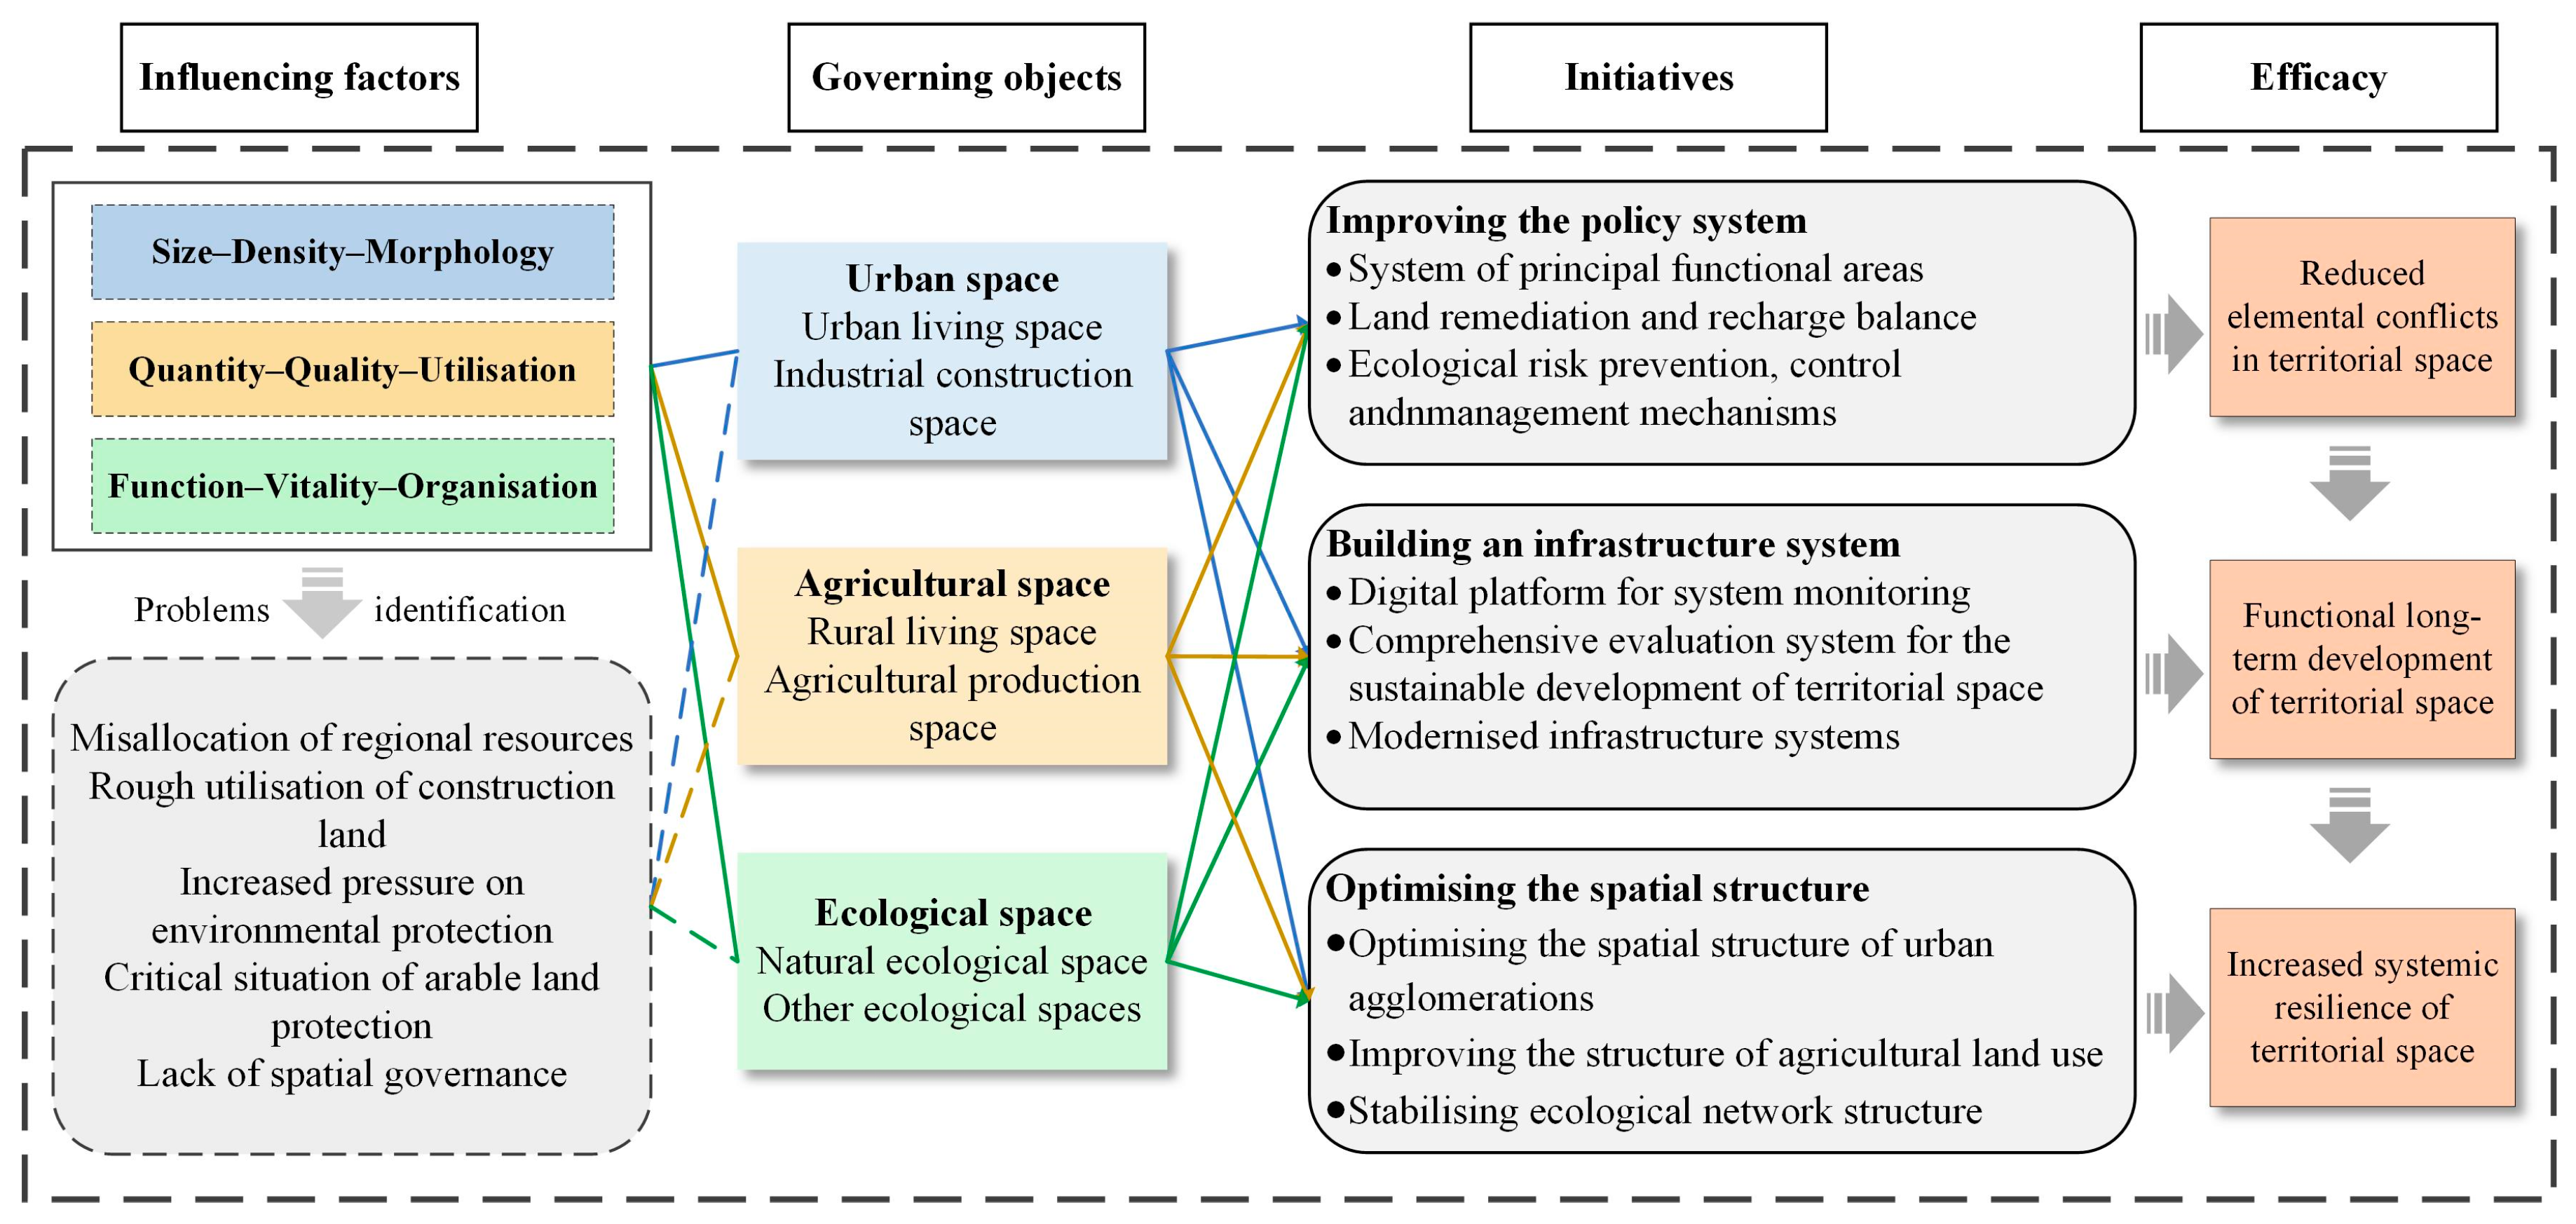
5.2. Pathways to Optimise TSR in the YREB

According to the evaluation results of the TSR level of the YREB, to achieve the optimisation goals of high efficiency of urban space, improvement of the quality of agricultural space and conservation of ecological space, differentiated countermeasures should be taken to address different development problems. From the systematic and holistic features of the territorial space, the production function, ecological function and living function of the region should be comprehensively enhanced (Figure 9).
(1)
Promoting institutional innovation and policy implementation. Although many land use policies have been put forward in China, these policies need continuous improvement and vigorous pursuit. We should gradually establish and improve the management mechanism of the three land-management “red lines”, i.e., urban growth boundaries (UGBs), ecological protection redlines (EPRs), and basic farmland protection zones (BFPZs) to alleviate the risks of territorial space development. Therefore, it is necessary to continue to promote the improvement of the ecosystem and to implement the main functional area strategy. Optimising requisition-compensation balance of farmland policy is necessary to achieve a dynamic balance of the total amount of arable land. Particular attention should be paid to the over-occupation of arable land by urban construction, agricultural restructuring and pollution of arable land. To achieve efficient use of the stock of construction land and optimise the layout, it is necessary to strengthen the three-dimensional composite development of space and guide the flexible adjustment of land use and composite use. The government should continue to innovate mechanisms for preventing, controlling and regulating ecological risks; implement strict use control in areas of the middle reaches of the Yangtze River where ecological space is vulnerable to urban spatial encroachment; accelerate the construction of water system restoration; and regulate the order of resource development.
(2)
Strengthening the construction of infrastructure systems. We should strengthen infrastructure development including public services, transportation infrastructure, water conservancy facilities, energy facilities and emergency facilities. For example, Shanghai, as a mega-city, should focus on optimising the overall layout of public service facilities, municipal infrastructures and disaster prevention and evacuation facilities in the compilation of territorial spatial planning, so as to improve its adaptive capacity to cope with various types of disturbances. In traditional agricultural areas, the Government should strengthen agricultural infrastructure to increase the scale and efficiency of agriculture through modern plants, mechanised farming patterns and intelligent cultivation techniques in order to strengthen the monitoring and repair of nature reserves in RE dominant areas, build biodiversity protection networks and ecological corridors, and give full play to the supporting role of ecological functions in the improvement of RU and RA.
(3)
Optimising the structure of territorial space enhances the spatial structure of urban agglomerations in line with the requirements of urban renewal, urban–rural integration and regional coordination and to improve the comprehensive carrying capacity of urban space. This approach includes accelerating the restructuring of the industrial structure, transforming traditional industries and building a green and ecological economic system. In response to the widespread fragmentation of arable land and the high degree of intertwining of towns and farmland in the Yangtze River Basin, it is imperative to rationally configure the structure of arable land use. For example, arable land and cities, forests and grasslands, rivers and lakes and wetlands should be regarded as interrelated wholes, the ecological environment of farmland should be improved, and the production potential of agricultural space should be fully tapped. In addition, efforts should centre on integrating and optimising the protection and restoration patterns of mountains, water, forests, fields, lakes, grasses and sands and improving the quality and resilience of ecosystems using zonal diagnosis and precise restoration.

5.3. Shortcomings and Prospect

Our research still has deficiencies. Firstly, we have not sufficiently analysed the territorial spatial system’s scale effect characteristics and element coupling characteristics. Moreover, the driving modes of TSR changes vary considerably in different regions, and conducting in-depth studies in the various areas is necessary, especially in those regions where TSR changes are relatively rapid. In subsequent research, we will further study the process and mechanism of TSR differentiation and transformation in different areas to regulate optimally the development and protection behaviour of land space more scientifically and effectively and to achieve sustainable use of the territorial space.

6. Conclusions

This study assessed TSR from three types of urban, agricultural and ecological space, and three dimensions of elements, structure and function, and a comprehensive judgement is made through the combined state of the three. We have developed a comprehensive system of indicators to accurately quantify TSR, which emphasises the coordination of urban, agricultural and ecological spaces.
The main conclusions are as follows: (1) There is a complex dynamic evolutionary process of TSR. From 2000 to 2020, the RU of the YREB declined first and then rose, with the low-value areas mainly distributed around the big cities and the high-value areas primarily located at the provincial borders. RA has an upward trend, and the equilibrium between the regions is enhanced, with the characteristics of the pattern of high in the west and low in the east becoming more and more significant. RE values continued to rise, but the differences between regions are widening, creating a spatial mismatch with RA. (2) The spatial clustering phenomenon of TSR is evident. The TSR combination of the YREB improved during the study period, with the widest distribution of single high RA. In the context of promoting high-quality development, the combination of RU–RA and RU–RE presents developmental advantages. According to the TSR evolution characteristics, the YREB is divided into three spatial resilience advantage areas of urban, agriculture, and ecology, as well as two combined spatial resilience lagging areas of RU–RA and RU–RE. (3) The evolution of TSR is generated by the joint action of the three spatial categories of RU–RA–RE and is dominated by the RU changes, which affect the RA and RE responses. The key to regulation is to mitigate internal conflicts in the territorial space through policy innovation. The support system for TSR is further strengthened. The focus is on optimising the multifunctional structure of the territorial space to facilitate the continuous improvement of TSR.

Author Contributions

Conceptualization, Y.Z. and J.C.; methodology, J.C.; software, Y.P.; validation, X.K.; formal analysis, X.K.; investigation, J.S.; resources, X.K.; data curation, Y.P.; writing—original draft preparation, H.J.; writing—review and editing, J.C.; visualization, J.S.; supervision, Y.Z.; project administration, J.C.; funding acquisition, Y.Z. All authors have read and agreed to the published version of the manuscript.

Funding

This research was funded by the National Natural Science Foundation of China, grant number 41901201 and 42361028.

Data Availability Statement

The data presented in this study are available on request from the authors. The data are not publicly available due to privacy.

Conflicts of Interest

The authors declare no conflicts of interest.

References

  1. Assiri, M.; Barone, V.; Silvestri, F.; Tassinari, M. Planning sustainable development of local productive systems: A methodological approach for the analytical identification of Ecoregions. J. Clean. Prod. 2021, 287, 125006. [Google Scholar] [CrossRef]
  2. Hu, Q.; Shen, W.; Zhang, Z. How does urbanisation affect the evolution of territorial space composite function? Appl. Geogr. 2023, 155, 102976. [Google Scholar] [CrossRef]
  3. Brunetta, G.; Ceravolo, R.; Barbieri, C.A.; Borghini, A.; de Carlo, F.; Mela, A.; Beltramo, S.; Longhi, A.; De Lucia, G.; Ferraris, S.; et al. Territorial Resilience: Toward a Proactive Meaning for Spatial Planning. Sustainability 2019, 11, 2286. [Google Scholar] [CrossRef]
  4. Menzori, I.D.; de Sousa, I.; Gonçalves, L.M. Urban growth management and territorial governance approaches: A master plans conformance analysis. Land Use Policy 2021, 105, 105436. [Google Scholar] [CrossRef]
  5. Frantzeskaki, N. Seven lessons for planning nature-based solutions in cities. Environ. Sci. Policy 2019, 93, 101–111. [Google Scholar] [CrossRef]
  6. Remøy, H.; Street, E. ‘The dynamics of “post-crisis” spatial planning: A comparative study of office conversion policies in England and The Netherlands. Land Use Policy 2018, 77, 811–820. [Google Scholar] [CrossRef]
  7. Holling, C.S. Resilience and Stability of Ecological Systems. Annu. Rev. Ecol. Syst. 1973, 4, 1–23. [Google Scholar] [CrossRef]
  8. Leitner, H.; Sheppard, E.; Webber, S.; Colven, E. Globalizing urban resilience. Urban Geogr. 2018, 39, 1276–1284. [Google Scholar] [CrossRef]
  9. Cumming, G.S. Spatial resilience: Integrating landscape ecology, resilience, and sustainability. Landsc. Ecol. 2011, 26, 899–909. [Google Scholar] [CrossRef]
  10. Labeyrie, V.; Ouadah, S.; Raimond, C. Social network analysis: Which contributions to the analysis of agricultural systems resilience? Agric. Syst. 2024, 215, 103832. [Google Scholar] [CrossRef]
  11. Qu, Y.; Dong, X.; Su, D.; Jiang, G.; Ma, W. How to balance protection and development? A comprehensive analysis framework for territorial space utilization scale, function and pattern. J. Environ. Manag. 2023, 339, 117809. [Google Scholar] [CrossRef]
  12. Assumma, V.; Bottero, M.; De Angelis, E.; Lourenco, J.M.; Monaco, R.; Soares, A.J. A decision support system for territorial resilience assessment and planning: An application to the Douro Valley (Portugal). Sci. Total Environ. 2021, 756, 143806. [Google Scholar] [CrossRef] [PubMed]
  13. Xia, C.; Zhai, G. Territorial spatial vulnerability assessment based on PSO-BP neural network: A case study in Shenzhen, China. Ecol. Inform. 2023, 75, 102088. [Google Scholar] [CrossRef]
  14. Qu, Y.; Wang, S.; Tian, Y.; Jiang, G.; Zhou, T.; Meng, L. Territorial spatial planning for regional high-quality development—An analytical framework for the identification, mediation and transmission of potential land utilization conflicts in the Yellow River Delta. Land Use Policy 2023, 125, 106462. [Google Scholar]
  15. Zhang, M.; Peng, C.; Shu, J.; Lin, Y. Territorial Resilience of Metropolitan Regions: A Conceptual Framework, Recognition Methodologies and Planning Response—A Case Study of Wuhan Metropolitan Region. Int. J. Environ. Res. Public Health 2022, 19, 1914. [Google Scholar] [CrossRef] [PubMed]
  16. Stotten, R. The natural domain and its social representation in the community resilience concept. Sustain. Dev. 2024, 32, 1458–1470. [Google Scholar] [CrossRef]
  17. Assumma, V.; Bottero, M.; Ishizaka, A. Enhancing territorial resilience assessment with a decision-aiding model in regional planning of Socio-Ecological Systems. Environ. Sci. Policy 2024, 154, 103691. [Google Scholar] [CrossRef]
  18. Zhao, Y.; Zhang, M.; Zhao, D.; Duo, L.; Lu, C. Optimizing the ecological network of resource-based cities to enhance the resilience of regional ecological networks. Environ. Sci. Pollut. Res. 2024, 31, 17182–17205. [Google Scholar] [CrossRef]
  19. Egerer, M.; Annighöfer, P.; Arzberger, S.; Burger, S.; Hecher, Y.; Knill, V.; Probst, B.; Suda, M. Urban oases: The social-ecological importance of small urban green spaces. Ecosyst. People 2024, 20, 2315991. [Google Scholar] [CrossRef]
  20. Fistola, R.; Gargiulo, C.; La Rocca, R.A. Rethinking vulnerability in city-systems: A methodological proposal to assess “urban entropy”. Environ. Impact Assess. Rev. 2020, 85, 106464. [Google Scholar] [CrossRef]
  21. García-Ayllón, S.; Pilz, J. Territorial spatial evolution process and its ecological resilience. Front. Environ. Sci. 2024, 12, 1373672. [Google Scholar] [CrossRef]
  22. Qu, Y.; Wang, S.; Li, Y.; Zhu, W.; Wang, S. Characteristics of potential conflicts of territorial space and optimization pattern in the Yellow River Delta based on multi-functional suitability. Sci. Geogr. Sin. 2023, 43, 301–312. [Google Scholar]
  23. Ran, Y.; Lei, D.; Li, J.; Gao, L.; Mo, J.; Liu, X. Identification of crucial areas of territorial ecological restoration based on ecological security pattern: A case study of the central Yunnan urban agglomeration, China. Ecol. Indic. 2022, 143, 109318. [Google Scholar] [CrossRef]
  24. Marando, F.; Heris, M.P.; Zulian, G.; Udías, A.; Mentaschi, L.; Chrysoulakis, N.; Parastatidis, D.; Maes, J. Urban heat island mitigation by green infrastructure in European Functional Urban Areas. Sust. Cities Soc. 2022, 77, 103564. [Google Scholar] [CrossRef]
  25. Zhai, G.; Xia, C. Strategic emphasis on the construction of resilient cities in China. City Plan. Rev. 2021, 45, 44–48. [Google Scholar]
  26. Rogatka, K.; Starczewski, T.; Kowalski, M. Urban resilience in spatial planning of polish cities—True or false? Transformational perspective. Land Use Policy 2021, 101, 105172. [Google Scholar] [CrossRef]
  27. Lu, P.; Stead, D. Understanding the notion of resilience in spatial planning: A case study of Rotterdam, The Netherlands. Cities 2013, 35, 200–212. [Google Scholar] [CrossRef]
  28. Datola, G. Implementing urban resilience in urban planning: A comprehensive framework for urban resilience evaluation. Sust. Cities Soc. 2023, 98, 104821. [Google Scholar] [CrossRef]
  29. Feng, Y.; Lee, C.C.; Peng, D.Y. Does regional integration improve economic resilience? Evidence from urban agglomerations in China. Sust. Cities Soc. 2023, 88, 104273. [Google Scholar] [CrossRef]
  30. Oliver, T.H.; Heard, M.S.; Isaac, N.; Roy, D.B.; Procter, D.; Eigenbrod, F.; Freckleton, R.; Hector, A.; Orme, D.L.; Petchey, O.L.; et al. Biodiversity and Resilience of Ecosystem Functions. Trends Ecol. Evol. 2015, 30, 673–684. [Google Scholar] [CrossRef] [PubMed]
  31. Zhou, Q.; Zhu, M.; Qiao, Y.; Zhang, X.; Chen, J. Achieving resilience through smart cities? Evidence from China. Habitat Int. 2021, 111, 102348. [Google Scholar] [CrossRef]
  32. Meuwissen, M.; Feindt, P.H.; Spiegel, A.; Termeer, C.; Mathijs, E.; de Mey, Y.; Finger, R.; Balmann, A.; Wauters, E.; Urquhart, J.; et al. A framework to assess the resilience of farming systems. Agric. Syst. 2019, 176, 102656. [Google Scholar] [CrossRef]
  33. Imperiale, A.J.; Vanclay, F. Conceptualizing community resilience and the social dimensions of risk to overcome barriers to disaster risk reduction and sustainable development. Sustain. Dev. 2021, 29, 891–905. [Google Scholar] [CrossRef]
  34. Zou, L.; Zhang, L.; Liang, Y.; Wen, Q. Scientific cognition and research framework of territorial space function in the New Era. J. Nat. Resour. 2022, 37, 3060–3072. [Google Scholar] [CrossRef]
  35. Deng, C.; Liu, C.; Li, Z. Research Path on the Resilience of Watershed Territorial Space under the Background of Ecological Restoration. China Land Sci. 2022, 36, 11–20. [Google Scholar]
  36. Li, S.; Zhao, X.; Pu, J.; Miao, P.; Wang, Q.; Tan, K. Optimize and control territorial spatial functional areas to improve the ecological stability and total environment in karst areas of Southwest China. Land Use Policy 2021, 100, 104940. [Google Scholar] [CrossRef]
  37. Liu, Y.S.; Zhou, Y. Territory spatial planning and national governance system in China. Land Use Policy 2021, 102, 105288. [Google Scholar] [CrossRef]
  38. Long, H.; Tu, S.; Ge, D.; Li, T.; Liu, Y. The allocation and management of critical resources in rural China under restructuring: Problems and prospects. J. Rural Stud. 2016, 47, 392–412. [Google Scholar] [CrossRef]
  39. Song, W.; Cao, S.; Du, M.; He, Z. Aligning territorial spatial planning with sustainable development goals: A comprehensive analysis of production, living, and ecological spaces in China. Ecol. Indic. 2024, 160, 111816. [Google Scholar] [CrossRef]
  40. Zhang, C.; Zhao, L.; Song, X.; Zhang, Q.; Zhang, X. Spatial-temporal coupling characteristics and interaction effects of economic resilience and people’s livelihoods and well-being: An analysis of 78 cities in the Yellow River Basin. Sust. Cities Soc. 2024, 112, 105638. [Google Scholar] [CrossRef]
  41. Liu, C.; Cheng, L.; Li, J.; Lu, X.; Xu, Y.; Yang, Q. Trade-offs analysis of land use functions in a hilly-mountainous city of northwest Hubei Province: The interactive effects of urbanization and ecological construction. Habitat Int. 2023, 131, 102705. [Google Scholar] [CrossRef]
  42. Dhar, T.K.; Khirfan, L. A multi-scale and multi-dimensional framework for enhancing the resilience of urban form to climate change. Urban Clim. 2017, 19, 72–91. [Google Scholar] [CrossRef]
  43. Shi, C.; Zhu, X.; Wu, H.; Li, Z. Assessment of Urban Ecological Resilience and Its Influencing Factors: A Case Study of the Beijing-Tianjin-Hebei Urban Agglomeration of China. Land 2022, 11, 921. [Google Scholar] [CrossRef]
  44. Volkov, A.; Morkunas, M.; Balezentis, T.; Streimikiene, D. Are agricultural sustainability and resilience complementary notions? Evidence from the North European agriculture. Land Use Policy 2022, 112, 105791. [Google Scholar] [CrossRef]
  45. Peng, J.; Pan, Y.; Liu, Y.; Zhao, H.; Wang, Y. Linking ecological degradation risk to identify ecological security patterns in a rapidly urbanizing landscape. Habitat Int. 2018, 71, 110–124. [Google Scholar] [CrossRef]
  46. Ghosh, S.; Das Chatterjee, N.; Dinda, S. Urban ecological security assessment and forecasting using integrated DEMATEL-ANP and CA-Markov models: A case study on Kolkata Metropolitan Area, India. Sust. Cities Soc. 2021, 68, 102773. [Google Scholar] [CrossRef]
  47. Wei, X.; Shen, L.; Liu, Z.; Luo, L.; Wang, J.; Chen, Y. Comparative analysis on the evolution of ecological carrying capacity between provinces during urbanization process in China. Ecol. Indic. 2020, 112, 106179. [Google Scholar] [CrossRef]
  48. Hu, Q.; Zhang, Z.; Niu, L. Identification and evolution of territorial space from the perspective of composite functions. Habitat Int. 2022, 128, 102662. [Google Scholar] [CrossRef]
  49. Xu, Y.; Zhao, X.; Huang, P.; Pu, J.; Ran, Y.; Zhou, S.; Zhao, Q.; Feng, Y.; Tang, Y.; Tao, J.; et al. A new framework for multi-level territorial spatial zoning management: Integrating ecosystem services supply-demand balance and land use structure. J. Clean. Prod. 2024, 441, 141053. [Google Scholar] [CrossRef]
  50. Cui, X.; Cai, T.; Deng, W.; Zheng, R.; Jiang, Y.; Bao, H. Indicators for Evaluating High-Quality Agricultural Development: Empirical Study from Yangtze River Economic Belt, China. Soc. Indic. Res. 2022, 164, 1101–1127. [Google Scholar] [CrossRef]
  51. Zhang, R.; Tai, H.; Cheng, K.; Zhu, Y.; Hou, J. Carbon emission efficiency network formation mechanism and spatial correlation complexity analysis: Taking the Yangtze River Economic Belt as an example. Sci. Total Environ. 2022, 841, 156719. [Google Scholar] [CrossRef] [PubMed]
  52. Sharifi, A. Urban form resilience: A meso-scale analysis. Cities 2019, 93, 238–252. [Google Scholar] [CrossRef]
  53. Xiu, C.; Wei, Y.; Wang, Q. Evaluation of urban resilience of Dalian city based on the perspective of ‘Size-Density-Morphology’. Acta Geogr. Sin. 2018, 73, 2315–2328. [Google Scholar]
  54. Feng, X.; Xiu, C.; Bai, L.; Zhong, Y.; Wei, Y. Comprehensive evaluation of urban resilience based on the perspective of landscape pattern: A case study of Shenyang city. Cities 2020, 104, 102722. [Google Scholar] [CrossRef]
  55. Dai, L.; Liu, Y.B.; Luo, X.Y. Integrating the MCR and DOI models to construct an ecological security network for the urban agglomeration around Poyang Lake, China. Sci. Total Environ. 2021, 754, 141868. [Google Scholar] [CrossRef]
  56. Urruty, N.; Tailliez-Lefebvre, D.; Huyghe, C. Stability, robustness, vulnerability and resilience of agricultural systems. A review. Agron. Sustain. Dev. 2016, 36, 15. [Google Scholar] [CrossRef]
  57. Ye, S.; Song, C.; Shen, S.; Gao, P.; Cheng, C.; Cheng, F.; Wan, C.; Zhu, D. Spatial pattern of arable land-use intensity in China. Land Use Policy 2020, 99, 104845. [Google Scholar] [CrossRef]
  58. Peng, J.; Liu, Y.; Li, T.; Wu, J. Regional ecosystem health response to rural land use change: A case study in Lijiang City, China. Ecol. Indic. 2017, 72, 399–410. [Google Scholar] [CrossRef]
  59. Xie, G.; Zhang, C.; Zhen, L.; Zhang, L. Dynamic changes in the value of China’s ecosystem services. Ecosyst. Serv. 2017, 26, 146–154. [Google Scholar] [CrossRef]
  60. Wang, Y.; Cai, Y.; Xie, Y.; Chen, L.; Zhang, P. An integrated approach for evaluating dynamics of urban eco-resilience in urban agglomerations of China. Ecol. Indic. 2023, 146, 109859. [Google Scholar] [CrossRef]
  61. Song, Y.; Xue, D.; Dai, L.; Wang, P.; Huang, X.; Xia, S. Land cover change and eco-environmental quality response of different geomorphic units on the Chinese Loess Plateau. J. Arid Land 2020, 12, 29–43. [Google Scholar] [CrossRef]
  62. Wu, P.; Duan, Q.; Zhou, L.; Wu, Q.; Deveci, M. Spatial-temporal evaluation of urban resilience in the Yangtze River Delta from the perspective of the coupling coordination degree. Environ. Dev. Sustain. 2023, 1–23. [Google Scholar] [CrossRef] [PubMed]
  63. Ye, C.; Hu, M.; Lu, L.; Dong, Q.; Gu, M. Spatio-temporal evolution and factor explanatory power analysis of urban resilience in the Yangtze River Economic Belt. Geogr. Sustain. 2022, 3, 299–311. [Google Scholar] [CrossRef]
Figure 1. The connotations of TSR.
Land 13 01395 g001
Figure 2. Technical framework of TSR assessment.
Land 13 01395 g002
Figure 3. Location of the study area.
Land 13 01395 g003
Figure 4. Temporal and spatial evolution of TSR in the YREB.
Land 13 01395 g004
Figure 5. SDE of the TSR in the YREB.
Land 13 01395 g005
Figure 6. Distribution of hot and cold spots of the TSR in the YREB.
Land 13 01395 g006
Figure 7. Combined classification based on RU, RA and RE in the YREB.
Land 13 01395 g007
Figure 8. Functional zoning of TSR in the YREB.
Land 13 01395 g008
Figure 9. Comprehensive governance system of TSR.
Land 13 01395 g009
Table 1. Quantitative measurement models for RU, RA and RE.
NameIndexFormulaExplanation
RUSize
(RUS)
R U S = L S L d where  R U S  is the size resilience index of urban space,  L S  is the area of land suitable for building and  L d  is the area of existing building land.
Density
(RUD)
E D = G D P / T S
P D = G D P / T P
R U D = ( E D + P D ) / 2
where  E D  is the city’s economic density,  P D  is the city’s population density,  G D P  is gross domestic product,  T S  and  T P  refers to the area and the resident population of the city, respectively.
Morphology (RUM) L d = i = 1 m m i n d i m
R U M = L / L d  
where  R U M  is the morphological density index of urban space,  m i n   d i  is the minimum cost distance from source raster  i  to the nearest sink,  m  is the number of source raster in the study area, and  L  is the average distance index value for the source–sink landscape across the YREB.
RAQuantity (RAA) S m i n = β G r p × q × k
R A A = S m i n / S  
where  R A A  is cropland pressure index,  S m i n  and  S  are the minimum per capita cropland area and the actual per capita cropland area (hm2/person), respectively,  β  is food self-sufficiency rate (%),  p  is the grain yield per unit area (kg/hm2),  q  is the proportion of area sown to grain to total sown area (%),  k  is the replanting index, and  G r  is the per capita food requirement (kg/person). With  R A A  = 1 as the early warning line, the greater the value of  R A A , the greater the pressure on cropland protection and the lower the level of agricultural spatial security. With reference to international food security standards and actual food production, the per capita food requirements for 2000, 2010 and 2020 were set at 400, 420 and 440 kg, respectively. Since more than half of the provinces in the YREB are major food-producing areas, the food self-sufficiency rate is taken to be 100%.
Quality (RAQ) R A Q = j n A j × A S j T A where  R A Q  is the average arable land suitability,  T A  is the total area of agricultural space in the study unit,  A j  is the area of image element j in agricultural land in the study area and  A S j  is the agricultural suitability of image element j in agricultural land.
Utilisation (RAU) R A U = A P / F A A P  is the value of agricultural production in the study area and    F A  is the area of agricultural land.
REFunction
(REF)
E S p i = A i × E S c × 100 + S N c 100
R E F = E S p
where  R E F  is the functional resilience of ecological space,  E S p i  is the ecosystem service value of raster  i A i  is the area of raster  i , ESc is the service coefficient of the ecosystem value for the land use type corresponding to raster  i  and  S N c  are the spatial neighbourhood coefficients.
Vitality
(REV)
R A U = N I R R N I R + R   = N D V I where  N I R  is the near-infrared band reflectance value, and  R  is the red band reflectance value.  N D V I  can reflect the state of vegetation cover, with a range of values from −1 to 1.  N D V I < 0  indicates that the ground cover is water, snow, ice or clouds;  N D V I > 0  indicates that there is vegetation growing on the surface, and the higher the value, the better the grade of vegetation cover.
Organisation
(REO)
R E O = 0.3 × S H D I + 0.2 × F R A C + 0.3 × P D + 0.2 × C O N T A G where  R E O  is the organisational resilience of the ecological space,  S H D I  is the Shannon diversity index,  F R A C  is the fractal dimensionality index,  P D  is the patch density and  C O N T A G  is the landscape contagion index. This calculation was run using Fragstats 4.2.
Table 2. Mean value of each dimension of TSR in the YREB.
NameRURARE
200020102020200020102020200020102020
YREB0.2340.1470.2310.2560.2630.2660.1690.1940.201
Disclaimer/Publisher’s Note: The statements, opinions and data contained in all publications are solely those of the individual author(s) and contributor(s) and not of MDPI and/or the editor(s). MDPI and/or the editor(s) disclaim responsibility for any injury to people or property resulting from any ideas, methods, instructions or products referred to in the content.

