Article

Construction of Wetland Ecological Security Pattern in Wuhan Metropolitan Core Area Considering Wetland Ecological Risk

1
College of Horticulture & Forestry Sciences, Huazhong Agricultural University, Wuhan 430070, China
2
Key Laboratory of Urban Agriculture in Central China, Ministry of Agriculture and Rural Affairs, Wuhan 430070, China
3
China Railway Siyuan Survey and Design Group Co., Ltd., Wuhan 430063, China
*
Author to whom correspondence should be addressed.
Land 2024, 13(9), 1407; https://doi.org/10.3390/land13091407
Submission received: 25 July 2024 / Revised: 25 August 2024 / Accepted: 30 August 2024 / Published: 1 September 2024

Abstract

:
Wetlands play a crucial role in maintaining biodiversity and ecological balance. Preserving the ecological security of wetlands is critically important for regional environmental protection and sustainable development. However, in the core area of the Wuhan metropolitan circle, which is rapidly urbanizing, its wetlands are more susceptible to external natural environmental risks, such as changes in temperature and rainfall, as well as risks to human activity, such as social and economic activities, urban expansion, land use changes, and population growth. Meanwhile, the internal vulnerability of wetlands in terms of their spatial extent, structure, and functions also exacerbates ecological risks. These factors collectively influence the formation and development of wetland ecological risks. This study aims to comprehensively assess wetland ecological risks in the core area of the Wuhan metropolitan circle by combining external hazards and internal vulnerabilities and to construct and optimize the wetlands’ ecological security pattern. We used the MSPA method to identify potential ecological sources. Additionally, the MCR model was employed to integrate ecological risk assessment results into the resistance surface, identify potential ecological corridors and nodes, construct the wetland ecological security pattern for the urban circle, and propose specific optimization strategies. In total, 31 primary and 106 secondary ecological sources were selected, along with 20 primary and 42 secondary ecological nodes. Furthermore, 10 major ecological corridors were constructed. Considering the landscape characteristics of the wetlands in the core area of the Wuhan metropolitan circle, the southern Yangtze River region will center around the Liangzi Lake group to establish a crucial corridor network, promoting overall wetland restoration and connectivity. Meanwhile, the northern Yangtze River region will form a chain-like distribution along the river, creating diverse ecosystems. This study provides a theoretical foundation for constructing and optimizing the ecological security pattern of wetlands, laying a solid groundwork for promoting regional wetland conservation and sustainable development.

1. Introduction

Nature plays a crucial role in promoting human well-being, with wetlands standing out as particularly valuable ecosystems due to their unique position at the interface of land and water [1]. Wetlands are essential for providing various ecosystem services that benefit humans, such as water regulation, pollutant purification, climate change mitigation, and habitat provision for numerous species [2]. Despite their significance, wetlands are increasingly threatened by land use changes, which have the potential to jeopardize their ability to maintain regional ecosystem balance and provide essential services [3]. It is important to emphasize that wetlands serve as ecological infrastructure supporting sustainable urban development. However, the frequent occurrence of extreme weather events driven by global climate change and the unchecked expansion of human activities continue to disrupt the natural structure and functions of wetlands [4].
Coupled with the over-exploitation of wetland resources and pollution caused by rapid urbanization, the self-recovery capacity of wetlands has been further weakened [5]. The combination of these external hazards and internal vulnerability means that wetland ecosystems are under unprecedented pressure, facing serious challenges of degradation and increased ecological risks. Therefore, the spatial and temporal distribution of wetland changes [6]. The sustainable utilization of wetland resources [7], wetland management [8], Wetland ecosystem services [9], ecological risk assessment [10], and other aspects are receiving extensive attention from experts and scholars.
Ecological risk is used to describe the potential for damage to ecosystems and their components as a result of uncertain events and disasters that may have adverse effects on ecosystems [11]. Ecological risk assessment is mainly used to quantify the adverse effects of one or more internal or external factors on ecosystems [12], which has been widely used to assess impacts on wetlands at global, national, and regional scales [13]. Wetland ecosystems are under threat from a variety of sources, including not only external pressures from the natural environment and human social activities but also the inherent vulnerability of the wetlands themselves. Specifically, wetlands are not only facing the external natural environmental disturbances of temperature and precipitation but also suffering from the profound impacts of human activities. At the same time, the spatial extent, spatial structure, and ecological functions of wetland ecosystems also pose inherent threats, which further exacerbate wetland ecological risks. Therefore, in order to more effectively understand and manage wetland ecological risks, we must comprehensively consider the interactions between the intrinsic characteristics of wetlands and external disturbances and formulate comprehensive protection and management strategies to maintain the stability and sustainability of wetland ecosystems [14]. Therefore, there is an urgent need for ecological risk assessment of wetlands to systematically reveal the multifaceted risk disturbances faced by the complex system of wetlands and its interaction process with ecological risks. Such assessment provides an important basis for developing effective strategies to optimize the ecological security pattern of wetlands.
The use of wetland ecological risk assessment provides a scientific basis for the early warning, prevention, and control of ecological security by exploring wetland disturbances from multiple perspectives and measuring the risk of damage to wetlands. Evaluating the spatial distribution of ecological risks to wetlands can reveal the challenges faced by wetlands, recognize the state of wetlands, and understand the chain reactions that these factors may have on the surrounding environment and human activities [15]. Constructing an ecological security pattern based on this is crucial for formulating regional ecological security strategies, implementing targeted protection measures, ensuring ecological security, and promoting sustainable development.
Since 1990, scholars at home and abroad have conducted preliminary explorations of ecological risk and ecological security patterns, and the concept of ESP has gradually emerged and attracted widespread attention. Currently, there are three main methods for wetland ecological risk evaluation: the single indicator method primarily uses indicators such as land use change [16], climate change [17], and landscape pattern indices [18]. Cheng validated model measurements based on the PSR framework and the fuzzy evaluation method. The analysis considered uncertainties related to the number of indicators, thresholds, and index weights, leading to the development of an ecological security evaluation model [19]. The fuzzy comprehensive evaluation method applied fuzzification to ecological risk evaluation indexes and results, enhancing operability and repeatability [20]. However, this method complicates the evaluation process. More scholars are using the multi-level and multi-indicator comprehensive evaluation method. For instance, Duan et al. constructed an ecological risk assessment framework by quantifying the external hazard index and internal vulnerability index [21]. Li used the product of external hazards and the internal vulnerability of wetlands to quantify the ecological risk in the Beijing–Tianjin–Hebei urban agglomeration [22]. This method is more scientific and provides a more profound insight into the potential risks to the ecosystem.
Scholars have conducted a lot of research in qualitative and quantitative pattern planning analysis, static pattern optimization [23], and dynamic grid simulation [24]. ESP is widely defined as a specific paradigm consisting of ecologically significant ecological components, patches, and corridors of ecosystems [25]. In urban planning practice, the construction of ESPs plays a pivotal role in fostering a harmonious coexistence between the rapid urbanization of urban areas and the conservation of the natural environment [26]. Currently, ESP research focuses on the identification and construction of ESPs, and adopts the basic construction paradigm of “ecological source-ecological corridor-ecological node” with the ecosystem rating as the evaluation index [27]. Ecological sources are critical habitat patches. Most existing studies have selected urbanized areas, nature reserves, or large-scale concentrated and continuous forests and grasslands as sources, with less attention paid to wetlands as an important ecosystem [28]. The ecological resistance surface is the degree of disturbance to species as they move between different landscape units or habitats [29]. Resistance surfaces are a key element in constructing the ecological resistance surface system. It is primarily established by integrating natural conditions such as land use type, climate environment, and the impact of human activities [30]. Ecological corridors are the transmission channels of ecological flows, processes, and functions in a region, and the methods of extracting ecological corridors mainly use MCR and circuit theory [31]. Based on the least resistance model and spatial interaction force model, important potential ecological corridors are simulated and extracted to establish channels for biological and energy flows [32]. The establishment of ecological strategic nodes at the points of intersection between significant corridors with varying levels of resistance serves to create transit points for the migration of biological organisms and the transfer of energy [33]. In recent years, MCR has become the main method for identifying ecological corridors, and the accurate setting of resistance surfaces is crucial for precisely identifying corridors and constructing ecological security patterns.
From the perspective of research subjects, current studies primarily focus on individual cities and ecological functional areas, with less emphasis on urban agglomerations as a whole. In terms of wetland ecological risk evaluation, research typically addresses aspects such as the natural environment, human activities, and ecosystem structure and function. Regarding the development of ecological safety patterns, there is a general approach to identifying source areas and constructing safety patterns based on ecological sensitivity evaluations. However, there is a notable lack of research on optimizing ecological safety pattern construction through ecological risk assessments. On this basis, this study employed a multi-level and multi-indicator comprehensive evaluation method, revealing the sources and characteristics of wetland ecological risks from the dual perspectives of internal vulnerability and external hazard. Wetland ecological risk evaluation is incorporated into the construction of the ecological resistance surface, and specific weights are determined to visualize the vulnerability and protection needs of wetland ecosystems in different regions. In this way, the configuration of essential ecological components is meticulously devised, thereby ensuring the optimal organization of the ecological security pattern. This method provides a scientific basis for constructing and optimizing the wetland ecological security pattern, improving the relevance and effectiveness of wetland protection.
Wuhan Metropolitan Core Area, the core area for wetland conservation in the Yangtze River Basin, has widely distributed and diverse types of wetland resources. According to data provided by the National Forestry and Grassland Administration [34], Wuhan and its surrounding areas have 165 rivers, 166 lakes, 10 wetland parks, and 5 nature reserves, with a wetland area of 162,000 hectares, accounting for 18.9% of the city’s total land area. Additionally, there are 63,500 hectares of small-scale wetlands, which constitute 7.41% of the city’s land area. Due to its unique geographic location, it plays a crucial role in maintaining the ecological balance of the entire basin [35]. As defined by The Convention on Wetlands, wetlands in the Wuhan metropolitan core area include inland wetlands and artificial wetlands [36]. River canals, lakes, marshes, and beaches are widely distributed as inland wetlands in the region. This includes 12 major rivers, namely the Yangtze, Han, Tongshun, Fu, Xie, Daoshui, Jushui, Sha, Bashui, Xishui, Qihe, and Yuanshanhe. Additionally, there are 7 large lake groups, primarily consisting of the Dong Lake, Tangxun Lake, Liangzi Lake, Baon Lake, Huama Lake, Daye Lake, and Wang Lake, along with thousands of smaller wetlands [37]. Artificial wetlands, on the other hand, are formed as a result of people’s transformation of land and water resources to meet the needs of agricultural production and urban flood control. At the same time, rapid economic development in the Wuhan metropolitan core area has subjected its wetland resources to internal and external pressures. Rapid urban expansion and frequent human activities have brought about serious impacts on wetlands, disturbing wetland structure and function, and dramatically increasing ecological risks [38]. In this study, we define wetland ecological risk as the external hazards wetlands face and their internal vulnerabilities when confronted with these disturbances. Therefore, it is necessary to consider both internal vulnerabilities and external hazards to develop a wetland ecological risk assessment system. By utilizing the results of wetland ecological risk evaluation, we construct an ecological resistance surface for the study area and, on this basis, develop an ecological security pattern. This provides a reference for optimizing the ecological security pattern of wetlands.
The comprehensive wetland ecological risk assessment system constructed can accurately quantify the ecological risk level of different wetlands in the Wuhan metropolitan core area, and this method provides the scientific basis and technical support for the construction of a wetland ecological security pattern and improves the targeting and effectiveness of wetland protection. Based on the identification and assessment of wetland ecological risks, the construction of a reasonable wetland ecological safety pattern is a key measure to ensure the stability and sustainability of wetland ecosystems in the Wuhan metropolitan core area, which can effectively reduce the probability of occurrence and the degree of impact of ecological risks in the future. By comprehensively assessing the ecological risk of wetlands, optimizing the construction of a scientific and reasonable wetland ecological security pattern, and strengthening ecological protection measures, the stability and resistance of wetland ecosystems can be improved, and scientific evidence and decision support can be provided for the protection and management of wetlands in the Wuhan metropolitan core area. In turn, it will enhance the regional ecological security level and promote the ecological protection and sustainable development of wetlands in the Yangtze River Basin.
There are three specific objectives: (1) to comprehensively evaluate the ecological risk of wetlands in the Wuhan metropolitan core area by systematically considering the dual dimensions of internal vulnerability and external hazard; (2) to integrate ecological risk into the construction of the ecological security pattern and develop a wetland ecological security pattern that aligns with the characteristics of the urbanization process and landscape pattern in the Wuhan metropolitan core area; and (3) based on the results of the ecological risk assessment and the constructed wetland ecological security pattern, to propose strategies aimed at optimizing the ecological spatial layout and enhancing the resilience of wetland ecosystems.

2. Materials and Methods
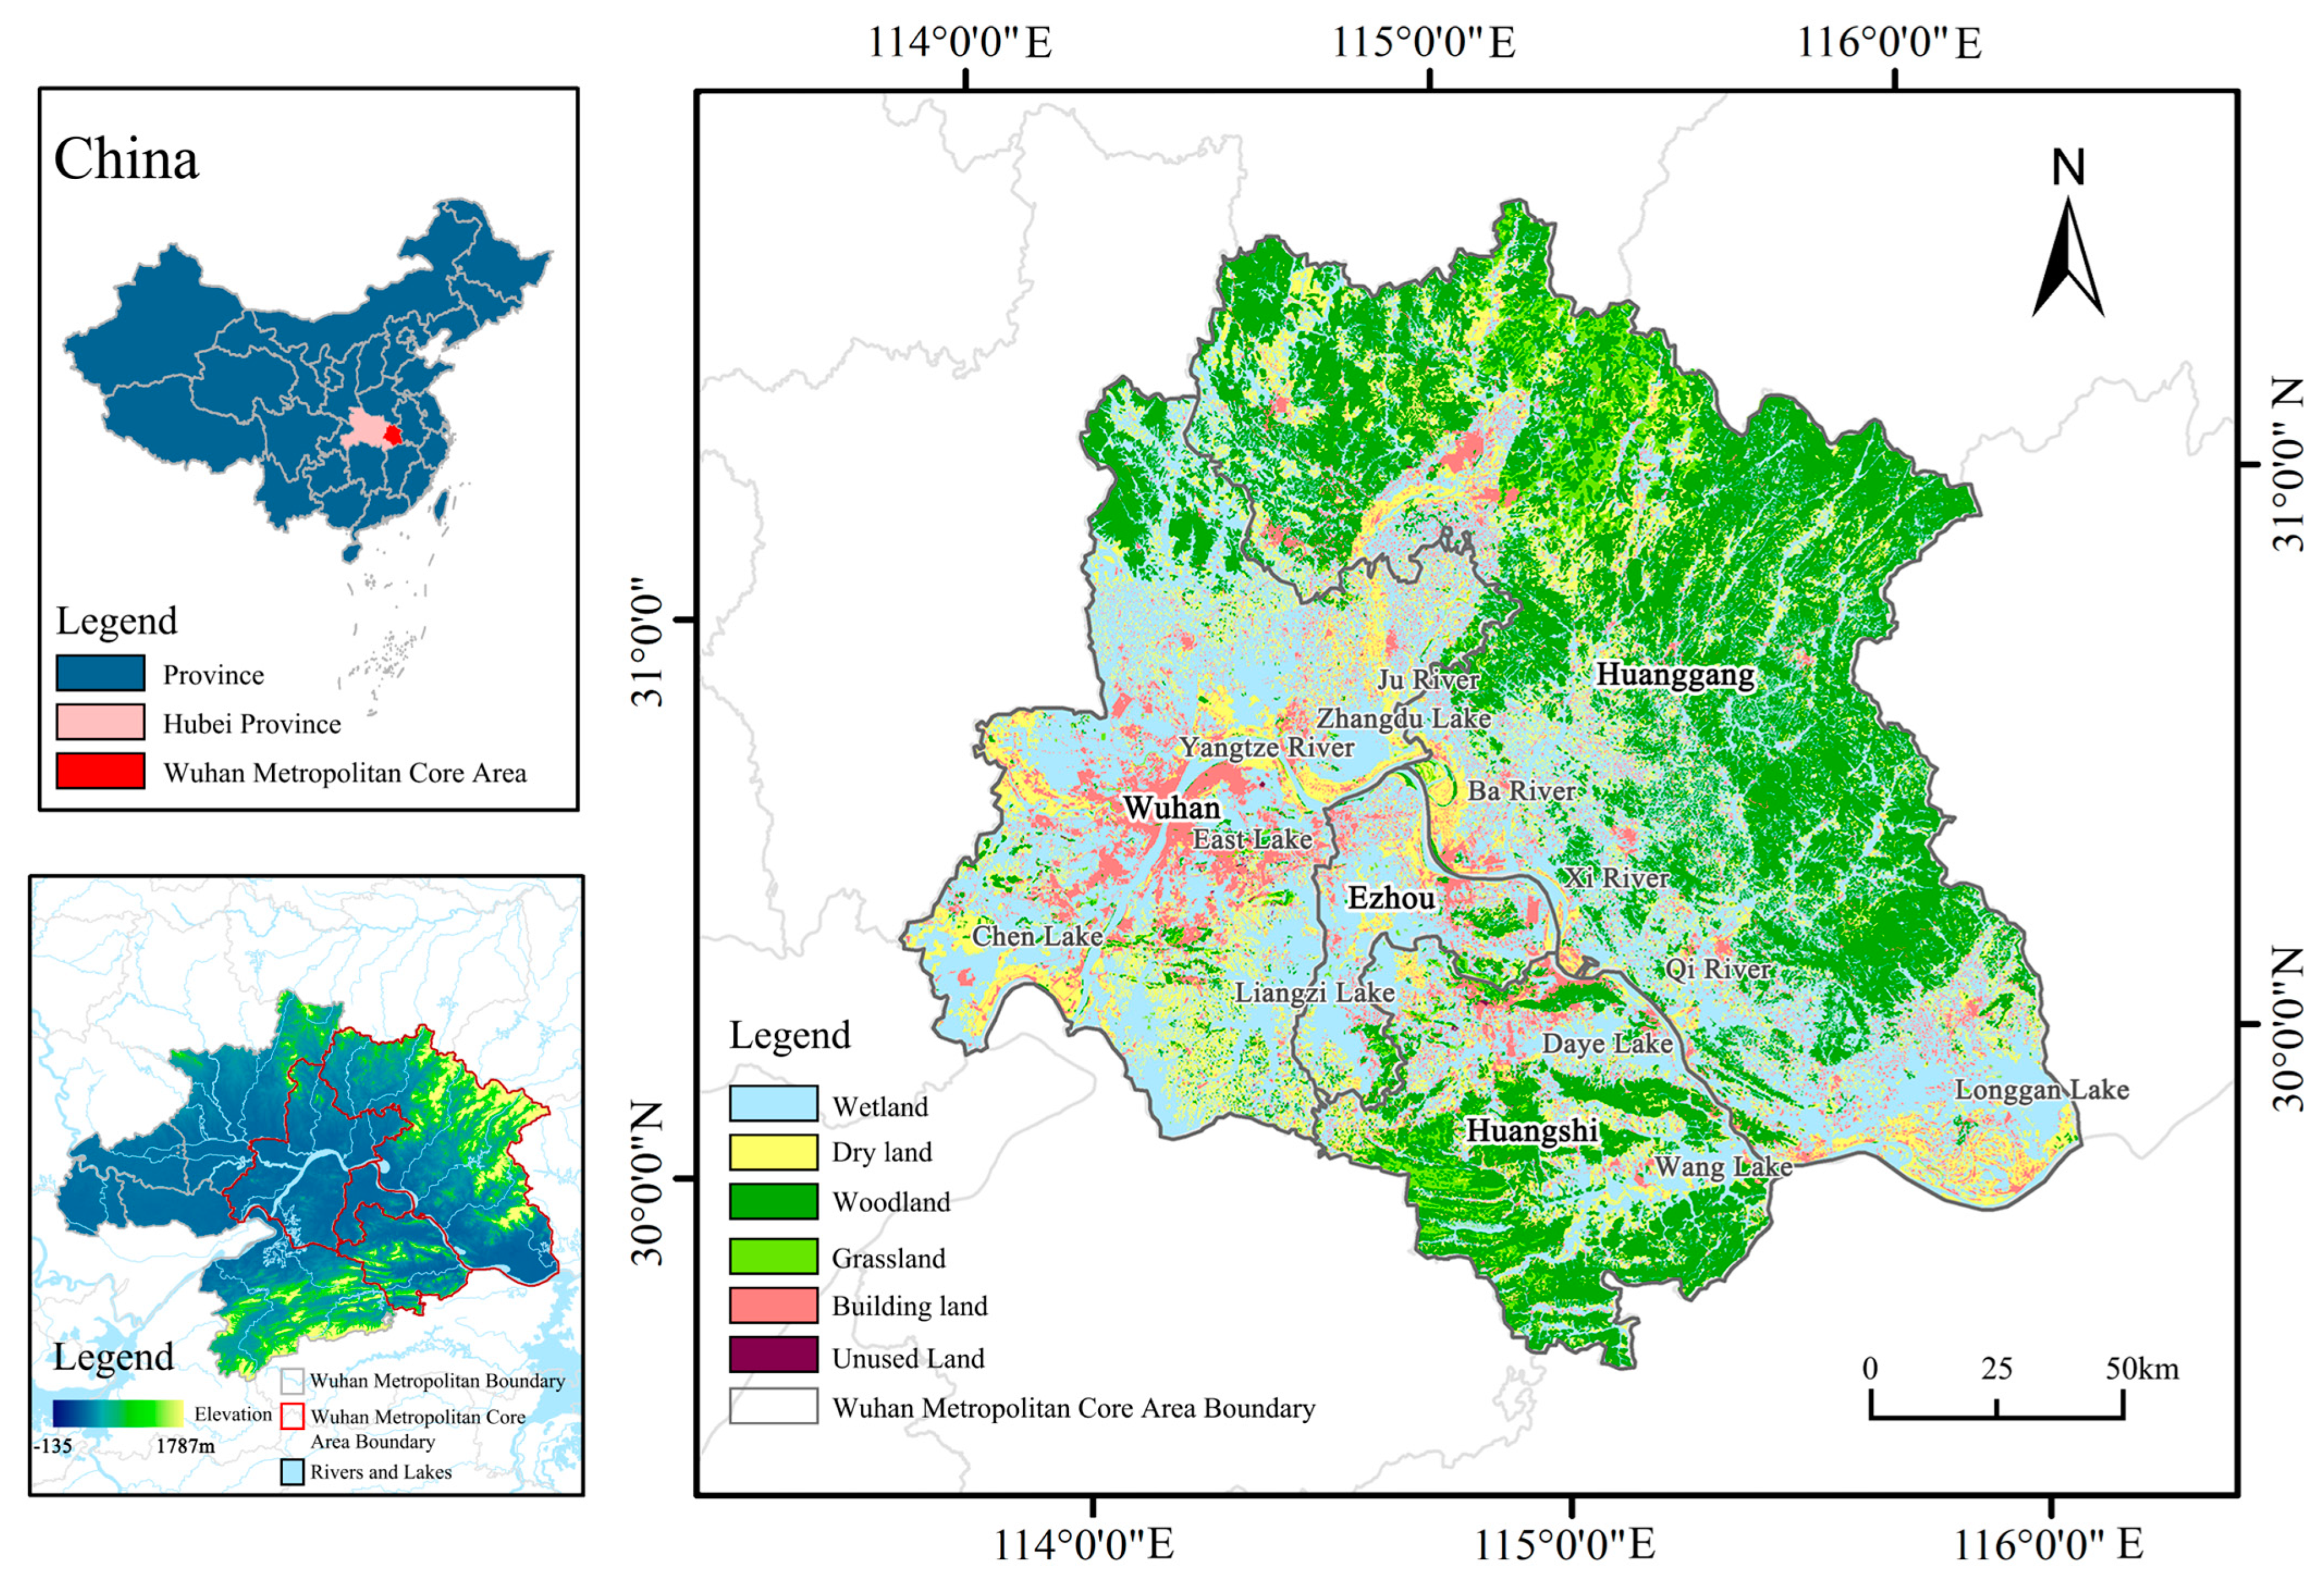
The study area (Figure 1) is dominated by the core area of the Wuhan metropolitan area, which was successfully designated as the seventh national metropolitan area in 2022. This designation encompasses four cities, Wuhan, Ezhou, Huangshi, and Huanggang, which collectively account for 68% of the area of the Wuhan metropolitan area [39].
Wetlands, as an ecological interface between water bodies and land, are a valuable asset of national and natural resources. According to the Ramsar Convention on Wetlands, wetlands include coastal, inland and artificial wetlands, while wetlands in the Wuhan metropolitan core area include inland and artificial wetlands. Firstly, the diverse topography and hydrological conditions in the Wuhan metropolitan core area provide favorable conditions for the formation of inland wetlands. As inland wetlands, rivers, lakes, marshes and beaches are widely distributed in the region, they play important ecological roles in climate regulation, soil and water conservation, and other aspects. Secondly, the artificial wetlands in the Wuhan metropolitan core area are formed due to the transformation of land and water resources by people to meet the needs of agricultural production and urban flood control in the long term. Artificial wetlands cover wetlands of paddy fields and reservoir pits and ponds, which provide strong support for local socio-economic development.
The total wetland area exceeds 13,000 km2, which has fostered a comprehensive and diverse wetland ecological environment. This environment is characterized by interconnected rivers and harbors, as well as lakes and reservoirs that are intermingled. As a result of socio-economic development and urban expansion, the wetlands in the Wuhan metropolitan core area are experiencing a range of ecological and environmental challenges. The acceleration of urbanization, the enclosure of lakes, and the over-exploitation of wetland resources have resulted in a significant reduction in wetland areas within the Jianghan Plain. This has led to an increase in water pollution, a threat to the ecological quality of some wetlands, and a considerable decline in biodiversity. Furthermore, the government and relevant departments lack the capacity to effectively manage and conduct scientific research on typical regional wetlands. Additionally, the current management of wetland ecological protection and construction is inadequate. In recent years, the state has enacted the Yangtze River Protection Law and the Wetland Protection Law, with the objective of strengthening the protection of wetland ecosystems in the Yangtze River basin and facilitating the implementation of the Yangtze River protection strategy. It is of great significance to examine the ecological risks posed by wetlands within the Wuhan metropolitan core area and to develop an appropriate ecological security strategy for these wetlands. This will help to safeguard the regional ecological environment and facilitate sustainable development.

2.1. Data Sources

The study employed a range of data types, including fundamental geographic information, climate data, land use data, and so forth. The geographic information data, which included vector boundaries and other relevant information, were obtained from the National Geographic Information Resource Catalog Service System (https://www.webmap.cn/). The digital elevation model (DEM) data were obtained from the Geospatial Data Cloud Platform (http://www.gscloud.cn/). The primary source of climate and land use data for this paper is the Resource and Environment Science and Data Center of the Institute of Geographic Sciences and Resources, Chinese Academy of Sciences (http://www.resdc.cn). The population density data were obtained from the WorldPop dataset (https://www.worldpop.org/). The standardized precipitation–evapotranspiration index (SPEI) data were obtained from the National Ecosystem Data Bank’s High-resolution SPEI Dataset (https://ecodb.scidb.cn/). The nighttime light data were obtained from the National Centers for Environmental Information’s Earth Observation Group, which is based on the NPP-VIIRS synthetic data (https://eogdata.mines.edu/). To synthesize the floating algae index (FAI), 2020 Landsat8 imagery (Path/Row: 123/039) was employed. All multispectral imagery underwent a series of preprocessing operations, including radiometric correction, atmospheric correction, de-clouding, mosaicking, and mean synthesis (https://www.usgs.gov).

2.2. Research Framework

As illustrated in Figure 2, the framework of this study is primarily comprised of three distinct phases. Firstly, the spatial distribution of ecological risk is quantified through a comprehensive evaluation of five types of factors, comprising a total of 16 indicators, which are assessed in both external and internal aspects. In the second step, the ecological sources are identified, and the spatial distribution of ecological risks of wetlands is integrated into the resistance surface construction process. Potential ecological corridors and ecological nodes are extracted, and the ecological security pattern of wetlands is constructed. In the third part, the spatial distribution of ecological risks and indicators at all levels is considered, and specific wetland ecological spatial protection and optimization strategies are proposed. This is achieved by combining the wetland ecological security pattern construction and optimization objectives.

2.3. Research Methods

2.3.1. Wetland Ecological Risk Assessment System

The two main aspects considered in this study’s wetland ecological risk assessment are the external risks that wetlands inevitably face and the ecological effects that arise after these pressures impact them, specifically focusing on external hazards and internal vulnerabilities. The greater the exposure of a wetland to external hazards, the higher the ecological risk. Wetlands with lower vulnerability have lower ecological risk. Therefore, this study assesses wetland ecological risk by measuring both external hazards and internal vulnerability. The wetland ecological risk assessment framework is based on the ecological risk assessment model proposed by the US Environmental Protection Agency in 1992 [40]. This model primarily evaluates ecological risk through exposure and ecological effects. Exposure represents the stress exerted on ecosystems by external hazards, while ecological effects represent the ecosystem’s vulnerability after being impacted by external factors. External hazards include natural and social factors and are assessed using seven indicators. Internal vulnerability includes the wetland’s spatial scope, spatial structure, and ecological functions, comprising nine indicators. In sum, a total of 16 parameters included in these two indexes are analyzed in detail. Each is normalized to a value between 0 and 1 after processing. The Analytic Hierarchy Process (AHP) is employed to determine the weights of these indicators (Table 1). By calculating the weighted sum of the external hazard index and the internal vulnerability index, their product is used to reflect the overall wetland ecological risk.
(1)
External Hazard Indicators and Calculation Methods
Natural Factors:
The state of wetlands can be significantly impacted by changes in natural factors. Climate change, including high temperatures, drought, and heavy rainfall, represents a primary driver of wetland destruction and degradation. Such alterations can exert a direct impact on the hydrological status and ecological milieu of wetlands, in addition to an indirect influence on their ecological functions and values [41]. Accordingly, this study employs three indicators, temperature, SPEI, and rainfall, to elucidate the influence of natural factors on wetlands. The temperature, SPEI, and rainfall values were derived through the calculation of annual average values.
Social Factors:
Due to the accelerated urbanization process in the Wuhan metropolitan area, human activities have significantly impacted wetlands. Thus, we have selected the nighttime light intensity, distance from construction site, land use intensity, and population density to measure the impact of societal and human activities on wetlands.
The nighttime light intensity is a key parameter for assessing human socio-economic activities, offering insights into the long-term urban development and changes in human activity interference in the Wuhan metropolitan core area. The data are of significant value in the evaluation of regional urbanization processes and ecological risk and are derived from the NPP-VIIRS composite nighttime light dataset [42]. The distance from construction site effectively reflects the degree of urban development disturbance on wetland ecological spaces and is calculated based on land use data [43].
Land use intensity has a notable impact on wetland ecosystems, directly reflecting societal demand and utilization of wetland resources [44]. The land use intensity calculation formula is as follows:
L = i = 1 n A i A × G i × 100 %
where L represents the land use intensity index; A i represents the area of the ith land use type; A represents the total area; and G i represents the intensity level of the ith land use type. The land use intensity levels for various land use types are shown in Table 2.
Population density is an important factor contributing to the risk of wetlands, and the increase in human density will lead to more human activities and urban construction, which in turn will cause the spatial and ecological environment of wetlands to be affected [45], so this paper calculates the population density based on the rasterized population spatial distribution data from Worldpop.
In this paper, the floating algae index is used to reflect the water quality of wetland water bodies through the degree of cyanobacterial blooms and the degree of eutrophication. The FAI index is calculated based on Landsat multispectral images, and the specific formula is as follows [46]:
F A I = R r e λ N I R R r e λ N I R R r e λ N I R = R r e λ R e d + R r e λ S W I R R r e λ R e d λ NIR λ R e d λ SWIR λ Red
In the formula, the bands of the TM images are λRED = 660 nm, λNIR = 839 nm, and λSWIR = 1678 nm, and the bands of the TM images are λRED = 655 nm, λNIR = 865 nm, and λSWIR = 1609 nm. Rre(λNIR) is the near-infrared reflectance, and R′re(λNIR) is the interpolated reflectance, which is the reflectance information obtained by linear interpolation in the near-infrared band for the red and segmental infrared bands.
(2)
Internal Vulnerability Indicators and Calculation Methods
Wetland Spatial Extent:
The size of a wetland patch is a direct reflection of the condition of the wetland ecosystem. Larger wetland patches are associated with greater complexity, stability, and resilience in the face of disturbances. Consequently, the dimensions of wetland patch size serve as an effective gauge for gauging the vulnerability of the wetland itself [47].
Wetland Spatial Structure:
The patch density of a wetland is defined as the number of wetland patches per unit area. As the density of wetland patches increases, the degree of habitat fragmentation rises, thereby increasing the ecological risk of the wetland [48]. The patch density index is calculated using the following formula:
PD = N / A
where N represents the number of wetland landscape patches and A is the total wetland landscape area.
The landscape spreading degree index is a visual representation of the degree of aggregation or expansion trend of different landscape patch types [49]. A high spreading degree indicates a high level of connectivity between wetland patches, which is associated with a low ecological risk. In contrast, a low spreading degree is indicative of a more dispersed pattern of wetland patches, which are more vulnerable to disturbance and consequently have a higher ecological risk. The calculation formula is as follows:
C O N T A G = 1 + i = 1 m k = 1 m L i g i k k = 1 m g i k l n L i g i k k = 1 m g i k 2   l n   m × 100
where C O N T A G represents the landscape sprawl index; L i reflects the proportion of patch area in the overall landscape; g i k represents the number of patch types and neighboring patches between them; and m represents the total number of landscape types.
The landscape separation index is a parameter used to measure the degree of separation between the distribution of different landscape types or patches within a region [50]. When the value is larger, it represents that wetland landscapes are more dispersed in terms of geographical distribution. Wetlands are subjected to a higher degree of disturbance, which results in an increased risk to the ecological balance of these ecosystems. The expression for the degree of landscape separation is as follows:
N i = 1 2 × n i A × A A i
where N i represents the wetland landscape separation, A is the total area of the landscape, A i represents the area of the i-th landscape type, and n i indicates the number of patches.
The Shannon Diversity Index (SHDI) is a measure of the diversity and complexity of landscape elements [51]. A high SHDI value is indicative of a balanced distribution of wetlands, a high degree of heterogeneity and structural complexity, and a greater resilience to ecological risks. The Shannon diversity index is calculated using the following formula:
S H D I = i = 1 m P i × l n P i
where S H D I is the landscape Shannon diversity index, P i is the percentage of the i-th landscape type, and m represents the total number of landscape types.
Wetland Ecological Function:
We quantify the service values of ecosystem supply, regulation, support, and cultural services using the equivalent method to reflect the value of ecosystem services. This is based on the conversion table of ecosystem service values per unit area in China, compiled by previous research results [52], and we adjust the economic value of the unit conversion factors according to the actual conditions of the study area (Table 3). The calculation formula is as follows:
E a = 1 7 i = 1 n m i p i q i M
In the formula, E a is the equivalent factor value of the a-th year (yuan/hm2), i is the type of grain; m i ,   p i ,   q i , respectively, are the average price of the i-th grain (yuan/kg), grain yield (kg/m2), and grain sown area (hm2); and   M is the total grain area (hm2). The reference scale is according to the wetland ecosystem service value of wetland area.

2.3.2. Construction and Optimization of Wetland Ecological Security Pattern Integrating Wetland Ecological Risk

The construction and optimization of wetland ecological security patterns is a crucial strategy for enhancing the ecological integrity and functionality of regional wetlands, which are vital ecological resources within the Wuhan metropolitan area. The “source-corridor-pattern” paradigm is the fundamental approach for developing a regional ecological security paradigm [53]. This approach includes extracting ecological sources, identifying ecological nodes, and constructing ecological corridors.
This section first establishes the ecological security planning outline for the Wuhan metropolitan core area, determining future ecological land use, construction land use planning, and ecological security development objectives. Secondly, the MSPA morphological method is used to identify and extract key wetland ecological sources. Subsequently, wetland ecological risks are incorporated into the resistance surface construction process. Using MCR modeling, the minimum cumulative resistance paths on ecological resistance surfaces are identified as ecological corridors. This method is then employed for constructing and optimizing the wetland ecological network within the Wuhan metropolitan core area.
(1)
Selection of Ecological Source Areas
An ecological source area is defined as an area exhibiting high ecosystem service value and a complete ecological pattern, in addition to demonstrating a robust ability to withstand disturbance and maintain stability. Currently, there are two main approaches to identifying ecological source areas. One method is based on patch feature structures and involves using the MSPA morphological analysis to select regions that have relatively complete structures as ecological source areas. The second approach considers the functionality of these ecological sources, including ecological function evaluation methods. Wetland core areas chosen through the MSPA method possess more stable structures and larger areas, thereby offering higher ecosystem services and resistance to disturbance. The MSPA morphological method was employed to categorize the wetlands within the Wuhan metropolitan core area into distinct landscape element types, including core area and isolated island, among others. Combined with the actual situation of wetlands in the Wuhan metropolitan core area, wetlands with strong anti-disturbance ability, such as lakes with large areas and water conservation and runoff storage functions, were identified as ecological source areas. The first and second levels of ecological sources were screened as important ecological sources by combining with the integral index of connectivity (IIC), the probability of connectivity (PC), and the delta values for probability of connectivity (dPC).
(2)
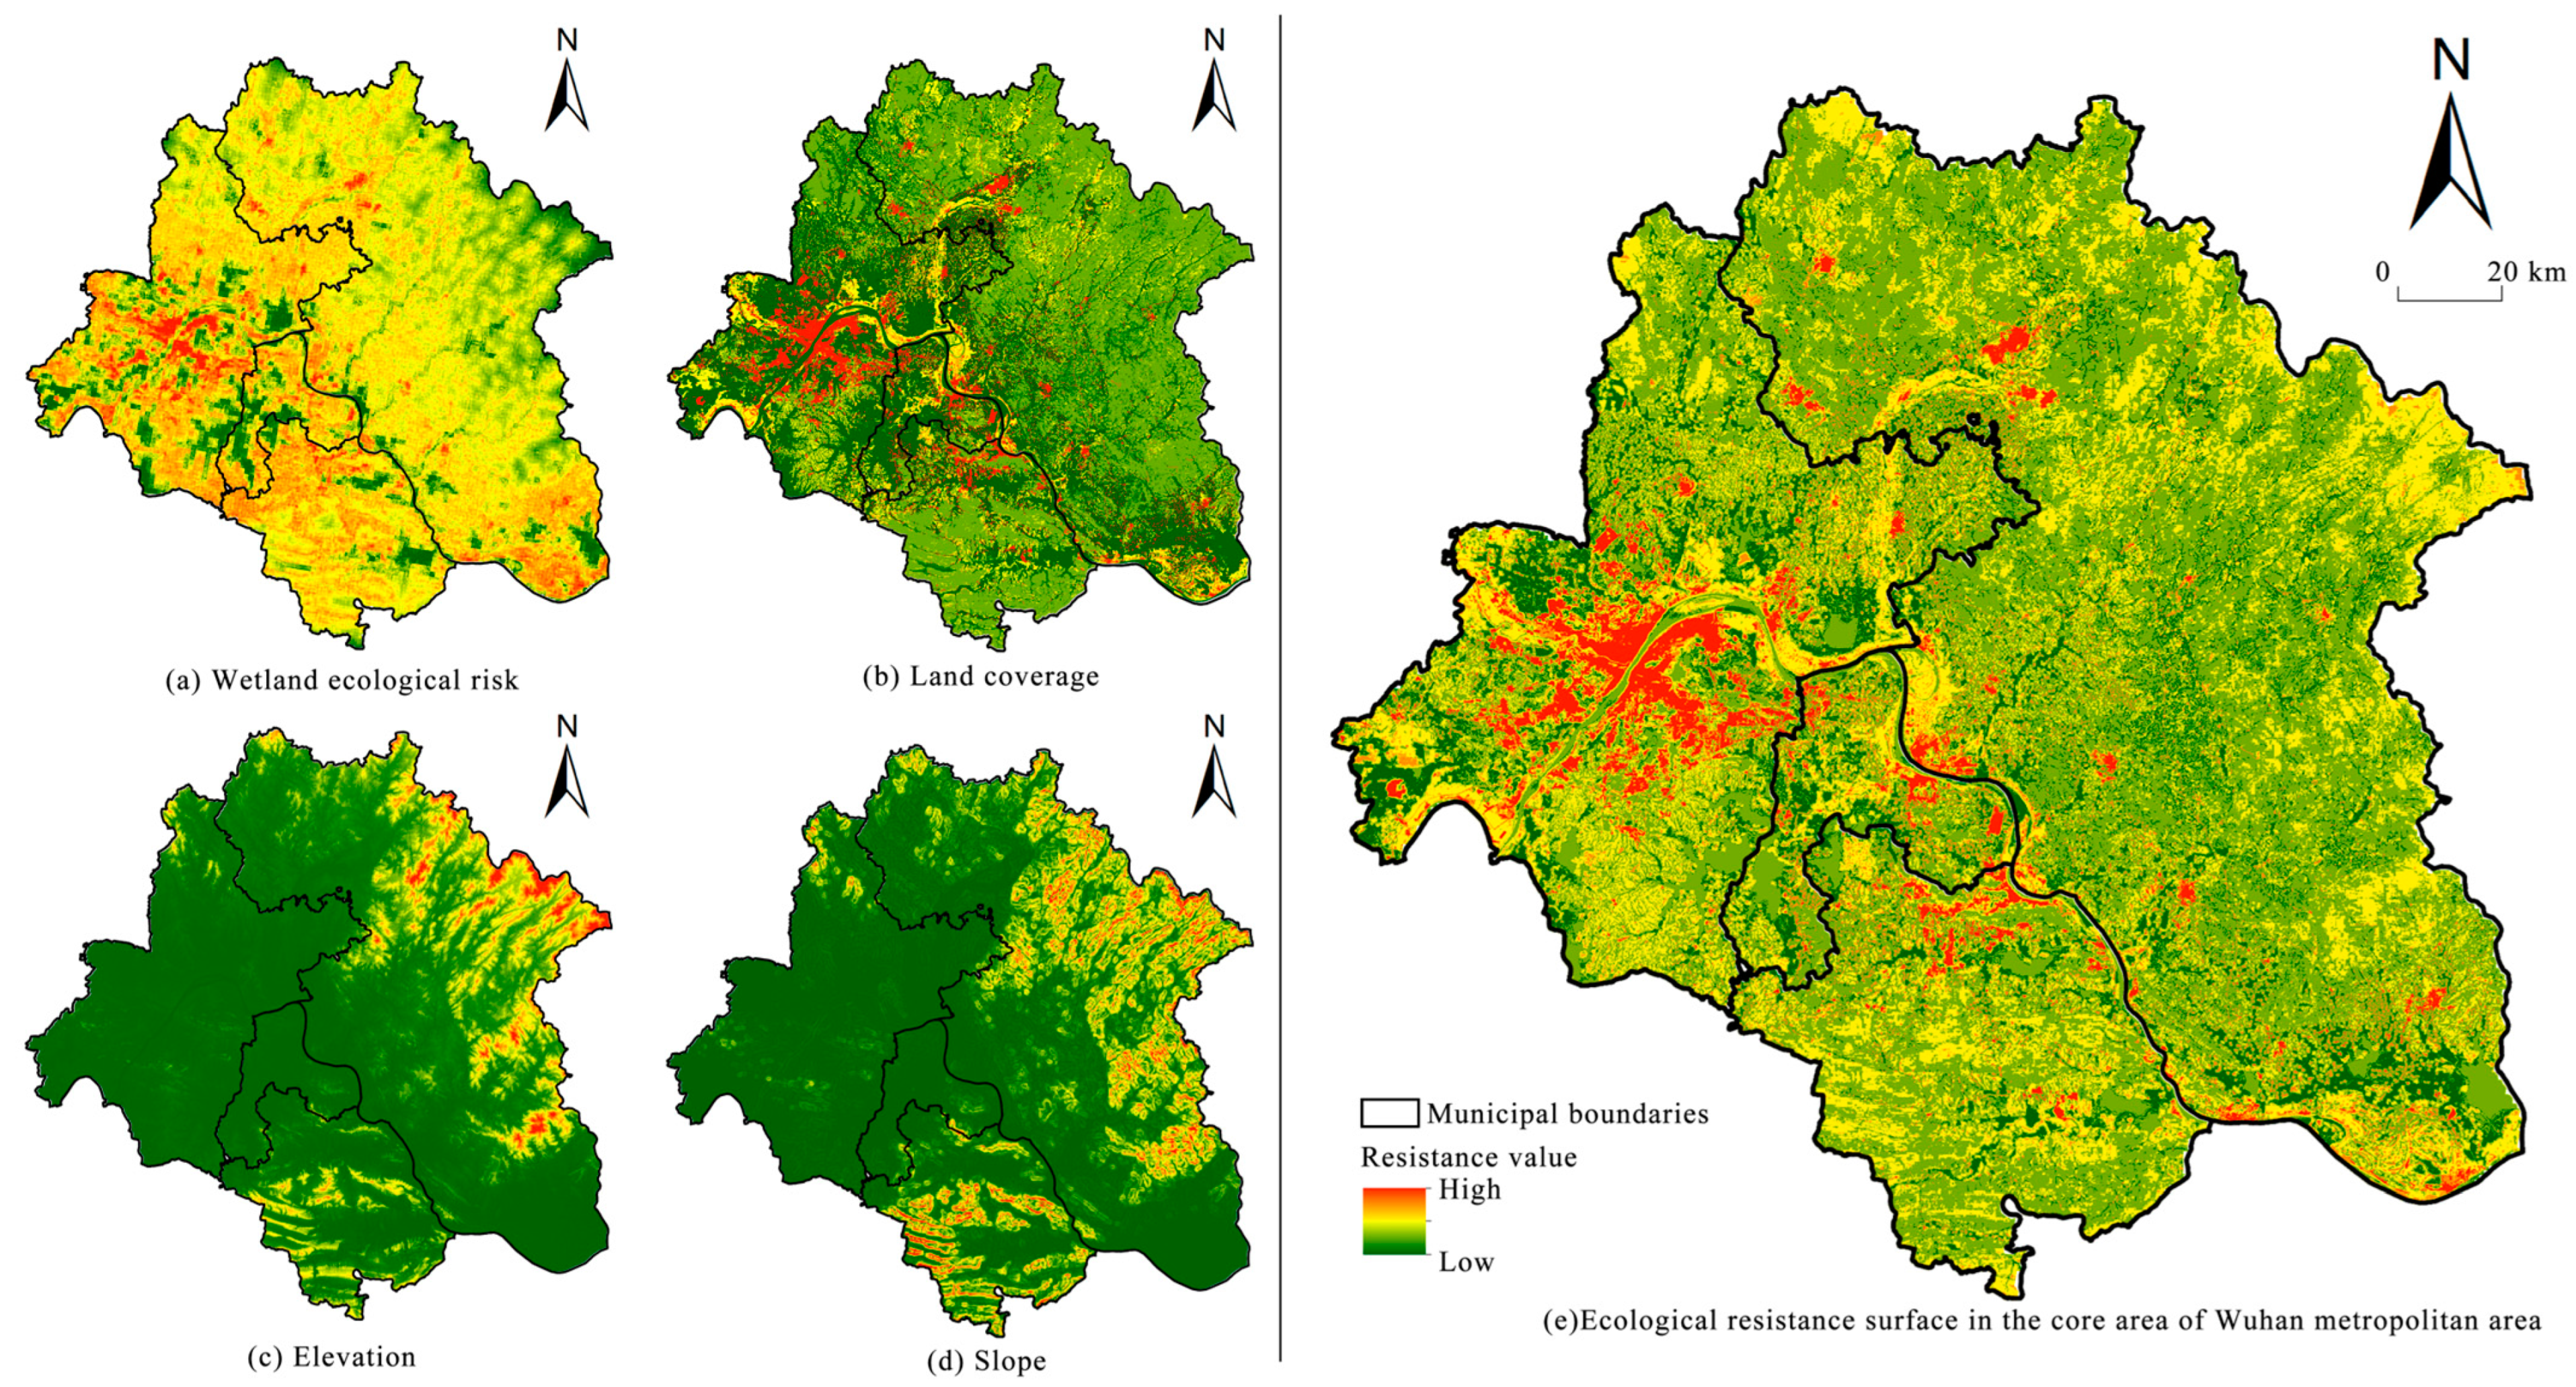
Resistance Surface Construction
The migration of organisms among ecological patches, energy flow, and material cycling are key ecological processes that are often constrained by resistance factors at the spatial level. The use of scientifically established ecological resistance surfaces provides an important basis for identifying and extracting ecological corridors [54]. The risk posed by wetlands to ecological processes and energy flow represents a significant challenge. Accordingly, this study considers wetland ecological risk to be the primary resistance factor, which is of paramount importance for optimizing the configuration of ecological corridors and ensuring the robust functioning of ecosystems. We identified wetland ecological risk, elevation, slope, and land cover as resistance factors, taking into account the actual situation and relevant research progress. These factors are then divided into resistance levels and values. AHP hierarchical analysis is applied to determine the weights of the resistance factors (Table 4), and a consistency test is conducted to ensure the reliability of the results. The consistency test yields a value of CR = 0.0036, which is less than 0.1, indicating that the results are consistent.
(3)
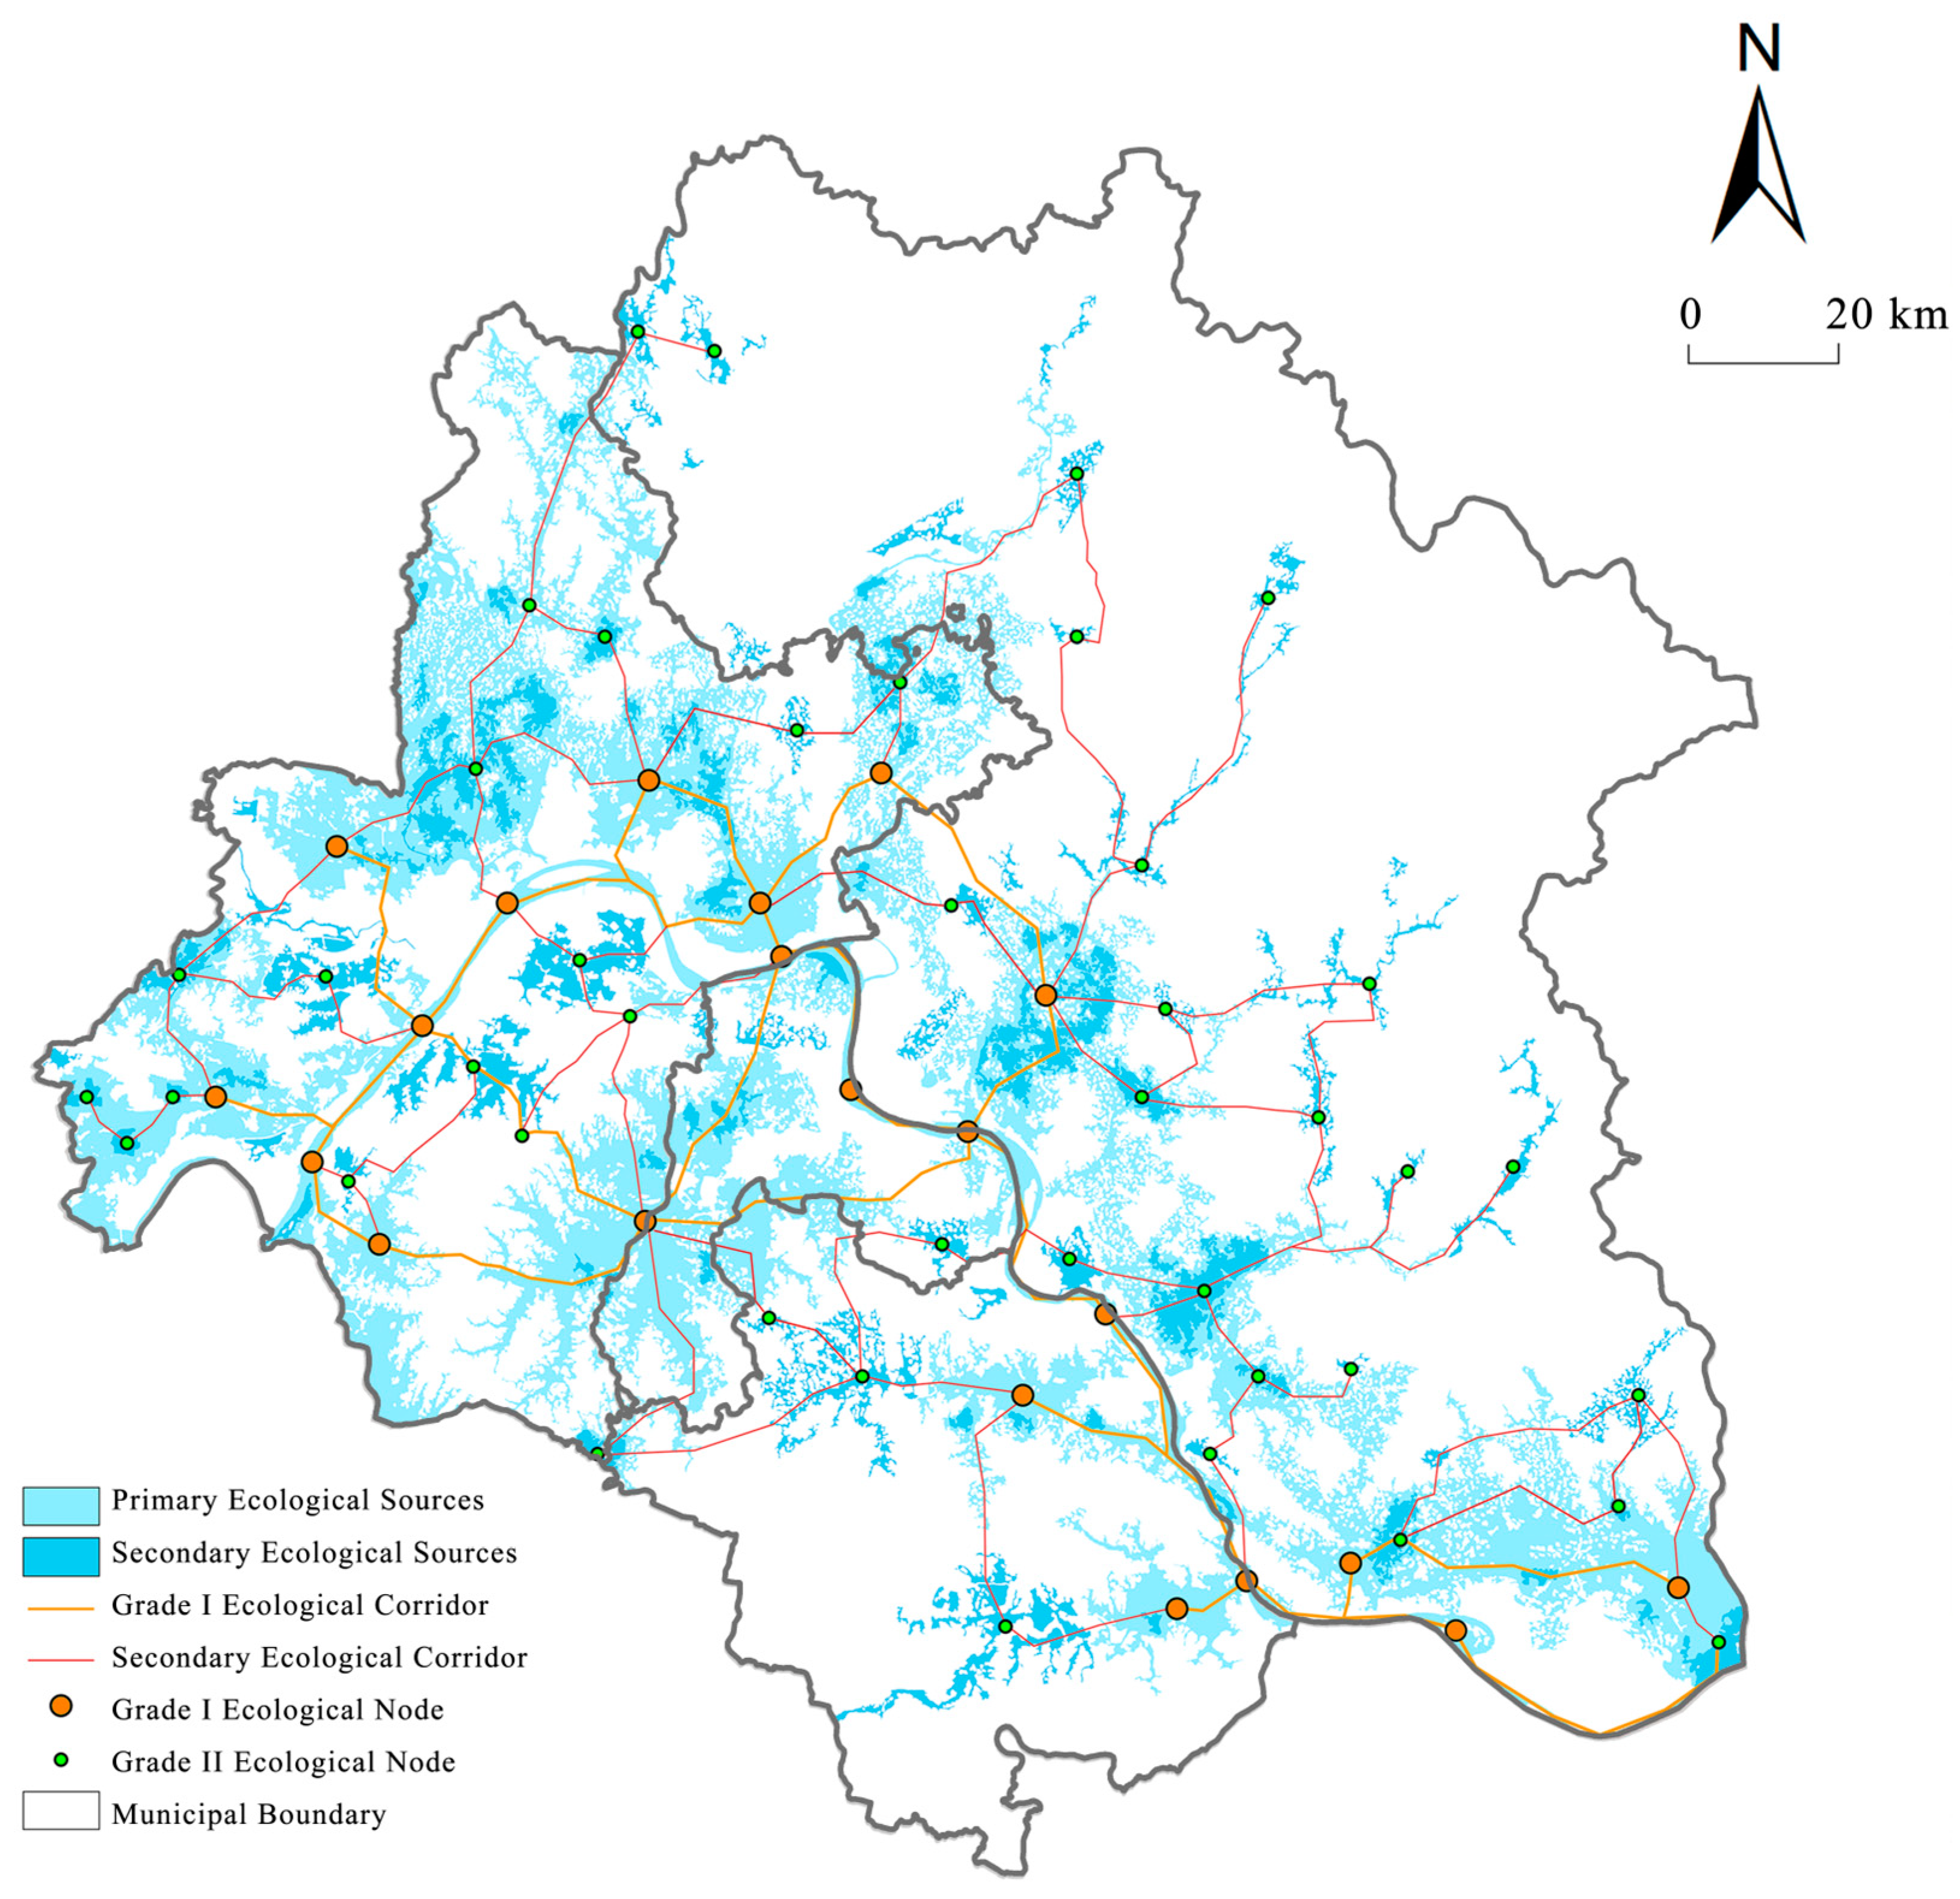
Ecological Corridor and Ecological Node Construction
Ecological corridors, as the lowest resistance channel between two neighboring ecological sources, play a key role in promoting material circulation and energy flow and are the core element to enhancing the stability and integrity of the regional wetland spatial structure. We combined the results of resistance surface construction based on the minimum resistance model to accurately calculate the minimum resistance between the ecological sources of the wetland in the study area and extract the ecological corridor [55]. The basic formula is as follows.
M C R = f m i n j = n i = m D i j × R i
where MCR represents the sum of the minimum resistance experienced from an ecological source to another ecological source. f represents the positive correlation between the minimum cumulative resistance model and the ecological process, which is an unknown monotonically increasing function. Dij represents the actual distance that the target unit has to traverse in space from ecological source i to another source j. Ri reflects the resistance that ecological source i encounters as it disperses in a particular direction in space [56].

3. Results

3.1. Wetland Ecological Risk Evaluation Results

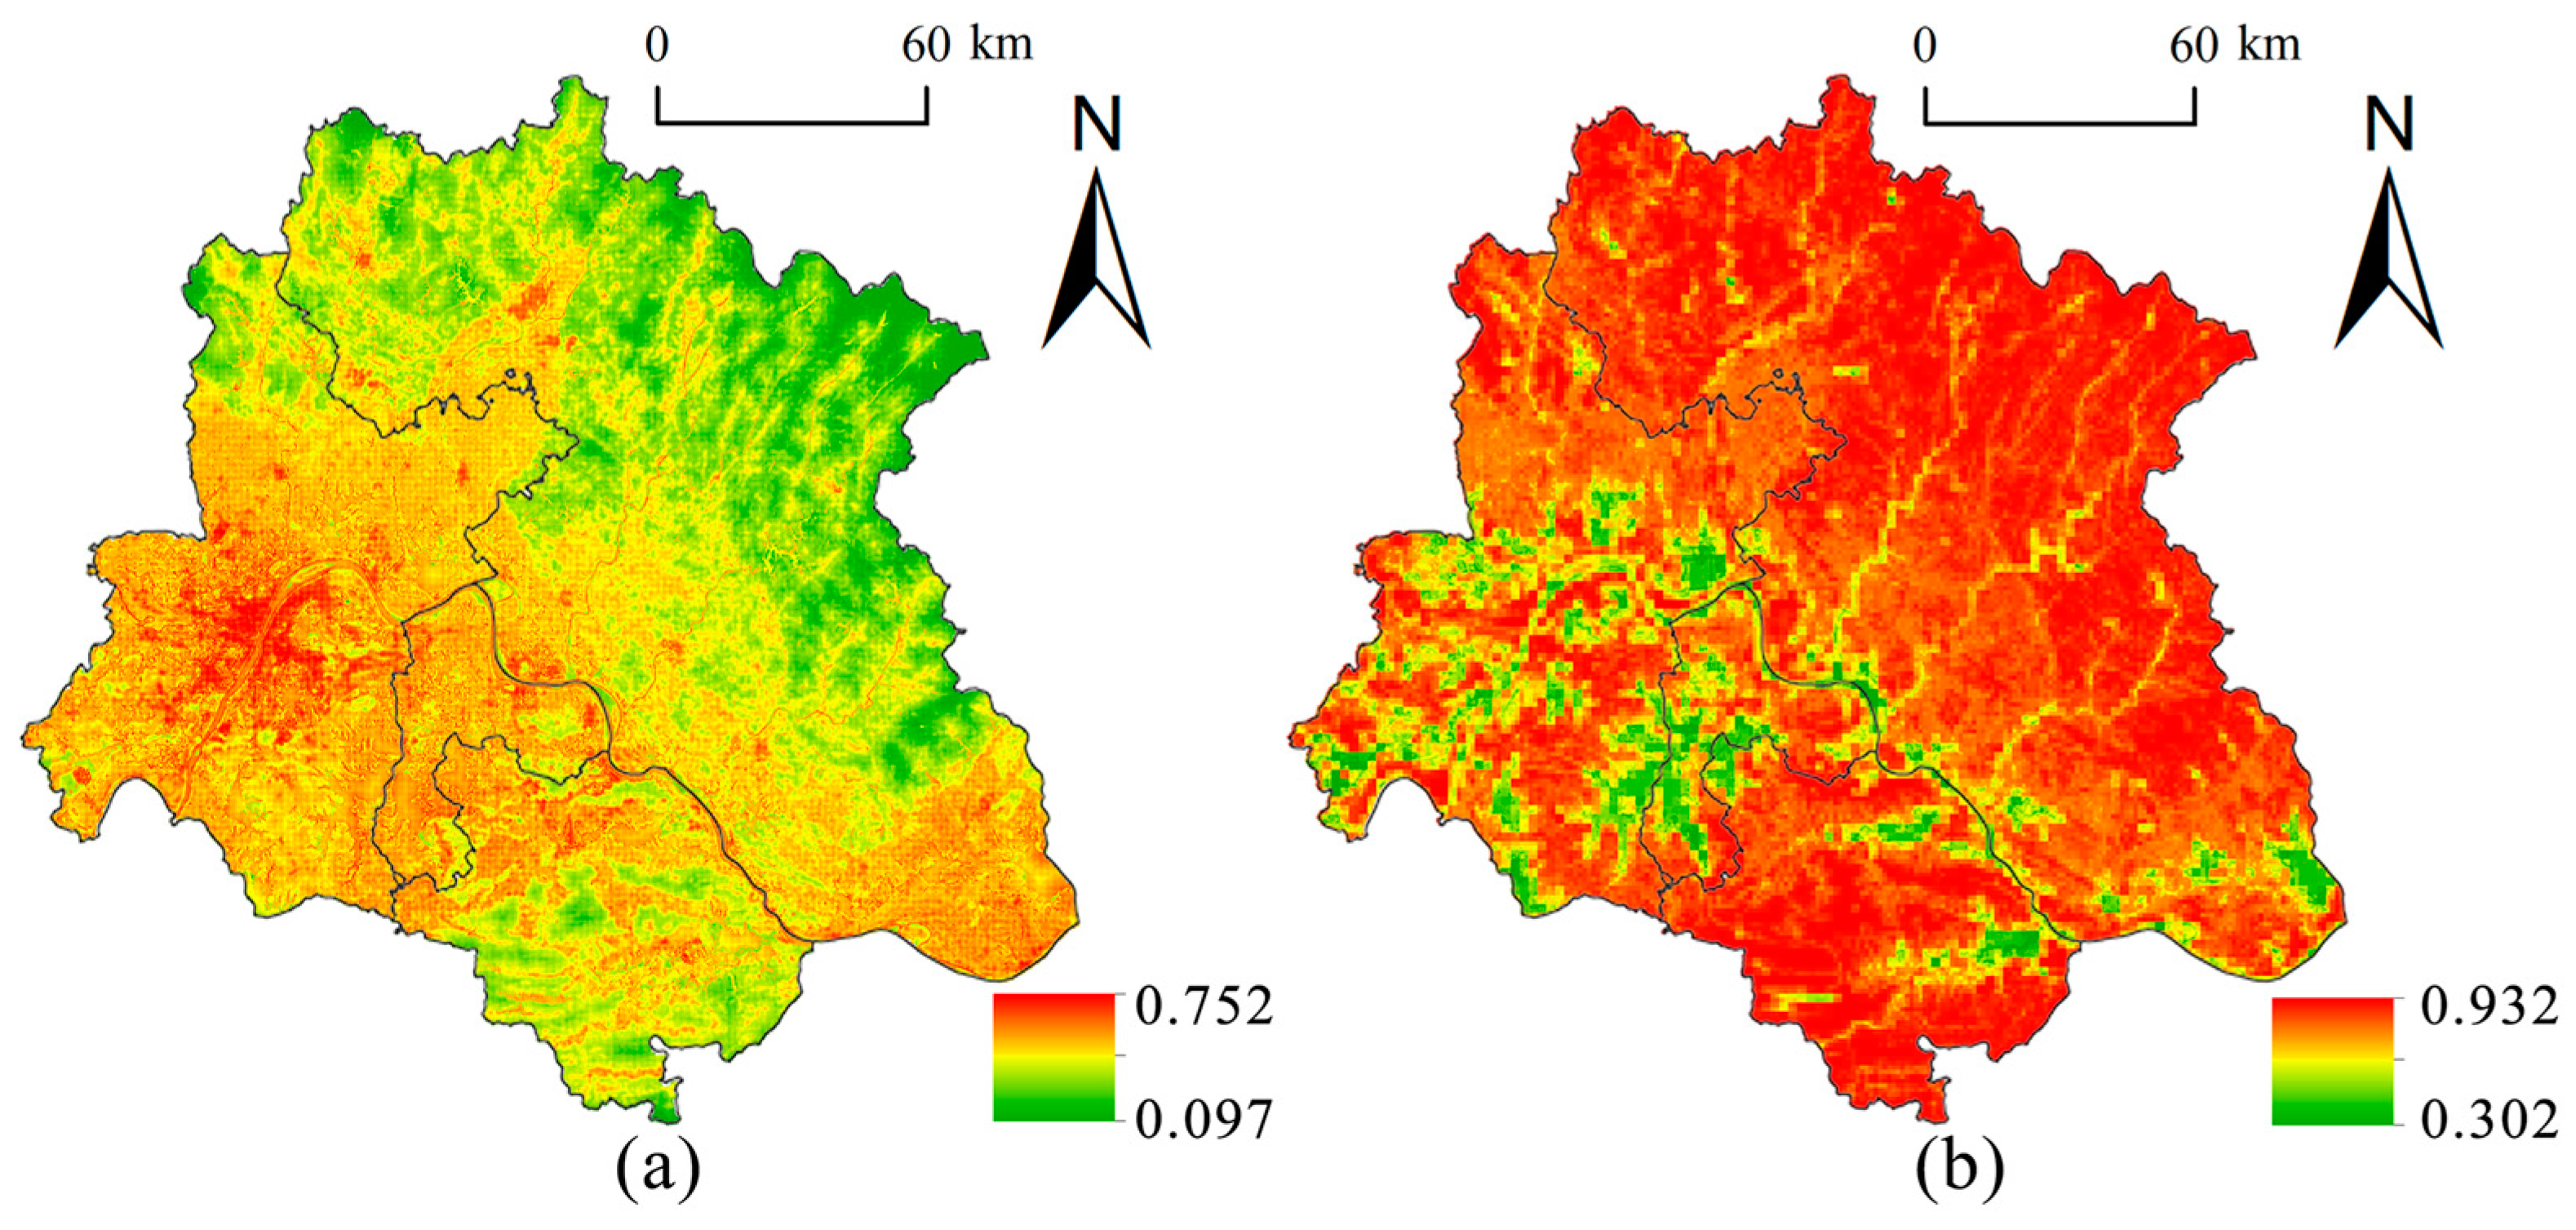
3.1.1. Spatial Distribution of External Hazard

We characterize the spatial variability in the risk of external hazards by combining two categories of external disturbances, natural factors and social factors (Figure 3a). A combination of natural factors and human activities has led to greater threats to wetland ecosystems in these areas. The combination of higher temperatures and SPEI in the central urban area and the central plain area, which are separated by the northern and southern mountains, has the potential to impact the natural environment in the wetlands due to the heat island effect and the relatively low rainfall. In terms of human activities, the expansion of human activities, the higher population density, the expansion of construction areas, and the higher land use intensity have resulted in increased disturbance in the central urban area of Wuhan, the areas along the Yangtze River, and the suburban areas of Wuhan such as Dongxihu District, Caidian District, and the new urban areas to Ezhou and Huangshi. In terms of human activities, there has been an increase in population density, an expansion of built-up areas, and an increase in the intensity of land use. These have led to increased disturbance in the central urban area of Wuhan, the areas along the Yangtze River, the suburban areas of Wuhan such as Dongxihu District, Caidian District, as well as the new urban areas to Ezhou and Huangshi. It is evident that there is a clear spatial differentiation in the risk of external disturbance. The central area of the city and the rapidly urbanizing and expanding area are the areas with the highest incidence of risk of external disturbance.

3.1.2. Spatial Distribution of Internal Vulnerability

In this study, the spatial differentiation of the inherent risk of wetlands in the study area was analyzed through the three aspects of wetland spatial extent, spatial structure and ecological function (Figure 3b). Urbanization has significantly eroded the wetland area, especially in Wuhan and its riverine areas, leading to the degradation of wetland ecosystems in these areas with obviously high risks. Under the combined influence of natural conditions like geography and climate, especially in areas with dense river networks, the density of wetland patches is significantly higher. This phenomenon is more pronounced in the Huangshi and Huanggang regions near the Yangtze River and its tributaries, where the density of wetland patches is higher. In contrast, in Wuhan’s main urban area and its surrounding development zones, such as Hanyang and Wuchang districts, rapid urbanization has fragmented wetlands into smaller patches, resulting in higher landscape fragmentation and poorer ecological continuity. The landscape diversity of wetlands is better in the Liangzi Lake cluster in Ezhou and the Daye Lake area in Huangshi, which are rich in types of natural lakes and riverine wetlands with strong ecological functions and lower risks. Due to excessive urbanization and industrialization in Wuhan New City and Ezhou District, the four ecological functions of wetlands, namely provisioning, regulating, supporting and cultural, have obviously been degraded, and the high risk is concentrated in these rapidly urbanizing areas. On the other hand, in the areas where wetland restoration is actively pursued, such as Luhu Lake and Jingyin Lake, the ecological functions of wetlands have been effectively restored and the risk is low. Overall, wetland ecosystems in the Wuhan metropolitan core area show obvious spatial differentiation characteristics in different regions. Urban development brings multi-level challenges to wetland areas, spatial structure and ecological functions.

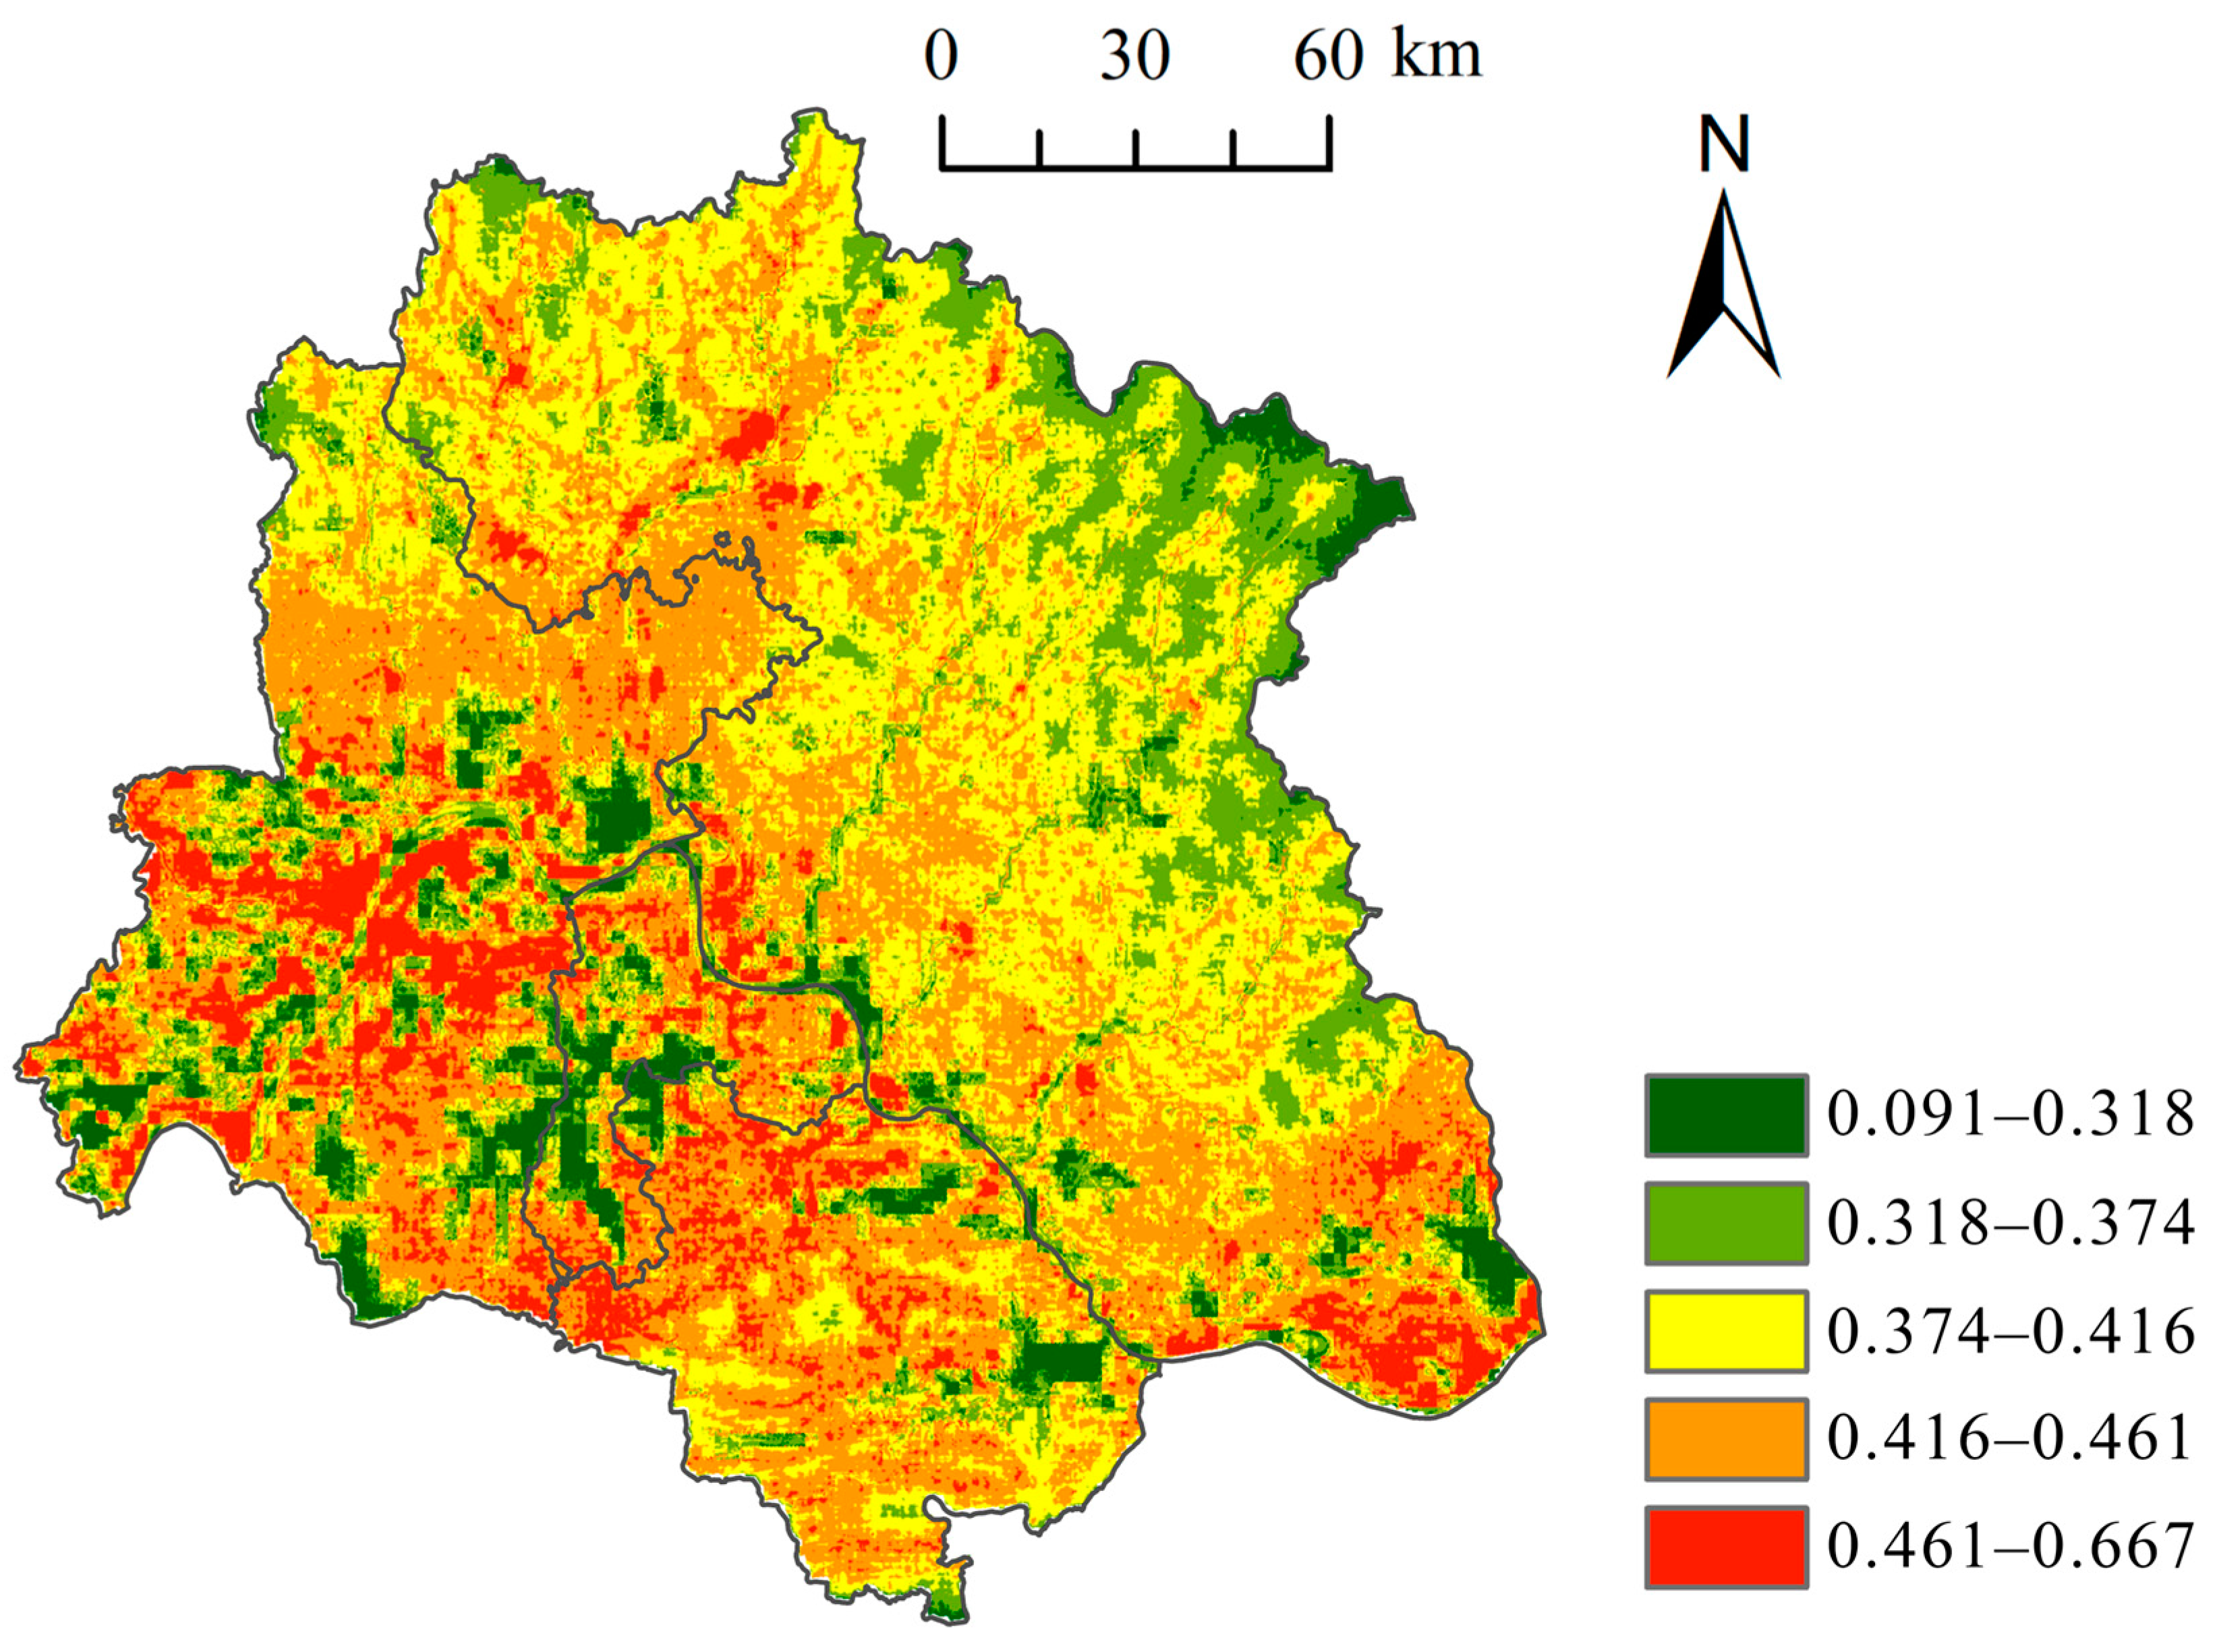
3.1.3. Spatial Distribution of Wetland Ecological Risk

The composite index of wetland ecological risk demonstrates considerable regional disparities in its spatial distribution (Figure 4), directly reflecting the impact of urbanization processes, the intensity of agricultural activities, and the efficacy of conservation measures. In particular, high-risk areas are predominantly situated within the central urban zones of Wuhan and its proximate suburbs, including Dongxihu District and Caidian District, as well as the riparian zones of Ezhou and Huangshi. The increasing risk in these regions is primarily attributable to the reduction in wetland areas resulting from urban expansion, the degradation of ecological functions, and the environmental pressures associated with the outward expansion of industrial and residential zones.
The relatively high-risk areas are primarily situated in the transitional zones between urban fringes and agricultural development zones, such as the areas extending from the outskirts of Wuhan towards Huangshi and Huanggang. In these regions, the increasing fragmentation of wetland patches and the degradation of ecological functions are intensified by the effects of urbanization. In these areas, the implementation of ecological restoration measures has reduced ecological risks to a certain extent. However, there are still ecological risks that cannot be ignored because of the friction and interlacing between industrial and agricultural activities and the penetration of cities into the suburbs.
Medium- and low-risk areas are predominantly situated in the mountainous regions to the north and south, as well as in well-protected wetlands such as Chenhu Lake and portions of the Liangzi Lake group, where extensive wetland restoration initiatives have been implemented. These areas are characterized by the maintenance of intact ecological structures, with the associated ecological services, including provisioning, regulation, support, and cultural services, being well preserved and reinforced. Furthermore, the effective implementation of wetland conservation measures in areas such as Chenhu Lake and parts of the Liangzi Lake group has demonstrated high resilience, thereby exemplifying successful regional ecological risk management.
In urban built-up areas, high-risk areas for ecological damage overlap with the central areas of major cities such as Wuhan, which demonstrates the significant pressures on wetlands brought about by urbanization. The implementation of effective wetland protection and management measures in surrounding lower-risk areas has resulted in notable benefits. The peripheral high-risk zones, particularly those with intensive agricultural activities such as aquaculture and cropland, are subjected to heightened environmental pressures due to the concentration of human activities, thereby forming an expansion zone of regional ecological risk. Regions with moderate composite risk, such as transitional zones from the Wuhan–Ezhou–Huangshi plains to the mountainous areas, exhibit a more complex risk pattern influenced by both urbanization impacts and the regulatory functions of natural landscapes.
The spatial distribution of wetland ecological risk in the study area exhibits a circular risk gradient pattern, with urban centers situated within the core high-risk area and remote mountainous regions located in the edge low-risk area. This pattern is undergoing a transformation concurrent with the simultaneous advancement of urban expansion and agricultural production activities. Various natural and anthropogenic factors are intertwined, thus determining the multidimensional spatial structure of the wetland ecological risk index.

3.2. Construction of Wetland Ecological Security Pattern in the Wuhan Metropolitan Core Area

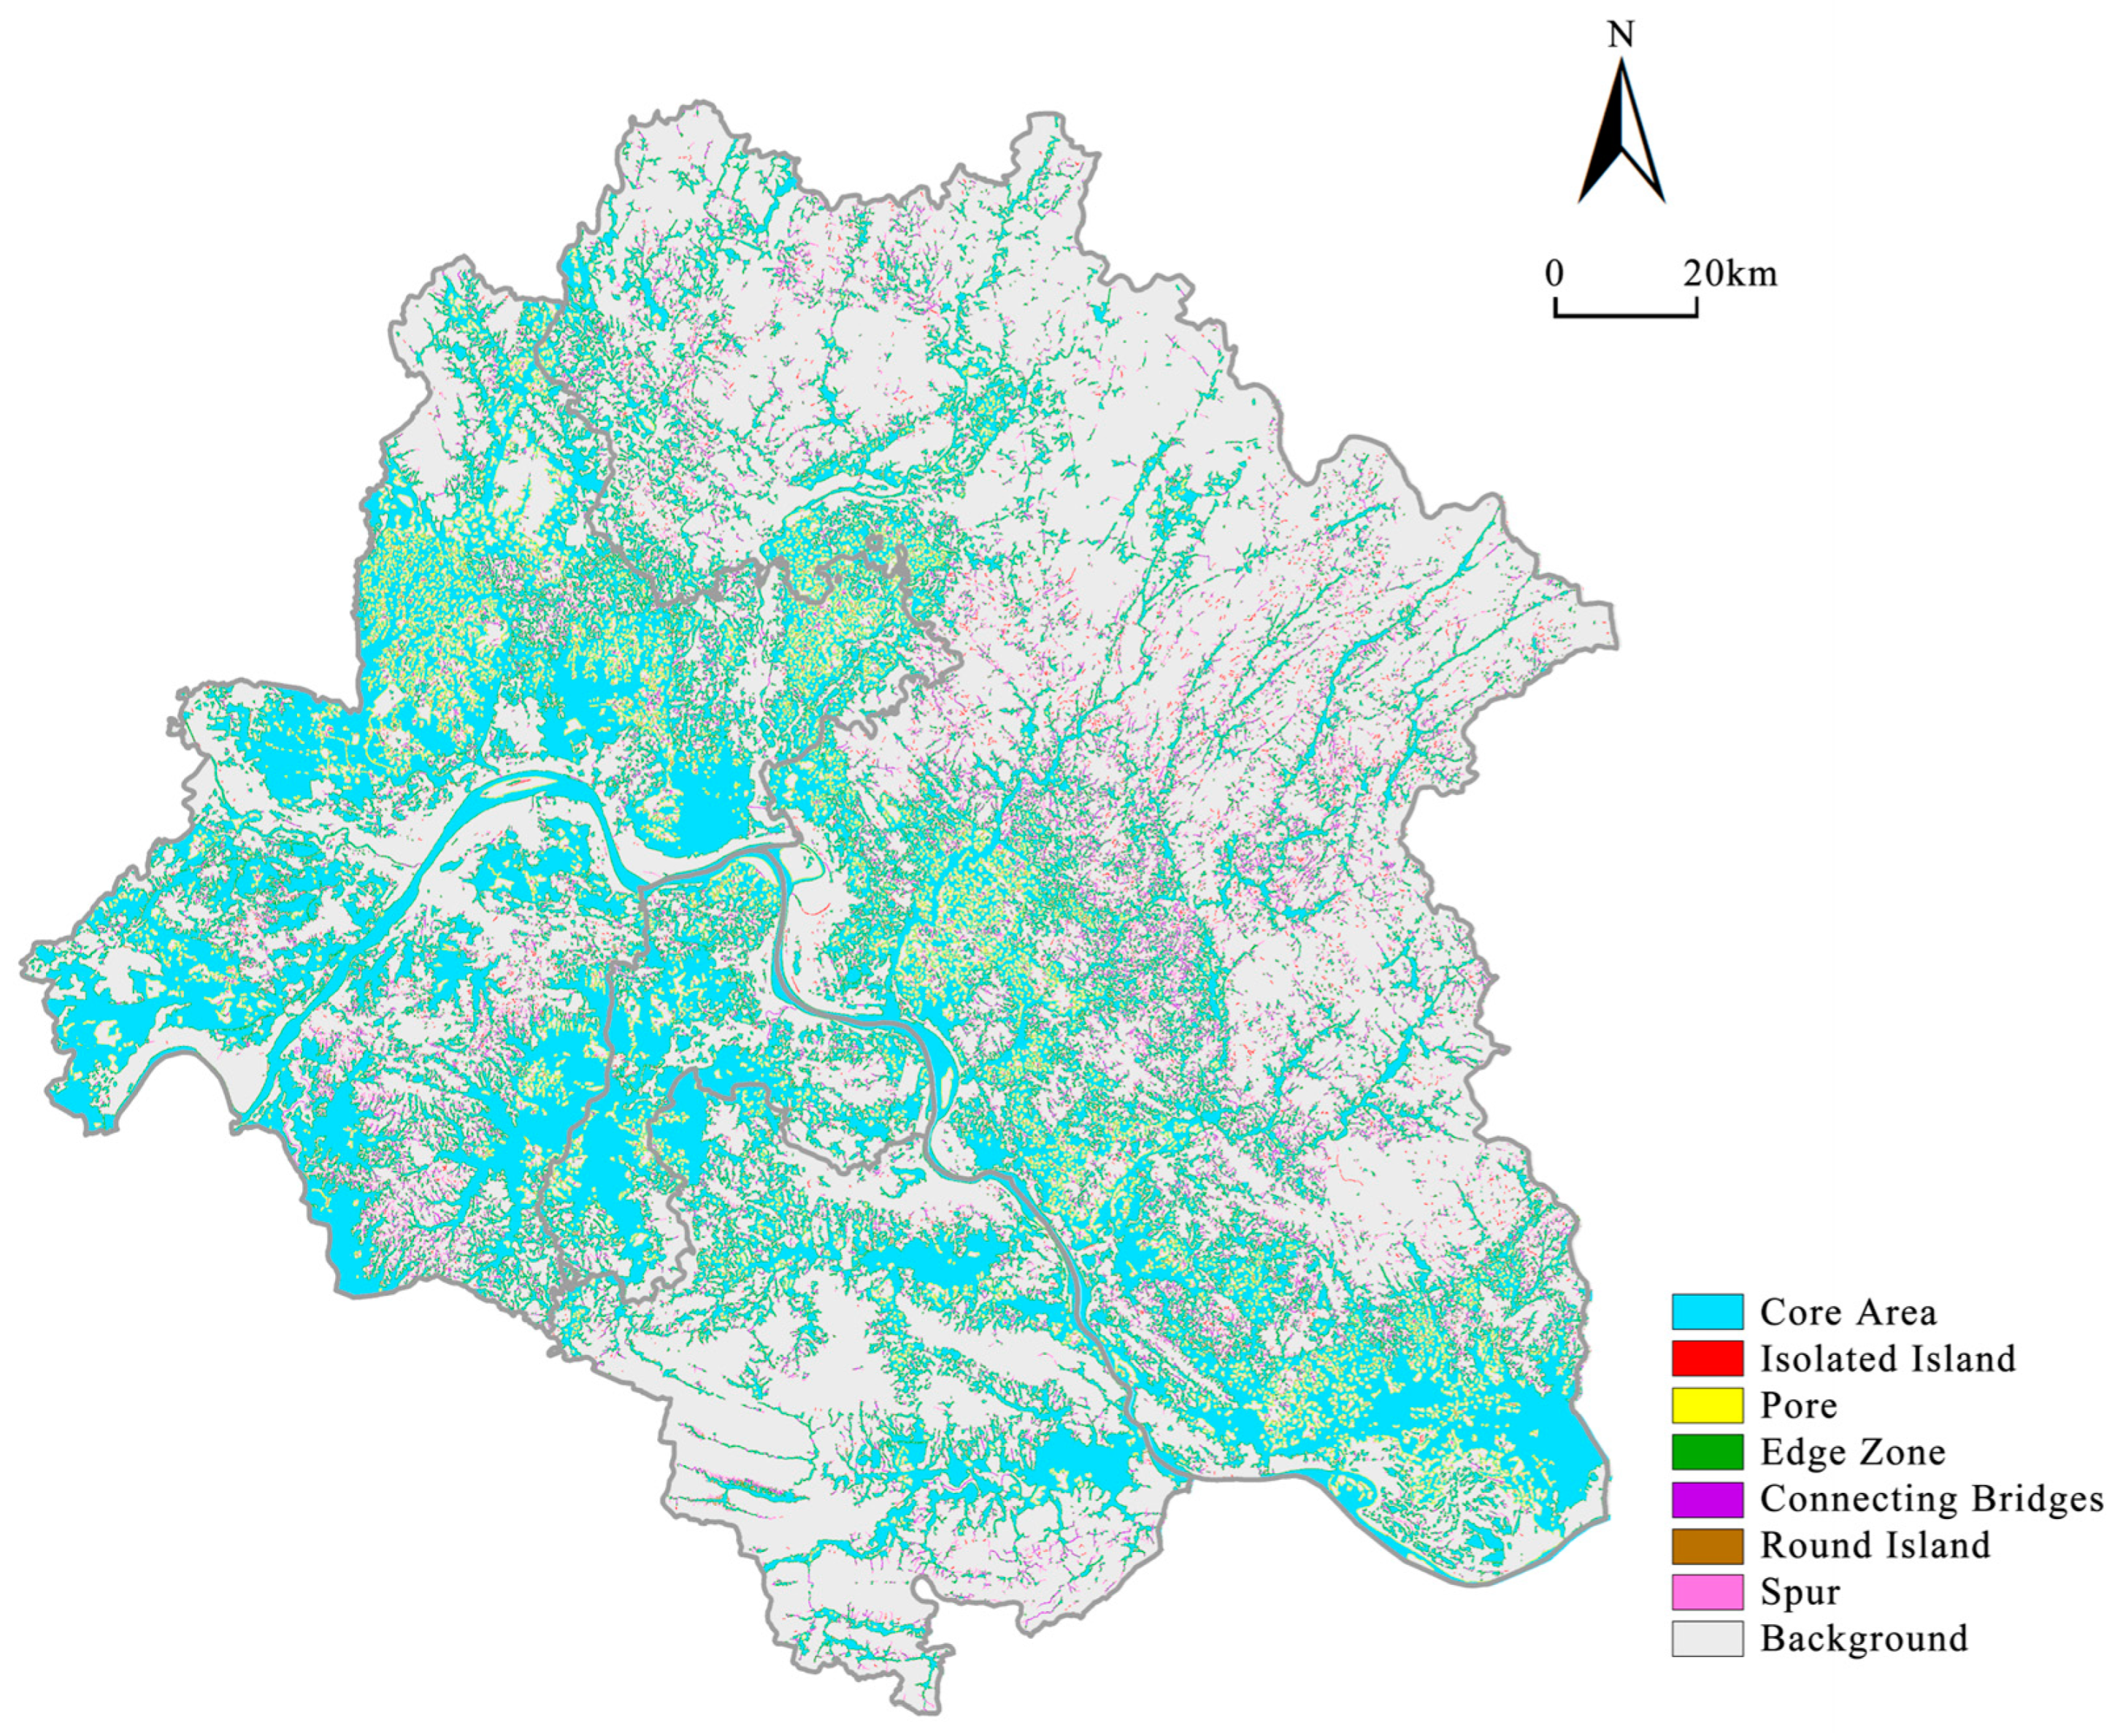
3.2.1. Wetland Ecological Source in the Wuhan Metropolitan Core Area

As illustrated in Figure 5, the core area in the west and south of the study area is of a larger size and plays an important role in stabilizing the ecological security pattern. In contrast, the core area in the northeast is relatively small and fragmented, which is not conducive to articulating the ecological sources.
Following the screening process, 668 ecological source sites were identified, encompassing an area of over 1,000,000 m2. The role of each ecological source area in landscape connectivity was evaluated in detail through the calculation of IIC, PC, and dPC. Based on these indices, the study conducted a ranking of the ecological source sites and ultimately identified 137 sites with a “dPC” value greater than 0.1, comprising 31 Class I sites and 106 Class II sites (Figure 6). The most significant ecological source sites are situated primarily along the main stem of the Yangtze River and in the surrounding lakes.

3.2.2. Construction of Wetland Ecological Resistance Surface in the Wuhan Metropolitan Core Area

Figure 7 illustrates the spatial distribution of wetland ecological risk and the factors affecting resistance. By combining the resistance factor and its corresponding weight, we can construct the ecological resistance surface of the wetland in the study area. The spatial differentiation of the ecological resistance value is notable. Areas with high resistance values are mainly located in urban built-up zones. The areas exhibiting lower resistance values are situated in proximity to the lakes and wetlands, situated at a considerable distance from the urban settlements. In contrast, the hilly regions display moderate resistance values.

3.2.3. Construction and Optimization of the Wetland Ecological Security Pattern in the

Wuhan Metropolitan Core Area

As illustrated in Figure 8, the study identified a total of 10 major ecological corridors, in addition to 20 primary and 42 secondary ecological nodes. An ecological security pattern is formed, in which a vast wetland corridor of the Yangtze River mainstem extends to the surrounding mountains and plains.
In the region situated to the south of the Yangtze River main stream, the Liangzi Lake Group represents the central ecological node. This node gives rise to several significant regional wetland ecological corridors, which are linked to the Yangtze River main stream. One such corridor is the “Yangtze River Main Stream-Dong Lake/Tangxun Lake/Wang Lake/Daye-Lu Lake/Liangzi Lake Group”. This corridor connects the core city, the development area wetland, and the urban and rural wetland. The development area wetlands, urban and rural area wetlands, and countryside area wetlands are being promoted for implementation of wetland ecological restoration and construction projects along the routes, to improve the integrity of wetland ecosystems in urban and rural areas.
The spatial structure of wetlands in the region north of the Yangtze River main stream is relatively uniform, exhibiting a chain-like distribution and generally forming an ecological spatial pattern of distribution along the banks of rivers such as the Tongshun River, Fu River, Ju River, and Bashui River. In the northern region, from south to north, from the plains to the mountains, wetland ecological corridors are distributed along the rivers, encompassing a variety of wetland types, including paddy fields and lakes, reservoirs and ponds. These diverse wetland ecosystems are interdependent and constitute a rich and varied wetland ecosystem.

3.2.4. Wetland Optimization Strategies Guided by Ecological Risks and Security Patterns of Wetlands in the Wuhan Metropolitan Core Area

In order to reduce the ecological risk of wetlands in the Wuhan metropolitan core area and to achieve a comprehensive optimization of the safety pattern, we propose specific strategies and optimization schemes for different regions, taking into account the spatial differentiation status of wetland ecological risk and the constructed ecological safety pattern. This is carried out so as to provide a reference path for the ecological protection and optimization of wetlands in the Wuhan metropolitan core area.
The Wuhan Dong Lake, situated at the heart of Wuhan city, is confronted with the challenge of urban expansion. To ensure the effective protection and management of this vital wetland resource, it is essential to comprehensively undertake wetland ecological restoration and assessment work, and to enhance the restoration standard system of the Dong Lake wetland. Concurrently, a risk management apparatus is constituted to guarantee the expeditious readjustment of wetland restoration strategies. Secondly, in accordance with the findings of the regional wetland risk assessment, a hierarchical management system should be put in place. In areas identified as low-risk, future construction and development should be strictly controlled, and a wetland buffer zone established. In areas identified as high-risk, there is a need to reinforce the management of sewage treatment and rainwater collection and filtration. Ultimately, the protection and construction of key elements such as the wetland water environment and wetland plants should be strengthened. The stability and self-regulation capacity of wetland ecosystems should be improved to ensure their healthy and sustainable development.
The new city area of Wuhan is replete with lakes and wetlands, which collectively constitute a unique ecological skeleton. This includes prominent bodies of water such as Liangzi Lake, Yanxi Lake, Wusi Lake, and Honglian Lake. As a consequence of the expansion of the new city, the ecological risk associated with wetlands in these areas has become increasingly evident. This risk displays a distinctive pattern of distribution, exhibiting a north-to-south gradient of increasing and then decreasing prevalence. In order to address these challenges, the initial step for the wetlands of Wuhan New City is to delineate the red line of wetland protection and control areas, implement a systematic governance structure to ensure the effective control of wetland ecological space usage, and reinforce the conservation of wetlands in rivers and lakes. Secondly, the construction of north–south ecological corridors is recommended to enhance the connectivity between the Liangzi Lake cluster and other important wetlands in the north, including Yanxi Lake, Yandong Lake, and those situated along the Yangtze River. This can be achieved through the establishment of large ecological corridors in the Guanggu area and the center of the new city, with the aim of enhancing the wetland integrity of the entire region. Moreover, it is imperative to reinforce the regulation of agricultural production and domestic sewage in rural areas to facilitate the ecological restoration of surrounding wetlands.
Liangzi Lake and Chen Lake, as the primary wetland resources in the Wuhan metropolitan core area, are of vital importance for maintaining ecosystem stability and serve as crucial ecological security barriers in the region. To safeguard the wetland ecosystems in these two regions, it is imperative to reinforce the administration of the nature reserves, implement real-time monitoring, and persist in advancing the wetland ecological restoration initiatives and compensation mechanisms. This will facilitate the comprehensive protection of wetland resources and enhance ecological functions and biodiversity. Concurrently, there is a need to strengthen the management of the water environment in lakes, paddy fields, and river wetlands. For the wetlands in these areas, strictly controlling emissions from pollution sources and exploring green industrial development models is crucial to improving the water quality of wetlands.
The ecological status of Wang Lake, which is the largest lake in the downstream main stream of the Fushui River, is of great consequence. In the past, Wang Lake and its surrounding lakes were severely polluted by aquaculture fertilizers, resulting in significant contamination of sediments and water bodies and a notable decline in water quality. The implementation of the policy of retiring Wang Lake in Yangxin, coupled with the deepening of pollution prevention and control measures, has led to a notable improvement in the water quality and water environment of the Wang Lake wetland. The objective of this study is to protect the Wang Lake wetland through the implementation of an integrated management strategy that addresses both external and internal sources of pollution. This encompasses the implementation of a no-farming policy within the nature reserve, the remediation of agricultural surface pollution, the restoration of wetland vegetation, and other ecological environment restoration projects. Concurrently, the study actively advocates for the advancement of ecological agricultural development models and the implementation of scientific dredging techniques for rivers, lakes, reservoirs, and ponds, with the objective of establishing a long-term mechanism for wetland protection. In addition, a watershed management experimental base has been established and the core and buffer zones of the wetland nature reserve have been delineated. It is also working on the construction of a lakeshore ecological belt to restore the ecological resilience of the wetland ecosystem. These measures are designed to enhance the resilience of critical wetlands such as Wang Lake and wetland-type nature reserves while also bolstering the protection of rare and endangered wildlife habitats.
The Huanggang Bailian River Reservoir Area is situated at the core of the Yangtze River’s main stream basin, specifically in the middle reaches of the Xishui River in the Wu Rivers Area of East Hubei. As a significant water source, the adaptive protection and management strategy for the Bailian River Reservoir Area is of particular importance. First and foremost, the key to addressing this issue lies in strengthening the prevention and control of various pollution sources. This encompasses agricultural surface pollution, aquaculture activities, and sewage treatment in neighboring towns. The threat of pollutants to the wetland ecosystem can be effectively mitigated through the implementation of rigorous emission standards, the promotion of environmentally sustainable agricultural technologies, and the enhancement of sewage treatment facilities.

4. Discussion

4.1. Analysis of the Framework for Constructing the Ecological Security Pattern Considering the Ecological Risk of Wetlands

Ecological risk assessment from the perspective of external hazard and intrinsic vulnerability has been widely applied to various ecological systems. For coupled natural–societal systems, social and cultural factors are often fully considered [57]. However, traditional methods for the ecological risk assessment of natural ecosystems often overlook factors related to social and human activities when applied to wetland ecosystems in the Wuhan metropolitan core area. This limitation hampers the comprehensive reflection of the spatial distribution of wetland ecological risk [58].
Thus, this study evaluates the ecological risks of wetlands in the Wuhan metropolitan core area in terms of two aspects: external hazard and intrinsic vulnerability. We selected factors from both natural elements and human activities as external disturbances and reflected wetland vulnerability through aspects such as area, structure, and function. This approach clarifies the social and ecological dimensions of wetland ecological risk assessment in metropolitan core areas [59].
Furthermore, aiming to optimize the spatial configuration of wetlands, we integrated the wetland ecological risk assessment into the construction of an ecological security pattern for the Wuhan metropolitan core area, fully considering ecological risks during the resistance surface construction. The ecological security pattern developed using this method offers higher practicality and feasibility for proposing specific strategies and actual planning and construction. This approach is significantly meaningful for improving the overall ecological environment quality of the region and responding to urban expansion in the Wuhan metropolitan core area [60].
We propose specific strategies for optimizing the ecological security pattern in terms of various aspects. In terms of the overall pattern of wetlands, we focus on wetland connectivity and stability; in terms of critical paths and nodes, we combine the results of ecological risk assessment and ecological security pattern and propose corresponding ecological space optimization strategies for typical wetland patches in the study area. In this way, the ecological function of wetlands at key nodes will be improved, and the sustainable development of wetland ecology in the Wuhan metropolitan core area will be maintained [61].

4.2. Discussion and Analysis of Ecological Risks of Wetlands in the Wuhan Metropolitan Core Area

The wetland ecological risks in the study area exhibit significant spatial differentiation, reflecting the intrinsic properties of wetland ecosystems and their susceptibility to urban development and agricultural activities. From the perspective of the spatial risk pattern, urban construction and the development of agricultural core areas significantly impact these ecosystems. Urban development zones along the Yangtze River and adjacent agricultural areas exhibit higher risks, highlighting the wetlands’ insufficient adaptive capacity to ecological risks. There is a gradient from low to high risk extending from the mountainous ecological functional areas on the north and south sides towards the urban development zones along the Yangtze River. This observation aligns with previous research indicating that urban expansion and production activities are key factors in deteriorating wetland ecological environments.
High-risk areas within the wetlands of the study area are mainly concentrated around rivers, lakes, and wetlands, especially those near urban water bodies, where frequent human activities lead to significant declines in environmental quality [62]. Additionally, the spatial structure of wetland landscapes is closely associated with road construction and urban sprawl. These human activities cause wetland landscapes to become fragmented, particularly in urban conglomerations where high-risk areas gradually extend toward suburban and rural regions. This finding indicates that urbanization severely threatens the connectivity of wetland systems, affecting their stability and functionality [63].
Although some areas within the central urban zones show lower risk levels due to the implementation of wetland ecological protection measures, the overall pressure of urbanization remains widespread. This evidence corroborates the multifaceted impact of human activities on wetland ecological environments, reflecting the characteristics of wetland ecosystems in response to different types of risks. It underscores the necessity of strengthening wetland protection and management amidst urbanization processes [64].

4.3. Discussion on the Optimization Strategy of the Wetland Ecological Security Pattern in the Wuhan Metropolitan Core Area

The optimization of the ecological security pattern of wetlands in the core area of metropolitan regions represents a pivotal step in addressing the inherent conflict between urbanization and ecological conservation. In the Wuhan metropolitan core area, wetlands are subjected to various pressures, including urban expansion, industrial pollution, and agricultural development. In 2024, China placed greater emphasis on wetland protection strategies for the Yangtze River Economic Belt, striving to integrate wetland resources. As a pivotal socio-economic development zone within the Yangtze River Basin, the conservation and administration of wetlands within the Wuhan metropolitan core area represent pivotal elements of regional ecological security. It plays an increasingly important role in ecological progress [65].
To effectively address these challenges, it is essential to conduct systematic wetland ecological risk assessments and implement feasible optimization strategies. This study synthesizes the findings of wetland ecological risk assessments to develop an ecological security pattern for wetlands. By integrating these results with the plan for the construction of an ecological security pattern, we provide targeted optimization strategies for the regional wetland ecological space. The objective of these efforts is to manage ecological risks and enhance the levels of wetland protection. The primary objectives of the proposed management measures for optimizing wetland ecological spaces are to maintain the integrity of wetland spatial patterns and to restore wetland ecological environments.
The strategies and optimization plans proposed in this study are based on comprehensive research into the spatial differentiation of wetland ecological risks. The objective of constructing an ecological security pattern is to enhance the ecological functions of wetlands within the metropolitan area while mitigating the impact of urban development on wetland ecosystems. Specifically, for the Wuhan East Lake area, it is proposed that wetland ecological restoration and assessment work be implemented and that periodic risk management mechanisms be established. These measures not only help to safeguard the ecological service functions of wetlands but are also key measures for maintaining biodiversity. They are more in line with the characteristics of wetlands and represent progress in fine-tuning the management of ecological space, which will be conducive to future ecological protection and restoration efforts [66].
In addition to the protection and restoration of wetland ecosystems, the proper integration of wetland conservation needs into urban planning and development is necessary to optimize the ecological security pattern of wetlands. The implementation of measures such as the delineation of red lines for wetland protection and the designation of control zones, as exemplified by the Wuhan New City area, can effectively manage and control wetland use, thereby preventing illegal occupation and overdevelopment. Moreover, the construction of a north–south ecological corridor through the Guanggu area serves to enhance connectivity between wetlands, thereby supporting overall urban ecosystem stability. In the case of wetlands that have already been degraded, such as the Huangshi Wanghu area, the implementation of comprehensive management and ecological restoration projects is of the utmost importance for the achievement of wetland ecological security [67].
Furthermore, the establishment of long-term wetland management mechanisms, such as the definition and control of nature reserves in Wang Lake, is of paramount importance for the maintenance of wetland ecosystem health. The success of these management measures hinges on the cooperation and support of local governments, communities, and non-governmental organizations to ensure effective implementation and continuous supervision. In optimizing the ecological security pattern of wetlands in the metropolitan core area, a number of challenges emerge. To ensure the feasibility and effectiveness of building an ecological security model, it is essential to consider the demands of the various stakeholders and to focus on the complex adaptations of the political mechanisms involved [68].

5. Conclusions

This study takes wetlands in the Wuhan metropolitan core area as the research object and clarifies the spatial distribution pattern of its ecological risk, which is a method to establish an ecological risk assessment system for wetlands by comprehensively evaluating the external disturbing factors and intrinsic vulnerability. Using the MSPA morphological method to identify the ecological source, the wetland ecological risk is integrated into the resistance surface to construct and determine the ecological corridors and nodes. Incorporating the spatial differentiation of ecological risk into the constructed ecological security pattern and proposing specific wetland ecological spatial optimization strategies can ensure the ecological functions of wetlands in metropolitan areas, improve the wetland ecological environment, and build a safe and sustainable wetland ecological space.
The conclusions of this study are as follows:
(1)
The overall wetland ecological risk assessment of wetlands in the Wuhan metropolitan core area found that the spatial distribution of ecological risk exhibits a ring-shaped risk gradient pattern centered on Wuhan and other large cities. The high-risk areas are mainly distributed in the central urban area and surrounding areas of Wuhan, the higher-risk areas are mainly the transition zone between the urban fringe and the agricultural development zone, and the medium- and low-risk areas are concentrated in the mountainous areas in the north and south of the region, as well as some well-protected wetland areas.
(2)
The ecological network of wetlands in the Wuhan metropolitan core area as a whole shows the spatial structure of the wetland corridor of the Yangtze River mainstem spreading to the surrounding mountains and plains, with 137 ecological sources selected, 10 major ecological corridors constructed, and 62 ecological nodes needing to be protected.
(3)
We combine the results of ecological risk assessment with the wetland ecological security pattern construction plan to develop an integrated management assessment framework, providing targeted optimization strategies for regional wetland ecological spaces. This promotes cross-regional coordination and cooperation, enhances wetland protection levels, and drives ecologically sustainable development.
Integrating the ecological risk evaluation of wetlands in the Wuhan metropolitan core area into the construction of ecological security pattern evaluation system helps to enrich the theoretical study of ecological risk and ESP, optimize the way ESP construction is carried out, and broaden new research ideas. This study helps to identify the influencing factors and distribution characteristics of wetland ecological risk in the Wuhan metropolitan core area, which is of practical significance for optimizing the regional wetland spatial structure and promoting the efficient development of wetland protection. This study understands the spatial distribution characteristics of wetland ecological risk in the Wuhan metropolitan core area, constructs an ecological safety pattern based on them, and discusses the development strategy of the ecological safety pattern in the study area. However, it is necessary to compare the wetland ecological risk evaluations of similar or different development areas horizontally for an in-depth and extensive empirical analysis.

Author Contributions

Conceptualization, P.H.; methodology P.H. and H.H.; software P.H. and H.H.; validation, P.H.; formal analysis, H.H.; investigation, P.H. and M.J.; resources, P.H. and M.J.; data curation, H.H. and M.J.; writing—original draft preparation, P.H.; writing—review and editing P.H. and M.J.; visualization, H.H.; supervision, M.W.; project administration, M.W.; funding acquisition M.W. All authors have read and agreed to the published version of the manuscript.

Funding

This study was funded by the Fund for Basic Research Operating Costs of the Central Universities under Grant No. 2662020YLPY013. This project was also funded by the Daye City Housing and Urban-Rural Development Bureau under the project title: 2022 Sixth Batch of Chinese Traditional Villages Survey and Recommendation Work-Daye City Traditional Villages Archiving and Declaration Study, Project No. 0220230143. The person in charge of both projects is Wang Min.

Data Availability Statement

The original contributions presented in the study are included in the article, further inquiries can be directed to the corresponding author.

Acknowledgments

We would like to express our sincere gratitude to our studio members for their assistance in the study and to the reviewers for their valuable suggestions and comments.

Conflicts of Interest

Author Haozhi Hu was employed by the company China Railway Siyuan Survey and Design Group Co., Ltd. The remaining authors declare that the research was conducted in the absence of any commercial or financial relationships that could be construed as a potential conflict of interest.

References

  1. Costanza, R. Nature: Ecosystems without Commodifying Them. Nature 2006, 443, 749. [Google Scholar] [CrossRef] [PubMed]
  2. Chen, L.; Ma, Y. Ecological Risk Identification and Ecological Security Pattern Construction of Productive Wetland Landscape. Water Resour. Manag. 2023, 37, 4709–4731. [Google Scholar] [CrossRef]
  3. Salimi, S.; Almuktar, S.A.A.A.N.; Scholz, M. Impact of Climate Change on Wetland Ecosystems: A Critical Review of Experimental Wetlands. J. Environ. Manag. 2021, 286, 112160. [Google Scholar] [CrossRef] [PubMed]
  4. Murray, N.J.; Phinn, S.R.; DeWitt, M.; Ferrari, R.; Johnston, R.; Lyons, M.B.; Clinton, N.; Thau, D.; Fuller, R.A. The Global Distribution and Trajectory of Tidal Flats. Nature 2019, 565, 222–225. [Google Scholar] [CrossRef]
  5. Jiang, T.; Pan, J.; Pu, X.-M.; Wang, B.; Pan, J.-J. Current Status of Coastal Wetlands in China: Degradation, Restoration, and Future Management. Estuar. Coast. Shelf Sci. 2015, 164, 265–275. [Google Scholar] [CrossRef]
  6. Fluet-Chouinard, E.; Stocker, B.D.; Zhang, Z.; Malhotra, A.; Melton, J.R.; Poulter, B.; Kaplan, J.O.; Goldewijk, K.K.; Siebert, S.; Minayeva, T.; et al. Extensive Global Wetland Loss over the Past Three Centuries. Nature 2023, 614, 281–286. [Google Scholar] [CrossRef]
  7. Liu, H.; Lin, Z.; Wang, W. Research Progress and Development Prospect of Wetland Resources. J. Nat. Resour. 2009, 24, 2204–2212. [Google Scholar]
  8. Liu, L.; Wang, H.; Yue, Q. China’s Coastal Wetlands: Ecological Challenges, Restoration, and Management Suggestions. Reg. Stud. Mar. Sci. 2020, 37, 101337. [Google Scholar] [CrossRef]
  9. Xiao, T.; Shi, Q.; Wen, Y.; Song, S.; Wang, Z.; Zeng, M. Progress and perspectives in the research of wetland ecosystem services. Shengtaixue Zazhi 2022, 41, 1205–1212. [Google Scholar] [CrossRef]
  10. Xu, T.; Weng, B.; Yan, D.; Wang, K.; Li, X.; Bi, W.; Li, M.; Cheng, X.; Liu, Y. Wetlands of International Importance: Status, Threats, and Future Protection. Int. J. Environ. Res. Public Health 2019, 16, 1818. [Google Scholar] [CrossRef]
  11. Pimm, S.L. The Complexity and Stability of Ecosystems. Nature 1984, 307, 321–326. [Google Scholar] [CrossRef]
  12. Kang, P.; Chen, W.; Hou, Y.; Li, Y. Linking Ecosystem Services and Ecosystem Health to Ecological Risk Assessment: A Case Study of the Beijing-Tianjin-Hebei Urban Agglomeration. Sci. Total Environ. 2018, 636, 1442–1454. [Google Scholar] [CrossRef] [PubMed]
  13. Wang, H.; Song, C.; Song, K. Regional Ecological Risk Assessment of Wetlands in the Sanjiang Plain with Respect to Human Disturbance. Sustainability 2020, 12, 1974. [Google Scholar] [CrossRef]
  14. Mao, D.; Wang, Z.; Wu, J.; Wu, B.; Zeng, Y.; Song, K.; Yi, K.; Luo, L. China’s Wetlands Loss to Urban Expansion. Land Degrad Dev 2018, 29, 2644–2657. [Google Scholar] [CrossRef]
  15. Qian, Y.; Liu, D.; Lou, Y.; Chen, H.; Zhou, G.; Chen, G. A review of wetland ecological status evaluation in China. Acta Ecol. Sin. 2019, 39, 3372–3382. [Google Scholar]
  16. Zhang, C.; Dong, B.; Liu, L.; Peng, W.; Chen, C.; Zhou, Q.; Wang, Q.; Li, J.; Wang, C.; Huang, H.; et al. Study on Ecological Risk Assessment for Land-Use of Wetland Based on Different Scale. J. Indian Soc. Remote Sens. 2016, 44, 821–828. [Google Scholar] [CrossRef]
  17. Zhang, Y.; Yan, J.; Cheng, X. Advances in impact of climate change and human activities on wetlands on the Tibetan Plateau. Acta Ecol. Sin. 2023, 43, 2180–2193. [Google Scholar]
  18. Zhou, D.; Shi, P.; Wu, X.; Ma, J.; Yu, J. Effects of Urbanization Expansion on Landscape Pattern and Region Ecological Risk in Chinese Coastal City: A Case Study of Yantai City. Sci. World J. 2014, 821781. [Google Scholar] [CrossRef] [PubMed]
  19. Cheng, H.; Zhu, L.; Meng, J. Fuzzy Evaluation of the Ecological Security of Land Resources in Mainland China Based on the Pressure-State-Response Framework. Sci. Total Environ. 2022, 804, 150053. [Google Scholar] [CrossRef]
  20. Li, S.; Tu, B.; Zhang, Z.; Wang, L.; Zhang, Z.; Che, X.; Wang, Z. Exploring New Methods for Assessing Landscape Ecological Risk in Key Basin. J. Clean. Prod. 2024, 461, 142633. [Google Scholar] [CrossRef]
  21. Duan, H.; Yu, X.; Zhang, L.; Xia, S.; Liu, Y.; Mao, D.; Zhang, G. An Evaluating System for Wetland Ecological Risk: Case Study in Coastal Mainland China. Sci. Total Environ. 2022, 828, 154535. [Google Scholar] [CrossRef] [PubMed]
  22. Li, Z.; Jiang, W.; Wang, W.; Chen, Z.; Ling, Z.; Lv, J. Ecological Risk Assessment of the Wetlands in Beijing-Tianjin-Hebei Urban Agglomeration. Ecol. Indic. 2020, 117, 106677. [Google Scholar] [CrossRef]
  23. Wang, Y.; Pan, J. Building Ecological Security Patterns Based on Ecosystem Services Value Reconstruction in an Arid Inland Basin: A Case Study in Ganzhou District, NW China. J. Clean. Prod. 2019, 241, 118337. [Google Scholar] [CrossRef]
  24. Solovjova, N.V. Synthesis of Ecosystemic and Ecoscreening Modelling in Solving Problems of Ecological Safety. Ecol. Model. 1999, 124, 1–10. [Google Scholar] [CrossRef]
  25. Dong, R.; Zhang, X.; Li, H. Constructing the Ecological Security Pattern for Sponge City: A Case Study in Zhengzhou, China. Water 2019, 11, 284. [Google Scholar] [CrossRef]
  26. Su, Y.; Chen, X.; Liao, J.; Zhang, H.; Wang, C.; Ye, Y.; Wang, Y. Modeling the Optimal Ecological Security Pattern for Guiding the Urban Constructed Land Expansions. Urban For. Urban Green. 2016, 19, 35–46. [Google Scholar] [CrossRef]
  27. Mu, H.; Li, X.; Ma, H.; Du, X.; Huang, J.; Su, W.; Yu, Z.; Xu, C.; Liu, H.; Yin, D.; et al. Evaluation of the Policy-Driven Ecological Network in the Three-North Shelterbelt Region of China. Landsc. Urban Plan. 2022, 218, 104305. [Google Scholar] [CrossRef]
  28. Tu, Y.; Liu, M.; Gao, C.; Sun, Y.; Cai, C.; Su, L. Construction of ecological sources identification system for metropolitan areas and diagnosis of key areas for ecological restoration in nationally spatial areas. Acta Ecol. Sin. 2022, 42, 7056–7067. [Google Scholar]
  29. Zhou, G.; Huan, Y.; Wang, L.; Lan, Y.; Liang, T.; Shi, B.; Zhang, Q. Linking Ecosystem Services and Circuit Theory to Identify Priority Conservation and Restoration Areas from an Ecological Network Perspective. Sci. Total Environ. 2023, 873, 162261. [Google Scholar] [CrossRef]
  30. Fan, F.; Wen, X.; Feng, Z.; Gao, Y.; Li, W. Optimizing Urban Ecological Space Based on the Scenario of Ecological Security Patterns: The Case of Central Wuhan, China. Appl. Geogr. 2022, 138, 102619. [Google Scholar] [CrossRef]
  31. Huang, L.; Lu, Y.; Wang, J. Linking G2SFCA Method and Circuit Theory to Promote Spatial Equity and Landscape Connectivity in Urban Ecological Infrastructure. J. Environ. Manag. 2023, 348, 119208. [Google Scholar] [CrossRef] [PubMed]
  32. Li, F.; Ye, Y.; Song, B.; Wang, R. Evaluation of Urban Suitable Ecological Land Based on the Minimum Cumulative Resistance Model: A Case Study from Changzhou, China. Ecol. Model. 2015, 318, 194–203. [Google Scholar] [CrossRef]
  33. Peng, S.; Lin, X.; Thompson, R.L.; Xi, Y.; Liu, G.; Hauglustaine, D.; Lan, X.; Poulter, B.; Ramonet, M.; Saunois, M.; et al. Wetland Emission and Atmospheric Sink Changes Explain Methane Growth in 2020. Nature 2022, 612, 477–482. [Google Scholar] [CrossRef] [PubMed]
  34. Hubei Provincial Ecological Environment Department. Hubei Wetland Protection Plan (2023–2030); Hubei Provincial Ecological Environment Department: Wuhan, China, 2023. [Google Scholar]
  35. Zhu, Z.; He, Q. Spatio-Temporal Evaluation of the Urban Agglomeration Expansion in the Middle Reaches of the Yangtze River and Its Impact on Ecological Lands. Sci. Total Environ. 2021, 790, 148150. [Google Scholar] [CrossRef]
  36. Meng, W.; He, M.; Hu, B.; Mo, X.; Li, H.; Liu, B.; Wang, Z. Status of Wetlands in China: A Review of Extent, Degradation, Issues and Recommendations for Improvement. Ocean Coast. Manag. 2017, 146, 50–59. [Google Scholar] [CrossRef]
  37. Department of Natural Resources of Hubei Province. Bulletin of the First National Geographic Census of Hubei Province; Department of Natural Resources of Hubei Province: Wuhan, China, 2017. [Google Scholar]
  38. Wang, M.; Mao, D.; Wang, Y.; Song, K.; Yan, H.; Jia, M.; Wang, Z. Annual Wetland Mapping in Metropolis by Temporal Sample Migration and Random Forest Classification with Time Series Landsat Data and Google Earth Engine. Remote Sens. 2022, 14, 3191. [Google Scholar] [CrossRef]
  39. Gao, X.; Zhang, A.; Sun, Z. How Regional Economic Integration Influence on Urban Land Use Efficiency? A Case Study of Wuhan Metropolitan Area, China. Land Use Policy 2020, 90, 104329. [Google Scholar] [CrossRef]
  40. Norton, S.B.; Rodier, D.J.; van der Schalie, W.H.; Wood, W.P.; Slimak, M.W.; Gentile, J.H. A Framework for Ecological Risk Assessment at the EPA. Environ. Toxicol. Chem. 1992, 11, 1663–1672. [Google Scholar] [CrossRef]
  41. Muro, J.; Strauch, A.; Heinemann, S.; Steinbach, S.; Thonfeld, F.; Waske, B.; Diekkrüger, B. Land Surface Temperature Trends as Indicator of Land Use Changes in Wetlands. Int. J. Appl. Earth Obs. Geoinf. 2018, 70, 62–71. [Google Scholar] [CrossRef]
  42. Wu, H.; Guo, B.; Fan, J.; Yang, F.; Han, B.; Wei, C.; Lu, Y.; Zang, W.; Zhen, X.; Meng, C. A Novel Remote Sensing Ecological Vulnerability Index on Large Scale: A Case Study of the China-Pakistan Economic Corridor Region. Ecol. Indic. 2021, 129, 107955. [Google Scholar] [CrossRef]
  43. Luo, J.; Zhu, L.; Fu, H. Construction of Wetland Ecological Network Based on MSPA-Conefor-MCR: A Case Study of Haikou City. Ecol. Indic. 2024, 166, 112329. [Google Scholar] [CrossRef]
  44. Xu, E.; Zhang, H. Aggregating Land Use Quantity and Intensity to Link Water Quality in Upper Catchment of Miyun Reservoir. Ecol. Indic. 2016, 66, 329–339. [Google Scholar] [CrossRef]
  45. Li, F.; Zhang, S.; Yang, J.; Bu, K.; Wang, Q.; Tang, J.; Chang, L. The Effects of Population Density Changes on Ecosystem Services Value: A Case Study in Western Jilin, China. Ecol. Indic. 2016, 61, 328–337. [Google Scholar] [CrossRef]
  46. Hu, C. A Novel Ocean Color Index to Detect Floating Algae in the Global Oceans. Remote Sens. Environ. 2009, 113, 2118–2129. [Google Scholar] [CrossRef]
  47. Kang, L.; Yang, X.; Gao, X.; Zhang, J.; Zhou, J.; Hu, Y.; Chi, H. Landscape Ecological Risk Evaluation and Prediction under a Wetland Conservation Scenario in the Sanjiang Plain Based on Land Use/Cover Change. Ecol. Indic. 2024, 162, 112053. [Google Scholar] [CrossRef]
  48. Xie, H.; He, Y.; Choi, Y.; Chen, Q.; Cheng, H. Warning of Negative Effects of Land-Use Changes on Ecological Security Based on GIS. Sci. Total Environ. 2020, 704, 135427. [Google Scholar] [CrossRef]
  49. Karimian, H.; Zou, W.; Chen, Y.; Xia, J.; Wang, Z. Landscape Ecological Risk Assessment and Driving Factor Analysis in Dongjiang River Watershed. Chemosphere 2022, 307, 135835. [Google Scholar] [CrossRef] [PubMed]
  50. Huang, L.; Yuan, L.; Xia, Y.; Yang, Z.; Luo, Z.; Yan, Z.; Li, M.; Yuan, J. Landscape Ecological Risk Analysis of Subtropical Vulnerable Mountainous Areas from a Spatiotemporal Perspective: Insights from the Nanling Mountains of China. Ecol. Indic. 2023, 154, 110883. [Google Scholar] [CrossRef]
  51. Colding, J. ‘Ecological Land-Use Complementation’ for Building Resilience in Urban Ecosystems. Landsc. Urban Plan. 2007, 81, 46–55. [Google Scholar] [CrossRef]
  52. Xie, G.; Lin, Z. Research on evaluation and accounting of ecosystem assets and services. China Soft Sci. 2024, 39, 388–393. [Google Scholar]
  53. Ding, G.; Yi, D.; Yi, J.; Guo, J.; Ou, M.; Ou, W.; Tao, Y.; Pueppke, S.G. Protecting and Constructing Ecological Corridors for Biodiversity Conservation: A Framework That Integrates Landscape Similarity Assessment. Appl. Geogr. 2023, 160, 103098. [Google Scholar] [CrossRef]
  54. Yu, K. Methods for Identifying Strategic Points in Landscape Ecology and the Surface Model of Theoretical Geography. J. Geogr. Sci. 1998, 11–20. [Google Scholar]
  55. Cao, C.; Luo, Y.; Xu, L.; Xi, Y.; Zhou, Y. Construction of Ecological Security Pattern Based on InVEST-Conefor-MCRM: A Case Study of Xinjiang, China. Ecol. Indic. 2024, 159, 111647. [Google Scholar] [CrossRef]
  56. Zeng, L.; Yang, Q.-Y.; Yang, R.-H.; Chen, Y.-D. Landscape Pattern Optimization For Ecological Barrier In The Three Gorges Reservoir Area: A Case Study In Jiangjin, Chongqing. Chin. J. Ecol. 2017, 36, 1364–1373. [Google Scholar] [CrossRef]
  57. Zhang, Z.; Gong, J.; Plaza, A.; Yang, J.; Li, J.; Tao, X.; Wu, Z.; Li, S. Long-Term Assessment of Ecological Risk Dynamics in Wuhan, China: Multi-Perspective Spatiotemporal Variation Analysis. Environ. Impact Assess. Rev. 2024, 105, 107372. [Google Scholar] [CrossRef]
  58. Zeng, W.; He, Z.; Bai, W.; He, L.; Chen, X.; Chen, J. Identification of Ecological Security Patterns of Alpine Wetland Grasslands Based on Landscape Ecological Risks: A Study in Zoigê County. Sci. Total Environ. 2024, 928, 172302. [Google Scholar] [CrossRef]
  59. Zhang, W.; Liu, G.; Ghisellini, P.; Yang, Z. Ecological Risk and Resilient Regulation Shifting from City to Urban Agglomeration: A Review. Environ. Impact Assess. Rev. 2024, 105, 107386. [Google Scholar] [CrossRef]
  60. Fan, S.; Yan, M.; Yu, L.; Chen, B.; Zhang, L. Integrating Ecosystem Service Supply–Demand and Ecological Risk Assessment for Urban Planning: A Case Study in Beijing, China. Ecol. Indic. 2024, 161, 111950. [Google Scholar] [CrossRef]
  61. Huang, L.; Chen, Z.; Yang, Z.; Chen, M.; Chen, X.; Zhai, T.; Qiu, T. Integrating “Quality-Risk-Demand” Framework and Circuit Theory to Identify Spatial Range and Priority Area of Ecological Security Pattern in a Rapidly Urbanizing Landscape. Ecol. Inform. 2024, 82, 102673. [Google Scholar] [CrossRef]
  62. Alikhani, S.; Nummi, P.; Ojala, A. Urban Wetlands: A Review on Ecological and Cultural Values. Water 2021, 13, 3301. [Google Scholar] [CrossRef]
  63. Han, P.; Xiong, H.; Hu, H.; Zhou, J.; Wang, M. Integrating Risk-Conflict Assessment for Constructing and Optimizing Ecological Security Patterns of Polder Landscape in the Urban-Rural Fringe. Ecol. Indic. 2024, 166, 112256. [Google Scholar] [CrossRef]
  64. Wei, Y.; Zhou, P.; Zhang, L.; Zhang, Y. Spatio-Temporal Evolution Analysis of Land Use Change and Landscape Ecological Risks in Rapidly Urbanizing Areas Based on Multi-Situation Simulation − a Case Study of Chengdu Plain. Ecol. Indic. 2024, 166, 112245. [Google Scholar] [CrossRef]
  65. Lu, Y.; Huang, D.; Liu, Y.; Zhang, Y.; Jing, Y.; Chen, H.; Zhang, Z.; Liu, Y. Exploring the Optimization and Management Methods of Ecological Networks Based on the Cluster Mode: A Case Study of Wuhan Metropolis, China. Land Use Policy 2024, 137, 107021. [Google Scholar] [CrossRef]
  66. Ozesmi, U. Ecosystems in the Mind: Fuzzy Cognitive Maps of the Kizilirmak Delta Wetlands in Turkey. arXiv 2006. [Google Scholar] [CrossRef]
  67. García-Herrero, L.; Lavrnić, S.; Guerrieri, V.; Toscano, A.; Milani, M.; Cirelli, G.L.; Vittuari, M. Cost-Benefit of Green Infrastructures for Water Management: A Sustainability Assessment of Full-Scale Constructed Wetlands in Northern and Southern Italy. Ecol. Eng. 2022, 185, 106797. [Google Scholar] [CrossRef]
  68. Préau, C.; Tournebize, J.; Lenormand, M.; Alleaume, S.; Boussada, V.G.; Luque, S. Habitat Connectivity in Agricultural Landscapes Improving Multi-Functionality of Constructed Wetlands as Nature-Based Solutions. Ecol. Eng. 2022, 182, 106725. [Google Scholar] [CrossRef]
Figure 1. The location of Wuhan Metropolitan Core Area and the distribution of the wetlands.
Land 13 01407 g001
Figure 2. Research framework.
Land 13 01407 g002
Figure 3. (a) Wetland ecological risk external hazard spatial distribution; (b) wetland ecological risk internal vulnerability spatial distribution.
Land 13 01407 g003
Figure 4. Spatial distribution of wetland ecological risk in the Wuhan metropolitan core area.
Land 13 01407 g004
Figure 5. Landscape pattern of MSPA wetlands in the Wuhan metropolitan core area.
Land 13 01407 g005
Figure 6. (a) Spatial distribution of wetland primary ecological source in the Wuhan metropolitan core areas; (b) Spatial distribution of wetland secondary ecological source in the Wuhan metropolitan core areas.
Land 13 01407 g006
Figure 7. Classification of resistance levels of each resistance factor and ecological resistance surfaces in the Wuhan metropolitan core area. (a) Wetland ecological risk resistance factor; (b) Land coverage resistance factor; (c) Elevation resistance factor; (d) Slope resistance factor; (e) ecological resistance surfaces in the Wuhan metropolitan core area.
Land 13 01407 g007
Figure 8. Wetland ecological security pattern in the Wuhan metropolitan core area.
Land 13 01407 g008
Table 1. Wetland ecological risk assessment indicators.
Composite IndexObjective LevelCriterion LevelIndicator Layer+/−
Wetland Ecological RiskExternal hazardNatural Factors (0.176)Temperature (0.022)Positive
SPEI (0.047)Negative
Rainfall (0.107)Negative
Social Factors (0.824)Nighttime light intensity (0.061)Positive
Distance from construction site (0.201)Positive
Land use intensity (0.273)Positive
Population density (0.149)Positive
FAI (0.14)Positive
InternalvulnerabilityWetland Spatial Extent (0.102)Wetland patch size (0.102)Negative
Wetland Spatial Structure (0.341)Wetland patch density (0.064)Negative
Landscape spreading index (0.035)Negative
Landscape separation index (0.068)Positive
Landscape shannon diversity index (0.174)Negative
Wetland Ecological Function (0.557)Supply services (0.145)Negative
Regulating service (0.126)Negative
Supporting services (0.247)Negative
Cultural services (0.039)Negative
Table 2. Land use intensity classification.
Land Use TypesLand Use Intensity (LUI)
Beach1
Marsh
Unused Land
Woodland2
Grassland
River and Canal
Lakes
Reservoirs and Ponds3
Paddy fields4
Dry land
Building land5
Table 3. Modified ecosystem service equivalence scale.
Level 1Level 2Paddy FieldsWetlandsWater Bodies
Arid LandsPaddy FieldsWetlandsWater SystemsGlacial Snow Packs
Supply ServiceFood Production0.851.360.510.80
Raw material production0.40.090.50.230
Water supply0.02−2.632.598.292.16
Regulating ServicesGas regulation0.671.111.90.770.18
Climate regulation0.360.573.62.290.54
Environment purification0.10.173.65.550.16
Hydrological regulation0.272.7224.23102.247.13
Supporting ServicesSoil conservation1.030.012.310.930
Nutrient cycling maintenance0.120.190.180.070
Biodiversity maintenance0.130.217.872.550.01
Cultural ServicesLandscape aesthetics0.060.094.731.890.09
Table 4. Wetland resistance factor indicators and resistance classification criteria.
Resistance FactorWeightLevel of ResistanceValue of Resistance
Wetland Ecological Risk0.5591Low Risk1
Relatively Low Risk200
Medium Risk500
Relatively High Risk800
High Risk1000
Elevation0.1445<150 m100
150–300 m200
300–600 m500
600–1000 m800
>1000m1000
Slope0.1493<6 degrees100
6–12 degrees200
12–18 degrees400
18–24 degrees600
>24 degrees1000
Land coverage0.1471Wetlands1
Cropland300
Woodland50
Grassland100
Construction Land1000
Unused land800
Disclaimer/Publisher’s Note: The statements, opinions and data contained in all publications are solely those of the individual author(s) and contributor(s) and not of MDPI and/or the editor(s). MDPI and/or the editor(s) disclaim responsibility for any injury to people or property resulting from any ideas, methods, instructions or products referred to in the content.

