Abstract
Coal mining inevitably causes damage to the surface ecological environment. In response to the characteristics of multiple factors, wide scope, and long time series of surface ecological environment damage in coal mining subsidence areas, how to integrate multiple data sources and monitoring methods to achieve monitoring and trend analysis of ecological damage throughout the entire mining cycle still needs to be studied. In addition, the 110 mining method provides an innovative method for underground coal mining to reduce its surface ecological damage, but the differences in surface damage between the two mining modes and the effectiveness of the 110 method in realizing surface ecological damage-reducing mining still need to be studied in depth. Therefore, this study takes the surface ecological damage in the mining area of Lvliang City, a typical resource city in Shanxi Province, China, as the object. It establishes a four-in-one “Satellite–UAV–Ground–Underground” information monitoring method, proposes a historical big data evolution analysis method, constructs three spatial scales of historical big databases, clarifies the current situation and development trend of damage in coal mining areas in Lvliang City and explores the differences in surface ecological environment damage characteristics in coal mining areas based on the 121 and 110 mining methods. The results show that: (1) The existing coal mining subsidence area in Lvliang City is as high as 92,191.47 hectares, and it is expected to continue to increase to 130,739.55 hectares in the future 2035, with a growth rate of 41.812%, which realizes the goals of mapping the current situation, retracing the history and predicting the future of the ecological damage of the surface in Lvliang City. (2) The surface NDVI of the 110 working face is restored to the average level of the mining area faster than that of the 121 working face. The surface crack width, step displacement, length, distribution density, and surface settlement height of the 110 working face are all smaller than those of the 121 working face. It has been verified that the unique top-cutting and swelling filling effect of the 110 methods can effectively reduce the ecological damage caused by coal mining subsidence. And its widespread application can effectively realize the ecological environmental protection of the coal mine area and contribute to the high-quality development of the coal industry in Lvliang City.
1. Introduction
Mineral resources are an important material foundation for social production and economic development and are crucial to human life and production. Coal, as the main energy source in China, has always remained the top consumer of primary energy [1]. As an important producer and consumer of coal resources [2], China’s coal mining not only plays an important role in the development of the national economy but also inevitably brings negative impacts on land, ecology, and the environment—such as land occupation, land subsidence, landscape changes, toxic gas emissions, and soil pollution—among a series of ecological and environmental problems [3]. In the current era of promoting ecological civilization construction, high-quality development, and achieving the “dual-carbon” goals in China, coal resource extraction must take the path of green and low-carbon development [4,5].
In contrast with other countries, where open-pit coal mining is the mainstay, China’s coal mining mainly relies on underground mining, accounting for more than 80% of the total coal production for the year [6]. Underground mining leads to surface subsidence and the formation of coal mining subsidence areas, changing the terrain and landscape pattern, damaging land and groundwater resources, affecting land cultivation and vegetation growth, and causing a series of geological and environmental problems [7,8]. According to incomplete statistics, the cumulative subsidence area of coal mining in China has reached 2 million hectares, and it is increasing at a rate of over 80,000 ha/a, which is due to China’s large amount and wide range of mining geological and environmental problems [1,5]. It is particularly important to diagnose and monitor the damage to the surface ecological environment in coal mining subsidence areas and to investigate the damage patterns and long-term development trends [9].
The monitoring of ecological damage caused by coal mining subsidence begins with the monitoring of surface subsidence deformation. As the root cause of ecological damage in other coal mining subsidence areas, the rapid acquisition of the movement and deformation of the rock layer and the ground surface is the prerequisite for the diagnosis and prediction of coal mining subsidence, and for the reclamation of the land in the mining area and ecological restoration. Various scholars have carried out considerable research on the monitoring of surface subsidence and deformation in coal mining areas, including the traditional monitoring means of establishing a surface mobile observatory, as well as modern measurement techniques such as synthetic aperture radar measurements, CORS (continuous operational reference system), three-dimensional laser scanning, and unmanned aerial vehicles [10]. Dulias studied the mining subsidence in the Rybnik Plateau region of Poland and explored changes in surface subsidence rates during different periods [11]. Wodka et al. analyzed the deformation monitoring of mining sinkholes in the Terzibinia region by means of data from historical aerial photographs, aerial scanning data, orthophotographs, and satellite data [12].
In recent years, with the continuous improvement of traditional monitoring methods on the ground and the increasing resolution of satellite remote sensing [13,14], continuing development of drone monitoring technology [15,16,17], monitoring methods for surface ecological damage in coal mining subsidence areas have been improved. The method of obtaining information on surface ecological damage in mining areas with the fusion of multiple data sources has become a mainstream method [18,19]. Damage monitoring of ecological elements such as soil, vegetation, surface landscape, surface water, etc., in the coal mine area is continuously developing in the direction of qualification and quantification [20,21,22]. Abramowicz et al. performed spatial and temporal analyses of topographic relief and land cover of coal gangue hills to realize the monitoring of changes in environmental elements in mining areas [23]. Dulias conducted a comprehensive survey of the impacts of mining in the Upper Silesian Coal Basin in Poland, examining the effects of anthropogenic mining activities on changes in landscape and geomorphic features [24]. Lei et al. used the Shendong Mining Area in China as the study area and combined a variety of technical means to monitor the spatial and temporal evolution patterns of key environmental elements at multiple scales [18]. However, the monitoring of ecological damage in mines is characterized by multiple elements, wide range, long time sequence, etc. Methods of integrating multiple data sources and monitoring methods to realize the monitoring and trend analysis of ecological damage in the whole cycle of mining are still to be studied in depth.
For a long time, China’s underground coal mining has been dominated by the longwall mining 121 method, which requires two tunnels to be dug for each working face and one coal pillar maintenance tunnel to be set up, with the disadvantages of low resource extraction rate, high number of tunnels, and tense mining and excavation succession. In recent years, the academician Manchao He put forward the theory of “Cutting Top Short Wall Beam” [25], forming the technology of cutting the top and unloading pressure to form a self-contained tunnel without coal pillars (Longwall Mining 110 Method), i.e., each working face only needs to dig one roadway, and the other tunnel will be formed automatically by cutting the top and unloading pressure without coal pillars, which is characterized by a significant increase in the resource recovery rate. This realizes the safe, high-efficiency, and high-strength mining of the working face. Research has shown that the 110 method’s unique directional roof-cutting and pressure-relieving technology realizes directional collapse by utilizing mine pressure and filling the mining airspace by using the crushing and swelling effect of the collapsed gangue to slow down the deformation of the earth’s surface, protect the ecological environment of the earth’s surface, and realize the balanced mining [26,27]. However, along with the promotion and application of the 110 method, the research on the ecological damage characteristics of the mine surface needs to be strengthened urgently, and the differences in the surface ecological damage of the coal mine area under the two mining modes as well as the effectiveness of the 110 working method in realizing the mine surface ecological damage reduction of the mining area still need to be researched.
Therefore, this paper takes Lvliang City, a typical resource city in Shanxi Province, China, as the object; establishes the monitoring method of the surface ecological environment damage in the coal mine area; puts forward the method of analyzing the evolution of the historical big data of the surface ecological damage in the mine area; maps out the current situation and development trend of the surface ecological environment damage in the coal mine area in Lvliang City; explores the difference of the surface ecological environment damage in the coal mine area under the two kinds of mining modes; and lays the foundation of the high-quality development of Lvliang City’s coal industry.
2. Data and Methods
2.1. Experimental Scheme
Based on the research objective of analyzing the historical big data of surface ecological damage in the coal mining area of Lvliang City in two mining modes, the study designed the following experimental scheme (Figure 1). Firstly, based on remote sensing and other precise sensing technologies and on-site investigation of mining subsidence damage, build a precise sensing technology system of ecological environment damage from macroscopic to microscopic, from the sky to the underground, and from nature to society, and establish a “Satellite–UAV–Ground–Underground” method that is guided by underground mining information and integrates multi-source, multi-temporal satellite, and aerial remote sensing images. To establish a four-in-one monitoring method of ecological damage information in mining areas; secondly, based on different types of ecological environment factors in the coal mining area of Lvliang City, a method for analyzing the evolution of ecological environment damage in the coal mining area of Lvliang City is proposed. With high-definition satellite imagery within the scope of Lvliang City as the background and the precise perception results of ecological environment damage in the coal mining area obtained by the “Satellite–UAV–Ground–Underground” four-in-one monitoring method as the basis, three spatial scales of historical big data of ecological environment damage in the mining area are constructed to understand the current situation of surface ecological damage in the study area, trace its historical evolution, and explore future development trends. Finally, based on the acquired historical data of ecological damage in the mining area, we explored the difference of ecological damage in the coal mine area under the two mining modes of the 121 methods and the 110 methods and verified the effectiveness of the 110 methods in reducing the damage to the ecological environment on the surface of the mining area.
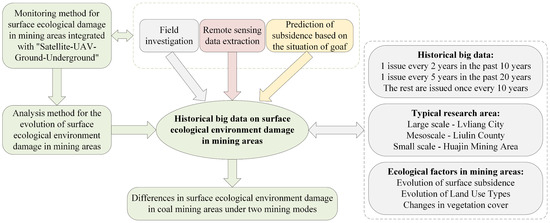
Figure 1.
Experimental flow chart.
2.2. Overview of the Study Area
This study takes Lvliang City, a typical resource city in Shanxi Province, China, as the research object, and establishes the historical big data of surface ecological environmental damages in the coal mining area from macro to micro, and from three spatial scales of Lvliang City, Liulin County, and the Huajin mining area (Figure 2).
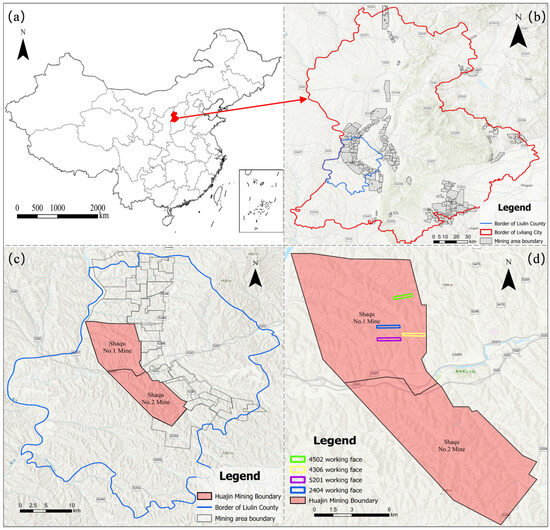
Figure 2.
Overview of the study area; map of (a) China, (b) Lvliang City, (c) Liulin County, (d) Huajin mining area.
2.2.1. Overview of Lvliang City
Lvliang City (Figure 2b), located in west-central Shanxi Province, 36°43′–38°43′ N, 110°22′–112°19′ E, maximum width of 140 km east–west, the maximum distance between north and south 220 km, the perimeter of the boundary is 954.3 km long. The total area of the territory is 21,000 square kilometers, accounting for 13.5% of the total area of Shanxi Province [28].
Lvliang is a part of the North China Platform in the geological structure evolution process. After the formation of the Shanxi Platform anticline by the Yanshan Movement in the Mesozoic era, the Lvliang anticline was basically finalized; the Himalayan movement of the Cenozoic Tertiary influenced this area, forming the Fen River Basin; in the Lower Pleistocene, modern river terraces and gully landforms were formed in hilly areas. The geological development within the territory is relatively complete, with all types of strata exposed except for the missing upper Ordovician, Silurian, Devonian, and Cretaceous systems and other strata. The exposed strata are as follows: the Middle Archean Hekou Group; the Upper Archean Lvliang Group; the Lower Proterozoic Lanhe Group; the Yejiashan Group; the Heichasha Group; the Middle Upper Proterozoic Lower System Hangaoshan Group; Paleozoic Cambrian; Ordovician; Carboniferous; Permian; Mesozoic, Triassic, and Jurassic; Cenozoic Tertiary; Quaternary; etc. [29].
Lvliang’s landform is part of the Loess Plateau in western Shanxi. The terrain is high in the north and low in the south, sloping from northeast to southwest and generally ranging from 1000 to 2000 m above sea level. The landforms can be broadly categorized into three types: meso-mountainous, hilly, and plain. The elevation of the meso-mountainous area is more than 1500 m above sea level, and there are many gullies and ravines in the area, with numerous small hills and good vegetation cover. It is a hilly area 900 m above sea level to 1500 m above sea level; loess cover is wide and thick; terrain is broken, steep slopes and deep gullies; there is less flat land; vegetation is sparse; and soil erosion is serious. The plain area is 740 m to 800 m above sea level, flat terrain, fertile soil, adequate water, suitable for the development of the modern three-dimensional planting industry [29].
As one of the traditional pillar industries in Lvliang City, the coal industry has made great contributions to the economic construction of Lvliang City. It is mainly rich in coking coal, with reserves of 12.941 billion tons, and the city’s coal-bearing area is 11,460 km2, accounting for 54.3% of the city [28]. Lvliang City’s coal mining history began relatively early, more than 100 years ago. the city’s existence began with small coal kiln mining; after 1978, the coal industry developed rapidly. By 1990, the city had a total of 776 coal mines, and this reached its peak in 1997 with a total of 881 coal mines of various types. Since 2001, the township closed coal mines to rectify the closure of wells, and by the end of 2008, the total number of mines was 359. After the reorganization and consolidation, the city’s existing coal mines were reduced to 125, with a raw coal production capacity of 163 million tons per year [30,31]. However, long-term large-scale resource development has disturbed soil and water resources, induced multiple ecological and environmental problems such as subsidence, pollution, and suppression, and has become an important bottleneck restricting the high-quality development of Lvliang City.
2.2.2. Overview of Liulin County
Liulin County belongs to Lvliang City. Located on the western edge of central Shanxi Province (Figure 2c)—37°08′–37°37′ N, 110°39′–111°05′ E—the terrain is high in the east and low in the west, with complete exposed strata and abundant mineral resources. The overall characteristic of the strata is that the strata in the eastern gully are old and gradually becoming newer towards the west. The Archaean is found in the eastern part of the county, making up about 5% of its area; the Paleozoic is primarily found in the central and eastern parts of the county, covering about 15%; the Mesozoic is predominantly in the southwestern part of the county, representing about 10%; the Cenozoic’s Pliocene series and Pleistocene eras have the most extensive distribution, comprising over 70% of the area. The structural location is on the eastern edge of the Ordos region, on the west side of the north–south structural belt, where the Lvliang Mountain block borders the Ordos block. The overall structural configuration is primarily a monocline that tilts gradually from north to southwest, with the strata descending gently westward at an angle of several degrees towards the Yellow River, accompanied by gentle folds [32].
Liulin County belongs to the hill and gully area of the northwest Loess Plateau, and its altitude decreases from east to west with the direction of bedrock inclination. Due to the altitude changes in the Paleozoic era and the Yanshan Movement in the Mesozoic era, the Lvliang Mountain structure was uplifted, the rock layers tilted westward, and the Yellow River channel cut downwards, forming a northeast high and southwest low. The Quaternary loess layer covering various landforms has been eroded by wind, rain, and flowing water for a long time and has been gradually cut into complex geomorphic units with crisscrossing gullies and intersecting hills [32].
Liulin County is rich in coal resources, with a coal-bearing area of about 1025 km2, accounting for 79.6% of the county’s land area (Figure 2c). Liulin County is the optimal main coking coal base in the country, with 28 coal mines in the county, 397 km2 of approved mining wellfields, and a raw coal production capacity of 42.35 million tons per year. The county’s coal resources have a prospective reserve of 10 billion tons, with proven reserves of 6.17 billion tons. Liulin not only has huge coal reserves, but its4# high-quality coking coal is known as a “national treasure”. However, after years of large-scale, high-intensity industrial mining of coal resources, a large area of coal mining subsidence area has been formed in Liulin County.
2.2.3. Overview of the Huajin Mining Area
Shanxi Coking Coal Huajin Coking Coal Co., Ltd. is under the jurisdiction of Liulin County, Lvliang City, Shanxi Province, with Shaqu No. 1 Coal Mine and Shaqu No. 2 Coal Mine under it, which are located in the middle part of the Hedong Coal Field and the southwestern part of Liliu Mining Area, 37°18′–37°30′ N, 110°45′–110°56′ E (Figure 2d). Shaqu No. 1 Mineshaft field is a monoclinic structure with a north–south direction and a westward inclination, with a strike length of 10.12–10.86 km, an inclined width of 5.32–8.18 km, and an area of 68.3817 km2. The shaft field has a reserved reserve of 1217 million tons, a recoverable reserve of 639 million tons, a service life of 101 years, and an approved production capacity of 4.5 million tons per year. Shaqu No. 2 Mine has a length of 9.7–14.5 km from north to south, a width of 3.2–5.6 km from east to west, and an area of 63.16 km2. The well field has 870 million tons of coal reserves, 410 million tons of recoverable reserves, a service life of 97.5 years, and an approved production capacity of 2.7 million tons per year.
The strata in the mining area, from old to new, are as follows: Middle Ordovician Upper Majiagou Formation (O2s), Fengfeng Formation (O2f), Middle Carboniferous Benxi Formation (C2b), Upper Carboniferous Taiyuan Formation (C3t), Lower Permian Shanxi Formation (P1s), Lower Shihezi Formation (P1x), Upper Permian Upper Shihezi Formation (P2s), Shiqianfeng Formation (P2sh), Upper Tertiary Pliocene, Quaternary Middle Pleistocene, Upper Pleistocene, and Holocene. The mining area contains eight coal seams that can be mined, namely 2#, 3#, 4#, and 5# coals in the Shanxi Formation and 6#, 8#, 9#, and 10# coals in the Taiyuan Formation. Each coal seam has stable occurrence and is mainly composed of coking coal. The hydrogeological type of the Shanxi Formation coal seam currently being mined is classified as moderate. The entire mining area is under pressure, with a static water level elevation of +797.64 m for the Ordovician limestone. The average thickness of the 3# coal seam from the Ordovician limestone aquitard is 145 m; the average thickness of the 4# coal seam from the Ordovician limestone aquitard is 142 m; the thickness of the 5# coal seam from the Ordovician limestone aquitard is 134 m.
2.3. A “Satellite–UAV–Ground–Underground” Four-in-One Method for Monitoring Ecological Damage on the Surface of Mining Areas
Compared with other surface environmental monitoring, the ecological damage in the mining area is mainly caused by underground coal mining activities. In addition to the obvious damage characteristics on the surface, the hidden damage characteristics of the underground soil and rock layers also need to be monitored so as to predict the scope and degree of future damage to the ecological environment on the surface through the method of predicting the subsidence of coal mining. In view of this, this paper proposes a “Satellite–UAV–Ground–Underground” four-in-one method for monitoring land ecological damage information in mining areas by integrating multi-source, multi-temporal satellite and airborne remote sensing images (Figure 3). Aiming to highlight the pioneering role of underground mining information and the coupling of remotely sensed and non-remotely sensed data, and aboveground and underground information, to realize the rapid extraction of information on ecological damage to the land in mining areas and the true reflection of the impact of coal mining on land ecology [33].
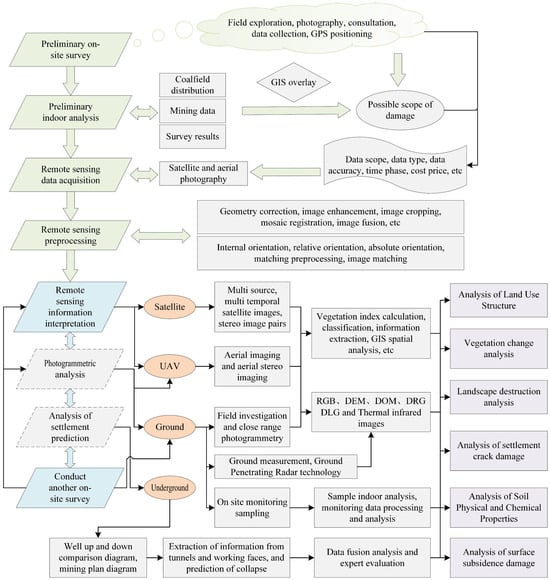
Figure 3.
Flow chart of monitoring ecological damage information of mining area land integrated with “Satellite–UAV–Ground–Underground”.
”Satellite” refers to satellite remote sensing monitoring, mainly multi-spectral, hyperspectral, thermal infrared [34], microwave, and other satellite image monitoring methods [35,36,37]. “UAV” refers to aerial photogrammetry and remote sensing monitoring, mainly by means of unmanned aerial vehicles (UAVs) and airplanes equipped with sensors such as RGB [38], multispectral [39], hyperspectral [40], thermal infrared [41], and LiDAR [42]. It is the supplementary fine monitoring of ecological elements on the surface of a key survey area on the basis of large-scale satellite remote sensing monitoring as well as the acquisition of high-precision three-dimensional topography, thus realizing the calculation of vegetation indices, classification of features, information extraction and spatial analysis, and so on. “Ground” refers to the use of field surveys, including traditional ground monitoring methods and ground-penetrating radar techniques [43,44], neutron meter surveying techniques, etc. [45]. “Underground” refers to the monitoring of the range of land damage through mining subsidence prediction methods based on subsurface geological mining information, including mining engineering plans, comparison maps above and below wells, mining schedules, and other contents [46].
The core of the monitoring methodology is the recognition and complementarity of aboveground information with underground information through the pioneering role of underground mining information. According to the prediction method of probability integration, the subsidence prediction parameters (including subsidence coefficient, main influence tangent angle, mining influence propagation angle, horizontal movement coefficient, inflection point offset) determined based on the surface movement observation data provided by each coal mine are calculated step by step and mine by mine using MSPS(V 1.0) (mining subsidence prediction software). The whole technical process is realized from the root cause of land damage, completing the rapid acquisition of land ecological damage information in the mining area in the “Satellite–UAV–Ground–Underground”, and providing basic information for the discovery of the scope and distribution of land ecological damage.
2.4. Methods for Analyzing the Evolution of Ecological Damage on the Surface of Mining Areas
Based on three types of ecological factors in the Lvliang coal mine area—changes in surface subsidence, evolution of land use types, and changes in vegetation cover—we propose a method for analyzing the evolution of surface ecological damage in the Lvliang coal mine area. Through the research and collection of coal mine data in the study area, selecting high-definition satellite image maps within Lvliang city as the background, and based on the results of the accurate perception of ecological damage in the coal mine area obtained by the four-in-one monitoring method of “Satellite–UAV–Ground–Underground”. We also analyzed the evolution of land use types and vegetation indices in the study area, constructed three spatial scales of historical big data of surface ecological damage in the mining area in Lvliang City, Liulin County, and the Huajin mining area and then retraced the evolution of surface ecological damage in the study area in the past 30 years.
2.4.1. Lvliang Coal Mine Information Acquisition
Using on-site research, literature analysis, and other methods, we collected and organized all the coal mine data in Lvliang City (Table 1), processed and analyzed the relevant data, and conducted on-site engineering surveys for the typical coal mine area in Liulin County and proposed three types of ecological environment factors for the typical coal mine area.

Table 1.
Collection of coal mine data list.
2.4.2. Remote Sensing Image Selection and Processing Analysis
Comparison and analysis of the accessibility of different satellite images, the suitability of the temporal/spatial resolution, and the quality of the accessible image data were performed, and the images with fewer clouds and shadows were selected, and each phase of the images was collected on similar dates in the same month so that suitable and effective multi-phase satellite images were screened out in accordance with the principle of 1 phase for every 2 years in the last 10 years, 1 phase for every 5 years in the last 20 years, and the rest are phased once every 10 years (Table 2). In this study, the multispectral remote sensing data from Landsat series satellites were finally selected to obtain nine phases of satellite remote sensing image data of Lvliang Coal Mining Area in the last 30 years (1993–2023). Image data were downloaded free of charge from the USGS (United States Geological Survey) website (https://earthexplorer.usgs.gov/, accessed on 15 February 2024). In addition, for the fine monitoring of the differences in damage between two mining methods at the scale of the Huajin mining area, we used the DJI M210RTK quadcopter industrial drone platform equipped with the DJI Zenmuse X5S pan tilt visible light camera and the Yusense MS600 multispectral camera to collect high-resolution images of the Huajin mining area in 2019, 2021, and 2023, respectively. Finally, ENVI5.3 was used to preprocess the acquired images, including radiometric correction, atmospheric correction, and image cropping.
Table 2.
Selected satellite image data.
2.4.3. Analysis of the Trend of Area Evolution of Coal Mining Subsidence Area
Based on the results of accurate perception of ecological damage in coal mining areas obtained by the “Satellite–UAV–Ground–Underground” four-in-one monitoring method, and the statistics of historical data on coal mining subsidence areas at various scales. Based on the development history of the coal industry in the study area, the remote sensing images since 2000 are used as the background to establish time series change datasets of coal mining subsidence range at different scales. The cumulative area of coal mining subsidence at each spatial scale was also statistically analyzed and based on the segmented fitting modeling method, the segmented function model of the evolution of coal mining subsidence area over time at each of the three scales was established by using the Origin2018 software in order to explore its evolution pattern and its development trend.
2.4.4. Evolutionary Analysis of Land Use Types in Coal Mining Areas
Using the support vector machine method, the remote sensing images of the above nine phases are categorized according to the six major categories of arable land, forest land, grassland, watershed, unused land, and construction land, and the area of each category is counted to find the land use structure in different periods [47]. The land use structure map from 1993 to 2023 is analyzed to find the land use structure change curve map of each coal mine area in Lvliang City and analyze the change of spatial and temporal characteristics of land use structure in Lvliang City.
2.4.5. Evolutionary Analysis of Vegetation Indices in Coal Mining Areas
The vegetation index reflects the differences in vegetation cover vegetation growth status and lushness in each region in the image, which can represent the growth status and growth trend of vegetation to a certain extent. Normalized difference vegetation index (NDVI) is a commonly used vegetation index in remote sensing analysis, it is an important evaluation method for portraying the vegetation cover of the ground surface, and it plays an important role in research on the changes of vegetation, ecological environment research, and other aspects. The formula for its calculation is as follows:
In Formula (1), NIR denotes near-infrared reflectance, and Red denotes red-band reflectance. The range of NDVI is (−1, 1), and the closer the value is to 1, the more likely it is covered with vegetation. The closer it is to 0, the more likely it is bare ground. The NDVI of remote sensing images in each period was calculated to analyze the change of vegetation in the coal mine area and the difference in the surface between the 121 and 110 methods of the coal mine area.
2.5. Analysis of Differences in Ecological Damage between Two Mining Models
The coal mine area and working face surface applying two different mining modes, 121 and 110, were selected as research objects to analyze the ecological damage differences between the two mining modes from the following two aspects:
- (1)
- Based on the NDVI of remote sensing images in each period obtained from the above calculations, explore and analyze the differences in the mean values of surface NDVI in the 121-mining method coal mine area, the 110-mining method coal mine area, and all the coal mine areas in the whole county of Liulin County. Taking the 2404 working face (110 mining method) and the 5201 working face (121 mining method) of Shaqu No. 1 mine in the Huajin mining area, which were simultaneously mined and emptied in 2019, as an example, we explored and analyzed the trend of the mean surface NDVI and its difference between the 2404 working face (110 mining method) and the 5201 working face (121 mining method) and the Huajin mining area.
- (2)
- Taking the 4502 working face (110 mining method) and the 4306 working face (121 mining method) in the 4# coal seam of Shaqu No. 1 mine in the Huajin mining area as an example, consider the following: 4502 working face (110 mining method) mining time, November 2020–February 2022; plumb depth from the ground about 290–460 m; backing length 1102–1092 m; inclined length 220 m; thickness of the coal seam 3.8–4.6 m; average thickness 4.2 m. For the 4306 working face (121 mining method): mining time June 2015–May 2017; thickness of coal seam 3.8–4.8 m; average thickness 4.2 m; inclination length 220.8 m; back mining length 1401 m. Based on the on-site research data and historical observation data, the surface cracks near the cutting eye, the dynamic cracks in the advancing direction of the working face, and the characteristics of subsidence damage and multiple parameters such as crack shape, crack width, crack depth, crack step misalignment, crack length, crack spacing, etc. (Table 3), were monitored to compare and analyze the differences in the characteristics of the surface subsidence damage of the working face of the two types of working face mining.
Table 3. Evaluation indexes of surface cracks in the working face.
3. Results
3.1. Data on Changes in Coal Mining Subsidence Areas on the Lvliang City Scale
Based on the monitoring method and evolution analysis method proposed in Section 2.3 and Section 2.4 above, the Lvliang city-scale mine surface ecological environment damage historical big data were constructed. Firstly, the historical image dataset of Lvliang City was constructed, and then the land use type evolution dataset of Lvliang City and the vegetation index evolution dataset was constructed based on the image data, respectively. Finally, based on the coal mine data obtained from the research, the area and distribution of the coal mining subsidence area in the past years were obtained through the prediction of surface subsidence damage and further constructed an atlas of historical data on the range of coal mining subsidence in Lvliang City (Figure 4a). The coal mining subsidence range maps of 2000, 2013, and 2023 were then superimposed and analyzed to obtain the map of coal mining subsidence range changes in Lvliang City (Figure 4b). At the same time, we statistically analyzed the coal mining subsidence area of Lvliang City in terms of its administrative divisions and plotted the trend of changes in the coal mining subsidence area of different administrative districts in Lvliang City (Figure 5). The figure shows that: from the founding of the country in 1949 to the present, 13 counties (districts) under Lvliang City, the coal mining subsidence area have different degrees of growth, of which Liulin County, as a typical coal industry base, the cumulative area of coal mining subsidence and its growth rate are the highest, as of the end of 2023, the cumulative area of coal mining subsidence in Liulin County amounted to 20,593 ha.
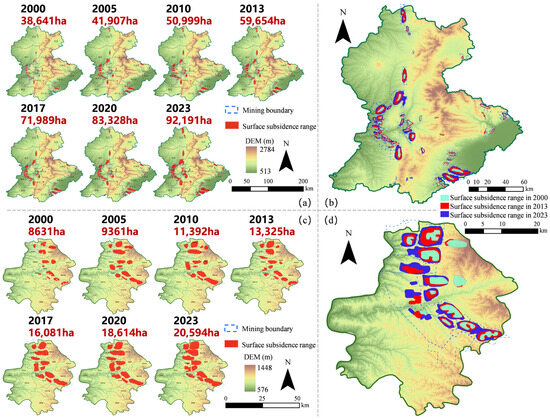
Figure 4.
(a) Atlas of historical data on the range of coal mining subsidence in Lvliang City, (b) map of changes in the range of coal mining subsidence in Lvliang City, (c) atlas of historical data on the range of coal mining subsidence in Liulin County, (d) map of changes in the range of coal mining subsidence in Liulin County.
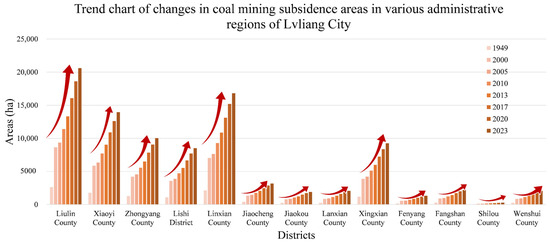
Figure 5.
The trend of coal mining subsidence areas in different administrative districts of Lvliang city.
3.2. Data on Changes in Coal Mining Areas Surface Ecological Damage on the Liulin County Scale
As with the Lvliang City scale, the same Liulin County scale big data on the historical ecological damage of the mine surface were constructed: Firstly, the historical image dataset of Liulin County was constructed, and then the land use type evolution dataset of Liulin County and the vegetation index evolution dataset were constructed based on the image data, respectively. Finally, based on the coal mine data obtained from the research, the area and distribution of the coal mining subsidence area in the past years were obtained through the prediction of the surface subsidence damage and the historical data atlas of the coal mining subsidence range in Liulin County was further constructed (Figure 4c). The maps of the range of coal mining subsidence in 2000, 2013, and 2023 were superimposed and analyzed among them to obtain the map of the change in the range of coal mining subsidence in Liulin County (Figure 4d).
In addition, as shown in Figure 6, a comparative analysis was conducted for the average surface NDVI values of coal mining areas using different mining modes within Liulin County, and the average surface NDVI value within all mining areas in Liulin County in 2023 was 0.5273 (Figure 6e). The average surface NDVI value of the coal mine area mined by the 121 mining method was 0.5186, which was lower than the average value of the county’s mining areas (Figure 6f), while the average surface NDVI value of the coal mine area mined by the 110 mining method was 0.5371, which was higher than the average value of the coal mine area mined by the 121 mining method as well as the average value of the county’s mining areas (Figure 6g).
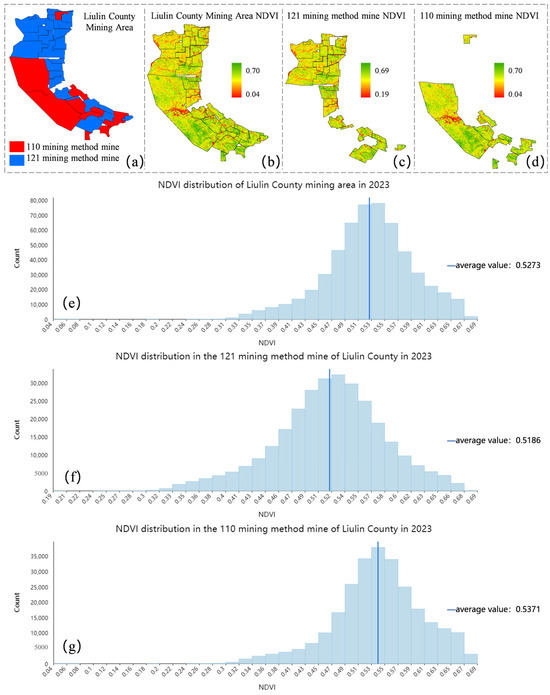
Figure 6.
(a) Distribution map of mining method in Liulin County, (b) NDVI image of mining method in Liulin County, (c) NDVI image of 121 mining method, (d) NDVI image of 110 mining method, (e) histogram of NDVI of mining method in Liulin County, (f) histogram of NDVI of 121 mining method, (g) histogram of NDVI of 110 mining method.
3.3. Data on Changes in Coal Mining Subsidence Areas on the Huajin Mining Area Scale
For the scale of the Huajin mining area, the data of ecological damage on the surface of its mining area were also constructed: firstly, the image dataset of the Huajin mining area was constructed (Figure 7a), the Huajin mining area began to be mined from the year of 2000, and as of the end of 2023, a total of 67 working faces were mined in two coal mines, Shaqu No. 1 and Shaqu No. 2, in the mining area. Then, based on the information obtained from the research, such as the plan of the mining project and the mining schedule, the area and distribution of the coal mining subsidence area in the past years were obtained through the prediction of the surface subsidence damage, and the data atlas of the extent of the coal mining subsidence in the Huajin mining area was further constructed (Figure 7b). Based on the difference in the degree of surface damage in the coal mining subsidence area, it was classified into three categories: mildly damaged area, moderately damaged area, and severely damaged area, and an atlas of changes in the graded damage extent of coal mining subsidence in the Huajin mining area was constructed (Figure 7c), which was then used to statistically analyze the data on the damage area at all levels in the Huajin mining area in the past years, and drew the trend of its changes (Figure 8).
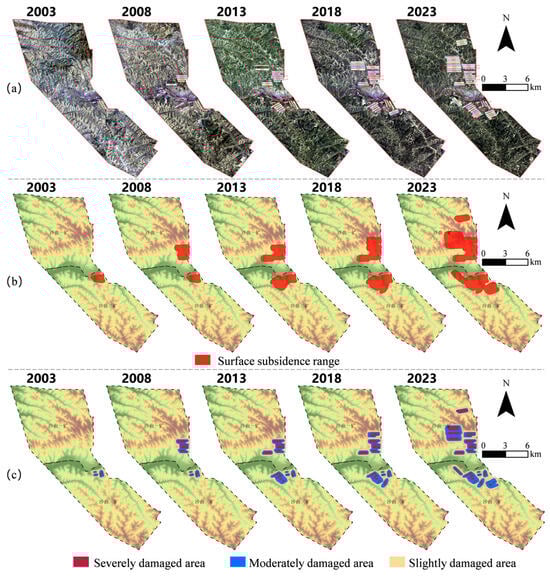
Figure 7.
(a) Imagery dataset of Huajin mine, (b) atlas of coal mining subsidence scope data in Huajin mine, and (c) atlas of coal mining subsidence graded damage scope data in Huajin mine.
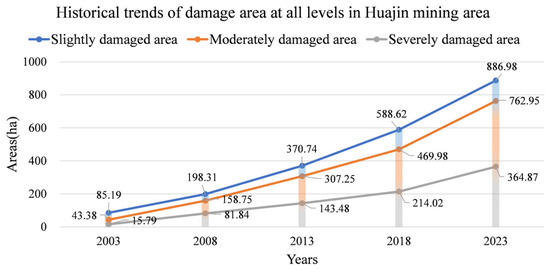
Figure 8.
Historical trends of damaged areas at all levels in the Huajin mining area.
The data in the figure show that from 2003 to 2023, the slightly damaged area within the Huajin mine area grew from 85.19 ha to 886.98 ha, with an average annual growth of 40.06 ha; the moderately damaged area grew from 43.38 ha to 762.95 ha, with an average annual growth of 35.98 ha; and the severely damaged area grows from 15.79 ha to 364.87 ha, with an average annual increase was 17.45 ha. Taking every five years as a phase, the average annual growth rates of slightly, moderately, and severely damaged areas were 22.62 ha/a, 23.08 ha/a, and 13.21 ha/a from 2003 to 2008; 34.49 ha/a, 29.7 ha/year, and 12.33 ha/a from 2008 to 2013; and 43.58 ha/a, 32.54 ha/a, and 14.11 ha/a from 2013 to 2018, respectively; and 59.67 ha/a, 58.59 ha/a, and 30.17 ha/a from 2018 to 2023, respectively; it can be clearly seen that the average annual rate of increase in the area of damage at all levels has increased significantly.
4. Discussion
4.1. Trend and Prediction of Changes in Subsidence Area
Based on the above-established dataset of temporal changes in the range of coal mining subsidence at three scales, the cumulative area of coal mining subsidence at each spatial scale was statistically analyzed, and the segmented function models of the evolution of the area of coal mining subsidence over time at the three scales were established based on segmented fitting modeling method (Figure 9), and the adjusted R2 of the three function models all reached more than 0.99.
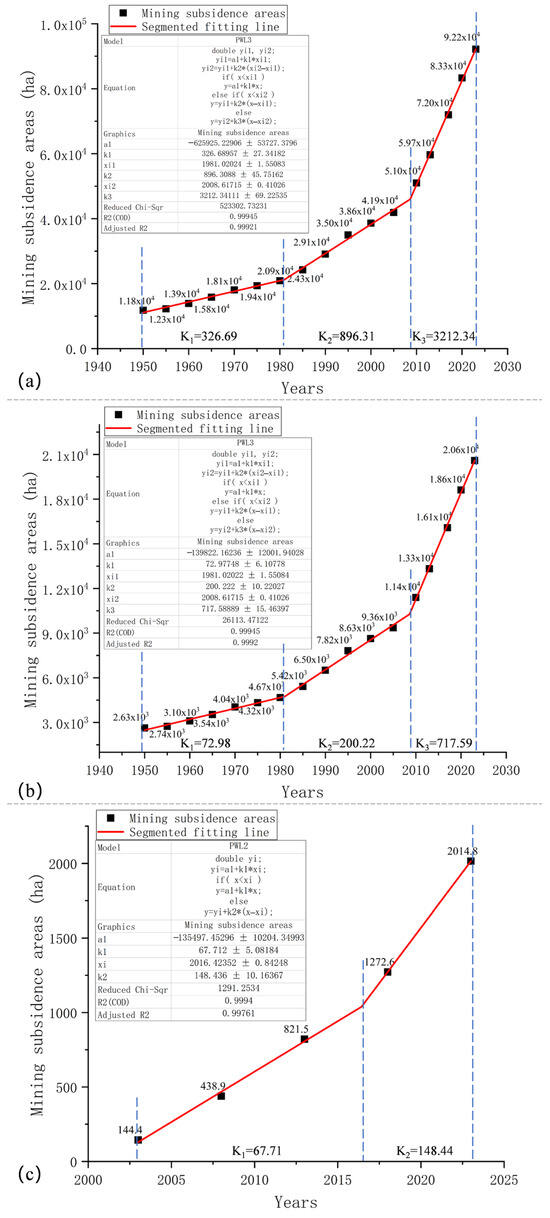
Figure 9.
Segmented fitting function model of coal mining subsidence area evolution over time (a) Lvliang City, (b) Liulin County, (c) Huajin Mining District.
In Figure 9a, the trend of the coal mining subsidence area in Lvliang City over time can be clearly seen to be divided into three historical phases, and the key historical time nodes for the change of its growth trend are around 1981 and 2008, respectively.
- In the first stage, from 1949 to 1981, the coal mining subsidence area in Lvliang City grew from 11,766.67 ha to 21,566.65 ha, and the slope of the curve of its segmented fitting function was 326.69, with an actual growth rate of 306.25 ha/a.
- In the second stage, from 1981 to 2008, the subsidence area grew to 46,306.67 ha, and the slope of the curve of its segmented fitting function was 896.31, with an actual average growth rate of 916.29 ha/a, which is 1.99 times more than the average annual growth rate of the previous stage.
- In the third stage, from 2008 to 2023, the subsidence area grows to 92,191.47 ha, and the slope of the curve of its segmented fitting function is 3212.34, and the actual average growth rate is 3058.99 ha/a, which is 2.34 times more than the average annual growth rate of the previous stage.
In Figure 9b, similar to Lvliang City, the trend of coal mining subsidence area over time in Liulin County can also be clearly seen to be divided into three historical phases, with the key historical time nodes for the change in its growth trend being around 1981 and 2008, respectively.
- In the first stage, from 1949 to 1981, the coal mining subsidence area in Liulin County grew from 2626.67 ha to 4820.01 ha, and the slope of the curve of its segmented fitting function was 72.98, with an actual growth rate of 68.54 ha/a.
- In the second stage, from 1981 to 2008, the subsidence area grew to 10,346.67 ha, and the slope of the curve of its segmented fitting function was 200.22, with an actual average growth rate of 204.69 ha/a, which is 1.98 times more than the average annual growth rate of the previous stage.
- In the third stage, from 2008 to 2023, the subsidence area grows to 20,594.19 ha, with a segmented fit function curve slope of 717.59 and an actual average growth rate of 683.17 ha/a, which is 2.33 times more than the average annual growth rate of the previous stage.
In Figure 9c, unlike the two scales mentioned above, the coal mining history of the Huajin mine is shorter, and the trend of its coal mining subsidence area over time can be clearly seen to be divided into two historical phases, with the key historical time point for the change in its growth trend being around 2016.
- In the first stage, from 2003 to 2016, the area of coal mining subsidence in the Huajin mining area grew from 144.35 ha to 980.01 ha, and the slope of the curve of its segmented fitting function was 67.71, with an actual growth rate of 64.28 ha/a.
- In the second phase, from 2016 to 2023, the subsidence area grows to 2014.8 ha, with a segmented fit function curve slope of 148.44 and an actual average growth rate of 147.83 ha/a, which is 1.3 times more than the average annual growth rate of the previous stage.
From the fitting model of the above three scales, it can be seen that the growth rate of coal mining subsidence area increases gradually over time, which is inextricably related to the continuous development of coal industry and the gradual growth of socio-economic level in Lvliang City over the past decades. In 1978, China implemented the reform and opening-up policy and began to support the development of the economy, and the coal industry began to develop rapidly, and the growth rate of coal mining subsidence area also increases dramatically at the same time as the increase in the production capacity of coal. In the 21st century, the government introduced policies to consolidate and merge a large number of small coal kilns with low production capacity and no mining rights and gradually completed the merger and reorganization by 2008. The coal production capacity has been further enhanced, and the coal mining subsidence area has also entered a new growth stage. It can be seen that the time nodes at which the growth trends of the two scales in Lvliang City and Liulin County changed are very close to the time nodes at which the government introduced policies and reforms in the process of social development. Furthermore, based on the functional relationships in the final stage of each fitted model, we predicted the future coal mining subsidence area at each of the three scales. At the current average growth rate, by 2035, the coal mining subsidence areas in Lvliang City, Liulin County, and Huajin Mining District will reach 130,739.55 ha, 29,205.27 ha, and 3796.08 ha, respectively, increases of 41.812%, 41.813%, and 88.41%, respectively compared to the existing coal mining subsidence areas in 2023. Therefore, in the context of the current era of green development and the process of future mining, the implementation of side mining, rehabilitation and management, and the development of green mining technology are very necessary.
4.2. Trends in Land-Use Types and NDVI Changes
Based on the above-established dataset of land use type evolution and vegetation index evolution in Lvliang City and Liulin County, the data of six land use types at two scales were statistically analyzed, and the historical trend maps of land use structure (Figure 10) and NDVI (Figure 11) were plotted in Lvliang City and Liulin County, respectively.
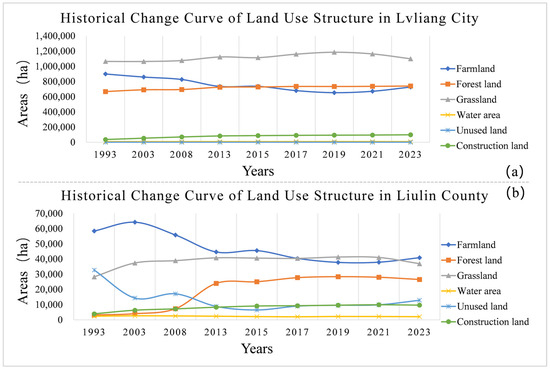
Figure 10.
Historical trend of land use structure in (a) Lvliang City, (b) Liulin County.
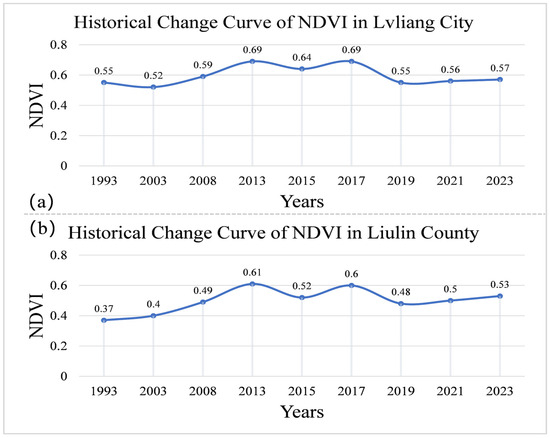
Figure 11.
Historical change trends of NDVI (a) Lvliang City, (b) Liulin County.
Figure 10a shows that in the 30-year period between 1993 and 2023, neither the water area nor the unused land area within the city of Lvliang changed substantially, with both fluctuating gently around 8000 ha and 300 ha, respectively. The areas of forest land and construction land increased gradually from 666,889.20 ha and 36,012.15 ha in 1993 to 740,932.40 ha and 98,792.82 ha in 2023, respectively, and both of them grew at relatively even rates; the area of grassland in 2023 is 1,099,351.09 ha, which is also a slight increase compared to 1,064,386.08 ha in 1993, with more small ups and downs and fluctuations in the course of its change over 30 years. The area of remaining farmland is the only one of the six land use types that decreases significantly in area after 30 years, from 899,192.88 ha in 1993 to 727,263.97 ha in 2023, but its decreasing trend turns around and gradually begins to grow after 2019.
In Figure 10b, it is shown that compared to the trend of land use structure change in Lvliang City, there is a large difference in the trend of change between the areas of multiple land use categories in Liulin County. The water area remains unchanged by a large margin, fluctuating gently around 2000 ha. The area of construction land has gradually increased from 3923.59 ha in 1993 to 9650.17 ha, with the rate of growth remaining relatively even and flat. After growing from 28,246.81 ha in 1993 to 37,380.92 ha in 2003, the grassland area stabilized around 40,000 ha for a long period of time, fluctuating gently until 2023, when there was a small decrease to 36,933.58 ha. Apart from this, the remaining three types—farmland, forest land, and unused land—all entered a relatively stable period of gentle fluctuations after increasing or decreasing significantly between 1993 and 2013, with the area of farmland decreasing by 17,533.44 ha in 2023 compared to 1993 and the area of forest land increasing by 23,309.1 ha year-on-year.
Figure 11a shows that in the past 30 years, the change in surface vegetation index within the city of Lvliang has shown a trend of first increasing, then decreasing, and finally stabilizing. The city’s average NDVI in 2023 has barely changed from 1993, which is closely related to the trends in the area of forest land, farmland, and grassland in Figure 10a. The synergistic changes of decreasing cropland, stable and gradual increase of woodland, and small fluctuation of grassland have created the historical trend of NDVI in Lvliang City.
Figure 11b shows that the trend of surface vegetation index within Liulin County is slightly similar to that of Lvliang City. However, the difference is that in 2023, the surface NDVI within Liulin County is 0.53, a significant increase from 0.37 in 1993. This is also fully related to the changes in its land use structure, as the Liulin County range has a significant reduction in the area of cultivated land and a significant increase in forested land, and the situation of returning farmland to forests has led to an overall trend of growth in the fluctuating changes in its NDVI, whereas the reduction in the area of cultivated land and the increase in the area of forested land in Lvliang City have both changed at a smaller rate, thus generating a more stable trend of change in general.
The factors affecting the change of land use structure and NDVI index mainly include natural (climate, hydrology, topography, soil, etc.) and socio-economic (demographic, economic, governmental planning, and urbanization drive) aspects, and the influence of the change of natural factors on the adjustment of Lvliang city’s land use structure is difficult to reflect in a short period of time, and this paper mainly analyzes the influence of socio-economic factors on Lvliang city’s land use structure and NDVI index, the driving force of the changes.
- Firstly, population change is an important influencing factor for the change of both, according to statistics, the population of Lvliang City has been growing continuously in the past 30 years. With a net increase of about 600,000 people, the growing population will generate huge demand for land, and the two are bound to undergo significant changes with the population growth. Theoretically, the pressure of increasing population on the demand for food will drive an increase in the area of arable land, but the data in this paper show that population growth has not caused an increase in the area of arable land but rather reflected in the steady increase in the area of land used for construction in order to meet the housing needs of the new population, a large area of agricultural land such as arable land has been zoned for residential land.
- Secondly, economic development is one of the main influencing factors driving the changes of the two. According to statistics, the gross domestic product (GDP) of Lvliang City reached CNY 236.61 billion in 2023. The vigorous development of the energy industry as a pillar has increased economic income and also accelerated the construction of city infrastructures, but the construction and development encroached upon and destroyed a large amount of agricultural and forestry land, resulting in a significant increase in the structure of the Lvliang City land use and the NDVI index changes.
- Thirdly, government planning and urbanization is another major factor driving the changes of the two. The policy issued by the Lvliang municipal government to actively carry out rational land planning and remediation is an important reason influencing the continuous balanced and stable development of the two and plays a key role in regulating them. Meanwhile, the rapid development of urbanization drives changes in the two mainly in three main features: firstly, the transfer of rural population; secondly, the gathering of non-agricultural industries to cities and towns; and thirdly, the transfer of agricultural labor force to non-agricultural labor force. According to statistics, the urbanization rate of Lvliang City reached 56.1% in 2023, and the land for urban construction has been increasing over the past 30 years, while the land for agriculture and forestry has been decreasing.
The above analysis shows that although the land use structure of Lvliang City in the past 30 years is still dominated by agricultural land, the area of agricultural land in Lvliang City in the future will undergo a relatively large-scale reduction as cultivated land and forested land are gradually transformed into construction land and unutilized land. Therefore, we suggest that the local government should take effective measures to curb the decreasing trend of agricultural land area, increase the investment in agriculture and forestry, and at the same time, increase the land reclamation and ecological restoration of mining areas to increase the area of arable land and forested land so as to promote the realization of green development in Lvliang City.
4.3. Differences in Ecological Damage between the Two Mining Models
Figure 12 shows a comparative analysis of the differences in surface NDVI between the two mining modes using the 2404 working face (110 mining method) and the 5201 working face (121 mining method), which were concurrently mined in 2019 at the Shaqu No. 1 mine in the Huajin mining area as an example. Figure 12I–III show the surface NDVI image data within the Huajin mine area in 2019, 2021, and 2023, respectively. Then, the average surface NDVI values within the respective areas of the Huajin mining area, working face 2404 (110 mining method) and working face 5201 (121 mining method), were calculated and their distribution histograms were plotted separately during the three-year period (Figure 12a–i). The average NDVI values for each region in 2019, 2021 and 2023 were counted and their historical change curves were plotted (Figure 13).
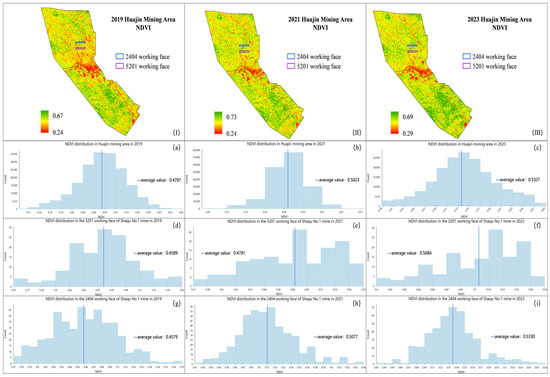
Figure 12.
Surface NDVI images of Huajin mine (I) 2019, (II) 2021, (III) 2023; histograms of the distribution of 3-year average surface NDVI values (a–c) Huajin mine, (d–f) 2404 working face, (g–i) 5201 working face.
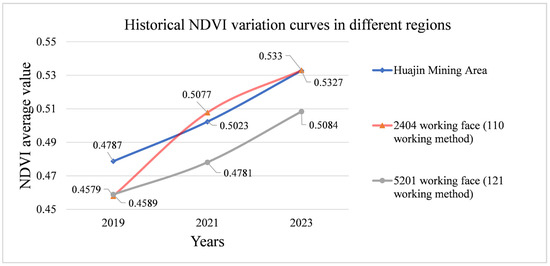
Figure 13.
Historical NDVI variation curves in different regions.
It is visualized in Figure 13 that there is an overall increasing trend in the surface NDVI average at the Huajin mine site between 2019 and 2023, from 0.4787 in 2019 to 0.5327 in 2023. The 2404 working face (110 mining method) and the 5201 working face (121 mining method), which were used as the 2019 mining voids, both had similar surface NDVI averages in 2019, and both were affected by mining damage lower than that of the average of the Huajin mining area, which was 0.4579 and 0.4589, respectively. However, with the change in time, the average surface NDVI value of working face 2404 (110 mining method) quickly recovered to the average level of the Huajin mining area in 2021, and the average surface NDVI values of working face 2404 (110 mining method) in 2021 and 2023 were 0.5077 and 0.5330, which were close to the mine average of 0.5023 and 0.5327, respectively. In contrast, the surface NDVI averages for the 5201 working face (121 mining method) are 0.4781 and 0.5084 in 2021 and 2023, respectively, both of which are still significantly lower than the mine average. This suggests that over time, working face 2404 (110 mining method) recovered to the average mine NDVI level more quickly than working face 5201 (121 mining method).
Figure 14 shows that taking the 4502 working face (110 mining method) and the 4306 working face (121 mining method) in the 4# coal seam of Shaqu No.1 Mine in the Huajin mining area as an example, the differences in the surface subsidence damage characteristics of the two working faces are compared and analyzed. The red lines in the rectangle of the simulated working face in Figure 14 show the distribution of cracks in the 4502 and 4306 working faces, respectively, and from left to right are partial photos of field research conducted on two working faces, including simulated crack distribution, panoramic view, crack width, and step displacement. Based on the field research and observation data of several parameters, such as crack shape, crack width, crack depth, crack step misalignment, crack length, crack spacing, etc. A statistical histogram was drawn based on the actual observation data of the evaluation indicators for surface cracks in two mining methods (Figure 15). The orange histogram represents the 4306 working face (121 mining method), and the green represents the 4502 working face (110 mining method). According to the actual observation statistical data, it is shown that:
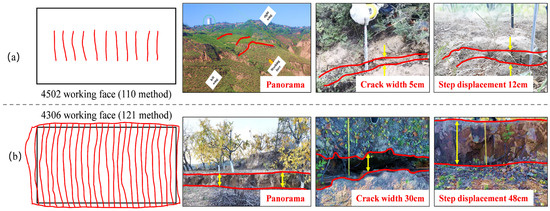
Figure 14.
Comparison diagram of the differences in surface cracks between two types of working faces, (a) 4502 working face (110 method) and (b) 4306 working face (121 method), from left to right, including simulated crack distribution, panoramic view, crack width, and step displacement.
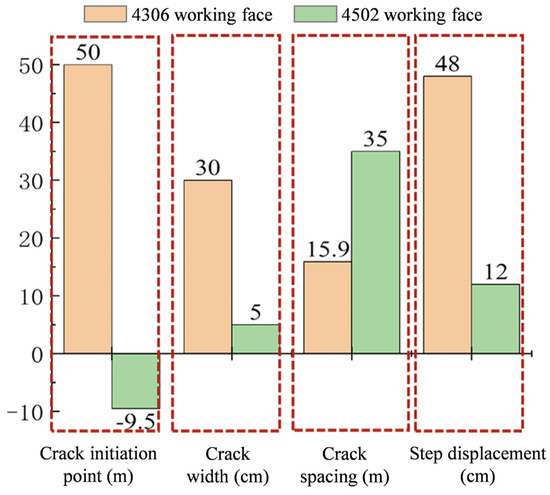
Figure 15.
Comparison of evaluation indicators for surface cracks in two working face methods.
- The width of the surface crack near the location of open-off cut of the 4502 working face (110 mining method) is about 5 mm, and the depth of crack development is about 4.5 m. There is a regular distribution of cracks on the surface above along the advancing direction of the working face, with the cracks length smaller than the inclined length of the working face. The starting points are about 50 m away from both sides of the working face. The width of the cracks is about 5 cm, and the spacing of the cracks ranges from 28 to 35 m. The crack in the advancing direction produces a step misalignment with a misalignment of about 12 cm.
- The width of the surface crack near the location of open-off cut of the 4306 working face (121 mining method) is about 10 cm, and the depth of the crack profile reaches 12 m. A large number of cracks along the advancing direction of the working face are irregularly distributed and produce obvious step misalignments, the cracks are staggered and connected, with a length of about 9.5 m beyond the sides of the working face. The width of the cracks reaches about 30 cm, and crack spacing is between 12 and 16 m. The apparent step misalignment produced by the cracks in the advancing direction amounted to about 48 cm.
Comparative analysis of the 4502 working face (110 mining method) and the 4306 working face (121 mining method), which have the same geological conditions and mining thickness, shows that there is no obvious step misalignment above the 4502 working face, while the 4306 working face generates obvious step subsidence. Neither the left nor right flanks of the 4502 working face produced significant cracks, but cracks were found directly above and on the left and right flanks of the 4306 working face. The 4306 working face has greater depth and width of edge cracks near the location of open-off cut than the 4502 working face. Summarizing the above differences in damage characteristics between the two working faces of mining can be seen: crack length of working face of 121 mining method > crack length of working face of 110 mining method, crack width of working face of 121 mining method > crack width of working face of 110 mining method, crack spacing in the advancing direction of the working face of 110 mining method > crack spacing in the advancing direction of the working face of 121 mining method, and the amount of misalignment of the cracking step in the working face of 121 mining method > the amount of misalignment of the cracking step in the working face of 110 mining method.
The main mechanism of fracture generation is the periodic breakage of the key layer above the working face after mining. When this rock movement ripples to the surface, cracks are created at the surface, and when the amount of rotational subsidence of the key layer-breaking blocks is large, the surface cracks can produce the phenomenon of step misalignment. As shown in Figure 16, the differences in the changes of the three zones (bending zone, fissure zone, and caving zone) in the geological profile engineering measurement model under two mining modes are presented.
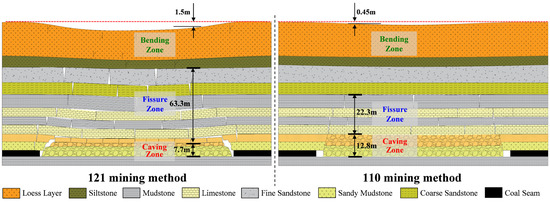
Figure 16.
Geological profile engineering measurement models for two mining modes.
- The height of the collapse zone on the 121 working face is 7.7 m, while that of the 110 working face is 12.8 m, increasing by 66.2%;
- The height of the crack zone in the 121 working face is 63.3 m, while that of the 110 working face is 22.3 m, which is reduced by 64.8%;
- The surface settlement height of the 121 working face is 1.5 m, while that of the 110 working face is 0.45 m, which is reduced by 70%.
The traditional 121 mining method working face mines the retained coal pillar, which has uneven surface settlement, insufficient crushing and swelling of the mining airspace, and serious ecological damage on the surface. The 110 mining method is unique in that it has no coal pillar in the working face, and the cutting of the roof realizes the balance of swelling, which can significantly increase the spacing of the cracks in the direction of the strike and tendency of the working face, reduce the width of the cracks, reduce the sinking of the steps, protect the morphology of the land surface, and reduce the ecological damage caused by the subsidence of the coal mining.
5. Conclusions
This study addresses two major scientific challenges—how to integrate multiple data sources and monitoring methods to achieve monitoring and trend analysis of ecological damage throughout the entire mining cycle and how to explore the differences in surface ecological environment damage in coal mining areas under two mining modes and the effectiveness of using the 110 method to achieve surface ecological damage reduction in mining areas. We have taken Lvliang City, a typical resource city in Shanxi Province, China, as an object and established a “Satellite–UAV–Ground–Underground–Well” four-in-one method for monitoring the ecological damage information on the surface of the mining area which is based on the information of underground mining and integrates multi-source, multi-temporal satellite and aerial remote sensing images. Based on different types of ecological environmental factors in the coal mining area of Lvliang City, we propose a method for analyzing the historical big data evolution of ecological damage on the surface of the mining area. A large database on the history of ecological damage in mining areas at three spatial scales of the Lvliang, Liulin, and Huajin mining areas was constructed, and the current situation and development trend of surface ecological damage in Lvliang coal mining areas were mapped out. We explored the differences in the characteristics of surface ecological environment damage in coal mining areas based on the 121 and 110 mining methods. The results indicate that:
- (1)
- As of the end of 2023, the coal mining subsidence areas in Lvliang City, Liulin County, and Huajin Mining District were 92,191.47 ha, 20,594.19 ha, and 2014.8 ha, respectively. Based on the current growth trend, it is expected that the coal mining subsidence area in Lvliang City, Liulin County, and Huajin Mining District will reach 130,739.55 ha, 29,205.27 ha, and 3796.08 ha, respectively in 2035, which is an increase of up to 41.812%, 41.813%, and 88.41%, respectively, compared to the existing coal mining subsidence areas in 2023.
- (2)
- Taking all mining areas within Liulin County in 2023 as an example, the average surface NDVI value within the 121 mining method mining area is lower than the average value of the entire county’s mining area, while the 110 mining method mining area is higher than the average value of the entire county’s mining area. The surface NDVI of the working face for both 121 mining method and 110 mining method will be lower than the average level of the mining area due to the impact of mining, but the surface NDVI of the working face of the 110 mining method will be restored to the average level of the mining area more quickly than that of the 121 mining method with the passage of time.
- (3)
- There are obvious differences in the damage characteristics of the working face between the 121 mining method and the 110 mining method, and the width of the surface cracks, the amount of misalignment of the crack steps, the length of the cracks, and the distribution density of the cracks in the working face of the 110 mining method are smaller than those in the working face of the 121 mining method. 110 mining method can effectively reduce the ecological damage caused by coal mining subsidence, and its widespread application can effectively realize the ecological environmental protection of coal mine areas and green mining of coal resources and contribute to the high-quality development of the coal industry.
Author Contributions
Conceptualization, Q.L. and Z.H.; methodology, Q.L. and F.Z.; software, Q.L. and Y.G.; investigation, F.Z.; resources, Y.L.; data curation, Q.L. and Y.G.; writing—original draft preparation, Q.L.; writing—review and editing, Z.H.; visualization, Q.L.; supervision, Z.H.; project administration, Z.H.; funding acquisition, Y.L. All authors have read and agreed to the published version of the manuscript.
Funding
This research was funded by “Key R&D project for school local cooperation in Lvliang City, grant number 2022XDHZ12”.
Data Availability Statement
No new data were created or analyzed in this study. Data sharing is not applicable to this article.
Acknowledgments
The authors thank the Institute of Land Reclamation and Ecological Reconstruction and State Key Laboratory for GeoMechanics and Deep Underground Engineering for their help in this research.
Conflicts of Interest
The authors declare no conflicts of interest.
References
- Hu, Z.Q.; Li, Y.Y.; Li, G.S.; Han, J.Z.; Liu, S.G. Opportunities and challenges of land reclamation and ecological restoration in mining areas under carbon neutral target. Coal Sci. Technol. 2023, 51, 474–483. [Google Scholar] [CrossRef]
- Stala-Szlugaj, K.; Grudzinski, Z. World steam coal management. Gospod. Surowcami Miner. Miner. Resour. Manag. 2021, 37, 5–26. [Google Scholar] [CrossRef]
- Laurence, D. Establishing a sustainable mining operation: An overview. J. Clean. Prod. 2011, 19, 278–284. [Google Scholar] [CrossRef]
- Hu, Z.Q. Reflections on the High Quality Development of Mining Land Reclamation and Ecological Restoration during the 14th Five Year Plan Period. J. Intell. Mine 2021, 2, 29–32. [Google Scholar]
- Hu, Z.Q.; Xiao, W. Some thoughts on green development strategy of coal industry: From aspects of ecological restoration. Coal Sci. Technol. 2020, 48, 35–42. [Google Scholar] [CrossRef]
- Dang, X.H.; Xu, L.J.; Gao, Y.; Feng, Y.Y.; Gao, Y. Effects of Coal Mining Subsidence on Soil Evaporation and Vegetation Transpiration. J. Basic Sci. Eng. 2022, 30, 1389–1401. [Google Scholar] [CrossRef]
- Li, G.S.; Hu, Z.Q.; Li, P.Y.; Yuan, D.Z.; Feng, Z.J.; Wang, W.J.; Fu, Y.K. Innovation for sustainable mining: Integrated planning of underground coal mining and mine reclamation. J. Clean. Prod. 2022, 351, 131522. [Google Scholar] [CrossRef]
- Wang, C.Y.; Gao, Z.; Li, J.P. Study on Influence of Underground Mining on Surface Subsidence. Coal Technol. 2018, 37, 10–12. [Google Scholar] [CrossRef]
- Hendrychová, M.; Kabrna, M. An analysis of 200-year-long changes in a landscape affected by large-scale surface coal mining: History, present and future. Appl. Geogr. 2016, 74, 151–159. [Google Scholar] [CrossRef]
- Wang, Y.J. Mining Area Research Progress and Prospect on Ecological Disturbance Monitoring in mining area. Acta Geod. Cartogr. Sin. 2017, 46, 1705–1716. [Google Scholar]
- Dulias, R. Impact of mining subsidence on the relief of the Rybnik Plateau, Poland. Z. Fur Geomorphol. 2011, 55, 25–36. [Google Scholar] [CrossRef]
- Wódka, M.; Kamieniarz, S.; Wojciechowski, T.; Przylucka, M.; Perski, Z.; Sikora, R.; Karwacki, K.; Jureczka, J.; Nadlonek, W.; Krieger, W.; et al. Post-mining deformations in the area affected by the former “Siersza” Hard Coal Mine in Trzebinia (southern Poland). Geol. Q. 2024, 68, 3–22. [Google Scholar] [CrossRef]
- Zhang, C.Y.; Li, J.; Lei, S.G.; Yang, J.Z.; Yang, N. Progress and Prospect of the Quantitative Remote Sensing for Monitoring the Eco-environment in Mining Area. Met. Mine 2022, 3, 1–27. [Google Scholar] [CrossRef]
- Zhao, Y.L.; Ding, B.L.; He, T.T.; Xiao, W.; Ren, H. Monitoring of subsidence water body change based on Google Earth Engine. J. China Coal Soc. 2022, 47, 2745–2755. [Google Scholar] [CrossRef]
- Xiao, W.; Chen, J.L.; Zhao, Y.L.; Hu, Z.Q.; Lv, X.J.; Zhang, S. Identify maize chlorophyll impacted by coal mining subsidence in high groundwater table area based on UAV remote sensing. J. China Coal Soc. 2019, 44, 295–306. [Google Scholar] [CrossRef]
- Xiao, W.; Hu, Z.Q.; Zhang, J.Y.; Zhao, Y.L.; Yang, K. The status and prospect of UAV remote sensing in mine monitoring and land reclamation. China Min. Mag. 2017, 26, 71–78. [Google Scholar]
- Yang, K.; Zhao, Y.L.; Zhang, J.Y.; Cheng, C.; Zhao, P.P. Tree height extraction using high-resolution imagery acquired from an unmanned aerial vehicle (UAV). J. Beijing For. Univ. 2017, 39, 17–23. [Google Scholar] [CrossRef]
- Lei, S.G.; Bian, Z.F. Research progress on the environment impacts from underground coal mining in arid western area of China. Acta Ecol. Sin. 2014, 34, 2837–2843. [Google Scholar]
- Ma, D.; Zhao, X.M. Dynamie monitoring of land damage in Xishan coalfield of Shanxi province. Sci. Surv. Mapp. 2022, 47, 107–114. [Google Scholar] [CrossRef]
- Li, J.; Peng, S.P.; Zhang, C.Y.; Yang, F.; Sang, X. Quantitative remote sensing-based monitoring and evaluation of the ecological environment in mining areas: Technology framework and application. J. Min. Sci. Technol. 2022, 7, 9–25+88. [Google Scholar] [CrossRef]
- Rahmonov, O.; Krzysztofik, R.; Środek, D.; Smolarek-Lach, J. Vegetation-and environmental changes on non-reclaimed spoil heaps in Southern Poland. Biology 2020, 9, 164. [Google Scholar] [CrossRef]
- Popovych, V.; Voloshchyshyn, A. Features of temperature and humidity conditions of extinguishing waste heaps of coal mines in spring. News Natl. Acad. Sci. Repub. Kazakhstan Ser. Geol. Tech. Sci. 2019, 4, 230–237. [Google Scholar] [CrossRef]
- Abramowicz, A.; Rahmonov, O.; Chybiorz, R. Environmental Management and Landscape Transformation on Self-Heating Coal-Waste Dumps in the Upper Silesian Coal Basin. Land 2021, 10, 23. [Google Scholar] [CrossRef]
- Dulias, R. The Impact of Mining on the Landscape; Springer: Cham, Switzerland, 2016. [Google Scholar] [CrossRef]
- He, M.C.; Song, Z.Q.; Wang, A.; Yang, H.H.; Qi, H.G.; Guo, Z.G. Theory of longwall mining by using roof cuting short wall team and 110 method—The third mining science and technology reform. Coal Sci. Technol. Mag. 2017, 1, 1–9+13. [Google Scholar] [CrossRef]
- He, M.C. Theory and engineering practice for non-pillars mining with automagical entry formation and 110 mining method. J. Min. Saf. Eng. 2023, 40, 869–881. [Google Scholar] [CrossRef]
- Wang, Q.; He, M.C.; Wang, Y.C.; Liu, J.T.; Xue, H.J. Research progress and prospect of automatically formed roadway by roof cutting and pressure relief without pillars. J. Min. Saf. Eng. 2023, 40, 429–447. [Google Scholar] [CrossRef]
- The People’s Government of Lvliang City. Overview of Lvliang City. Available online: http://www.lvliang.gov.cn/zjll/llgl/llgk/ (accessed on 20 April 2024).
- The People’s Government of Lvliang City. Physical Geography. Available online: http://www.lvliang.gov.cn/zjll/llgl/zrdl/ (accessed on 20 April 2024).
- Lvliang Investigation Team of National Bureau of Statistics, Lvliang City Bureau of Statistics. 2018 National Economic and Social Development Statistics Bulletin of Lvliang City. Lvliang Daily, 16 April 2019; 002. [Google Scholar]
- The People’s Government of Lvliang City. Energy Production and Utilization Situation. Available online: http://www.lvliang.gov.cn/zjll/zyys/ny/ (accessed on 20 April 2024).
- The People’s Government of Liulin Connty. Geological Introduction. Available online: http://www.liulin.gov.cn/zjll/rwdl_67897/zrdl/202112/t20211217_1601770.shtml (accessed on 20 April 2024).
- Hu, Z.Q.; Wang, L.L.; Xu, X.L. A Method for Obtaining Ecological Damage Information of Mining Land Based on Multiple Data Sources. CN103049655B, 23 July 2014. [Google Scholar]
- Nádudvari, Á.; Abramowicz, A.; Fabiańska, M.; Misz-Kennan, M.; Ciesielczuk, J. Classification of fires in coal waste dumps based on Landsat, Aster thermal bands and thermal camera in Polish and Ukrainian mining regions. Int. J. Coal Sci. Technol. 2021, 8, 441–456. [Google Scholar] [CrossRef]
- Li, Q.Z.; Hu, Z.Q.; Zhang, F.; Song, D.Y.; Liang, Y.S.; Yu, Y. Multispectral Remote Sensing Monitoring of Soil Particle-Size Distribution in Arid and Semi-Arid Mining Areas in the Middle and Upper Reaches of the Yellow River Basin: A Case Study of Wuhai City, Inner Mongolia Autonomous Region. Remote Sens. 2023, 15, 2137. [Google Scholar] [CrossRef]
- Song, D.Y.; Hu, Z.Q.; Zeng, J.Y.; Sun, H. Influence of mining on vegetation in semi-arid areas of western China based on the coupling of above ground and below ground—A case study of Daliuta coalfield. Ecol. Indic. 2024, 161, 111964. [Google Scholar] [CrossRef]
- Demirel, N.; Düzgün, Ş.; Emil, M.K. Landuse change detection in a surface coal mine area using multi-temporal high-resolution satellite images. Int. J. Min. Reclam. Environ. 2011, 25, 342–349. [Google Scholar] [CrossRef]
- Zhang, F.; Hu, Z.Q.; Liang, Y.S.; Li, Q.Z. Evaluation of Surface Crack Development and Soil Damage Based on UAV Images of Coal Mining Areas. Land 2023, 12, 774. [Google Scholar] [CrossRef]
- Wang, Q.Y.; Zhao, Y.L.; Fang, S.D.; Yang, X.; Zhou, H.; Liu, J.F. Inversion of soil moisture in bare soil based on multi-spectral remote sensing. J. Min. Sci. Technol. 2020, 5, 608–615. [Google Scholar] [CrossRef]
- Chen, W.; Xu, Z.J.; Guo, Q. Estimation of soil organic matter by UAV hyperspectral remote sensing in coal mining areas. Trans. Chin. Soc. Agric. Eng. 2022, 38, 98–106. [Google Scholar]
- Zhao, Y.X.; Sun, B.; Liu, S.M.; Zhang, C.; He, X.; Xu, D.; Tang, W. Identification of mining induced ground fissures using UAV and infrared thermal imager: Temperature variation and fissure evolution. ISPRS J. Photogramm. Remote Sens. 2021, 180, 45–64. [Google Scholar] [CrossRef]
- Qi, L.Z.; An, S.K.; Tian, C.; Zhou, D.W.; Dong, X. Mining Subsidence Monitoring Method and Parameter Inversion Based on Unmanned Aerial Vehicle Lidar Technology. Sci. Technol. Eng. 2022, 22, 4752–4761. [Google Scholar]
- Cui, F.; Wang, R.; Chen, C.Q.; Wang, Y.L.; Bai, Y.; Yin, C.Y.; Cao, Y.F.; Cao, R.; Liao, L.X. Integrated advanced prediction of small structures by ground penetrating radar and downhole seismic with complex geological conditions in East Yunnan. Coal Sci. Technol. 2023, 51, 222–230. [Google Scholar] [CrossRef]
- Wang, X.J. Monitoring, Evolution and Self-Healing Characteristic of Land Damage Due to High Tension Coal Mining in Windy and Sandy Area; China University of Mining and Technology: Beijing, China, 2014. [Google Scholar]
- Ju, C.Y.; Fu, Y.K.; Chen, C.; Feng, Z.W.; Bai, M.B.; Hu, Z.Q. Influence of coal mining subsidence cracks on soil surface watercontent in Shennan Mining Area. Coal Sci. Technol. 2022, 50, 309–316. [Google Scholar] [CrossRef]
- Cui, X.M.; Deng, K.Z. Research review of predicting theory and method for coal mining subsidence. Coal Sci. Technol. 2017, 45, 160–169. [Google Scholar] [CrossRef]
- Han, J.Z.; Hu, Z.Q.; Wang, P.J.; Yan, Z.G.; Li, G.S.; Zhang, Y.H.; Zhou, T. Spatio-temporal evolution and optimization analysis of ecosystem service value-A case study of coal resource-based city group in Shandong, China. J. Clean. Prod. 2022, 363, 132602. [Google Scholar] [CrossRef]
Disclaimer/Publisher’s Note: The statements, opinions and data contained in all publications are solely those of the individual author(s) and contributor(s) and not of MDPI and/or the editor(s). MDPI and/or the editor(s) disclaim responsibility for any injury to people or property resulting from any ideas, methods, instructions or products referred to in the content. |
© 2024 by the authors. Licensee MDPI, Basel, Switzerland. This article is an open access article distributed under the terms and conditions of the Creative Commons Attribution (CC BY) license (https://creativecommons.org/licenses/by/4.0/).