Abstract
Water conservation is crucial for sustainable ecosystem development in loess gully regions. The redlines of permanent basic farmland protection and ecological protection are key land use control zones in China, yet their impact on water conservation is understudied. The study focuses on Yan’an and constructs three scenarios: natural development (NDS), farmland protection (FPS), and ecological protection (EPS). Then, land use simulation for the three scenarios in 2025, 2030, and 2035 is carried out using the patch-generating land use simulation model. Finally, the integrated valuation of ecosystem services and trade-offs model is combined to calculate water conservation. The findings suggest the following: (1) From the temporal perspective, the water conservation of the three scenarios exhibits an incremental trend by period from 2025 to 2035, with an annual growth rate of approximately 0.65‰ for the NDS, 0.60‰ for the FPS, and 0.64‰ for the EPS. (2) From the scenario perspective, from 2025 to 2035, the annual water conservation under the FPS is 0.35‰ less than that under the NDS, while the impact of the EPS is weak at only ±0.1‰. (3) Across all scenarios, the average water conservation depth of grassland surpasses that of forestland. This study provides scientific evidence to help optimize China’s land space governance policy as well as methodological and theoretical support for related studies.
1. Introduction
Water conservation, as an important service function of terrestrial ecosystems, is a critical indicator for assessing the status of regional ecosystems [1,2]. In China, especially in loess gully regions with a fragile ecological environment and severe soil erosion, water conservation is indispensable for maintaining the regional ecological balance, preventing soil erosion, and underpinning economic development [3].
Reasonable land use policies are an effective approach to optimizing water conservation [4]. Thus, identifying the trends in ecosystem service changes induced by land use policies forms the scientific basis for policy optimization [5]. Relevant studies indicate that while land use policies may enhance certain services, they may also entail adverse consequences [6,7]. For instance, farmland consolidation may lead to issues such as soil and water pollution and biodiversity reduction [8,9]. Moreover, afforestation, despite its carbon sequestration benefits, might reduce water yield [10]. Therefore, the potential trade-offs between the ecosystem services provided by these policies and other services should be assessed across spatial and temporal scales [11].
Since November 2019, the Chinese government has promulgated the Guiding Opinions on Coordinating and Implementing Three Control Lines in National Spatial Planning, which strictly regulates land use conversions within the designated control areas. Although China’s permanent basic farmland protection redline (PBFPR) and ecological protection redline (EPR) were comprehensively delineated around 2017, these areas have been adjusted and redefined multiple times due to overlapping conflicts and implementation challenges [12,13,14,15,16]. Since 2020, these policies have become crucial elements in the spatial governance of the loess gully region and have been stringently enforced in practice.
While providing ecosystem services such as food supply and carbon sequestration, the policies of the permanent basic farmland protection redline and the ecological protection redline may also have profound impacts on water conservation services. Currently, research on these two redlines primarily focuses on the optimization of policy formulation [14,17,18,19] and delineation techniques [20,21,22]. In terms of policy impact assessment, many scholars concentrate on how farmland and ecological protection policies alter land use demands and how the changes in land use demands further affect ecosystem services [23,24,25,26,27]. In recent years, some studies have started to explore the impact of implementing the EPR on ecosystem services. For instance, Guo et al. evaluated the EPR in Guizhou Province and found that although the redline significantly reduced soil erosion and enhanced carbon sequestration, it may also lead to reduced water yield [12]. Nevertheless, research on the impacts of the PBFPR and EPR on water conservation remains insufficient, particularly in the unique loess gully region. Water conservation in this region is crucial for the sustainable development of the ecosystem.
Research on the impact of land use policies on ecosystem services often relies on land use simulation models to assess changes in ecosystem services. Commonly used land use change simulation models include the cellular automaton (CA) model [28,29], the CLUE-S model [30], the land transformation model (LTM) [31], the future land use simulation (FLUS) model [32,33] and the patch-generating land use simulation (PLUS) model [23,25,34]. For evaluating ecosystem services related to water conservation, notable models include the integrated valuation of ecosystem services and trade-offs (InVEST) model, the soil and water assessment tool (SWAT), and the artificial intelligence model of ecosystem services (ARIES). Studies have shown that the PLUS model offers higher simulation accuracy compared with other models [35,36]. Both the SWAT and InVEST models provide similar reference frameworks that can guide management and policy formulation [37]. The InVEST model is more suitable for the assessment of the influence of land use change on multiple ecosystem services [38]. Thus, the PLUS model is combined with the InVEST model with the purpose of obtaining the water yield. Meanwhile, the velocity coefficient, the terrain index, and the soil saturated hydraulic conductivity are adopted for calculating the water conservation.
Yan’an, as a typical loess gully region with broken topography and loose soil, is susceptible to water and wind erosion. Thus, there is a need to focus on its soil and water conservation. Consequently, this study selects Yan’an as the representative area. The specific objectives include: (1) simulating the land use in Yan’an in the natural development scenario (NDS), permanent basic farmland protection scenario (FPS), and ecological protection scenario (EPS) in 2025, 2030, and 2035; (2) calculating the spatial distribution of water yield and water conservation in Yan’an under these three scenarios in 2025, 2030, and 2035; and (3) investigating the impact of the PBFPR and the EPR on water conservation. The main contributions of this study include three aspects. First, it offers a basis for the optimization of land use policy zoning and water resource management in Yan’an. Second, it offers scientific support for the optimization of land use policies in the loess gully region. Third, it furnishes methodological references for simulating land use policies in other regions.
2. Materials and Methods
2.1. Study Area
As presented in Figure 1, Yan’an City is located in the northern part of Shaanxi Province, China, and is situated in the middle reaches of the Yellow River. It is a key area for soil and water conservation in the middle reaches of the Yellow River. It has jurisdiction over 13 districts and counties, with a total area of 37,000 square kilometers. The terrain is predominantly characterized by ridges and gullies, with an overall fragile ecological environment and water resource scarcity. Between 2006 and 2022, the annual average precipitation was 554.9 mm, while the annual average potential evaporation was 1060.9 mm.
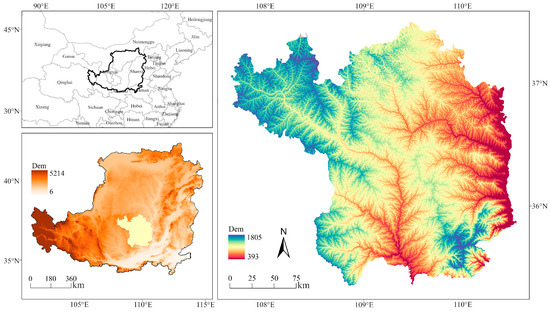
Figure 1.
Location of the study area.
Yan’an City implements the strictest controls over the three control lines. In urbanized areas, the focus is on balancing development and conservation to guide the efficient concentration of economic, population, and innovation resources and to accelerate new-type industrialization and urbanization. In agricultural production areas, the policy prioritizes protection before development, with the primary aim of safeguarding farmland. In ecological function zones, the emphasis is on protecting the ecological environment while supporting the gradual and orderly migration of the population.
2.2. Data and Parameter Processing
Table 1 presents the foundational data for the PLUS model, while Table 2 outlines the basic data for the InVEST water yield module and the water conservation model. All raster data were resampled to a spatial resolution of 30 m using the ArcGIS Pro 3.0 software.

Table 1.
Foundational data for the PLUS model.
Table 2.
Foundational data for the InVEST model and the water conservation model.
The foundational data for the PLUS model primarily include land use data, driving factor data, and spatial control data:
- (1)
- Land use data: These data are obtained from the Resource and Environmental Science and Data Center of the Chinese Academy of Sciences and encompass 6 first-level types and 25 second-level types, with an overall accuracy of more than 90%. For simplification, some second-level types with smaller areas were merged into first-level types to form a final total of 6 first-level types and 16 second-level types. These specific types are as follows: cultivated land, which includes paddy fields (PF) and dry land (DL); forest land, which includes woodland (WL), shrub land (SHL), sparse woodland (SWL), and other woodland (OWL); grassland, which includes high-coverage grassland (HCG), medium-coverage grassland (MCG), and low-coverage grassland (LCG); water areas, which include rivers and ditches (RD), lakes (LK), reservoirs and ponds (RP), and floodplains (FLP); construction land, which includes urban construction land (UCL) and rural residential land (RRL); and unused land (UNL).
- (2)
- Driving factor data: There are two topographic factors, namely dem and slope; three climate factors, namely annual precipitation, annual potential evapotranspiration, and annual average temperature; and eight socioeconomic factors, namely population, GDP, and the Euclidean distance to railways, highways, provincial roads, county roads, township roads, and county governments. The location data for county government offices were obtained using the reverse geocoding tool from Baidu Maps.
- (3)
- Spatial control data: This involves the permanent basic farmland protection redline (PBFPR), the ecological protection redline (EPR), as well as the urban development boundary (UDB).
2.3. Research Method
The study establishes three scenarios: the natural development scenario (NDS), the permanent basic farmland protection scenario (FPS), and the ecological protection scenario (EPS). In accordance with the spatial distribution of land use, water yield, and water conservation under the different scenarios in 2025, 2030, and 2035, the impact of implementing the PBFPR and EPR in the loess gully region is evaluated. The specific research framework can be found in Figure 2.
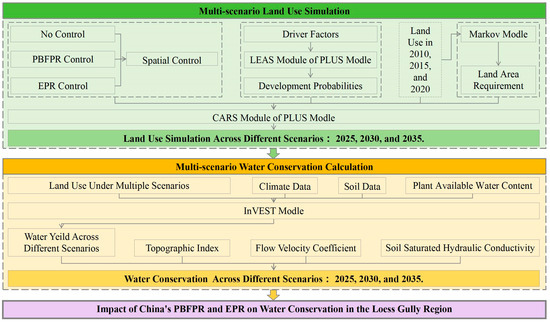
Figure 2.
The workflow of this study.
2.3.1. The PLUS Model and Scenario Design
- Land expansion strategy analysis
First, the transition data for various land uses from 2010 to 2015 were extracted. Then, the Land Expansion Analysis Strategy (LEAS) module was used to adopt the random forest algorithm to mine the driving factors of land transfer from the changing land use, and the development probability of each type of land use and the contribution of its driving factors were calculated. In this study, the sample sampling rate was defined as 0.1, the number of regression trees was 20, and the mTry number was 13.
- 2.
- Land demand prediction
To avoid interference in the evaluation results due to differences in land area demand under different scenarios, this study ensures that the goal of the land area demand is identical across the three scenarios. The Markov chain model was adopted for simulating land use demands for the years 2020, 2025, 2030, and 2035.
- 3.
- Land use simulation
In the CARS module, the simulation of land patch generation is carried out through combining random seed generation with a threshold decreasing mechanism. In this study, the neighborhood size was set to 3, the patch generation threshold to 0.5, the expansion coefficient to 0.1, and the percentage of random seeds to 0.0001. Based on the land expansion areas from 2015 and 2020, the neighborhood weights for each land type were calculated (Formula (1)), and the land use conversion matrix was set, where 0 represents non-convertible and 1 represents convertible.
where Hi denotes the neighborhood weight of the i-th land type, TAi is the i-th land use transfer area, and TAmin and TAmax denote the minimum and maximum transition areas among all the land use types, respectively.
The “conversion restriction area” and “development zone” were set, with water bodies set as restricted areas (value 0), areas within the urban development boundary set as development zones (value 2), and all other areas assigned a value of 1. The development weight for the development zones was set to 0.5, and the development type was urban construction land code 14. Based on the land use data in 2015, this model successfully simulated the land use in 2020 (Figure 3), and the model’s effectiveness was validated through accuracy verification, showing a Kappa coefficient of 0.85 and an overall accuracy of 88.31%.
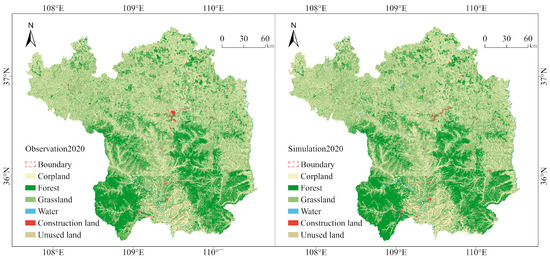
Figure 3.
Comparison of the observed land use (left) versus the PLUS model simulation (right) for 2020.
- 4.
- Scenario design
This study sets three scenarios (Table 3). In the natural development scenario (NDS), water bodies are designated as restricted areas, while areas within the urban development boundary are designated as development zones. In the permanent basic farmland protection scenario (FPS), both water bodies and areas under the PBFPR are designated as restricted areas, while areas within the UDB are designated as development zones. In the ecological protection scenario (EPS), both water bodies and areas under the EPR are designated as restricted areas, while areas within the UDB are designated as development zones.
Table 3.
Scenario design.
2.3.2. The InVEST Water Yield Model and Water Conservation
- InVEST water yield model
The InVEST water yield model uses Formula (2) to calculate the water yield using the principle of the water cycle:
where Yj is the annual water yield (mm); Pj is the annual average rainfall (mm); AETj is the annual actual evapotranspiration (mm). The AETj of the vegetation land use type is calculated using Formula (3), and the AETj of other land types is calculated using Formula (4).
where PETj is the potential evapotranspiration (mm), calculated using Formula (5); and Wj represents a dimensionless parameter that accounts for natural climatic and soil characteristics, calculated using Formula (6).
where ET0j is the evapotranspiration (mm); KCij denotes the plant evapotranspiration coefficient of land type i on grid j; AWCj refers to the effective soil water content (%); and Z refers to the Zhang coefficient, which ranges from 1 to 30. According to the Yan’an Water Resources Bulletin, the average total water resource in Yan’an is 1.335 billion cubic meters. By inputting the multi-year average precipitation and evapotranspiration into the InVEST model and setting Z to 4.3, the calculated average total water resources for 2010, 2015, and 2020 is 1.373 billion cubic meters. This value closely approximates the average total water resources reported for Yan’an.
- 2.
- Water conservation model
Relevant research indicates that water conservation is not only closely related to water yield but is also influenced by the soil characteristics, topography, and surface roughness. To fully account for the complex topographical features and spatial variability in the loess hilly region, this study first estimates water yield using a water yield module, and then calibrates this estimate by incorporating the topographic conditions, soil physical properties, and flow velocity. The final water conservation amount is calculated using Formula (7) [38,44]:
where WRj represents the water conservation amount (mm); Ksatj represents the soil saturated hydraulic conductivity (mm/d); and Velij is the velocity coefficient of land type i on grid unit j. Tj is the terrain index, which is dimensionless and calculated using Formula (8), and Yj is the water yield, calculated via Formula (2). Given the significant alterations or degradation often associated with urban construction land, rural residential areas, and unused land, these parcels are set to Nodata. Drainage Area is the number of catchment grids, dimensionless; Soil Depth represents the soil depth (mm); and Percent Slope represents the percentage slope.
3. Results
3.1. Analysis of Land Use under Multiple Scenarios
3.1.1. Characteristics of Land Use Change from 2010 to 2035
Figure 4 illustrates the changes in the area in the various land use types from 2010 to 2035. Among the land use types that increased, medium-coverage grassland exhibited the largest growth, reaching 1194.92 square kilometers. This was followed by urban construction land, which increased by 104.50 square kilometers. Other land types such as reservoirs and ponds, unused land, rivers and ditches, other woodlands, floodplains, and lakes also increased, though to a smaller extent. Conversely, among the land use types that decreased, dry land experienced the most significant reduction, shrinking by 578.82 square kilometers. This was followed by shrubland, which decreased by 381.82 square kilometers, and high-coverage grassland, which declined by 218.05 square kilometers. Additionally, low-coverage grassland, sparse woodland, woodland, rural residential land, and paddy fields also decreased, though to a smaller extent.
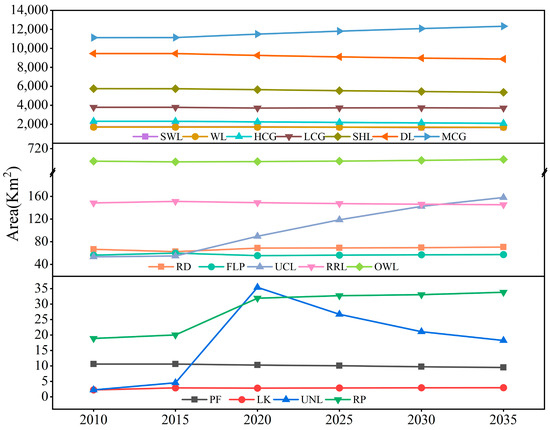
Figure 4.
Area changes in the different land use types from 2010 to 2020.
3.1.2. Characteristics of Land Use Transfer
Figure 5 presents the proportion of the total land use transition area occupied by each land type. Across all three scenarios, there is a notable transition from dry land and shrubland to medium-coverage grassland. The combined transfer-out ratio of dry land and shrubland is approximately 45%, while the transfer-into ratio of medium-coverage grassland is also around 45%. Under the FPS, the transfer ratio of cultivated land is lower compared with that in the NDS. In the EPS, the transfer ratio of forest land is lower than that in the NDS. According to Figure 6, the spatial transition patterns of dry land, shrubland, and medium-coverage grassland are similar across the three scenarios.
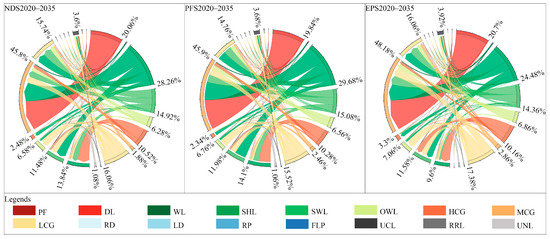
Figure 5.
Proportions of land cover transitions under multiple scenarios for 2020–2035.
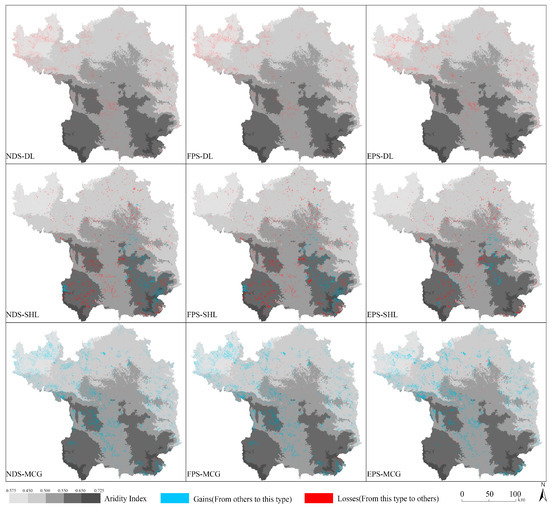
Figure 6.
Spatial patterns of land use changes under multiple scenarios for 2020–2035.
3.2. Analysis of Water Yield and Water Conservation under Multiple Scenarios
3.2.1. Spatial Distribution of Water Yield and Water Conservation
As shown in Figure 7, the spatial distribution patterns of water yield and water conservation are similar across the three scenarios. The PBFPR and the EPR have a minimal effect on the spatial distribution pattern of water conservation in the study area. Clearly, the high values of water yield and water conservation are mainly distributed in areas with a drought index ranging from 0.501 to 0.550, while the low values of water yield and water conservation are mainly distributed in areas with a drought index of 0.375–0.450 and 0.551–0.650.
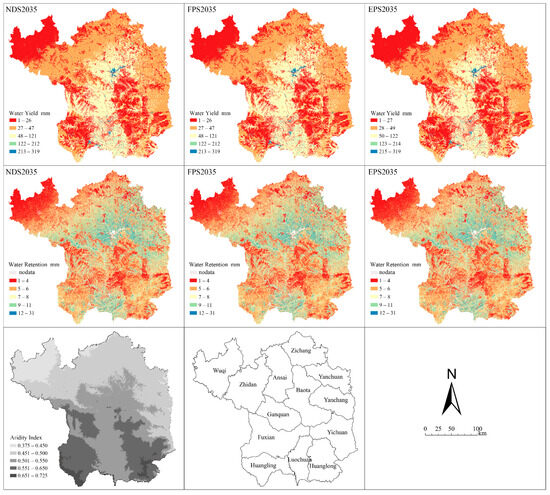
Figure 7.
Spatial distribution of water yield and water conservation across multiple scenarios in 2035.
3.2.2. Water Yield Impact Analysis
Table 4 shows the changes in water yield in the time dimension and the multi-scenario dimension. In the time dimension, the water yield exhibits a trend of gradual increase. Under the NDS, the water yield increases from 1.392042 billion cubic meters in 2025 to 1.404349 billion cubic meters in 2035. In the FPS, the water yield increases from 1.391935 billion cubic meters in 2025 to 1.404342 billion cubic meters in 2035. Under the EPS, the water yield increases from 13.92007 billion cubic meters in 2025 to 14.04881 billion cubic meters in 2035.
Table 4.
Water yield under multiple scenarios.
In the multi-scenario dimension, the water yield in the natural development scenario is consistently higher than that in the permanent basic farmland protection scenario across all periods. The latter scenario shows a decrease of approximately 0.1‰ on average per year compared with the former.
3.2.3. Water Conservation Impact Analysis
Table 5 shows the alterations in water conservation in the time dimension and multiple scenario dimensions. In terms of the time dimension, the average water conservation depth also shows a trend of gradual increase. Under the NDS, the average water conservation depth increases from 6.21091 mm in 2025 to 6.25153 mm in 2035. Under the FPS, the average water conservation depth increases from 6.21035 mm in 2025 to 6.24800 mm in 2035. Under the EPS, the average water conservation depth increases from 6.21157 mm in 2025 to 6.25113 mm in 2035. In the multi-scenario dimension, the water conservation depth in all three scenarios also exhibits a gradual upward trend. Specifically, the annual growth rate is approximately 0.65‰ in the NDS, about 0.60‰ in the FPS, and around 0.64‰ in the EPS.
Table 5.
Average water conservation depth under multiple scenarios.
In the multi-scenario dimension, the characteristics of the average water conservation depth are as follows: The average water conservation depth of the NDS is higher than that of the FPS in each period. Compared with the NDS, the average annual decrease of the FPS decreases by approximately 0.35‰ per year. The EPS exerts a weak effect on the average water conservation depth, with variations ranging around ±0.1‰.
Figure 8 presents the average water conservation depth for the various land use types across the different scenarios, which are ranked as follows: low-coverage grassland, medium-coverage grassland, high-coverage grassland, dry land, shrubland, woodland, sparse woodland, other woodland, and paddy fields. The specific values for the average water conservation depth under the NDS are as follows: paddy fields, 2.80394 mm; dry land, 5.55039 mm; woodland, 4.27190 mm; shrubland, 4.51460 mm; sparse woodland, 3.99649 mm; other woodland, 2.78409 mm; high-coverage grassland, 5.81327 mm; medium-coverage grassland, 7.15861 mm; and low-coverage grassland, 8.27530 mm. Under the FPS, the average water conservation depth of paddy fields and dry land increases, while the average water conservation depth of high-coverage grassland, medium-coverage grassland, and low-coverage grassland decreases.
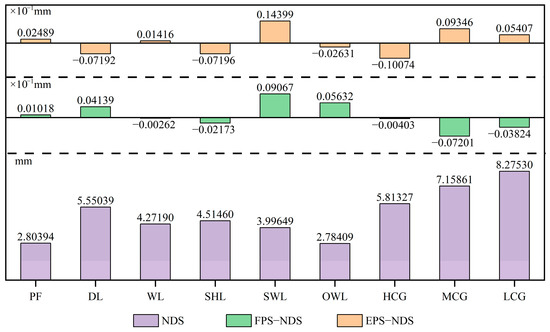
Figure 8.
Average water conservation depth across land cover types under multiple scenarios in 2035.
4. Discussion
At present, hotspots in studies on the PBFPR and EPR mainly focus on the optimization of policy construction and demarcation technical methods. However, there is a relative paucity of studies evaluating the effectiveness of policy implementation. This study quantifies the long-term impacts of the PBFPR and the EPR on a key ecosystem service in the loess gully region, namely water conservation.
4.1. Discussion of the Impact of the PBFPR and EPR on Water Conservation
The research results indicate that in regions where the drought index ranges from 0.375 to 0.450 and 0.551 to 0.650, the water conservation capacity is relatively low. There is a strong spatial correlation between the spatial distribution of water conservation services and the drought index. Previous studies have shown that in the Loess Plateau, precipitation and vegetation are important factors affecting water conservation [44]. Particularly in arid regions where water resources are already scarce, afforestation increases evapotranspiration, and this consumption further exacerbates the water scarcity [45]. In areas with a drought index between 0.375 and 0.450, the precipitation is relatively low, while in regions with a drought index between 0.551 and 0.650, the forest cover is relatively high. Therefore, the reduction in water conservation in these two areas may be primarily attributed to insufficient precipitation and excessive forest cover, respectively.
The implementation of the policy for the PBFPR has resulted in a decrease in the overall water conservation service of about 0.35‰. More specifically, the average water conservation depth of cultivated land has increased, and the average water conservation depth of grassland has decreased. This may be because permanent basic farmland is mostly located in land areas with good soil quality and terrain conditions [46]. Restricting the conversion of these high-quality cultivated lands can suppress the enhancement of water conservation to a certain extent. Furthermore, related studies have indicated that cultivated land in the loess gully region exhibits serious fragmentation [47], poor fertility [48], and a low production potential [49]. Thus, it remains to be seen whether the value of food supply services provided by the permanent basic farmland protection policy can offset the loss in water conservation services.
The implementation of the EPR has a weak effect on water conservation in the study area. This may be caused by the evaluation models used during the delineation of the ecological redline not adequately considering spatial heterogeneity, resulting in the protected areas inherently lacking high water conservation capacity. According to the Guidelines for the Delineation of Ecological Protection Redlines in China, it is recommended that local governments give priority to the model assessment method. The model assessment method calculates the water conservation through the water balance equation, where the runoff volume is determined by applying the corresponding surface runoff coefficient values based on surface vegetation types. Although vegetation type is a significant factor influencing the surface runoff volume, it explains less than 50% of the surface runoff coefficients [50]. The surface runoff coefficient comprehensively reflects geological soil and vegetation conditions, and soil characteristics and topography are also important influencing factors [51]. Determining the surface runoff coefficient based only on the surface vegetation type is likely to cause deviations in the calculation results for areas with complex terrain like the loess gully region.
The study also indicated that the average water conservation amount of grassland is greater than that of forest land. Thus, grassland is more suitable for improving water conservation services in the loess gully region. This conclusion aligns with previous research findings: some studies utilizing multi-source datasets have demonstrated that while converting cropland to forest promotes soil retention, it diminishes the ecosystem’s water conservation services [52]. Other studies have found through meta-analysis that in areas where farmland is returned to forests, these forests seriously deplete the soil water content compared with grassland and cultivated land [53]. Additionally, sampling data indicate that the annual soil water storage capacity of different vegetation types on the Loess Plateau decreases in the following order: naturally restored grassland, artificial grassland, cultivated land, artificial shrubland, and artificial woodland [54]. On loess slopes, the soil moisture in both artificial and natural forest lands is lower than in grasslands [55]. In addition, related studies have indicated that grasslands can better optimize the trade-off between maintaining runoff and soil erosion than forests [56].
4.2. Policy Optimization Suggestions for the Loess Gully Region
In the future land space governance and water resource management process of Yan’an, it may be beneficial to consider using the drought index as the basis for policy zoning. For areas with different drought levels, corresponding management and response policies should be formulated to improve the pertinence and effectiveness of these policies. Furthermore, the necessity of implementing the permanent basic farmland protection policy in the loess gully region should be evaluated through a more in-depth analysis. When delineating the ecological protection redline, local governments should refine parameters and models based on their unique terrain and landform characteristics, establishing ecological delineation rules suited to the local context. Additionally, it is recommended to prioritize the restoration of grasslands in the loess gully region during ecological restoration efforts.
4.3. Limitations and Future Work Suggestions
This study evaluated the impact of the PBFPR and the EPR policies on water conservation by integrating the PLUS model and the InVEST model. However, there are certain limitations to this research. Although the focus is on the impact of the two redline policies on water conservation, the underlying mechanisms of these impacts are still insufficiently understood. Therefore, future research should continue to delve into the intrinsic mechanisms behind these effects, aiming to provide more comprehensive policy recommendations for the optimization of land use policies.
5. Conclusions
To conclude, this study combines the PLUS model and the InVEST model to simulate the land use situation in Yan’an in 2025, 2030, and 2035 under the NDS, FPS, and EPS. Then, the long-term impact of the PBFPR and the EPR on the key ecosystem service function of the loess gully region, namely water conservation, is evaluated. The findings show the following: (1) The PBFPR and the EPR have a weak effect on the spatial distribution pattern of water conservation. (2) The PBFPR somewhat suppresses the water conservation services in the study area. This indicates that there is a trade-off between farmland protection and water conservation in the study area. (3) The EPR has a limited impact on the water conservation service in the study area, potentially due to an inadequate consideration of spatial variability during its delineation. (4) Grassland is more conducive to water conservation services in the loess gully region. This finding aligns with previous research indicating that grasslands are more suitable for maintaining water conservation compared with forests.
Future research will focus on exploring the underlying mechanisms of the impacts of the PBFPR and EPR, as well as investigating how policy adjustments can further enhance water conservation. Additionally, assessments of land use policies in various regions will provide broader insights. This study lays the foundation for policy optimization and offers valuable methodological insights for future research.
Author Contributions
Conceptualization, data curation, writing—original draft preparation, visualization, writing—reviewing and editing, J.L.; methodology, supervision, project administration, J.Z.; software and validation, Q.H. All authors have read and agreed to the published version of the manuscript.
Funding
This research was funded by the Chunhui Project Foundation of the Education Department of China (Grant No. HZKY20220521), the Natural Science Basic Research Program of Shaanxi Province (Grant No. 2024JC-YBQN-0541), and the Fundamental Research Funds for the Central Universities, CHD (Grant No. 300102414603).
Data Availability Statement
The original contributions presented in the study are included in the article, further inquiries can be directed to the corresponding author.
Conflicts of Interest
The authors declare no conflicts of interest.
References
- Xue, J.; Li, Z.; Feng, Q.; Gui, J.; Zhang, B. Spatiotemporal Variations of Water Conservation and Its Influencing Factors in Ecological Barrier Region, Qinghai-Tibet Plateau. J. Hydrol. Reg. Stud. 2022, 42, 101164. [Google Scholar] [CrossRef]
- Zuo, D.; Chen, G.; Wang, G.; Xu, Z.; Han, Y.; Peng, D.; Pang, B.; Abbaspour, K.C.; Yang, H. Assessment of Changes in Water Conservation Capacity under Land Degradation Neutrality Effects in a Typical Watershed of Yellow River Basin, China. Ecol. Indic. 2023, 148, 110145. [Google Scholar] [CrossRef]
- Liu, Y.; Liu, X.; Zhang, B. Spatial Features Analysis of Water Conservation Function in the Hilly Areas of the Loess Plateau Based on InVEST Model. Acta Ecol. Sin. 2020, 40, 6161–6170. [Google Scholar] [CrossRef]
- Vandecasteele, I.; Marí i Rivero, I.; Baranzelli, C.; Becker, W.; Dreoni, I.; Lavalle, C.; Batelaan, O. The Water Retention Index: Using Land Use Planning to Manage Water Resources in Europe. Sustain. Dev. 2018, 26, 122–131. [Google Scholar] [CrossRef]
- Yang, Y.; Yuan, X.; An, J.; Su, Q.; Chen, B. Drivers of Ecosystem Services and Their Trade-Offs and Synergies in Different Land Use Policy Zones of Shaanxi Province, China. J. Clean. Prod. 2024, 452, 142077. [Google Scholar] [CrossRef]
- Cord, A.F.; Bartkowski, B.; Beckmann, M.; Dittrich, A.; Hermans-Neumann, K.; Kaim, A.; Lienhoop, N.; Locher-Krause, K.; Priess, J.; Schröter-Schlaack, C.; et al. Towards Systematic Analyses of Ecosystem Service Trade-Offs and Synergies: Main Concepts, Methods and the Road Ahead. Ecosyst. Serv. 2017, 28, 264–272. [Google Scholar] [CrossRef]
- Shi, M.; Wu, H.; Fan, X.; Jia, H.; Dong, T.; He, P.; Baqa, M.F.; Jiang, P. Trade-Offs and Synergies of Multiple Ecosystem Services for Different Land Use Scenarios in the Yili River Valley, China. Sustainability 2021, 13, 1577. [Google Scholar] [CrossRef]
- Zhong, L.; Wang, J.; Zhang, X.; Ying, L. Effects of Agricultural Land Consolidation on Ecosystem Services: Trade-Offs and Synergies. J. Clean. Prod. 2020, 264, 121412. [Google Scholar] [CrossRef]
- Wang, J.; Yan, S.; Guo, Y.; Li, J.; Sun, G. The Effects of Land Consolidation on the Ecological Connectivity Based on Ecosystem Service Value: A Case Study of Da’an Land Consolidation Project in Jilin Province. J. Geogr. Sci. 2015, 25, 603–616. [Google Scholar] [CrossRef]
- Nosetto, M.D.; Jobbágy, E.G.; Brizuela, A.B.; Jackson, R.B. The Hydrologic Consequences of Land Cover Change in Central Argentina. Agric. Ecosyst. Environ. 2012, 154, 2–11. [Google Scholar] [CrossRef]
- Viglizzo, E.F.; Paruelo, J.M.; Laterra, P.; Jobbágy, E.G. Ecosystem Service Evaluation to Support Land-Use Policy. Agric. Ecosyst. Environ. 2012, 154, 78–84. [Google Scholar] [CrossRef]
- Guo, X.; Zhang, Y.; Guo, D.; Lu, W.; Xu, H. How Does Ecological Protection Redline Policy Affect Regional Land Use and Ecosystem Services? Environ. Impact Assess. Rev. 2023, 100, 107062. [Google Scholar] [CrossRef]
- Jiang, B.; Bai, Y.; Wong, C.P.; Xu, X.; Alatalo, J.M. China’s Ecological Civilization Program–Implementing Ecological Redline Policy. Land Use Policy 2019, 81, 111–114. [Google Scholar] [CrossRef]
- Wang, N.; Hao, J.; Zhang, L.; Duan, W.; Shi, Y.; Zhang, J.; Wusimanjiang, P. Basic Farmland Protection System in China: Changes, Conflicts and Prospects. Agronomy 2023, 13, 651. [Google Scholar] [CrossRef]
- Xu, X.; Tan, Y.; Yang, G.; Barnett, J. China’s Ambitious Ecological Red Lines. Land Use Policy 2018, 79, 447–451. [Google Scholar] [CrossRef]
- Zhou, Y.; Li, X.; Liu, Y. Cultivated Land Protection and Rational Use in China. Land Use Policy 2021, 106, 105454. [Google Scholar] [CrossRef]
- Qie, L.; Pu, L.; Tang, P.; Liu, R.; Huang, S.; Xu, F.; Zhong, T. Gains and Losses of Farmland Associated with Farmland Protection Policy and Urbanization in China: An Integrated Perspective Based on Goal Orientation. Land Use Policy 2023, 129, 106643. [Google Scholar] [CrossRef]
- Qiu, T.; Luo, B.; Li, S.; He, Q. Does the Basic Farmland Preservation Hinder Land Transfers in Rural China? China Agric. Econ. Rev. 2019, 12, 39–56. [Google Scholar] [CrossRef]
- Bai, Y.; Wong, C.P.; Jiang, B.; Hughes, A.C.; Wang, M.; Wang, Q. Developing China’s Ecological Redline Policy Using Ecosystem Services Assessments for Land Use Planning. Nat. Commun. 2018, 9, 3034. [Google Scholar] [CrossRef]
- Chen, Y.; Yao, M.; Zhao, Q.; Chen, Z.; Jiang, P.; Li, M.; Chen, D. Delineation of a Basic Farmland Protection Zone Based on Spatial Connectivity and Comprehensive Quality Evaluation: A Case Study of Changsha City, China. Land Use Policy 2021, 101, 105145. [Google Scholar] [CrossRef]
- Chen, D.; Pan, Y.; Jin, X.; Du, H.; Li, M.; Jiang, P. The Delineation of Ecological Redline Area for Catchment Sustainable Management from the Perspective of Ecosystem Services and Social Needs: A Case Study of the Xiangjiang Watershed, China. Ecol. Indic. 2021, 121, 107130. [Google Scholar] [CrossRef]
- Zhang, Y.; Yang, B.; Liu, Y.; Wu, S.; Cui, Y.; Xu, T. High-Precision Ecological Protection Red Line Boundary Optimization for Fangshan District, Beijing, China. Sens. Mater. 2023, 35, 835. [Google Scholar] [CrossRef]
- Gao, L.; Tao, F.; Liu, R.; Wang, Z.; Leng, H.; Zhou, T. Multi-Scenario Simulation and Ecological Risk Analysis of Land Use Based on the PLUS Model: A Case Study of Nanjing. Sustain. Cities Soc. 2022, 85, 104055. [Google Scholar] [CrossRef]
- Liu, K.; Zhang, C.; Zhang, H.; Xu, H.; Xia, W. Spatiotemporal Variation and Dynamic Simulation of Ecosystem Carbon Storage in the Loess Plateau Based on PLUS and InVEST Models. Land 2023, 12, 1065. [Google Scholar] [CrossRef]
- Liu, X.; Liu, Y.; Wang, Y.; Liu, Z. Evaluating Potential Impacts of Land Use Changes on Water Supply–Demand under Multiple Development Scenarios in Dryland Region. J. Hydrol. 2022, 610, 127811. [Google Scholar] [CrossRef]
- Xiong, M.; Li, F.; Liu, X.; Liu, J.; Luo, X.; Xing, L.; Wang, R.; Li, H.; Guo, F. Characterization of Ecosystem Services and Their Trade-Off and Synergistic Relationships under Different Land-Use Scenarios on the Loess Plateau. Land 2023, 12, 2087. [Google Scholar] [CrossRef]
- Cui, L.; Tang, W.; Zheng, S.; Singh, R.P. Ecological Protection Alone Is Not Enough to Conserve Ecosystem Carbon Storage: Evidence from Guangdong, China. Land 2023, 12, 111. [Google Scholar] [CrossRef]
- Sang, L.; Zhang, C.; Yang, J.; Zhu, D.; Yun, W. Simulation of Land Use Spatial Pattern of Towns and Villages Based on CA–Markov Model. Math. Comput. Model. 2011, 54, 938–943. [Google Scholar] [CrossRef]
- Wang, S.Q.; Zheng, X.Q.; Zang, X.B. Accuracy Assessments of Land Use Change Simulation Based on Markov-Cellular Automata Model. Procedia Environ. Sci. 2012, 13, 1238–1245. [Google Scholar] [CrossRef]
- Jiang, W.; Chen, Z.; Lei, X.; Jia, K.; Wu, Y. Simulating Urban Land Use Change by Incorporating an Autologistic Regression Model into a CLUE-S Model. J. Geogr. Sci. 2015, 25, 836–850. [Google Scholar] [CrossRef]
- Pijanowski, B.C.; Brown, D.G.; Shellito, B.A.; Manik, G.A. Using Neural Networks and GIS to Forecast Land Use Changes: A Land Transformation Model. Comput. Environ. Urban Syst. 2002, 26, 553–575. [Google Scholar] [CrossRef]
- Lin, W.; Sun, Y.; Nijhuis, S.; Wang, Z. Scenario-Based Flood Risk Assessment for Urbanizing Deltas Using Future Land-Use Simulation (FLUS): Guangzhou Metropolitan Area as a Case Study. Sci. Total Environ. 2020, 739, 139899. [Google Scholar] [CrossRef]
- Zhang, Y.; Yu, P.; Tian, Y.; Chen, H.; Chen, Y. Exploring the Impact of Integrated Spatial Function Zones on Land Use Dynamics and Ecosystem Services Tradeoffs Based on a Future Land Use Simulation (FLUS) Model. Ecol. Indic. 2023, 150, 110246. [Google Scholar] [CrossRef]
- Wang, Q.; Guan, Q.; Sun, Y.; Du, Q.; Xiao, X.; Luo, H.; Zhang, J.; Mi, J. Simulation of Future Land Use/Cover Change (LUCC) in Typical Watersheds of Arid Regions under Multiple Scenarios. J. Environ. Manag. 2023, 335, 117543. [Google Scholar] [CrossRef]
- Liang, X.; Guan, Q.; Clarke, K.C.; Liu, S.; Wang, B.; Yao, Y. Understanding the Drivers of Sustainable Land Expansion Using a Patch-Generating Land Use Simulation (PLUS) Model: A Case Study in Wuhan, China. Comput. Environ. Urban Syst. 2021, 85, 101569. [Google Scholar] [CrossRef]
- Wang, J.; Zhang, J.; Xiong, N.; Liang, B.; Wang, Z.; Cressey, E.L. Spatial and Temporal Variation, Simulation and Prediction of Land Use in Ecological Conservation Area of Western Beijing. Remote Sens. 2022, 14, 1452. [Google Scholar] [CrossRef]
- Cong, W.; Sun, X.; Guo, H.; Shan, R. Comparison of the SWAT and InVEST Models to Determine Hydrological Ecosystem Service Spatial Patterns, Priorities and Trade-Offs in a Complex Basin. Ecol. Indic. 2020, 112, 106089. [Google Scholar] [CrossRef]
- Li, M.; Liang, D.; Xia, J.; Song, J.; Cheng, D.; Wu, J.; Cao, Y.; Sun, H.; Li, Q. Evaluation of Water Conservation Function of Danjiang River Basin in Qinling Mountains, China Based on InVEST Model. J. Environ. Manag. 2021, 286, 112212. [Google Scholar] [CrossRef] [PubMed]
- Yan, F.; Shangguan, W.; Zhang, J.; Hu, B. Depth-to-Bedrock Map of China at a Spatial Resolution of 100 Meters. Sci. Data 2020, 7, 2. [Google Scholar] [CrossRef]
- Yang, J.; Xie, B.; Zhang, D. Spatio-Temporal Variation of Water Yield and Its Response to Precipitation and Land Use Change in the Yellow River Basin Based on InVEST Model. Chin. J. Appl. Ecol. 2020, 31, 2731–2739. [Google Scholar] [CrossRef]
- Yu, C.; Huang, X.; Guo, Q.; Yang, Y.; Xu, Z. Predicting Water Ecosystem Services under Prospective Climate and Land-Use Change Scenarios in Typical Watersheds Distributed across China. Ecol. Indic. 2024, 159, 111744. [Google Scholar] [CrossRef]
- Bao, Y.; Li, T.; Liu, H.; Ma, T.; Wang, H.; Liu, K.; Shen, X.; Liu, X. Spatial and Temporal Changes of Water Conservation of Loess Plateau in Northern Shaanxi Province by InVEST Model. Geogr. Res. 2016, 35, 664–676. [Google Scholar] [CrossRef]
- Chen, S. Evaluation of Ecological Service Function of Water Retention and Soil Conservation in Water Source Area for the South-to-North Water Transfer: A Case Study in Shangluo City. Ph.D. Thesis, Northwest University, Xi’an, China, 2016. [Google Scholar]
- Xu, H.; Zhao, C.; Wang, X.; Chen, S.; Shan, S.; Chen, T.; Qi, X. Spatial Differentiation of Determinants for Water Conservation Dynamics in a Dryland Mountain. J. Clean. Prod. 2022, 362, 132574. [Google Scholar] [CrossRef]
- Zan, B.; Ge, J.; Mu, M.; Sun, Q.; Luo, X.; Wei, J. Spatiotemporal Inequality in Land Water Availability Amplified by Global Tree Restoration. Nat. Water 2024, 1–12. [Google Scholar] [CrossRef]
- Qianwen, C.; Penghui, J.; Lingyan, C.; Jinxia, S.; Yunqian, Z.; Liyan, W.; Manchun, L.; Feixue, L.; Axing, Z.; Dong, C. Delineation of a Permanent Basic Farmland Protection Area around a City Centre: Case Study of Changzhou City, China. Land Use Policy 2017, 60, 73–89. [Google Scholar] [CrossRef]
- Wang, Z.; Wu, J.; Bai, S.; Wang, H.; Chen, Y. Evaluation of Cultivated Land Fragmentation and Land Consolidation Engineering Zoning in the Loess Hilly and Gully Region: A Case Study in Wuqi County. Res. Soil Water Conserv. 2022, 29, 300–307. [Google Scholar]
- He, J.; Bai, H.; Wang, J.; Xu, Y.; Ni, L. Spatial Patterns and Driving Factors of Soil Nutrient Contents in Cultivated Lands Across Various Topographical Types in the Loess Plateau. Res. Soil Water Conserv. 2024, 31, 1–11. [Google Scholar] [CrossRef]
- Xu, Q.; Yang, G.; Gu, W.; Xie, T.; Liu, R. Estimation of Potential Productivity over Arable Land in Shaanxi Province of West China. Remote Sens. Inf. 2017, 32, 141–151. [Google Scholar]
- Gong, S.; Xiao, Y.; Fang, Y.; Zheng, H.; Xiao, Y.; Ouyang, Z. Forest Ecosystem Surface Run-off Regulation Characteristics in China. Acta Ecol. Sin. 2016, 36, 7472–7478. [Google Scholar]
- Kong, W.; Zhou, B.; Fu, M.; Li, Z.; Xie, J.; Wu, M. Effects of Different Land-Use on Characteristics of Soil and Water Conservation. Joumal Nanjng For. Univ. (Nat. Sci. Ed.) 2009, 33, 57–61. [Google Scholar]
- Jiang, C.; Zhang, H.; Wang, X.; Feng, Y.; Labzovskii, L. Challenging the Land Degradation in China’s Loess Plateau: Benefits, Limitations, Sustainability, and Adaptive Strategies of Soil and Water Conservation. Ecol. Eng. 2019, 127, 135–150. [Google Scholar] [CrossRef]
- Li, B.; Zhang, W.; Li, S.; Wang, J.; Liu, G.; Xu, M. Severe Depletion of Available Deep Soil Water Induced by Revegetation on the Arid and Semiarid Loess Plateau. For. Ecol. Manag. 2021, 491, 119156. [Google Scholar] [CrossRef]
- Ge, F. The Water Conservation Function of Typical Artificial Vegetation on the Loess Plateau of China. Ph.D. Thesis, Northwest A&F University, Xianyang, China, 2023. [Google Scholar]
- Mei, X.; Ma, L.; Zhu, Q.; Wang, S.; Zhang, D.; Wang, Y. Responses of Soil Moisture to Vegetation Restoration Type and Slope Length on the Loess Hillslope. J. Mt. Sci. 2018, 15, 548–562. [Google Scholar] [CrossRef]
- Liu, Y.; Dunkerley, D.; López-Vicente, M.; Shi, Z.-H.; Wu, G.-L. Trade-off between Surface Runoff and Soil Erosion during the Implementation of Ecological Restoration Programs in Semiarid Regions: A Meta-Analysis. Sci. Total Environ. 2020, 712, 136477. [Google Scholar] [CrossRef]
Disclaimer/Publisher’s Note: The statements, opinions and data contained in all publications are solely those of the individual author(s) and contributor(s) and not of MDPI and/or the editor(s). MDPI and/or the editor(s) disclaim responsibility for any injury to people or property resulting from any ideas, methods, instructions or products referred to in the content. |
© 2024 by the authors. Licensee MDPI, Basel, Switzerland. This article is an open access article distributed under the terms and conditions of the Creative Commons Attribution (CC BY) license (https://creativecommons.org/licenses/by/4.0/).