Article

Leveraging Geospatial Information to Map Perceived Tenure Insecurity in Urban Deprivation Areas

by
Esaie Dufitimana
1,2,
Jiong Wang
3 and
Divyani Kohli-Poll Jonker
3,*
1
Research and Innovation Centre, African Institute for Mathematical Sciences (AIMS), Kigali P.O. Box 6428, Rwanda
2
Department of Computer Science, School of Information Communication Technology, College of Science and Technology, University of Rwanda, Kigali P.O. Box 4285, Rwanda
3
Faculty of Geo-Information Science and Earth Observation (ITC), University of Twente, 7522 NB Enschede, The Netherlands
*
Author to whom correspondence should be addressed.
Land 2024, 13(9), 1429; https://doi.org/10.3390/land13091429
Submission received: 15 July 2024 / Revised: 26 August 2024 / Accepted: 27 August 2024 / Published: 4 September 2024
(This article belongs to the Special Issue Digital Earth and Remote Sensing for Land Management)

Abstract

:
Increasing tenure security is essential for promoting safe and inclusive urban development and achieving Sustainable Development Goals. However, assessment of tenure security relies on conventional census and survey statistics, which often fail to capture the dimension of perceived tenure insecurity. This perceived tenure insecurity is crucial as it influences local engagement and the effectiveness of policies. In many regions, particularly in the Global South, these conventional methods lack the necessary data to adequately measure perceived tenure insecurity. This study first used household survey data to derive variations in perceived tenure insecurity and then explored the potential of Very-High Resolution (VHR) satellite imagery and spatial data to assess these variations in urban deprived areas. Focusing on the city of Kigali, Rwanda, the study collected household survey data, which were analysed using Multiple Correspondence Analysis to capture variations of perceived tenure insecurity. In addition, VHR satellite imagery and spatial datasets were analysed to characterize urban deprivation. Finally, a Random Forest regression model was used to assess the relationship between variations of perceived tenure insecurity and the spatial characteristics of urban deprived areas. The findings highlight the potential of geospatial information to estimate variations in perceived tenure insecurity within urban deprived contexts. These insights can inform evidence-based decision-making by municipalities and stakeholders in urban development initiatives.

1. Introduction

The rapid growth of urban populations has placed significant pressure on the capacities of developing countries to adequately plan and provide essential services for their urban inhabitants [1]. This phenomenon has been exacerbated by the failure to implement inclusive urban redevelopment policies, leading to spatial injustices particularly predominant in the Global South, where approximately 1 billion urban dwellers reside in urban deprived areas commonly known as slums and informal settlements [2,3]. These deprived areas are often characterized by substandard socio-economic and physical living conditions, including inadequate infrastructure, poor housing, overcrowding, poverty, social exclusion, and tenure insecurity [4,5].
One of the challenges threatening residents of such urban deprived areas is tenure insecurity. This insecurity arises when individuals’ rights to land and property are not adequately recognized or protected, particularly in the face of disputes or conflicts [6], increasing vulnerability to evictions and other forms of displacement [7]. To gain a deeper understanding of tenure insecurity, it is important to explore these three interconnected forms: De jure (legal), de facto, and perceived tenure security. De jure (legal) tenure security is achieved through formal means, such as titles or certificates of ownership, which theoretically guarantee property rights [5]. De facto tenure security, on the other hand, refers to the actual recognition and acceptance of these property rights within the social and political context. It encompasses various informal factors, such as paying property taxes, utility bills, and the length of property occupation, which contribute to the social acknowledgment of property rights [6,7]. Perceived tenure security represents the subjective experience and feeling of security or insecurity related to one’s property rights. This form of tenure security reflects an individual’s assessment of the risk of losing their land or property, influenced by personal experiences, trust in the legal system, and broader socio-economic factors [8]. The feeling of tenure insecurity is linked to the likelihood of losing land or property without someone’s willingness and is regarded as perceived tenure insecurity [8]. This feeling is commonly induced by the unfair distribution of urban resources to all urban dwellers, which results in unequal access to resources and opportunities for dwellers of urban deprived areas [9]. Thus, perceived tenure insecurity reflects a threat to the injustice that may arise due to events like eviction or displacement of urban inhabitants living in deprived areas.
This study focused on perceived tenure security because firstly, it emphasizes the subjective experience and feeling of tenure insecurity among residents, regardless of their actual legal status such as holding of legally recognized land and property documents [10]. This subjectivity influences the behaviour and decisions that residents make to invest and improve in their land and properties, and neighbourhoods, even if their legal tenure is secure. Secondly, it provides a critical assessment of how effective legal and institutional frameworks are at making residents feel secure. This is due to the existence of robust legal systems (mostly the global south countries) that theoretically protects tenure rights, but their people feel insecure because of gradual loss of their land and properties, and the legal procedures fail to protect them as theoretically intended [11]. Thus, perceived insecurity is crucial for highlighting the gaps between the legal systems and their implementations or enforcement. Additionally, by focusing on perceived insecurity, policies can be more inclusive and considerate of minority or marginalized groups who might feel particularly vulnerable due to past injustices or lack of formal recognition by mainstream legal systems [12].
Addressing tenure insecurity, particularly among poor and vulnerable groups, is essential for advancing the Sustainable Development Goals (SDGs). This is explicitly outlined in goal 1, target 1.4, which aims to ensure that all men and women, particularly the poor and vulnerable, have equal rights to ownership and control over land and other forms of property, and is also highlighted in goal 11, which focuses on making cities and human settlements inclusive, safe, resilient, and sustainable [13]. However, obtaining comprehensive data on urban deprivation, including tenure status, remains a difficult challenge. While household surveys and census are believed to serve as standard methods for gathering socio-economic data, including tenure status, they are often time-consuming, expensive, hard to keep up-to-date [14], and insufficiently responsive to the dynamic nature of urban deprived areas [5]. Moreover, most surveys do not consider the information about tenure status of people, especially inhabitants living in deprived areas. Consequently, little attention has been paid to perceived tenure insecurity in urban deprived areas.
Recent advancements in Earth observation and geospatial technologies, coupled with sophisticated machine learning methodologies, offer promising avenues for capturing the physical characteristics of deprived areas, which in turn reflect the socio-economic status of their inhabitants [15,16]. Nevertheless, the incorporation of tenure status into conceptualizations of deprivation remains limited due to data constraints. Despite assertions regarding the potential of Earth observation and geospatial data to serve as an alternative data source for understanding urban deprivation, its application to understand more detailed aspects of urban deprivation, especially perceived tenure insecurity has been underexplored. Additionally, the variation of perceived tenure insecurity within urban deprived areas, and its association with urban deprivation deserves further investigation.
Therefore, this research seeks to leverage the potential of Very High Resolution (VHR) satellite image-based information and supplementary spatial data, alongside traditional survey data, to measure and understand variations in perceived tenure insecurity within urban deprived areas. The study focused on the city of Kigali, Rwanda, as a representative case study in the Global South, whereby the implementation land tenure regularization program is recognized to have improved tenure security [17,18,19]. The city of Kigali is also known for its success in the implementation of urban redevelopment schemes such as master plan. For instance, the city is currently known as one of the greenest and cleanest cities in Africa [20]. However, these schemes are criticized for threatening tenure security for urban deprived areas dwellers [21,22,23], despite a generally assumption that tenure security has improved due to the Land Tenure Regularization program [24]. This brought attention to a broad concern that land registration and titling are not always the solution to tenure insecurity, especially for vulnerable people living in urban deprived areas [25]. Therefore, it is worth exploring the potential of Very-High Resolution images and spatial data to understand variation of perceived tenure insecurity across deprived areas to fill existing gaps in understanding and address the complexities of tenure insecurity in deprived urban contexts.

2. Materials and Methods

2.1. The Study Area

The study was conducted in Kigali, the capital city of Rwanda, located in the eastern region of Africa. The city has three administrative districts, Gasabo, Kicukiro and Nyarugenge [26]. This study focuses on three distinct research sites within the city of Kigali: Gitega and Kimisagara in Nyarugenge district, and Gatsata in Gasabo district, as highlighted in Figure 1. These sites were purposively selected for their representation of urban deprivation and because of three main reasons: Firstly, these areas are officially designated as informal settlements, exhibiting typical characteristics of deprived urban spaces such as high building density and limited access to infrastructure [27]. Secondly, they have been identified as priority zones for urban redevelopment initiatives aligned with the city’s master plan [28]. Lastly, each site encompasses diverse topographical features, including steep slopes in Kimisagara, low-lying terrain with proximity to ditches in Gitega, and a combination of wetland and steep slopes in Gatsata. This variation in topography provides an opportunity to examine how geographical features contribute to the perceived tenure insecurity across the study area.
In the study area, tenure insecurity is high due to the legality issues of informal settlements targeted by the city’s Master Plan for safety reasons, often without compensation for demolitions on government-owned land [20]. Despite many dwellers possessing land titles, the implementation of the Master Plan raises concerns about fair compensation and suitable relocation, as evidenced by legal disputes and perceived unsuitability of provided compensation properties [21,23].

2.2. Data

2.2.1. Household Survey Data

Reliable data on perceived tenure insecurity within the study area were exclusively sourced from household surveys, as such information was not accessible through the National Institute of Statistics of Rwanda or other institutions. Household survey data were gathered through interviews conducted with representatives from 120 households. The survey was designed based on a comprehensive review of literature, summarizing key indicators of perceived tenure insecurity as shown in Table A1 (Appendix A). Structured and open-ended questions were employed, tailored to elicit responses from participants. For instance, participants were asked to judge the likelihood of losing their land and/or properties (rights) within the next five years, as well as to provide insights into the physical conditions of their properties and neighbourhoods. Moreover, questions were framed to solicit justifications for respondents’ answers, thereby ensuring the validity and reliability of the data collected. The survey instrument facilitated the capture of multifaceted information, encompassing the physical environment of the neighbourhood and respondents’ properties, tenure rights of households, and perceptions regarding tenure insecurity. This holistic approach allowed for a comprehensive understanding of the factors contributing to perceived tenure insecurity within the study area.

2.2.2. Very High-Resolution Satellite Imagery and Spatial Data

In addition to survey data, the research utilized VHR imagery of Kigali city. The image was downloaded using the SAS Planet, a free and open tool developed by SAS Group (Russia) for downloading high-resolution satellite images from Google Earth (GE) (http://www.sasgis.org/sasplaneta/, accessed on 23 February 2021) as a set of mosaic and mostly cloud-free image tiles captured between 2019 and 2020 (see detailed information at https://developers.google.com/maps/documentation/tile/satellite, accessed on 23 February 2021). The image was downloaded with enough zoom level similar to VHR imagery with sub-meter pixel size (50 cm resolution) and included visible bands of Red, Green, and Blue. While the quality of free VHR GE imagery may be relatively lower compared to commercially available options, its accessibility provides a distinct advantage, particularly for areas and cities with limited resources for purchasing standard VHR satellite images. Furthermore, supplementary spatial information was integrated into the analysis to augment the understanding of spatial characteristics of deprived areas. This included data on slope and zoning plans sourced from the National Land Authority, and road networks from OpenStreetMap. These additional geospatial datasets were selected based on insights gleaned from survey data regarding the factors influencing respondents’ perceptions of tenure insecurity.

2.3. Methods

2.3.1. Overall Workflow

The entire process consisted of three main steps, as depicted in Figure 2. The initial step, captured in blue on the left side of the figure, involved analysing household data to identify variations of perceived tenure insecurity using Multiple Correspondence Analysis (MCA). The following step, in green on the right side of the figure, integrated VHR satellite imagery with additional geospatial datasets to spatially characterize urban deprivation. The final step, on bottom in orange, involved examining the relationship between the variations of perceived tenure insecurity and the spatial characteristics of urban deprivation using Random Forest regression model.

2.3.2. Characterising the Variation of Perceived Tenure Insecurity from Survey Data

Multiple Correspondence Analysis (MCA) was employed to analyze survey data and derive a perceived tenure insecurity index for each respondent. MCA was chosen for its effectiveness in visualizing categorical variables within a dimensional space [29,30], and its previous applications in constructing deprivation indices for slum identification in India and wealth indices in South African urban informal settlements city [31,32]. The MCA was used to calculate an index from survey responses, which was later connected to spatial characteristics of deprived areas retrieved from VHR imagery and other spatial data.
In addition, hierarchical clustering techniques were applied to the perceived tenure insecurity indices, resulting in four distinct clusters: very high, high, moderate, and low. This method, useful for identifying patterns based on unsupervised classification, constructs clusters from top to bottom [33]. The study evaluated the significance of indicators characterizing these clusters using p-values, where a small p-value suggests significant results, and test statistics, where a value above 2 indicates high discriminatory power [34]. This approach helped identify variables effectively distinguishing between clusters. The first two dimensions from MCA were used to understand the underlying data structure and identify clusters through visualization [35]. The implementation was done in R (RStudio) version 3.6.3.

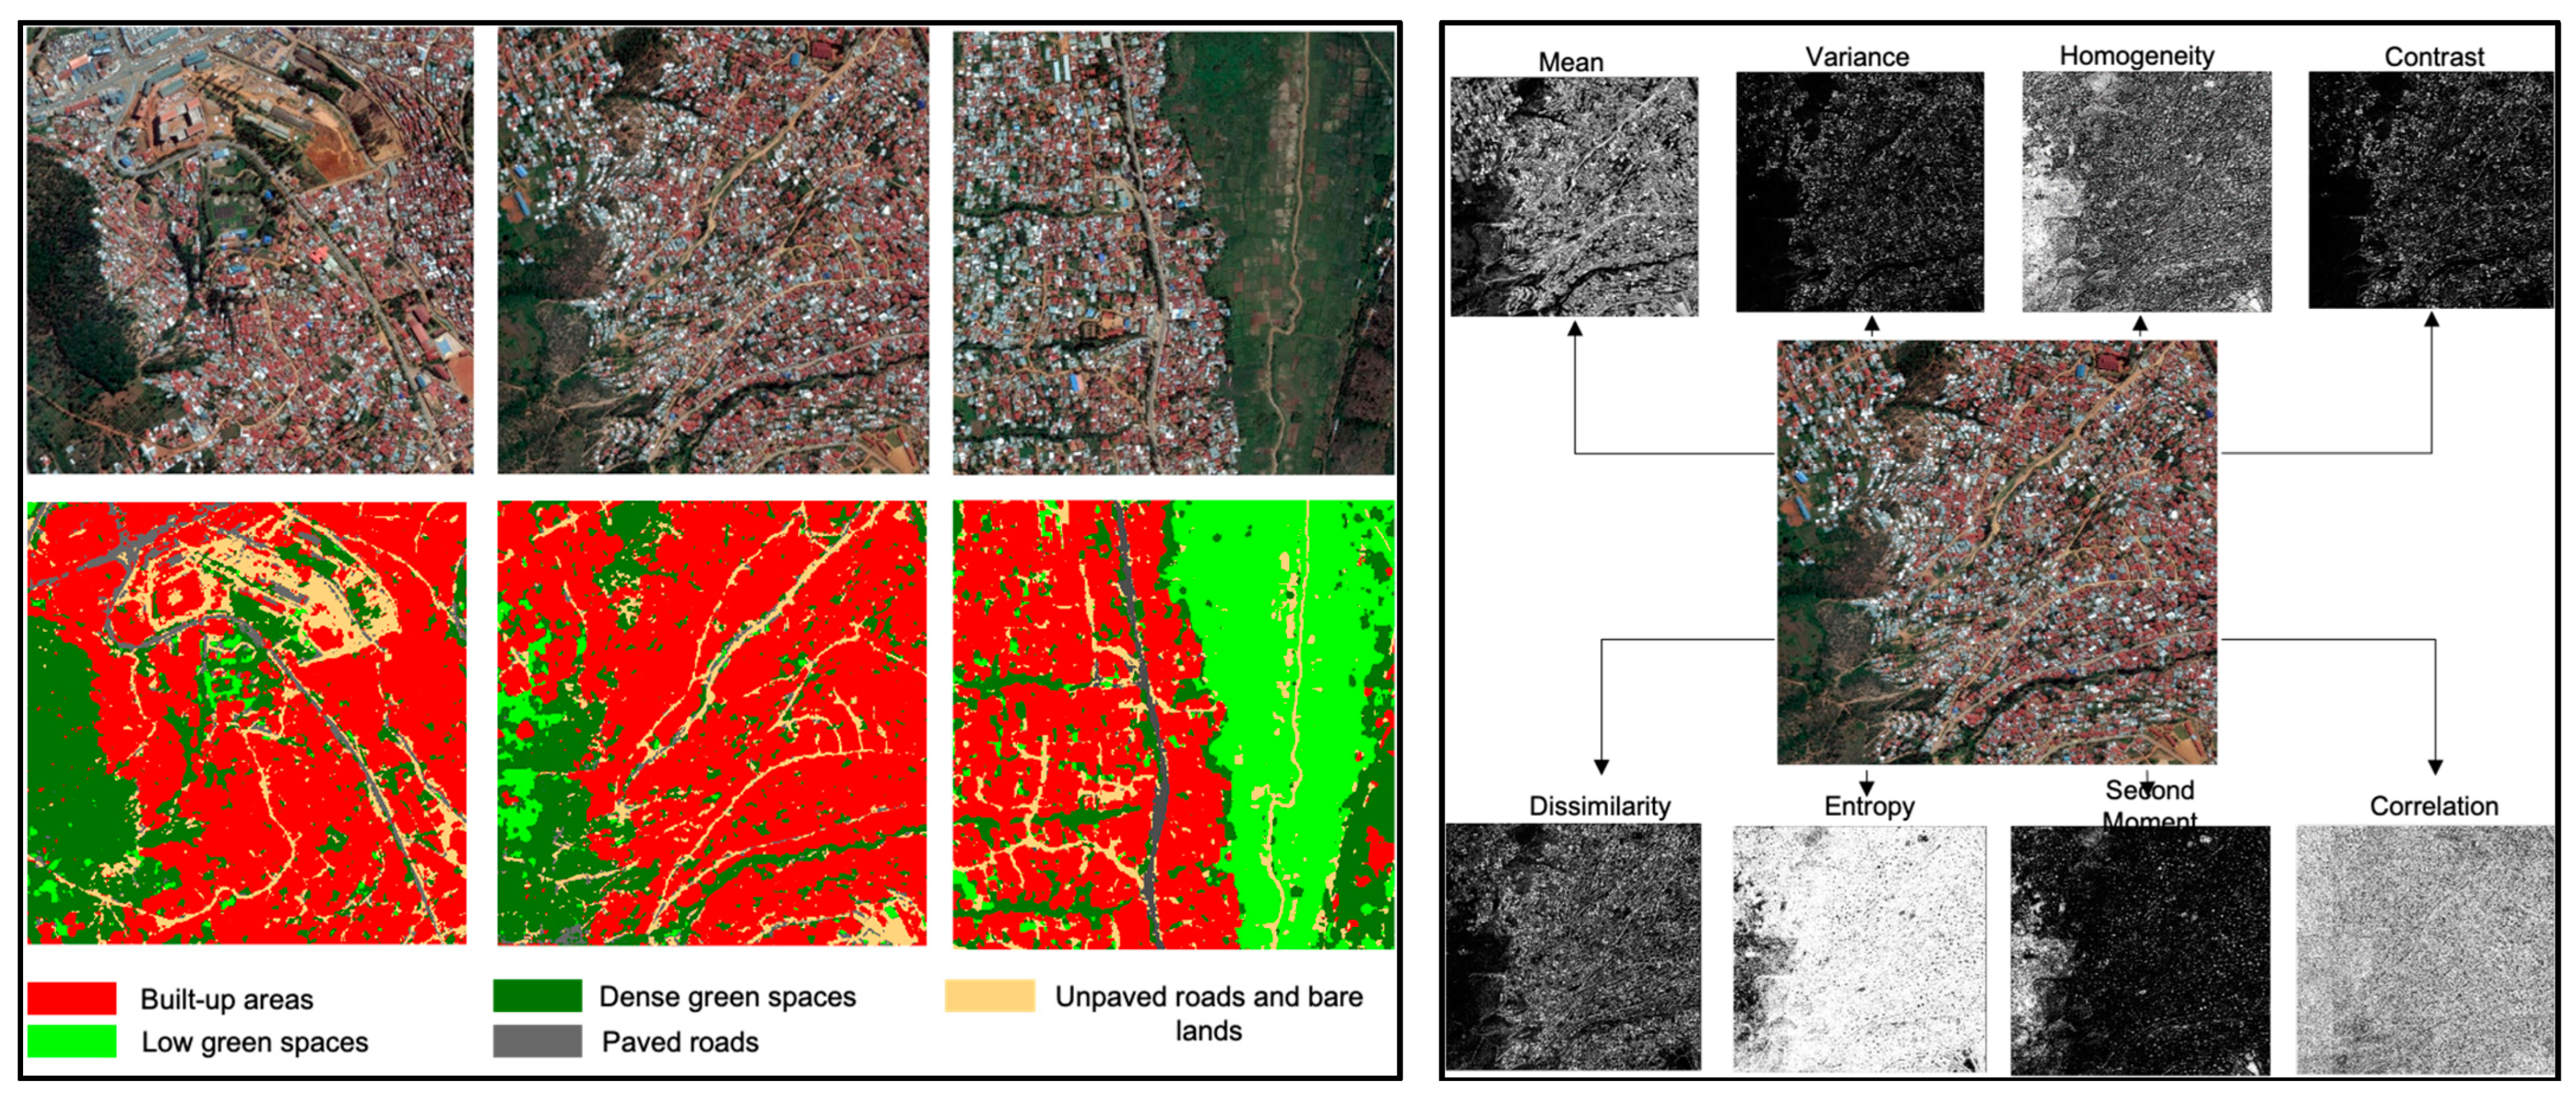
2.3.3. Extracting Spatial Characteristics of the Deprived Area in the Study Area

A Convolutional Neural Network (CNN) with a U-Net architecture was used to extract land cover characteristics from VHR images, leveraging the ArcGIS API for Python. This pre-established model allowed the study to focus on variations in perceived tenure insecurity and their correlations with spatial characteristics rather than developing a new model from scratch. Training data were manually collected and superimposed onto VHR images to extract six land cover classes: Built-up area, Low green space, Dense green space, Paved roads, Unpaved roads, and bare lands. The model was trained on different patch sizes (64 × 64, 128 × 128, 256 × 256 pixels) with a learning rate of 0.001 over 100 epochs, and evaluated using precision, recall, and F1-Score metrics [36,37]. Texture features were extracted to complement land cover information and address VHR image quality limitations. The Grey-Level Co-occurrence Matrix (GLCM) method, effective in capturing texture information, was used to extract eight texture variables: contrast, correlation, dissimilarity, entropy, homogeneity, mean, second moment, and variance, following the methodologies employed in previous studies such as [38,39]. The implementation was conducted using ENVI software version 4.8.
Additional spatial data, such as slope, zoning information, and access to transportation facilities, were incorporated to enrich spatial characterization. Buffer zones of varying sizes (10, 15, 20, 25 m) around each household location were delineated to compute percentages of land cover types, texture features, and other spatial attributes. This approach, similar to methodologies used in previous studies on wealth index modelling and demographic and health survey point displacement influence [40,41], facilitated comprehensive spatial environment characterization for each respondent. Thus, the approach facilitated the comprehensive characterization of the spatial environment surrounding each respondent. Putting all together, the study obtained variables used for measuring/predicting variation of perceived tenure insecurity highlighted in Table 1.

2.3.4. Relating Spatial Characteristics of the Deprived Area to Perceived Tenure Security

To establish the relationship between various spatial characteristics of deprived areas and perceived tenure insecurity, a Random Forest regression model was employed. This model was chosen due to its suitability for handling complex, non-linear relationships in datasets [40]. Random Forest, a tree-based and non-parametric supervised machine learning algorithm, was selected for its resilience to overfitting and its capacity to handle multi-collinear datasets overfitting [42,43]. Additionally, the model offers a relatively low number of hyper-parameters for optimization and can function effectively as both a classifier and regressor. Consequently, Random Forest was utilized to analyse the association between extracted spatial characteristics and variations in perceived tenure insecurity.

3. Results

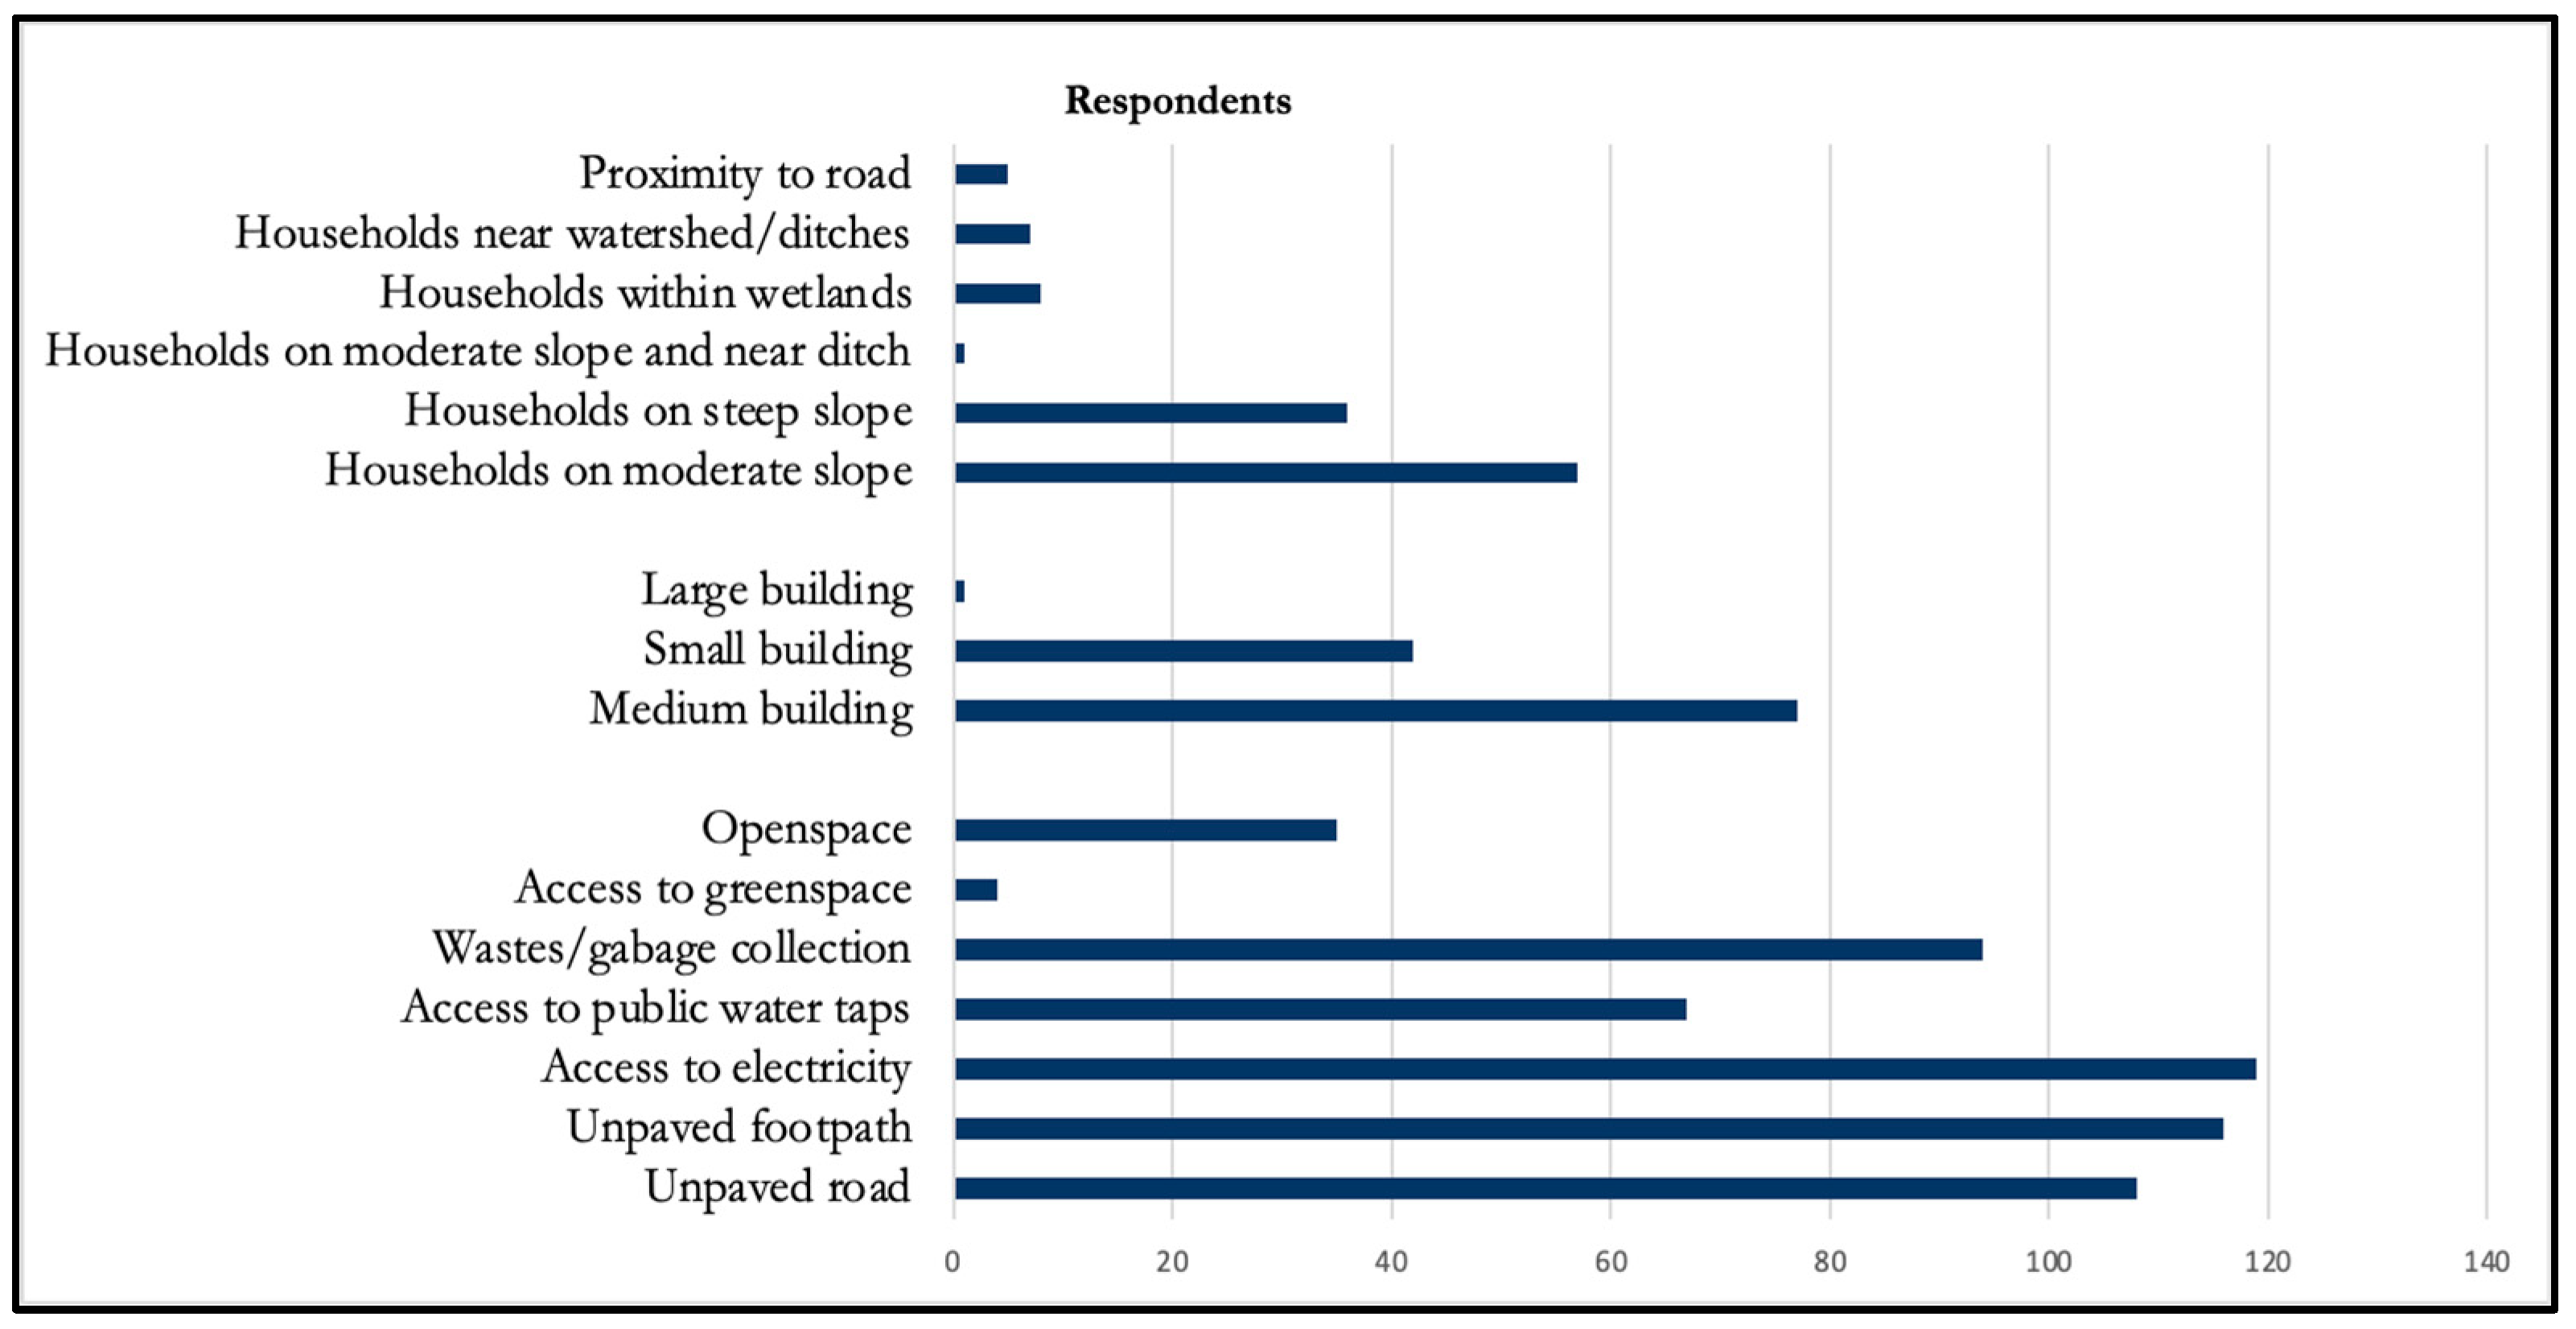
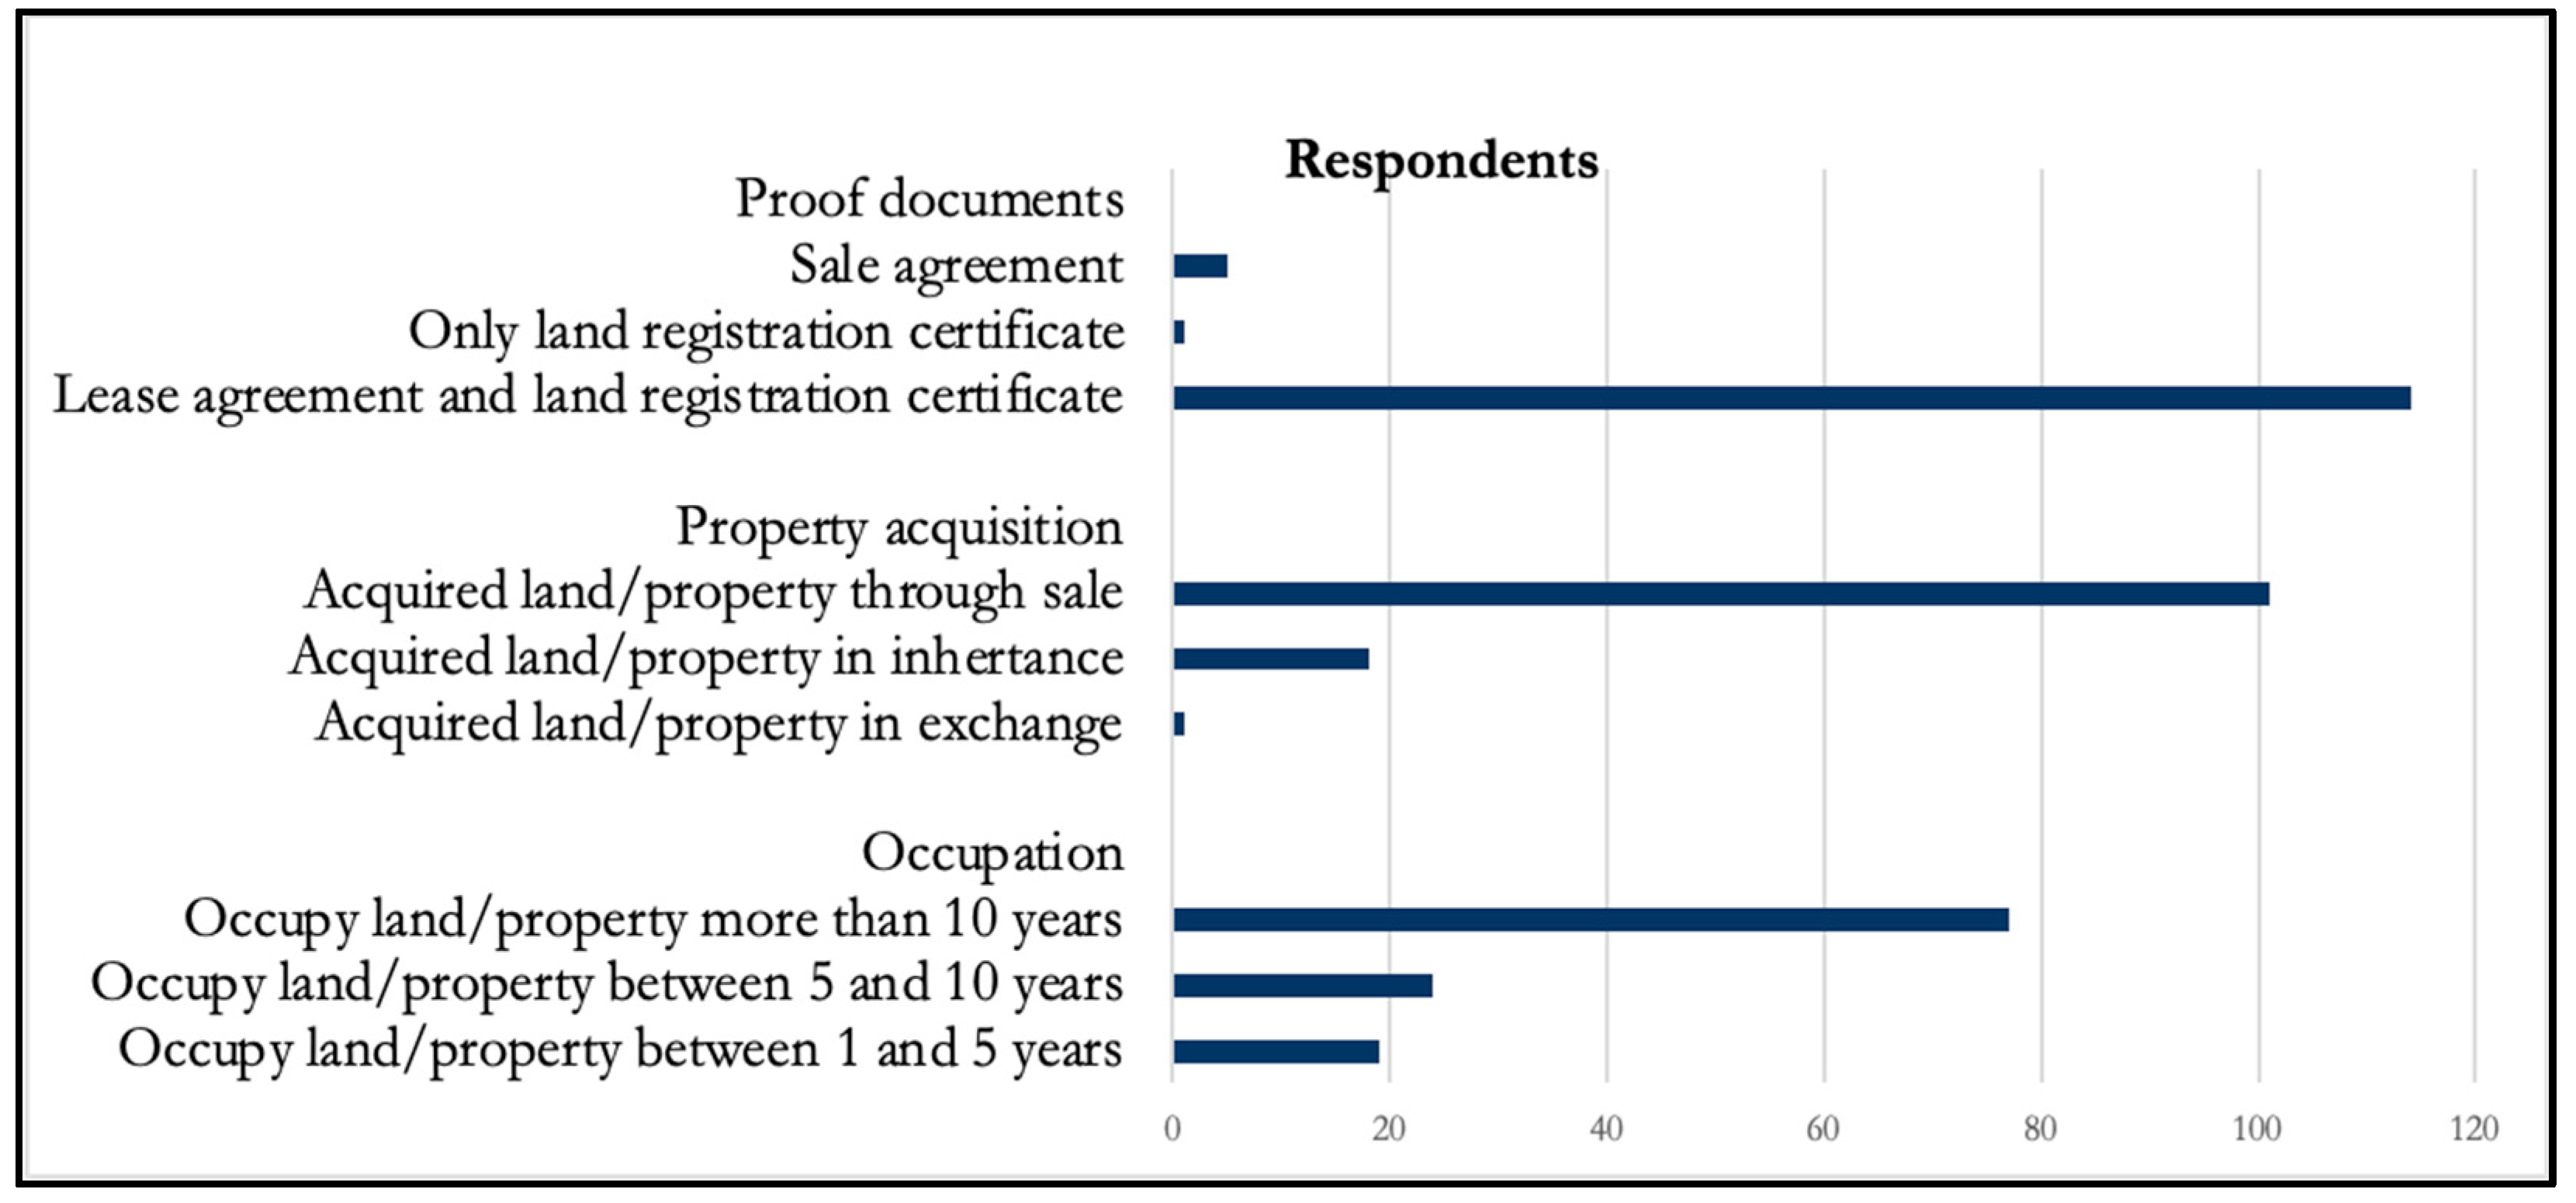
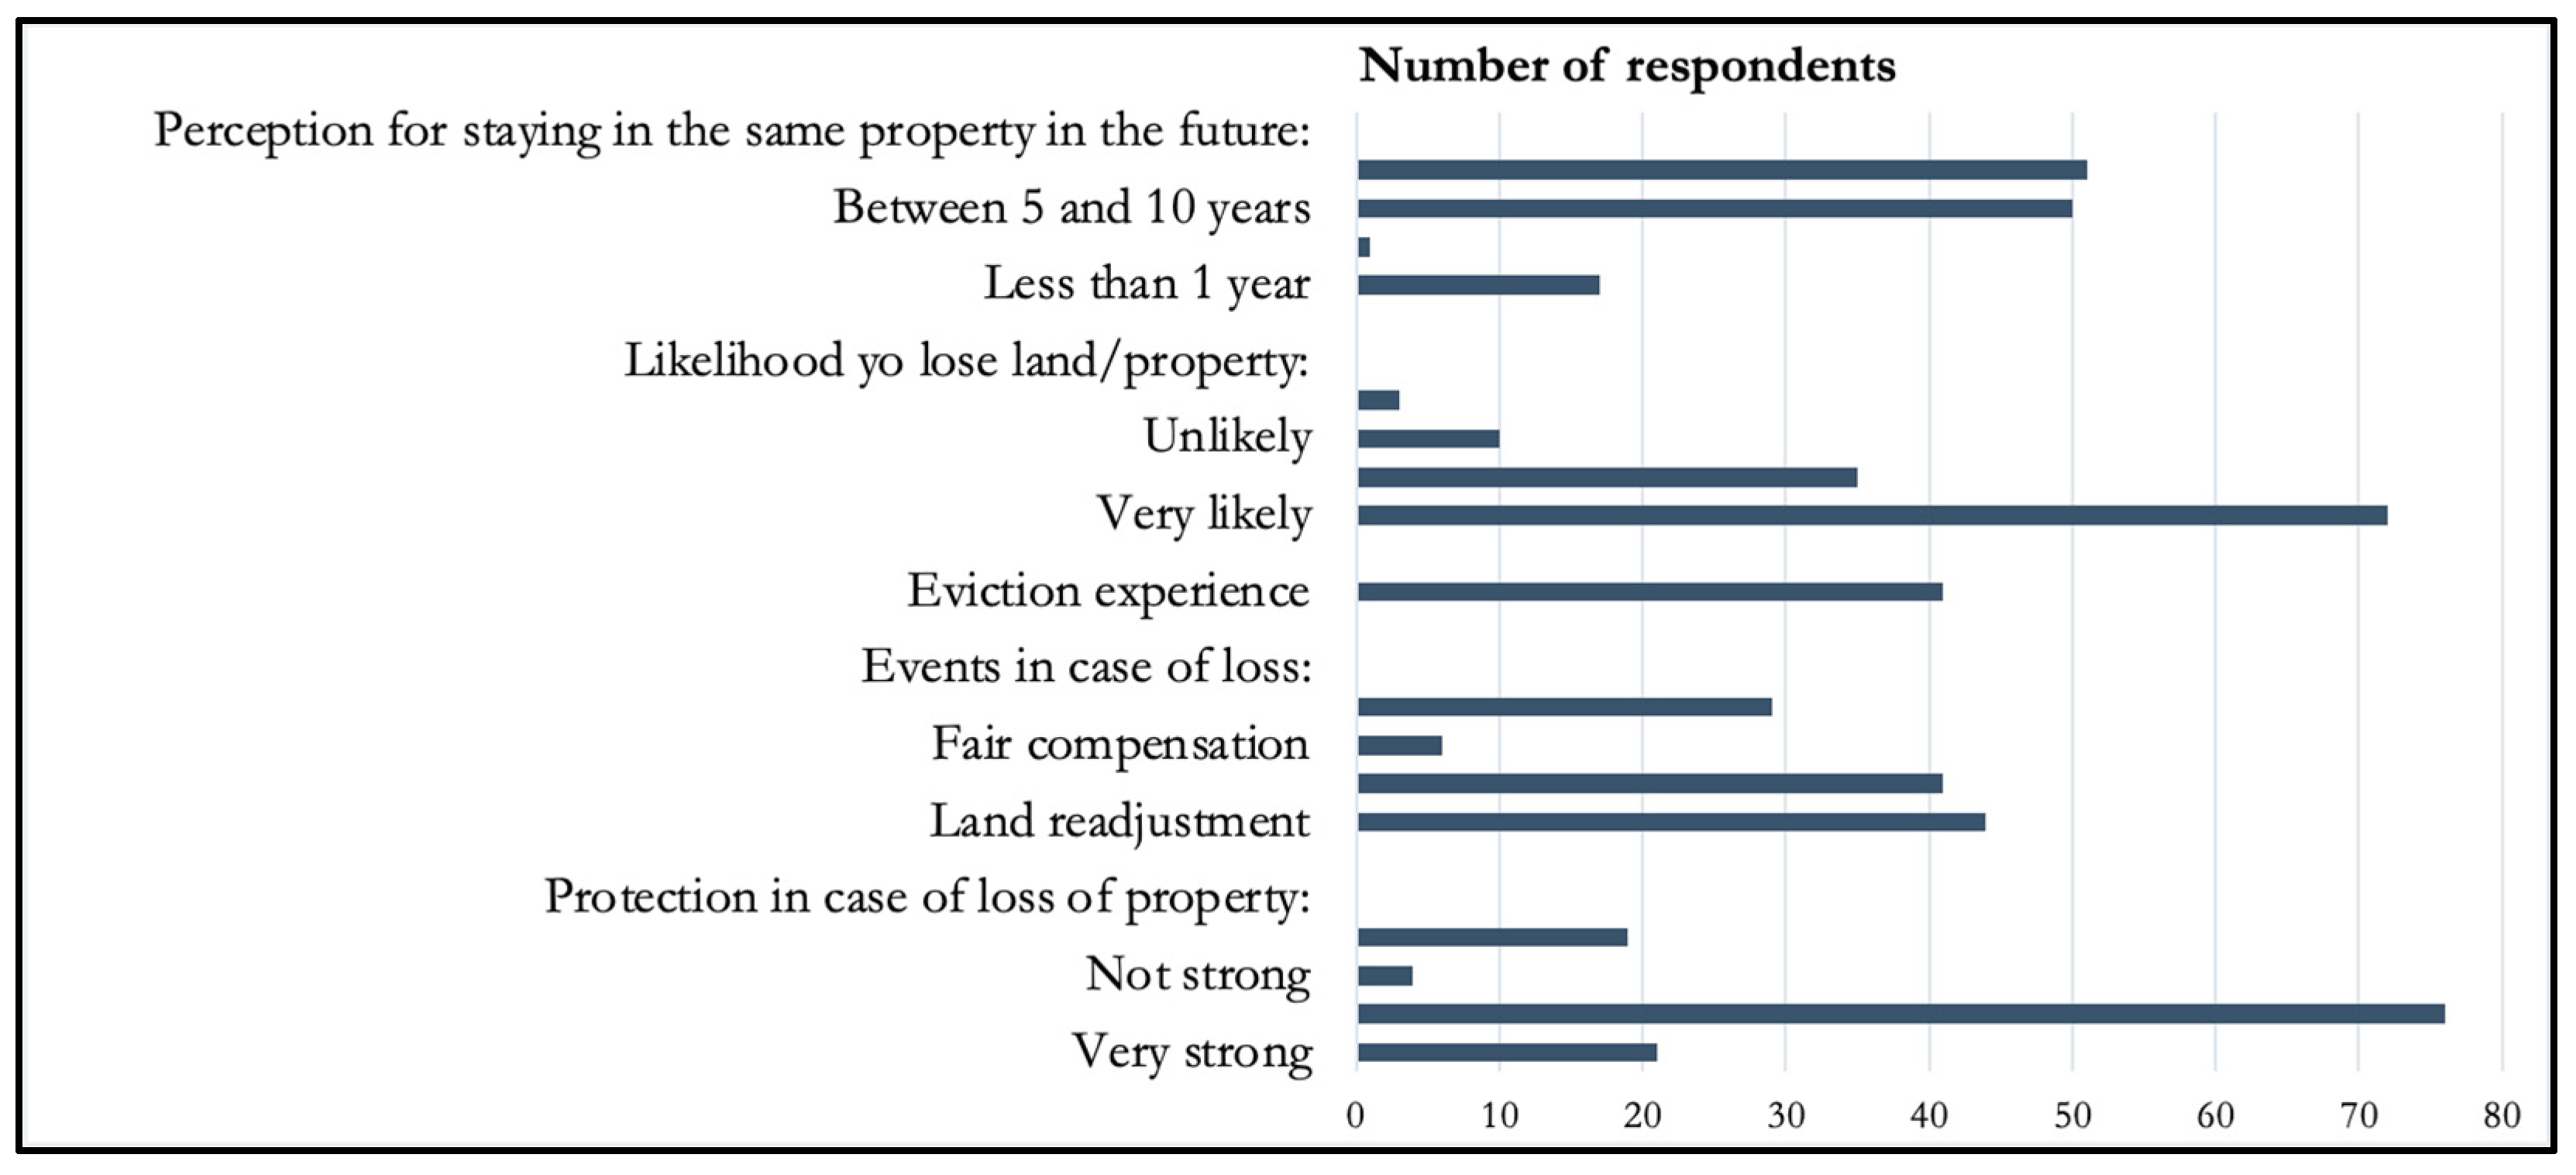
3.1. Overview of Survey Results

The detailed household data from 120 households collected from the study area contained data about the physical environment of the neighbourhoods (Figure 3) and households (Figure 4), and data about the tenure rights (Figure 5) and perceptions of household respondents on tenure insecurity (Figure 6).
The Figure 3 depicts characteristics of physical environment of neigborhoods across the study sites based on their overall households’ characteristics and access to various amenities. Most households are situated on moderate slopes, with fewer on steep slopes and within wetlands. Medium-sized buildings are the most common housing type. While access to electricity, waste/garbage collection, and public water taps is high, few households are near roads and very few have access to greenspaces, and many rely on unpaved footpaths and roads for connectivity.
The Figure 4 illustrates the characteristics of households of respondents according to housing materials, building shapes, sizes, and access to basic amenities. Most respondents live in old, simply shaped houses made from unburnt (mud) brick. Access to electricity and water is relatively high, but access to garbage collection and paved roads is limited. Medium-sized houses are the most common, with few large houses.
The Figure 5 highlights respondents’ tenure rights based on land and/or property documentation, acquisition methods, and duration of occupation. The majority have a lease agreement and land registration certificate as proof documents. Most respondents acquired their property through purchase, followed by inheritance. A significant number have occupied their land/property for more than 10 years, with fewer occupying between 5 to 10 years, and even fewer between 1 to 5 years.
The Figure 6 illustrates respondents’ perceptions on tenure (in)security and experiences regarding their land and property rights. Many respondents expect to stay in their current property for over 10 years, but some believe they might lose it, with eviction being a common experience. In case of property loss, upgrading and land readjustment are the most anticipated responses. Most respondents feel they have protection, although some think it’s only fairly strong or not strong.

3.2. Patterns of Perceived Tenure Insecurity

The Multiple Correspondence Analysis (MCA) employed 25 qualitative indicators from each of the 120 respondents, creating a 44-dimensional space to discern variations in the dataset. Consequently, MCA generated a point cloud representing respondents across each dimensional space. The scatter plot depicted in Figure 7 provides an overview of this point cloud across the first and second dimensions. Proximity between respondents on the plot indicates similarity in their perceived indicators of tenure insecurity, while greater distances reflect dissimilarity. Thus, respondents in close proximity exhibit congruent perceptions of tenure insecurity, whereas those farther apart manifest significantly different perceptions.
However, not all indicators contributed equally to the creation of perceived tenure insecurity indices. The squared correlation of each indicator with the first dimension offers insights into their respective contributions, as depicted in Figure 8. Higher squared correlation values signify greater contributions to the perceived tenure insecurity indices, highlighting the importance of these indicators in characterizing variations in perceived tenure insecurity within the study area. Notably, indicators such as wall materials, household access to water, likelihood of property loss within the next five years, anticipated length of occupation, and dwelling size emerged as the most influential indicators shaping the perceived tenure insecurity indices. Consequently, these indicators play a pivotal role in delineating the nuanced variations in perceived tenure insecurity observed within the study area.
The perceived tenure insecurity indices derived from MCA provided a generalized characterization of perceived tenure insecurity variations within the study area. However, to validate this variation, the study investigated the spatial distribution of respondents with similar perceptions of tenure insecurity. This was achieved through clustering respondents based on the similarity of their perceived indicators, resulting in the identification of four distinct clusters. Each cluster was subsequently characterized based on its constituent indicators, variables, and dimensions, facilitating an understanding of their relationship to variations in perceived tenure insecurity. Furthermore, the study evaluated the significance of each indicator to identify those that best characterized all clusters (Appendix A, Table A2). Each indicator comprised different variables; for example, the indicator “wall materials” encompassed variables such as wood, unburnt brick, concrete, and stone. The similarity of variables within each cluster further delineated respondents’ characteristics. By assessing the test statistic value of each variable within the clusters, the study identified similar variables across clusters (Appendix A, Table A3).
Moreover, the characterization of clusters based on MCA dimensions revealed that the first and second dimensions provided optimal separation of clusters by giving a visual idea of distances that distinguish the respondents according to their clusters, as indicated by the test statistics along these dimensions (Table 2).
The results indicate that respondents in cluster 1 have lower coordinates on the first dimension and lower coordinates on the second dimension. Respondents in cluster 2 have the lowest coordinates significantly on the first dimension and high coordinates on the second dimension. Respondents in cluster 3 have high coordinates on the first dimension and significantly lower coordinates on the second dimension. Finally, respondents in cluster 4 have significantly high coordinates on the first dimension and significantly high coordinates on the second dimension. Therefore, by synthesizing the characteristics of clusters based on indicators, variables, and dimensions, the study reveals that Cluster 1 comprised respondents with common variables representing very high perceived tenure insecurity, followed by Cluster 2 with high perceived tenure insecurity, Cluster 3 with moderate perceived tenure insecurity, and Cluster 4 with low perceived tenure insecurity. Additionally, visual representation of the clusters on the map revealed spatial concentrations of respondents within the same clusters across the study area, as depicted in Figure 9.

3.3. Spatial Characteristics of the Urban Deprived Areas

The CNN model demonstrated good accuracy on the test set, yielding satisfactory visual results given image quality constraints as shown by model evaluation metrics (Table 3). These findings underscore the CNN model’s capability in accurately identifying diverse land cover classes, with implications for applications in urban planning, environmental monitoring, and resource management. Table 3 illustrates recall, precision and F1-Score evaluation metrics for each land cover class.
The deployment of the model yielded insightful land cover features that delineate the study area, encompassing built-up areas, dense green spaces, paved and unpaved roads, and bare lands. These results, showcased in Figure 10 (left), exemplify both the input image samples provided to the model and the classification/segmentation outcomes generated by the model. Through this visualization, key spatial characteristics of the study area are highlighted, offering valuable insights into its land cover composition and spatial distribution. In addition to the information about land cover, we extracted the information about texture features from the VHR GE image to complement land cover information. These features were adapted as an alternative to other detailed information about the urban deprived area related to variation, such as building layouts and roofing conditions that could not be extracted from the VHR GE image due to its quality. Figure 10 (Right) visualizes the texture features extracted from the sample of the VHR image tile of the study area.

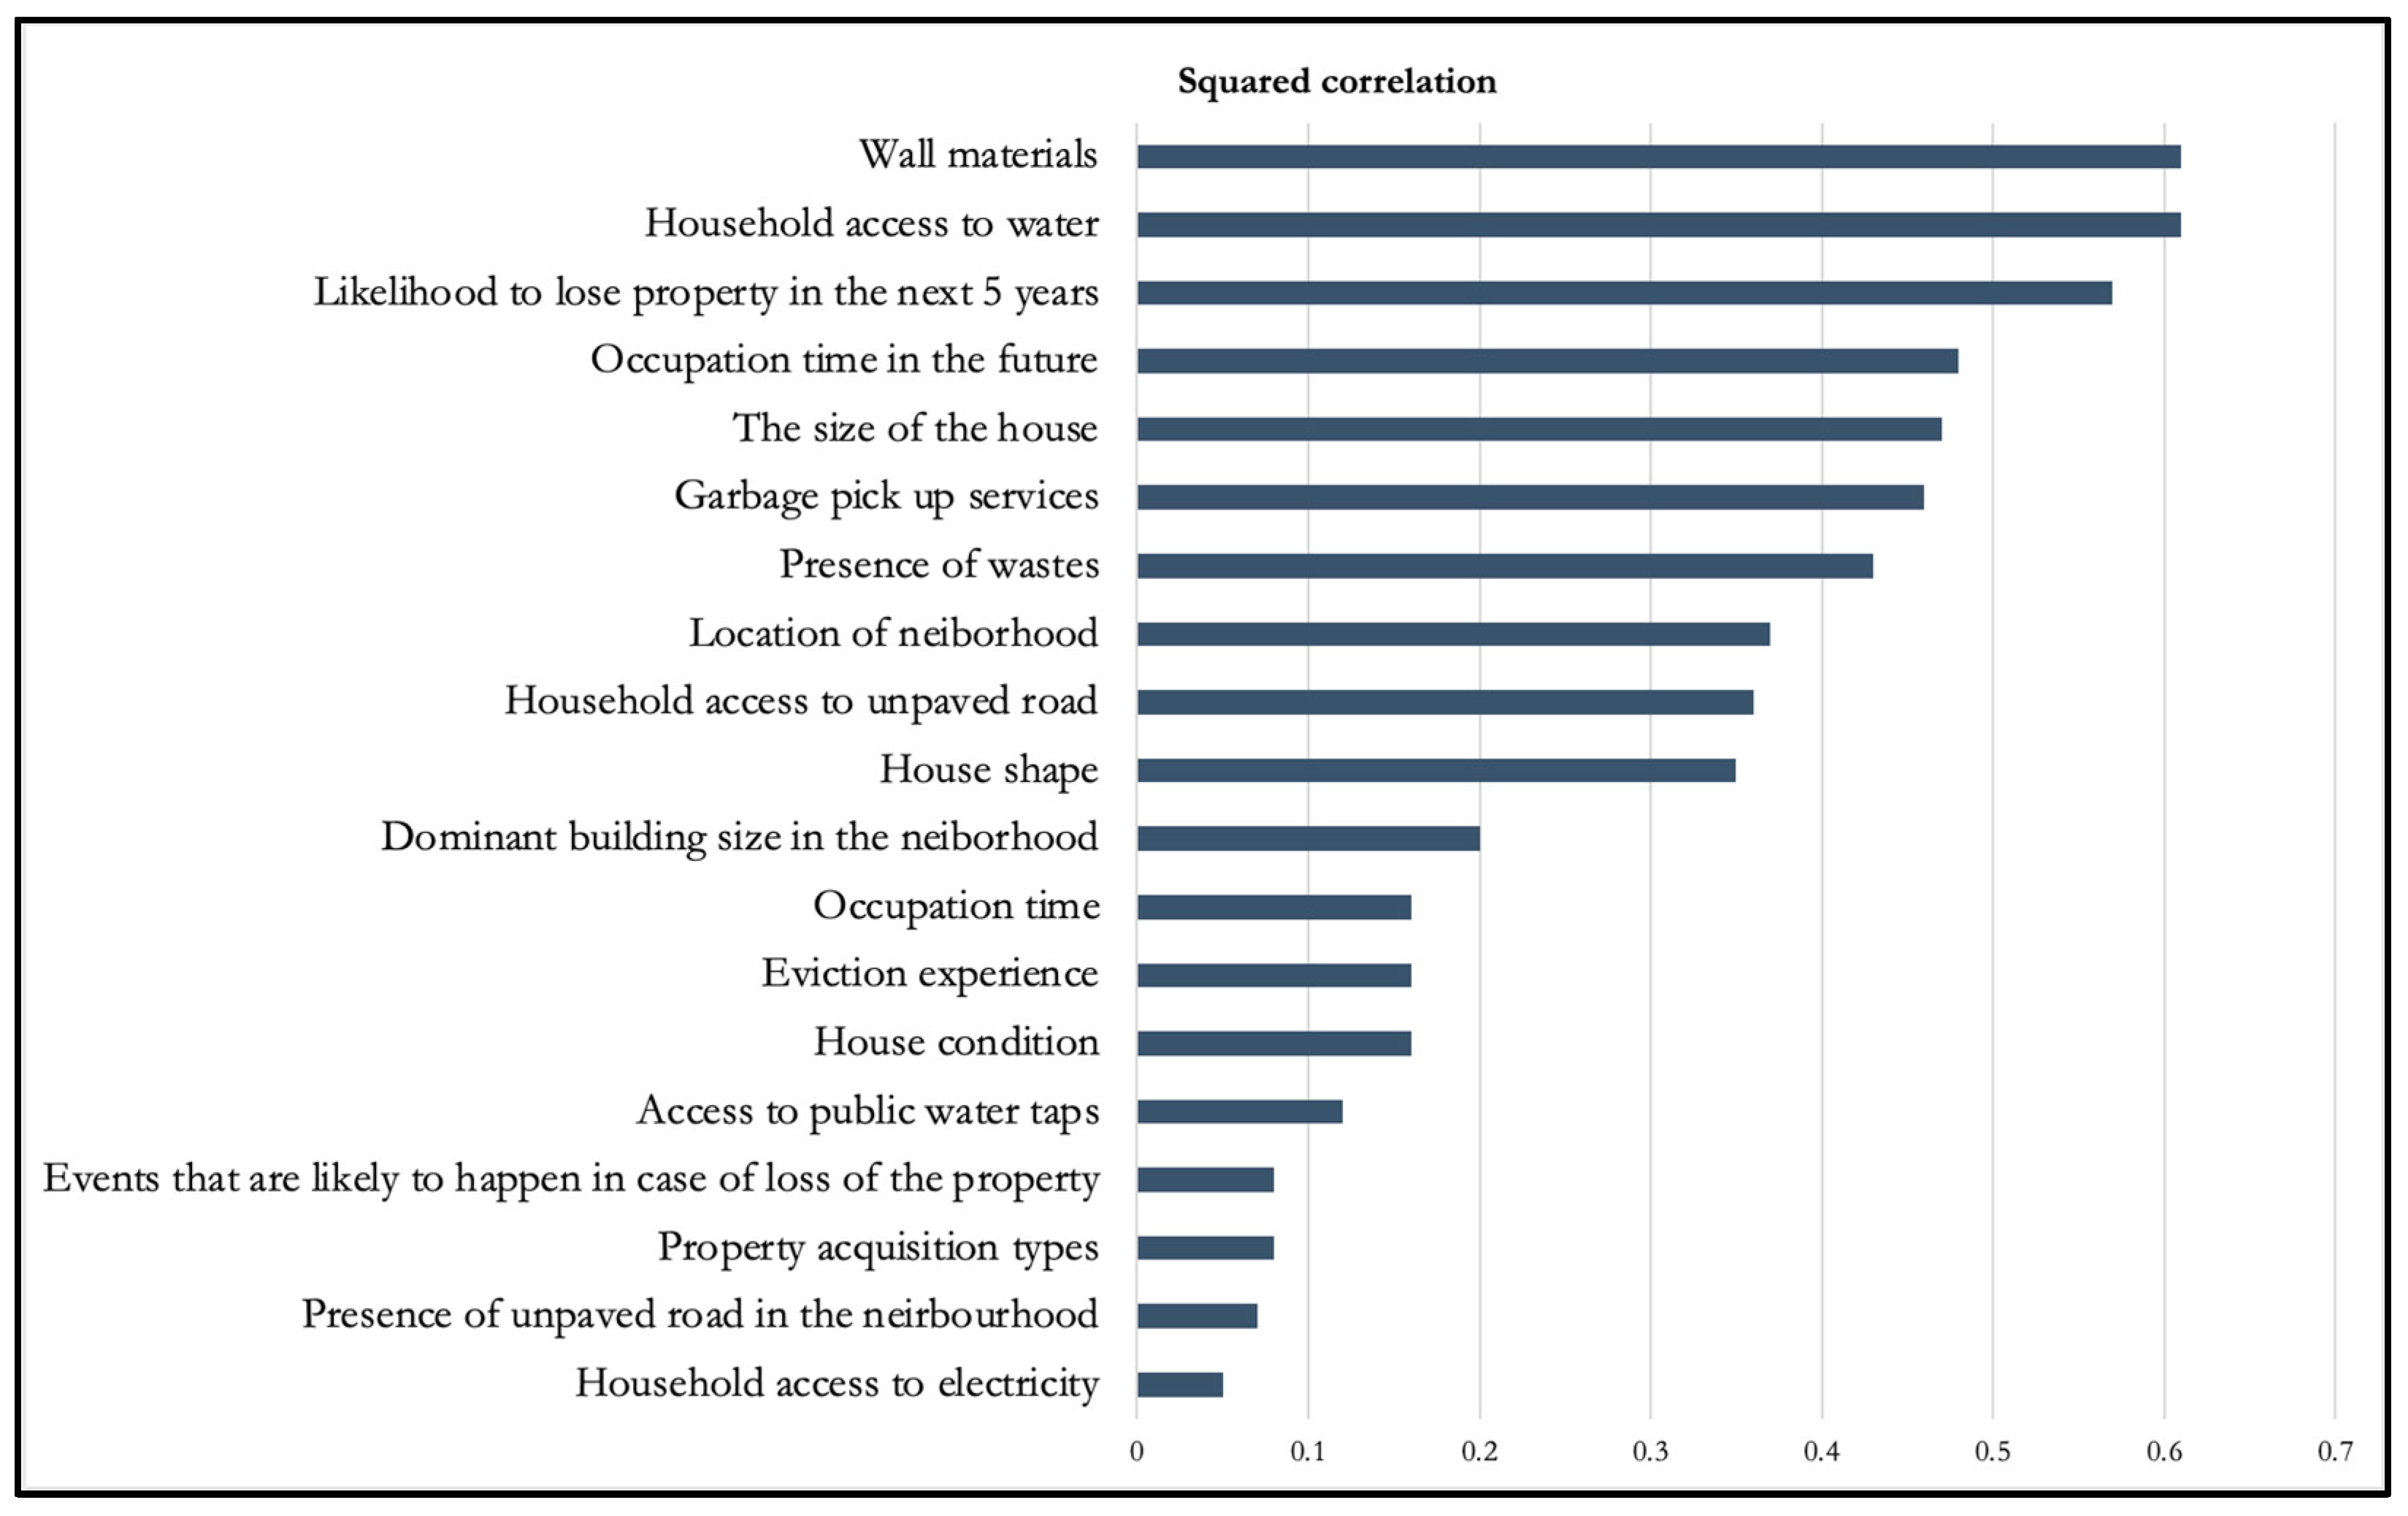
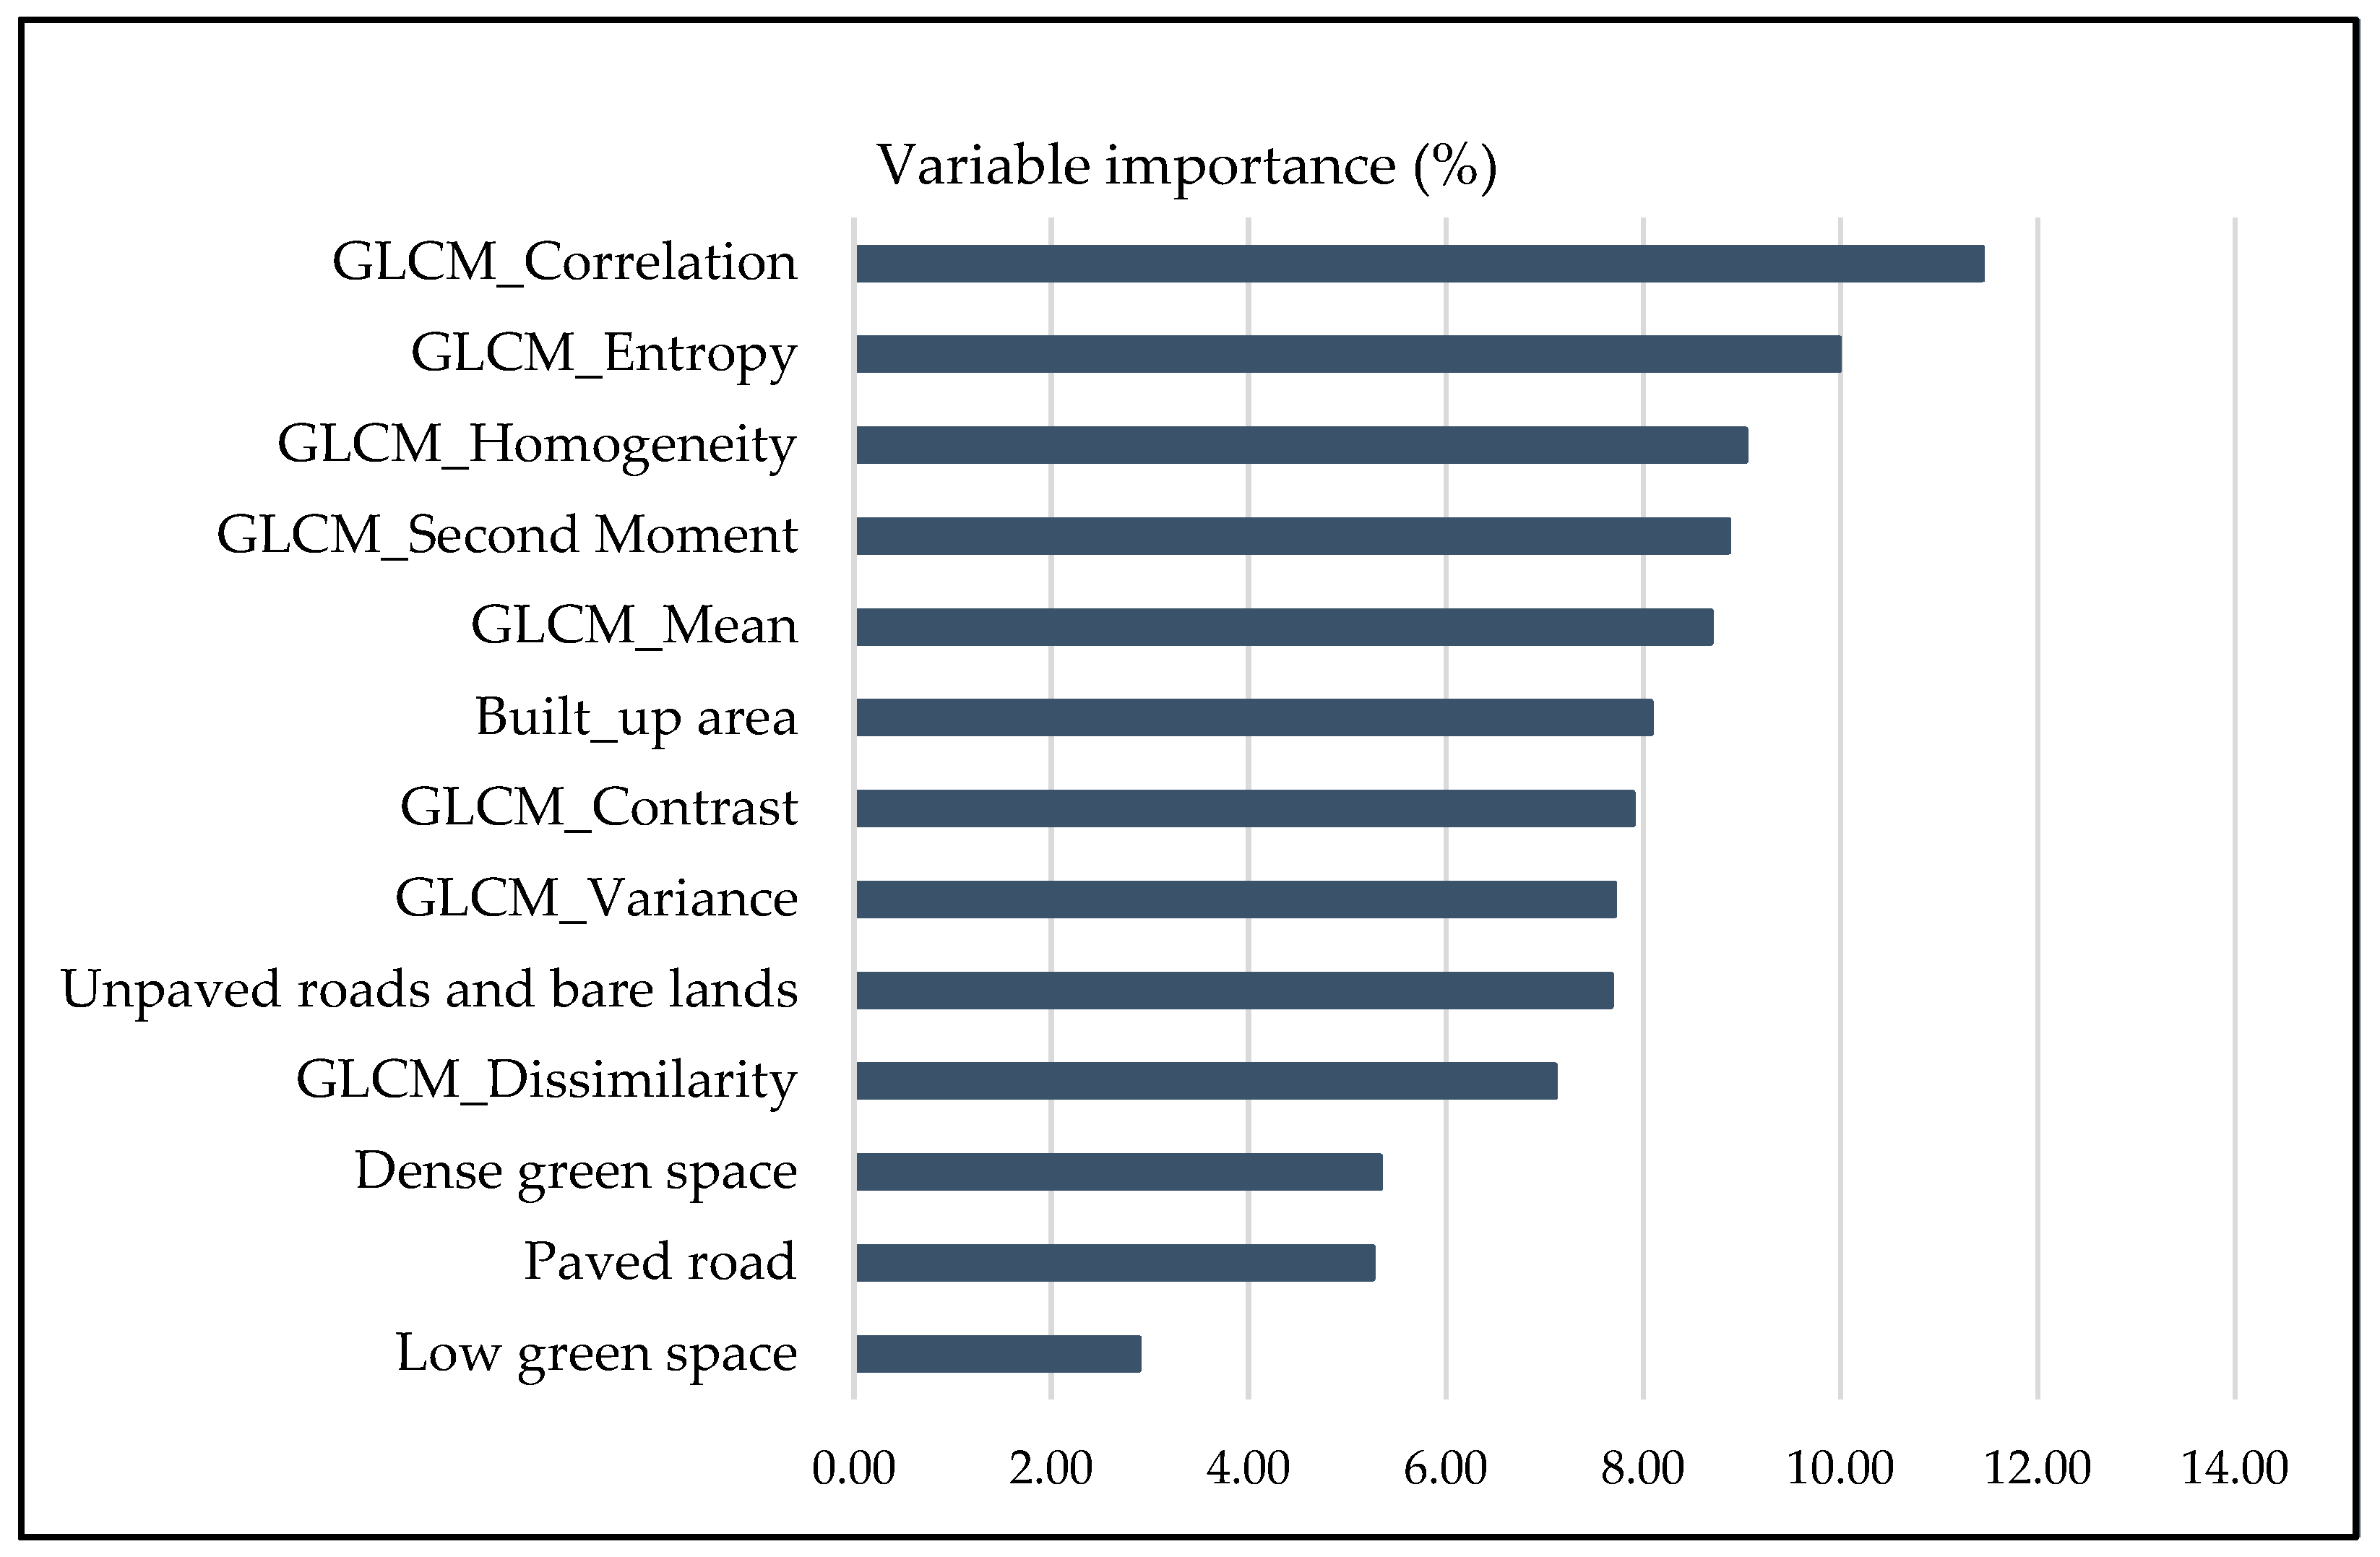
3.4. Relationship between Perceived Tenure Insecurity and Spatial Characteristics of Urban Deprived Areas

The survey data revealed that physical environmental indicators played a significant role in characterizing the variation of perceived tenure insecurity within the study area. To elucidate this further, the study juxtaposed the spatial characteristics of deprived areas derived from VHR imagery and complementary spatial data with the physical indicators obtained from the survey. The comparative analysis, summarized in Table 4, underscored the prominence of physical environmental conditions in shaping respondents’ perceptions of tenure insecurity. MCA of the survey data identified several physical environment indicators strongly associated with perceived tenure insecurity. The VHR image and complementary spatial information provided limited detailed information, it offered valuable insights into the physical environment that influenced respondents’ perceptions. These spatial characteristics served as input variables to establish their relationship with variations in perceived tenure insecurity, as elaborated in the subsequent subsection. The integration of survey-derived physical indicators with spatial data facilitated a comprehensive understanding of the factors contributing to perceived tenure insecurity. Despite limitations in extracting detailed information from the VHR GE image, the study successfully utilized available spatial data to capture key environmental influences on respondents’ perceptions. This approach enabled the delineation of spatial patterns and relationships crucial for discerning the dynamics of tenure insecurity within urban deprived areas. The subsequent analysis aimed to elucidate these relationships further, shedding light on the complex interplay between spatial characteristics and perceived tenure insecurity.
The intention was to assess the predictive capacity of spatial characteristics derived from VHR image and complementary spatial data in estimating perceived tenure insecurity throughout the study area. To this end, we conducted four modelling iterations employing Random Forest regression—a tree-based approach. These models aimed to establish the relationship between image-derived spatial features of urban deprived areas and additional spatial information with perceived tenure insecurity. The study utilized the squared correlation coefficient (R²) to assess the performance of each modelling iteration. Specifically, the study evaluated the relationship between image-derived variables alone and their combination with complementary spatial data. The dataset was divided into two subsets for model training and evaluation, respectively. Table 5 presents the R² values obtained on the test set for each modelling iteration, providing insights into the predictive accuracy of the models in forecasting perceived tenure insecurity across the study area.
Modelling processes using only image-derived spatial characteristics showed good performance for spatial characteristics extracted on a buffer area of 20 m (R2 = 0.45), followed by those extracted on a buffer area of 25 m (R2 = 0.44). Besides, the modelling processes using only image-derived spatial characteristics showed poor performance on characteristics extracted based on the buffer of 10 m (R2 = 0.22) and 15 m (R2 = 0.27), respectively.
In addition to evaluating modelling processes through the values of R2, the visualisation of the variable importance to understand the relevance of each variable in predicting perceived tenure insecurity. Figure 11 illustrates the variable importance of the modelling process based on the spatial characteristics extracted on the buffer of 20 m, which illustrated the good performance.
Modelling processes using image-derived spatial characteristics and additional spatial information showed good performance for spatial characteristics extracted based on the buffer area of 25 m (R2 = 0.61), but not significantly different to the result of the modelling process using spatial characteristics extracted based on the buffer area of 20 m (R2 = 0.60). Furthermore, the modelling processes using image-derived spatial characteristics and additional spatial information showed low performance on characteristics extracted based on the buffer of 15 m (R2 = 0.36) and 10 m (R2 = 0.40), respectively. Figure 12 illustrates the variable importance of the modelling process based on the spatial characteristics extracted on the buffer of 25 m, which illustrated the good performance.
The results show that correlations between image-derived spatial characteristics of the urban deprived area and perceived tenure insecurity are low (R2 = 0.22 on the buffer of 10 m and R2 = 0.27 on the buffer of 15 m) and moderate (R2 = 0.45 on the buffer of 20 m and R2 = 0.44 on the buffer of 25 m). Furthermore, the correlations between image-derived spatial characteristics alongside additional spatial information and perceived tenure insecurity are also moderate for the buffer of 10 m and 15 m (R2 = 0.45 and R2 = 0.36). However, the correlations between image-derived alongside additional spatial information and perceived tenure insecurity are almost high on the buffer areas of 20 and 25 m (R2 = 0.45 and R2 = 0.36).

4. Discussion

4.1. The Interpretation of Survey Results

The survey data reveals that the majority of households reside in older, simpler homes with limited access to essential utilities and inadequate waste management services. These conditions align with the characteristics of deprived areas described in Section 2.1. Figure 5 shows that most respondents possess long-term, documented ownership of their properties, primarily acquired through purchase. This suggests stability and security in property rights, likely resulting from the Land Tenure Regularization program implemented nationwide. This program addresses issues such as tenure insecurity, unequal land access, and inefficient land use inherited from precolonial, colonial, and early independence periods [44]. However, Figure 6 indicates mixed perceptions among respondents regarding the stability of their land and property rights and the protection in case of loss. This reflects a perceived likelihood of losing their land and properties, influenced by past eviction experiences and other threats, such as the implementation of master plans. The observed tenure insecurity among respondents arises from a combination of factors. While they have legal (de jure) property rights through the LTR program, there is ongoing de facto (in reality/practice) insecurity due to the legality issues of informal settlements targeted by the city’s Master Plan implementation for redevelopment [45,46]. Thus, de facto insecurity persists due to legality issues, inadequate compensation, and unsuitable relocation options, exacerbated by a lack of trust in the regulatory framework and past eviction experiences [21,47].

4.2. The Variation of Perceived Tenure Insecurity in the Urban Deprived Area

The study identified that physical environment indicators significantly contribute to perceived tenure insecurity in urban deprived areas. This aligns with the findings of [48,49] and [1,50] who argue that tenure insecurity is often linked to the physical environment and political pressures. Notably, the study sites, recognized as informal settlements slated for redevelopment according to the Kigali Master plan [27], underscore the relevance of these indicators. This study uniquely highlights the spatial concentration of tenure insecurity perceptions within urban deprived areas, providing a new perspective on how physical environment and political factors influence these perceptions. While previous studies have linked tenure insecurity to environmental and political factors, our research emphasizes the spatial clustering of these perceptions, offering insights into the geographic distribution of tenure insecurity. The findings confirm previous research by [47], which demonstrated that land titles do not always guarantee perceived tenure security. Despite all land parcels in the study area being registered and titled through the LTR program, residents still report feeling insecure. This suggests that factors beyond legal ownership, such as environmental conditions and political pressures, significantly impact perceived tenure security. The spatial clustering of tenure insecurity perceptions indicates that interventions should be geographically targeted, addressing specific areas where insecurity is most concentrated. Urban redevelopment plans, such as those outlined in the Kigali Master Plan, should consider the physical environment’s impact on tenure perceptions and incorporate measures to enhance residents’ security.

4.3. Spatial Characteristics of the Urban Deprived Area

This study combined land cover information from with GLCM texture features extracted from VHR GE images, enhancing the spatial characterization of urban deprived areas. Unlike previous studies that focused solely on basic land cover variables [15,40], the integration of texture features provides a more understanding of the physical characteristics of these areas [51,52]. This allows for a more detailed spatial analysis, bridging the gap where detailed land cover information was necessary but lacking [53,54]. This dual approach of land cover and texture analysis offers a richer dataset for understanding urban deprivation’s physical characteristics. The implications of our findings are significant for urban planning and policy development. The detailed spatial characterization provided by our methodology can inform targeted interventions in urban deprived areas. For instance, recognizing areas with significant unpaved roads and bare lands can guide infrastructure development priorities. Additionally, the identification of dense and low green spaces can inform urban greening initiatives, which are crucial for improving living conditions and environmental quality in these areas.

4.4. Relationship between Spatial Characteristics of Urban Deprived Area and Variation of Perceived Tenure Insecurity

The results demonstrated that spatial characteristics derived from VHR images can predict the variation of perceived tenure insecurity with R² values of 0.45 and 0.44, which improved to 0.60 and 0.61 when incorporating additional spatial information within 20 and 25-m buffers, respectively. These results highlight the effectiveness of combining VHR image-derived spatial characteristics with additional spatial information to predict perceived tenure insecurity. While previous studies have identified the importance of spatial characteristics (see [3,4,55,56,57,58,59]) to characterise urban deprivation, our study demonstrates the relevance of these spatial characteristics for understanding perceived tenure insecurity across urban deprived areas.
The texture features alongside land cover information play an important role for explaining the variation of perceived tenure insecurity since physical conditions influencing perceived tenure insecurity in the study area, as identified from survey data (see Table 4), were similar to the physical characteristics of urban deprived areas [3,55,59]. This revealed that perceived tenure insecurity exists as one of the challenges faced by urban deprived dwellers [60]. Moreover, additional spatial information presented high importance for explaining the variation of perceived tenure insecurity, mainly slope and distance to wetland. This can be traced back to the existing regulations and current activities of displacing people living in urban deprived areas and high-risk zones in Kigali city (see [46,61,62]). Generally, the additional spatial information was linked with the factors inducing the perceptions on tenure insecurity for the people of the study area. This information is closely related to regulations such as zoning regulation and urban redevelopment policies in Kigali city [27]. Therefore, it is worth considering that the importance of additional spatial information for predicting the variation of perceived tenure insecurity opens the door to the possibility of exploring other spatial information that may have a strong significance.

4.5. Limitation

The primary limitation of this study lies in the quality of the freely available VHR image used, which is lower compared to VHR images available from commercial providers. Specifically, the image used in this research lacks comprehensive spectral information, since it only contained visible bands (Red, Green, and Blue). This limitation hindered the model’s ability to effectively discriminate between certain land cover classes, such as water bodies, and negatively impacted the results of image classification, especially in areas with significant shadowing. Additionally, the physical environment and household characteristics, such as building size, shape, and condition, were difficult to detect with the available VHR image. Another significant limitation concerns to the survey data measuring respondents’ perceptions of tenure insecurity. Such detailed perception data is often not available in most census datasets. Consequently, this research relied on a sample collected specifically from the study area. However, the sample was limited to three research sites selected based on administrative boundaries. The small sample size, constrained by time and resource limitations, may introduce some uncertainty in the results. Moreover, the resulting clusters showing variations in perceived tenure insecurity were imbalanced, which could have affected the performance of the random forest regression model.

5. Conclusions

This study highlights the effective integration of earth observation-based information with traditional survey methods to measure and predict the variation of perceived tenure insecurity in urban deprived areas. By combining high-resolution satellite imagery with spatial data and surveys data, we achieved a more understanding of how physical characteristics and additional spatial factors influence perceived tenure insecurity. This approach not only enhanced the accuracy of our measurements but also provided a detailed spatial characterization of the study area, addressing previous limitations due to the lack of comprehensive base data on tenure insecurity. Moreover, this integration of spatial data with traditional survey insights provided a more contextually relevant analysis, showcasing the potential of earth observation data in understanding complex urban challenges. Overall, this study provides a valuable framework for bridging the gap between survey data and earth observation information, offering insights that can inform more effective urban planning and policy interventions to address tenure insecurity in urban deprived areas. Future research could build on our findings by applying this approach to different urban contexts and larger areas to test its scalability. Expanding the methodology to regional, continental, or global levels could contribute to monitoring progress toward SDGs goal 1 (target 1.4), which focuses on ensuring equal land rights, and goal 11, which aims to make cities and human settlements safe, inclusive, and resilient.

Author Contributions

Conceptualization, E.D., J.W. and D.K.-P.J.; methodology, E.D.; software, E.D.; validation, E.D., J.W. and D.K.-P.J.; formal analysis, E.D.; investigation, E.D., J.W. and D.K.-P.J.; data curation, E.D.; writing—original draft preparation, E.D.; writing—review and editing, J.W. and D.K.-P.J.; visualization, E.D.; supervision, J.W. and D.K.-P.J. All authors have read and agreed to the published version of the manuscript.

Funding

This research received no external funding and the APC was waived by the journal.

Data Availability Statement

Survey data presented in this study are available on request from the first author due to privacy protection and ethical consideration. Satellite imagery was obtained from Google Satellite and are available from http://www.sasgis.org/sasplaneta/ (accessed on 23 February 2021) with the permission for proper use as per terms and conditions.

Conflicts of Interest

The authors declare no conflicts of interest.

Appendix A

Table A1. Indicators for measuring perceived tenure insecurity in deprived areas identified from the literature.
IndicatorResearchComment
Duration of land or property ownership[4];
[6];
[19];
[26];
[62];
[10];
[11]
The long or short period that landholder occupy the land/ property and living or nor living in fear of losing the land/property induce the perception of tenure insecurity
Land or property acquisitionInformal or formal land acquisition
Expected occupation period in the futureThe likelihood of living or holding the land/property in the coming period of time
Types of rights to land/propertyBundle of rights to land enjoyed by the land and property holders
Recognition and protection of rights to land/propertyLegal or de facto recognition of rights to land/property
Proof or evidence for rights to land/propertyDocuments proving the rights to land/property of land and property holders
Experience of evictionPrevious eviction and the causes of it
Likelihood to lose
land/property unwillingly in the coming period of time (5 years)
Fear of event that can happen and make land/property holders to lose their rights to land/property
Physical/environmental characteristics[9];
[12];
[48];
[49];
[50];
Feeling insecure reduces the willingness to invest in land/property. Thus, areas with high tenure insecurity can be characterized by inadequate housing and environmental conditions.
Table A2. Indicators that best characterise the clusters.
Indicatorsp-Value
Wall materials3.21 × 10−26
Location of the neighbourhood1.56 × 10−21
Household access to water4.58 × 10−15
Likelihood to lose popery in the next 5 years7.65 × 10−12
House condition8.80 × 10−12
Occupation time9.94 × 10−12
Events that are likely to happen in case of loss of the property1.21 × 10−11
The shape of the house1.72 × 10−10
Presence of wastes9.17 × 10−10
Garbage pick-up services4.71 × 10−9
Feelings of staying in the same property in the future5.04 × 10−9
The size of the house7.70 × 10−9
Dominant building size in the neighbourhood5.01 × 10−7
Household access to the unpaved road2.33 × 10−6
Property acquisition types1.39 × 10−4
Eviction experience9.20 × 10−4
Access to green space7.89 × 10−3
Presence of unpaved road in the neighbourhood1.29 × 10−2
Access to public water taps2.56 × 10−2
Presence of unpaved footpath4.13 × 10−2
Table A3. Variables that best characterise each cluster.
Cluster 1
VariablesTest statistic
Event in case of loss of property: Relocation6.61
Location of the neighbourhood: Proximity to wetland5.35
Location of the neighbourhood: Proximity to ditch4.48
Eviction experience: No3.79
Property acquisition: Inherited from my family3.7
Likelihood to lose popery in the next 5 years: Very likely2.93
Household access to water: No2.79
Wall material: Unburnt brick2.65
Dominant building size in the neighbourhood: Medium2.57
Access to green space: Yes2.49
Access to public water taps: No2.25
Protection in case of loss: Very strongly2.18
Location of the neighbourhood: Proximity to the road2.17
House condition: Old2.14
Cluster 2
VariablesTest statistic
Household access to water: No6.59
Wall material: Unburnt brick6.43
Location of the neighbourhood: Steep slope6.38
Dominant building size in the neighbourhood: Small5.87
House size: Small5.5
Presence of wastes: No5.47
Garbage pickup: No5.33
Occupation time: Between 5 and 10 years5.14
Likelihood to lose popery in the next 5 years: Very likely5.14
Household access to unpaved road: No3.76
House shape: Simple shape3.16
Unpaved roads: No2.92
Event in case of loss of property: Land readjustment2.75
Household access electricity: No2.16
Cluster 3
VariablesTest statistic
Wall material: Burnt brick7.29
Presence of wastes: Yes5.09
Occupation time: Longer than 10 Years4.81
Garbage pickup: Yes4.76
Household access to water: Yes4.45
Occupation time in the future: Longer than 10 Years/lifelong4.41
Likelihood to lose popery in the next 5 years: Unlikely4
House condition: Old3.72
House size: Medium3.71
Dominant building size in the neighbourhood: Medium3.55
Event in case of loss of property: Upgrading3.18
Location of the neighbourhood: Moderate slope2.91
Household access to unpaved road: Yes2.46
Household access to footpath: No2.13
Location of the neighbourhood: Proximity to watershed2.01
Unpaved roads: Yes2
Cluster 4
VariablesTest statistic
Wall material: Concrete7.92
House condition: New7.27
House shape: Complex shape5.99
Household access to water: Yes5.47
Occupation time: Between 1 and 5 years4.51
Occupation time in the future: Longer than 10 Years/lifelong4
Location of the neighbourhood: Moderate slope3.93
Household access to unpaved road: Yes3.93
Likelihood to lose popery in the next 5 years: Somewhat likely3.77
Occupation time: Between 5 and 10 years3.72
House size: Medium2.89
House size: Large2.69
Likelihood to lose popery in the next 5 years: Very unlikely2.69
Eviction experience: Yes2.67
Property acquisition: Bought from the private individual2.59
Event in case of loss of property: Land readjustment2.37
Garbage pickup: Yes2.09

References

  1. UN-Habitat. Urbanization and Development: Emerging Futures. 2016. Available online: https://unhabitat.org/sites/default/files/download-manager-files/WCR-2016-WEB.pdf (accessed on 22 May 2020).
  2. Friesen, J.; Friesen, V.; Dietrich, I.; Pelz, P.F. Slums, space, and state of health—A link between settlement morphology and health data. Int. J. Environ. Res. Public Health 2020, 17, 2022. [Google Scholar] [CrossRef] [PubMed]
  3. Kuffer, M.; Thomson, D.R.; Boo, G.; Mahabir, R.; Grippa, T.; Vanhuysse, S.; Engstrom, R.; Ndugwa, R.; Makau, J.; Darin, E.; et al. The role of earth observation in an integrated deprived area mapping ‘system’ for low-to-middle income countries. Remote Sens. 2020, 12, 982. [Google Scholar] [CrossRef]
  4. UN-Habitat. Tenure Security, Land and Property Rights in an Urban Context. 2015. Available online: https://www.habitat.org/sites/default/files/Tenure_Security_Land%26Property_Rights_in_an%20Urban_Context_emea_2017.pdf (accessed on 11 November 2020).
  5. Lilford, R.; Taiwo, O.J.; de Albuquerque, J.P. Characterisation of urban spaces from space: Going beyond the urban versus rural dichotomy. Lancet Public Health 2018, 3, E61–E62. [Google Scholar]
  6. Fenyes, T.I. Land tenure and rural development, Proceedings of a workshop, Rhodes University. In Development Southern Africa; FAO: Rome, Italy, 2002; Volume 3. [Google Scholar] [CrossRef]
  7. Durand-Lasserve, A. Urban and Rural Inhabitants’ Insecure Real Estate and Land Rights. In Take Back the Land! The Social Function of Land and Housing, Resistances & Alternatives; Mathivet, C., Ed.; Ritimo: Paris, France, 2012; p. 183. [Google Scholar]
  8. van Gelder, J.-L. Legal Tenure Security, Perceived Tenure Security and Housing Improvement in Buenos Aires: An Attempt towards Integration. Int. J. Urban Reg. Res. 2009, 33, 126–146. [Google Scholar]
  9. Moroni, S. Property as a human right and property as a special title. Rediscussing private ownership of land. Land Use Policy 2018, 70, 273–280. [Google Scholar]
  10. Reerink, G.; van Gelder, J.-L. Land titling, perceived tenure security, and housing consolidation in the kampongs of Bandung, Indonesia. Habitat Int. 2010, 34, 78–85. [Google Scholar]
  11. imbizi, M.C.D.; Bennett, R.M.; Zevenbergen, J. Land tenure security: Revisiting and refining the concept for Sub-Saharan Africa’s rural poor. Land Use Policy 2014, 36, 231–238. [Google Scholar]
  12. Nakamura, S. Revealing invisible rules in slums: The nexus between perceived tenure security and housing investment. Habitat Int. 2016, 53, 151–162. [Google Scholar]
  13. United Nations. Transforming Our World: The 2030 Agenda for Sustainable Development United Nations United Nations Transforming Our World: The 2030 Agenda for Sustainable Development. A/RES/70/1. 2015. Available online: https://www.un.org/en/development/desa/population/migration/generalassembly/docs/globalcompact/A_RES_70_1_E.pdf (accessed on 20 May 2020).
  14. Abascal, Á.; Rothwell, N.; Shonowo, A.; Thomson, D.R.; Elias, P.; Elsey, H.; Kuffer, M. “Domains of Deprivation Framework” for Mapping Slums, Informal Settlements, and other Deprived Areas in LMICs to Improve Urban Planning and Policy: A Scoping Review. 2021. Preprints. Available online: https://www.preprints.org/manuscript/202102.0242/v2 (accessed on 17 April 2021).
  15. Arribas-Bel, D.; Patino, J.E.; Duque, J.C. Remote sensing-based measurement of Living Environment Deprivation: Improving classical approaches with machine learning. PLoS ONE 2017, 12, e0176684. [Google Scholar]
  16. Duque, J.C.; Patino, J.E.; Ruiz, L.A.; Pardo-Pascual, J.E. Measuring intra-urban poverty using land cover and texture metrics derived from remote sensing data. Landsc. Urban Plan. 2015, 135, 11–21. [Google Scholar]
  17. Brown, M.; Hughes, A.K. Is Land Tenure ‘Secure Enough’ in Rural Rwanda? In Proceedings of the 2017 World Bank Conference on Land and Poverty, Washington, DC, USA, 20–24 March 2017; p. 28. Available online: https://www.chemonics.com/wp-content/uploads/2017/03/Secure-Enough-Land-Tenure_2017.pdf (accessed on 26 January 2021).
  18. Fosudo, O.P. Land Tenure Regularization in Rwanda: The Outcome for Agricultural Land Use Change in Peri-Urban Kigali. 2014. Available online: https://essay.utwente.nl/84408/1/fosudo.pdf (accessed on 6 March 2021).
  19. Prindex. Global Perceptions of Tenure Security: Looking beyond the Formalization of Property Rights. 2020. Available online: https://www.prindex.net/documents/529/Prindex-Policy_Brief-Rights_vs_Perceptions-6May.pdf (accessed on 12 January 2021).
  20. Baffoe, G.; Malonza, J.; Manirakiza, V.; Mugabe, L. Understanding the concept of neighbourhood in Kigali City, Rwanda. Sustainability 2020, 12, 1555. [Google Scholar] [CrossRef]
  21. Esmail, S.; Corburn, J. Struggles to remain in Kigali’s ‘unplanned’ settlements: The case of Bannyahe. Environ. Urban 2020, 32, 19–36. [Google Scholar] [CrossRef]
  22. Finn, B. Quietly Chasing Kigali: Young Men and the Intolerance of Informality in Rwanda’s Capital City. Urban Forum. 2018, 29, 205–218. [Google Scholar]
  23. Nikuze, A.; Sliuzas, R.; Flacke, J. From closed to claimed spaces for participation: Contestation in urban redevelopment induced-displacements and resettlement in Kigali, Rwanda. Land 2020, 9, 212. [Google Scholar] [CrossRef]
  24. Ali, D.A.; Deininger, K.; Goldstein, M. Environmental and gender impacts of land tenure regularization in Africa: Pilot evidence from Rwanda. J. Dev. Econ. 2014, 110, 262–275. [Google Scholar]
  25. Prindex. Global Perceptions of Urban Land Tenure Security Evidence from 33 Countries. 2019. Available online: https://www.prindex.net/reports/global-perceptions-urban-land-tenure-security-report-evidence-33-countries/ (accessed on 24 May 2020).
  26. NISR, Rwanda Statistical YearBook 2018, Kigali, 2018. Available online: https://www.statistics.gov.rw/publication/statistical-yearbook-2018 (accessed on 9 May 2024).
  27. City of Kigali, “Masterplan 2050”, Kigali, 2019. Available online: https://masterplan.kigalicity.gov.rw/portal/sharing/rest/content/items/ecd3119c441a4dc89eb226719adbeafc/data (accessed on 22 February 2021).
  28. City of Kigali, Zoning Regulations: Kigali Master Plan 2050, Kigali City, 2019. Available online: https://masterplan2020.kigalicity.gov.rw/portal/sharing/rest/content/items/b9e31b07d8684053b0f3eac8649e1213/data (accessed on 22 February 2020).
  29. Di Franco, G. Multiple correspondence analysis: One only or several techniques? Qual. Quant. 2016, 50, 1299–1315. [Google Scholar]
  30. Ayele, D.; Zewotir, T.; Mwambi, H. Multiple correspondence analysis as a tool for analysis of large health surveys in African settings. Afr. Health Sci. 2014, 14, 1036–1045. [Google Scholar]
  31. Ajami, A.; Kuffer, M.; Persello, C.; Pfeffer, K. Identifying a Slums’ Degree of Deprivation from VHR Images Using Convolutional Neural Networks. Remote Sens. 2019, 11, 1282. [Google Scholar] [CrossRef]
  32. Lawana, N.; Booysen, F. Decomposing socioeconomic inequalities in alcohol use by men living in South African urban informal settlements. BMC Public Health 2018, 18, 993. [Google Scholar] [CrossRef]
  33. Lana, R.M.; Riback, T.I.S.; Lima, T.F.M.; Da Silva-Nunes, M.; Cruz, O.G.; Oliveira, F.G.S.; Codeço, C.T. Socioeconomic and demographic characterization of an endemic malaria region in Brazil by multiple correspondence analysis. Malar. J. 2017, 16, 397. [Google Scholar]
  34. Greenacre, M.; Blasius, J. Multiple Correspondence Analysis and Related Methods. In Multiple Correspondence Analysis and Related Methods; Chapman and Hall/CRC: Boca Raton, FL, USA, 2006. [Google Scholar]
  35. Liu, Y.; Hayes, D.N.; Nobel, A.; Marron, J.S. Statistical significance of clustering for high-dimension, low-sample size data. J. Am. Stat. Assoc. 2008, 103, 1281–1293. [Google Scholar] [CrossRef]
  36. Sameen, M.I.; Pradhan, B.; Aziz, O.S. Classification of very high-resolution aerial photos using spectral-spatial convolutional neural networks. J. Sens. 2018, 2018, 7195432. [Google Scholar]
  37. Nivaggioli, A.; Randrianarivo, H. Weakly Supervised Semantic Segmentation of Satellite Images. In Proceedings of the 2019 Joint Urban Remote Sensing Event (JURSE), Vannes, France, 22–24 May 2019; pp. 1–4. [Google Scholar]
  38. Kuffer, M.; Pfeffer, K.; Sliuzas, R.; Baud, I. Extraction of Slum Areas from VHR Imagery Using GLCM Variance. IEEE J. Sel. Top. Appl. Earth Obs. Remote Sens. 2016, 9, 1830–1840. [Google Scholar] [CrossRef]
  39. Mboga, N.; Persello, C.; Bergado, J.; Stein, A. Detection of Informal Settlements from VHR Images Using Convolutional Neural Networks. Remote Sens. 2017, 9, 1106. [Google Scholar] [CrossRef]
  40. Georganos, S.; Gadiaga, A.N.; Linard, C.; Grippa, T.; Vanhuysse, S.; Mboga, N.; Lennert, M. Modelling the Wealth Index of Demographic and Health Surveys Within Cities Using Very High-Resolution Remotely Sensed Information. Remote Sens. 2019, 11, 2543. [Google Scholar] [CrossRef]
  41. Perez-Heydrich, C.; Warren, J.L.; Burgert, C.R.; Emch, M.E. Influence of Demographic and Health Survey Point Displacements on Raster-Based Analyses. Spat. Demogr. 2016, 4, 135–153. [Google Scholar] [CrossRef]
  42. Breiman, L. Random Forests. Mach. Learn. 2001, 45, 5–32. [Google Scholar] [CrossRef]
  43. Stevens, F.R.; Gaughan, A.E.; Linard, C.; Tatem, A.J. Disaggregating Census Data for Population Mapping Using Random Forests with Remotely-Sensed and Ancillary Data. PLoS ONE 2015, 10, e0107042. [Google Scholar]
  44. Ngoga, T. Land Governance Assessment Framework Final Report: Rwanda. 2016. Available online: https://openknowledge.worldbank.org/bitstream/handle/10986/28492/119631-WP-P095390-PUBLIC-7-9-2017-10-30-51-RwandaFinalReport.pdf?sequence=1&isAllowed=y (accessed on 12 June 2020).
  45. Hitayezu, P.; Rajashekar, A.; Stoelinga, D. The Dynamics of Unplanned Settlements in the City of Kigali. 2018. Available online: https://www.theigc.org/sites/default/files/2019/02/Hitayezu-et-al-2018-final-report-v2.pdf (accessed on 4 March 2021).
  46. Nikuze, A.; Sliuzas, R.; Flacke, J.; van Maarseveen, M. Livelihood impacts of displacement and resettlement on informal households—A case study from Kigali, Rwanda. Habitat Int. 2019, 86, 38–47. [Google Scholar]
  47. Uwayezu, E.; de Vries, W. Expropriation of Real Property in Kigali City: Scoping the Patterns of Spatial Justice. Land 2019, 8, 23. [Google Scholar] [CrossRef]
  48. Alizadeh, B.; Mirgholami, M.; Dadashpoor, H.; Farabiasl, N.; Allan, A. The Impact of Land Tenure Security on Housing Investment at Informal Settlements (The Case of EslamAbad Neighborhood, Tehran). Space Ontol. Int. J. 2019, 8, 77–86. [Google Scholar]
  49. Payne, G.; Piaskowy, A.; Kuritz, L. Land Tenure in Urban Environments; U.S. Agency for International Development: Washington, DC, USA, 2014. Available online: https://www.land-links.org/wp-content/uploads/2016/09/USAID_Land_Tenure_Urban_Brief_061214-1.pdf (accessed on 21 May 2020).
  50. Chigbu, U.; Alemayehu, Z.; Dachaga, W. Uncovering land tenure insecurities: Tips for tenure responsive land-use planning in Ethiopia. Dev. Pract. 2019, 29, 371–383. [Google Scholar] [CrossRef]
  51. Wurm, M.; Taubenböck, H. Detecting social groups from space—Assessment of remote sensing-based mapped morphological slums using income data. Remote Sens. Lett. 2018, 9, 41–50. [Google Scholar] [CrossRef]
  52. Kuffer, M.; Pfeffer, K.; Sliuzas, R.; Baud, I.; Maarseveen, M.V. Capturing the diversity of deprived areas with image-based features: The case of Mumbai. Remote Sens. 2017, 9, 384. [Google Scholar] [CrossRef]
  53. Kuffer, M.; Barrosb, J. Urban Morphology of Unplanned Settlements: The Use of Spatial Metrics in VHR Remotely Sensed Images. Procedia Environ. Sci. 2011, 7, 152–157. [Google Scholar] [CrossRef]
  54. Kohli, D.; Sliuzas, R.; Stein, A. Urban slum detection using texture and spatial metrics derived from satellite imagery. J. Spat. Sci. 2016, 61, 405–426. [Google Scholar] [CrossRef]
  55. Lilford, R.; Kyobutungi, C.; Ndugwa, R.; Sartori, J.; Watson, S.I.; Sliuzas, R.; Kuffer, M.; Hofer, T.; De Albuquerque, J.P.; Ezeh, A. Because space matters: Conceptual framework to help distinguish slum from non-slum urban areas. BMJ Glob. Health 2019, 4, e001267. [Google Scholar] [CrossRef] [PubMed]
  56. Wang, J.; Kuffer, M.; Roy, D.; Pfeffer, K. Deprivation pockets through the lens of convolutional neural networks. Remote Sens. Environ. 2019, 234, 111448. [Google Scholar]
  57. Bergado, J.R.; Persello, C.; Gevaert, C. A deep learning approach to the classification of sub-decimetre resolution aerial images. In Proceedings of the 2016 IEEE International Geoscience and Remote Sensing Symposium (IGARSS), Beijing, China, 10–15 July 2016; pp. 1516–1519. [Google Scholar] [CrossRef]
  58. Thomson, D.R.; Linard, C.; Vanhuysse, S.; Steele, J.E.; Shimoni, M.; Siri, J.; Caiaffa, W.T.; Rosenberg, M.; Wolff, E.; Grippa, T.; et al. Extending Data for Urban Health Decision-Making: A Menu of New and Potential Neighborhood-Level Health Determinants Datasets in LMICs. J. Urban Health 2019, 96, 514–536. [Google Scholar] [CrossRef]
  59. Kohli, D.; Sliuzas, R.; Kerle, N.; Stein, A. An ontology of slums for image-based classification. Comput. Environ. Urban Syst. 2012, 36, 154–163. [Google Scholar] [CrossRef]
  60. UN-Habitat. The Challenges of Slums: Global Report on Human Settlements 2003; Earthscan: London, UK, 2003. [Google Scholar]
  61. Government of Rwanda. Law N° 27/2021 of 10/06/2021 Governing Land in Rwanda. 2021. Available online: https://www.lands.rw/index.php?eID=dumpFile&t=f&f=63561&token=c5f5e724c9648319ff46143dc105c89226f1410f (accessed on 17 May 2024).
  62. Uwayezu, E.; de Vries, W.T. Can In-Kind Compensation for Expropriated Real Property Promote Spatial Justice? A Case Study Analysis of Resettlement in Kigali City, Rwanda. Sustainability 2020, 12, 3753. [Google Scholar] [CrossRef]
Figure 1. Map of Kigali city and the selected sites.
Land 13 01429 g001
Figure 2. Steps and process followed by the study.
Land 13 01429 g002
Figure 3. Characteristics of physical environment of neigborhoods across the study sites.
Land 13 01429 g003
Figure 4. Responses according to housing materials, building shapes, sizes, and access to basic amenities.
Land 13 01429 g004
Figure 5. Tenure rights based on land and/or property documentation, acquisition methods, and duration of occupation.
Land 13 01429 g005
Figure 6. Perceptions of respondents on tenure (in)security.
Land 13 01429 g006
Figure 7. Scatter plot of respondents in 2-dimensional space on the first and second dimension of MCA.
Land 13 01429 g007
Figure 8. Squared correlation indicators with the first dimension of MCA.
Land 13 01429 g008
Figure 9. The variation of perceived tenure insecurity across the study sites. A illustrates site of Gatsata (3), b illustrates sites of Kimisagara (2) and Gitega (1).
Land 13 01429 g009
Figure 10. Example of land cover classification results from the model (Left), GLCM texture features (Right).
Land 13 01429 g010
Figure 11. Variable importance based on image-based spatial characteristics extracted at the buffer of 20 m.
Land 13 01429 g011
Figure 12. Variable importance based on image-based spatial characteristics and additional spatial at the buffer of 25 m.
Land 13 01429 g012
Table 1. Variables for predicting perceived tenure insecurity.
CategoryVariableDescription
Land coverBuilt-up areaPercentage of built-up areas
Dense green spacePercentage of dense green spaces
Low green spacePercentage of low green spaces
Paved roads Percentage of paved areas
Unpaved roads and bare landsPercentage of unpaved roads and bare lands
Texture featuresGLCM_ContrastTexture features extracted through GLCM contrast
GLCM_CorrelationTexture features extracted through GLCM correlation
GLCM_DissimilarityTexture features extracted through GLCM dissimilarity
GLCM_EntropyTexture features extracted through GLCM entropy
GLCM_HomogeneityTexture features extracted through GLCM homogeneity
GLCM_MeanTexture features extracted through GLCM mean
GLCM_Second MomentTexture features extracted through GLCM second moment
GLCM_VarianceTexture features extracted through GLCM variance
Additional spatial informationDistance to roadAccessibility to road
Distance to wetlandProximity to wetland
SlopeSlope (%) derived from DEM representing the topography
Residential_R1Planned low residential zone derived from the zoning plan
Residential_R1BPlanned rural residential zone derived from the zoning plan
Transportation facilitiesPlanned transportation facilities derived from the zoning plan
Table 2. Test statistics for the first and second dimensions of each cluster.
Test Statistic
Cluster 1Cluster 2Cluster 3Cluster 4
First dimension−3.797−6.2984.3316.788
Second dimension−2.9703.581−7.0235.517
Table 3. Accuracy metrics for each land cover class.
Land Cover ClassRecallPrecisionF1-Score
Built-up area0.920.900.91
Low green space0.880.890.88
Dense green space0.930.910.92
Paved roads0.850.840.84
Unpaved roads and bare lands0.850.860.85
Table 4. Spatial characteristics describing the variation of perceived tenure insecurity in the study area.
Physical Indicators (from Survey Data)Spatial Characteristics (Detected from VHR GE Image)Comment
Wall materialsDifficult to capture but can be captured using oblique VHR Unmanned Aerial Vehicle image
Location of the neighbourhoodNot detected (Slope was used instead)
House condition+Partially detected through GLCM texture and spectral features
Shape of the house+Partially detected through GLCM texture features
Presence of the wastesNot detected
Size of the house+Partially detected through GLCM texture features
Dominant building size in the neighbourhood +Partially detected through GLCM texture features
Household access to the unpaved road ++Detected as the unpaved road land cover class
Access to green space++Detected as the dense and low green spaces land cover class
Presence of unpaved road in the neighbourhood ++Detected as the unpaved road land cover class
Presence of unpaved footpath +Not fully detected, but a portion of it detected as unpaved roads and bare lands
++ directly detected, + indirectly detected, − not detected.
Table 5. Correlation coefficient between spatial characteristics of urban deprived areas.
Buffer-Wise Squared Correlation (R2)
Buffer (in meters)10152025
Only VHR GE image derived spatial characteristics0.220.270.450.44
With additional spatial information layers0.400.360.600.61
Disclaimer/Publisher’s Note: The statements, opinions and data contained in all publications are solely those of the individual author(s) and contributor(s) and not of MDPI and/or the editor(s). MDPI and/or the editor(s) disclaim responsibility for any injury to people or property resulting from any ideas, methods, instructions or products referred to in the content.

