Abstract
Steppe pastures are characteristic of the Armenian landscape and play an important role in supporting livelihoods and biodiversity conservation. The productivity and biodiversity of steppe pastures depend on grazing management, soil types, and climatic and topographical characteristics. As a whole, they form local small-scale sites. Our data on five study sites located on the southeast slope of Mt. Aragats summarized the impact of sites and grazing on canopy height; productivity; grass, legume, and forb biomass; nitrogen, phosphorus, and potassium concentrations; pH; and litter contents in the soil. Five grazed and ungrazed plots (ca. 600–800 m2) were established at each study site. Within each plot, two permanent 40 m long transects were installed. The canopy height was recorded in ungrazed and freely grazed plots. The aboveground biomass was cut at the soil surface from May to June; grouped into grass, legumes, and forbs; dried; and weighed. Soil samples were collected in every ungrazed and freely grazed plot. The results indicated that grazing decreased the plant parameters and nitrogen and litter content across all sites, while it had no effect on the phosphorus and potassium content or the pH. It seems that plant parameters, as well as soil parameters, were more affected by the management strategy than by the topographical and climatic features of the sites, as revealed via redundancy analysis. Our results suggest that it is important to introduce livestock rotation practices for sites with respect to the sustainable management of steppe pastures. This management strategy could ensure ecosystem services, high forage quality, and soil fertility.
1. Introduction
The Eurasian steppe is one of the largest vegetation types (8–13 million km2), and it is located in different regions. Steppes are diverse ecosystems in terms of abiotic conditions and biotic composition [1]. They originated from the transformation of forest stands by herbivores [2]; as a result, steppes are characterized by a gradual development of vegetation. Climatic conditions and human activities are the main determinants that shape species composition and diversity in these ecosystems. The grasslands of steppes are usually grazed, and livestock farming comprises the traditional land use type [3].
In terms of climatic conditions, temperature, precipitation, and solar radiation are the main drivers for steppe vegetation growth [4] and the duration of the growth period [5]. The results of regional and local studies emphasized the role of annual precipitation, which explains up to 90% of the variation in the aboveground biomass of natural ecosystems [6,7,8,9,10,11,12,13]. Thus, due to global warming, biodiversity changes and the accumulation of different elements in soils are occurring [14,15,16,17,18]. In meadow steppes, low temperatures and a high soil moisture index depress the growth of grass with roots accumulating in the 0–10 cm soil layer [19].
Several research studies focusing on the effects of human-induced processes on the productivity and soil structure of grasslands have been conducted over the years [20,21]. Most studies show that the most significant factor that leads to changes in the structure of grassland and soil properties is grazing by animals. There are contrasting results in the literature regarding the impact of grazing on biodiversity and soil nutrient contents. Grazing by herbivores supports the intake of mineral elements in soil and can positively modify nutrient cycling from soil to plant tissue [22,23]. Light grazing can increase grassland productivity if soil moisture and nutrients are available. Additionally, light grazing suggests increasing species richness via the succession of grassland to woodland [24,25]. In semiarid steppes with perennial grasses and forbs, continuous grazing leads to low productivity due to the substantial spreading of short plant species and decreasing species diversity [26]. Severe drought combined with grazing can negatively change species and functional component compositions in arid steppes [9].
Grazing exclusion experiments have been widely carried out in order to restore vegetation and soil properties in different steppe grasslands. Both 11-year and 31-year grazing exclusion in Leymus chinensis grasslands significantly improved vegetation characteristics (i.e., biomass, cover, richness, etc.) and soil organic carbon contents [26]. Sixteen years of grazing exclusion in the arid rangelands in Baluchistan (Pakistan) increased vegetation by 54–74% and soil organic carbon content by 46–54% and improved nitrogen mineralization, soil aggregation, and the water holding capacity [27]. Eight years of excluding grazing tripled the biomass production in desert steppe of the Junggar Basin region, China, and improved plant cover, especially for perennial grass; in addition, soil organic carbon (in the 0–10 cm layer) was increased by 66%, total nitrogen by 110%, and total phosphorus by 114% [28]. The contents of soil organic carbon, N, Ca, and K exhibited increasing trends as the time of grazing exclusion increased, while there was an opposite trend for Na and pH in Stipa tenacissima steppe [29]. Soil organic carbon and N decreased with increasing stocking rates in Inner Mongolian grasslands. Moreover, grazing exclusion enhanced soil C storage in sand grasslands in the Horqin region [30].
Armenia is a mountainous country, and steppes occupy large territories from low-altitude (500 m) to high-altitude belts (2500 m). Steppes are spread over flat areas as well as steep slopes and on thick, fine-grained and stony weathered soils [31]. Steppes are characterized by diverse vegetation composition with xerophilic and mesophilic species [32], and they play an important role in biodiversity protection and landscape preservation. In addition, steppes serve as a principal feed source for domestic animals and are therefore of economic importance for animal husbandry in the country [33]. More than 12% of the total area of pastures (about 1 million ha) is located near settlements and subjected to grazing. Due to the absence of legal regulations on grazing and the financial means for the transportation of animals to high mountain pastures, these areas are at risk of degradation. Grazing results in changes to floristic composition, an increased percentage of bare soil, and reduced productivity of steppe grasslands [34].
Despite the importance assigned to pasture management, limited information is available on the impact of grazing on vegetation and soil parameters of small-scale pasture sites. The main objective of this study was to investigate the effect of grazing and local edaphoclimatic conditions on vegetation and soil parameters in five pasture sites of Mt. Aragats in Armenia (Table 1). The following questions were addressed: (1) Is there any differentiation in productivity and floristic composition between sites? (2) Is there any differentiation in soil N, P2O5, K, litter content, and pH between sites? (3) How do the grazing and local edaphoclimatic conditions affect the vegetation and soil parameters of the sites? This study contributes to the identification of the main determinants of steppe pasture productivity, forage quality, and soil fertility, and it highlights the necessity for the implementation of an appropriate grazing management plan.

Table 1.
Geographical, climatic, and soil characteristics of sites in the steppe zone of Mt.Aragats [https://www.arcgis.com/apps/mapviewer/index.html (accessed on 18 January 2023)]. FUP = forage utilization percentage.
2. Materials and Methods
2.1. Study Area
The study was carried out in a steppe zone in the southeastern part of Mt. Aragats, Armenia (Figure 1). The area belongs to the Nerkin Sasnashen (NSSH), Avan (AVN), Antarut (ANT), and Artashavan (ART) communities of Aragatsotn Marz. It is located between 43.976266–44.386365 E/40.316728–40.38736 N and at elevations of 1300–1800 m a.s.l. (Table 1).
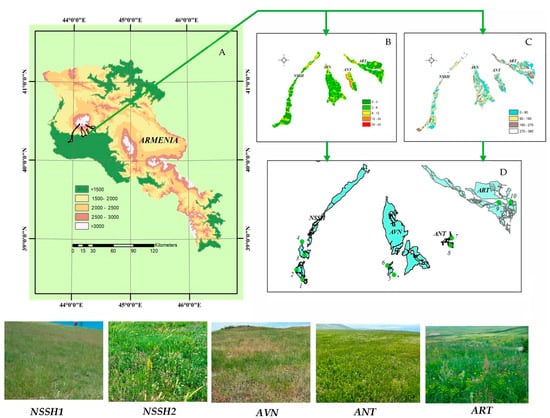
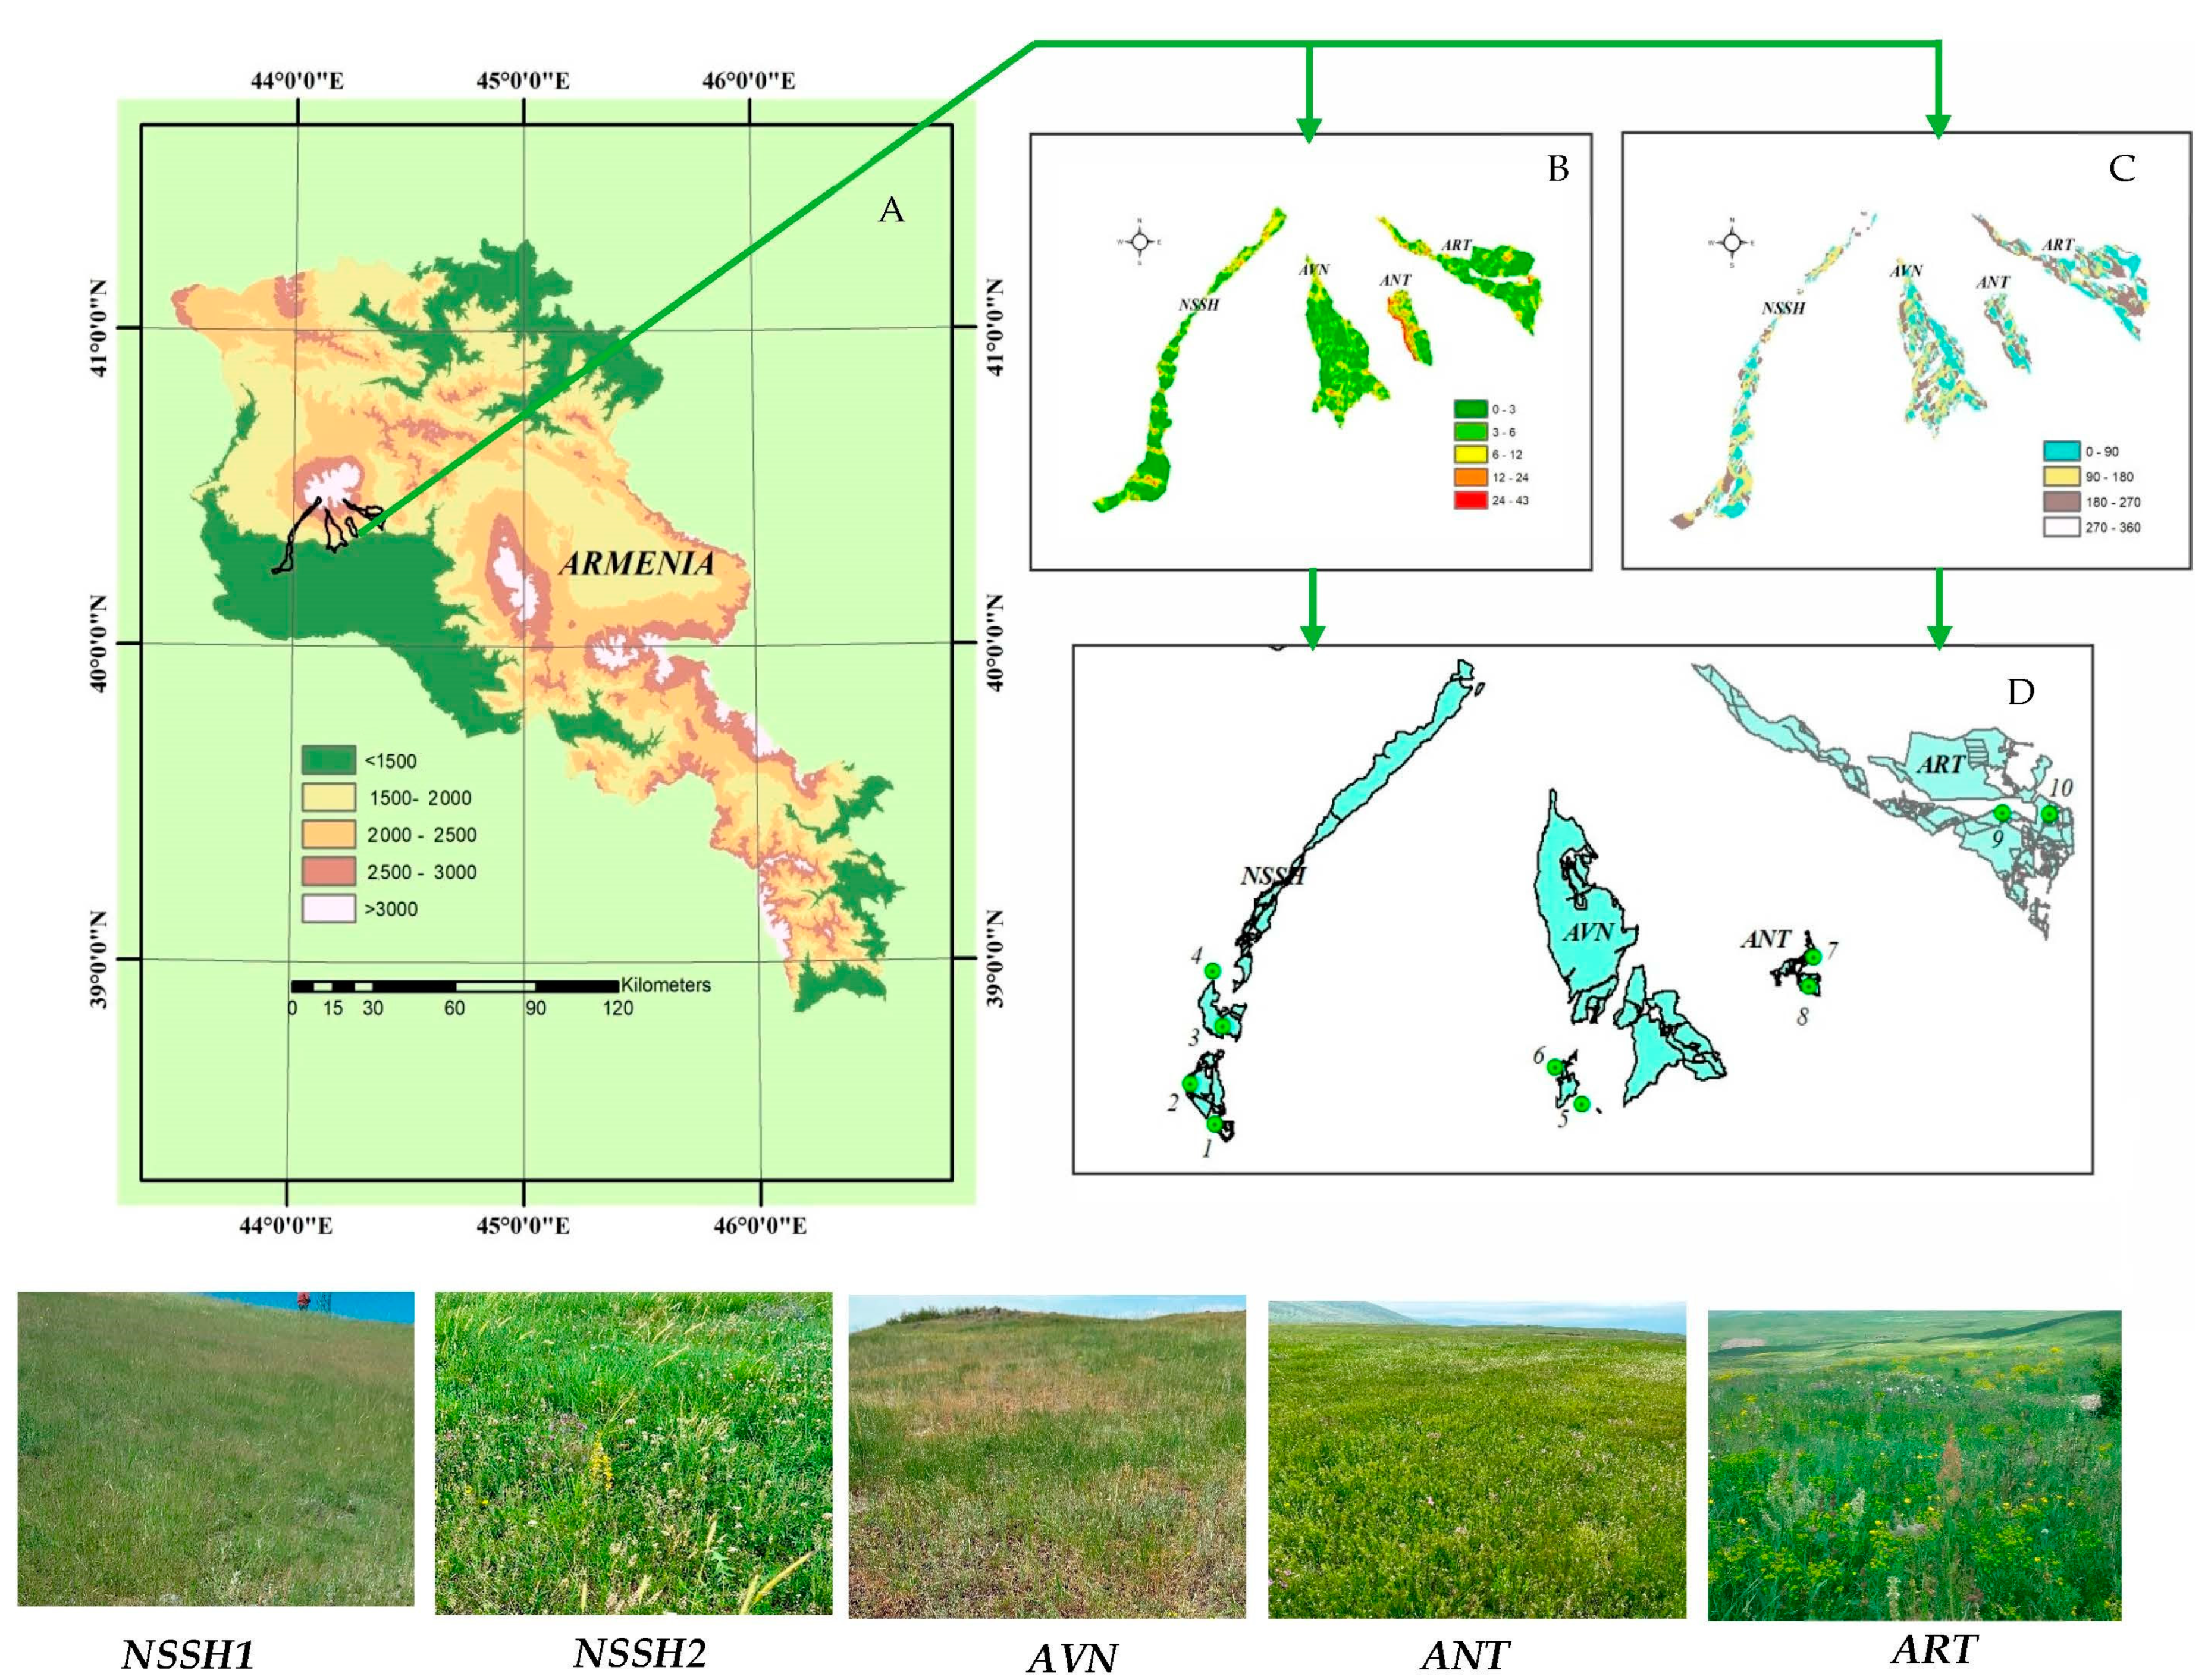
Figure 1.
Location of study area on Mt. Aragats, Armenia (A); its geomorphological characteristics (B—slope 0; C— exposure 0); study sites in rangelands of NSSH, AVN, ANT, and ART communities, where 1, 3, 5, 7, and 9 are grazed plots, and 2, 4, 6, 8, and 10 are ungrazed plots (D).
The study sites were located 11 and 37 km apart (Figure 1). The predominant rocks comprise mid- and upper-quaternary basaltic andesite lava, which forms many hills and mounds on the surface, with small plateaus between them. Thus, the terrain usually consists of hills with different steepness levels and flat areas. The soils in this area range from chernozem-like to dark and light chestnut types [31].
The studied steppe pastures cover an area of about 4600 ha, and according to information provided by the community administration, there are about 2800 heads of cattle of the Caucasian brown breed and 6080 heads of semi-coarse-wooled Balbas sheep. These breeds are the most adapted to the conditions of Armenia and are successfully bred for the production of milk and meat. Within these pastures, there are private plots that are fenced and protected from grazing, and they often serve as hayfields (ungrazed plots: forage utilization percentage, FUP = 0%). Additionally, pastures near villages are public and communally grazed by the entire livestock of the community from early spring to late autumn (freely grazed plots) in a continuous grazing system.
2.2. Climate
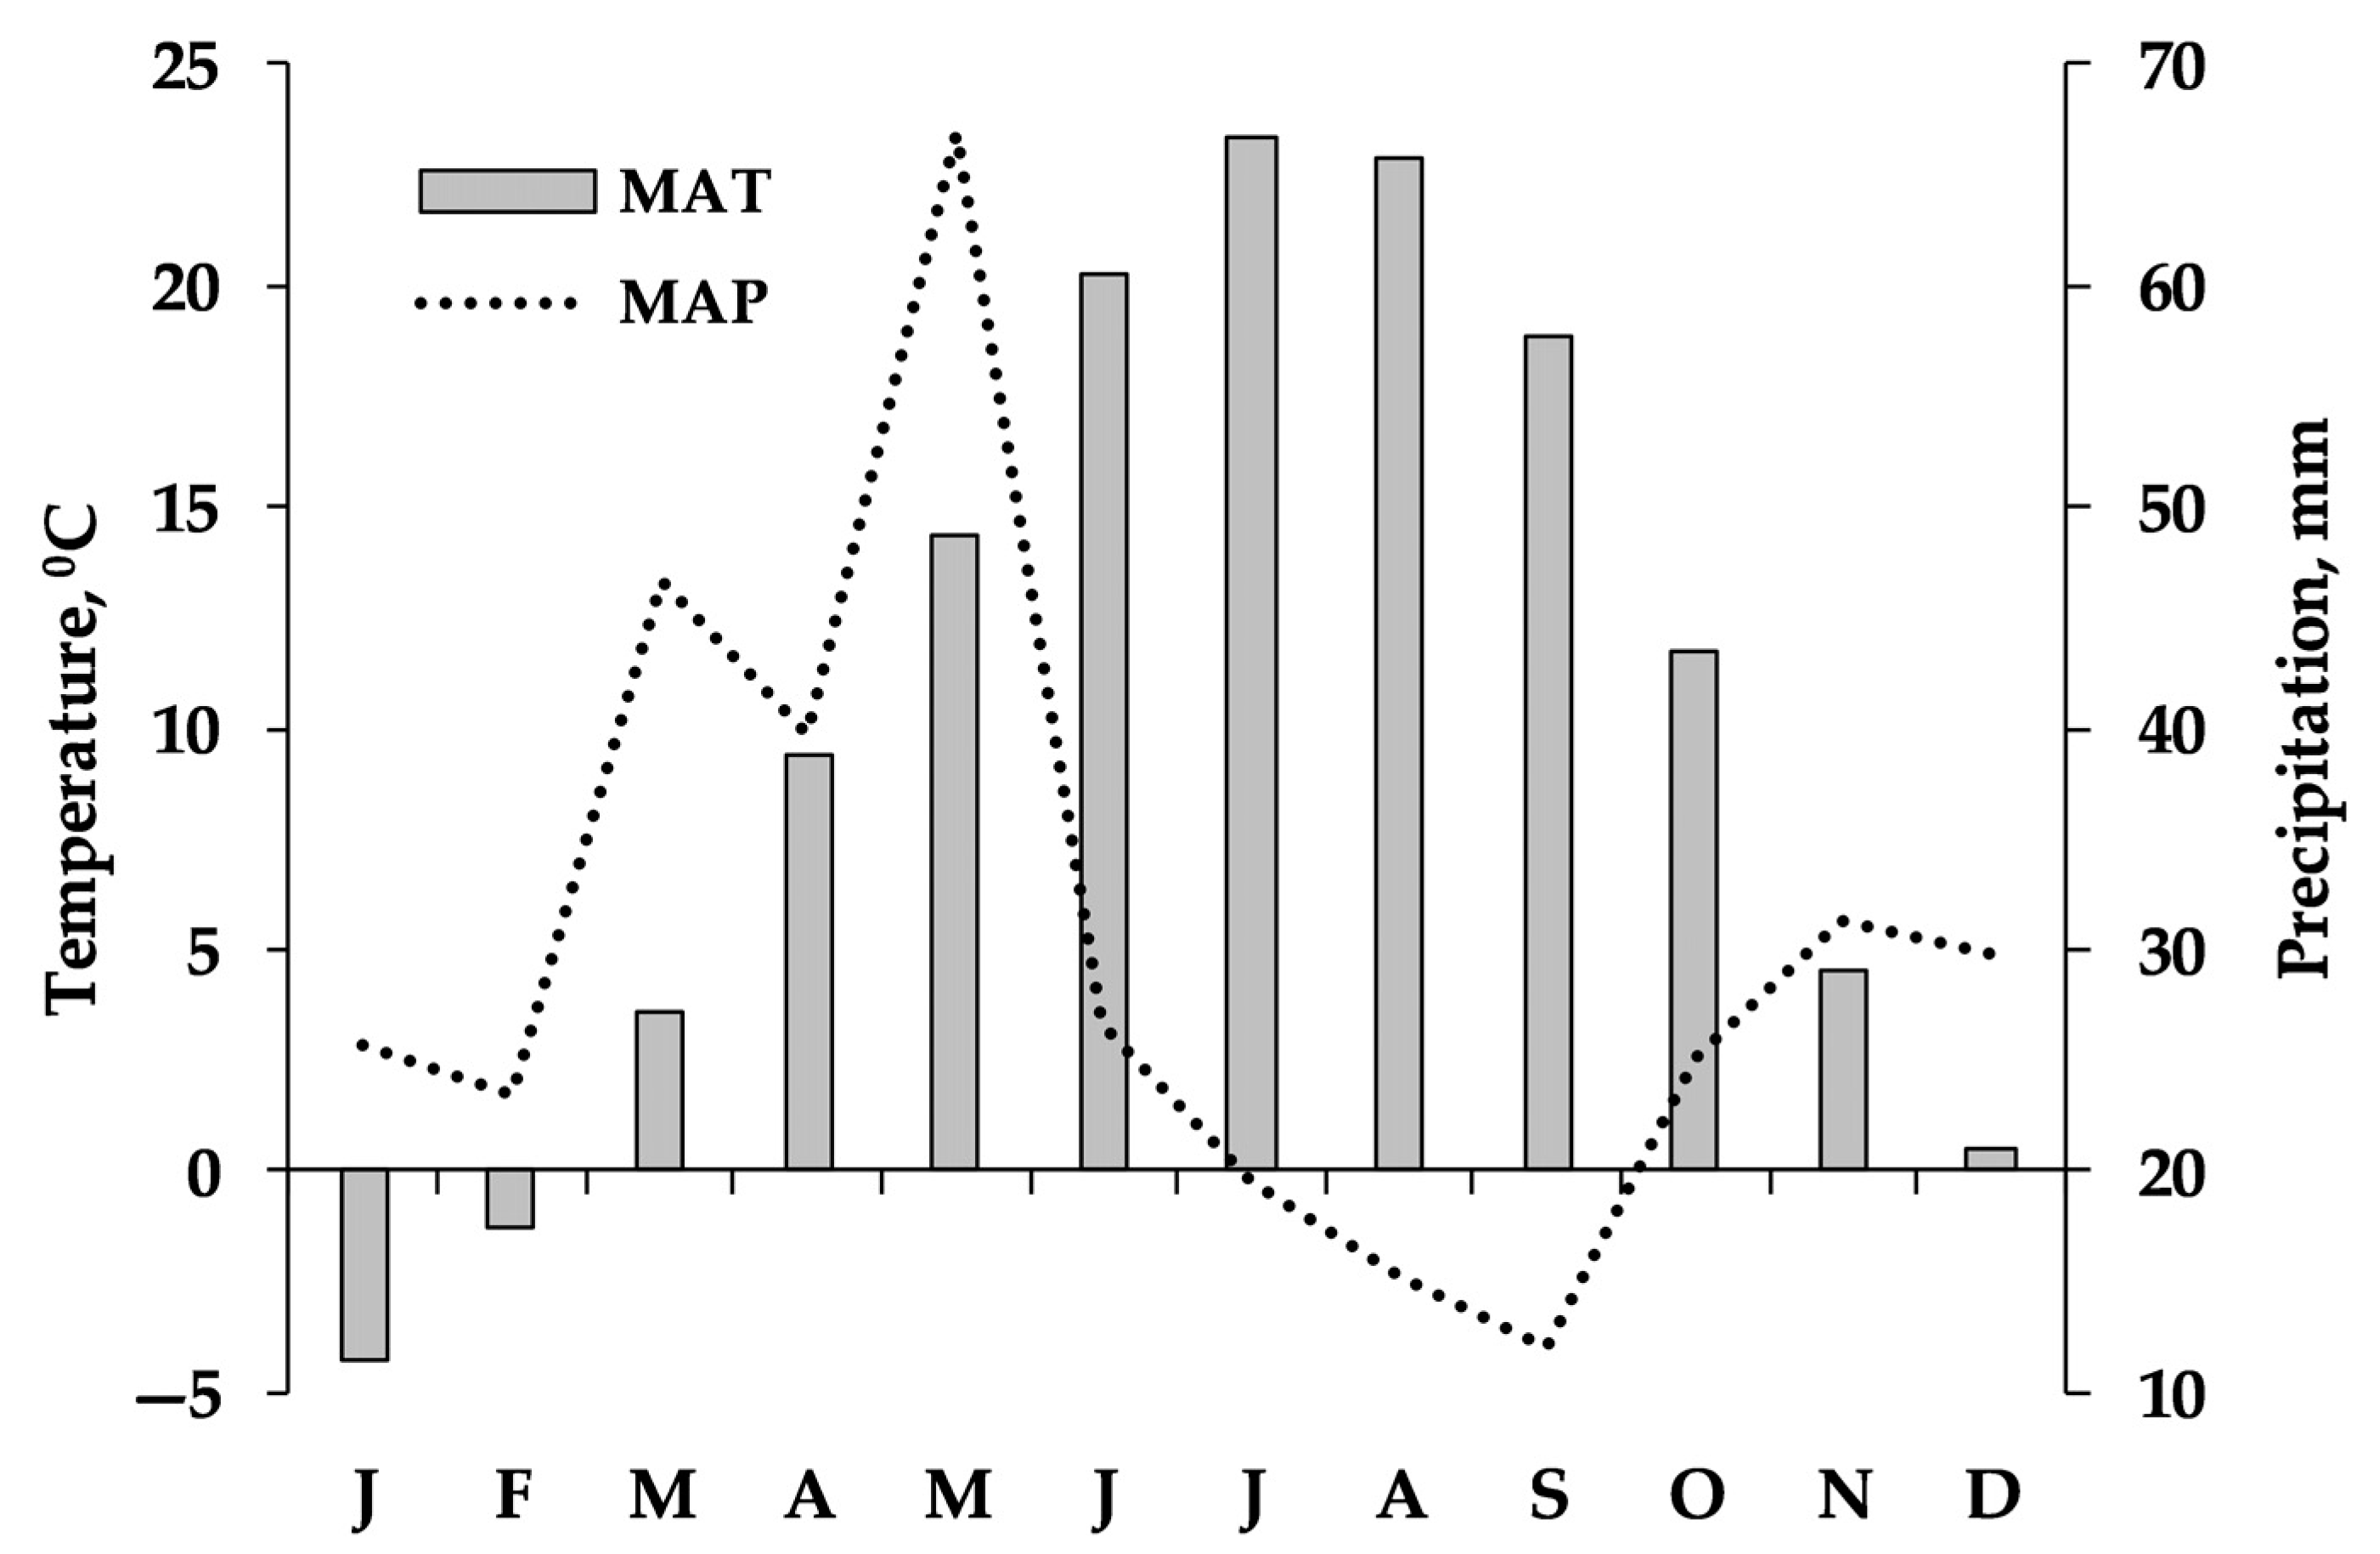
According to the Köppen–Geiger climate classification, the climate of the area is classified as cold and semi-arid (Bsk). Based on 6-year mean meteorological data obtained from 4 Meteorological Stations of the Ministry of Environment of Armenia for the 2017–2022 period (Figure 2), during the winter, the temperature ranged from 0.5 to −4.3 °C, and during summer, it was 22.2 °C on average. The mean annual temperature (MAT) during the growing season was 10.3–23.2 °C, reaching a maximum in July. At the same time, the mean annual precipitation (MAP) was 362 mm with about 55% falling during the growing season. Precipitation is below the potential evapotranspiration (800–1000 mm) level in the study area. During the experimental years (2019–2021), precipitation and temperature, as well as their seasonal distribution, exhibited similar trends to those of the 6-year period (Figure 2). Table 1 also presents the climatic data obtained from the closest weather stations (10–15 km) of the study sites. According to these data, the MAP ranged from 227 mm in 2021 at NSSH1 to 549 mm in 2022 at AVN (growing and non-growing season precipitation was 219 and 162 mm or 58 and 42% of annual precipitation, respectively). In 2021, the MAT was the highest (12.2 °C) at site NSSH1, and in 2019 (6.7 °C), it was the lowest at site NSSH2.

Figure 2.
Monthly average temperature (°C) and monthly sum precipitation (mm) during the period 2017–2022 in the study area. The data were recorded by the Armavir, Talin, Amberd, and Eghvard Meteorological Stations of the Ministry of Environment of the Republic of Armenia.
2.3. Vegetation
The growing season for vegetation in the study area, including sod-forming grass, varies from 4 to 5 months (from March to July) [35,36]. Ephemeral species such as Poa bulbosa L., Colpodium humile (M.B.) Grisb. dominate in early spring, while perennial forbs and legumes dominate in early summer. The dominant species in this steppe zone are as follows: Bromus fibrosus E. Hack, Festuca sulcata E. Hack. Rizh., Hordeum crinitum Desf., Koeleria nitidula Vel., Agropyrum trichophorum Richt., A. cristatum (Schreb) P.B., Aegilops cylindrica Host., Poa bulbosa L., Nepeta mussinii Henke, Xeranthemum squarrosum Boiss., Artemisia austriaca Jack., Thymus kotschyanus Boiss., Pyrethrum myriophyllum C.A.M., Achillea micrantha M.B., Medicago sativa L., and Onobrychis michauxii D.C, among others.
2.4. Sampling
Five sites were established in the study area: two in NSSH and one each in AVN, ANT, and ART (Figure 1). At each site, grazed and ungrazed plots were selected (10 in total) that were about 600–800 m2 in size. Within each plot, two permanent 40 m long transects were placed. The aboveground biomass was cut at the soil level from June to July using 8 quadrats (1 m × 1 m) at a 5 m interval along each transect (i.e., 16 quadrats per plot). The height of the canopy cover was measured with a meter ruler. The total aboveground biomass (TAGB) was grouped into 3 functional groups, namely, grass (G), forbs (F), and legumes (L), according to [37], dried in an oven at 65 °C for 48 h, and weighed.
Three soil samples were collected (400 cm2 = 0.20 m × 0.20 m) in each experimental plot from the 0–20 cm soil layer along each transect (six samples per plot). In the laboratory, plant remains, stones, and roots were removed from the soil sample, and then they were dried at about (60 to 70 °C) for 48 h and passed through a metal sieve with 1 mm diameter holes. Then, the soil sample was averaged several times, bringing it to 100–150 g.
Hygroscopic moisture was determined by the weight difference before and after drying at 105 ± 50 °C until constant weight was reached (ISO 11465:1993) [38]. The pH of the soil solution was determined according to ISO 10390:2021 [39]. Soil suspensions for the determination of total nitrogen (N), total phosphorus (P2O5), and potassium (K) were obtained by boiling the sample in sulfuric acid followed by the addition of hydrogen peroxide at a temperature not exceeding 400 °C. The N content was determined using a modified Kjeldahl method (ISO 11261:1995) [40], P2O5 was measured using a modified spectrophotometric method in Truog’s fume hood (ISO 11263:1994) [41,42], and K was measured using a flame emission spectrometer (calibration method). For the determination of organic matter (litter) in soil, organic carbon was determined via the colorimetric Walkley–Black method [43]. The accuracy (trueness and precision) of measurement methods and results was controlled in accordance with ISO 5725:2023 [44]. N, P, and certified organic matter standard soils were used during measurements to ensure the accuracy of the data obtained.
2.5. Data Analysis
Two-way ANOVA (IBM SPSS Statistics 20), based on general linear models (GLMs), was used in order to detect the effect of grazing and sites (across years) on vegetation and soil parameters. Additionally, the effect of year and sites on the studied parameters was detected via two-way ANOVA separately in ungrazed and freely grazed areas. Tukey’s Studentized range (HSD) was used to compare the difference among means at p ≤ 0.05.
Two redundancy analyses (RDAs) [45] were carried out as follows: RDA1 for the ordination of the plant parameters and RDA2 for soil parameters to test the effect of the climatic and topographical variables of sites that differed by management strategy (Table 1) using XLStat software. Management (freely grazed vs. ungrazed) in RDAs was included in the analysis as a dummy variable.
3. Results
The effect of grazing and sites (across years) was significant for all plant parameters (Table 2). Regarding soil parameters, sites (across years) significantly affected all soil parameters, while grazing only significantly affected N and litter content (Table 2). Additionally, the interaction of grazing and sites was significant (p < 0.05) for G and L, as well as P2O5 and K contents, indicating that the effect of grazing differed among the studied sites (Table 3). No effect was observed with respect to the interaction between grazing and site on TAGB, indicating that grazing, regardless of site conditions and sampling year, plays a crucial role in plant growth and pasture productivity.
Table 2.
Assessment of the impact of year and site on plant cover and soil (depth: 0–20 cm) parameters of ungrazed (UGR) and freely grazed (FG) pasture plots in the steppe zone of Mt. Aragats. CH: canopy height; TAGB: total aboveground biomass; G: grass; L: legumes; F: forbs.
Table 3.
Plant cover and soil (depth: 0–20 cm) parameters with respect to the average of ungrazed and freely grazed sites in the steppe pastures of Mt. Aragats.
Significant differences were recorded among ungrazed and freely grazed sites for all studied plant parameters (Table 3). The highest mean values for all plant parameters were recorded in the ungrazed steppe pasture plots (Table 3). In particular, the mean values of canopy height (CH) and TAGB of ungrazed plots were 1.5 and 2.2 times higher than in freely grazed plots. Similarly, the botanical composition (G, L, and F) in ungrazed plots was 2.6, 3.2, and 1.6 times higher than in the freely grazed plots, respectively.
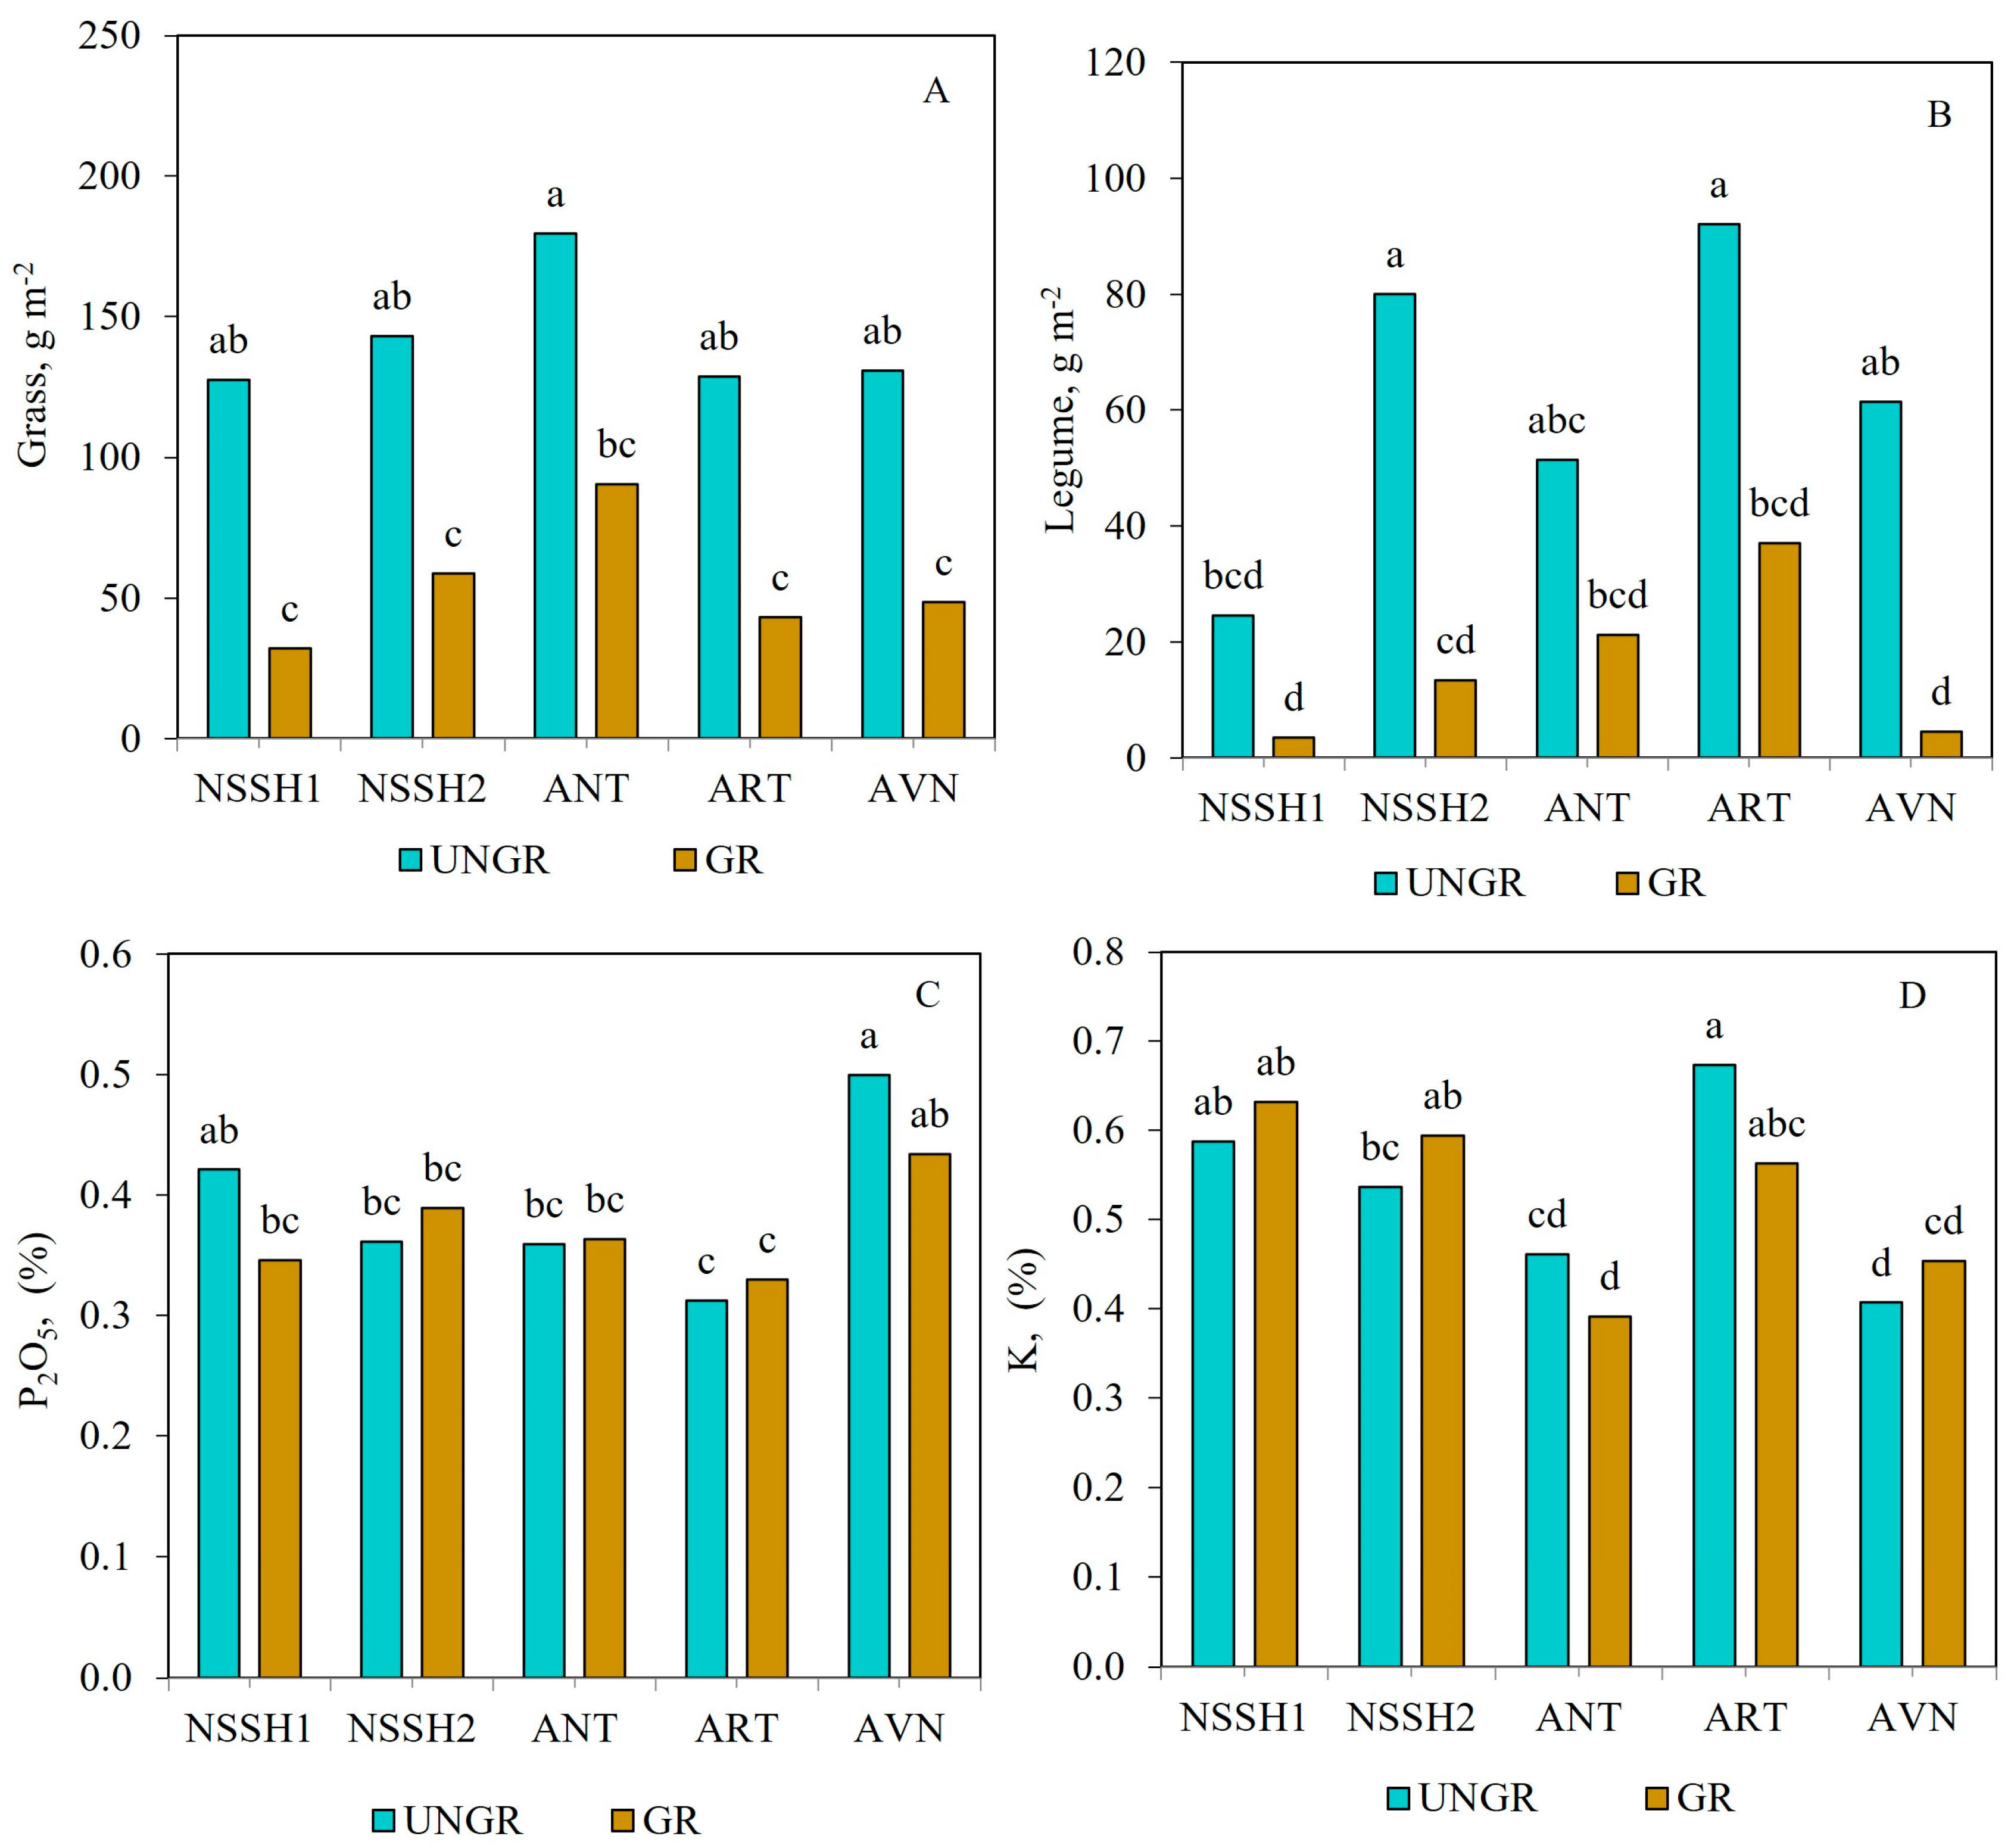
Regarding soil parameters, significant differences were observed with respect to N and litter contents, which were higher in ungrazed plots (0.46% and 6.20%, respectively). The P2O5, K, and pH values did not change with respect to ungrazed and freely grazed sites (Table 3). The G biomass (across sites) was higher in ungrazed plots compared to freely grazed plots at all sites (Figure 3A), while in both cases, there were no significant differences among them. However, the G biomass tended to be higher in ANT for both grazed and ungrazed plots. The L biomass (across years) was significantly higher in the ungrazed plots of NSSH2 and ART sites compared to NSSH1 (Figure 3B). On the other hand, the lowest L biomass was found in the grazed plots of NSSH1 and AVN sites (3.5 and 4.6 g m−2, respectively).
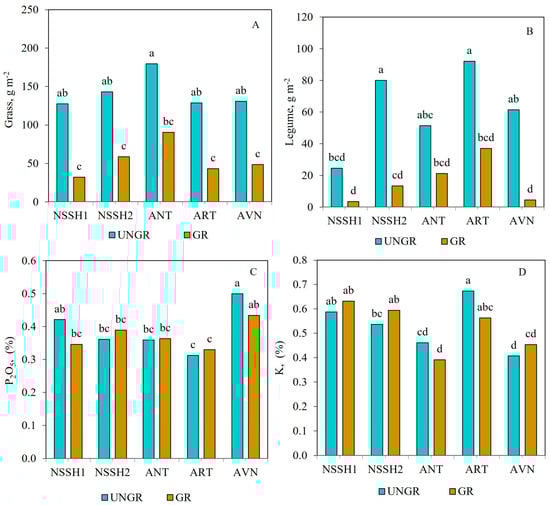
Figure 3.
Effects of grazing and site interaction on G (A) and L biomass (B) and P2O5 (C) and K (D) contents of the steppe zone pasture plots. Columns with the same letter are not significantly different (p > 0.05).
P2O5 content was similar between ungrazed and grazed plots for all sites, although it tended to be lower in grazed plots compared to ungrazed plots in NSSH1 and AVN (Figure 3C). There were no consistent trends between ungrazed and grazed plots for K content in the studied sites. Thus, K content did not differ between ungrazed and grazed plots at NSSH1, and it tended to be lower in the grazed plots at NSSH2 and AVN and higher in the grazed plots at ANT and ART compared to ungrazed ones (Figure 3D). The effect of years was studied separately in ungrazed and freely grazed plots at the studied sites. In this respect, the effect of year (across all sites) was not significant at ungrazed and freely grazed plots for all studied parameters, except the TAGB of grazed plots (Table 2). The site effect (across all years) was significant for all plant and soil parameters in both ungrazed and grazed plots, except for G biomass in ungrazed ones (Table 2).
The ungrazed plots of sites ANT, ART, and AVN (across years) had significantly higher TAGB compared to NSSH1 (Table 4). The CH was higher in the ungrazed plots of NSSH2, ANT, and ART in comparison to NSSH1 and AVN (Table 4). The TAGB increased from 270 g m−2 at NSSH1 to 349 g m−2 at ANT, and the CH increased from 25 cm at NSSH1 to 42 cm at ART. Regarding the botanical composition, small differences were recorded among the sites.
Table 4.
Means of plant cover and soil (depth: 0–20 cm) parameters in ungrazed plots in the steppe pastures of Mt. Aragats.
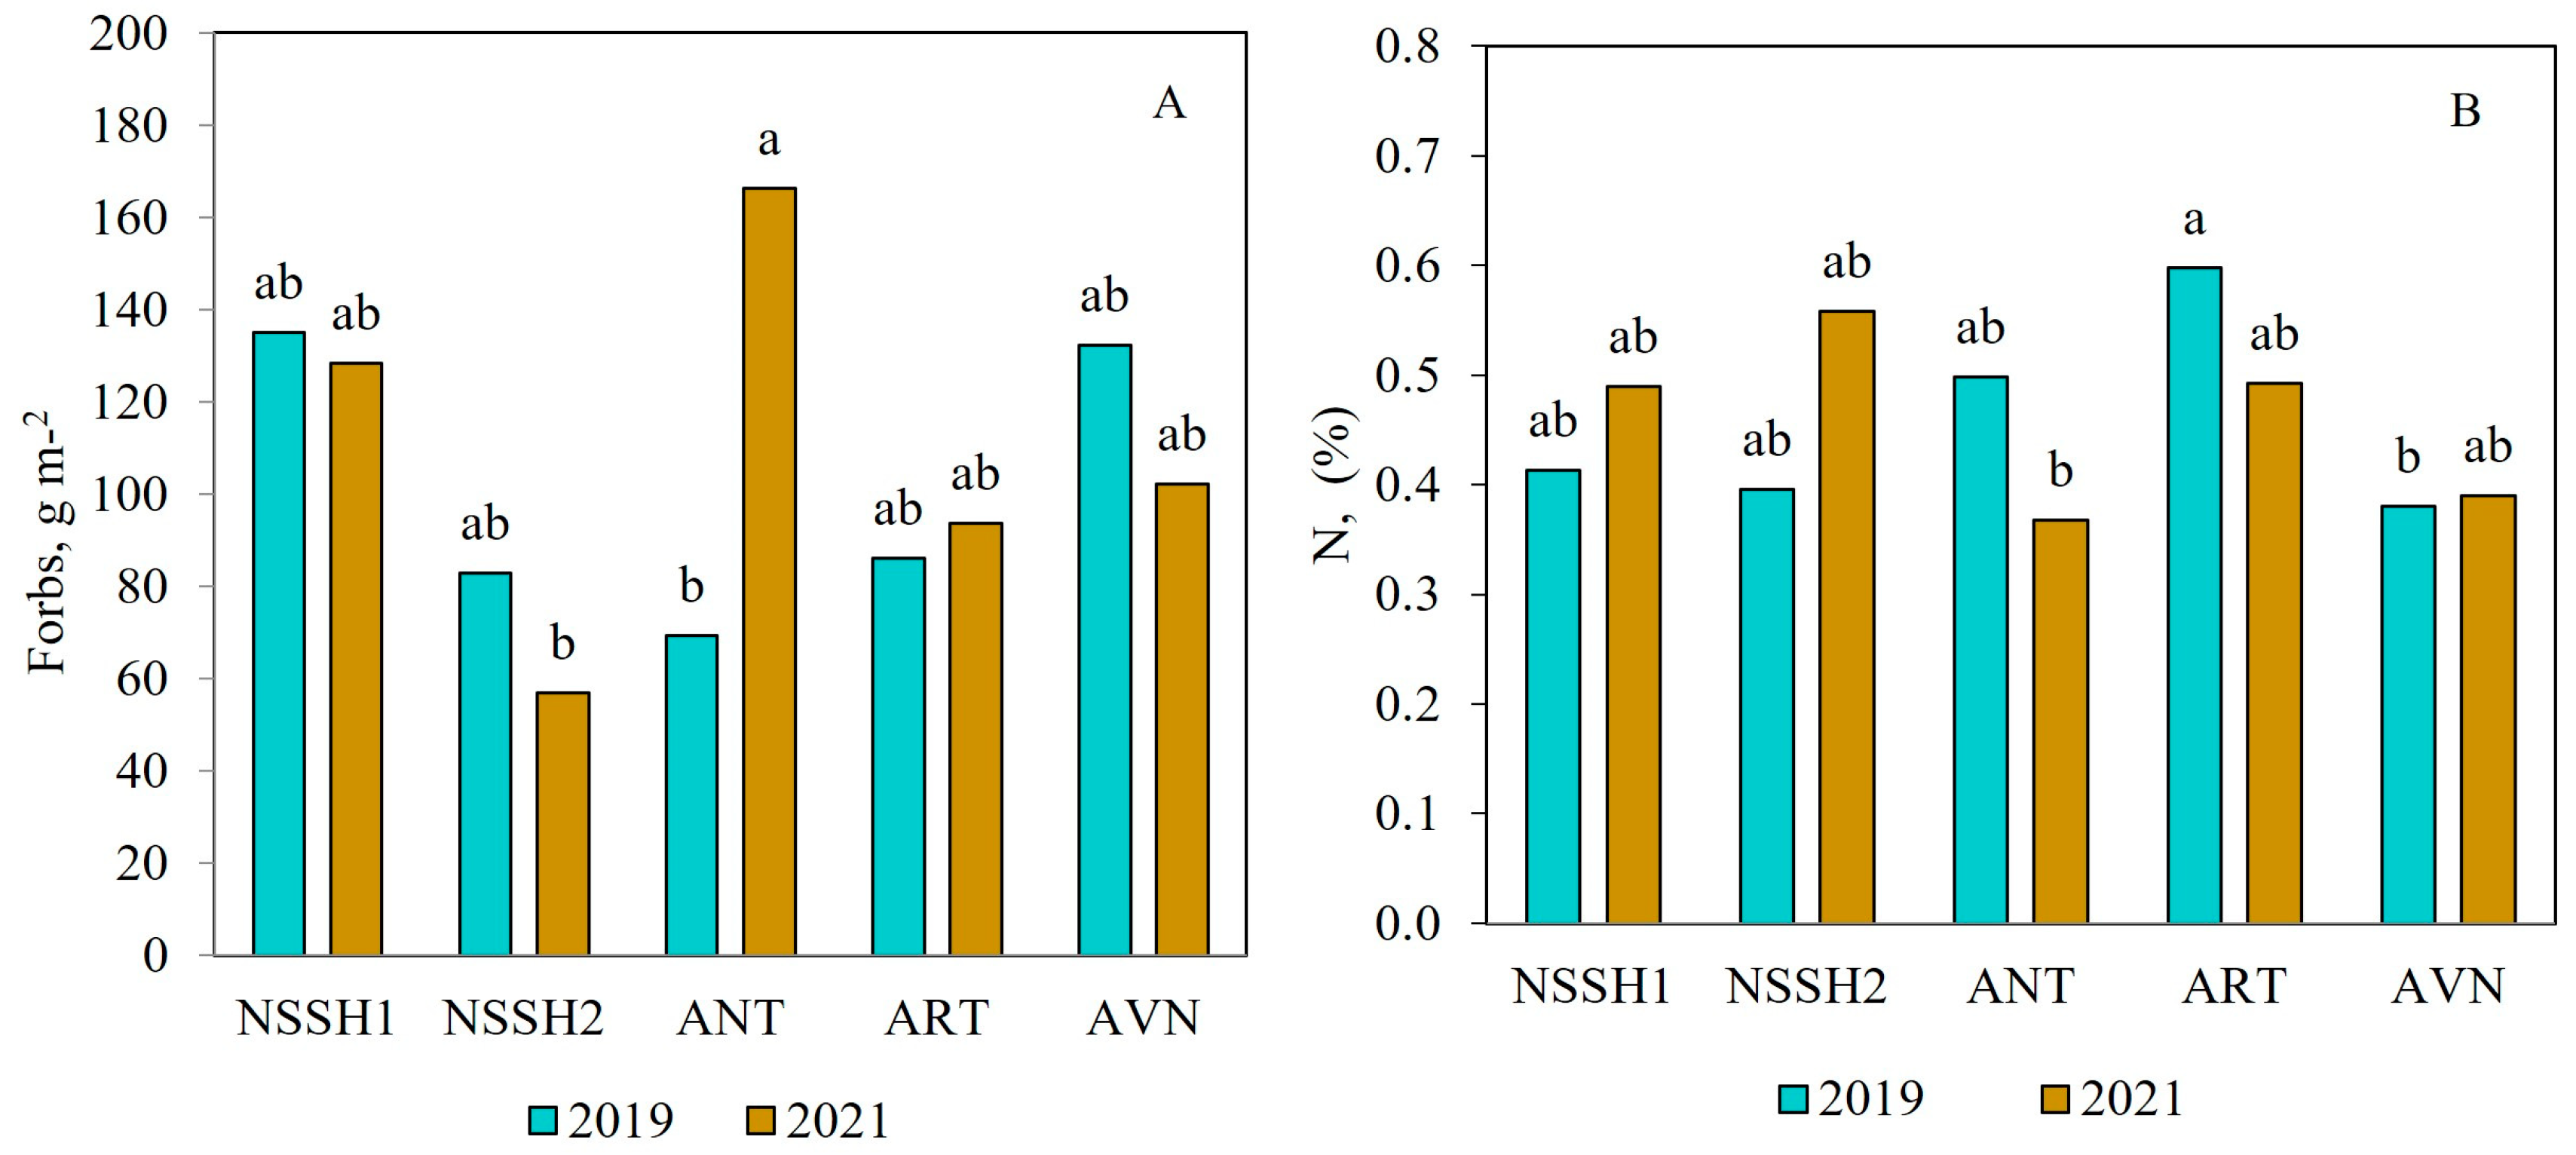
The highest biomass of G (180 g m−2), L (92 g m−2), and F (138 g−2) was recorded at ANT, ART, and NSSH1, respectively (Table 4). Only the F biomass in ANT differed between the two years of study. It was significantly higher in the second year compared to the first (Figure 4A). Regarding soil parameters, the ungrazed AVN site had significantly lower contents of N and K, while the ART site exhibited higher litter content compared to the other sites, and small differences were observed between years (Table 4 and Figure 4B).

Figure 4.
Effect of site and year interaction on F biomass (A) and N content (B) in ungrazed plots in the steppe pastures of Mt. Aragats. Columns with the same letter are not significantly different (p > 0.05).
TAGB in freely grazed plots at NSSH1 and AVN (across years) was significantly lower than that at NSSH2, ANT, and ART sites. The CH was higher at the ANT site compared to NSSH1, NSSH2, ART, and AVN. Concerning the botanical composition, the highest biomass of G and F (90 g m−2 105 g m−2 respectively) was recorded in ANT, and the highest biomass of L was observed in ART (37 g m−2). On the other hand, the lowest biomass of G and L was in NSSH1, and the lowest biomass of F was in AVN. N and litter contents were significantly higher at the ART site, P2O5 was higher in AVN, and K was higher in NSSH1 (Table 5).
Table 5.
Means of plant cover and soil (depth: 0–20 cm) parameters in freely grazed plots in the steppe pastures of Mt. Aragats.
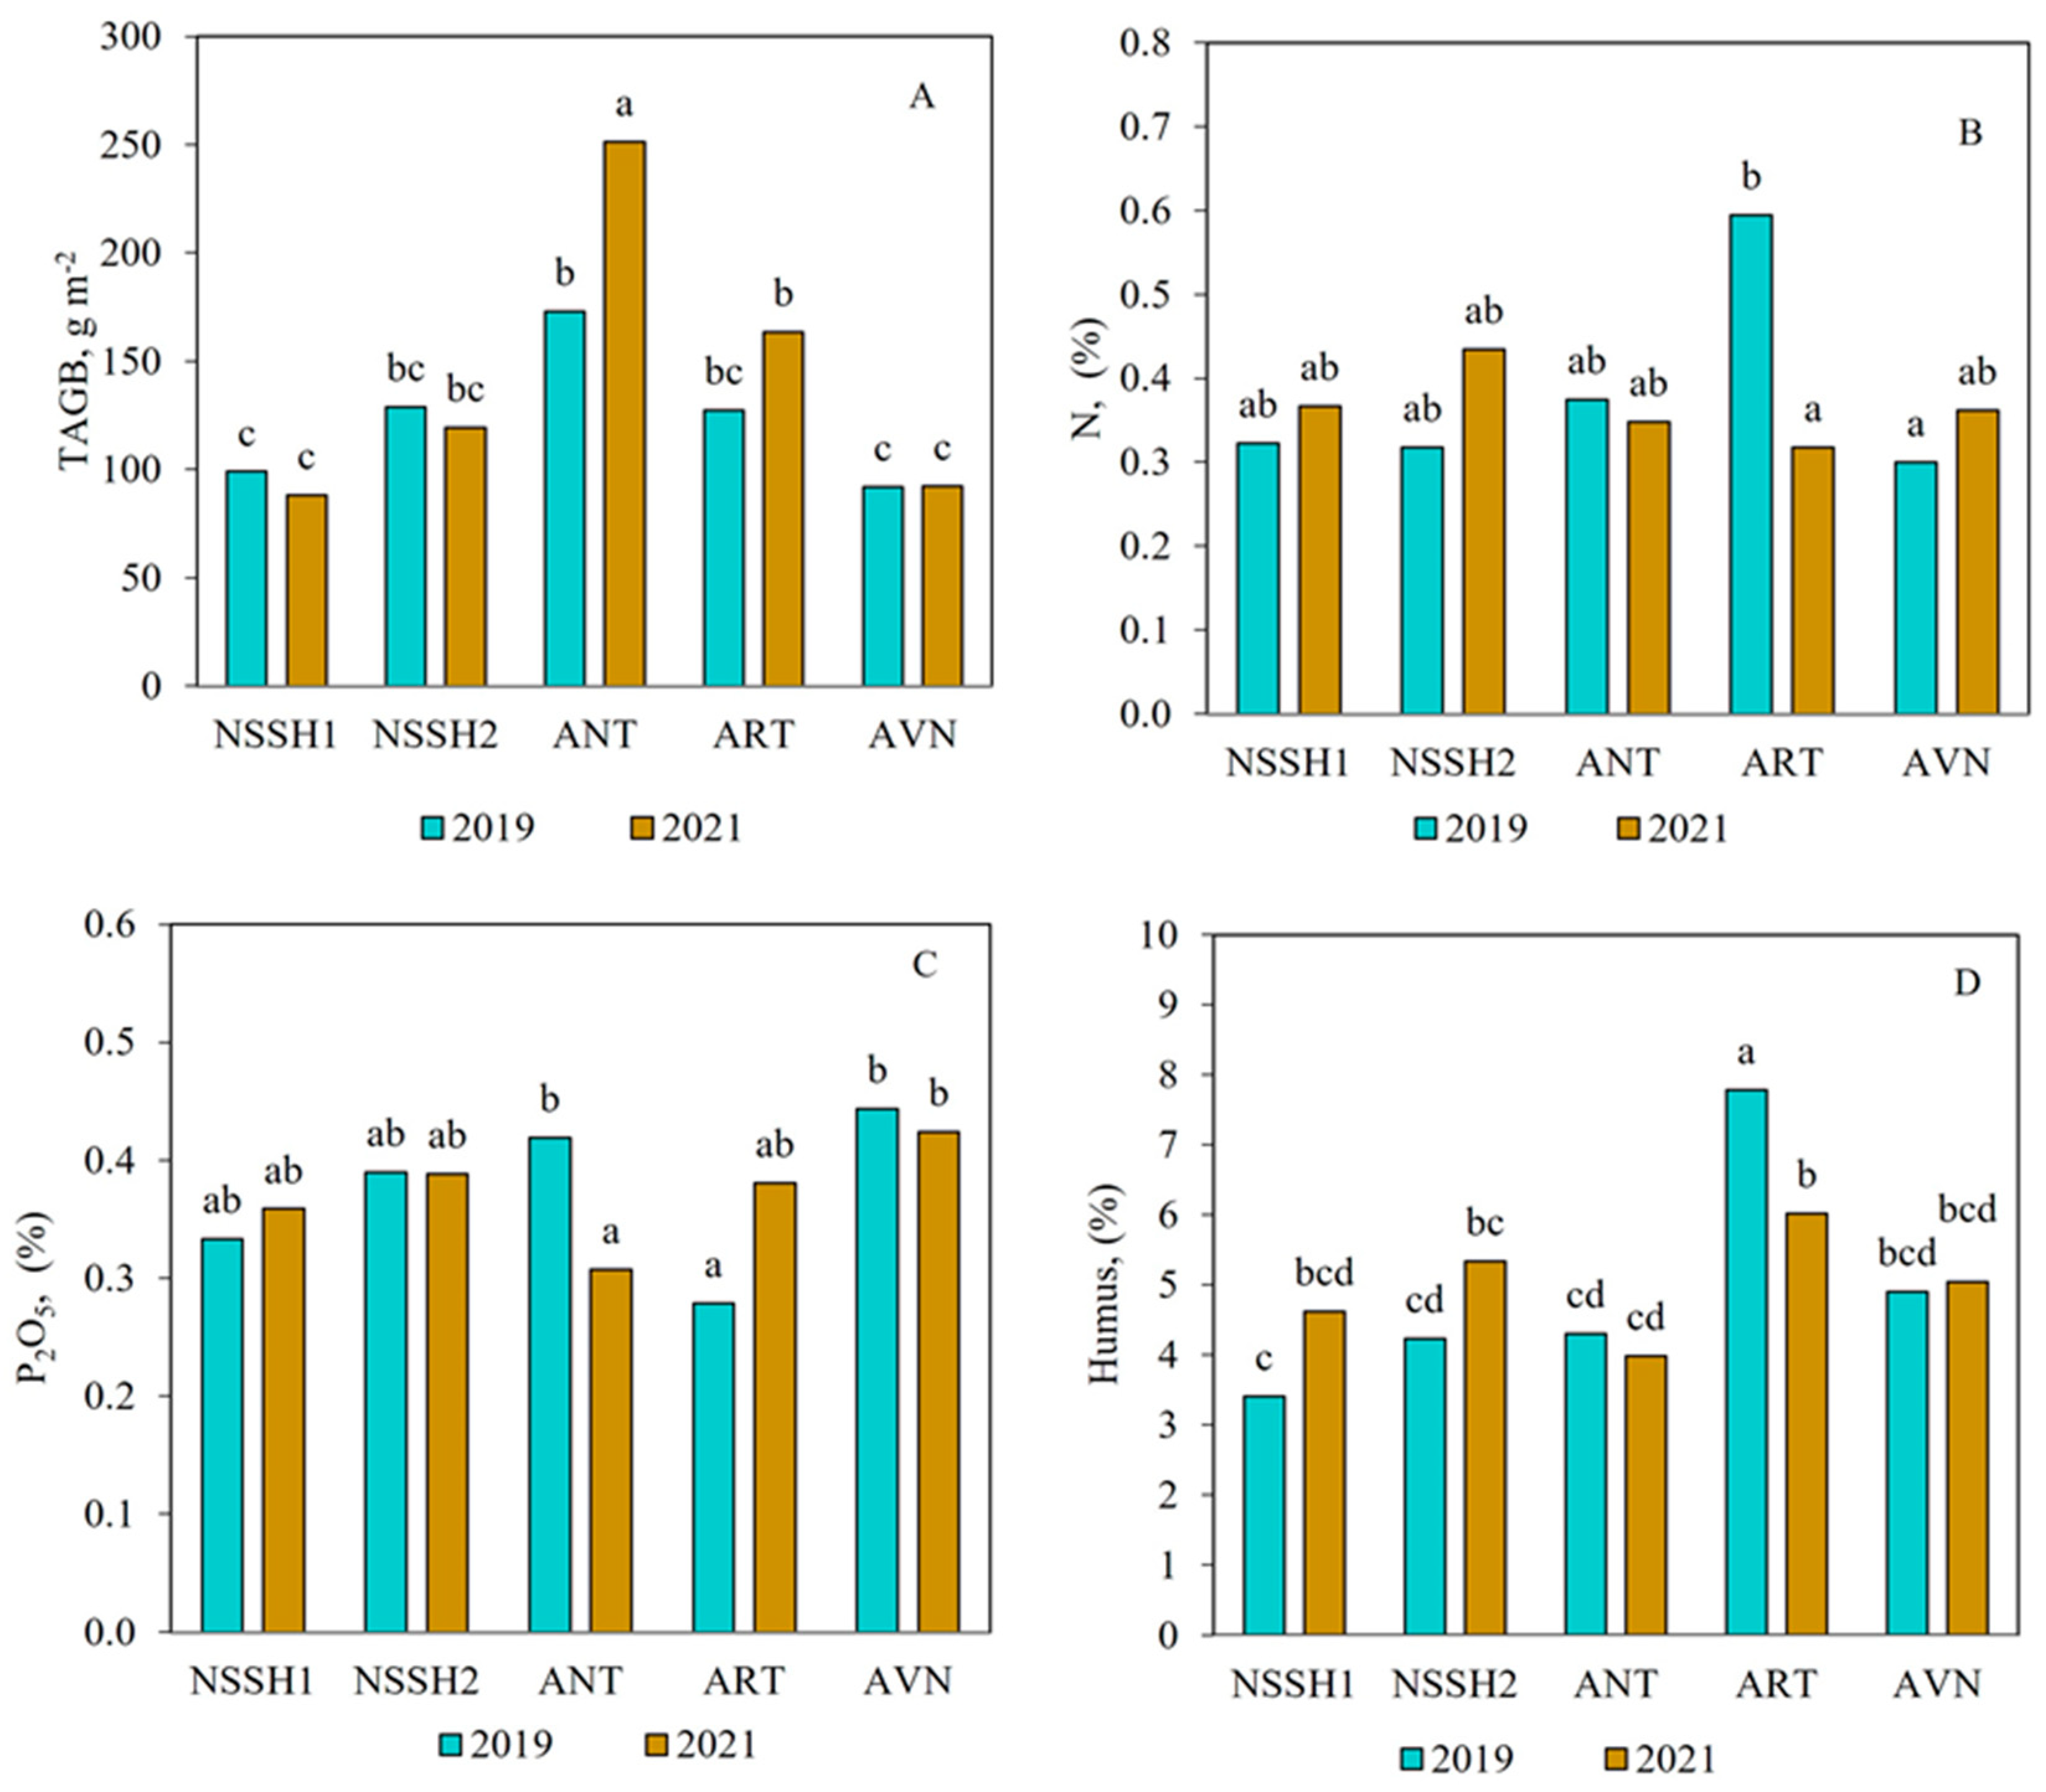
There were no significant differences in the TAGB among the sites in the freely grazed plots, except at ANT, where TAGB was significantly higher in the second year compared to the first (p < 0.05) (Figure 5A). The N and litter contents of grazed plots did not significantly differ between the two studied years at all sites, except for ART, where they were significantly higher in the first year (Figure 5B,D). Similarly, the content of P2O5 was significantly different during the first year compared to the second year in ANT, while there were no significant differences between the years at the other sites (Figure 5C).

Figure 5.
Effect of site and year interactions on total aboveground biomass (A); N, % (B); P2O5, % (C); and litter, % content (D) in freely grazed plots in steppe zone pastures. Columns with the same letter are not significantly different (p > 0.05).
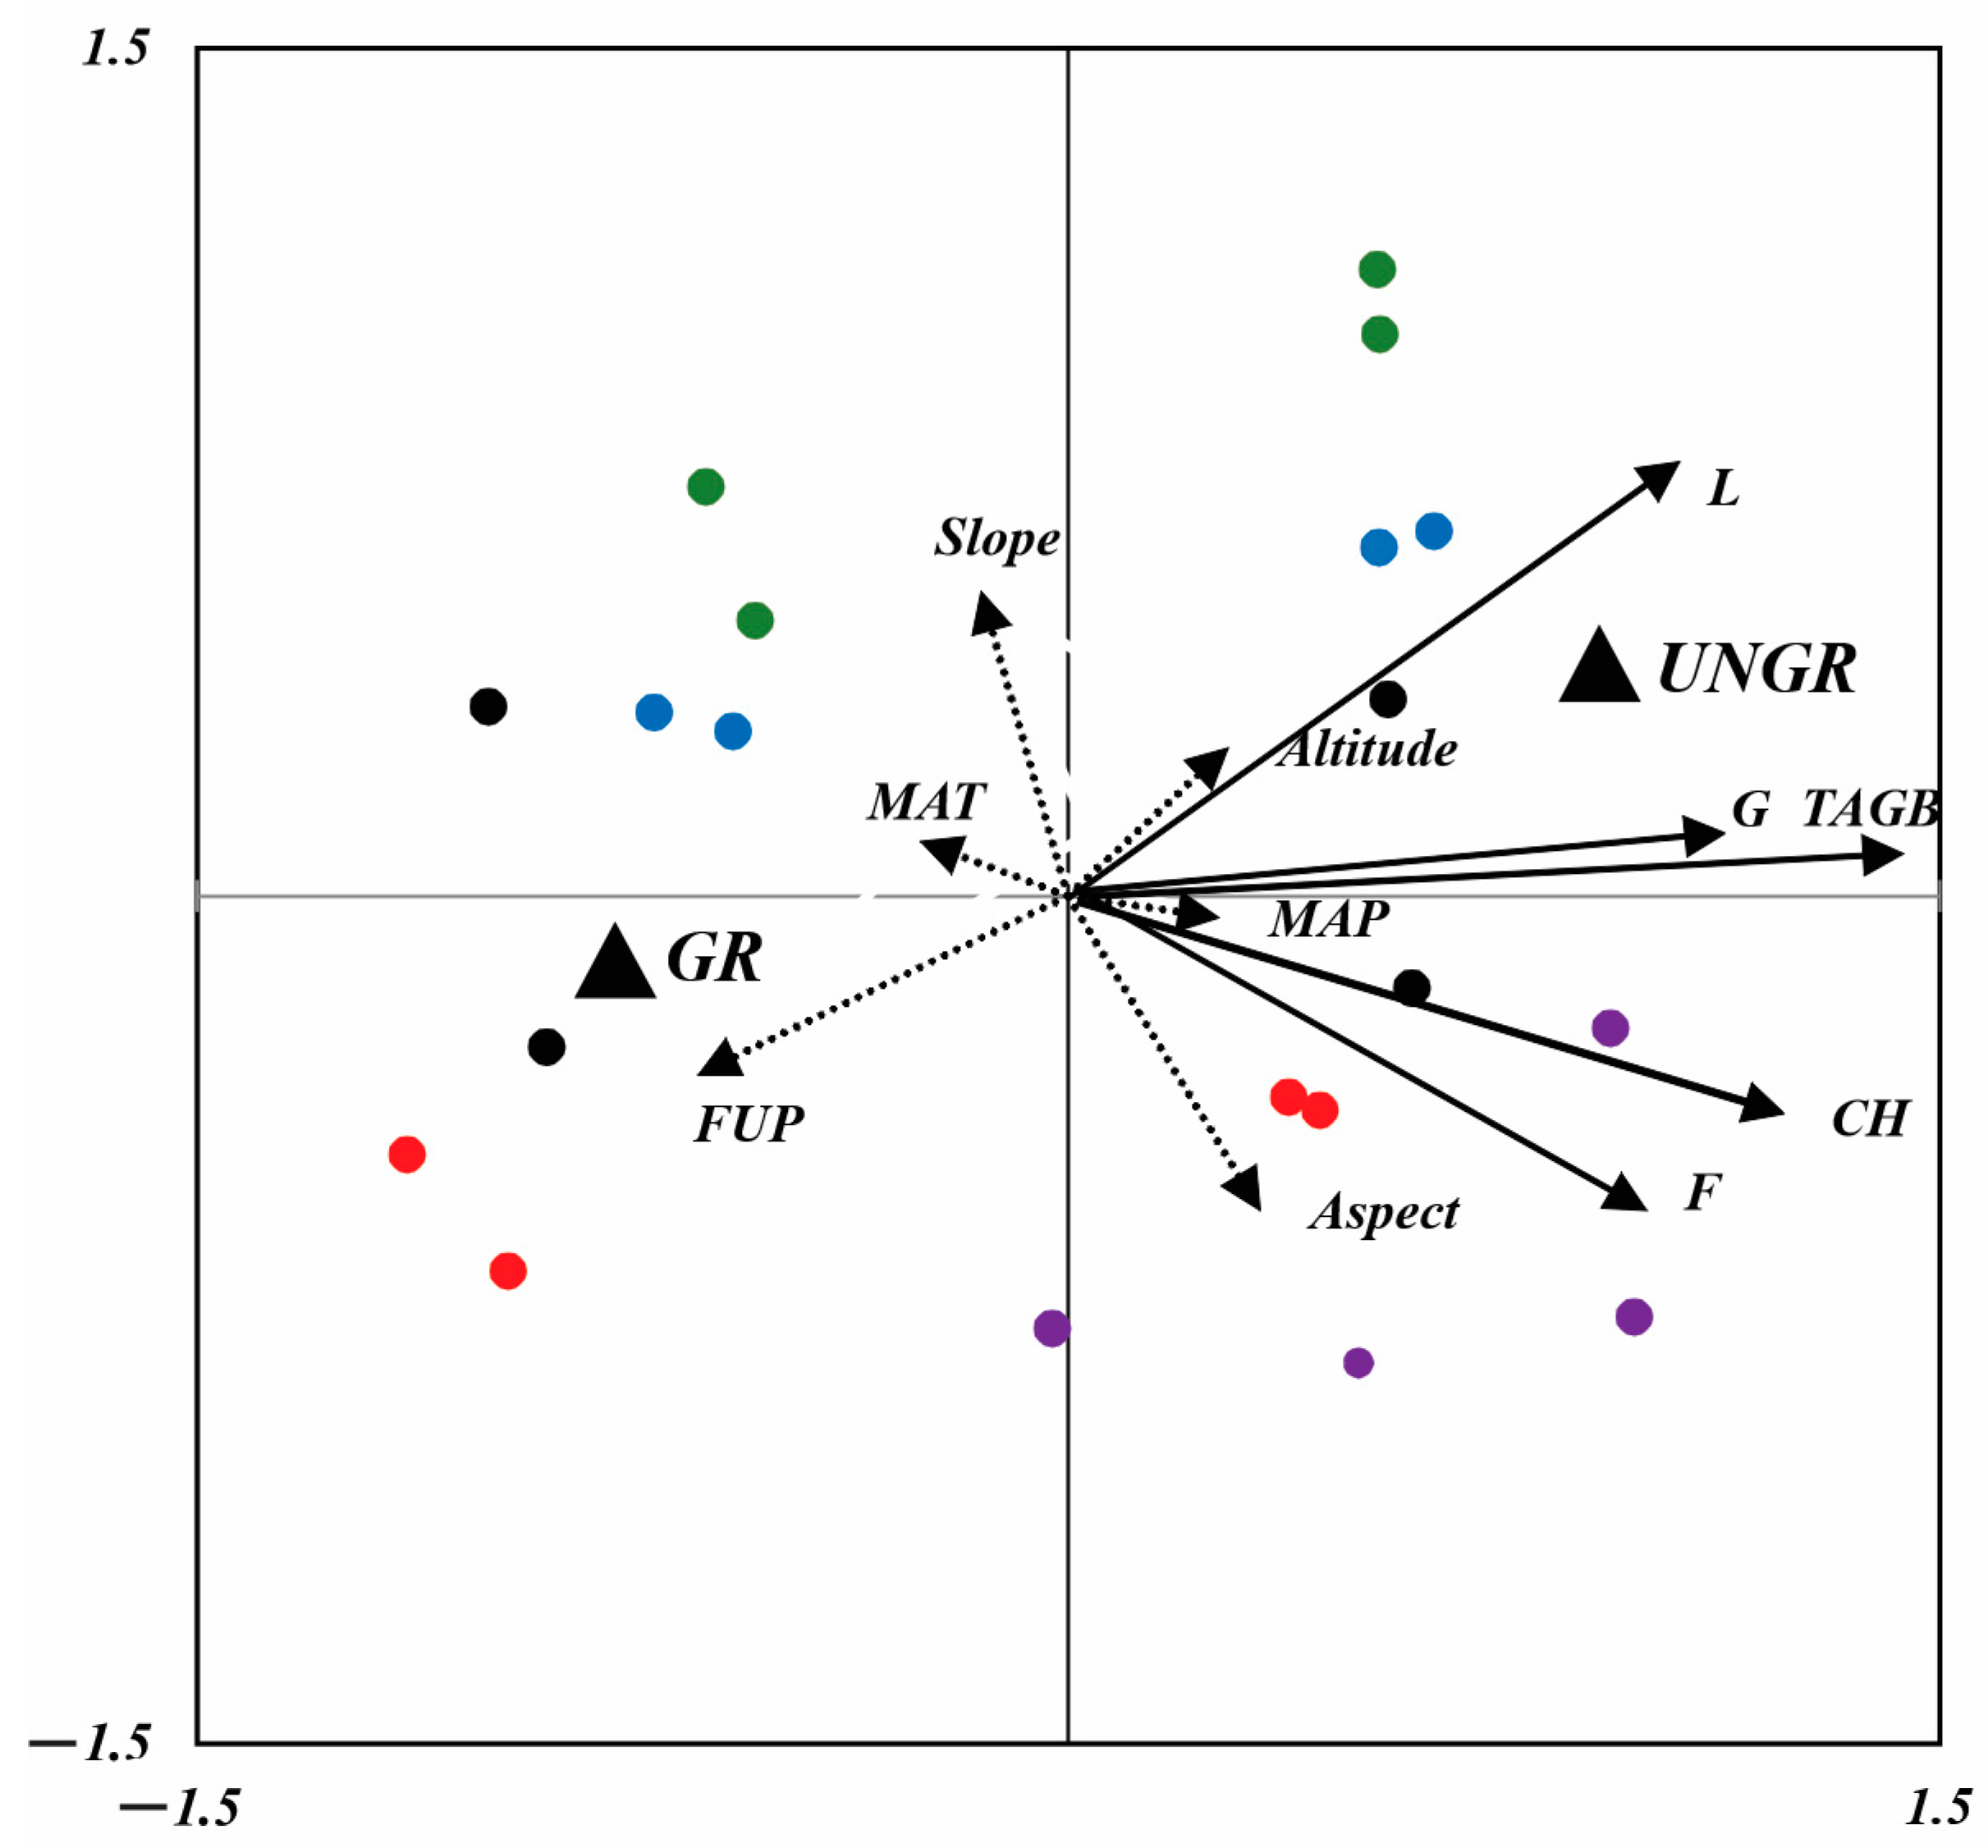
The two obtained RDA axes explained 88% (F = 7.556, p < 0.0001) and 71% (F = 2.445, p < 0.0001) of the total variation in plant and soil parameters according to grazing management and the sites’ climatic and topographical features (Figure 6 and Figure 7). In both RDA axis management strategies, the explanatory variables FUP, MAT, MAP, and aspect best correlated with the first two axes of RDA1 and RDA2, and they explained 82% and 58% of the variance. Therefore, the management strategy and FUP explained more variance in plant parameters than the climatic and topographical features of the sites (Figure 6). The TAGB and biomass of G were mainly affected by the management strategy, and they were positively related to ungrazed fenced plots. The L biomass increased according to the elevation of sites, in accordance with the vertical belts in the fenced plots. F biomass and CH were positively related to aspect and the MAP, and these parameters increased with an increase in precipitation and relative to the southwest exposure. Ungrazed plots at NSSH1, NSSH2, and ANT greatly contributed to the F1 axes of RDA1, whereas only the grazed plots of AVN contributed to the F1 axes of RDA2.

Figure 6.
RDA biplot, showing the position of plant functional groups (solid arrows) and climatic and topographic variables (dashed arrows). Dummy variables are represented by solid black triangles (UNGR: ungrazed; GR: grazed). Sites are represented by red (NSSH1), blue (NSSH2), purple (ANT), green (ART), and black (AVN) points [MAT: mean annual temperature; MAP: mean annual precipitation; FUP: forage utilization percentage; CH: canopy height; G: grass; L: legumes; F: forbs; slope: slope inclination (°); aspect: slope exposure; altitude: m a.s.l.].
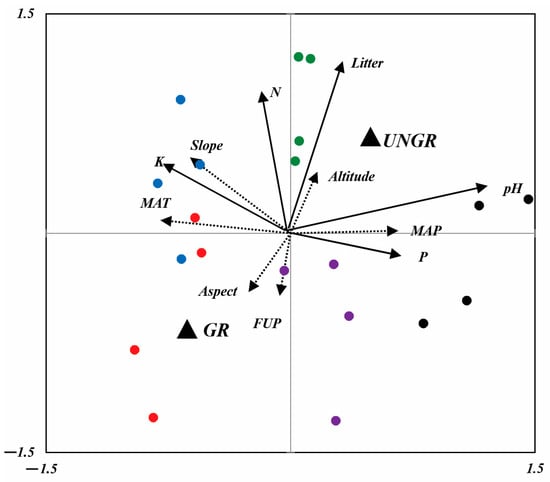
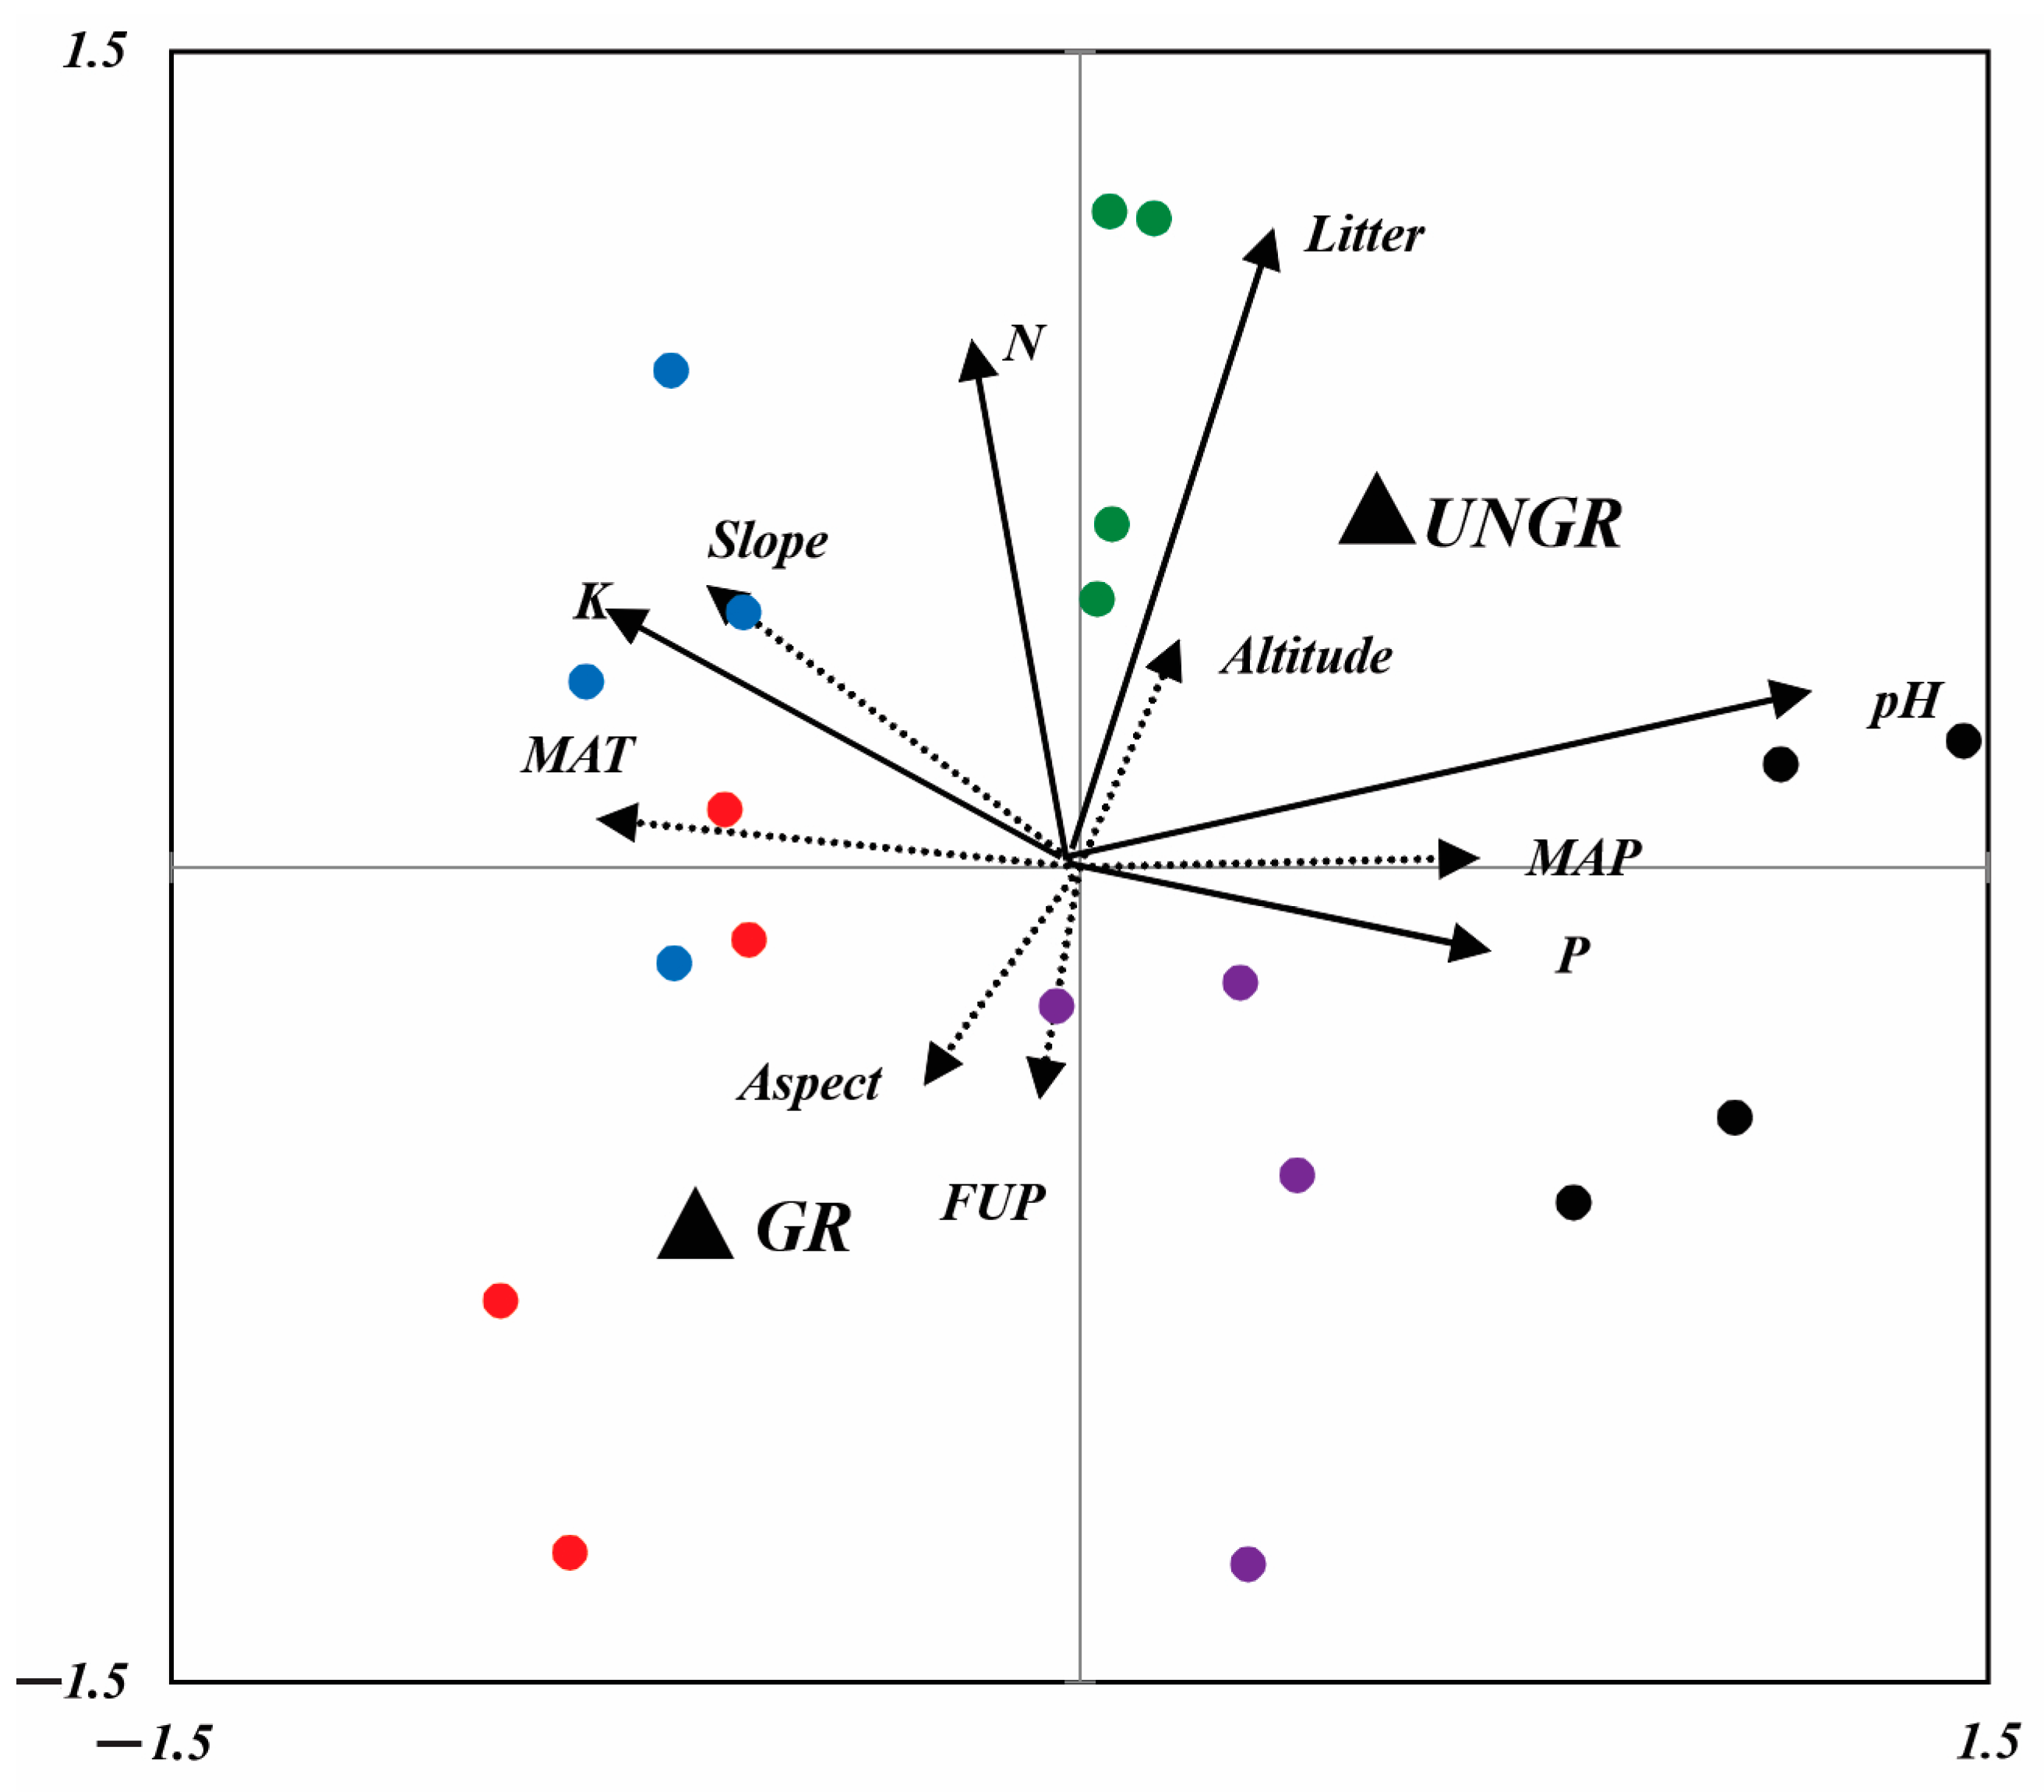
Figure 7.
RDA biplot, showing the position of soil parameters (solid arrows) and climatic and topographic variables (dashed arrows). Dummy variables are represented by solid black triangles (UNGR: ungrazed; GR: grazed). Sites are represented by red (NSSH1), blue (NSSH2), purple (ANT), green (ART), and black (AVN) points [MAT: mean annual temperature; MAP: mean annual precipitation; FUP: forage utilization percentage; N: total nitrogen; P: (P2O5); K: potassium, pH and litter; slope: slope inclination (°); aspect: slope exposure; altitude: m a.s.l.].
Similarly to the plant parameters, the soil parameters of the pasture sites were significantly affected by grazing and the site’s climatic and topographical conditions. Litter, N, and K contents were best correlated with the F1 axes of RDA2, and pH and P2O5 were correlated with F2 (Figure 7). All soil parameters positively correlated with the fencing of pastures. The litter and N contents of soils increased with an increase in altitude and grazing exclusion. P2O5 content and pH were positioned at the positive end of MAP, and K content was positioned on the positive side of the slope. With a decrease in MAP, a decreasing trend was observed with respect to P2O5 and pH contents. At plain sites, the K content is decreased. It is evident from RDA2 that there is no relationship between soil parameter variations and studied sites as they provide only a small contribution to the construction of the two RDA2 axes.
4. Discussion
4.1. Effect of Grazing Exclusion on Vegetation and Soil Characteristics
On ungrazed plots, all plant and soil parameters were different among the studied sites, except grass biomass. Moreover, the climatic conditions relative to different years did not influence pasture productivity. The formation of steppe vegetation is closely associated with the percentage of grass, which is evolutionarily predominant on steppes regardless of soil type and climatic conditions. However, there is a suggestion that the formation of steppes is a consequence of long-term grazing and climate change, which result in changes in vegetation cover and reduced productivity [9].
Studies on eastern European plain steppes have shown that perennial grass dominates in the northern steppes, while they are replaced by perennial forbs in the south. The MAP in the studied area increases from the north to the south: from 160 to 450 mm; in contrast, the MAT increases from 5 to 10 °C [18]. In meadow, typical, and desert steppes of the Inner Mongolia Autonomous Region, which belongs to the Eurasian steppe region, the proportions of perennial grass and forbs are 36% and 62%; 57% and 63%; and 23% and 6%, respectively. The predominance of perennial grass increased at low MAP levels and decreased at high MAP levels [46].
The results of the present study indicate that steppe pastures with cinnamonic and chernozem-like soils (sites ANT and ART) exhibit higher productivity compared to light chestnut soils (site NSSN1). At these sites, TAGB increases with an increase in MAP and a decrease in MAT, and decreases when MAP decreases and MAT increases. These changes are dependent on soil types. The difference among sites was significant for all studied soil parameters. Litter content and pH were more affected by the amount of MAP than N, P2O5, and K, but the effect on light chestnut (site NSSH1), chernozem-like (site ART), and typical chestnut soils (site AVN) was more evident than on dark chestnut (NSSH2 site) and cinnamonic (site ANT) soil. Many studies have examined the effects of soil nutrients on plant productivity, e.g., [47,48,49], and they have shown that nutrient supply is one of the major sources for promoting plant productivity and diversity in grasslands. Additionally, it has been shown that precipitation during the active period of plant growth alters the essential nutrients from soil to plants and supports communities in adapting to a severely living environment [17]. Regarding the ratio of legumes and forbs on ungrazed plots, the dominance of legumes over forbs was not observed, and they produced the same biomass only in dark chestnut and chernozem-like soils. The proportion of legumes increased with an increase in altitude, and forbs increased in the western areas. Similar results were reported by Bale et al. [50]. According to the present study, the eastern sites NSSH1 and NSSH2 are dominated mainly by graminoids, while the western site ANT is dominated mainly by forbs.
4.2. Effect of Grazing on Vegetation and Soil Characteristics
In grazed pastures, grazing is the main driver of productivity [9,22,51]. The results of the present study indicate that the vegetation and soil properties of grazed plots are mainly affected by management. However, TAGB of grazed plots differed among soil types and study years. In all cases, the total productivity of freely grazed steppe pastures with cinnamonic and chernozem-like soils was higher (sites ANT and ART) than in plots with light and chestnut soils. The same results were obtained for canopy height and grass, legume, and forb biomass with respect to the studied pasture sites and main soil types. The content of nitrogen and litter was significantly higher in chernozem-like soils (site ART), and phosphorus and pH were significant in chestnut (site AVN) soils. Regarding the floristic composition, forbs dominate in freely grazed plots because grass and legume species are preferred by ruminants and are intensively grazed by them [46,52,53,54].
4.3. The Importance of Pasture Management
The comparison of protected ungrazed and freely grazed plots indicates that the plant cover height, total biomass, and floristic composition of steppe pastures are mainly affected by grazing rather than by site topography and climatic conditions. The increase in the canopy height inside the protected plots is in agreement with studies showing the positive effects of protecting this parameter [51]. The same is observed for TAGB [55], which experienced a significant increase in protected plots. The impact of grazing on vegetation composition has also been reported by other scientists [56]. From our data, it is obvious that grazing decreases the total nitrogen and litter content in the soil, which could probably be attributed to changes in vegetation composition. This effect was positively related to the altitude, as revealed via RDA2. The reduction in legumes and grass in freely grazed plots probably contributes to a decrease in nitrogen and litter, respectively. Further research is needed regarding the effect of legume reduction on soil parameters in relation to the effect of grazing on microorganisms that settle at the roots of legumes. Grazing had no effect on phosphorus, potassium, or pH. The same results were obtained on the basis of 236 site investigations conducted around the world, and the authors of [2] concluded that there is no relationship between grazing and the pH of soil. Inversely, Liu et al. [57] reported that high grazing intensities in alpine grasslands significantly increased the soil pH. Similarly, available soil P [58] and potassium [59] significantly increased in highly grazed grasslands. These inconsistencies are attributed to differences among the studied areas in terms of altitude, parent rock material, and grazing frequency and intensity. In particular, with respect to phosphorus, Zhang et al. [21] suggested that it is more dependent on the parent material and climate than grazing intensity. Additionally, this may be due to the manner in which these elements are used by plants and the degree of soil compaction, or the lack of agro-measures, i.e., applying fertilizers to natural pastures. All of these issues can be investigated in future studies.
5. Conclusions
The sustainability of steppe pasture sites is mainly influenced by grazing rather than site topography and climatic conditions. Grazing reduced the total productivity of pastures and altered the floristic composition mainly with respect to a reduction in the proportion of grass and legumes and an increase in the proportion of forbs. Grazing also reduced nitrogen and litter contents in soils. However, the major determinant of the grazing effect is the local edaphoclimatic conditions of each site. In particular, grazing had a larger impact at sites with lower precipitation and light chestnut soils compared to sites with higher precipitation and cinnamonic and chernozem-like soils. It is important to introduce management practices, particularly the rotation of livestock around sites, according to local conditions and grazing capacity. This management strategy could ensure enduring ecosystem services and high forage quality and soil fertility.
Author Contributions
Conceptualization, M.N., B.M. and E.M.A.; methodology, M.N., B.M. and E.M.A.; software, M.N., T.S. and H.D.; validation, M.N., T.S., H.D., B.M. and E.M.A.; formal analysis, M.N., T.S. and H.D.; investigation, M.N., T.S., H.D. and B.M.; resources, M.N., T.S. and B.M.; data curation, M.N., T.S. and B.M.; writing—original draft preparation, M.N., T.S. and B.M.; writing—review and editing, M.N., B.M. and E.M.A.; visualization, M.N., T.S. and H.D.; supervision, E.M.A.; project administration, M.N.; funding acquisition, M.N. All authors have read and agreed to the published version of the manuscript.
Funding
The research was supported by the Higher Education and Science Committee of MESCS RA (research project No. 21T-4C237: Influence of different grazing regimes of pasture on key indicators of productivity and soil fertility).
Data Availability Statement
The data presented in this study are available in the figures and tables provided in the manuscript.
Conflicts of Interest
The authors declare no conflicts of interest.
References
- Török, P.; Penksza, K.; Tóth, E.; Kelemen, A.; Sonkoly, J.; Tóthmérész, B. Vegetation type and grazing intensity jointly shape grazing effects on grassland biodiversity. Ecol. Evol. 2018, 8, 10326–10335. [Google Scholar] [CrossRef]
- Milchunas, D.; Forwood, J.; Lauenroth, W. Productivity of long-term grazing treatments in response to seasonal precipitation. J. Range Manag. 1994, 47, 133–139. [Google Scholar] [CrossRef]
- Török, P.; Valkó, O.; Deák, B.; Kelemen, A.; Tóth, E.; Tóthmérész, B. Managing for species composition or diversity? Pastoral and free grazing systems of alkali grasslands. Agric. Ecosyst. Environ. 2016, 234, 23–30. [Google Scholar] [CrossRef]
- Gao, X.; Huang, X.; Lob, K.; Dang, Q.; Wena, R. Vegetation responses to climate change in the Qilian Mountain nature reserve, Northwest China. Glob. Ecol. Conserv. 2021, 28, 1–12. [Google Scholar] [CrossRef]
- Zhang, Y.; Liang, W.; Liao, L.; Han, Z.; Xu, M.; Jiao, R.; Liu, L. Effects of climate change on lake area and vegetation cover over the past 55 years in Northeast Inner Mongolia grassland, China. Theor. Appl. Climatol. 2019, 138, 13–25. [Google Scholar] [CrossRef]
- Bai, W.; Fang, Y.; Zhou, M.; Xie, T.; Li, L.; Zhang, W. Heavily intensified grazing reduces root production in Inner Mongolia temperate steppe. Agric. Ecosyst. Environ. 2014, 200, 143–150. [Google Scholar] [CrossRef]
- Briggs, J.; Knapp, A. Interannual variability in primary production in tallgrass prairie: Climate, soil moisture, topographic position and fire as determinants of aboveground biomass. Am. J. Bot. 1995, 82, 1024–1030. [Google Scholar] [CrossRef]
- Craine, J.; Nipperta, J.; Elmoreb, A.; Skibbea, A.; Hutchinsonc, S.; Brunsell, N. Timing of climate variability and grassland productivity. Proc. Natl. Acad. Sci. USA 2012, 109, 3401–3405. [Google Scholar] [CrossRef]
- Gamoun, M.; Tarhouni, M.; Belgacem, A.; Neffati, M.; Hanchi, B. Response of different arid rangelands to protection and drought. Arid Land Res. Manag. 2011, 25, 372–378. [Google Scholar] [CrossRef]
- Hao, L.; Sun, G.; Liu, Y.; Gao, Z.; He, J.; Shi, T.; Wu, B. Effects of precipitation on grassland ecosystem restoration under grazing exclusion in Inner Mongolia, China. Landsc. Ecol. 2014, 29, 1657–1673. [Google Scholar] [CrossRef]
- Ni, J. Estimating net primary productivity of grasslands from field biomass measurements in temperate northern China. Plant Ecol. 2004, 174, 217–234. [Google Scholar] [CrossRef]
- Sala, O.; Parton, W.; Joyce, L.; Lauenroth, W. Primary production of the central grassland region of the United States. Ecology 1988, 69, 40–45. [Google Scholar] [CrossRef]
- Yang, H.; Wu, M.; Liu, W.; Zhang, E.; Zhang, N.; Wan, S. Community structure and composition in response to climate change in a temperate steppe. Glob. Chang. Biol. 2011, 17, 452–465. [Google Scholar] [CrossRef]
- Chen, L.; Li, H.; Zhang, P.; Zhao, X.; Zhou, L.; Liu, T.; Hu, H.; Bai, Y.; Shen, H.; Fang, J. Climate and native grassland vegetation as drivers of the community structures of shrub-encroached grasslands in Inner Mongolia, China. Lands. Ecol. 2014, 30, 1627–1641. [Google Scholar] [CrossRef]
- Li, Z.; Ma, W.; Liang, C.; Liu, Z.; Wang, W.; Wang, L. Long-term vegetation dynamics driven by climatic variations in the Inner Mongolia grassland: Findings from 30-year monitoring. Lands. Ecol. 2015, 30, 1701–1711. [Google Scholar] [CrossRef]
- Deng, S.; Yang, T.; Zeng, B.; Zhu, X.; Xu, H. Vegetation cover variation in the Qilian Mountains and its Response to Climate Change in 2000–2011. J. Mt. Sci. 2013, 10, 1050–1062. [Google Scholar] [CrossRef]
- Yan, W.; Shi, F.; Wan, T. Effects of grazing intensity on plant-soil C: N: P stoichiometry with precipitation changes during the growing season in desert grassland. Res. Sq. 2021; 1–18. [Google Scholar] [CrossRef]
- Kudrevatykh, Y.; Kalinin, P.; Mitenko, G. The effect of changes vegetation cover on the chemical properties of steppe soils during climate aridization. Plant Soil. 2023, 491, 265–284. [Google Scholar] [CrossRef]
- Wang, X.; Dong, S.; Yang, B.; Li, Y.; Su, X. The effects of grassland degradation on plant diversity, primary productivity and soil fertility in the alpine region of Asia’s headwaters. Environ. Monit. Assess. 2014, 186, 6903–6917. [Google Scholar] [CrossRef]
- Hanafi, A.; Jauffret, S. Are long-term vegetation dynamics useful in monitoring and assessing desertification processes in the arid steppe, southern Tunisia. J. Arid. Environ. 2008, 72, 557–572. [Google Scholar] [CrossRef]
- Zhang, M.; Zhang, F.; Guo, L.; Dong, P.; Cheng, C.; Kumar, P.; Johnson, B.; Chan, N.; Shi, J. Contributions of climate change and human activities to grassland degradation and improvement from 2001 to 2020 in Zhaosu County, China. J. Environ. Manag. 2023, 348, 119465. [Google Scholar] [CrossRef]
- McNaughton, S.; Banyikwa, F.; McNaughton, M. Promotion of the cycling of diet-enhancing nutrients by African grazers. Science 1997, 278, 1798–1800. [Google Scholar] [CrossRef]
- Parissi, Z.; Papaioannou, A.; Abraham, E.; Kyriazopoulos, A.; Sklavou, P.; Tsiouvaras, C. Influence of combined grazing by wild boar and small ruminant on soil and plant nutrient contents in a coppice oak forest. Plant Nutr. Soil Sci. 2014, 177, 783–791. [Google Scholar] [CrossRef]
- Abraham, E.; Karatassiou, M.; Parissi, Z.; Koukoura, Z.; Tsiouvaras, C. Long-term effects of grazing on composition in various habitats of a mountainous area in central Greece. Options Méditerranéennes 2009, 85, 73–78. [Google Scholar]
- Collins, S.; Knapp, A.; Briggs, J.; Blair, J.; Steinauer, E. Modulation of diversity by grazing and mowing in native tallgrass prairie. Science 1998, 280, 745–747. [Google Scholar] [CrossRef] [PubMed]
- Chen, J.; Tang, H.P. Effect of grazing exclusion on vegetation characteristics and soil organic carbon of Leymus chinensis grassland in northern China. Sustainability 2016, 8, 56. [Google Scholar] [CrossRef]
- Qasim, S.; Gul, S.; Shah, M.; Hussain, F.; Ahmad, S.; Islam, M.; Rehman, G.; Yaqoob, M.; Qasim, S. Influence of grazing exclosure on vegetation biomass and soil quality. Int. Soil Water Cons. Res. 2017, 5, 62–68. [Google Scholar] [CrossRef]
- Rong, Y.; Yuan, F.; Ma, L. Effectiveness of enclosures for restoring soils and vegetation degraded by overgrazing in the Junggar Basin, China. Grassl. Sci. 2014, 60, 118–124. [Google Scholar] [CrossRef]
- Jeddi, K.; Chaieb, M. Changes in soil properties and vegetation following livestock grazing exclusion in degraded arid environment of South Tunisia. Flora Morphol. Distrib. Funct. Ecol. Plants 2010, 205, 184–189. [Google Scholar] [CrossRef]
- He, N.; Zhang, Y.; Yu, Q.; Chen, Q.; Pan, Q.; Zhnag, G.; Han, X. Grazing intensity impacts soil carbon and nitrogen storage of continental steppe. Ecosphere 2011, 2, 1–10. [Google Scholar] [CrossRef]
- Ghazaryan, H. Soils of Armenia. In Soil Resources of Mediterranean and Caucasus Countries: Extension of the European Soil Database; Yigini, Y., Panagos, P., Montanarella, L., Eds.; Office for Official Publications of the European Communities: Luxembourg, 2013; pp. 2–15. [Google Scholar]
- Gabrielyan, E.; Zohary, D. Wild relatives of food crops native to Armenia and Nachichevan. Fl. Midit. 2004, 14, 5–80. [Google Scholar]
- Study of pasture management issue and their causality in the Republic of Armenia. In 2019 SDC Report; Swiss Agency for Development Cooperation: Bern, Switzerland, 2019.
- Mezhunts, B.K. Production Process of the Ecosystems of the Ararat Valley and the Ways for Their Improvement; Abs. of doct. diss.; CENS NAS RA: Yerevan, Armenia, 2011; 43p. [Google Scholar]
- Fayvush, G. Endemic plants of Armenian flora. In Flora, Vegetation and Plant Resources of Armenia; Armenian Academy of Sciences: Yerevan, Armenia, 2007; Volume 16, pp. 62–68. [Google Scholar]
- Fayvush, G.; Aleksanyan, A. Habitats of Armenia; NAS RA Institute of Botany: Yerevan, Armenia, 2016; 360p. [Google Scholar]
- Tovmasyan, G. Sustainable Management of Biodiversity Program South Caucasus: Guidelines for Development and Implementation of Sustainable Management Plans for Pastures and Grasslands; Task LLC: Yerevan, Armenia, 2015; 60p. [Google Scholar]
- ISO 11465; Soil Quality—Determination of Dry Matter and Water Content on a Mass Basis—Gravimetric Method. 1st ed. ISO: Geneva, Switzerland, 1993; 3p.
- ISO 10390:2021; Soil, Treated Biowaste and Sludge—Determination of pH. 3rd ed. ISO: Geneva, Switzerland, 2021; 8p.
- ISO 11261:1995; Soil Quality—Determination of Total Nitrogen—Modified Kjeldahl Method. 1st ed. ISO: Geneva, Switzerland, 1995; 4p.
- Truog, E.; Meyer, H. Improvements in the deniges colorimetric method for phosphate and arsenic. Ind. Eng. Chem. Anal. Ed. 1929, 1, 136–139. [Google Scholar] [CrossRef]
- ISO 11263:1994; Soil Quality—Determination of Phosphorus—Spectrometric Determination of Phosphorus Soluble in Sodium Hydrogen Carbonate Solution. 1st ed. ISO: Geneva, Switzerland, 1994; 5p.
- Standard Operating Procedure for Soil Organic Carbon. In Walkley-Black Method, Titration and Colorimetric Method; FAO: Rome, Italy, 2019; pp. 1–25.
- ISO 5725:2023; Accuracy (Trueness and Precision) of Measurement Methods and Results. 2nd ed. ISO: Geneva, Switzerland, 2023; 19p.
- Sandel, B.; Goldstein, L.; Kraft, N.; Okie, J.; Shuldman, M.; Ackerly, D.; Cleland, E.; Suding, K. Contrasting trait responses in plant communities toexperimental and geographic variation in precipitation. New Phytol. 2010, 188, 565–575. [Google Scholar] [CrossRef]
- Bai, Y.; Wu, J.; Xing, Q.; Pan, Q.; Huang, J.; Yang, D.; Han, X. Primary production and rain use efficiency across a precipitation gradient on the Mongolia plateau. Ecology 2008, 89, 2140–2153. [Google Scholar] [CrossRef]
- Clark, C.; Tilman, D. Loss of plant species after chronic low-level nitrogen deposition to prairie grasslands. Nature 2008, 451, 712–715. [Google Scholar] [CrossRef] [PubMed]
- De Deyn, G.; Quirk, H.; Yi, Z.; Oakley, S.; Ostle, N.; Bardgett, R. Vegetation composition promotes carbon and nitrogen storage in model grassland communities of contrasting soil fertility. Ecology 2009, 97, 864–875. [Google Scholar] [CrossRef]
- Reynolds, H.; Haubensak, K. Soil fertility, heterogeneity and microbes: Towards an integrated understanding of grassland structure and dynamics. Appl. Veg. Sci. 2009, 12, 33–44. [Google Scholar] [CrossRef]
- Bale, C.; Williams, J.; Charley, J. The impact of aspect on forest structure and floristics in some Eastern Australian sites. Forest Ecol. Manag. 1998, 110, 363–377. [Google Scholar] [CrossRef]
- Gao, Y.; Giese, G.; Han, X.; Wang, D.; Zhou, Z.; Brueck, H.; Lin, S.; Taube, F. Land use and drought interactively affect interspecific competition and species diversity at the local scale in a semiarid steppe ecosystem. Ecol. Res. 2009, 24, 627–635. [Google Scholar] [CrossRef]
- Briggs, J.; Knapp, A. Determinants of C3 forb growth and production in a C4 dominated Grassland. Plant Ecol. 2001, 152, 93–100. [Google Scholar] [CrossRef]
- O’Connor, T.; Haines, L.; Snyman, H. Influence of precipitation and species composition on phytomass of a semi-arid African grassland. J. Ecol. 2001, 89, 850–860. [Google Scholar] [CrossRef]
- Tilman, D. The Ecological consequences of changes in biodiversity: A search for general principles. Ecology 1999, 80, 1455–1474. [Google Scholar] [CrossRef]
- Wei, P.; Pan, X.; Xu, L.; Hu, Q.; Zhang, X.; Guo, Y.; Shao, C.; Wang, C.; Li, Q.; Yin, Z. The effects of topography on aboveground biomass and soil moisture at local scale in dryland grassland ecosystem, China. Ecol. Indic. 2019, 105, 107–115. [Google Scholar] [CrossRef]
- Radic, V.; Drinic, M.; Kralj, A.; Figurek, A.; Komljenovic, L. Impact of agricultural practices on the botanical composition changes and nutritional value of natural grassland, type Aagroseietum vulgaris. Appl. Ecol. Environ. Res. 2017, 15, 403–415. [Google Scholar] [CrossRef]
- Liu, D.; Zhang, C.; Ogaya, R.; Estiarte, M.; Peñuelas, J. Effects of Decadal experimental drought and climate extremes on vegetation growth in Mediterranean forests and shrublands. J. Veg. Sci. 2020, 31, 768–779. [Google Scholar] [CrossRef]
- Weil, R.R.; Brady, N.C. The Nature and Properties of Soils, 15th ed.; Pearson: Columbus, OH, USA, 2016; ISBN 978-0-13-325448-8. [Google Scholar]
- Moghbeli, Z.; Ebrahimi, M.; Shirmohammdi, E. Effects of different livestock grazing intensities on plant cover, soil properties, and above and below ground C and N Pools in arid ecosystems (Jiroft Rangeland, Iran). Environ. Resour. Res. 2021, 9, 13–30. [Google Scholar]
Disclaimer/Publisher’s Note: The statements, opinions and data contained in all publications are solely those of the individual author(s) and contributor(s) and not of MDPI and/or the editor(s). MDPI and/or the editor(s) disclaim responsibility for any injury to people or property resulting from any ideas, methods, instructions or products referred to in the content. |
© 2024 by the authors. Licensee MDPI, Basel, Switzerland. This article is an open access article distributed under the terms and conditions of the Creative Commons Attribution (CC BY) license (https://creativecommons.org/licenses/by/4.0/).