Article

Change Patterns of Desertification and Its Dominant Influencing Factors in China–Mongolia–Russia Economic Corridor Based on MODIS and Feature Space Model

1
School of Civil Engineering and Geomatics, Shandong University of Technology, Zibo 255000, China
2
Key Laboratory of Remote Sensing of Gansu Province, Heihe Remote Sensing Experimental Research Station, Northwest Institute of Eco-Environment and Resources, Chinese Academy of Sciences, Lanzhou 730000, China
*
Authors to whom correspondence should be addressed.
Land 2024, 13(9), 1431; https://doi.org/10.3390/land13091431
Submission received: 19 July 2024 / Revised: 22 August 2024 / Accepted: 3 September 2024 / Published: 4 September 2024
(This article belongs to the Section Land – Observation and Monitoring)

Abstract

:
The desertification of the China–Mongolia–Russia Economic Corridor (CMREC), one of the six major economic corridors in the Belt and Road Initiative, has posed a great challenge to the ecological environment protection and sustainable economic development of the region. In this work, two categories of feature space models based on point–point mode and point–line mode were constructed. The optimal feature space model was used to establish the spatial–temporal change patterns of desertification in the CMREC from 2001 to 2020, and then the dominant driving factors were quantitatively determined. The conclusions demonstrated the following: (1) the monitoring accuracy of the Albedo–MSAVI desertification model based on point–point mode was the highest, at 86.47%, followed by that of the TGSI–MSAVI model based on point–line mode, at 85.71%; (2) from 2001 to 2020, the spatial distribution of desertification in the China–Mongolia–Russia Economic Corridor region showed a decreasing trend radiating outwards from the Inner Mongolia Plateau and Gobi Desert; (3) the gravity center of desertification in Chinese parts in the CMREC migrated toward the northeast, while the Mongolia and Russia parts migrated toward the southwest and southeast, respectively; and (4) from 2001 to 2020, precipitation and land use change had the greatest impacts on the evolution patterns of desertification in China and Mongolia, while topography and land use contributed greatly to the change process of desertification in Russia. The research results could provide data support for desertification control in the CMREC.

1. Introduction

Desertification is one of the most severe global ecological issues, with aridity and extensive deserts being major ecological constraints. Land desertification results from both natural factors and human activities, leading to environmental degradation and the evolution of desert landscapes in areas that were previously non-desertified. Since the 20th century, intensified human activities and significant global climate change have made desertification in semi-arid and arid regions increasingly pronounced [1]. This has led to a decline in ecological quality and significantly impacted human survival and socio-economic development [2]. The China–Mongolia–Russia Economic Corridor is located between 35.8° N to 60° N and 87.9° E to 135.1° E, covering a total area of approximately 4.85 million square kilometers. The China–Mongolia–Russia Economic Corridor is the first of the six major economic corridors planned and constructed under the Belt and Road Initiative to be implemented. It aims to promote regional economic development and connectivity through cooperation between China, Mongolia, and Russia. This economic corridor encompasses various aspects, including infrastructure construction, trade facilitation, and investment cooperation. Its natural geographical conditions are complex and diverse. Monitoring the dynamic changes in land desertification and understanding its patterns are crucial for both combating desertification and advancing socio-economic development in the affected areas.
Traditional desertification monitoring primarily relies on field measurements, but data collection is relatively challenging. As a result, this method provides high accuracy but low efficiency, making it unsuitable for large-scale desertification monitoring. At present, the combination of RS and GIS technology is effective for quickly obtaining large-scale images, realizing rapid identification of desertification areas, and evaluating the degree of desertification [1]. Many scholars have utilized a variety of desertification feature parameters for the quantitative monitoring of land desertification, including the NDVI (Normalized Difference Vegetation Index), MSAVI (Modified Soil–Adjusted Vegetation Index), LST (Land Surface Temperature), TGSI (Topsoil Grain Size Index) and Albedo [3]. However, many scholars use remote sensing methods to monitor land desertification [4]. For example, extracting feature variables can effectively monitor desertification. The feature space model could effectively overcome these shortcomings because it can consider the relationships among different feature parameters. Zeng et al. (2007) [4] proposed an Albedo–NDVI feature space model to quantitatively analyze and monitor desertification. Pan et al. (2010) [5] utilized Landsat TM images to construct an NDVI–Albedo feature space index model and quantitatively evaluated the degree of desertification in Zhangye oasis and its surrounding areas. Based on MODIS data, Yue et al. (2019) [6] proposed a NDVI–Albedo feature space model to analyze the spatial and temporal distribution characteristics and laws of desertification and drought in Shaanxi Province. Gao et al. (2016) [7] constructed an NDVI-T feature space model using MODIS satellite images to investigate the change laws of desertification in the India–Pakistan region. By utilizing the Albedo–MSAVI feature space derived from Landsat images, Zhou (2021) [8] developed a feature space monitoring model to detect desertification in Naiman Banner. However, few studies have been conducted based on a MODIS and feature space model to investigate large-scale desertification, which could be used to examine the nonlinear relationships between the parameters. In addition, the dominant driving factors of desertification in different periods and sub-regions of the CMREC are still unclear and need to be explored in depth. Few studies on the ecological environment and desertification of the China–Mongolia–Russia Economic Corridor have been carried out thus far. Therefore, this study focuses on the spatiotemporal evolution and driving mechanism analysis of desertification in the China–Mongolia–Russia Economic Corridor from 2001 to 2020.
In view of the special ecological environment of the CMREC, this study inverted the typical surface parameters of desertification based on MODIS data and constructed two categories of feature space monitoring based on point–point and point–line modes. MODIS data, characterized by a large number of bands and high temporal resolution, facilitate efficient observation of complex surfaces and model construction. This study utilized the optimal feature space model to analyze and discuss the spatial and temporal variation patterns of desertification and its driving mechanisms from 2001 to 2020.

2. Materials and Methods

2.1. Overview of the Study Area

The China–Mongolia–Russia Economic Corridor (CMREC) is located in the eastern part of the Eurasian continent and spans multiple regions of China, Mongolia, and Russia, which is an important international channel connecting the Eurasian continent. The China–Mongolia–Russia Economic Corridor (CMREC) is located between 35.8° N~60° N and 87.9° E~135.1° E, with a total area of approximately 4.85 million km2. The administrative scope included 7 provinces and cities (autonomous regions) in China, 22 provinces and cities in Mongolia, and 3 states, border areas, republics, and cities in Russia (Figure 1). Its geographical environment is complex and diverse, fragile and sensitive. The terrain structure of the study area is complex and diverse, with a relief of more than 4000 m. The geomorphic units mainly included the Sayan Mountains, the Gobi Altai Mountains, the Lesser Khingan Mountains, the Yinshan Mountains, the Mongolian Plateau, and the Northeast Plain. The average annual precipitation is 50–1300 mm, mainly concentrated in July-September. The average annual temperature ranges from −10 °C to 15 °C. The climate transitions from a temperate monsoon climate in coastal regions to a temperate continental climate further inland. The vegetation types were complex and diverse, including coniferous forest and coniferous mixed forest.

2.2. Data Source and Preprocessing

The MODIS products from July to September (.hdf, h23v3, h23v4, h24v3, h24v4, h25v3, h25v4, h25v5, h26v3, h26v4, h26v5, h27v4, h27v5) were provided by the LAADS DAAC data center of NASA (https://ladsweb.modaps.eosdis.nasa.gov, accessed on 14 January 2024). This is mainly because this period is the peak growing season for vegetation, during which the thermal radiation characteristics of various surface covers show significant differences. The enhancement of these differences provides favorable conditions for comparative studies of different land cover types. Remote sensing data are obtained from NASA’s LAADS DAAC data center, which provides MODIS products, including the MOD09A1 8-day composite product and MOD13Q1. The data were stored in HDF format.
The land use data were derived from MOD12Q1 data products. The population density data were derived from the global population data from 2000 to 2020 under the WorldPop (https://hub.worldpop.org/, accessed on 15 January 2024) dataset Top-Down, with a spatial resolution of 1km and a projection coordinate of GCS_WGS_1984. For MODIS data, we used ENVI’s Raster Management tool for resampling. For driver factors such as precipitation and temperature, we used ArcGIS 10.7 tools to unify their resolution. The sampling method employed was the nearest neighbor method, and the data were resampled to a uniform resolution of 1 km. The GDP data (NetCDF) were from the global GDP dataset produced by Kummu et al. (2015) [9]. The DEM is derived from GEBCO (https://www.gebco.net/about_us/overview/, accessed on 15 January 2024), and its coordinate was GCS_WGS_1984, with a spatial resolution of 15 arc seconds. The slope data are then calculated from DEM data using ArcGIS 10.7. In the study, batch splicing, projection conversion (converting all data sine curve projections to WGS84), format conversion, and resampling of MODIS data products were completed using the MRT tool.
In the study, a batch processing script using MRT tools was employed to perform batch stitching, projection transformation (converting all data from sinusoidal projection to WGS84), format conversion, and resampling (using the nearest neighbor method to resample the data to 1 km) of MODIS data products. Based on the vector boundaries of the China–Mongolia–Russia Economic Corridor, ArcGIS 10.7 was used to perform batch clipping of the data. To reduce the interference of water bodies and buildings in the desertification monitoring research, ArcGIS 10.7 software was utilized to remove water bodies and built-up areas from the remote sensing images.

2.3. Methods

2.3.1. Principle of Feature Space

Taking Albedo–NDVI as an example (Figure 2), NDVI could indicate the spatial distribution of surface vegetation density, the growth status of surface vegetation and/or the information on vegetation coverage. The more serious the desertification, the sparser the distribution of vegetation, and the lower the NDVI value [10]. Therefore, NDVI could be applied to indicate the degree of desertification. Albedo was an important parameter to determine the amount of radiation absorbed by the underlying surface. The change in Albedo value would be affected by soil moisture and vegetation cover. The boundary A–D edge in Figure 2 represents a high albedo, which represents the albedo corresponding to the vegetation coverage under drought conditions. B–C is the lowest albedo, representing the water-rich area. As surface water decreases, the surface roughness decreases, and the surface albedo (Albedo) also increases [11]. The four points of A, B, C, and D represent four extreme value states. The closed area defined by the four points includes various land cover types except clouds and water bodies, reflecting a certain distribution pattern. Specifically, point B has the least vegetation and the most severe desertification, while point D exhibits the least desertification.

2.3.2. Gravity Center Model

In physics, the gravity center is a point where the forces reach phase equilibrium in all directions [12]. Beyond physics, the gravity center has also been widely used in various fields [10], including production, land use, daily life, and more. The formula is as follows:
x ¯ = i = 1 n z i x i i = 1 n z i y ¯ = i = 1 n z i y i i = 1 n z i
where ( x ¯ , y ¯ ) is the gravity center coordinate, zi is the attribute value of the i-th plane space unit, and (xi, yi) is the coordinate value of the i-th plane space unit.
The gravity center migration direction can be used to characterize the area with more serious desertification, and the migration distance of the gravity center can reveal the dispersion degree of the distribution of the gravity center of desertification. The calculation equation is as follows [12]:
θ = a t c tan y t + m y t x t + m x t d = y t + m y t 2 + x t + m x t 2
where θ is the migration angle of the desertification gravity center; d is the migration distance of the desertification gravity center; yt+m and yt represent the ordinate of the gravity center at t + m and t, respectively; and xt+m and xt represent the abscissa of the gravity center when t + m and t, respectively.

2.3.3. Transfer Matrix

A transfer matrix is used to reflect the transfer process between different degrees of desertification [13]. The calculation formula is as follows:
S i , j = S 11 S 1 n S n 1 S n n
where S represents different degrees of transfer area (km2); n represents different degrees of desertification; i and j represent the degree of desertification in the initial and final periods, respectively; and Snn represents the area change (km2) in the desertification degree from the initial period to the final period.

2.3.4. Geodetector

Geographic detectors, as an emerging geographic analysis tool, focus on identifying, quantifying, and analyzing the spatial heterogeneity of geographic phenomena. A geodetector can be used to determine the contribution rate of a factor to desertification [14]. The correlation degree is measured by a q value ranging from 0 to 1. The calculation formula is as follows:
q = 1 h = 1 L N h σ h 2 N σ 2 = 1 SSW SST
SSW = h = 1 L N h σ h 2
SST = N σ 2
where h = 1, …, L is the classification of variable Y or factor X; Nh and N are the layer h and the number of units in the whole region, respectively; σ h 2 represents the variance of Y values for class h; σ 2 denotes the variance of Y values for the entire region; SSW is the sum of intra-layer variance; and SST is the total variance of the whole region.

2.3.5. Typical Feature Parameters of Desertification

During the process of desertification, vegetation coverage, surface albedo, and land surface temperature undergo significant changes. Therefore, based on the MODIS datasets, this study selected the land surface temperature (LST, MOD11A1), vegetation index (NDVI (MOD13Q1) and MSAVI), topsoil particle size index (TGSI), and surface albedo (Albedo) to propose the desertification feature space monitoring model [15]. The calculation formulas are as follows:
MSAVI = ( ( 2 NIR + 1 ( 2 NIR + 1 ) 2 8 ( NIR RED ) ) / 2
TGSI = ( RED BLUE ) / ( RED + BLUE + GREEN )
Albedo = 0.356 BLUE + 0.13 RED + 0.085 SWIRI + 0.072 SWIR 2 0.0018
In the above formula, NIR is the near-infrared band, RED is the red band, BLUE is the blue band, GREEN is the green band, and SWIR1 and SWIR2 are short-wave infrared 1 and short-wave infrared 2, respectively.
To eliminate the influence of dimensional differences, the feature parameters of different units or orders of magnitude should be compared, weighted, and normalized. The normalized calculation formula is as follows:
Nor = A A min A max A min
In the formula, Nor is the normalized various specialized parameters. A is the characteristic parameter, Amax is the maximum value of each characteristic parameter, and Amin is the minimum value of each characteristic parameter.

3. Results

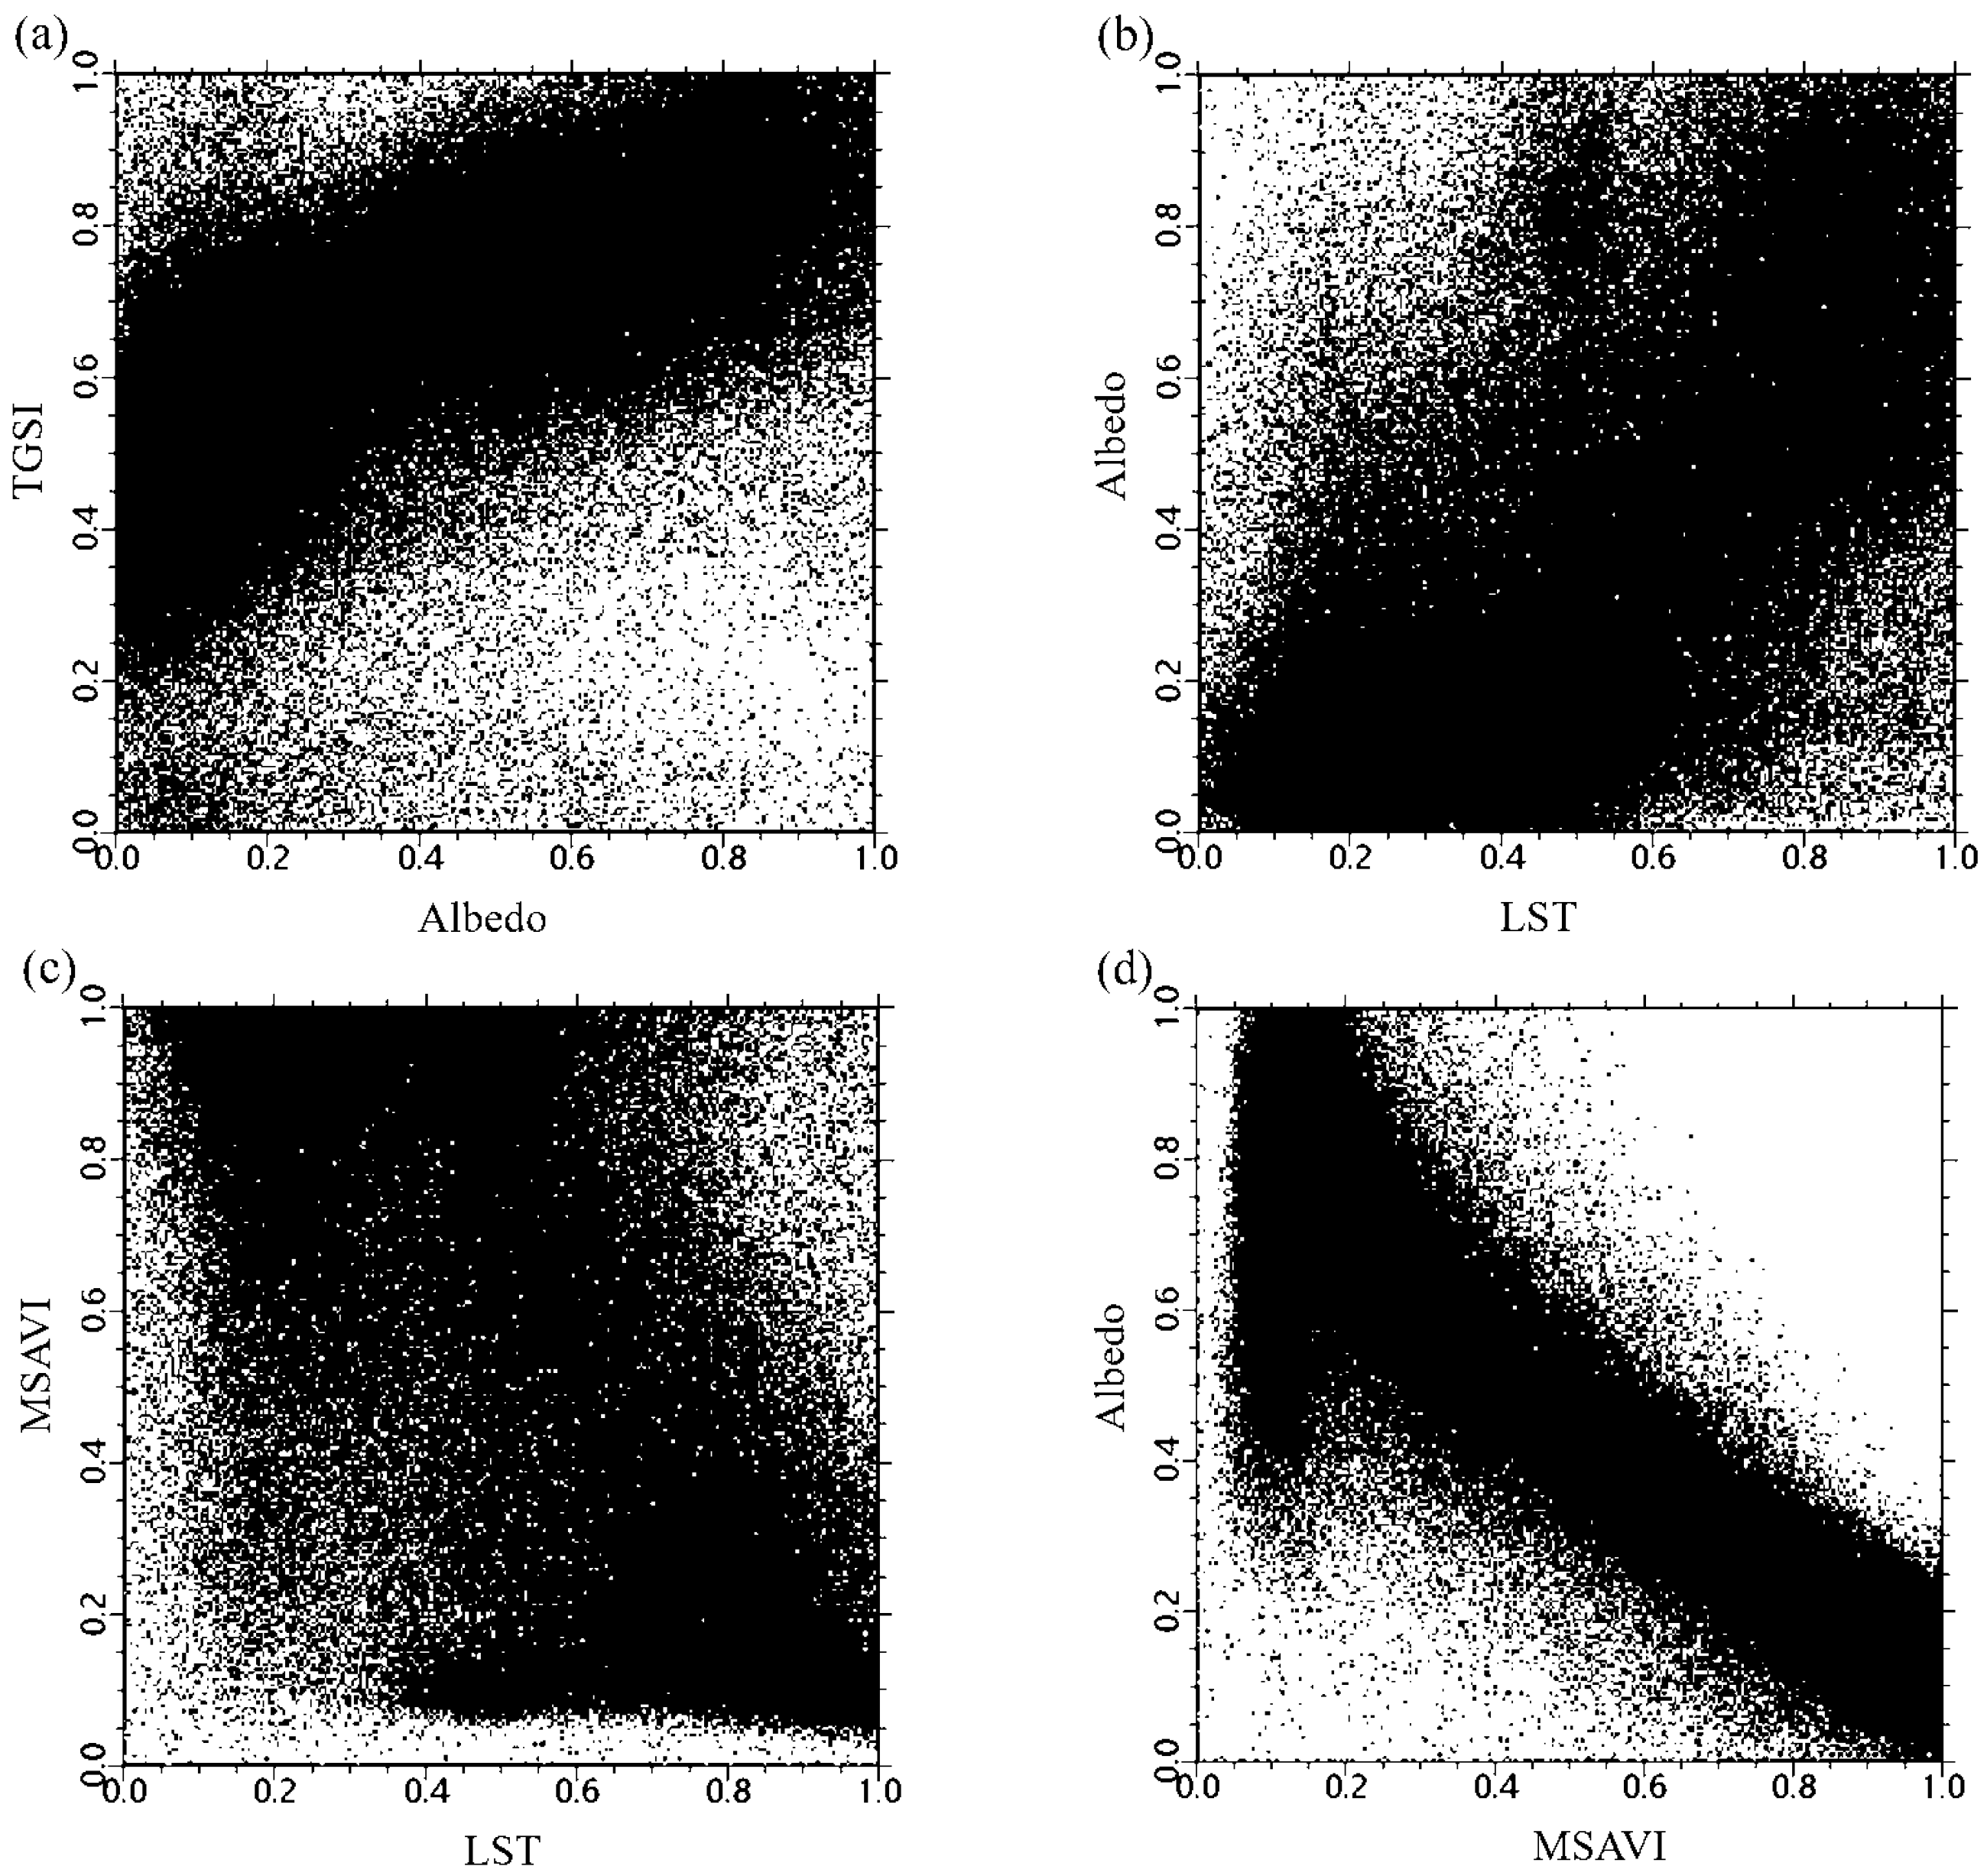
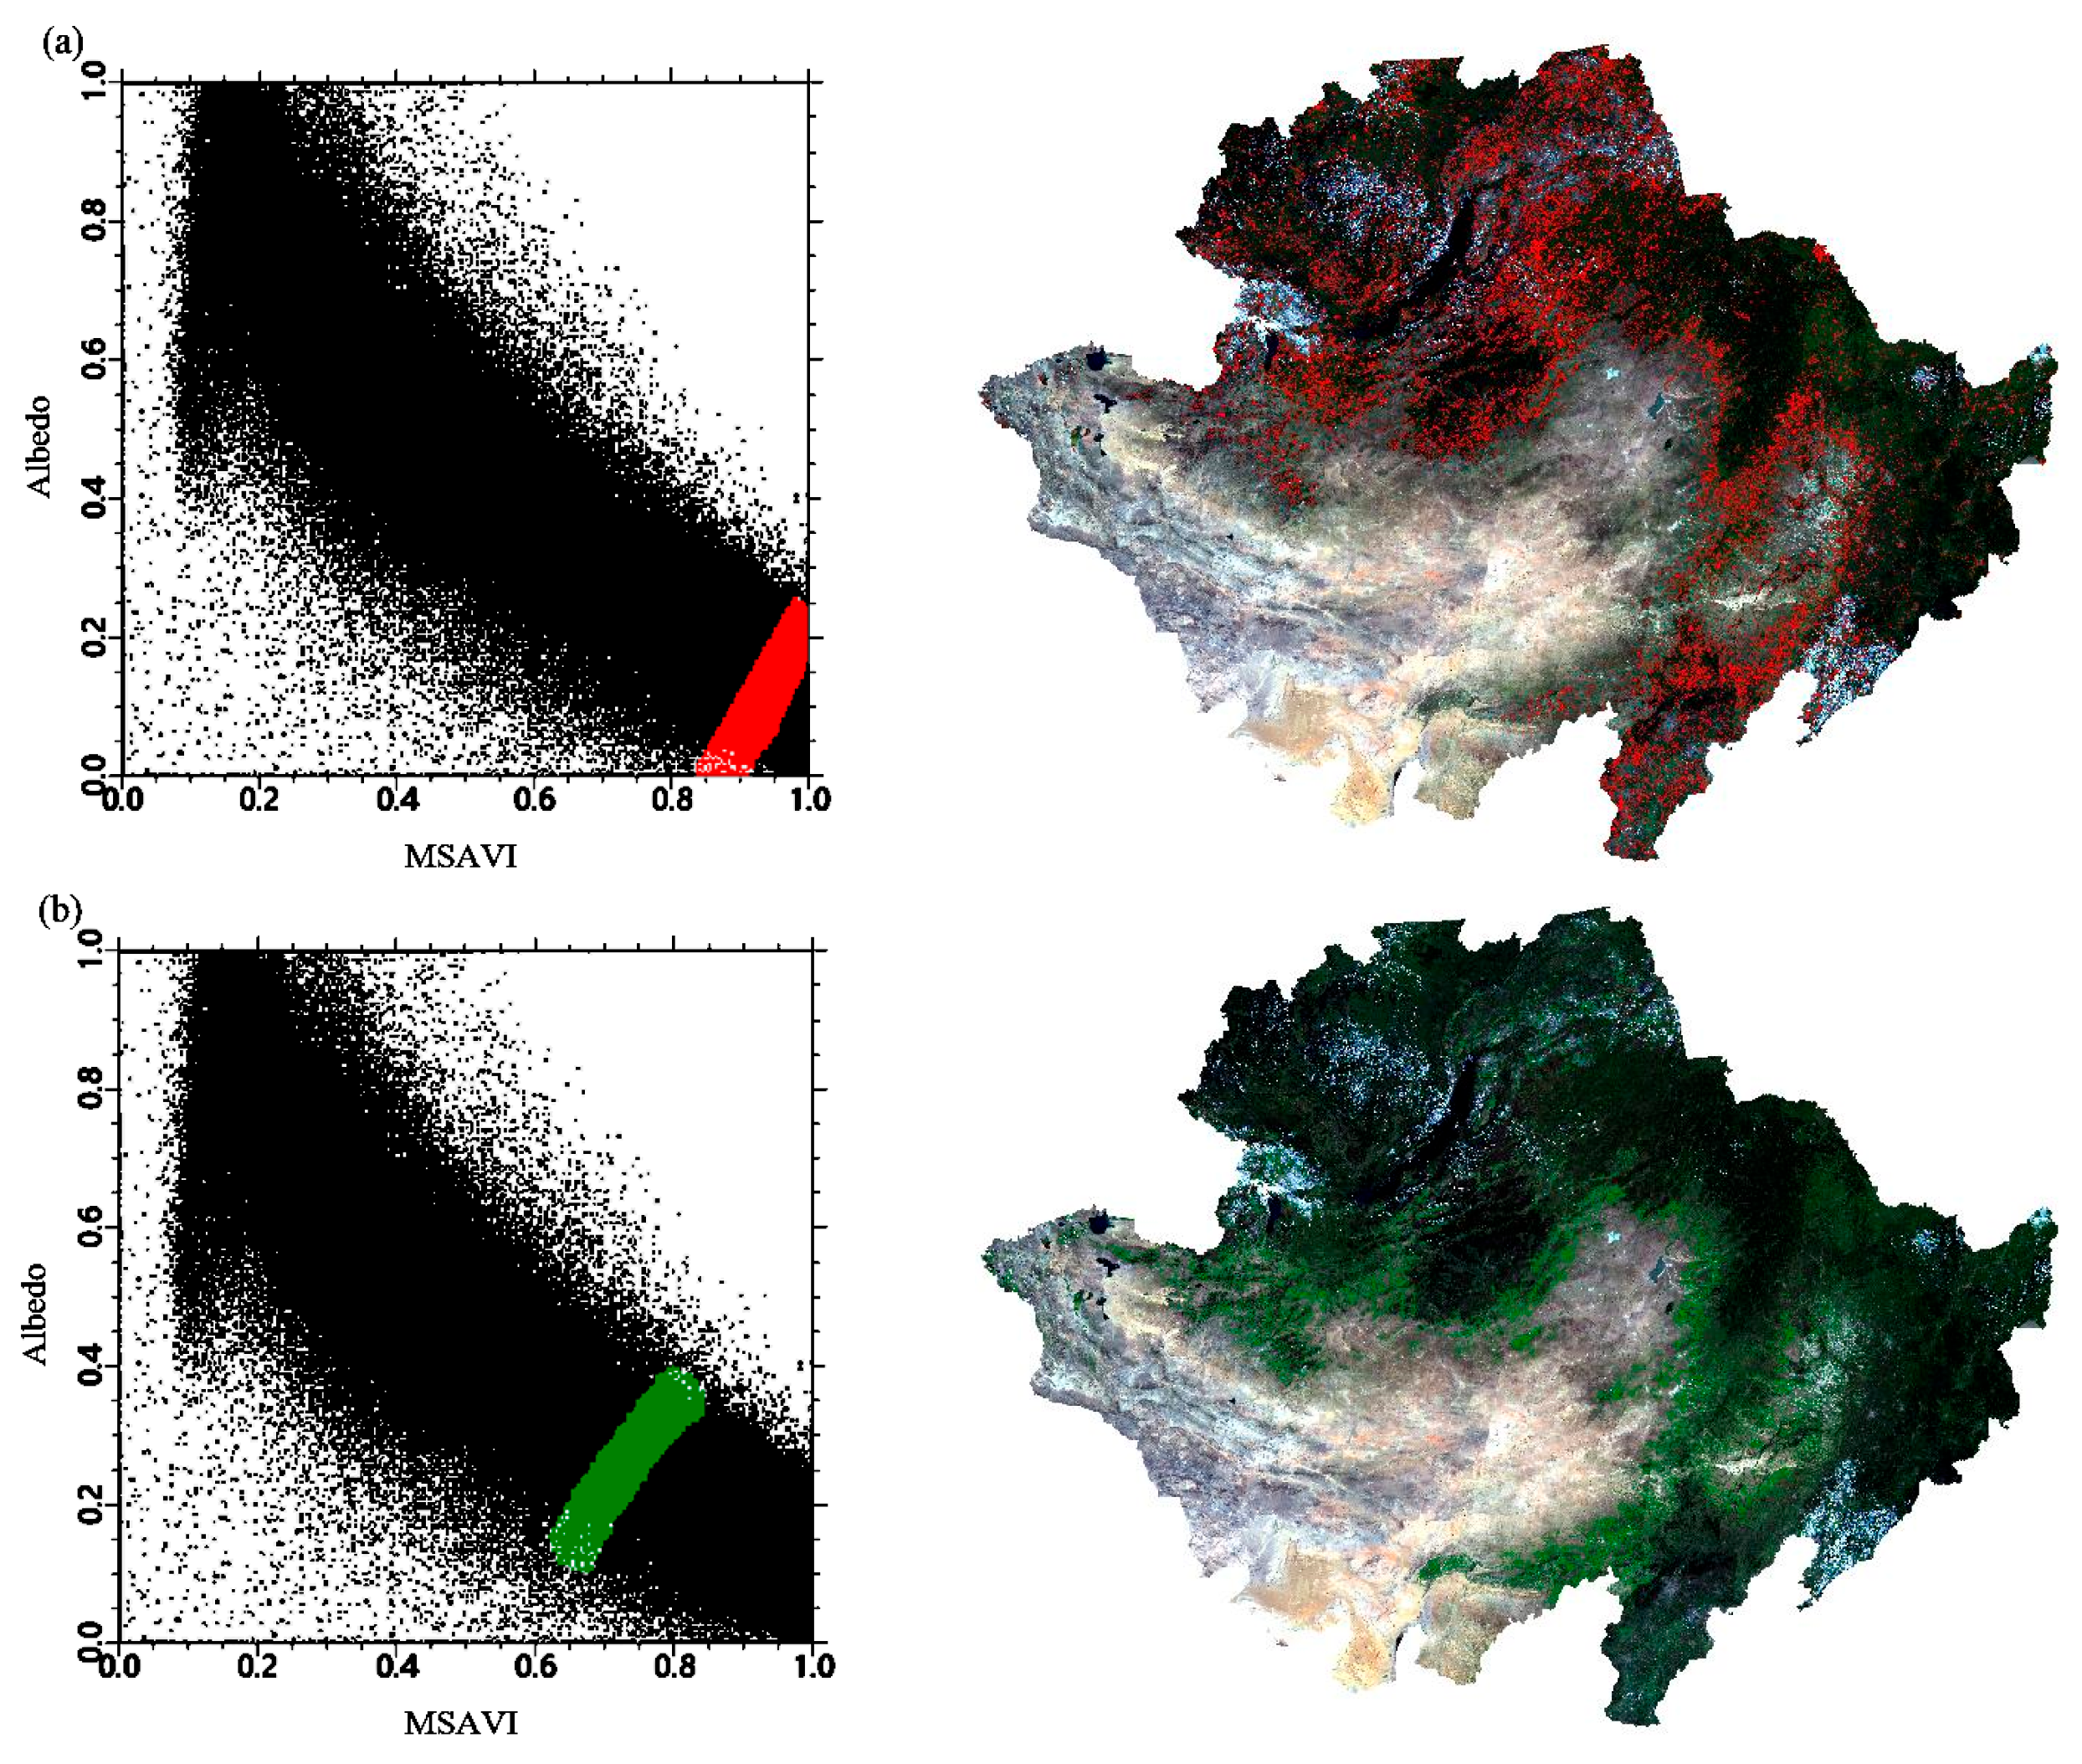
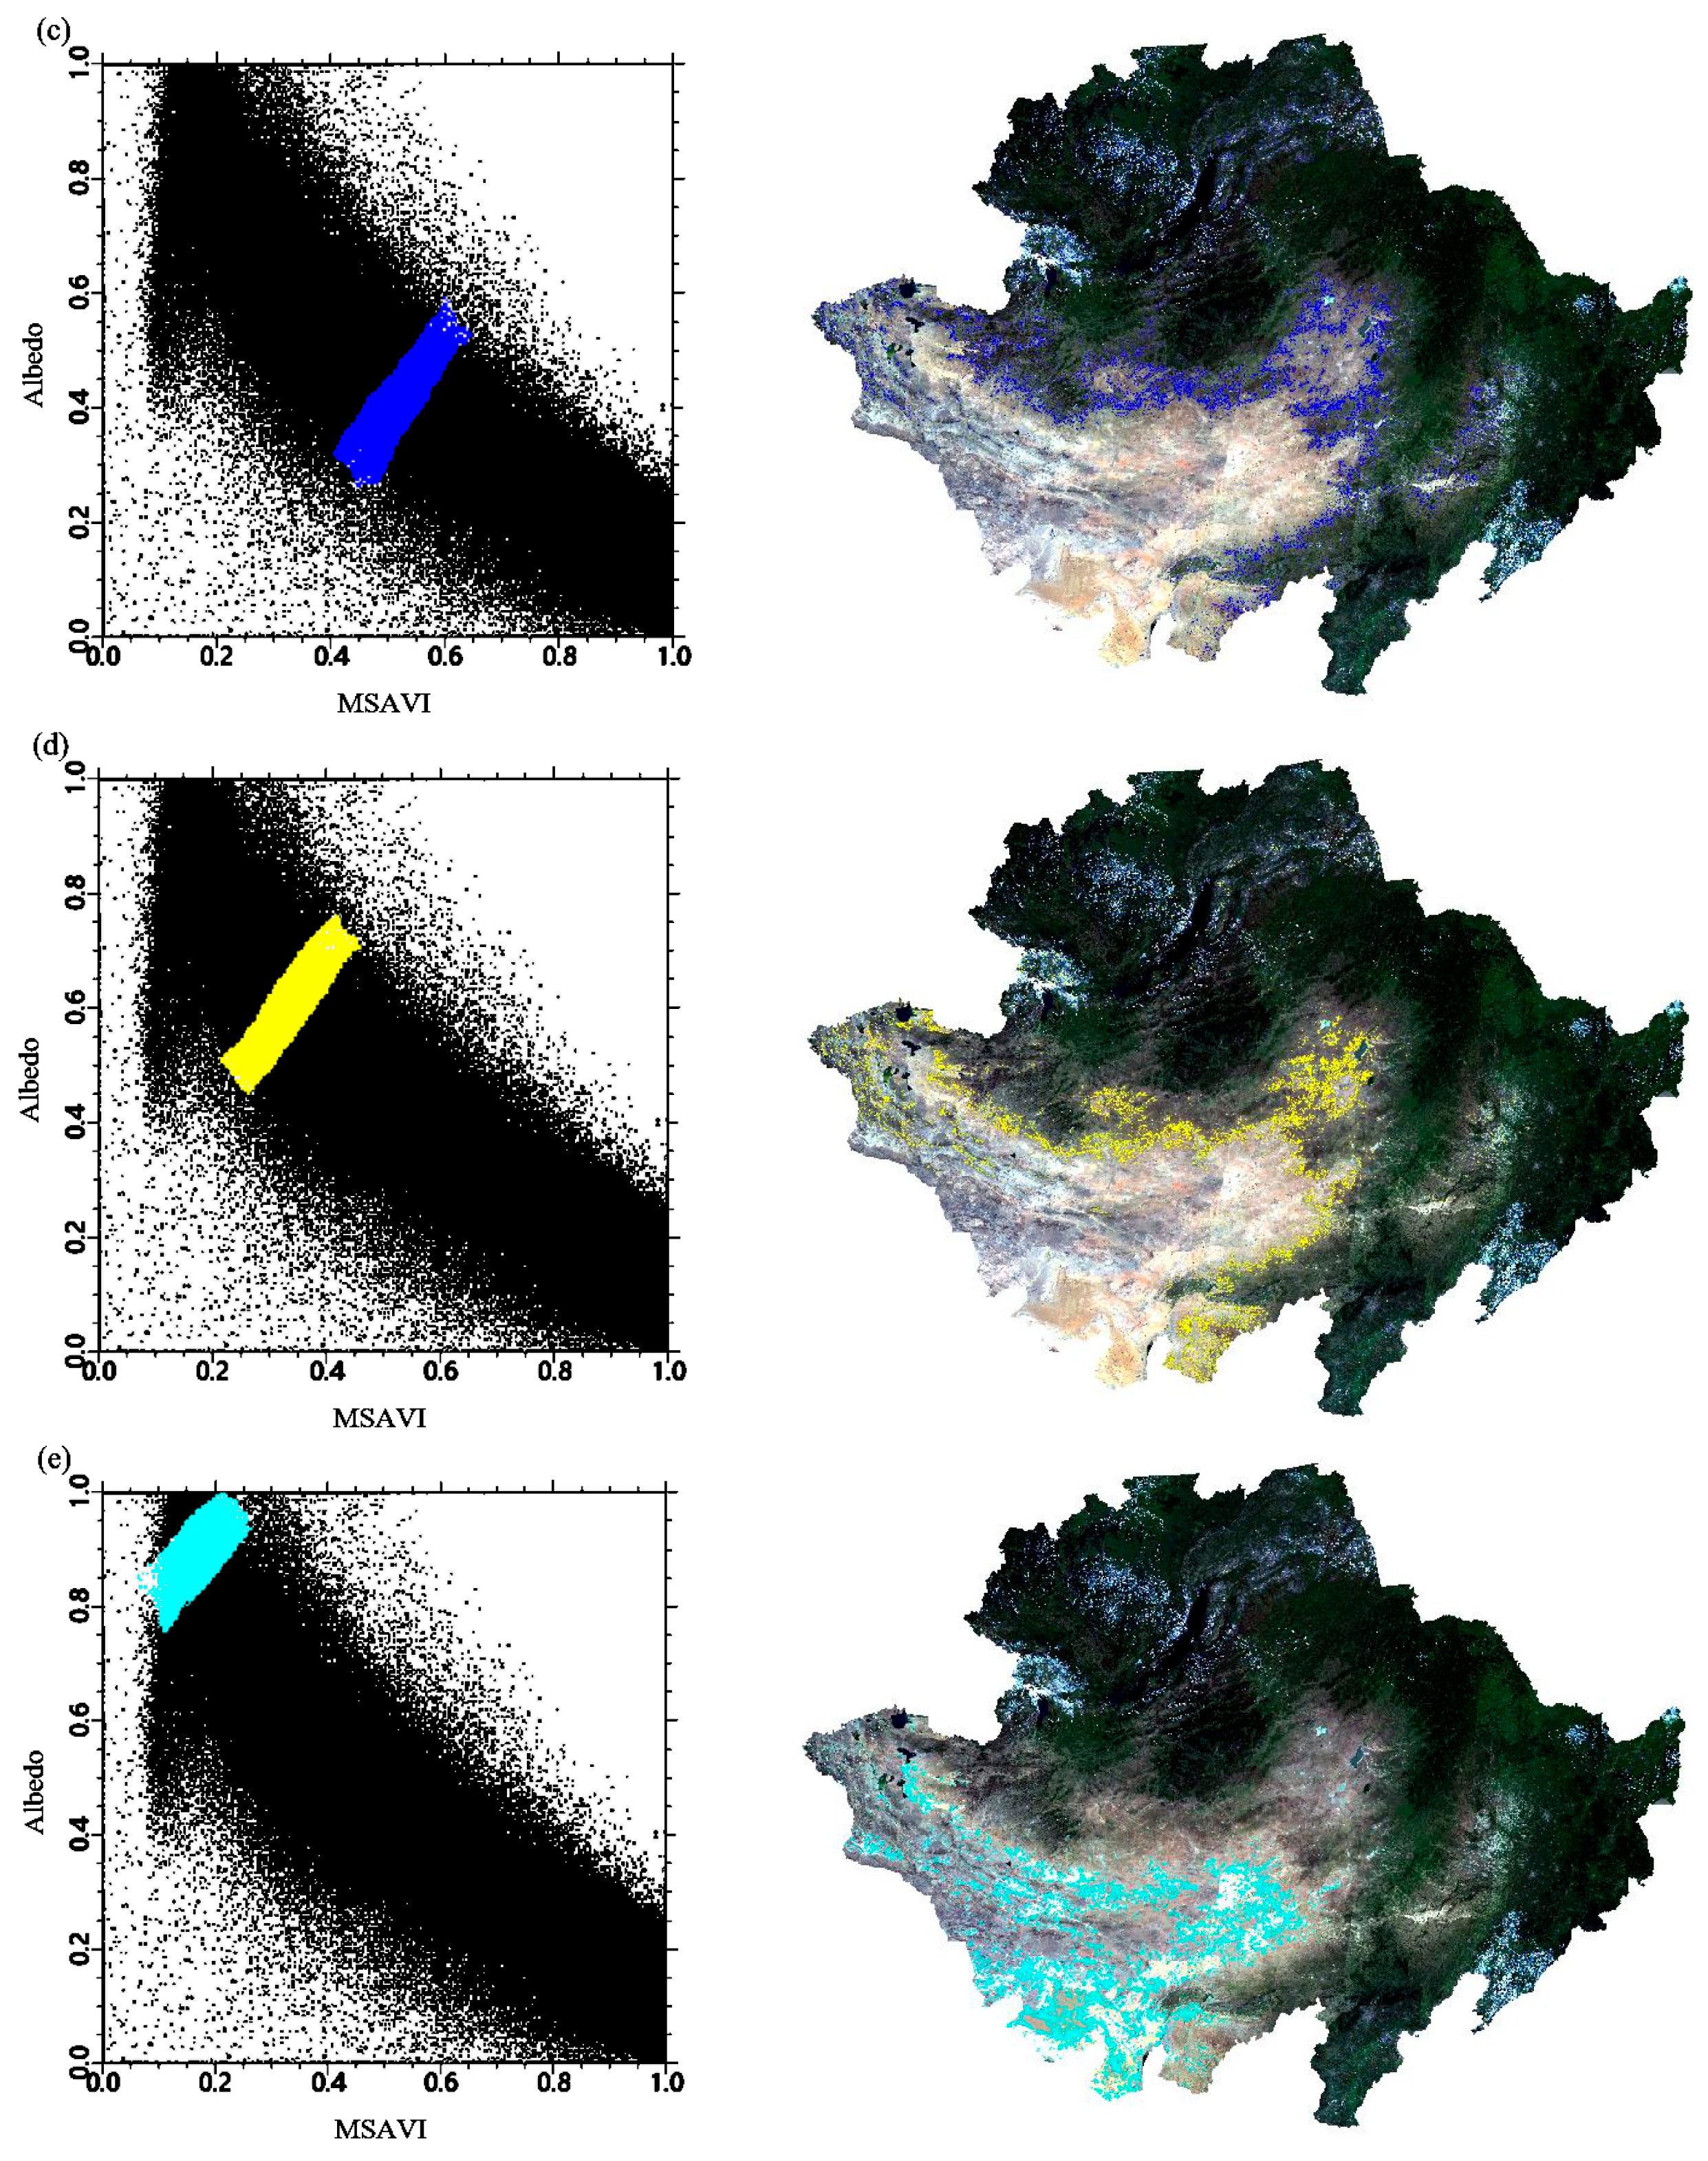
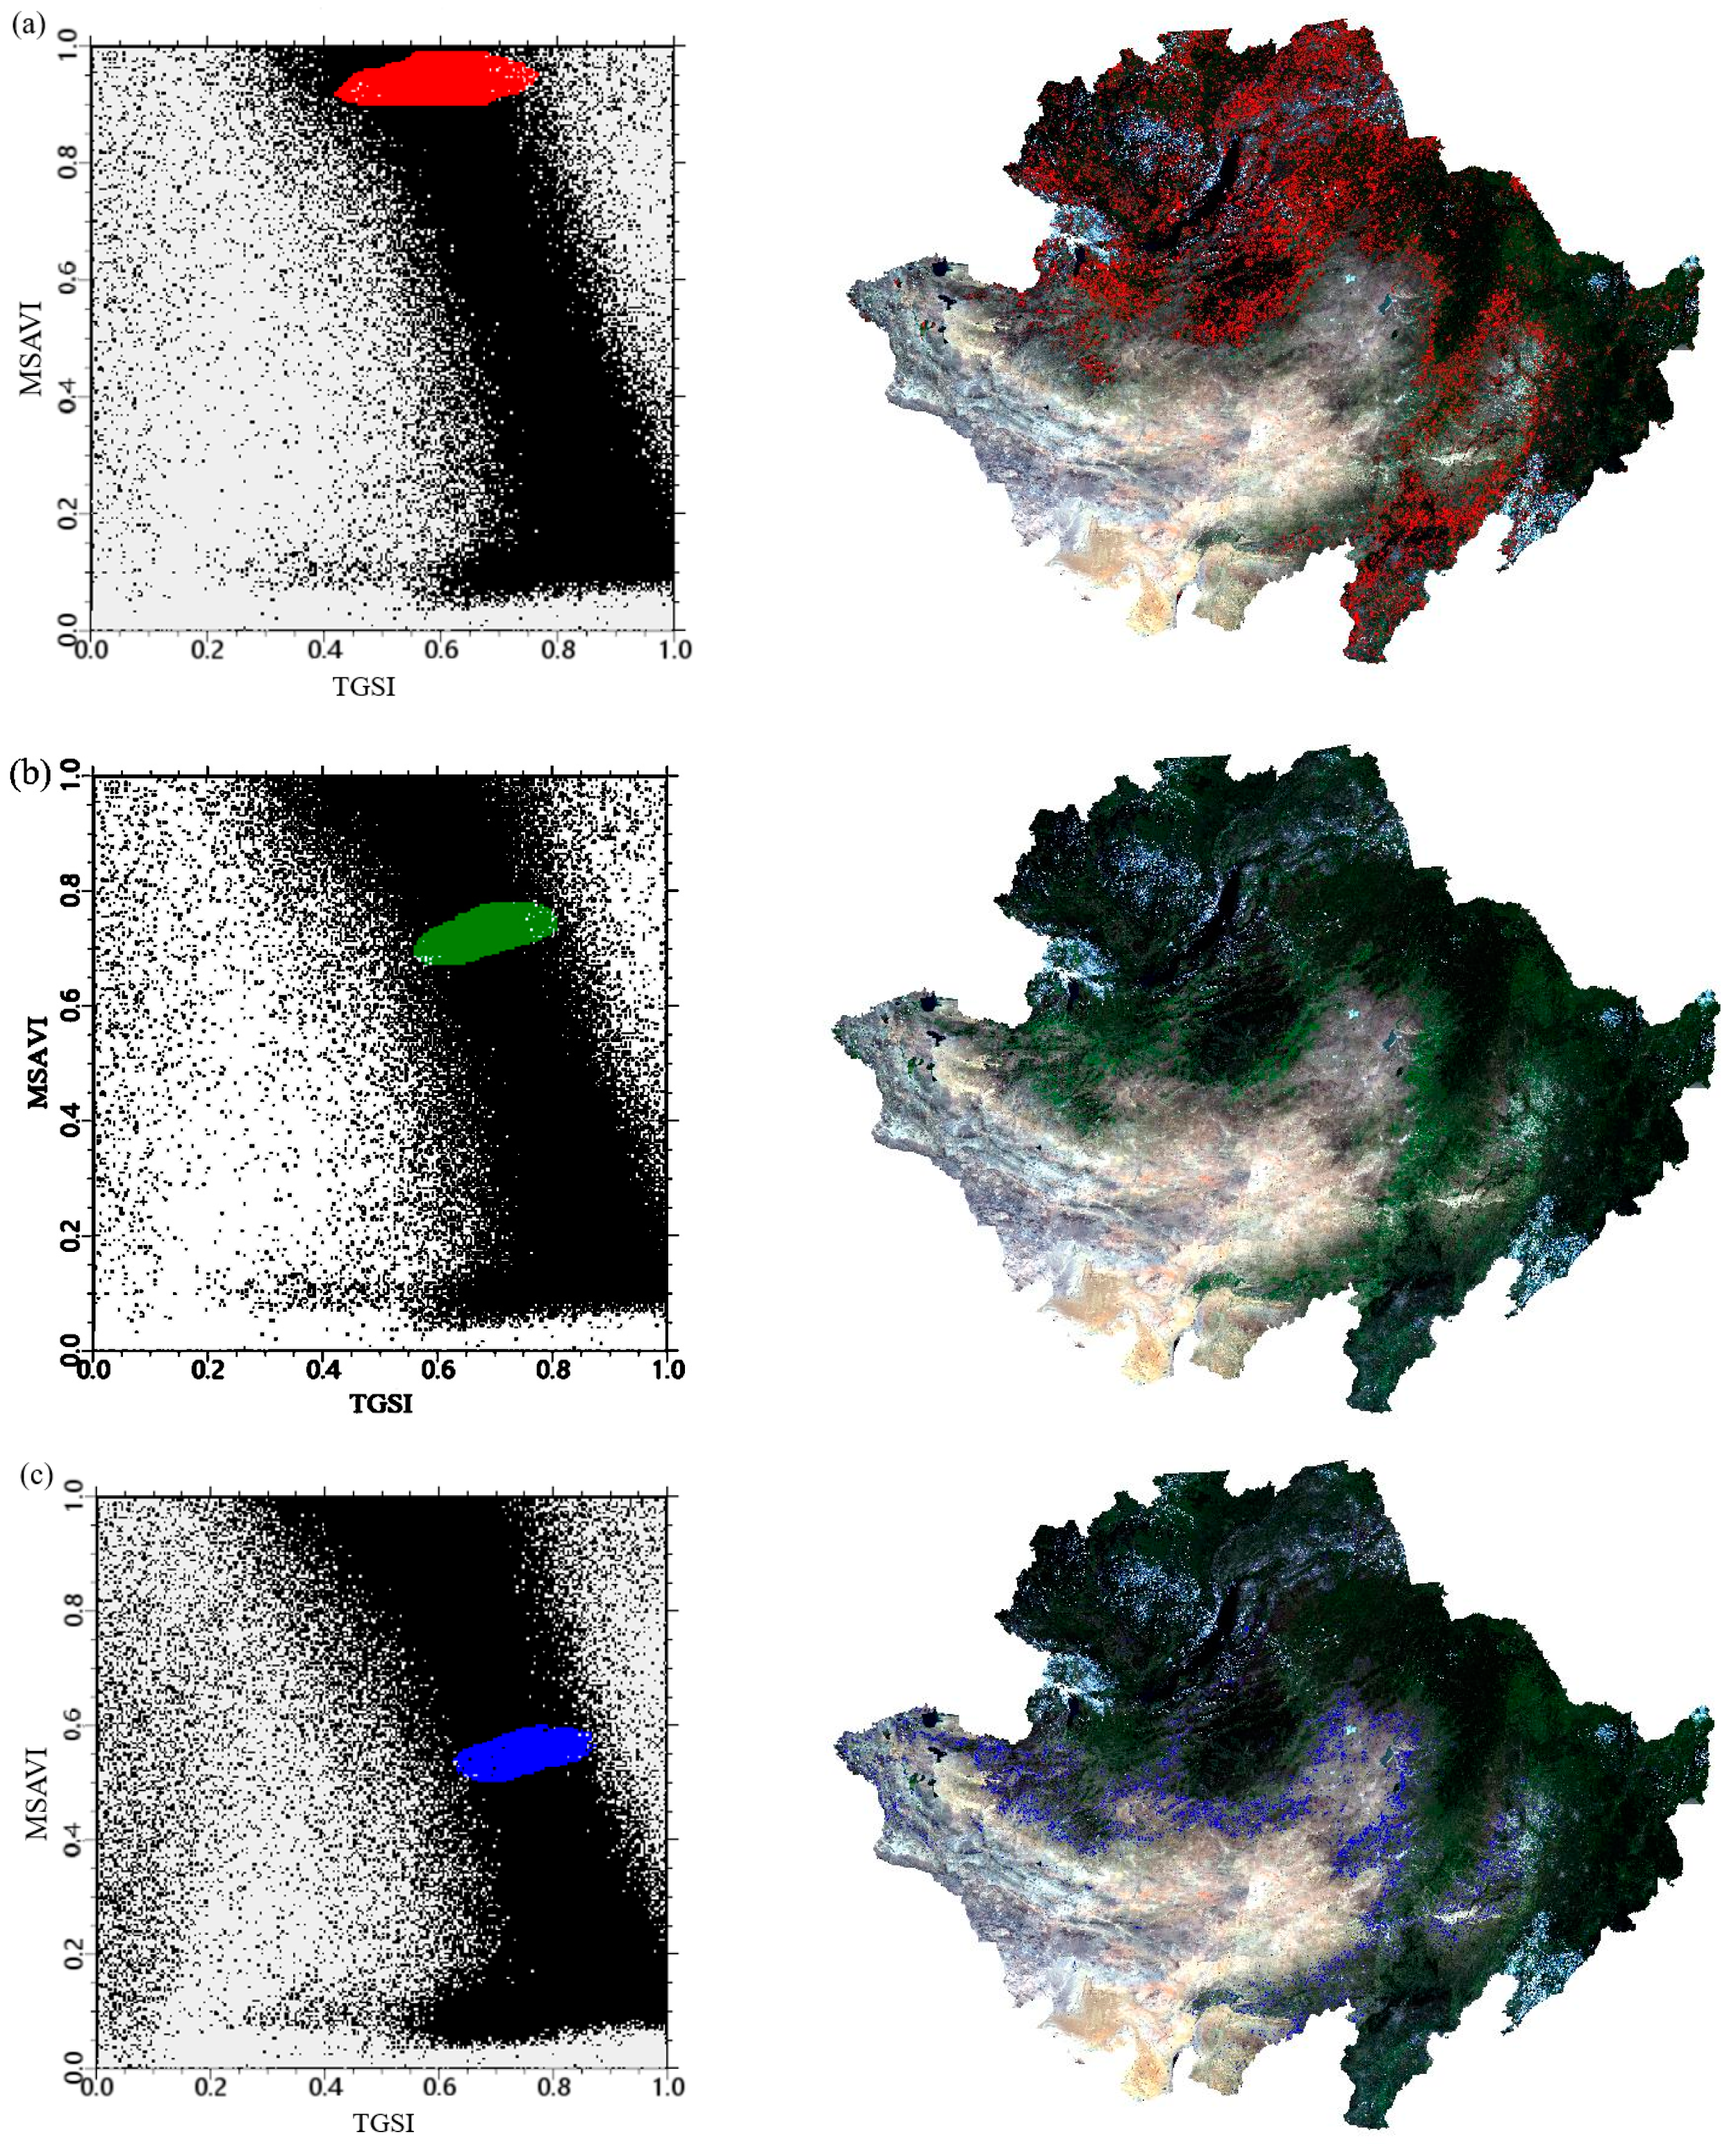
3.1. Construction of the Desertification Feature Space Model

3.1.1. Feature Variable Inversion

The feature variables were extracted and normalized, and the extracted results were inverted to obtain the inversion result maps for the five feature variables, as shown in Figure 3.

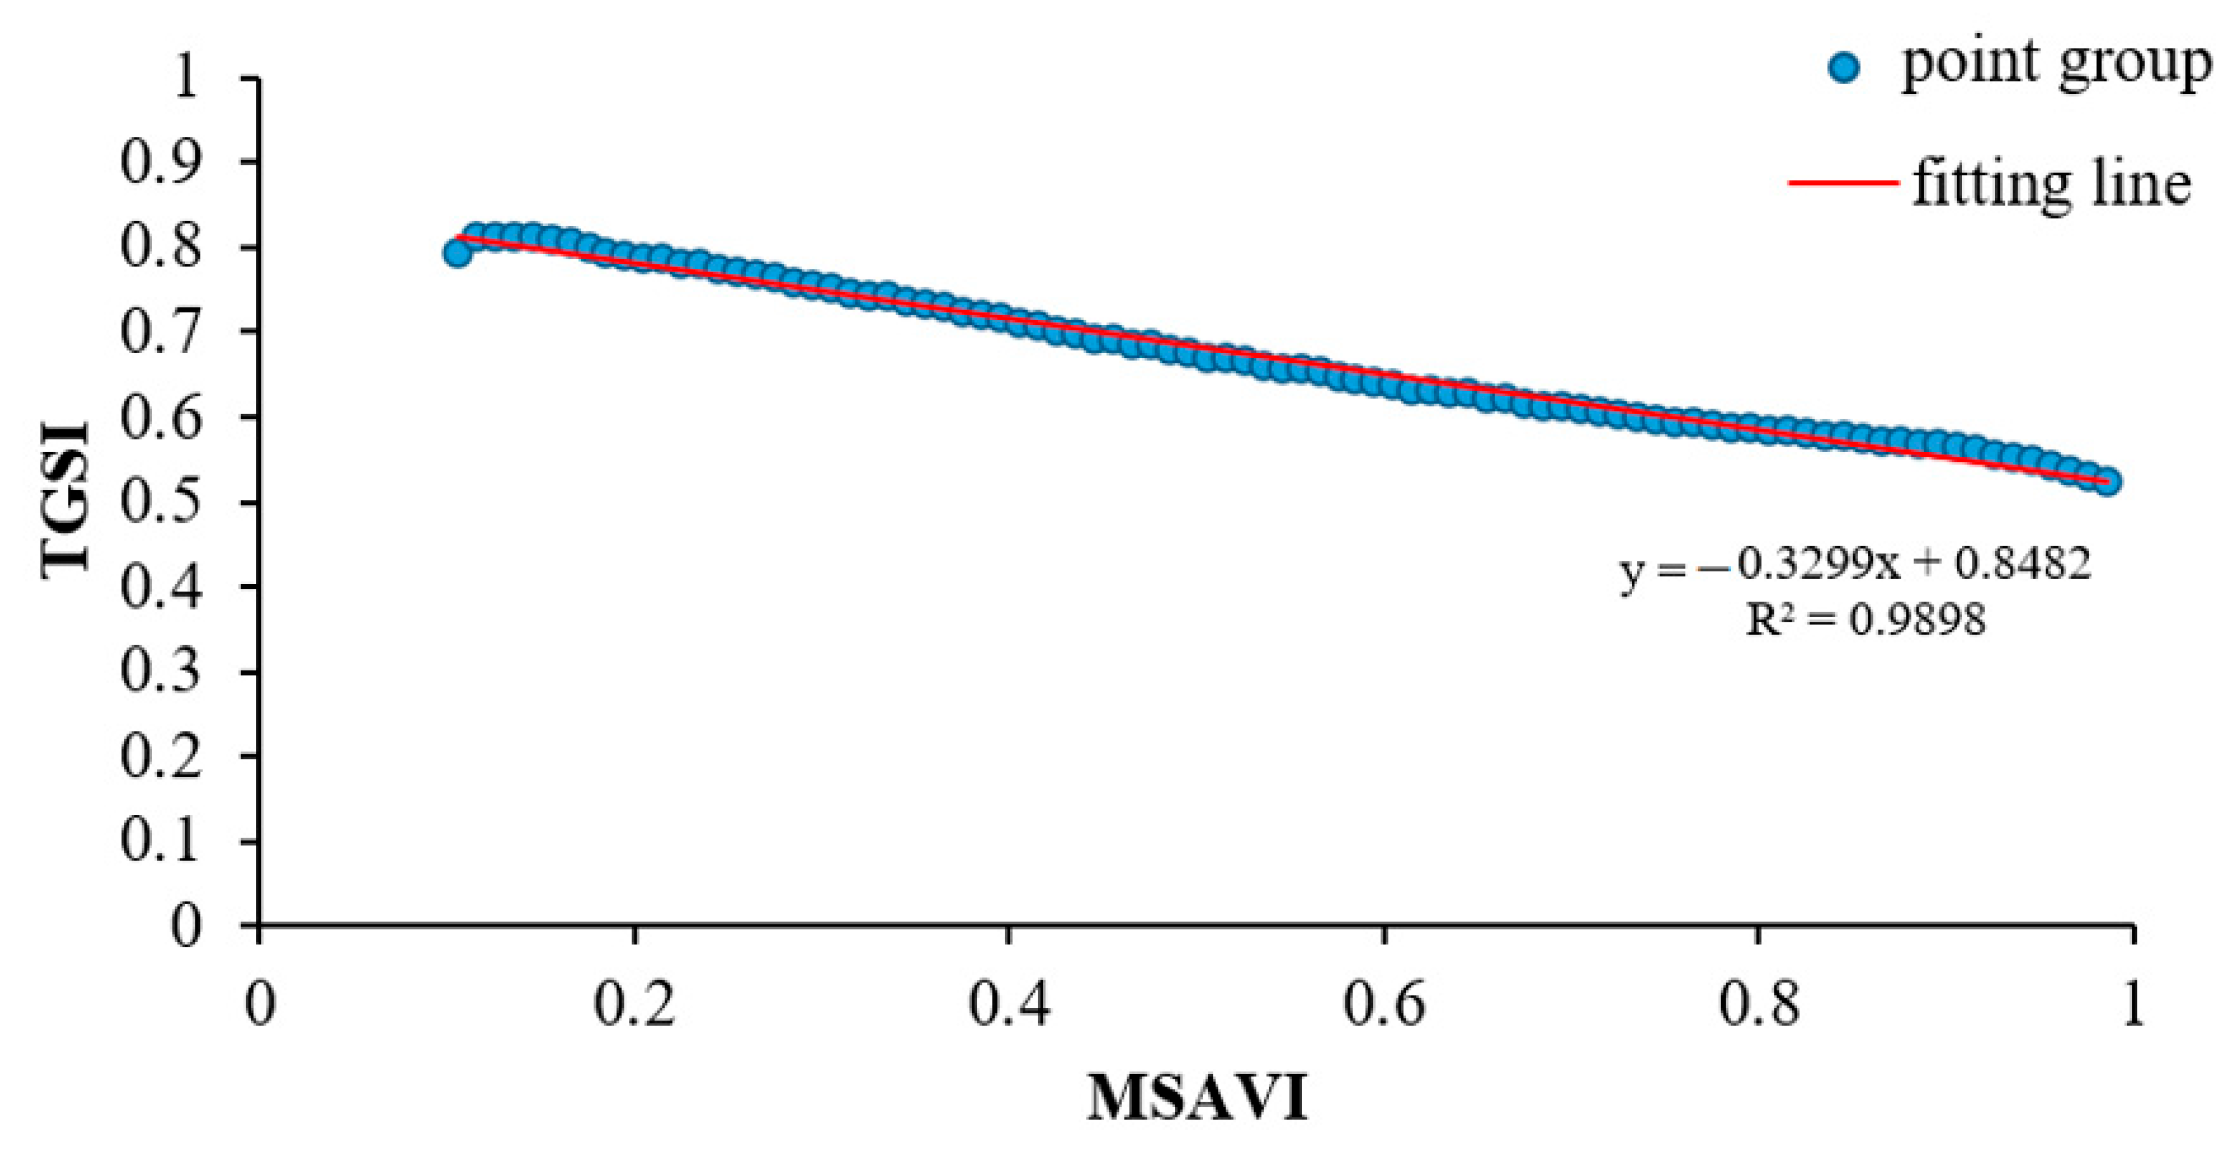
3.1.2. Feature Space

In different geographic locations, due to the complexity and diversity of topography and landforms, a single index has limitations in detecting desertification. This study uses a two-dimensional feature space, utilizing a two-dimensional scatter plot tool with two typical feature parameters as the X and Y axes. Based on the five feature parameters mentioned, nine feature spaces are constructed. Feature selection is exemplified for the year 2020, as shown in Figure 4.

3.1.3. Desertification Monitoring Index

To analyze the differentiation patterns of various desertification degrees in feature space, this study constructs two models: the point–point model and the point–line model.
For the point–point mode, MSAVI–Albedo is taken as an example (Figure 5). In the Albedo–MSAVI feature space, the point groups are divided into five categories and combined with Google Earth images and actual field observation samples, the desertification status of the actual space is compared and analyzed to study the corresponding relationship between different degrees of desertification and point groups.
Significant differences existed in the spatial distribution of corresponding point groups with different degrees of desertification. The farther the distance from point O (1, 0), the more serious the degree of desertification. The degree of desertification is divided into non-desertification, mild desertification, moderate desertification, severe desertification, and extremely severe desertification, as shown in Figure 6.
According to the distance formula between two points, the desertification detection index model was constructed. The formula is as follows:
L = ( MSAVI 1 ) 2 + Albedo 2
Based on the point–line mode and taking TGSI–MSAVI as an example, as shown in Figure 7, the distribution of point groups in the TGSI–MSAVI feature space is rectangular, and the point–line pattern is determined accordingly. The point groups are divided into five categories and combined with Google Earth images and actual field observations. They are compared with the desertification status of the actual space to study the corresponding relationship between different degrees of desertification and point groups.
According to the distance from any point P to the soil line L, different desertification degrees could be determined. The shorter the distance from point P to line L, the more serious the corresponding desertification degree. The farther the distance, the lighter the desertification degree. According to this, the point group was divided into five degrees—non-desertification, mild desertification, moderate desertification, severe desertification, and extremely severe desertification—as shown in Figure 8.
Based on the distance formula from point to line, the distance formula from point to soil line L is constructed:
TGSI = α MSAVI + β
DL = | TGSI α MSAVI β | 1 + α 2
In the equation, α , β is the parameter of the soil line regression equation and DL is the distance from the point to the soil line.
Fit the soil first. By testing correlations, you can understand how well different feature parameters fit in feature space construction, as shown in Figure 9, with the equation y = −0.3299x + 0.8482. The coefficients α and β are −0.3299 and 0.8428, and TGSI and MSAVI showed a significant negative correlation with R2 = 0.9898.

3.1.4. Accuracy Verification

In order to determine the optimal model to distinguish the degree of desertification, a total of 221 verification points were chosen. Combined with Google Earth real images and field observed samples, the error matrix was constructed, and then the Kappa coefficient (KC) was calculated. As shown in Table 1 and Table 2, based on the point–point mode, the MSAVI–Albedo feature space monitoring index model had the highest accuracy with 86.47%, and the KC was 0.825. The monitoring accuracy of the MSAVI–LST feature space model was the second largest, 79.87%, and the KC was 0.72. Based on the point–line mode, the MSAVI–TGSI feature space monitoring index model had the highest accuracy of 85.71%, and the KC was 0.815, followed by the TGSI–Albedo feature space monitoring model, with an accuracy of 74.65% and a KC of 0.669.
To investigate the monitoring accuracy of different models for various degrees of desertification, an error matrix is used for further analysis of each model’s performance across different levels of desertification, as shown in Table 3. The MSAVI–LST feature space had the highest monitoring accuracy for non-desertification, which was 93.2%, followed by the MSAVI–Albedo with 92.5%. The MSAVI–Albedo feature space had the highest monitoring accuracy for mild desertification and extremely severe desertification, with 90.5% and 88.6%, respectively. The MSAVI–TGSI feature space had the highest monitoring accuracy for moderate desertification and severe desertification, which were 90.1% and 88.4%, respectively.
The above analysis showed that the MSAVI–Albedo feature space monitoring index model based on point–point mode had better applicability in desertification monitoring in CMREC. China and Russia extend into a variety of different climate conditions beyond the analyzed region; thus, this assumption is marginally reasonable.

3.2. Spatial and Temporal Evolution Pattern of Desertification

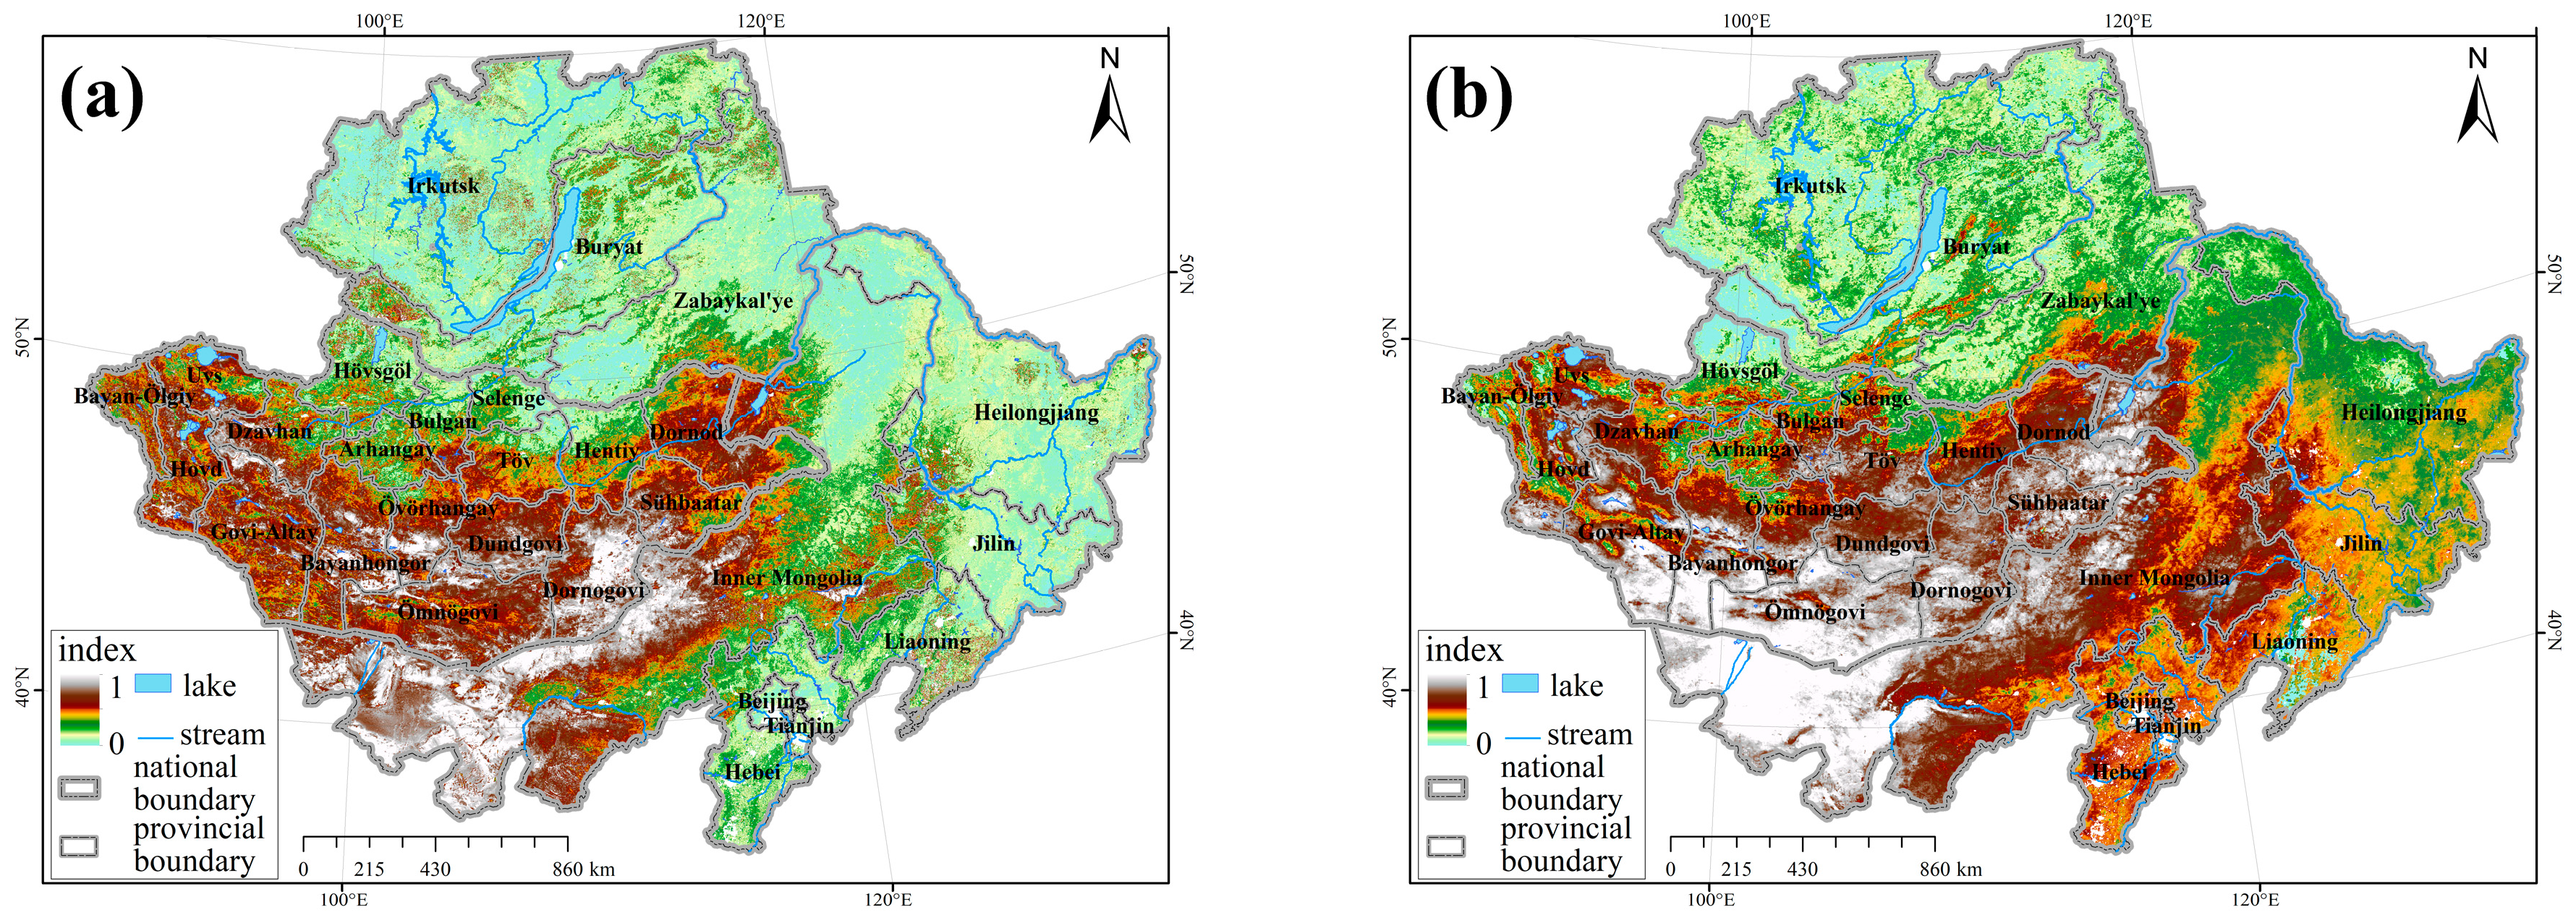
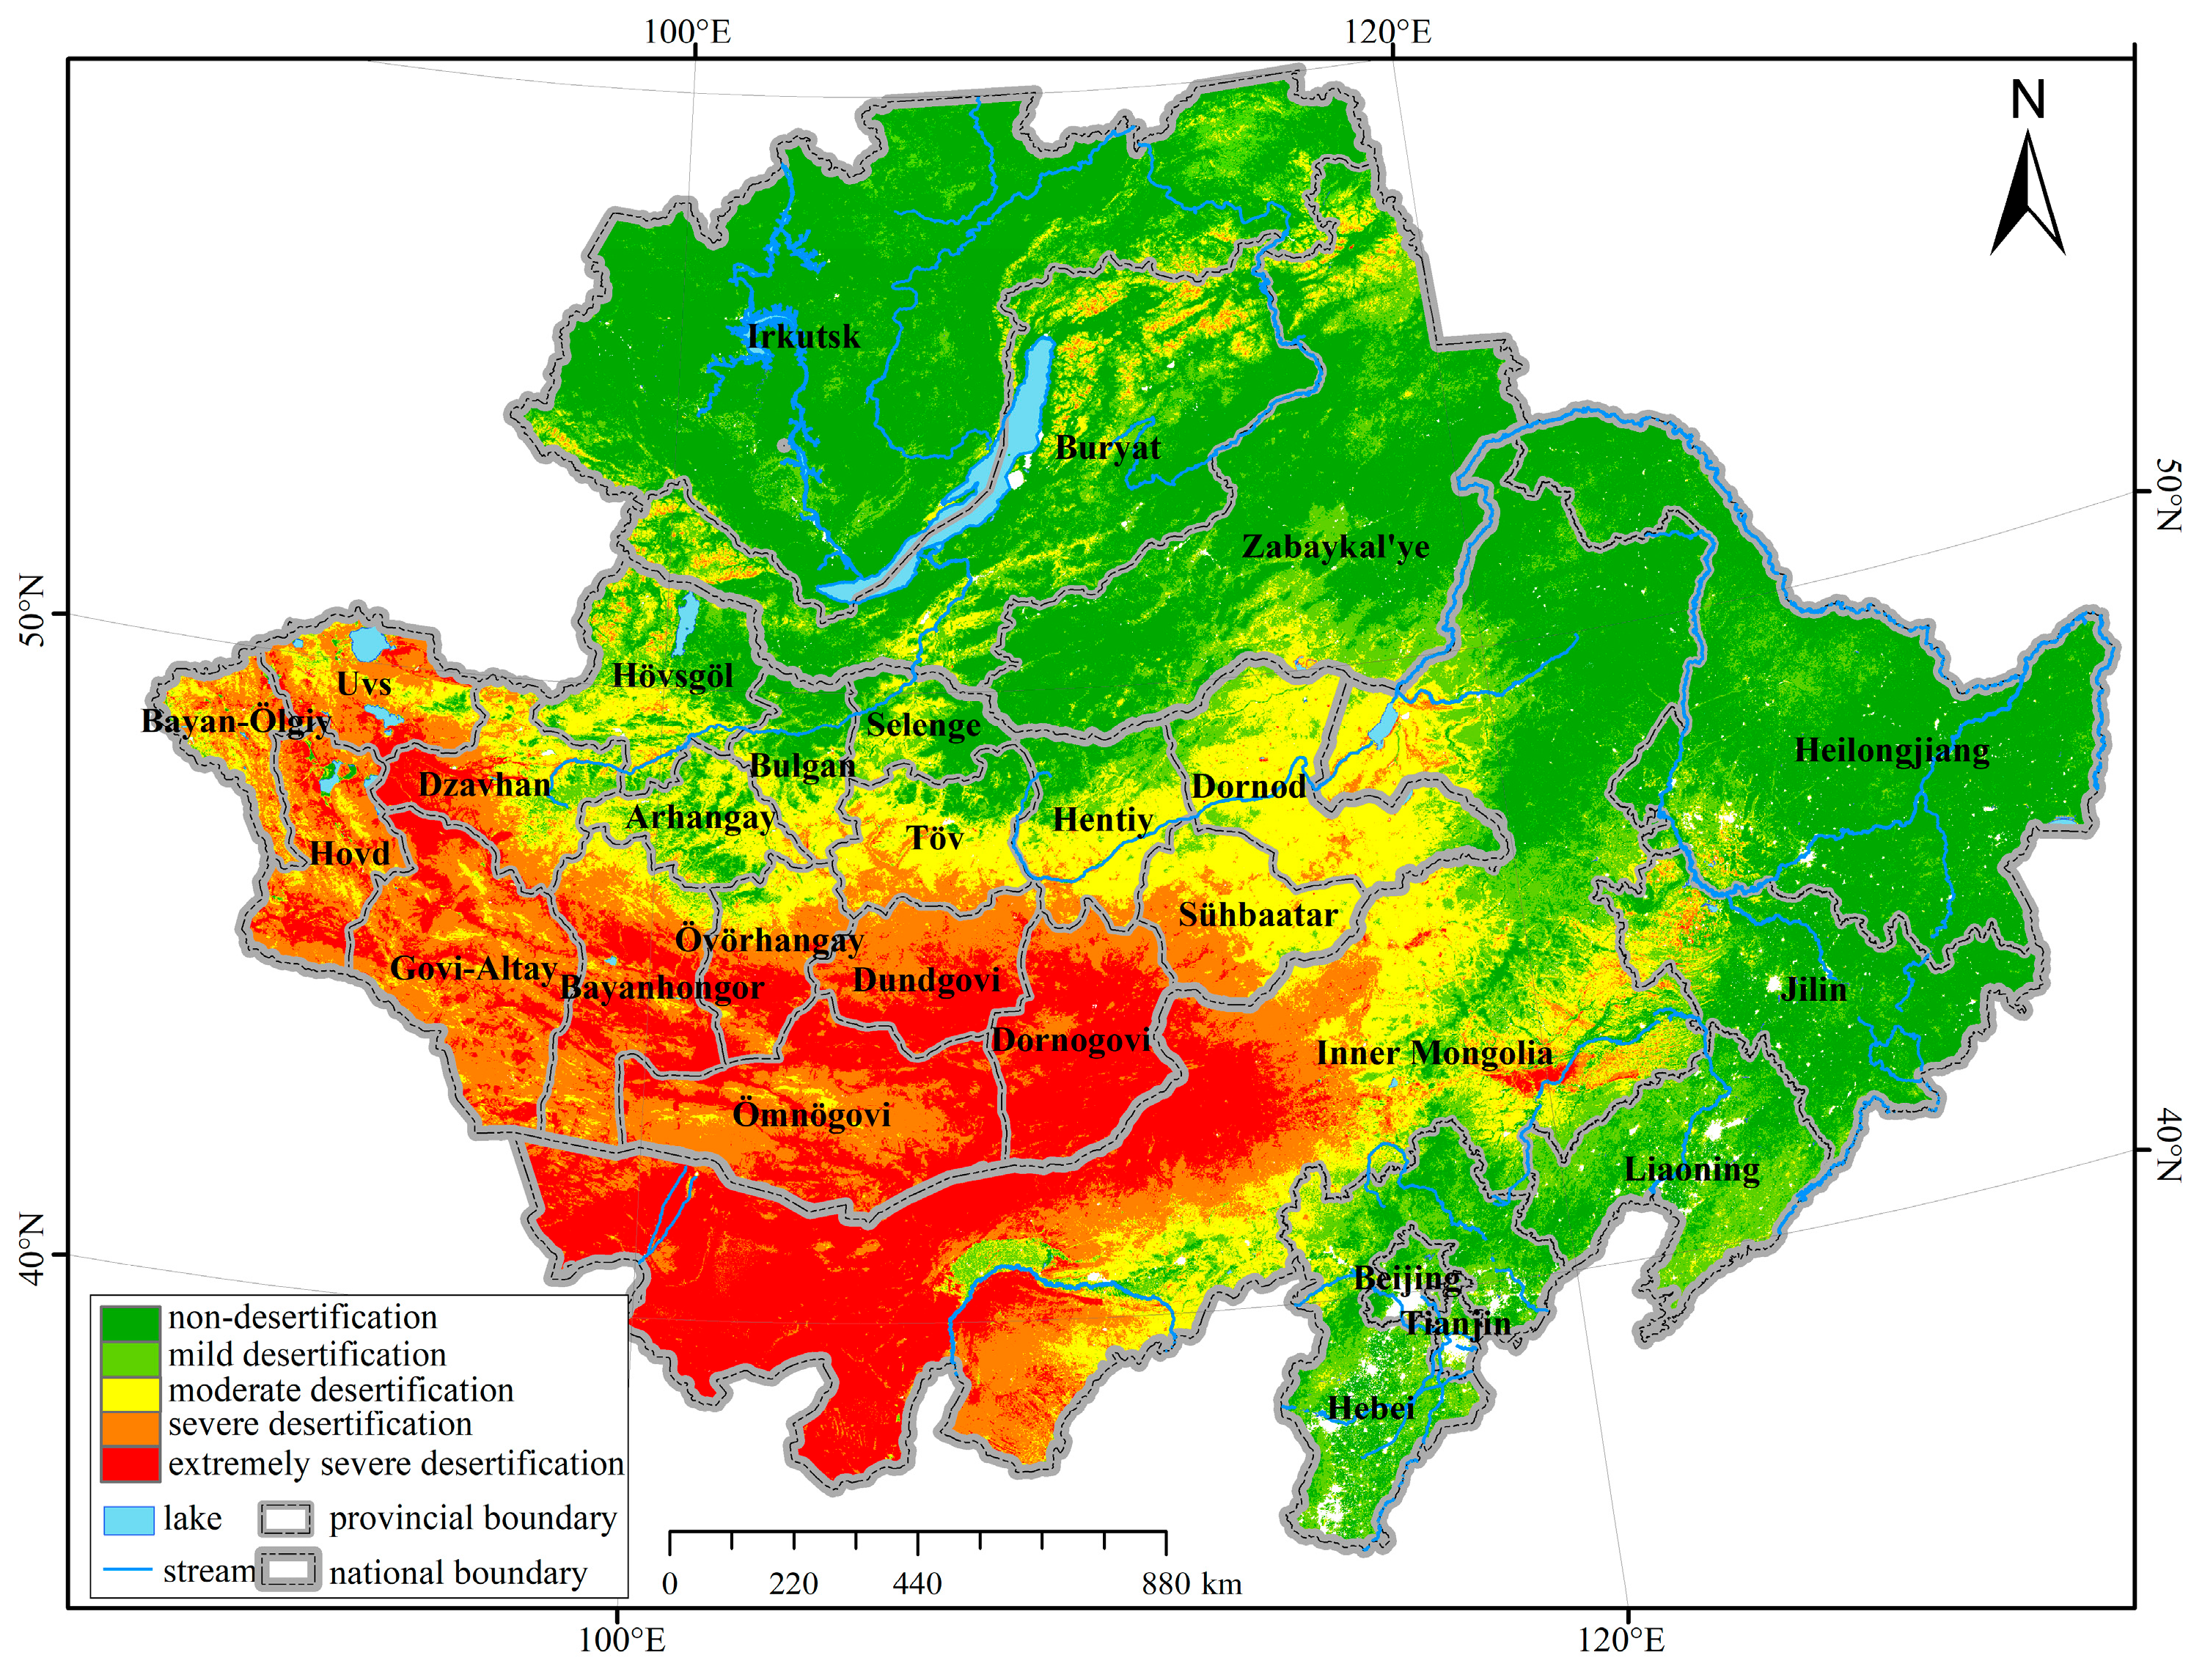
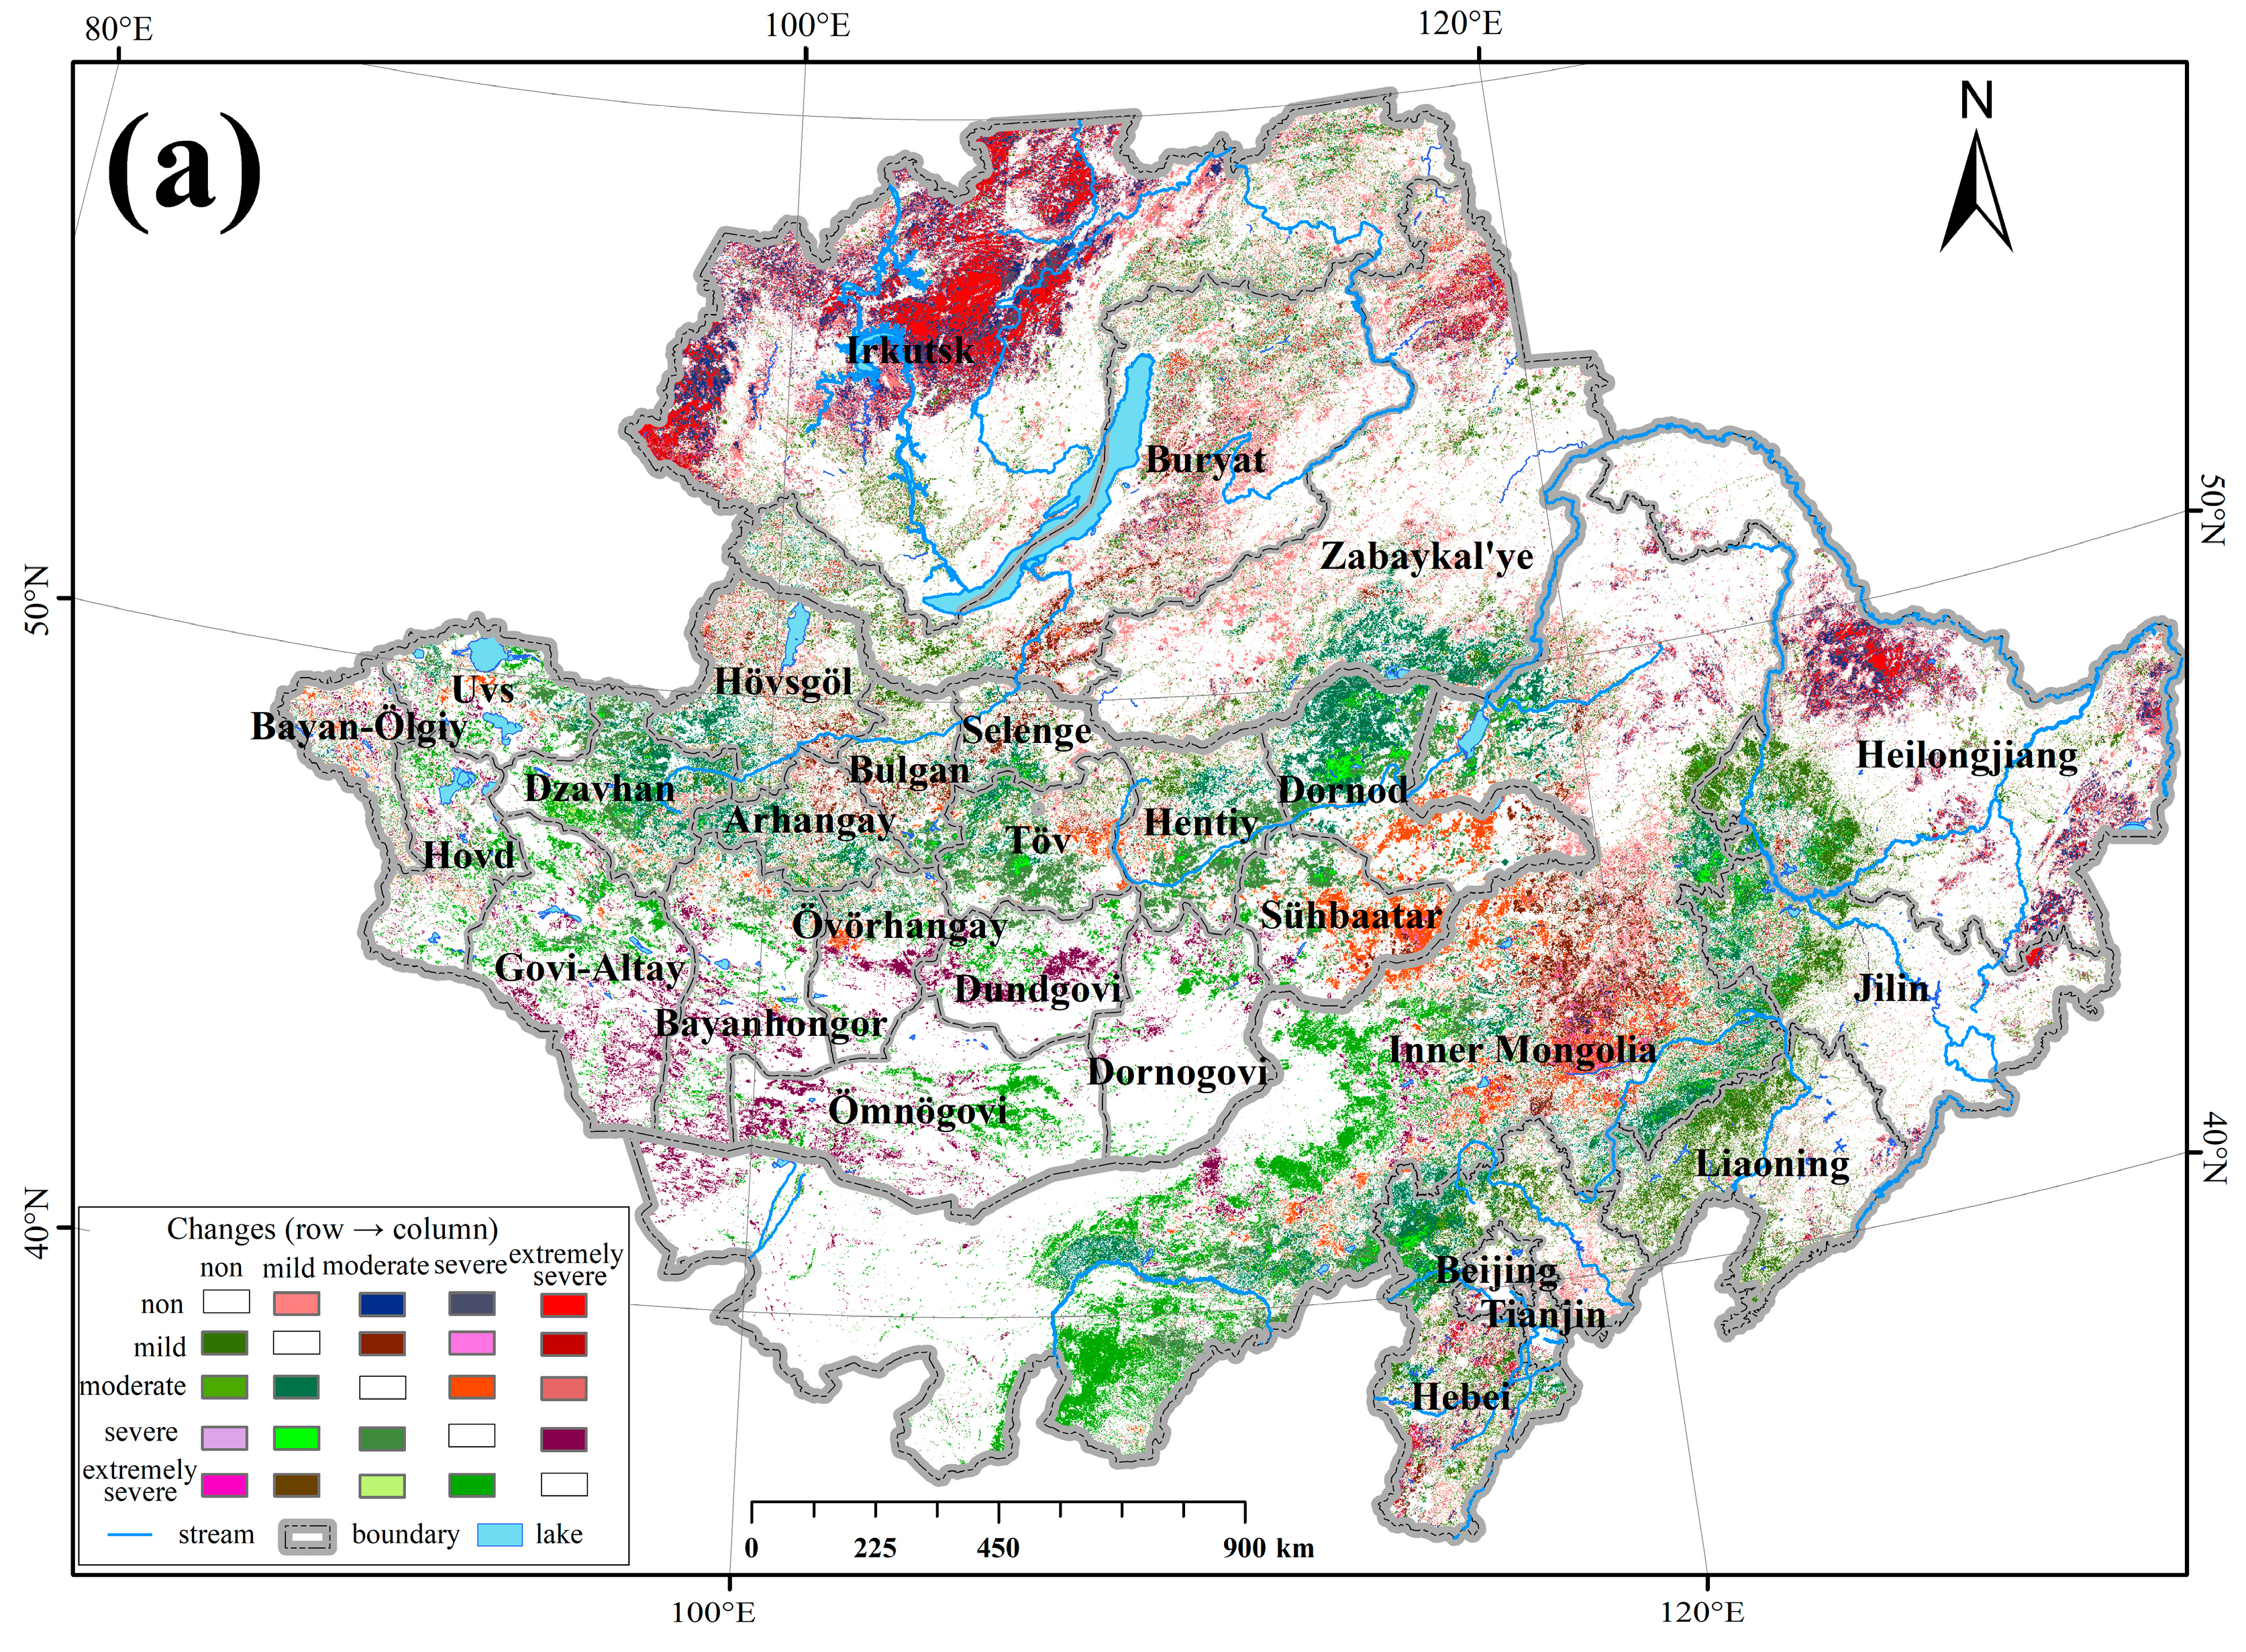
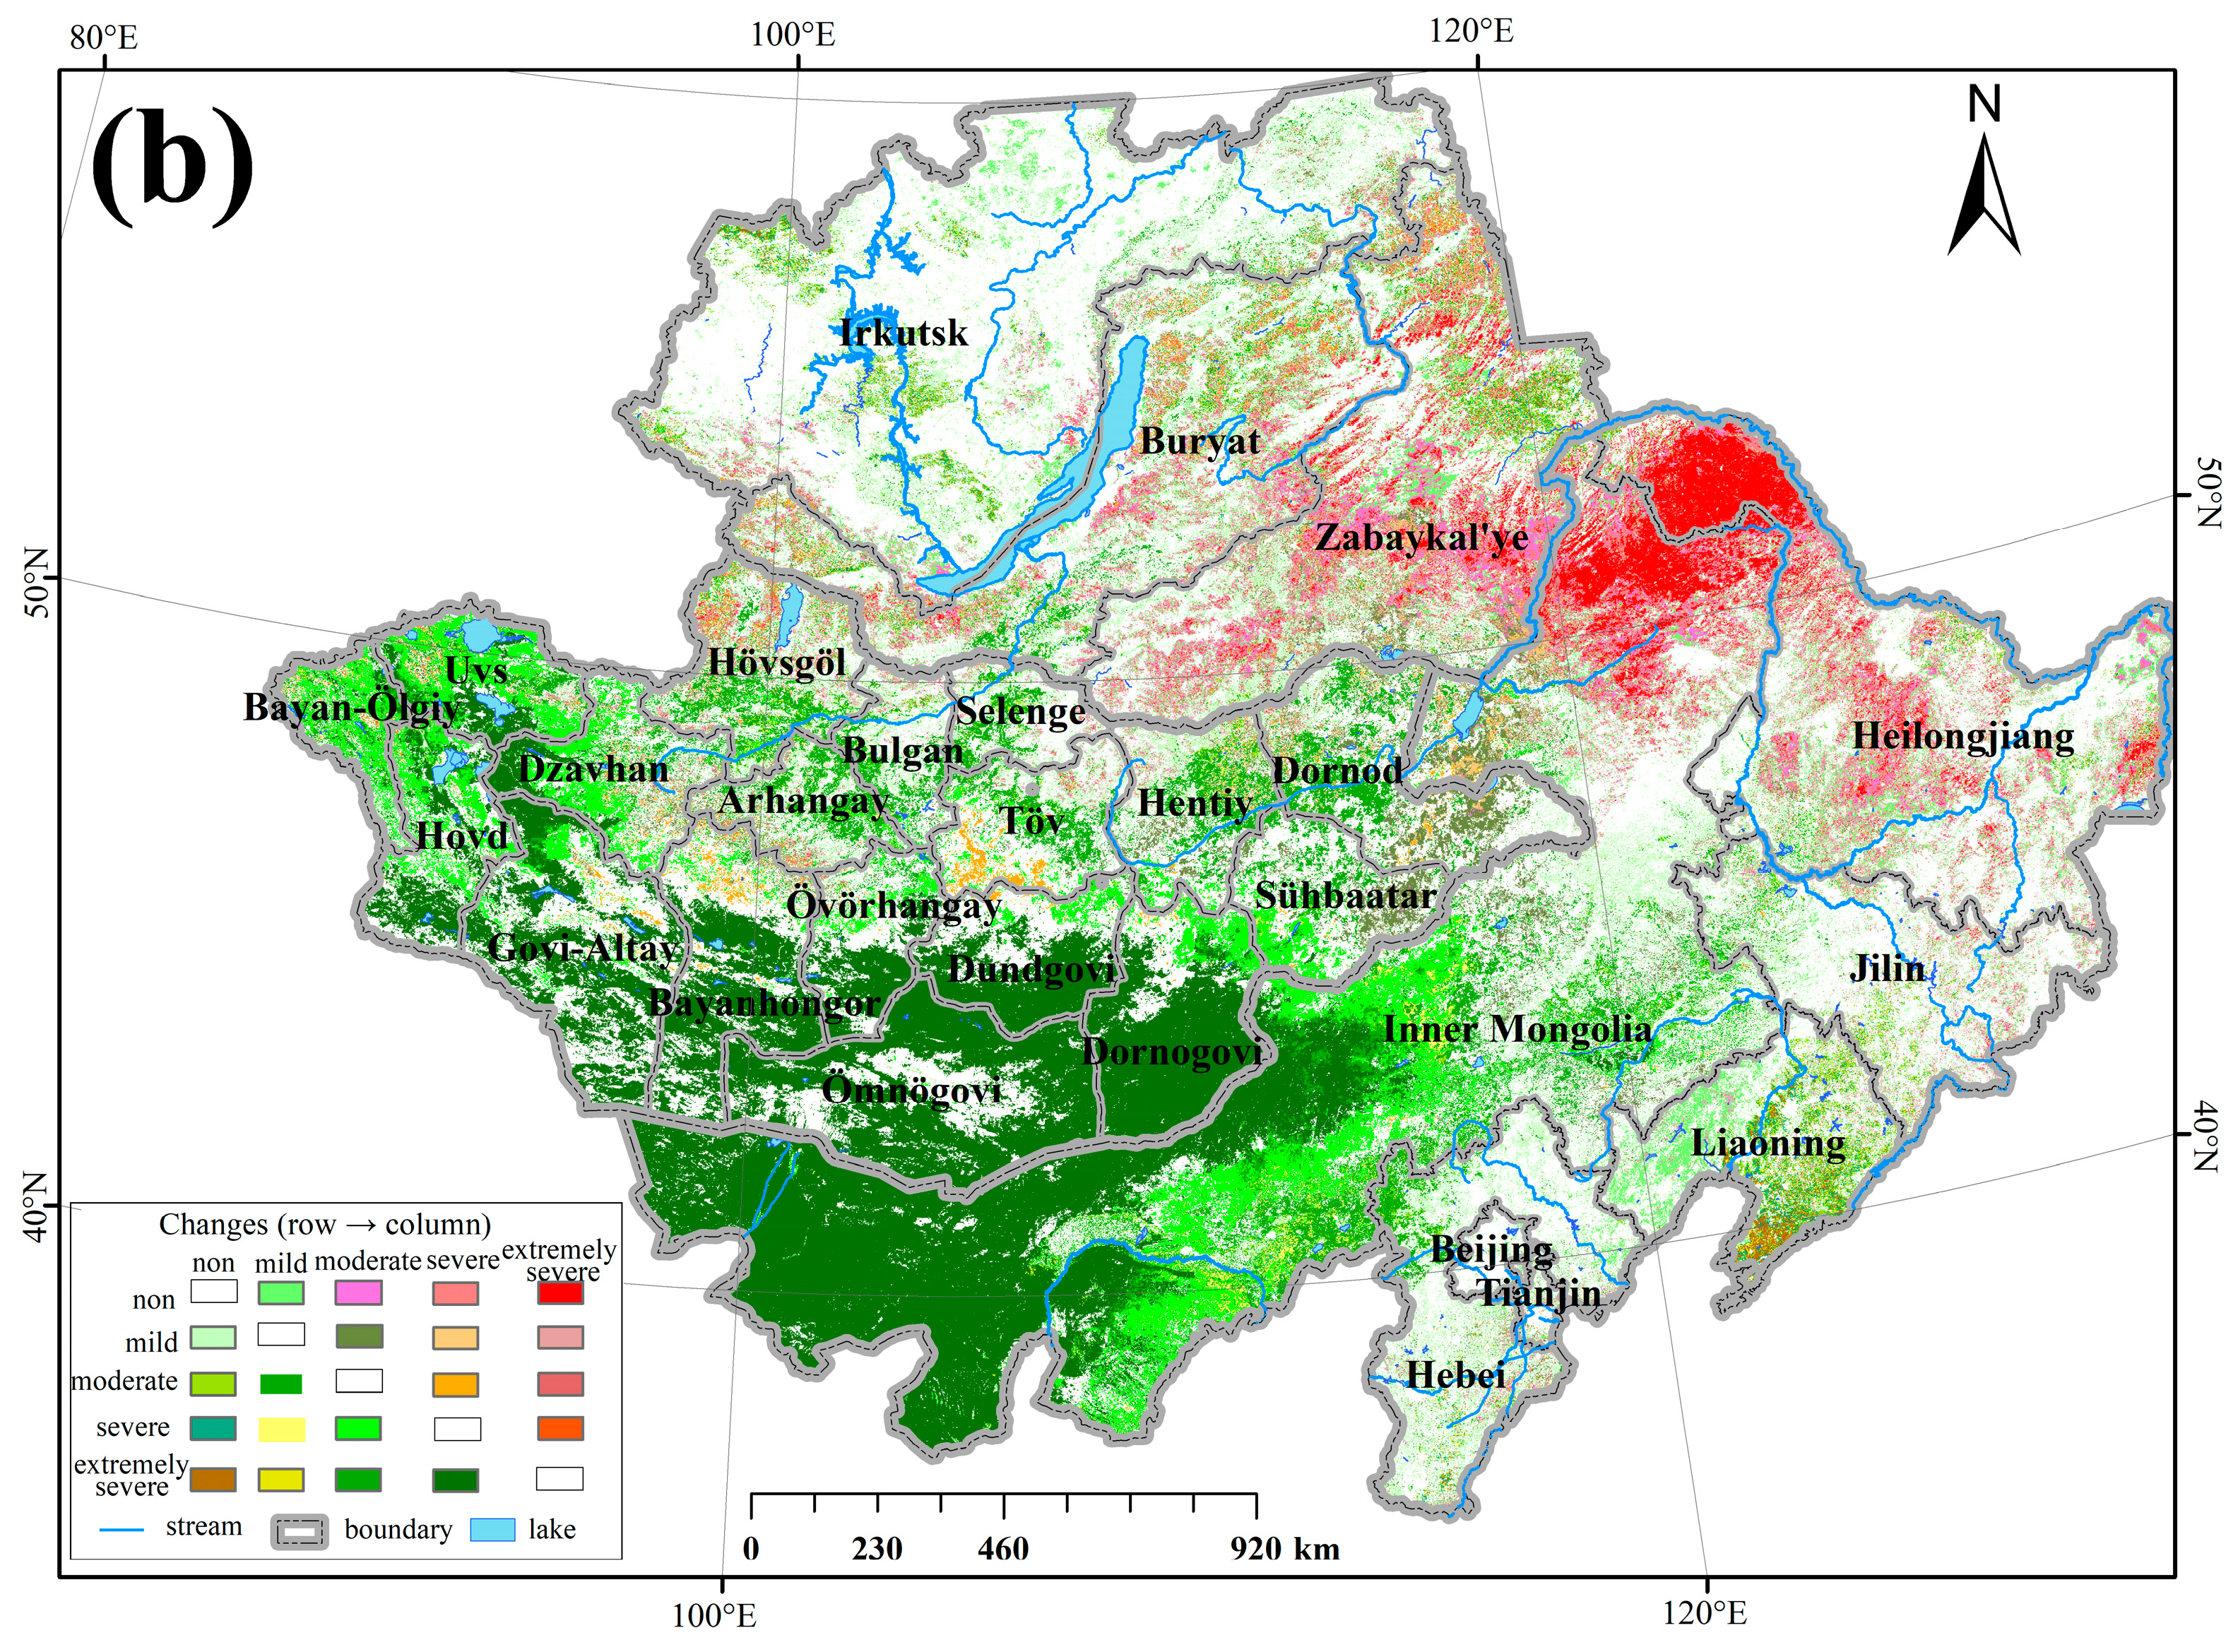
3.2.1. Spatial Distribution Pattern of Desertification in the China–Mongolia–Russia Economic Corridor

In order to analyze the spatial distribution characteristics of different degrees of desertification, the average desertification index during 2001–2020 was divided into five degrees based on the natural breakpoint method and field observed samples, namely the non-desertification area (<0.25), mild desertification area (0.25–0.53), moderate desertification area (0.53–0.84), severe desertification area (0.84–1.16), and extremely severe desertification area (>1.16) (Figure 10). Figure 11 shows that the area proportions of extremely severe and severe desertification zones were the smallest at approximately 13.9%. Among them, the zone of extremely severe desertification was mainly concentrated in the Inner Mongolia Plateau and Gobi Desert area, and the zone of severe desertification was mainly concentrated in the border area between the Inner Mongolia Plateau and Gobi Desert. The area proportion of the non-desertification area was the largest at approximately 37.9%, mainly concentrated in the Northeast China Plain, Greater Khingan Mountains, and Russia. Inner Mongolia and the Gobi Desert had the largest severe desertification areas, which spread outward, and the degree of desertification showed a decreasing trend.

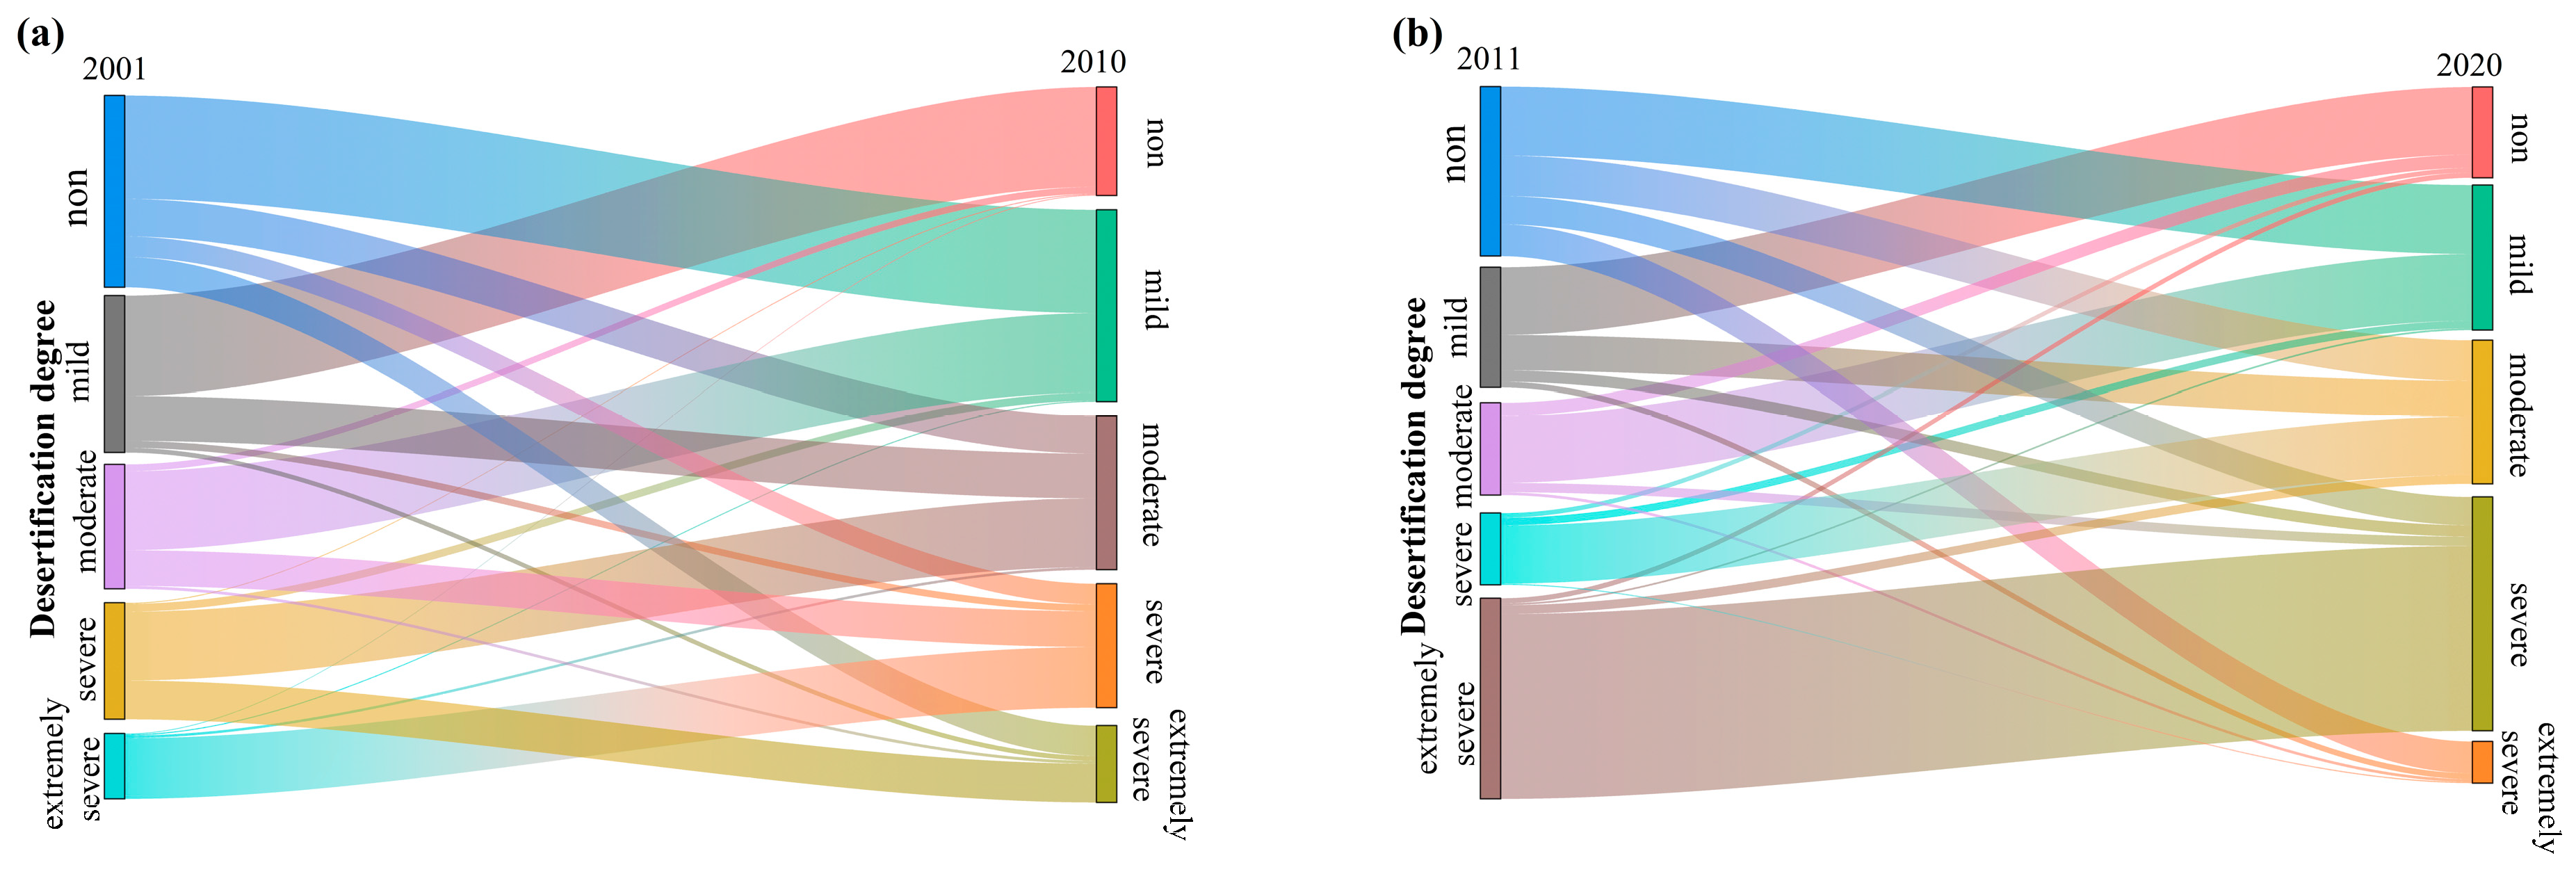
3.2.2. Temporal Variation in Desertification in the CMREC during 2001–2020

As shown in Figure 12, desertification in Mongolia is the most pronounced, which may be attributed to the region’s topography and climate. In 2007, the maximum value was 0.93, while that of 2019 was the smallest of 0.73, showing an overall decreasing trend. The desertification index of China was the second largest. Overall, the change in desertification degree was relatively stable, with a maximum value of 0.63 in 2019 and a minimum value of 0.47 in 2012. Desertification levels in Russia fluctuated significantly, peaking at 0.37 in 2003 and reaching a low of 0.19 in 2019. Overall, the trend is relatively stable, with a slight increase from 2001 to 2020.

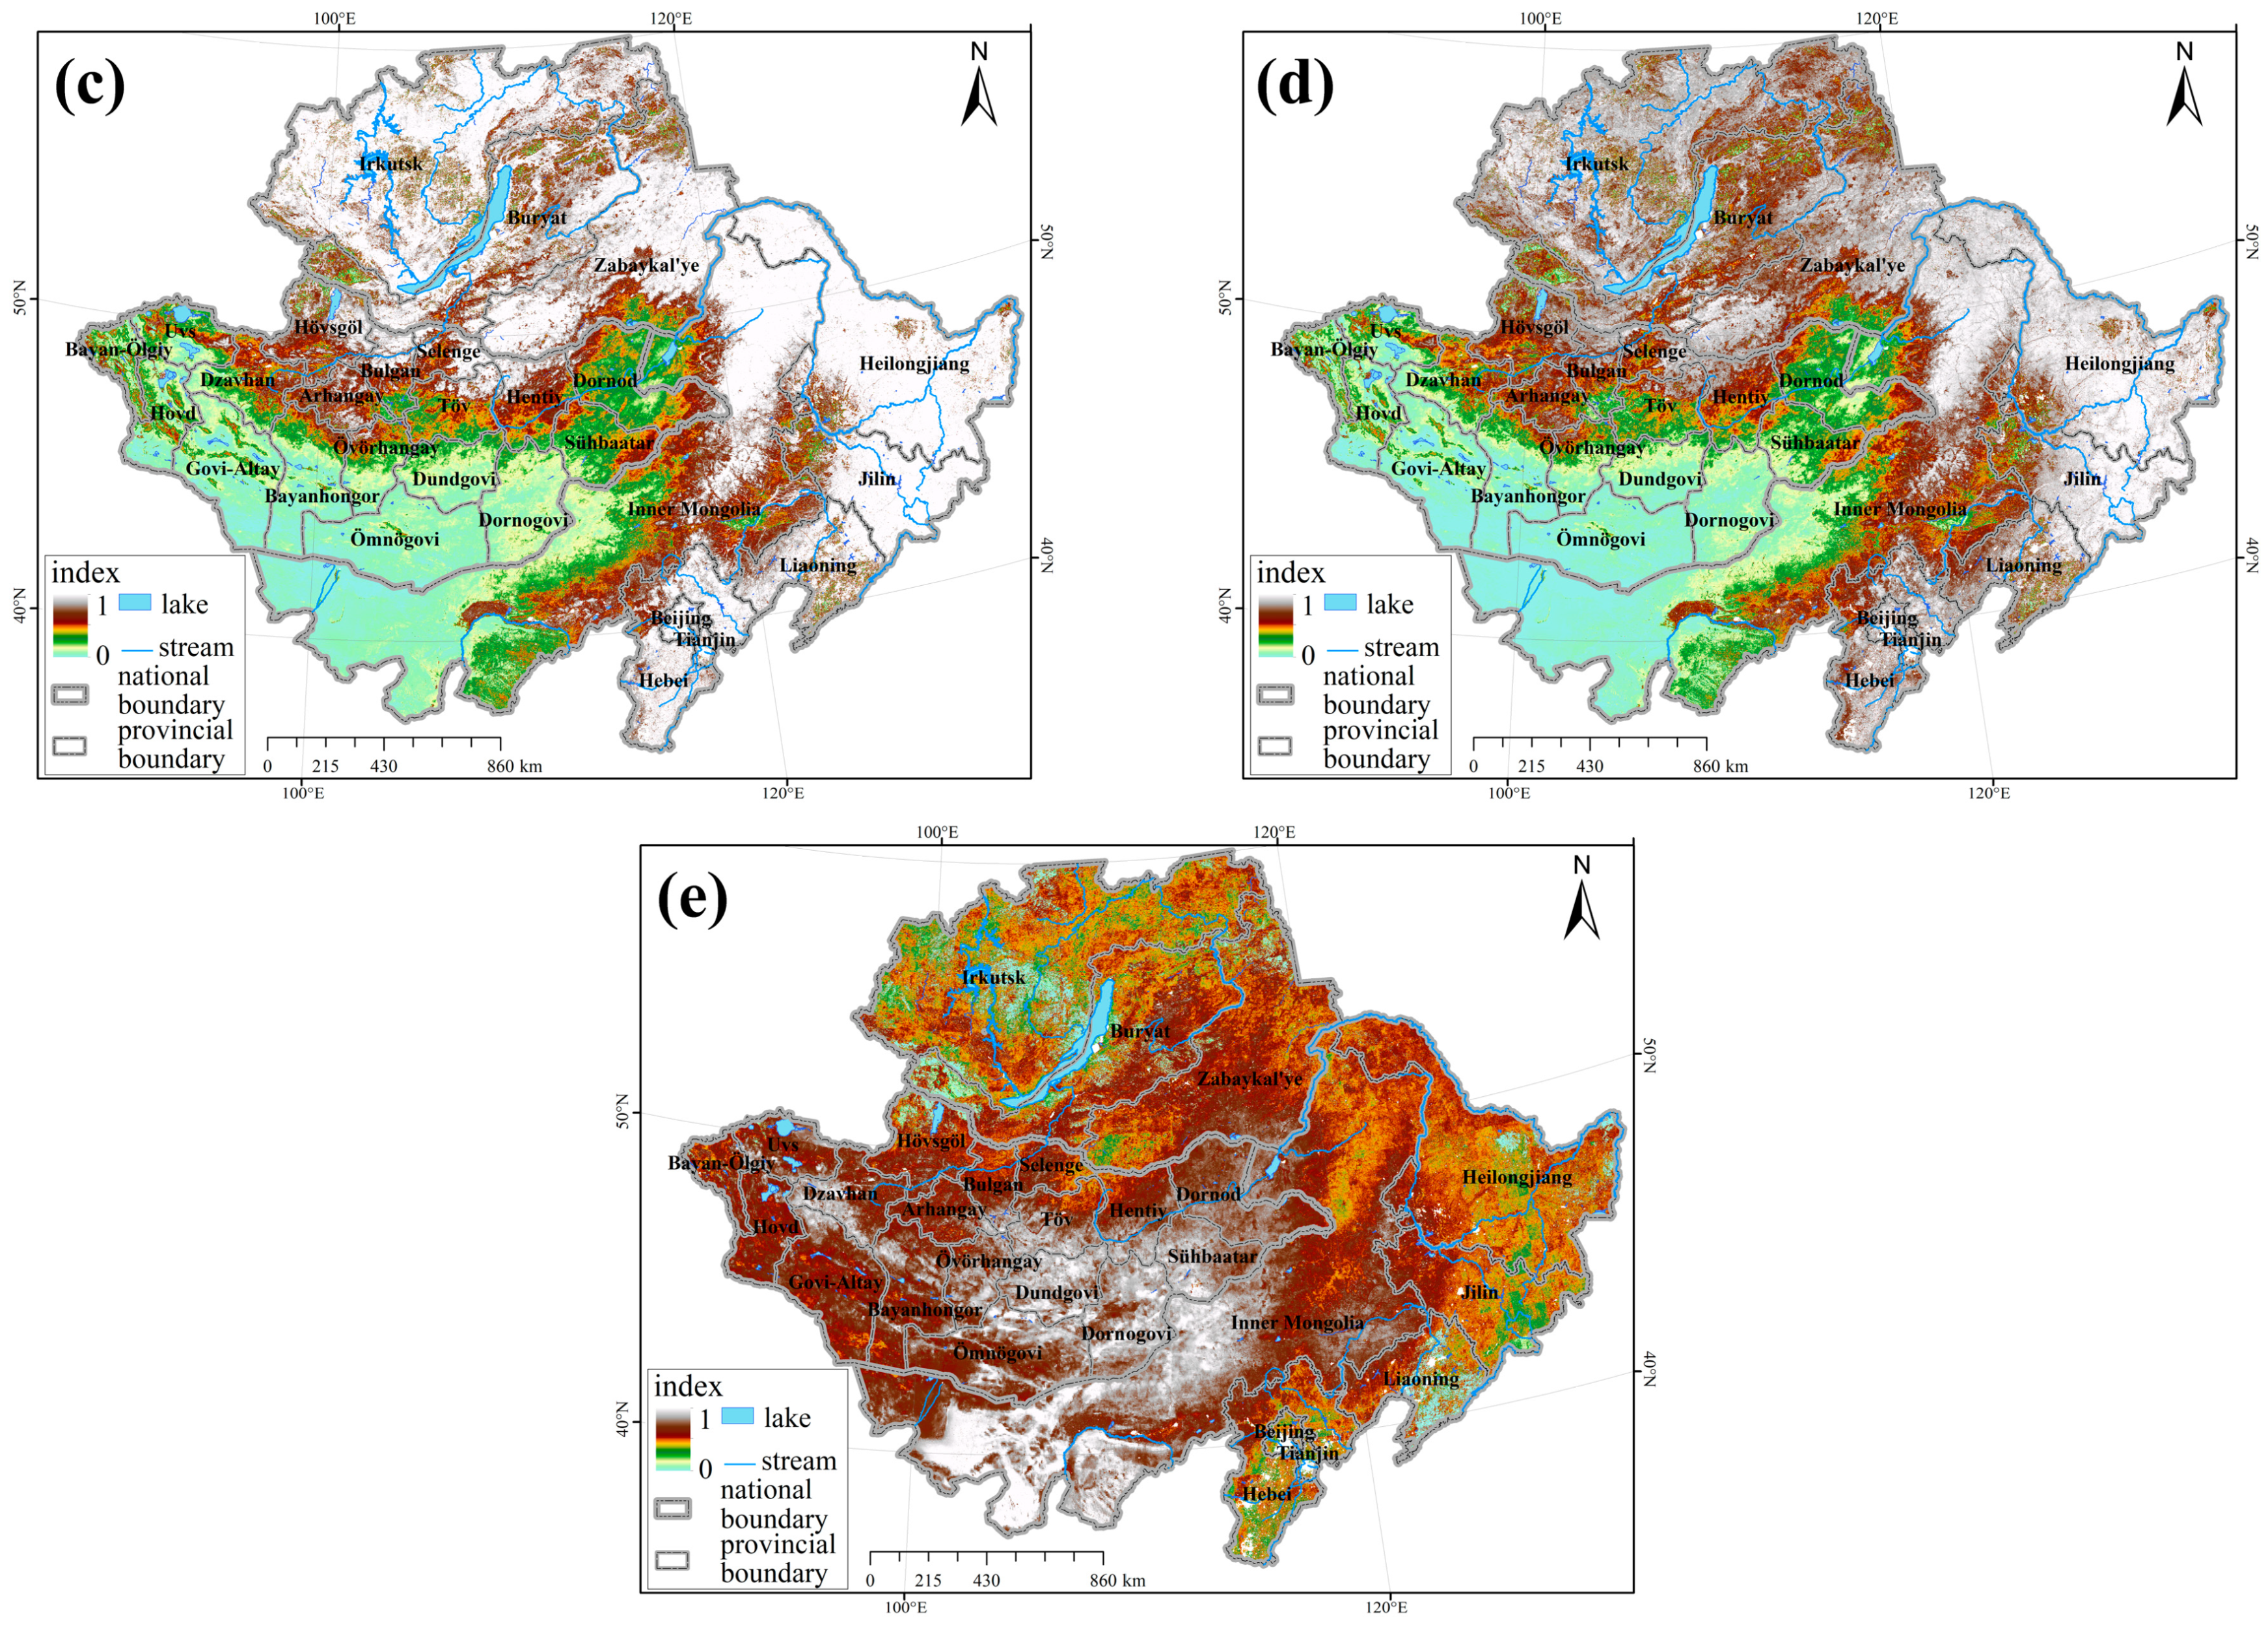
3.2.3. Variation in Gravity Center in Different Sub-Regions

The gravity center migration trajectory of desertification at a 4-year time scale in different regions was further explored (Figure 13).
As shown in Figure 13a, the desertification gravity center in China exhibited a trend of southeast–southwest–northeast change from 2001 to 2020. During 2013–2016 and 2017–2020, the migration distance to the northeast was the farthest, 148.354 km. This indicates that the change in the degree of desertification in the northeast during 2017–2020 was significantly more severe compared to other times. On the whole, the gravity center of desertification in China showed a law of migration to the northeast, indicating that the exacerbating rate and degree of desertification in the northeast was higher than that of the southwest parts.
As Figure 13b shows, the desertification gravity center in Mongolia exhibited a trend of southwest–southeast–northeast–northwest between 2001 and 2020. The migration distance first increased and then decreased. The maximum migration distance to the southwest appeared between 2005–2008 and 2009–2012, which was 30.010 km, indicating that the degree of desertification in the southwest during 2009–2012 was more significant compared to that in other directions. The minimum gravity center migration distance was 4.684 km between 2001–2004 and 2005–2008, indicating that the degree of desertification in the southeast direction was slighter than that in other directions during 2005–2008. The gravity center of desertification in Mongolia mitigated toward the southwest, indicating that the exacerbation rate and degree of desertification in the southwest parts was higher than that of northeastern regions.
Figure 13c shows that the desertification gravity center in Russia had a strong regularity, exhibiting a trend of southeast migration from 2009 to 2020. The overall analysis showed a northeast–northwest–southeast change trend from 2001 to 2020. The migration distance first increased, then increased, and then decreased. Among them, the maximum migration distance to the southeast was 65.833 km from 2009–2012 to 2013–2016, indicating that the desertification degree in the southeast direction from 2013 to 2016 was much greater than that in other directions. From 2005–2008 to 2009–2012, the gravity center migration distance was the smallest, which was 12.644 km, indicating that the degree of desertification in the southeast direction during 2009–2012 was much smaller than that in other directions. The desertification gravity center in Russia mitigated toward the southeast, indicating that the exacerbating rate and desertification degree in the southeast parts was higher than that of the northwest parts.

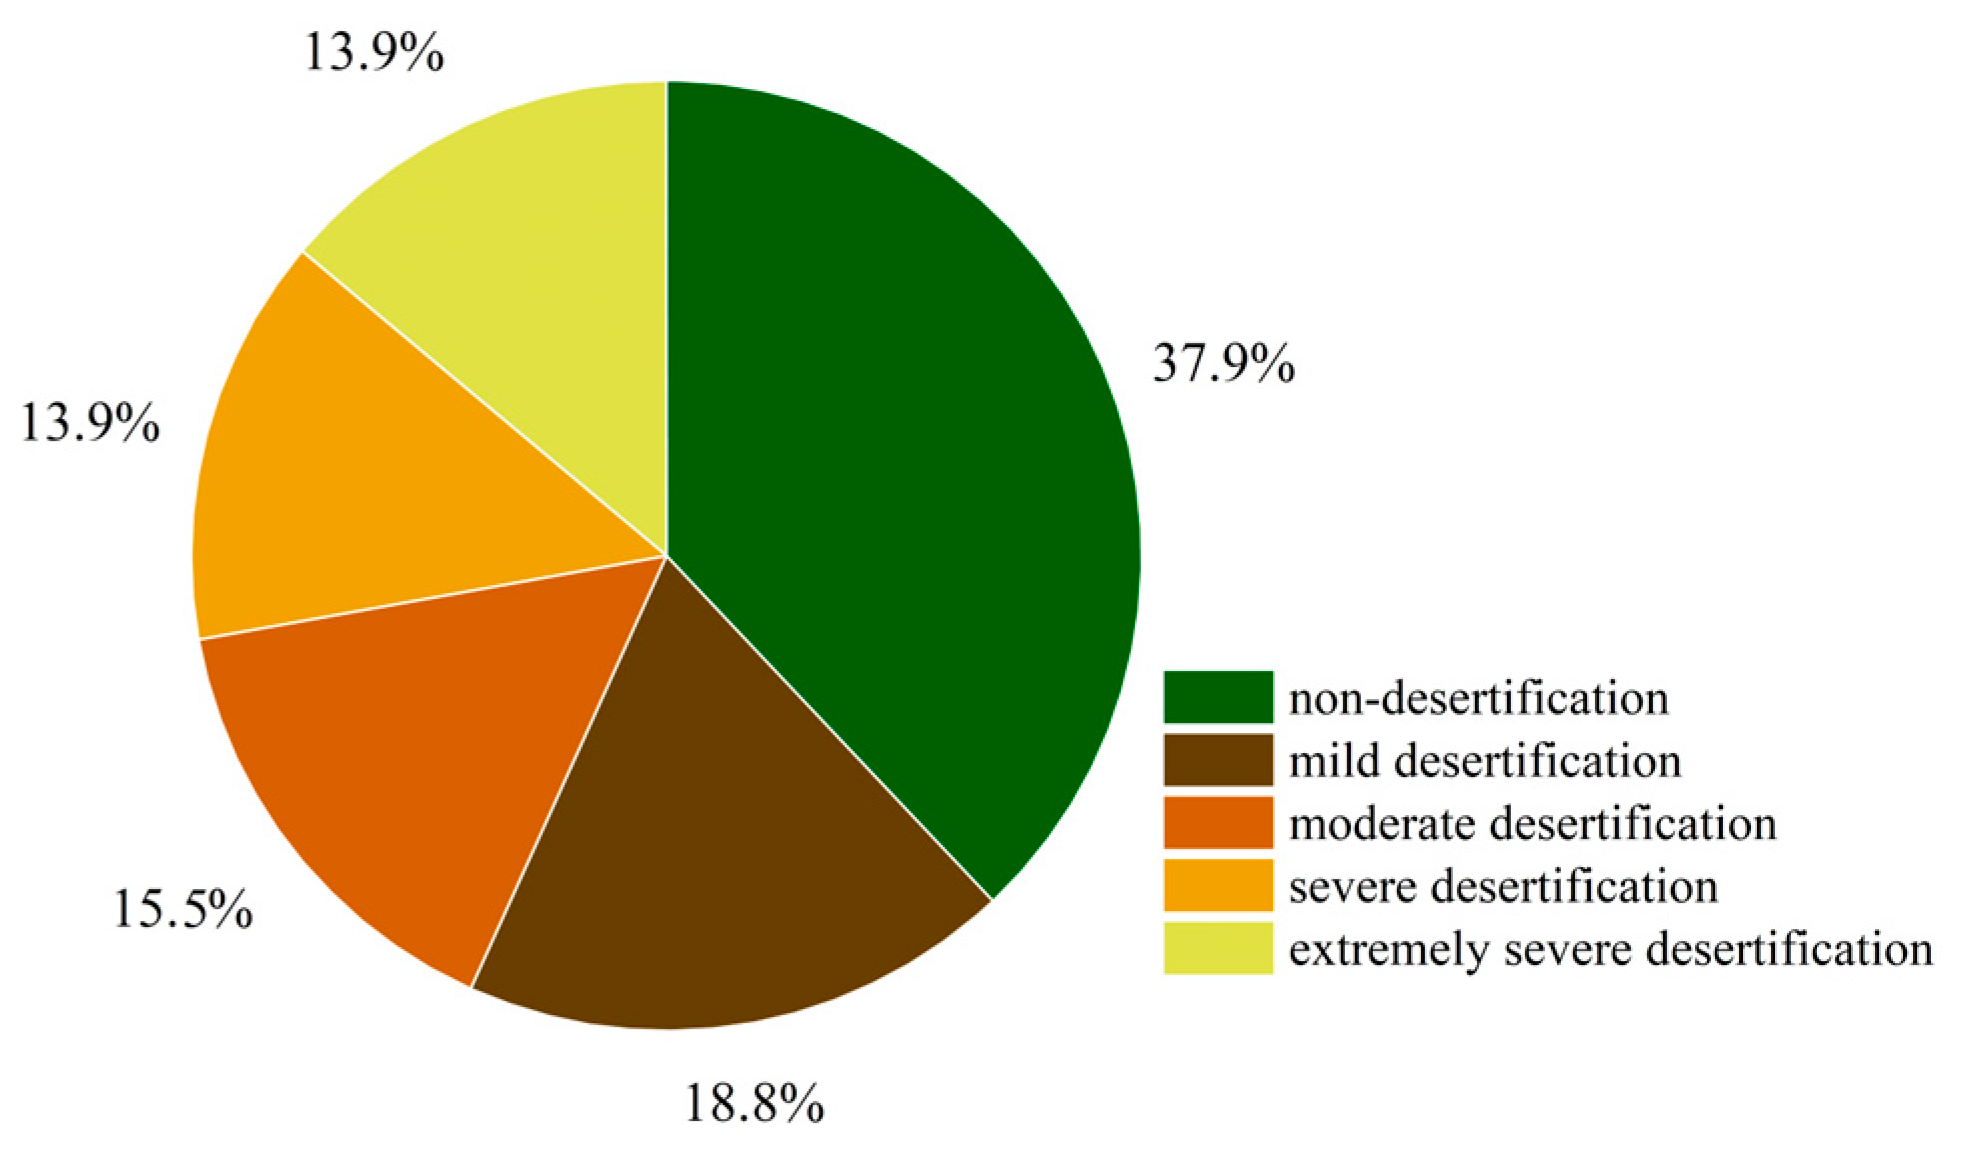
3.2.4. Area Change among Different Degrees of Desertification during 2001–2020

To analyze the changes in desertification degree during different time periods, the study period was divided into two historical periods, namely 2001–2010 and 2011–2020, respectively, and the area changes in different periods were statistically analyzed using a Sankey diagram, as shown in Figure 14 and Figure 15.
Figure 14a and Figure 15a show that during 2001–2010, the transfer zone from non-desertification to mild desertification accounted for the area’s largest proportion, approximately 15.79%, which was scattered in the Mongolian Plateau, Gobi Desert, northwest of Irkutsk Oblast, the central region of the Buryat, and the northeast of Heilongjiang Province. The transfer zone from mild desertification to non-desertification had the second largest area proportion of 15.26%, mainly concentrated in the Greater Khingan Mountains, Mongolia, Russia, and other regions. The transfer zone from non-desertification to extremely severe desertification, with an area proportion of 4.63%, was mainly distributed in the northeastern part of Irkutsk. The area of intensified desertification accounted for 49.76%, while that of improved desertification accounted for 50.24%, indicating that the desertification in China, Mongolia, and Russia was slightly improved from 2000 to 2010.
As shown in Figure 14b and Figure 15b, from 2011 to 2020, the transfer zone from extremely severe desertification to severe desertification accounted for the largest area proportion of approximately 28.25%, which was mostly located in the northeast of Inner Mongolia and the Gobi Desert of Mongolia. The transfer zone from non-desertification to mild desertification had the second largest area proportion of approximately 10.54%, which was mostly located in the Northeast Plain, southern Russia, and northern Mongolia. The transfer zone from severe desertification to moderate desertification accounted for approximately 8.9%, mainly located in the border area of the Inner Mongolia Plateau and the Gobi Desert. Overall analysis shows that areas with increased desertification account for 35.98%, while areas with reduced desertification make up 64.02%. This indicates notable improvement in desertification levels in the China–Mongolia–Russia region from 2011 to 2020.

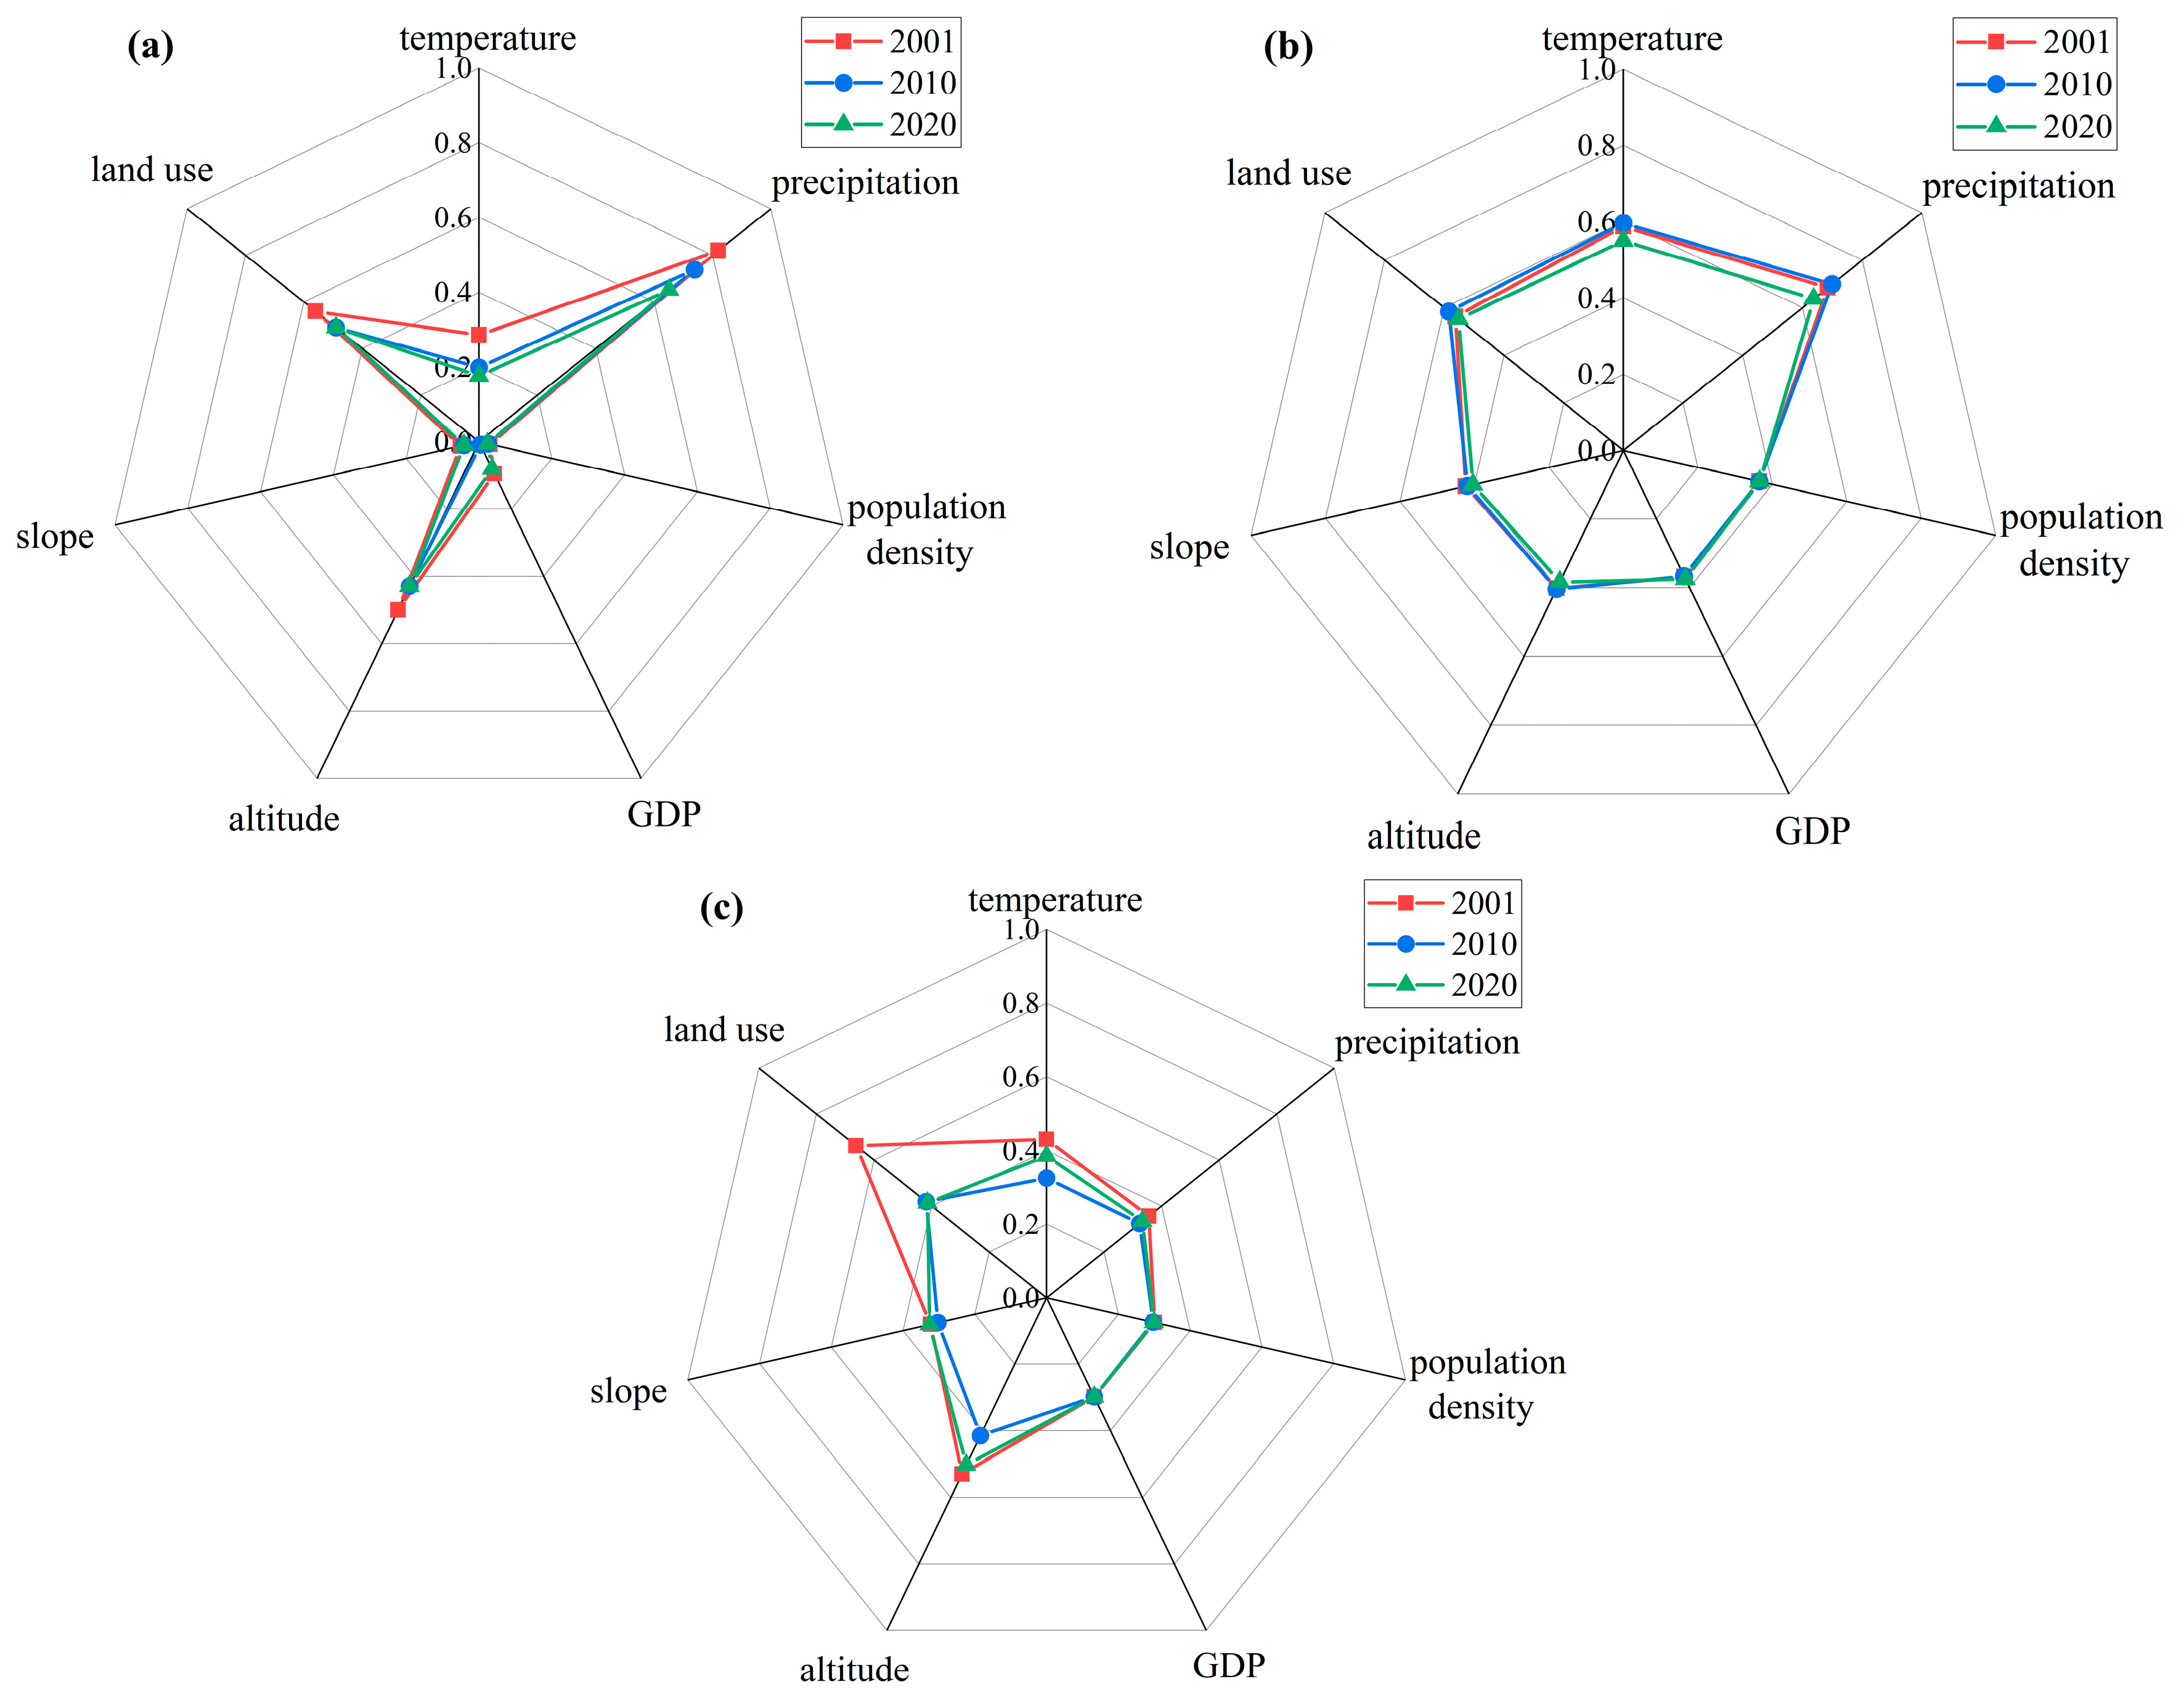
3.3. Dominant Influencing Factors of Desertification in Different Historical Periods

3.3.1. Single Factor

In different regions and different historical periods, there are some differences in the factors affecting desertification, which could be effectively distinguished using a geodetector. In this study, seven factors, including climate factors (temperature and precipitation), social factors (population density, GDP, and land use change), and terrain factors (altitude and slope), were selected to analyze the driving mechanism of desertification (Figure 16).
Figure 16a showed that in 2001, 2010, and 2020, precipitation was the dominant factor affecting desertification in China, with q values of 0.82, 0.74, and 0.65, respectively, indicating that precipitation had the strongest impact on desertification in China, followed by land use, with q values of 0.56, 0.49 and 0.49, respectively. The weakest impacts on desertification were GDP and population density, with q values of 0.03, 0.008, and 0.02, respectively.
Figure 16b shows that in 2001, 2010, and 2020, the dominant factor affecting desertification in Mongolia was precipitation, with q values of 0.68, 0.69, and 0.63, respectively, indicating that precipitation had the greatest impact on desertification in Mongolia, followed by temperature, with q values of 0.58, 0.59, and 0.55, respectively, indicating that during 2001–2010, temperature had a greater impact on desertification in Mongolia. In 2020, land use had the greatest impact on desertification in Mongolia. The factor with the weakest impact on desertification was population density, and its q value was 0.36, indicating that human activities had the weakest impact on desertification in Mongolia.
As shown in Figure 16c, in 2001, 2010, and 2020, the factors with the strongest impact on desertification in Russia were land use, land use, and altitude, and the q values were 0.66, 0.42, and 0.50, respectively, indicating that, during 2001–2010, the transformation between different land types has the greatest impact on desertification. In 2020, the terrain had the strongest impact on desertification, followed by altitude, altitude, and land use, with q values of 0.53, 0.41, and 0.41, respectively, indicating that during the period from 2001 to 2020, the terrain had the greatest impact on desertification in Russia, and land use had the greatest impact on desertification in 2020. The factors with the weakest impact on desertification are GDP, population density, and GDP, and the q values are 0.30, 0.29, and 0.29, respectively, indicating that human activities have the weakest impact on desertification in Russia.

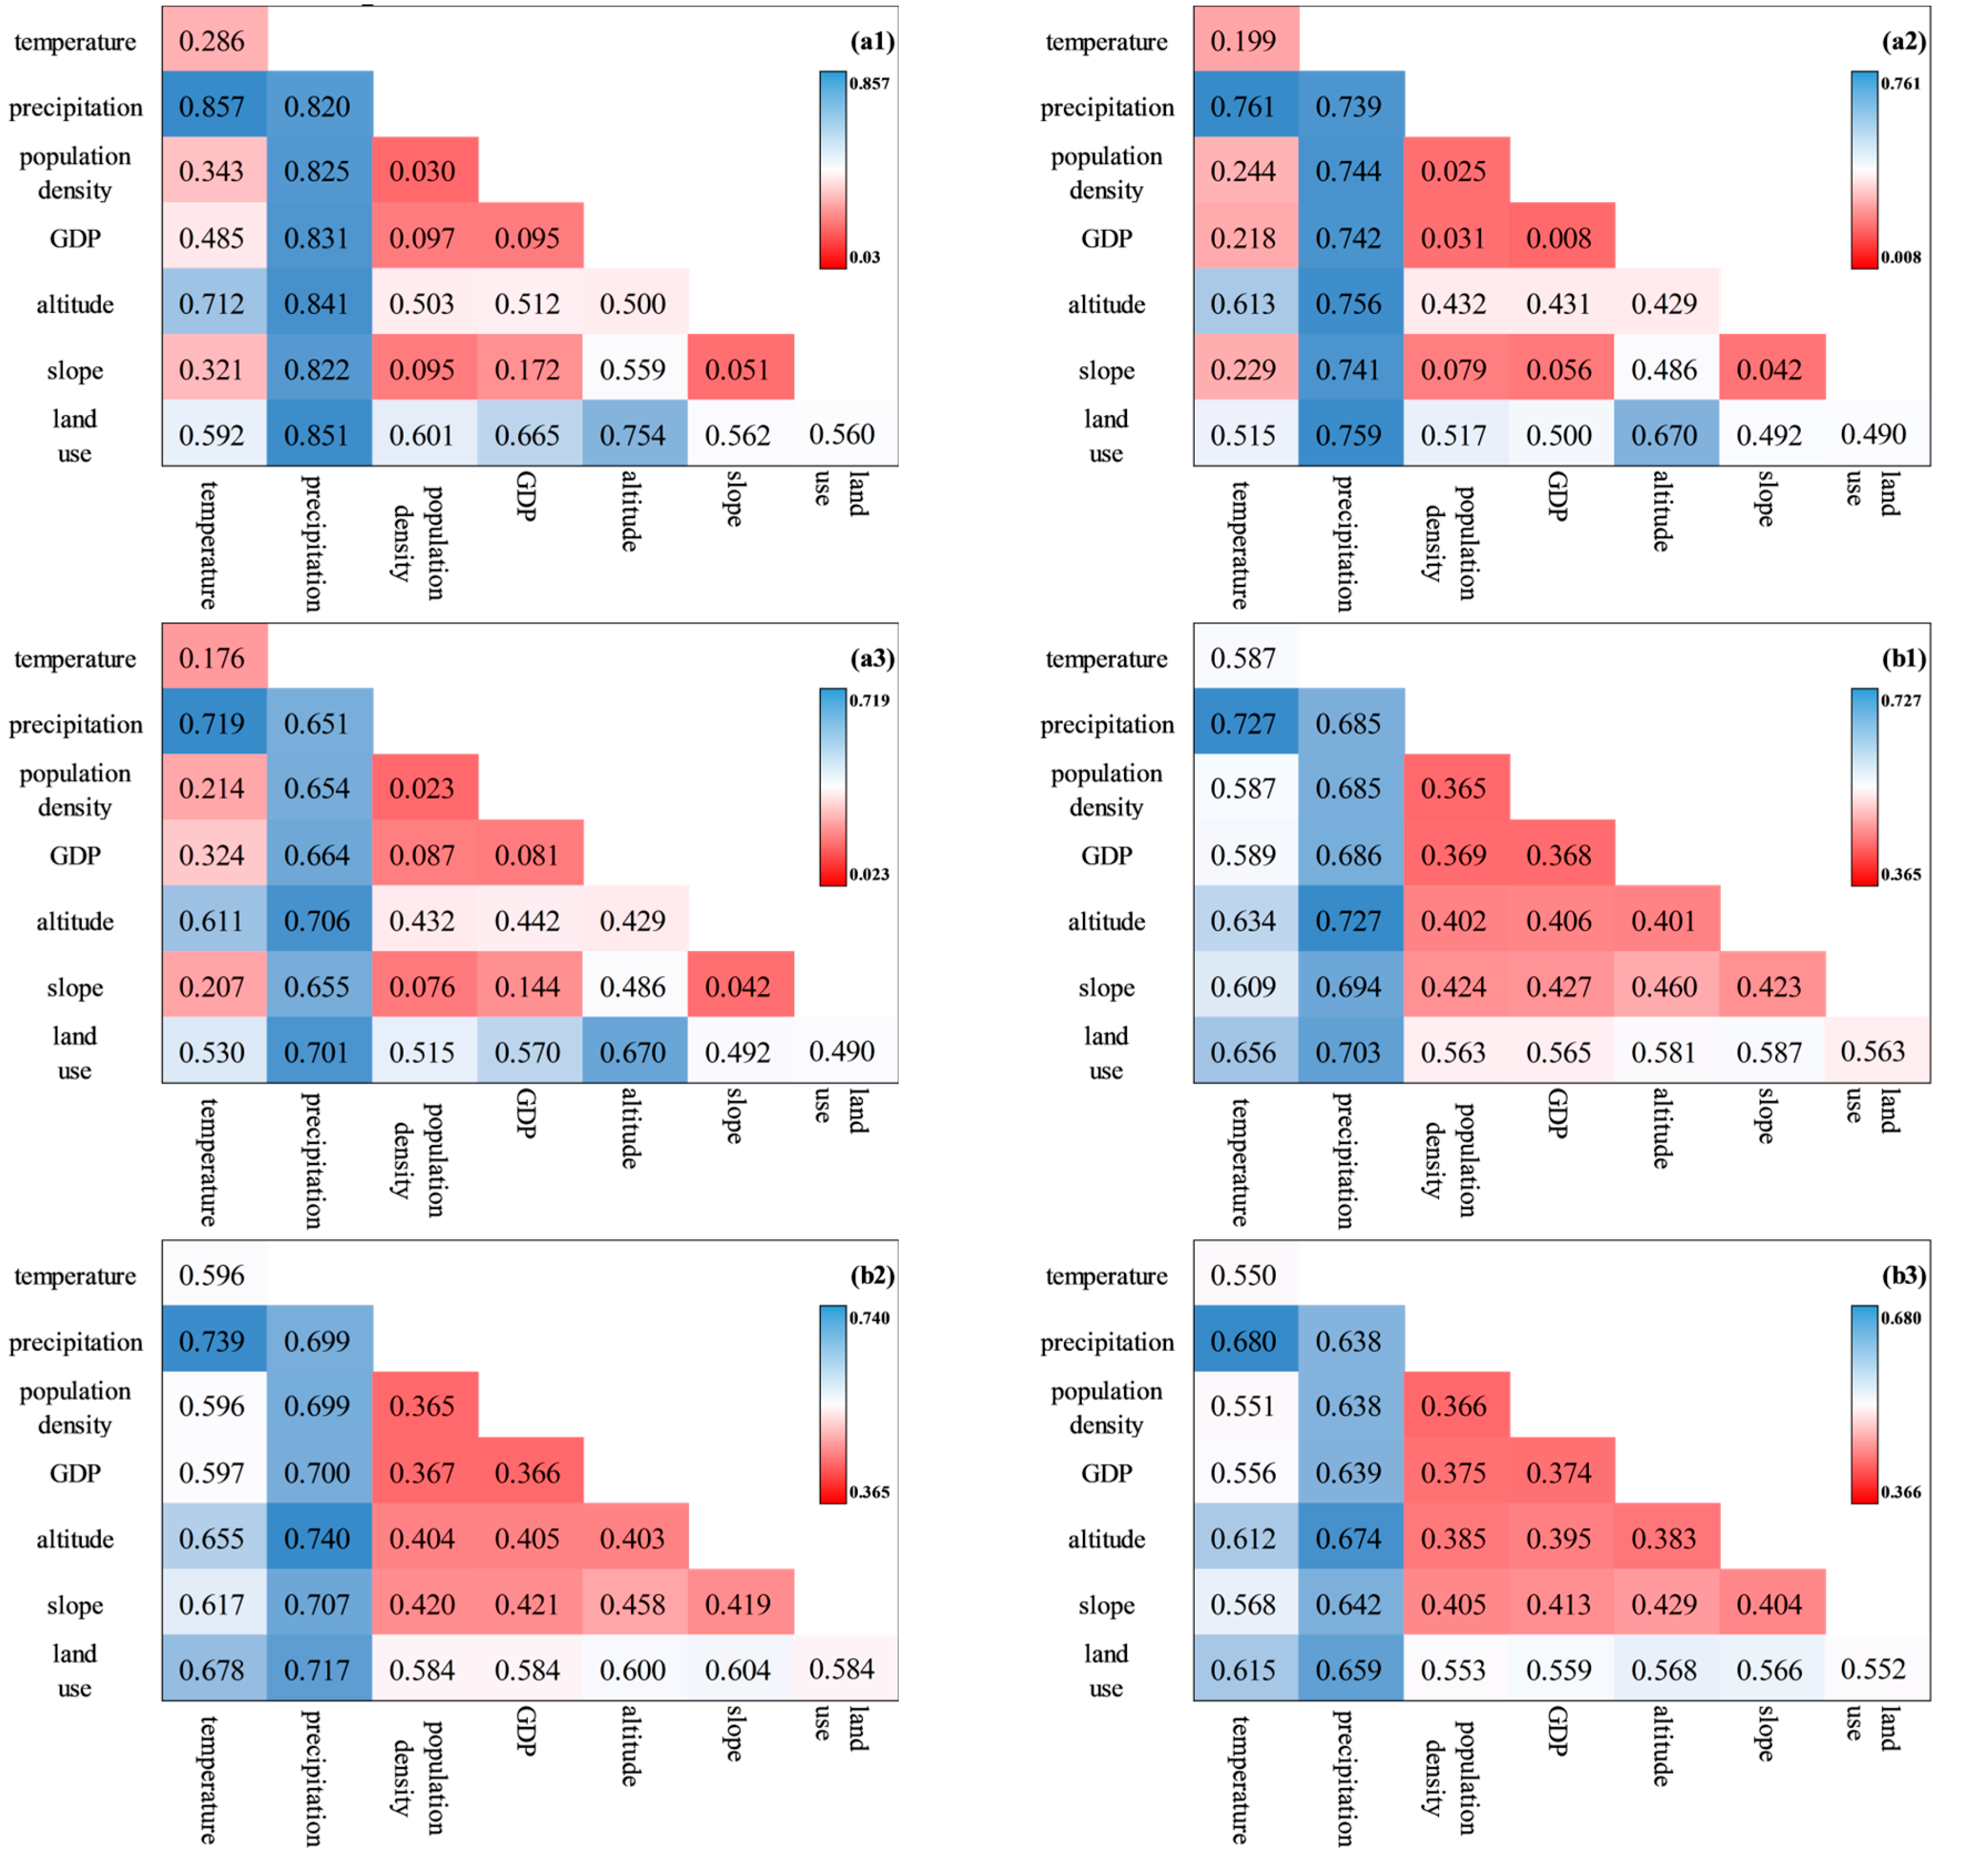
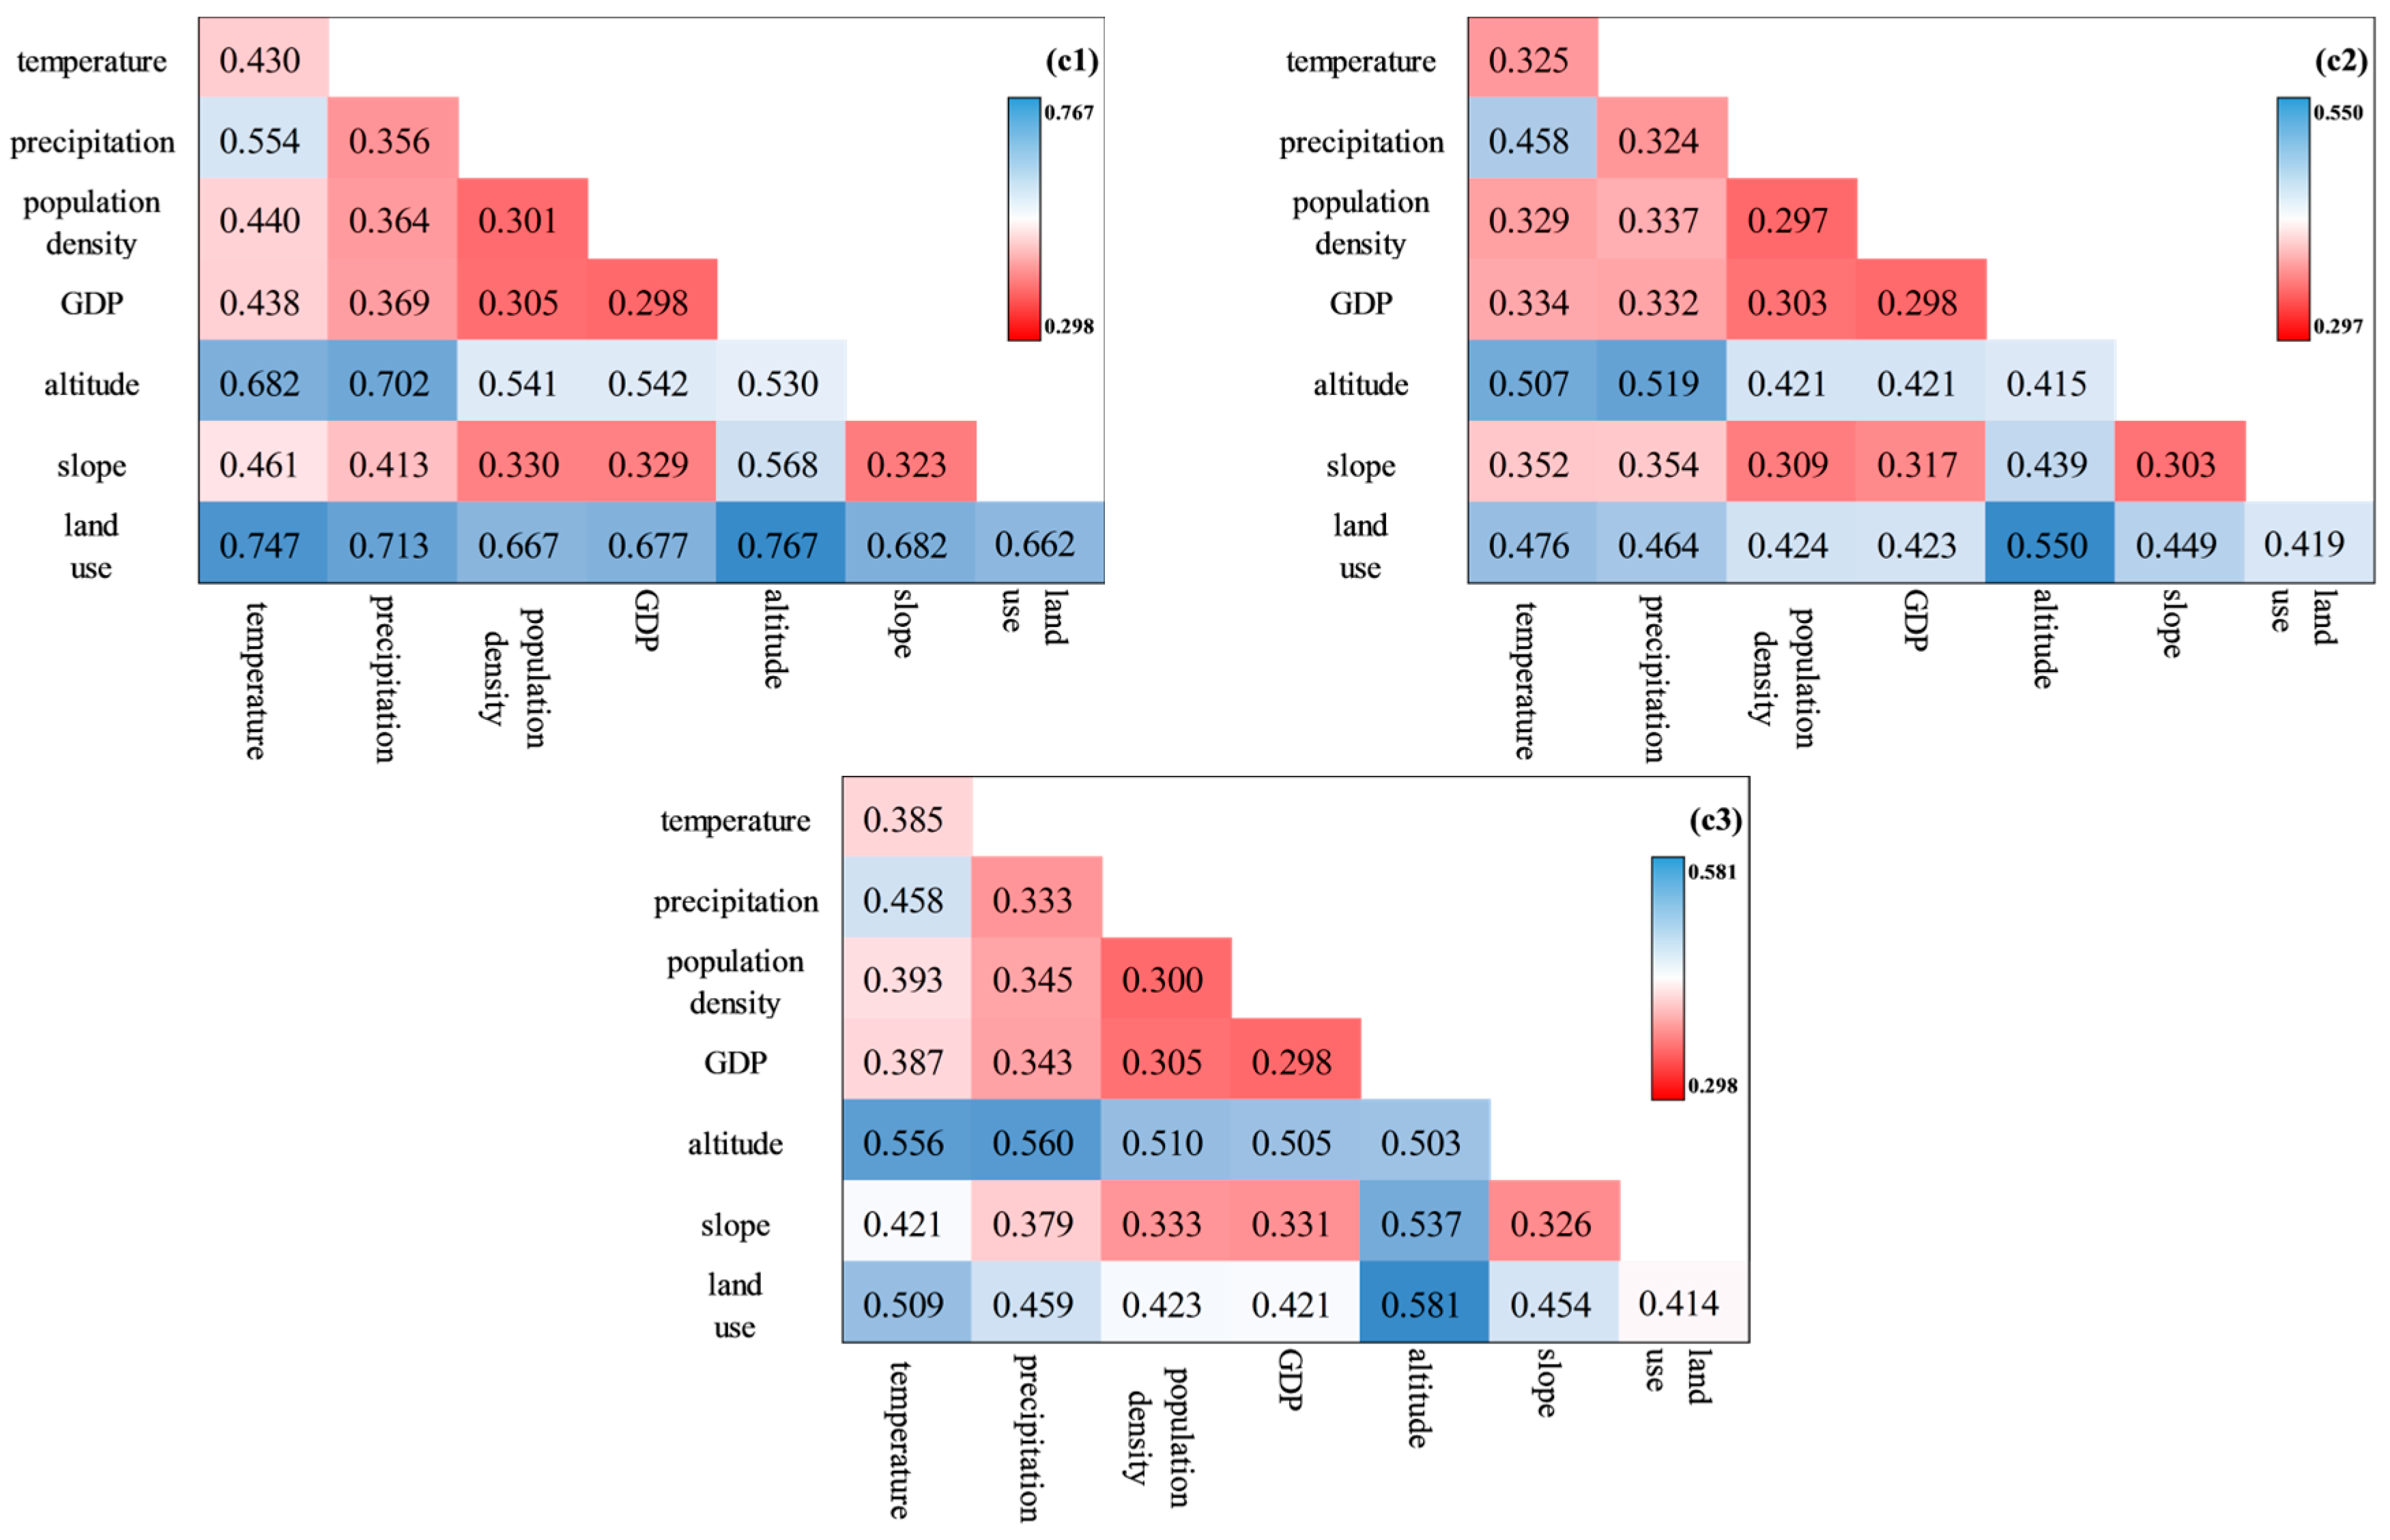
3.3.2. Interactive Factors

The interaction among different factors also affects changes in desertification levels. During different historical periods and in various regions, there is a certain degree of interaction among influencing factors. By using geographic detectors to explore interaction factor q values, it is found that a higher q value indicates stronger interaction among driving factors, whereas a lower q value indicates weaker interaction.
Figure 17a1–a3 showed that the interaction between most of the two factors in China was two-factor enhancement. In 2001, 2010, and 2020, the dominant interactive factor was precipitation ∩ temperature, with q values of 0.857, 0.761, and 0.719, respectively, indicating that the interactions between temperature and precipitation had the greatest impacts on desertification in China.
Figure 17b1–b3 shows that the interaction between most factors in Mongolia was characterized by two-factor enhancement. In 2001 and 2010, the dominant interactive factor was precipitation ∩ altitude, while that of 2020 was temperature ∩ precipitation, with the q values of 0.727, 0.740, and 0.680, respectively, indicating that the interactions between climate and topography had the greatest impact on desertification in Mongolia.
As shown in Figure 17c1–c3, the interaction between most of the two factors in the Russian region was nonlinearly enhanced. The dominant interactive factor in 2001, 2010, and 2020 was altitude ∩ land use, and the q values were 0.767, 0.550, and 0.581, respectively, indicating that the interaction between altitude and land use has the greatest impact on desertification in Russia.

4. Discussion

4.1. Causes of Temporal and Spatial Variation Pattern of Desertification in the CMREC

The distribution of desertification severity in the China–Mongolia–Russia Economic Corridor shows a certain regularity, with desertification decreasing outward from the Inner Mongolia Plateau and Gobi Desert (Figure 10). Severe desertification is mainly found in the Inner Mongolia Plateau and Gobi Desert regions, likely due to intensive grazing, deforestation, and soil erosion [16]. The influence of the Loess Plateau in the south also contributes to the formation of severe desertification areas [17]. The Gobi Desert has an extreme continental climate. Due to the combined actions of the sun and wind, loose rock masses such as surface sandstone were continuously weathered and eroded to form clastic materials, which accumulated over time [18]. Due to the influence of topography, the region has difficulty receiving water vapor from the Arctic Ocean and Pacific Ocean, resulting in fragile and arid zones [19]. The mild desertification areas and non-desertification areas were mainly distributed in the northeast of China and the northern part of Russia. Northeast China had a temperate monsoon climate, which was affected by the warm and humid airflow of the Pacific Ocean. The vegetation in the Greater Khingan Mountains was dense, and the Russian region was sparsely populated. Human activities had minimal impact on vegetation and were located in the desert zone, resulting in a lower degree of desertification in the corresponding area [20].
During 2001–2020, the degree of desertification in the Inner Mongolia Plateau and Gobi Desert showed a significant improvement trend, which may be related to the local implementation of the policy of returning farmland to forests and grasslands and reducing human overgrazing [21]. In 2022, Xinhua News Agency released relevant news that Inner Mongolia adopted the governance strategy of ‘easy first and then difficult, from near too far, zoning governance, and overall promotion’, realizing the historical transformation of ecological security in the Inner Mongolia Autonomous Region [22]. In the northeastern part of the Greater Khingan Mountains and the northwestern part of the Lesser Khingan Mountains, the degree of desertification had deteriorated significantly. The local area had a good degree of desertification in the early stage, and the vegetation coverage was dense. The gradual deterioration of desertification may be related to the weak awareness of local human desertification and the random cutting of vegetation [23]. At the same time, with the improvement of living standards, urbanization has become increasingly prominent, leading to greater land demand and further aggravating desertification [24].
In this study, the analysis did not incorporate land use distribution and vegetation cover types. Future research could further explore the specific impact of the spatial distribution of vegetation change on desertification [25]. Based on the results, it is evident that the northeastern part of the study area has been more sensitive in recent years, with significant fluctuations in desertification expansion and reduction. Inadequate prevention and control measures may exacerbate desertification in northeastern regions such as Heilongjiang. The southwestern desertification trend is secondary; thus, it is crucial to focus on desertification in both northeastern and southwestern regions, implementing appropriate control measures [24]. With economic development, attention should be paid to vegetation restoration and protection, and land use should be planned rationally. Additionally, the government should strengthen protection efforts in sensitive areas to prevent uncontrolled desertification [26].

4.2. Causes of the Changes in the Dominant Driving Factors of Desertification in the CMREC

During different historical periods, the dominant factor affecting desertification in China and Mongolia was precipitation. The latitude of this region was high, and the Altai Mountains and Hangai Mountains in the north block water vapor from the Arctic Ocean. The Greater Khingan Mountains and Changbai Mountains in the east block water vapor from the Pacific Ocean, directly affecting the soil moisture content. Less moisture reduces soil viscosity, making the soil looser and resulting in higher desertification levels [27]. In China, the impacts of the urbanization level on desertification were significant. Reasonable urbanization could alleviate the desertification degree, such as the implementation of reasonable wind and sand fixation policies in cities [28]. Unreasonable urbanization, such as extensive land reclamation of wasteland and increased urbanization, may cause a certain degree of damage to the original land and aggravated desertification [29]. Another dominant factor affecting desertification in Mongolia was temperature. The increase in temperature causes soil moisture evaporation and, thus, a decrease in soil water content, leading to desertification [30]. However, the increase in temperature promotes the photosynthesis of vegetation and makes the plant grow better, thus weakening desertification [31]. The dominant influencing factor in Russia was land use, indicating that human activities became the dominant factor in the desertification process. Another factor affecting the desertification degree in Russia was altitude. The central Siberian Plateau has a higher elevation. The higher the altitude, the lower the temperature, and the low temperature limits the growth of vegetation, making the windbreak and sand-fixing ability weak, aggravating the desertification degree [32].

5. Conclusions

In this study, two categories of feature space models based on point–point mode and point–line mode were constructed using MODIS images. Utilizing the optimal feature space model, the desertification change patterns in the CMREC from 2001 to 2020 were explored, and then the dominant driving factors were quantitatively determined. The main conclusions are as follows:
(1)
The monitoring accuracy of the Albedo–MSAVI desertification model based on point–point mode was the highest, at 86.47%, followed by that of the TGSI–MSAVI model based on point–line mode, at 85.71%.
(2)
The China–Mongolia–Russia Economic Corridor extends from the Inner Mongolian Plateau and Gobi Desert outward. Desertification is most severe in Mongolia and least severe in Russia, showing significant spatial heterogeneity.
(3)
The gravity center of desertification in China migrated toward the northeast, while that of Mongolia and Russia migrated toward the southwest and southeast, respectively.
(4)
From 2001 to 2020, the degree of desertification in the CMREC showed an overall improvement trend.
(5)
Precipitation and land use have the greatest impact on desertification in China and Mongolia, and altitude and land use have the greatest impacts on desertification in Russia.

Author Contributions

Conceptualization, methodology, writing—original draft preparation, L.W. and B.G.; investigation, supervision, project administration, and funding acquisition, R.Z. All authors have read and agreed to the published version of the manuscript.

Funding

This research was funded by the National Natural Science Foundation of China (grant numbers: 42471329, 42101306, 42301102), Scientific Innovation Project for Young Scientists in Shandong Provincial Universities (grant number: 2022KJ224), the Natural Science Foundation of Shandong Province (grant number: ZR2021MD047), and the Gansu Youth Science and Technology Fund Program (grant numbers: 24JRRA100).

Data Availability Statement

The data that support the findings of this study are available from Bing Guo upon reasonable request.

Conflicts of Interest

The authors declare no conflicts of interest.

References

  1. Liu, R.T.; Sun, J.C.; Zhou, L. The conception, subject characteristics, and contents of desert ecology and it simplication for desertification control. Acta Ecol. Sin. 2024, 17, 1–7. [Google Scholar]
  2. Feng, L.L. Spatio-temporal evolution and driving force analysis of desertification land in northern China. Ph.D. Thesis, Chinese Academy of Sciences, Beijing, China, 2017. [Google Scholar]
  3. Min, Y.F.; Zhang, Y.N.; Kang, J.F.; Feng, K.T. Study on Spatial-temporal Dynamic Monitoring of Degree of Desertification in CPEC based on MODIS Image. Remote Sens. Technol. Appl. 2021, 36, 827–837. [Google Scholar]
  4. Zeng, Y.N.; Feng, Z.D. Remote sensing analysis of temporal and spatial variation of land desertification in the source region of the Yellow River. Acta Geogr. Sin. 2007, 74, 529–536. [Google Scholar]
  5. Pan, J.H.; Qin, X.J. Remote sensing extraction of desertification information based on vegetation index albedo feature space a case study of Zhangye oasis and its vicinity. Sci. Surv. Mapp. 2010, 35, 193–195. [Google Scholar]
  6. Yue, H.; Liu, Y. Remote sensing monitoring of drought and desertification in Shaanxi Province based on NDVI-Albedo feature space. J. Northwest A F Univ. 2019, 34, 198–205. [Google Scholar]
  7. Gao, H.; Zhang, J.H.; Xia, X.Q. Drought monitoring in India and Pakistan based on temperature vegetation drought index. Remote Sens. Inf. 2016, 31, 62–68. [Google Scholar]
  8. Zhou, P. Remote sensing monitoring of desertification in Naiman Banner based on Albedo-MSAVI feature space. Geospat. Inf. 2021, 25, 78–81. [Google Scholar]
  9. Kummu, M.; Taka, M.; Guillaume, J.H.A. Data from: Gridded global datasets for Gross Domestic Product and Human Development Index over 1990–2015. Sci. Data 2018, 5, 1–15. [Google Scholar] [CrossRef]
  10. Luo, J. Extraction and Analysis of Rocky Desertification Information Based on NDVI-Albedo Feature Space. Master’s Thesis, Guizhou Normal University, Guiyang, China, 2022. [Google Scholar]
  11. Sun, S.J.; Cao, X.Y.; Xiao, J.S.; Sun, W.J.; Zhu, C.X. Desertification monitoring in Qaidam Basin based on NDVI-Albedo feature space. J. Arid. Meteorol. 2023, 41, 560–569. [Google Scholar]
  12. Lv, X.; Wang, J.L.; Kang, H.J.; Zhao, Q.; Han, X.H.; Wang, Y.J. Based on MODIS NPP, the temporal and spatial variation of grass yield in Sanjiangyuan region from 2006 to 2015 was studied. J. Nat. Resour. 2017, 32, 1857–1868. [Google Scholar]
  13. Li, J.N.; Pan, B.H.; Zheng, W.K.; Zhang, Y. Analysis of spatial and temporal evolution of land use pattern in the Yellow River Basin (Shaanxi section) from 1990 to 2020. J. Guizhou Norm. Univ. (Nat. Sci.) 2024, 42, 46–57. [Google Scholar]
  14. Wang, J.F.; Xu, C.D. Geographical Detectors: Principles and Prospects. Acta Geogr. Sin. 2017, 72, 116–134. [Google Scholar]
  15. Zhu, X.; Yang, B.Y.; Li, X.L.; Zhang, X.Z.; Dan, L.L. Research on Landsat8 land surface temperature inversion algorithm. Geospat. Inf. 2018, 16, 103–106. [Google Scholar]
  16. Miao, L.J.; Jiang, C.; He, B.; Liu, Q.; Zhu, F.; Cui, X.F. Response of vegetation coverage to climate change in Mongolian Plateau during recent 10 years. Acta Ecol. Sin. 2014, 35, 1295–1301. [Google Scholar]
  17. Wang, Z.Y.; Dang, B.; Qu, J.H.; Zhang, S.Y.; Feng, X. Effects of grazing intensity on soil properties of Xilinguole grassland in Inner Mongolia. For. Sci. Technol. Inf. 2023, 55, 157–159. [Google Scholar]
  18. Zhu, Z.Z.; Gong, J.R.; Yang, B.; Zhang, Z.H.; Wang, B.; Shi, J.Y.; Yue, K.X.; Zhang, W.Y. Changes of windbreak and sand fixation services and the driving factors in the desert steppe, Inner Mongolia. Acta Ecol. Sin. 2021, 41, 4606–4617. [Google Scholar]
  19. Cui, K.J.; Li, S.Y.; Fan, J.L.; Wang, H.F.; Meng, X.Y.; Miao, J.M.; Lv, Z.T. Characteristics of wind-sand activity in wind erosion desertification in grassland area of central Mongolia-Taking Joyle City as an example. Arid Land Geogr. 2022, 45, 792–801. [Google Scholar]
  20. Wu, Y.L.; Zhang, Y.; Tian, J.R. Impacts by Climate Change and Human Activities on NDVI in Different Vegetation Types across the Inner Mongolia Plateau. Chin. J. Agrometeorol. 2023, 44, 1155–1168. [Google Scholar]
  21. Tan, J.; Liu, F.Y.; Hou, X.C.; Wen, M.; Liu, Y.P. Discussion on site classification and management mode of Shayuan area in Inner Mongolia. Inner Mong. For. Surv. Des. 2000, 46, 45–47+53. [Google Scholar]
  22. Zhang, M. Research on desertification control pathways in Inner Mongolia under the orientation of green development strategy. Heilongjiang Environ. J. 2024, 37, 133–135. [Google Scholar]
  23. Yan, Y.; Chen, Y.F.; Zhao, G.C.; Qu, H.J.; Chen, S.Y.; Wang, X. Driving Factors of Desertification in Thin-Cover Areas of Inner Mongolia and Their Geological Evidence. Geol. Explor. 2019, 55, 630–640. [Google Scholar]
  24. Lu, C.; Huang, L.L.; Zhang, F.; Zhang, T.L. Causes of land desertification and sand prevention and control strategies. Inner Mong. For. Surv. Des. 2023, 46, 45–47+53. [Google Scholar]
  25. Qin, T.; Zhu, Q.F.; Zhu, C.X.; Li, N.; Liang, J.L.; Wang, R.X. The Study on Coupling Mechanism between Desertification Control and High Quality Development of Society-Economic-Ecology in Xinjiang. Ecol. Econ. 2023, 39, 201–208. [Google Scholar]
  26. He, Y. Research on Countermeasures of Soil and Water Conservation and Desertification Control. Sci. Technol. Inf. 2023, 21, 98–101. [Google Scholar]
  27. Ding, X. Study on the Dynamic Change of Land Desertification in Inner Mongolia Autonomous Region. Master’s Thesis, Northeast Agricultural University, Harbin, China, 2019. [Google Scholar]
  28. Ma, L. Research on ecological management path in soil and water conservation and desertification control. Mar. Saf. 2023, 43, 66–68. [Google Scholar]
  29. Wang, H. Coordination Degree Analysis of Oasis Urbanization and Water and Soil Resources Utilization Benefit. Master’s Thesis, Northeast Agricultural University, Harbin, China, 2014. [Google Scholar]
  30. He, P.J.; Zhang, H.J.; Wang, Y.C.; Kang, Y.X.; Huang, C.X.; Yang, X.T. Analysis of influencing factors of land desertification in Linze County of Hexi area. J. Environ. Eng. 2016, 34, 1111–1116. [Google Scholar]
  31. Ma, L.; Wang, J.R.; Liu, Y.X.; Huang, X.; Liu, D.H.; Li, H.Y. The response relationship between vegetation and climatic factors in Horqin sandy land from 2000 to 2012. Trans. Chin. Soc. Agric. Mach. 2016, 47, 162–172. [Google Scholar]
  32. Liu, W.M. Dynamic Changes and Sensitivity Analysis of Land Desertification in Qinghai-Tibet Plateau. Master’s Thesis, Northwest A&F University, Xianyang, China, 2023. [Google Scholar]
Figure 1. Overview of the study area.
Land 13 01431 g001
Figure 2. Principle of feature space related to NDVI and albedo.
Land 13 01431 g002
Figure 3. Typical feature parameters in 2020. (a) Albedo; (b) LST; (c) MSAVI; (d) NDVI; and (e) TGSI.
Land 13 01431 g003aLand 13 01431 g003b
Figure 4. Feature spaces of decertification. (a) Albedo–TGSI; (b) LST–Albedo; (c) LST–MSAVI; (d) MSAVI–Albedo; (e) NDVI–Albedo; (f) NDVI–LST; (g) NDVI–TGSI; (h) TGSI–LST; and (i) TGSI–MSAVI.
Land 13 01431 g004aLand 13 01431 g004b
Figure 5. Point–point model of spatial distribution of desertification at different levels. (a) Non-desertification; (b) mild desertification; (c) moderate desertification; (d) severe desertification; and (e) extremely severe desertification.
Land 13 01431 g005aLand 13 01431 g005b
Figure 6. Point–point feature space monitoring index model. P refers to any point in the feature space, O refers to the point (1,0), and D refers to the distance from P to D.
Land 13 01431 g006
Figure 7. Point–line mode distribution of different degrees of desertification. (a) Non-desertification; (b) mild desertification; (c) moderate desertification; (d) severe desertification; and (e) extremely severe desertification.
Land 13 01431 g007aLand 13 01431 g007b
Figure 8. Point–line feature space monitoring model.
Land 13 01431 g008
Figure 9. Linear regression between TGSI and MSAVI.
Land 13 01431 g009
Figure 10. Spatial distribution of levels of desertification. (Based on the optimal model MSAVI–Albedo).
Land 13 01431 g010
Figure 11. The proportion of levels of desertification area.
Land 13 01431 g011
Figure 12. Temporal variation in desertification during 2001–2020.
Land 13 01431 g012
Figure 13. Migration trajectory of gravity center. (a) China; (b) Mongolia; and (c) Russia.
Land 13 01431 g013
Figure 14. Desertification changes during different historical periods: (a) 2001–2010; and (b) 2011–2020.
Land 13 01431 g014aLand 13 01431 g014b
Figure 15. Sankey map of area change: (a) 2001–2010; and (b) 2011–2020.
Land 13 01431 g015
Figure 16. Single factors in different regions. (a) China; (b) Mongolia; and (c) Russia.
Land 13 01431 g016
Figure 17. The interaction factor q values for different regions and periods. (a1) China 2001; (a2) China 2010; (a3) China 2020; (b1) Mongolia 2001; (b2) Mongolia 2010; (b3) Mongolia 2020; (c1) Russia 2001; (c2) Russia 2010; and (c3) Russia 2020.
Land 13 01431 g017aLand 13 01431 g017b
Table 1. Error matrix (using MSAVI–Albedo as an example).
Error MatrixNon-DesertificationMild DesertificationModerate DesertificationSevere DesertificationExtremely Severe DesertificationTotal
Non-desertification62221168
Mild desertification23811143
Moderate desertification10331136
Severe desertification11232137
Extremely severe desertification11223137
Total6742403735221
Table 2. Comparison of the accuracy of different models and their Kappa coefficients.
Model TypeModel CompositionModel AccuracyKappa Coefficient
Point–pointNDVI–Albedo61.26%0.508
NDVI–LST58.53%0.446
NDVI–TGSI55.76%0.425
MSAVI–LST79.87%0.720
MASVI–Albedo86.47%0.825
Point–lineLST–Albedo72.35%0.642
MSAVI–TGSI85.71%0.815
LST–TGSI73.27%0.651
TGSI–Albedo74.65%0.669
Table 3. Monitoring accuracy results for different levels of desertification severity.
AccuracyNon-DesertificationMild DesertificationModerate DesertificationSevere DesertificationExtremely Severe Desertification
MSAVI–Albedo92.5%90.5%82.5%86.5%88.6%
MSAVI–TGSI85.6%86.9%90.1%88.4%84.1%
MSAVI–LST93.2%81.1%79.3%80.6%85.2%
TGSI–Albedo85.1%80.3%76.4%78.3%80.2%
LST–TGSI75.4%73.2%80.8%69.4%78.3%
LST–Albedo63.2%78.1%65.4%76.8%81.2%
NDVI–Albedo60.5%68.2%65.6%70.3%57.4%
NDVI–LST61.3%67.3%66.4%59.3%58.2%
NDVI–TGSI59.3%58.6%60.5%70.6%55.3%
Disclaimer/Publisher’s Note: The statements, opinions and data contained in all publications are solely those of the individual author(s) and contributor(s) and not of MDPI and/or the editor(s). MDPI and/or the editor(s) disclaim responsibility for any injury to people or property resulting from any ideas, methods, instructions or products referred to in the content.

