Article

Regional Differences in Carbon Budgets and Inter-Regional Compensation Zoning: A Case Study of Chongqing, China

1
Chongqing Geomatics and Remote Sensing Center, Chongqing 401120, China
2
School of Resource and Environmental Sciences, Wuhan University, Wuhan 430079, China
3
Key Laboratory of Monitoring, Evaluation and Early Warning of Territorial Spatial Planning Implementation, Ministry of Natural Resources, Chongqing 401120, China
4
Key Laboratory of GIS, Ministry of Education, Wuhan University, Wuhan 430079, China
5
School of Computer Science & Engineering, Chongqing University of Technology, Chongqing 400054, China
*
Author to whom correspondence should be addressed.
Land 2024, 13(9), 1495; https://doi.org/10.3390/land13091495
Submission received: 25 July 2024 / Revised: 24 August 2024 / Accepted: 10 September 2024 / Published: 14 September 2024

Abstract

:
Carbon compensation can guide human activities in reducing carbon emissions or increasing carbon sequestration and also represents an important approach for coordinating regional development. In this paper, Chongqing Municipality, whose internal development is varied, was selected as a case study. The annual carbon emissions, carbon sequestration, carbon deficits, and inter-regional carbon compensation costs from 2000 to 2021 were continuously estimated via local optimization methods, and a carbon compensation zoning scheme was proposed that integrates the present situation and trend analysis. The results show that (1) Chongqing’s total carbon emissions were greater than the total carbon sequestration, and the carbon deficit was approximately 556.24 × 10⁴ t~3621.58 × 104 t. (2) County-level carbon budgets have large regional differences; the counties that should always receive carbon compensation are from the southeast and northeast regions, and the counties that should always pay carbon compensation are from central urban areas and the surrounding new urban areas. (3) All the counties were zoned into key payment areas, basic payment areas, key recipient areas, and basic recipient areas. The key payment areas, which account for 39.47%, maintain and grow payment status and are the main sources of carbon compensation costs, while the key recipient areas, which account for 44.74%, maintained a negative compensation status and a continuous downward trend, meaning that they may receive increasing carbon compensation costs. This paper revealed inequities in carbon compensation and proposed a novel zoning solution, which can provide scientific reference and data support for further establishing inter-regional carbon compensation mechanisms.

1. Introduction

In the pursuit of economic goals, human development and excessive carbon emissions have clashed [1]; many countries have chosen ecological compensation as a solution [2,3]. Based on the externality effects of human activities on ecosystems, including the positive environmental externalities from afforestation, soil conservation, etc., and the negative environmental externalities from pollution and deforestation, etc., ecological compensation establishes a balancing mechanism among them to promote coordinated and equitable development between regions [4,5]. As a new focus of ecological compensation research [6], paying for carbon compensation costs can transform carbon-related environmental externalities into economic incentives, which is helpful in guiding human activities to reduce carbon emissions or increase carbon sequestration, thus enabling the coordination of regional development and regional carbon neutrality [7,8,9].
Carbon compensation is considered the behavior taken to offset carbon emissions by compensating carbon sequestration providers or ecological protectors [10,11]. Measuring carbon emission/sequestration capacity is the key to revealing regional differences in carbon budgets and considering whether carbon compensation are needed [8]; zoning schemes are the focus of current carbon compensation research, as they provide the necessary foundation for implementing regional carbon compensation systems [12].
For the content of compensation, the carbon emissions generated by human activities are generally considered [13,14], and the natural carbon emissions such as volcanic eruptions, plant respiration, etc., are excluded. The Intergovernmental Panel on Climate Change (IPCC) has developed a standard method for classifying, counting, and accumulating carbon emissions across all aspects of production and living, which is widely used internationally [15,16]. The statistical results of this method are usually used to simulate the spatial distribution of carbon emissions through road networks data [17], land use data [18], night-time light data [19], or population spatial distribution data [20]. Because carbon emission is closely related to micro-human activities, the simulation scheme using population spatial distribution data is more reasonable for uneven regions [21]. On the other hand, carbon sequestration from terrestrial ecosystems is currently considered to be the main component for offsetting carbon emissions from human activities and typically demonstrates its capacity in the form of net ecosystem productivity (NEP) [22]. NEP reflects the material circulation and energy flow of an ecosystem; the primary method for calculating NEP is the process model, which integrates multisource data including temperature, precipitation, and soil respiration [23,24]. On the basis of understanding the carbon budget according to emissions and sequestrations, researchers modified the carbon deficit of the budgets in conjunction with socioeconomic parameters to construct a widely accepted method for calculating carbon compensation costs [8,10,13].
Using compensation costs to identify the type of payments or recipients in a region is the key to further promoting the implementation of carbon compensation mechanisms, but the existing approach has revealed several problems. As in typical Chinese studies, some researchers tend to judge whether to pay or receive compensation based on the positioning of each region in functional planning [12,25], while others tend to distinguish the types of compensation based on driving factors and clustering results [26,27]. Although the temporal change in carbon compensation costs has been considered in previous studies, these changes have not been incorporated into the zoning process, the long-term efforts of regions in emission reduction and sequestration enhancement have been neglected, and the role of carbon compensation mechanisms in balancing regional inequalities has been limited. In addition, while the depth and continuity of the data used for computation are improving [24,28,29,30], the research scale has remained predominantly at the provincial or city level [9,10,31]; smaller-scale exploration is lacking.
Chongqing, one of four municipalities directly administered by the nation, is also the largest and most populous of these municipalities. In 1997, China established Chongqing Municipality to coordinate the migrant affairs brought about by the construction of the Three Gorges Project, which manages an area of 82,400 km2 and a population of more than 32 million people. Chongqing Municipality has 38 county-level administrative regions (including districts, counties, and autonomous counties) under its jurisdiction [32] and is traditionally divided into four regions (Figure 1), namely the central urban area of Chongqing (CUAC), the new area of Chongqing city proper (NACCP), the city cluster of the Three Gorges Reservoir area in northeast Chongqing (NEC), and the city cluster of the Wuling Mountain area in southeast Chongqing (SEC) [33,34]. Development in the four regions is varied with large differences in regional economic and ecological status. Taking Chongqing as an example to carry out research on carbon compensation will provide a useful reference for the coordinated development of urban and rural areas in China and even other regions.
Therefore, this study takes Chongqing as a case study and sets the following three innovation goals around carbon compensation zoning: (1) continuously estimate the carbon emission/sequestration capacity of Chongqing based on optimization methods that meet the requirements at the county scale; (2) modify the carbon deficit based on local socioeconomic parameters and further calculate the carbon compensation cost of each county to reveal potential regional inequalities in the carbon budget differences; and (3) consider the influence derived from the present situation and trend to zone the carbon compensation types. Through these approaches, a novel framework for analyzing and compensating for regional differences in carbon budgets is formed.

2. Materials and Methods

2.1. Methodology

The flowchart of this methodology is shown in Figure 2. Based on the research objectives, we constructed carbon emission accounting, carbon sequestration accounting, actual carbon deficit calculation, carbon compensation cost estimation, and carbon compensation zoning methods, which were organized into the following five parts.

2.1.1. Accounting for Carbon Emissions

We accounted for carbon emissions from human respiration and energy consumption, covering two main aspects of life and production, which also represents the main demand for carbon compensation, and calculated them as follows:
C E = C E R + C E C
C E R = 365 × p o p × β × 12 44 × 10 3
C E C = i = 1 n E i × δ i × f i
where C E denotes the total carbon emission, and C E R and C E c denote the carbon emission from human respiration and energy consumption, respectively. Specifically, pop denotes the population, and β denotes the human respiration CO2 emission rate according to previous studies, which is 0.9 kg cap−1d−1 [35]. In addition, E i refers to the consumption of 10 kinds of energy, namely raw coal, coke, crude oil, gasoline, kerosene, diesel oil, fuel oil, liquefied petroleum gas, natural gas, and electric power. δ i and f i are the standard coal coefficient and the carbon emission coefficient, respectively, used to convert the i th energy type; the coefficient values set according to previous studies are shown in Table 1 [36,37], taking into account the information provided by the IPCC guidelines for national greenhouse gas inventories, China Energy Statistical Yearbook and the practical situation in Chongqing. In addition, by calculating the per capita emissions, the statistical results of carbon emissions from energy consumption were discretized according to the spatial distribution of the population.

2.1.2. Accounting for Carbon Sequestration

NEP refers to the net carbon exchange quantity between terrestrial ecosystems and the atmosphere [9] and supplies the basic carbon sequestration capacity of landlocked Chongqing. The annual NEP is the difference between the annual net primary production (NPP) and soil heterotrophic respiration (Rh) [30] and was calculated as follows:
C S = N E P = N P P R h
R h = 1.598 R s 0.862 + 23.92
where R s is the annual soil respiration (g C/m2/yr), which can be simulated with the geostatistical model of R s (GSMRS). The GSMR model was constructed in a previous study [38], which was based on collected data from 390 sample points and adapted to soil respiration estimates in China, calculated as follows:
R s , m o n t h = 0.588 + 0.118 S O C e ln 1.83 e 0.006 T T 10 ( 2.972 + P ) / ( 5.657 + P ) × 30
R s , a n n u a l = i = 1 12 R s , m o n t h
where R s , m o n t h and R s , a n n u a l are the monthly and annual soil respiration, respectively. SOC is the topsoil (0–20 cm) organic carbon storage density, and T and P are the mean monthly temperature (°C) and mean monthly precipitation (cm), respectively.

2.1.3. Calculation of the Carbon Deficit

The difference between carbon emissions and carbon sequestration in counties is expressed by the carbon deficit [8,13], which was calculated as shown in Equation (8): when CD > 0, the carbon sequestration in the county is less than the carbon emission, indicating relatively strong human activities. When CD < 0, that is, when the carbon sequestration in the county is greater than the carbon emission, the ecological environment is considered relatively better.
C D = C E C S

2.1.4. Estimation of the Regional Carbon Compensation Cost

The calculation of carbon compensation costs relies on the carbon deficit and the unit carbon price. In addition, differences in population, area, and economic affordability between counties need to be taken into account to correct the carbon deficit and price [13]. The carbon compensation cost calculation method is as follows:
C C i = ( C D i ρ i C D i ) × P × r i
For county i , C C i is the carbon compensation cost. C D i is the carbon deficit of county i , modified by the coefficient ρ i and the total carbon deficit of Chongqing. The modification coefficient ρ i is calculated based on the population and area differences among counties, as shown in Equation (10) below. P is the currency price of a unit of carbon and is modified by the carbon compensation coefficient r i of each county. Chongqing is one of the earliest carbon emission trading pilot areas in China, and the highest and lowest trading prices during the pilot period were 47.52 CNY/t CO2 and 1.11 CNY/t CO2, respectively. We set the p value to the median value, which is 24.315 CNY/t CO2, that is, 89.155 CNY/t C. Specifically, the carbon compensation coefficient r i is expressed as Equation (12):
ρ i = p o p i × a r e a i p o p i × a r e a i
P = ( P m i n + P m a x ) / 2
r i = G i / G c q ( 1 + a e b t )
where p o p i and a r e a i represent the population and area of county i , respectively. G i and G c q , respectively, refer to the per capita GDP of county i and Chongqing Municipality, and their ratios can indicate the large difference in compensation capacity among counties. a and b are constants whose values are equal to 1, while t is the Engel coefficient for the city.

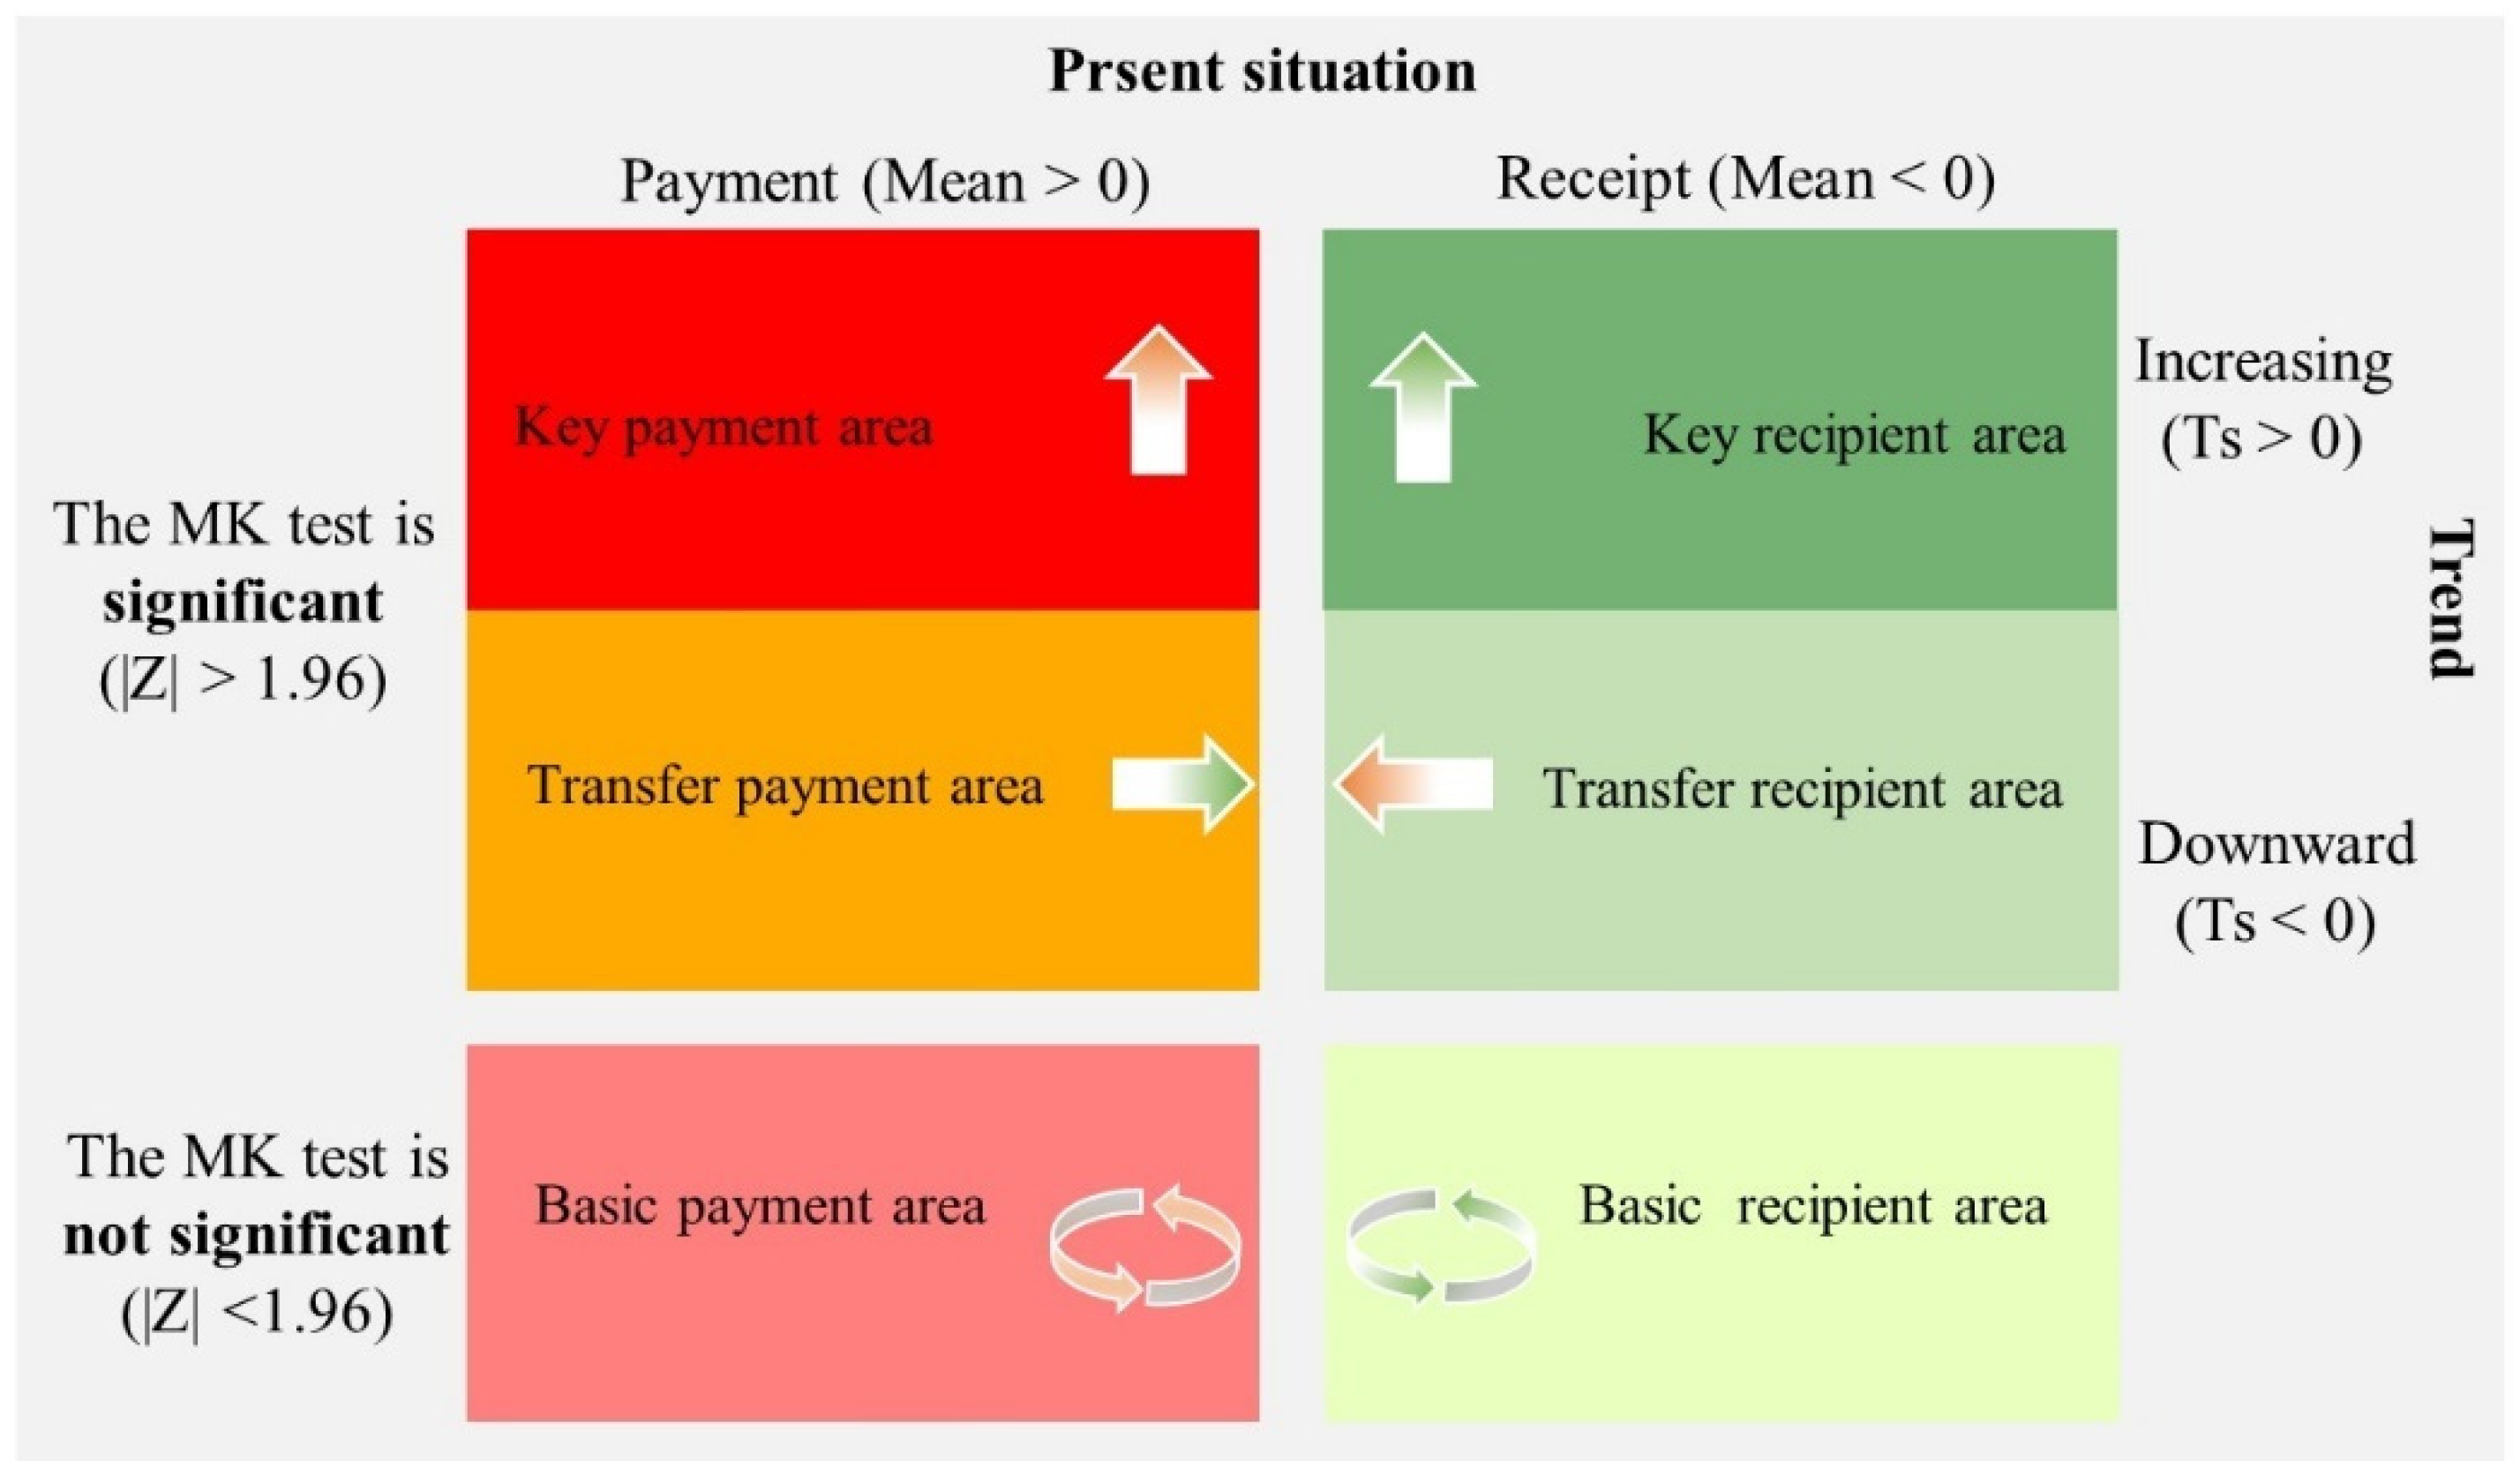
2.1.5. Identify the Type of Carbon Compensation Area

In this study, the type of carbon compensation in each county was zoned according to the present situation and trend of carbon compensation costs. Specifically, the present situation was judged by the average compensation costs of the past three years, and trend analysis was achieved by combining the Theil–Sen (TS) median index and Mann–Kendall (MK) test methods.
The TS method is a robust nonparametric statistical trend calculation method that is suitable for trend analysis of long time series data [39,40]. The Ts method analyzes the trend of carbon compensation costs by calculating the slope, which focuses on the magnitude and direction of the trend rather than making assumptions about the underlying distribution of the time series data [41], as shown below:
T s = M e d i a n C C i , j C C i , k j k , 2000 k j 2021
where C C i , k and C C i , j represent the carbon compensation cost value of i county in years k and j , respectively, and Ts is the slope value of the change trend. When TS > 0, the carbon compensation cost shows an increasing trend. In contrast, this indicates that the carbon compensation cost shows a downward trend.
Associated with the change trend of carbon compensation costs, the MK method is used to test the significance of Ts. For the time series C C i , t = ( C C i , 2000 , C C i , 2001 , …, C C i , 2021 ) composed of carbon compensation cost data, this method does not require samples to follow a certain distribution, nor is it disturbed by a few outliers [42,43], the output statistic Z is defined as follows:
Z = S 1 v a r ( S ) , S > 0             0 ,                     S = 0 S + 1 v a r ( S ) , S < 0
S = j = 1 n 1 k = j + 1 n s g n ( C C i , k C C i , j )
s g n C C i , k C C i , j =     1 ,   C C i , k C C i , j > 0       0 ,   C C i , k C C i , j = 0 1 ,   C C i , k C C i , j < 0 , v a r S = n ( n 1 ) ( 2 n + 5 ) 18
where n is the length of the time series, s g n is the sign function, and v a r ( S ) is the variance of the statistic S. The Z value ranges from (−∞, +∞). Under the significance level of 0.05 given in this study, Z > 1.96 indicates a significant change in the time series of carbon compensation cost. On the contrary, it is considered that the change trend represented by Ts is not significant.
Finally, we designed the zoning scheme shown in Figure 3 below. Based on the present situation and trends analysis in carbon compensation costs, all the counties can be divided into 6 types of areas, namely key payment areas, transfer payment areas, basic payment areas, key recipient areas, transfer recipient areas, and basic recipient areas.

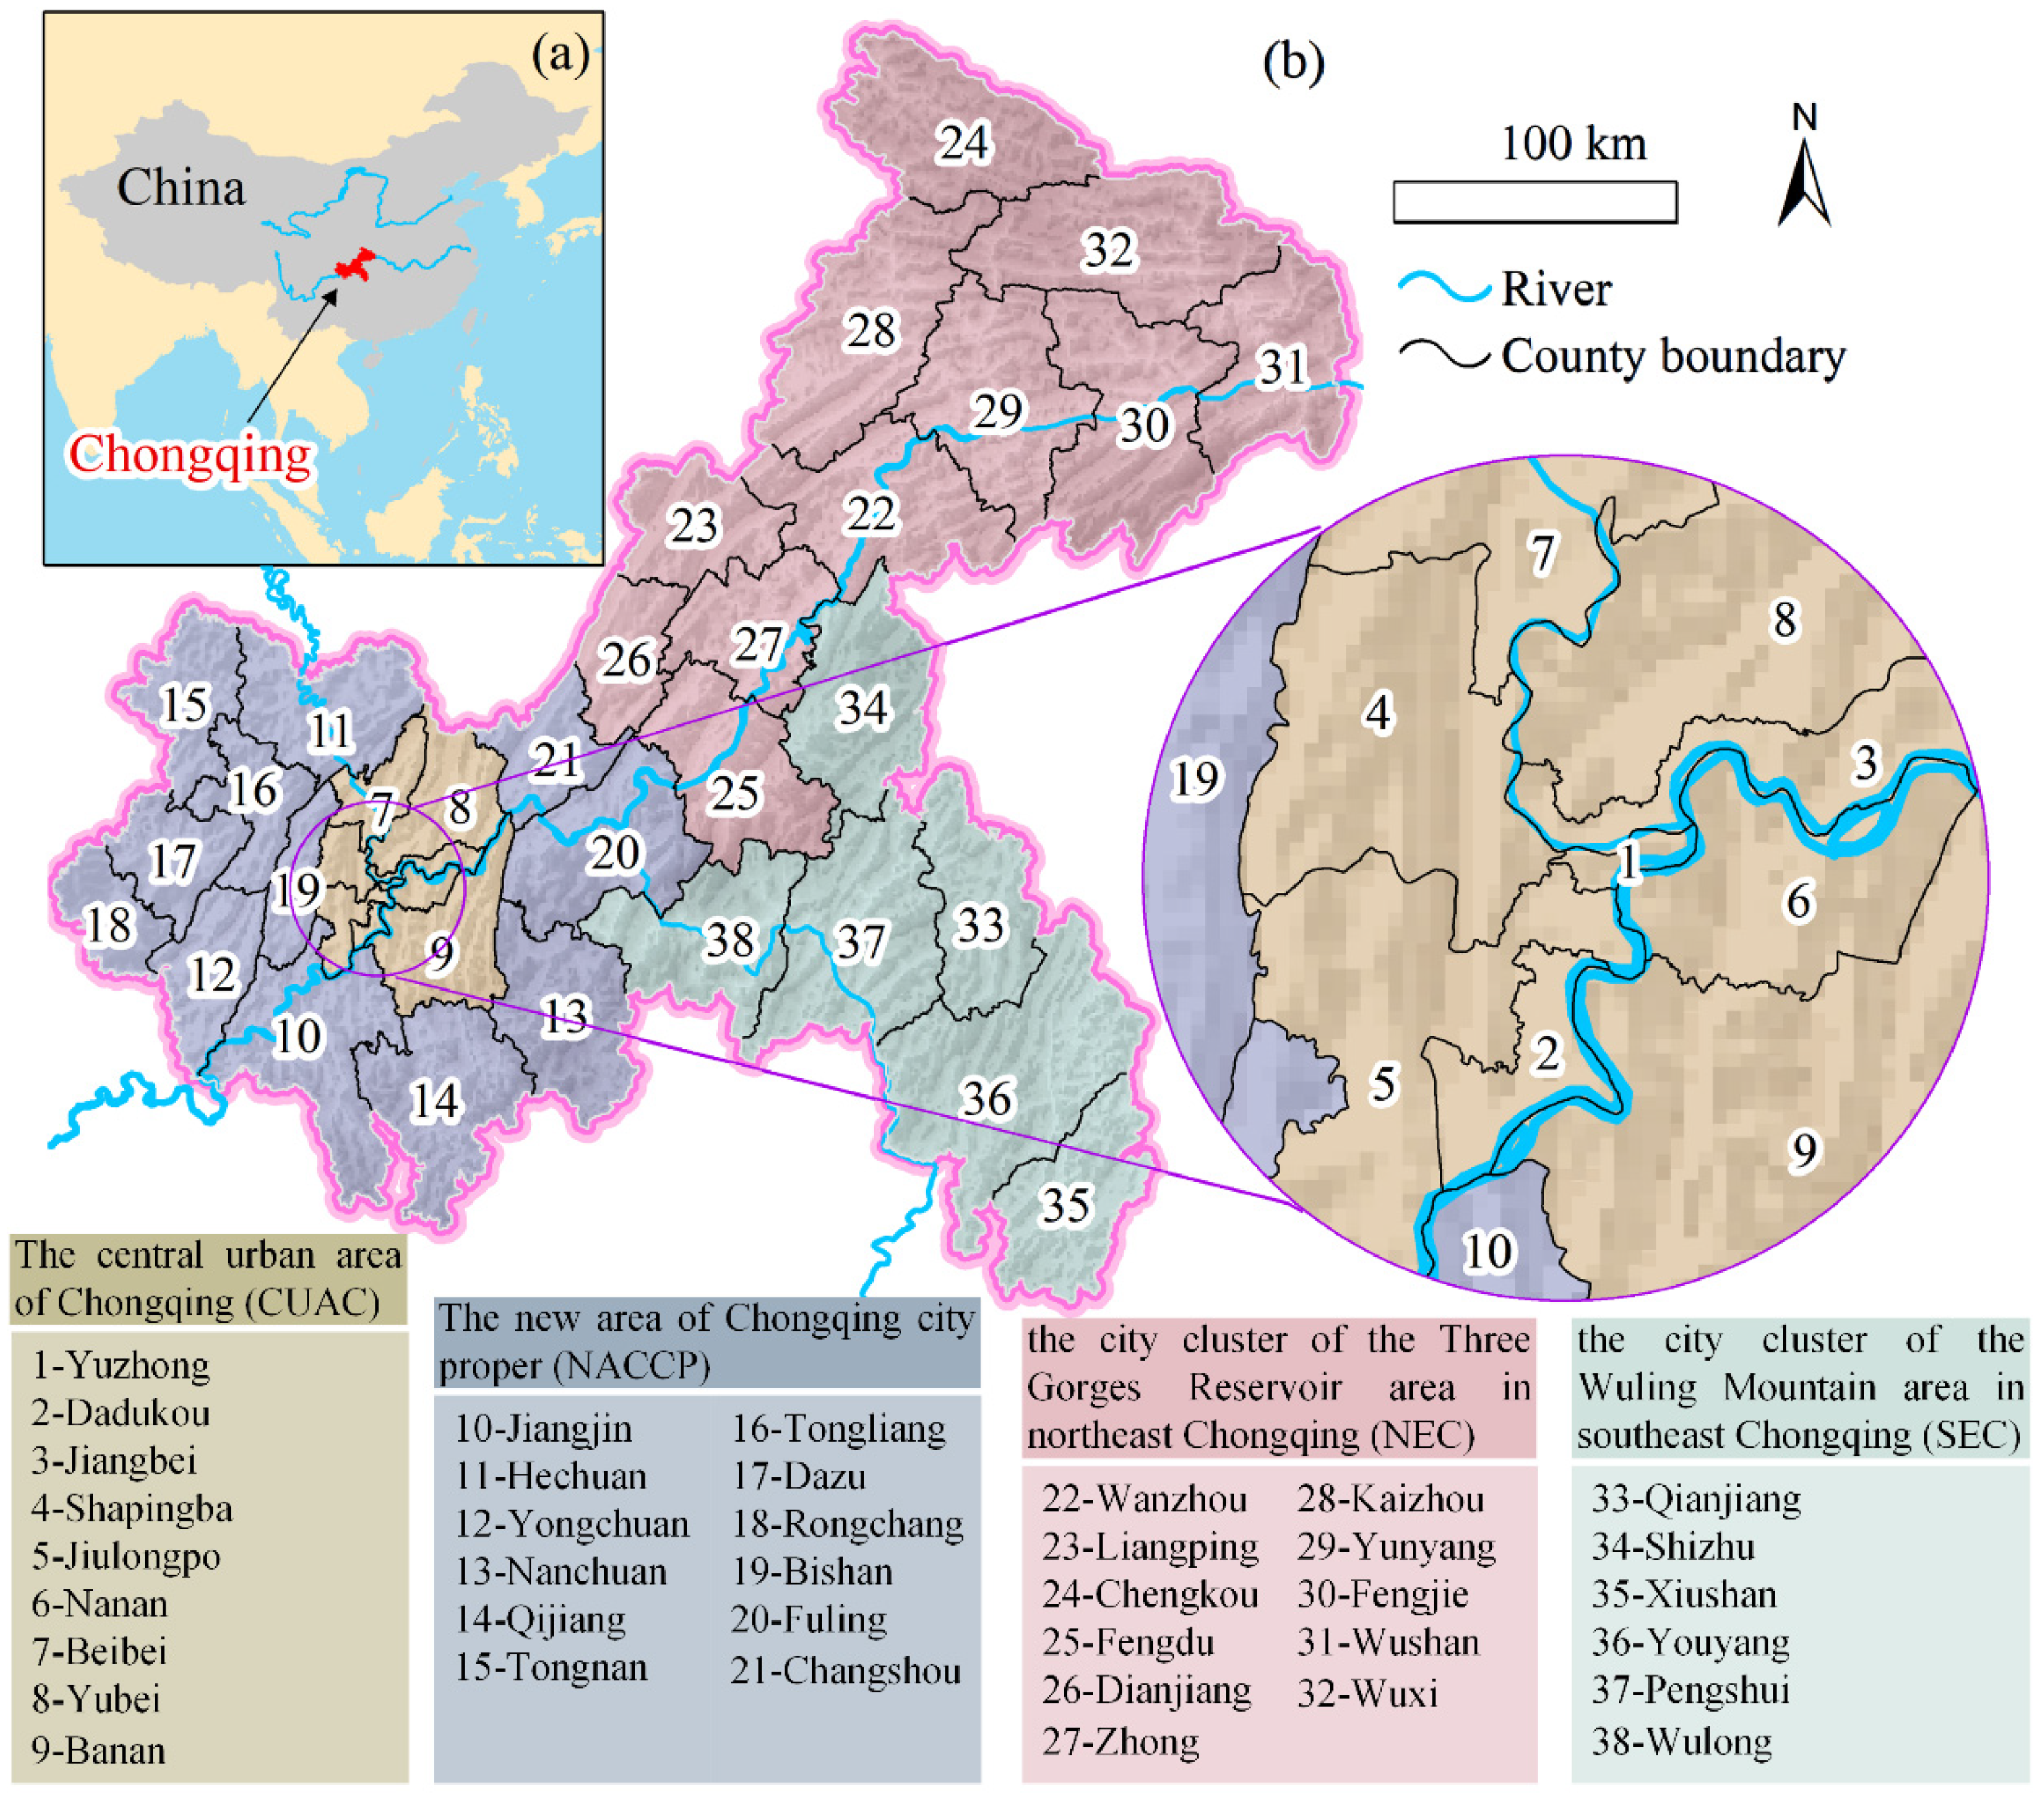
2.2. Data Collection

With Chongqing as the target, this study used multisource data from 2000 to 2021. First, the consumption data obtained from the China Energy Statistical Yearbook were used to estimate energy consumption carbon emissions, and the total carbon emissions were spatialized based on the Landscan dataset (https://landscan.ornl.gov) with a spatial resolution of 1 km. Second, NASA’s 500 m resolution annual NPP product, called MOD17A3 (https://www.earthdata.nasa.gov), was used to calculate carbon sequestration, and spatial distribution data such as temperature, precipitation, land cover, and soil organic carbon (SOC) density were also combined. The total carbon emissions and carbon sequestration estimated in this study were eventually resampled to a 1 km resolution for subsequent analysis. Next, a range of statistics, such as GDP and the Engel coefficients from Chongqing Statistical Yearbook, were used together with carbon prices from Carbon Trading Website (http://www.tanjiaoyi.com) to estimate the carbon compensation costs. Finally, the detailed introduction and sources of the above data are supplemented as shown in Table 2.

3. Results

3.1. Spatiotemporal Dynamics of Carbon Emissions

During the study period, Chongqing’s carbon emissions exhibited fluctuating and rising trends and were distributed in an uneven pattern in its vast regional space. Figure 4a,b depict the average carbon emission intensity and the interannual change process, respectively. The average carbon emission density over 21 years reflects the heterogeneity of the spatial distribution of carbon emissions. In general, the density in the urban center is the highest, and the average density in the highest area reaches 94,299.83 g/m2/yr. However, there are still many places on the outskirts of urban areas that have zero carbon intensity, which means that they have very little emissions, and our accounting methods have not detected anything. From the perspective of interannual changes in carbon emissions, Chongqing’s total carbon emissions increased from 1766.91 × 104 t in 2000 to 3688.6 × 104 t in 2021, with a significant linear growth trend of approximately 130.24 × 10⁴ t/yr (p < 0.05). The year with the lowest emissions was 2003, at 1576.56 × 104 t. Total carbon emissions subsequently climbed rapidly, peaking in 2011 at 4723.24 × 104 t. Afterward, emissions began to show more complex fluctuations and gradually declined. At present, although Chongqing’s total carbon emissions have shown signs of decreasing annually, compared with the value in 2000, they are already at a very high level (increased by 2.09 times), and the overall growth trend in the past 21 years has been quite rapid.
Figure 5 illustrates the regional and temporal distributions of carbon emissions in more detail. Although the area of the CUAC is generally small, the carbon emissions are high. Yubei District reached the highest county carbon emissions in 2012, reaching 231.42 × 10⁴ t. The number of counties in the NACCP region is large, and carbon emissions were generally high, with Hechuan and Jiangjin Districts reaching 224.27 × 10⁴ t and 204.6 × 10⁴ t of emissions, respectively, in 2011. In the NEC region, the Wanzhou and Kaizhou Districts also reached high levels of carbon emissions of 249.1 × 10⁴ t and 218.76 × 10⁴ t in 2011, respectively; however, in 2011, the annual carbon emissions of Wushan, Wuxi, and Chengkou County were lower than 89.1 × 10⁴ t. In addition, the annual carbon emissions of the six counties in the SEC region were relatively uniform, and the highest level was only 92.93 × 10⁴ t, which was reached in Pengshui Autonomous County in 2011. In terms of temporal distribution, the period from 2009 to 2017, when Chongqing’s total carbon emissions were higher than 4000 × 104 t, was also the period of concentrated distribution of carbon emissions in various counties. Especially in 2011, twenty-five (65.79%) counties, such as Yuzhong, Hechuan, Wanzhou, and Pengshui, reached their peaks, which is generally consistent with the temporal distribution of total carbon emissions.

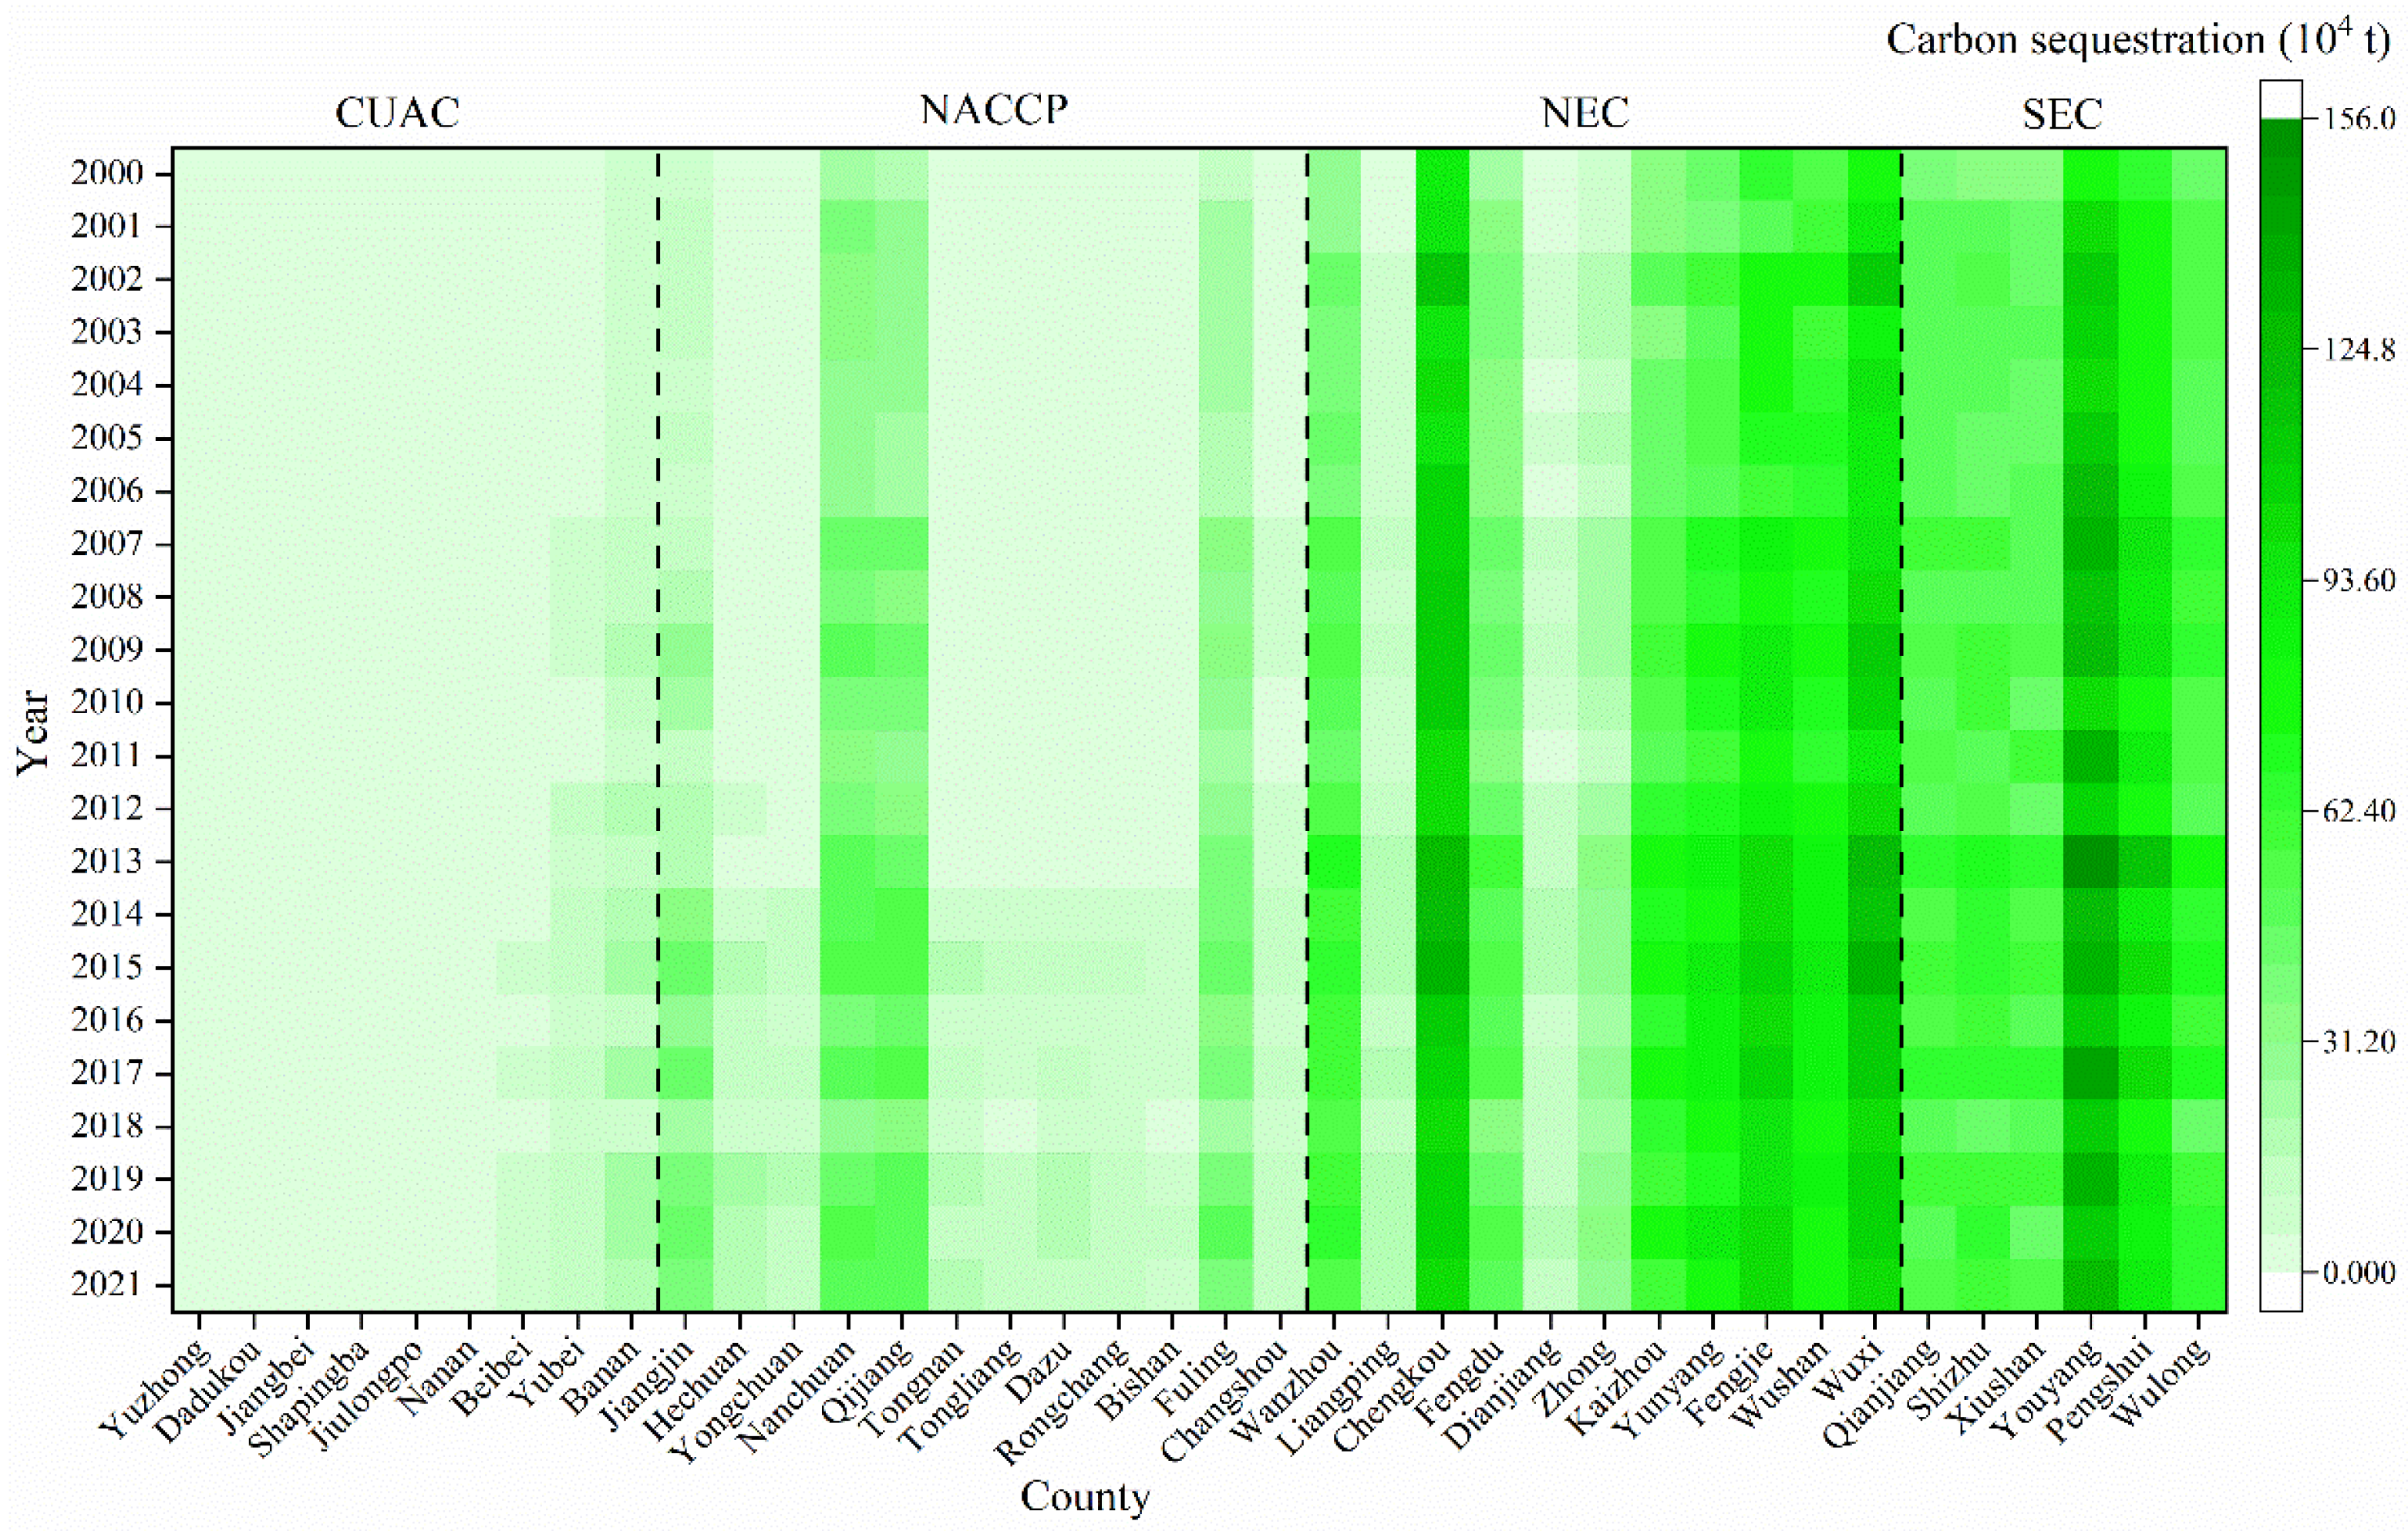
3.2. Spatiotemporal Dynamics of Carbon Sequestration

Similar to the total carbon emissions, Chongqing’s carbon sequestration also fluctuated and increased during the study period, but there were differences in spatial distribution and growth rate. As shown in Figure 6a, the spatial distribution of the annual average carbon sequestration density was different from that of the average carbon emission density, and the high-value pixels were concentrated in the eastern regions, with the highest value of 740.48 g/m2/yr. At a data resolution of 1 km, the lowest carbon sequestration density we observed in the urban center was 0. Figure 6b shows the interannual change in total carbon sequestration in Chongqing. The lowest level of sequestration was 803.86 × 10⁴ t in 2000, and the highest sequestration occurred in 2015, when it reached 1682.04 × 104 t. At the end of the study period, in 2021, it fell back to 1478.25 × 104 t. In general, the change process of Chongqing’s total carbon sequestration also showed a fluctuating growth trend. The annual carbon sequestration capacity increased by approximately 1.84 times in 21 years, the growth trend was significant (p < 0.05), and the linear fitting results showed that the annual growth scale was approximately 31.2 × 10⁴ t.
For carbon sequestration at the county level (Figure 7), the carbon sequestration capacity varied greatly between regions, while the annual variation was relatively small. In general, the carbon sequestration capacities of CUAC, NACCP, NEC, and SEC were enhanced successively. In the CACU region, Banan District achieved the highest value in 2020, at only 25.08 × 10⁴ t. The carbon sequestration in the NACCP region was relatively high, but only Qijiang and Nanchuan Districts reached more than 50 × 104 t in some years after 2014. In 2015, the counties in the NEC region had greater carbon sequestration, with Chengkou, Wuxi, and Fengjie Counties peaking at 134.84 × 10⁴ t, 131.68 × 10⁴ t, and 108.49 × 10⁴ t, respectively. Carbon sequestration is generally high in SEC counties, with Xiushan Autonomous County reaching a minimum of 32.08 × 10⁴ t in 2000 and Youyang Autonomous County reaching a maximum of 155.58 × 10⁴ t in 2013. Although there were also 11 (28.95%) counties whose carbon sequestration was in sync with Chongqing’s total carbon sequestration, peaking in 2015, this result was more complex than the anthropogenic carbon emission growth process.

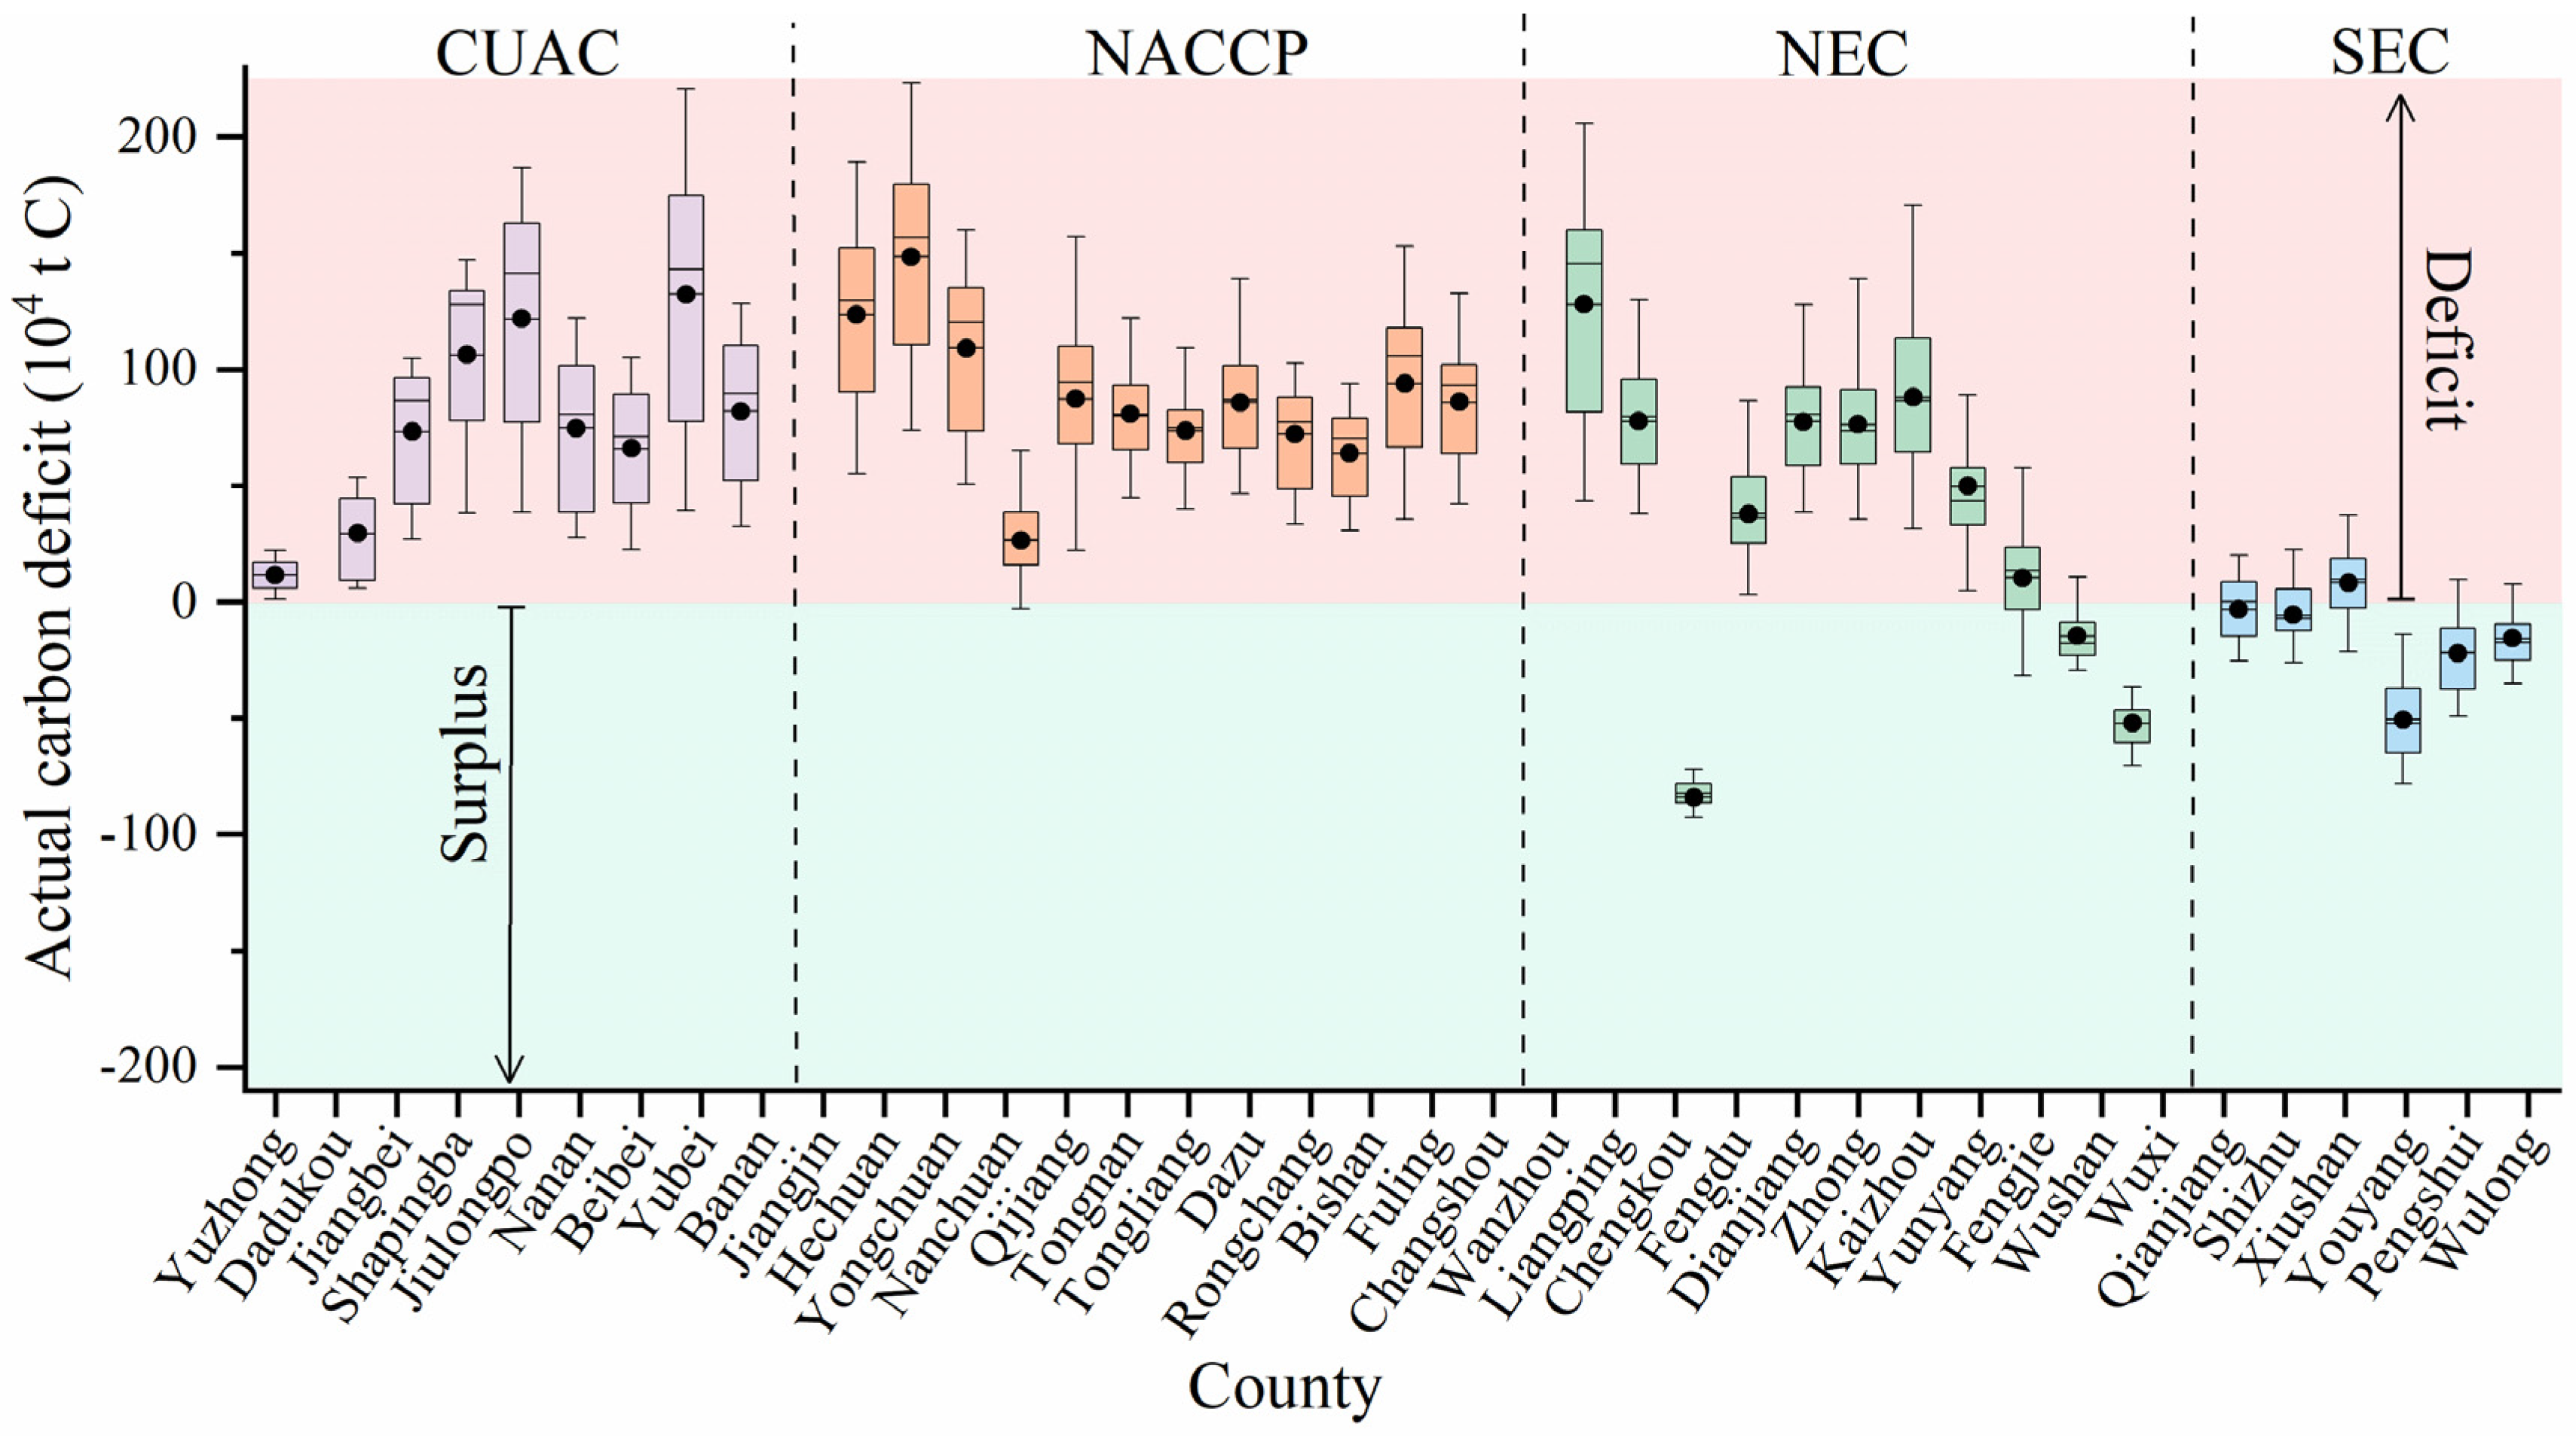
3.3. Carbon Deficits at the Municipality and County Levels

Between 2000 and 2021, Chongqing’s total carbon emissions and carbon sequestration both increased but at different rates. Figure 8 compares the differences in their growth processes and describes the changes in the carbon deficit resulting from their subtraction. Chongqing’s carbon emission baseline was greater than its carbon sequestration baseline and grew faster, resulting in a fluctuating trend of widening carbon deficit between 2000 and 2021. Specifically, the lowest carbon deficit was 556.24 × 10⁴ t in 2002, meaning that Chongqing’s total carbon emissions were always greater than its carbon sequestration. The highest value was 3621.58 × 104 t in 2011, and since then, the downward trend of carbon deficit follows that of carbon emissions.
Figure 9 details the county distribution of carbon deficits from 2000 to 2021. In contrast to the overall state of Chongqing, the carbon budgets of eight counties (21.05%) switched between deficit and surplus. These counties are distributed in the NACCP, NEC, and CUAC regions, such as Nanchuan District (−3 × 10⁴~65.11 × 10⁴ t), Fengjie County (−31.59 × 10⁴~57.62 × 10⁴ t), and Xiushan Autonomous County (−21.28 × 10⁴~37.23 × 10⁴ t). Only three counties, Chengkou (−107.23 × 10⁴~−65.56 × 10⁴ t), Wuxi (−83.27 × 10⁴~−14.59 × 10⁴ t), and Youyang (−78.26 × 10⁴~−13.97 × 10⁴ t), have always maintained a surplus in their carbon budget. These counties are from the NEC and SEC regions. There were 27 (71.05%) counties that maintained a carbon deficit each year, and they were distributed in areas other than the SEC, such as Yubei District (39.36 × 10⁴~220.61 × 10⁴ t), Hechuan District (73.69 × 10⁴~223.41 × 10⁴ t), and Wanzhou District (43.31 × 10⁴~205.74 × 10⁴ t).

3.4. Lateral Carbon Compensation across Counties

On the basis of the carbon deficit, we integrated lateral population, administrative area, and economic data to estimate the carbon compensation costs across counties (Figure 10). Because the carbon compensation cost is not entirely determined by the carbon deficit, the data for some counties that remained in deficit were corrected. During 2000–2021, only Jiangjin, Qijiang, Fuling, and Wanzhou Districts maintained a transition in the payment and receipt of carbon compensation costs. Fourteen (36.84%) counties, such as Youyang Autonomous County (CNY −119.6~−32.32 million), Fengjie County (CNY −116.74~−20.59 million), and Nanchuan District (CNY −42.08~−10.07 million), which were from the SEC, NEC, and NACCP regions, respectively, received compensation costs every year. The remaining 20 (52.63%) counties paid compensation costs, and they are located in the CUAC, NACCP, and NEC regions; these counties include Jiulongpo District (CNY 109.5~413.36 million), Rongchang District (CNY 28.44~104.73 million), and Dianjiang County (CNY 19.96~55.44 million).

3.5. Inter-Regional Carbon Compensation Zoning

The results of the present situation and trend analysis of carbon compensation in each county during 2000–2021 are shown in Figure 11. Figure 11a illustrates the average carbon compensation cost in the past three years; 20 counties had a payment status, and 18 counties had a recipient status, accounting for 52.63% and 47.37%, respectively, of the total. The highest average payment for Yuzhong District was CNY 359.83 million. In contrast, Youyang Autonomous County paid the lowest average of CNY −104.71 million, indicating that it should receive the most compensation. Figure 11b shows the trend analysis of the carbon compensation costs from 2000 to 2021; 18 counties experienced an increase, and 20 counties experienced a decrease, accounting for 47.37% and 52.63%, respectively, of the total. Specifically, the increase trend was significant (p < 0.05) in 15 (39.47%) counties, and the compensation cost paid by Yuzhong District increased the fastest, reaching CNY 11.18 million per year. In the other 17 counties, the downward trend was significant, with the compensation cost paid by Wanzhou District decreasing the fastest, reaching CNY −4.64 million per year.
Based on the present situation and trend analysis, we zoned the types of carbon compensation in all the counties of Chongqing (Table 3). Fifteen counties, such as Yuzhong, Yongchuan, and Dianjiang, were classified as key payment areas; these counties maintain and grow payment status and are the key sources of carbon compensation costs. Five counties, namely Dadukou, Shapingba, Jiulongpo, Hechuan District, and Zhong County, were classified as basic payment areas; these counties were important sources of carbon compensation costs and did not show any significant change in trend. Seventeen counties, such as Nanchuan, Wanzhou, and Youyang, were classified as key recipient areas that maintained a negative compensation status and a continuous downward trend, meaning that they may receive increasing carbon compensation costs. Only Chengkou County was classified as a basic recipient area; it showed a negative carbon compensation status and no significant change trend, making it an important recipient of carbon compensation costs. In Chongqing, no county was classified as a transfer payment area or transfer recipient area, indicating that no county was trying to switch between the status of payment and receipt. As a result, all 38 counties in Chongqing were divided into four types, namely key payment areas, basic payment areas, key recipient areas, and basic recipient areas. The proportion of key payment areas is 39.47%, the proportion of basic payment areas is 13.16%, and these areas are distributed in the CUAC, NACCP, and NEC regions. The key recipient area and basic recipient area accounted for 44.74% and 2.63%, respectively, and were mainly distributed in the NACCP, NEC, and SEC regions.

4. Discussion

4.1. Reliability of Carbon Budget Capacity

In this study, for the purpose of carbon compensation, only major anthropogenic carbon emissions and terrestrial ecosystem carbon sequestration were included in the accounting. There are few studies on the carbon budgets of Chongqing, and its carbon emissions are controversial. For example, Cao and Yuan calculated direct and indirect carbon emissions from land uses in Chongqing; the total in 2015 was only approximately 705 × 104 t C [36]. Additionally, Wang et al. calculated 2015 carbon emissions of approximately 1216 × 104 t based on a similar approach [44]. Shan et al. calculated China’s energy-related sectoral approach emissions, which were approximately 4890 × 104 t C for Chongqing in 2015 [45]. Because of the greater uncertainty in the land use data used in the calculation, the results based on the energy statistical method were considered more reliable. In this study, the calculated carbon emissions of Chongqing in 2015 were 4201.16 × 104 t C, which was close to the results obtained by Shan et al., but we established a newer and more complete continuous dataset based on annual data. In contrast, the results of carbon sequestration in Chongqing, which is dominated by the NEP, are more certain. Han and Liu harmonized flux sites with remote sensing products and meteorological data to establish long-term series of NEP datasets [46]. Although the calculation method is different from ours, the verification results for various counties in 2002, 2011, and 2020, as shown in Figure 12, still reveal a positive and significant correlation (R2 = 0.813 and p < 0.05). A comparison of the existing studies confirmed that our calculation of Chongqing’s carbon budget capacity was reliable and had advantages in terms of parameter localization and data integrity, which was sufficient to support the subsequent analysis of carbon compensation.

4.2. The Coordination of Carbon Compensation with Regional Development

Similar to other urbanized regions [26,47], Chongqing’s total carbon emission is greater than its carbon sequestration, with an annual carbon deficit of 556.24 × 10⁴~3621.58 × 104 t; this means that carbon sequestration, mainly from terrestrial ecosystems, offsets about 40.37% of the anthropogenic carbon emissions, which is higher than the global average (33.69%) over the same period [48,49,50] and is also high in China [51]. This is because there are differences in carbon budgets at the county level, as 71.05% of the counties always have deficits; 21.05% switch between deficits and surpluses; and 7.89% always have surpluses. Within Chongqing Municipality, the vast southeast and northeast regions provided more carbon sequestration than other areas, the preferentially developed urban and surrounding regions produced carbon emissions exceeding twice the sequestration, also reflecting more complex regional inequalities [8,52].
Establishing a lateral compensation mechanism between unequal regions is an important way to promote sustainable development [53], but case studies of inter-regional carbon compensation in China are inadequate. We quantified the annual carbon deficit and carbon compensation costs of Chongqing since 2000, compared the differences among counties, and enriched the understanding of regional carbon compensation. Furthermore, to test the coordination function of carbon compensation on coordinating regional development [25], we analyzed the change in the share of each county in Chongqing’s GDP after including carbon compensation costs. As shown in Figure 13, the change in the GDP share of the CUAC region with a higher economic level after compensation was always less than 0, which means that the region continued to pay compensation. In contrast, the changes in the GDP shares of the SEC and NEC regions with ecological resource advantages after compensation were always greater than 0, which means that they continued to receive compensation. In brief, carbon compensation can play an effective coordinating role in regional development.

4.3. The Contributions of the Carbon Compensation Zoning Scheme

Carbon compensation can balance regional inequalities and promote the goal of reducing emissions and increasing sequestration [8,54,55]. In practical application, a comprehensive zoning scheme is indispensable for supporting the formulation of differentiated low-carbon development strategies [26]. The formulation of regional development strategies requires not only assessing the present situation but also considering development trends [56,57,58]. The few studies conducted on the carbon compensation zoning scheme [25,26] generally consider only the economic costs at the provincial or city level and lack detailed consideration of the changing trend. However, the changing trend implies the efforts of counties in carbon management, and only when their contributions are comprehensively considered can the incentive role of the compensation mechanism be better played, which is conducive to reducing the pressure of low-carbon transition in high-carbon emission counties and avoiding those high-carbon absorption counties (which are usually low-income counties) from falling into a new “resource curse” [59,60].
To address these deficiencies, we constructed a zoning scheme based on the present situation and trend analysis of county-level carbon compensation costs. In the case of Chongqing, 15 counties were classified as key payment areas, 5 counties were classified as basic payment areas, 17 counties were classified as key recipient areas, and only 1 county was classified as basic recipient areas. In general, the type of county that pays or receives compensation has been relatively clear, and there was no county switching to the opposite type, which may be related to China’s persistence in implementing the main functional areas planning [61]. Attention has been given to formulating differentiated development policies according to the resource and environmental conditions of counties, and Chongqing has also launched a development plan called “One district and two groups” [62]; that is, on the one hand, focus on the development of the main city metropolitan areas, including the CUAC and NACCP. On the other hand, focus on the ecological functional area protection and urban–rural integration development, including the SEC and NEC. The results of carbon compensation zoning in this study are consistent with those of existing planning schemes and further quantify compensation costs. Therefore, they can provide support for the implementation, management, and dynamic adjustment of relevant planning in Chongqing. For example, extracting the corresponding amount of tax transfers from key payment areas and basic payment areas to key recipient areas and basic recipient areas, as well as encouraging cooperation in industrial transfer, environmental protection, eco-product development, etc., based on the complementarity between key payment areas and key recipient areas, which will be conducive to coordinating the promotion of China’s carbon neutrality target [11,63,64].

4.4. Problem Statement and Future Work

Structural and parametric uncertainties are prevalent in carbon budget estimation models [65,66,67]. To construct continuous carbon emission and carbon sequestration datasets, we compromised the spatial resolution and introduced some parameters of previous studies, which may have limited the accuracy of accounting for carbon compensation costs. Nevertheless, the framework proposed in this study can be adapted to diverse datasets. In the future, we intend to explore the use of new observational data and downscaling methods to improve the estimation accuracy [68,69,70] and further carry out sensitivity analysis and driving factors research to further optimize the estimation method, resulting in more reliable carbon compensation solutions for regional planning and coordinated management applications.

5. Conclusions

A scientific and comprehensive zoning scheme can support the carbon compensation mechanism to better play an incentive role and guide regions to reduce carbon emissions or increase carbon sequestration, which is of great significance to the formation of a sustainable development model. At the county level, taking Chongqing Municipality as an example, we accounted for the annual carbon emission/sequestration capacity from 2000 to 2021, revealed the regional differences in carbon budgets at the county level, proposed a novel zoning scheme that takes into account the present situation and trend of carbon compensation costs, and zoned each county into different carbon compensation types.
The main conclusions were as follows: (1) Chongqing’s carbon emissions have always been higher than its carbon sequestration, and both have shown a general growth trend. Chongqing’s terrestrial ecosystem offsets about 40.37% of the anthropogenic carbon emissions but is still a long way from achieving carbon neutrality. (2) There were large regional differences in the carbon budget among counties; although many counties in the CUAC and NACCP regions maintained their carbon deficits, counties from NEC and SEC regions provided more carbon sequestration than other areas, and it is this regional difference that provided both the possibility and the necessity of carbon compensation. (3) A new carbon compensation zoning framework was proposed and tested, and Chongqing’s counties were zoned into four carbon compensation types based on their present situation and trends as follows: key payments, basic payments, key recipient areas, and basic recipient areas. When implementing the inter-regional carbon compensation mechanism in the future, the former two should be the sources of carbon compensation costs, and the latter two should be the recipients of costs.
In general, a quantitative estimation and detailed analysis of the carbon budgets in Chongqing was completed, and a novel framework for inter-regional carbon compensation zoning was proposed. The research results can provide a scientific solution for China’s further exploration of local regional carbon compensation regulations and systems and can promote achieving China’s carbon peak in 2030 and carbon neutrality in 2060 through local initiatives.

Author Contributions

Conceptualization, R.Y., X.J. and Z.M.; methodology, X.J. and F.R.; software, L.Y. and H.Z. (Hongwei Zhang); writing—review and editing, R.Y.; supervision, Z.M.; project administration, H.Z. (Hongwen Zhou); funding acquisition, X.Z. All authors have read and agreed to the published version of the manuscript.

Funding

This research was funded by the Chongqing Natural Science Foundation Postdoctoral Project, grant number CSTB2023NSCQ-BHX0062.

Data Availability Statement

The data presented in this study are available on request from the corresponding author. The data are not publicly available due to the public as the team’s follow-up study is still pending.

Conflicts of Interest

The authors declare no conflicts of interest.

References

  1. Huo, J.; Meng, J.; Zheng, H.; Parikh, P.; Guan, D. Achieving decent living standards in emerging economies challenges national mitigation goals for CO2 emissions. Nat. Commun. 2023, 14, 6342. [Google Scholar] [CrossRef] [PubMed]
  2. Pan, H.; Page, J.; Shi, R.; Cong, C.; Cai, Z.; Barthel, S.; Thollander, P.; Colding, J.; Kalantari, Z. Contribution of prioritized urban nature-based solutions allocation to carbon neutrality. Nat. Clim. Chang. 2023, 13, 862–870. [Google Scholar] [CrossRef]
  3. Sonter, L.J.; Simmonds, J.S.; Watson, J.E.M.; Jones, J.P.G.; Kiesecker, J.M.; Costa, H.M.; Bennun, L.; Edwards, S.; Grantham, H.S.; Griffiths, V.F.; et al. Local conditions and policy design determine whether ecological compensation can achieve No Net Loss goals. Nat. Commun. 2020, 11, 2072. [Google Scholar] [CrossRef]
  4. Shang, W.; Gong, Y.; Wang, Z.; Stewardson, M.J. Eco-compensation in China: Theory, practices and suggestions for the future. J. Environ. Manag. 2018, 210, 162–170. [Google Scholar] [CrossRef]
  5. Su, K.; Sun, X.; Guo, H.; Long, Q.; Li, S.; Mao, X.; Niu, T.; Yu, Q.; Wang, Y.; Yue, D. The establishment of a cross-regional differentiated ecological compensation scheme based on the benefit areas and benefit levels of sand-stabilization ecosystem service. J. Clean. Prod. 2020, 270, 122490. [Google Scholar] [CrossRef]
  6. Luo, K.; Wang, H.; Ma, C.; Wu, C.; Zheng, X.; Xie, L. Carbon sinks and carbon emissions balance of land use transition in Xinjiang, China: Differences and compensation. Sci. Rep. 2022, 12, 22456. [Google Scholar] [CrossRef]
  7. Quan, T.; Zhang, H.; Li, J.; Lu, B. Horizontal ecological compensation mechanism and green low-carbon development in river basins: Evidence from Xin’an River basin. Environ. Sci. Pollut. Res. 2023, 30, 88463–88480. [Google Scholar] [CrossRef]
  8. Xia, M.; Chuai, X.; Xu, H.; Cai, H.H.; Xiang, A.; Lu, J.; Zhang, F.; Li, M. Carbon deficit checks in high resolution and compensation under regional inequity. J. Environ. Manag. 2023, 328, 116986. [Google Scholar] [CrossRef]
  9. Zhang, Y.; Yu, Z.; Zhang, J.; Zhang, W. Study on the initial carbon quota allocation and spatial balance compensation strategy at the provincial level in China. Environ. Sci. Pollut. Res. 2023, 30, 67150–67173. [Google Scholar] [CrossRef]
  10. Li, D.; Cao, L.; Zhou, Z.; Zhao, K.; Du, Z.; Chen, Y. Correlating CO2 emissions of cities with the inter-city carbon compensation mechanism: A regional perspective in the middle reaches of the Yangtze River (MRYR), China. Environ. Dev. Sustain. 2023, 26, 9185–9216. [Google Scholar] [CrossRef]
  11. Zhao, R.; Liu, Y.; Li, Y.; Ding, M.; Zhang, Z.; Chuai, X.; Jiao, S. Overview of regional carbon compensation: Mechanism, pattern and policy suggestions. Areal Res. Dev. 2015, 34, 116–120. (In Chinese) [Google Scholar]
  12. Chen, J.; Wu, S.; Zhang, L. Spatiotemporal variation of per capita carbon emissions and carbon compensation zoning in Chinese counties. Land 2023, 12, 1796. [Google Scholar] [CrossRef]
  13. Yang, G.; Shang, P.; He, L.; Zhang, Y.; Wang, Y.; Zhang, F.; Zhu, L.; Wang, Y. Interregional carbon compensation cost forecast and priority index calculation based on the theoretical carbon deficit: China as a case. Sci. Total Environ. 2019, 654, 786–800. [Google Scholar] [CrossRef]
  14. Zhai, T.; Wu, L.; Chen, Y.; Nazir, M.F.; Chang, M.; Ma, Y.; Cai, E.; Ding, G.; Zhao, C.; Li, L.; et al. Ecological compensation in the context of carbon neutrality: A case involving service production-transmission and distribution-service consumption. Land 2022, 11, 2321. [Google Scholar] [CrossRef]
  15. Ma, X.; Yang, J.; Sun, D.; Zhang, R.; Xiao, X.; Xia, J. Fine allocation of sectoral carbon emissions at block scale and contribution of functional zones. Ecol. Inform. 2023, 78, 102293. [Google Scholar] [CrossRef]
  16. Miao, Y.; Kong, C.; Wang, L.; Mu, J.; Lu, X.; Bao, J.; Li, H. A provincial lateral carbon emissions compensation plan in China based on carbon budget perspective. Sci. Total Environ. 2019, 692, 1086–1096. [Google Scholar] [CrossRef]
  17. Long, Z.; Zhang, Z.; Liang, S.; Chen, X.; Ding, B.; Wang, B.; Chen, Y.; Sun, Y.; Li, S.; Yang, T. Spatially explicit carbon emissions at the county scale. Resour. Conserv. Recycl. 2021, 173, 105706. [Google Scholar] [CrossRef]
  18. Fan, M.; Wang, Z.; Xue, Z. Spatiotemporal evolution characteristics, influencing factors of land use carbon emissions, and low-carbon development in Hubei Province, China. Ecol. Inform. 2024, 81, 102567. [Google Scholar] [CrossRef]
  19. Zhang, Y.; Quan, J.; Kong, Y.; Wang, Q.; Zhang, Y.; Zhang, Y. Research on the fine-scale spatial-temporal evolution characteristics of carbon emissions based on nighttime light data: A case study of Xi’an city. Ecol. Inform. 2024, 79, 102454. [Google Scholar] [CrossRef]
  20. Xu, F.; Zheng, X.; Zheng, M.; Liu, D.; Ma, Y.; Wang, T.; Han, X. Fine mapping and multidimensional analysis of carbon emission reduction in China. Front. Ecol. Evol. 2023, 11, 1163308. [Google Scholar] [CrossRef]
  21. Gaughan, A.E.; Oda, T.; Sorichetta, A.; Stevens, F.R.; Bondarenko, M.; Bun, R.; Krauser, L.; Yetman, G.; Nghiem, S.V. Evaluating nighttime lights and population distribution as proxies for mapping anthropogenic CO2 emission in Vietnam, Cambodia and Laos. Environ. Res. Commun. 2019, 1, 091006. [Google Scholar] [CrossRef] [PubMed]
  22. Zeng, J.; Zhou, T.; Wang, Q.; Xu, Y.; Lin, Q.; Zhang, Y.; Wu, X.; Zhang, J.; Liu, X. Spatial patterns of China’s carbon sinks estimated from the fusion of remote sensing and field-observed net primary productivity and heterotrophic respiration. Ecol. Inform. 2023, 76, 102152. [Google Scholar] [CrossRef]
  23. Chuai, X.; Qi, X.; Zhang, X.; Li, J.; Yuan, Y.; Guo, X.; Huang, X.; Park, S.; Zhao, R.; Xie, X.; et al. Land degradation monitoring using terrestrial ecosystem carbon sinks/sources and their response to climate change in China. Land. Degrad. Dev. 2018, 29, 3489–3502. [Google Scholar] [CrossRef]
  24. Zhang, D.; Zhao, Y.; Wu, J. Assessment of carbon balance attribution and carbon storage potential in China’s terrestrial ecosystem. Resour. Conserv. Recycl. 2023, 189, 106748. [Google Scholar] [CrossRef]
  25. Wang, W.; Wang, W.; Xie, P.; Zhao, D. Spatial and temporal disparities of carbon emissions and interregional carbon compensation in major function-oriented zones: A case study of Guangdong province. J. Clean. Prod. 2020, 245, 118873. [Google Scholar] [CrossRef]
  26. Xia, S.; Yang, Y. Examining spatio-temporal variations in carbon budget and carbon compensation zoning in Beijing-Tianjin-Hebei urban agglomeration based on major functional zones. J. Geogr. Sci. 2022, 32, 1911–1934. [Google Scholar] [CrossRef]
  27. Yang, Z.; Zhang, X.; Hu, X.; Zhou, X. Spatial-temporal evolution of agricultural carbon balance at township scale and carbon compensation zoning: A case study of Guangshui City, Hubei Province. Land 2024, 13, 820. [Google Scholar] [CrossRef]
  28. Gilfillan, D.; Marland, G. CDIAC-FF: Global and national CO2 emissions from fossil fuel combustion and cement manufacture: 1751–2017. Earth Syst. Sci. Data 2021, 13, 1667–1680. [Google Scholar] [CrossRef]
  29. Nangini, C.; Peregon, A.; Ciais, P.; Weddige, U.; Vogel, F.; Wang, J.; Bréon, F.-M.; Bachra, S.; Wang, Y.; Gurney, K.; et al. A global dataset of CO2 emissions and ancillary data related to emissions for 343 cities. Sci. Data 2019, 6, 180280. [Google Scholar] [CrossRef]
  30. Ye, X.; Chuai, X. Carbon sinks/sources’ spatiotemporal evolution in China and its response to built-up land expansion. J. Environ. Manag. 2022, 321, 115863. [Google Scholar] [CrossRef]
  31. Yue, D.; Sarkar, A.; Cui, Y.; Qian, L.; Minjuan, Z.; Das, J.C. Ecological compensation of grain trade within urban, rural areas and provinces in China: A prospect of a carbon transfer mechanism. Environ. Dev. Sustain. 2021, 23, 16688–16712. [Google Scholar] [CrossRef]
  32. Yang, C.; Zeng, W.; Yang, X. Coupling coordination evaluation and sustainable development pattern of geo-ecological environment and urbanization in Chongqing municipality, China. Sustain. Cities Soc. 2020, 61, 102271. [Google Scholar] [CrossRef]
  33. He, H.; Ren, Y.; Shen, L.; Xiao, J.; Lai, Y.; Yang, Y.; Zhang, L. A guiding methodology for “urban physical examination”: Indicator checklist, benchmark setting and empirical study. Sustain. Cities Soc. 2023, 98, 104835. [Google Scholar] [CrossRef]
  34. Zhang, Z.; Liu, J.; Wang, C.; Zhao, Y.; Zhao, X.; Li, P.; Sha, D. A spatial projection pursuit model for identifying comprehensive urban vitality on blocks using multisource geospatial data. Sustain. Cities Soc. 2024, 100, 104998. [Google Scholar] [CrossRef]
  35. Lin, T.; Ge, R.; Zhao, Q.; Zhang, G.; Li, X.; Ye, H.; Liao, J.; Yin, K. Dynamic changes of a city’s carbon balance and its influencing factors: A case study in Xiamen, China. Carbon Manag. 2016, 7, 149–160. [Google Scholar] [CrossRef]
  36. Cao, W.; Yuan, X. Region-county characteristic of spatial-temporal evolution and influencing factor on land use-related CO2 emissions in Chongqing of China, 1997–2015. J. Clean. Prod. 2019, 231, 619–632. [Google Scholar] [CrossRef]
  37. Zhang, Y.; Dai, Y.; Chen, Y.; Ke, X. The study on spatial correlation of recessive land use transformation and land use carbon emission. China Land Sci. 2022, 36, 100–112. (In Chinese) [Google Scholar]
  38. Yu, G.; Zheng, Z.; Wang, Q.; Fu, Y.; Zhuang, J.; Sun, X.; Wang, Y. Spatiotemporal pattern of soil respiration of terrestrial ecosystems in China: The development of a geostatistical model and its simulation. Environ. Sci. Technol. 2010, 44, 6074–6080. [Google Scholar] [CrossRef]
  39. Airiken, M.; Li, S.; Abulaiti, A.; Wang, Y.; Zhang, L. Prediction of extreme climate on the Tibetan Plateau based on NEX-GDDP-CMIP6. Hum. Ecol. Risk Assess. Int. J. 2023, 29, 2260493. [Google Scholar] [CrossRef]
  40. Mancino, G.; Console, R.; Greco, M.; Iacovino, C.; Trivigno, M.L.; Falciano, A. Assessing vegetation declinedue to pollution from solid waste management by a multitemporal remote sensing approach. Remote Sens. 2022, 14, 428. [Google Scholar] [CrossRef]
  41. Mehmood, K.; Anees, S.A.; Rehman, A.; Pan, S.a.; Tariq, A.; Zubair, M.; Liu, Q.; Rabbi, F.; Khan, K.A.; Luo, M. Exploring spatiotemporal dynamics of NDVI and climate-driven responses in ecosystems: Insights for sustainable management and climate resilience. Ecol. Inform. 2024, 80, 102532. [Google Scholar] [CrossRef]
  42. Habeeb, R.; Almazah, M.M.A.; Hussain, I.; Al-Ansari, N.; Al-Rezami, A.Y.; Sammen, S.S. Modified standardized precipitation evapotranspiration index: Spatiotemporal analysis of drought. Geomat. Nat. Hazards Risk 2023, 14, 2195532. [Google Scholar] [CrossRef]
  43. Salman, S.A.; Shahid, S.; Ismail, T.; Chung, E.-S.; Al-Abadi, A.M. Long-term trends in daily temperature extremes in Iraq. Atmos. Res. 2017, 198, 97–107. [Google Scholar] [CrossRef]
  44. Wang, H.; He, Y.; Shi, W.; Zeng, W.; He, Y. Spatiotemporal spillover effect and efficiency of carbon emissions from land use in China. Environ. Dev. Sustain. 2024, 26, 8915–8953. [Google Scholar] [CrossRef]
  45. Shan, Y.; Guan, D.; Zheng, H.; Ou, J.; Li, Y.; Meng, J.; Mi, Z.; Liu, Z.; Zhang, Q. China CO2 emission accounts 1997–2015. Sci. Data 2018, 5, 170201. [Google Scholar] [CrossRef]
  46. Han, Q.; Liu, L. Upscaling Tower-Based Net Ecosystem Productivity to global 250m using the Data Augmentation Method by Considering their Spatial Distribution. Zenodo 2024. [Google Scholar] [CrossRef]
  47. Song, H.; Li, Y.; Gu, L.; Tang, J.; Zhang, X. Spatiotemporal pattern of carbon compensation potential and network association in urban agglomerations in the Yellow River Basin. ISPRS Int. J. Geo-Inf. 2023, 12, 435. [Google Scholar] [CrossRef]
  48. Friedlingstein, P.; Jones, M.W.; O’Sullivan, M.; Andrew, R.M.; Bakker, D.C.E.; Hauck, J.; Le Quéré, C.; Peters, G.P.; Peters, W.; Pongratz, J.; et al. Global carbon budget 2021. Earth Syst. Sci. Data 2022, 14, 1917–2005. [Google Scholar] [CrossRef]
  49. Friedlingstein, P.; O’Sullivan, M.; Jones, M.W.; Andrew, R.M.; Gregor, L.; Hauck, J.; Le Quéré, C.; Luijkx, I.T.; Olsen, A.; Peters, G.P.; et al. Global carbon budget 2022. Earth Syst. Sci. Data 2022, 14, 4811–4900. [Google Scholar] [CrossRef]
  50. Friedlingstein, P.; O’Sullivan, M.; Jones, M.W.; Andrew, R.M.; Hauck, J.; Olsen, A.; Peters, G.P.; Peters, W.; Pongratz, J.; Sitch, S.; et al. Global carbon budget 2020. Earth Syst. Sci. Data 2020, 12, 3269–3340. [Google Scholar] [CrossRef]
  51. Wei, W.; Hao, R.; Ma, L.; Xie, B.; Zhou, L.; Zhou, J. Characteristics of carbon budget based on energy carbon emissions and vegetation carbon absorption. Environ. Monit. Assess. 2024, 196, 134. [Google Scholar] [CrossRef] [PubMed]
  52. Li, L.; Liu, L.; Gu, Z.; Sun, Z.; Zhang, Q. Examining the relationships between carbon emissions and land supply in China. Ecol. Inform. 2022, 70, 101744. [Google Scholar] [CrossRef]
  53. Yang, W.; Ma, H.; Yao, L. A study case of China on inter-regional carbon compensation from the perspective of carbon neutrality. World Dev. Sustain. 2023, 2, 100049. [Google Scholar] [CrossRef]
  54. Chen, H.; Wang, E.; Song, T.; Wang, Y.; Ye, Z. Four-quadrant modelling of carbon inequality in international trade and accounting for carbon compensation. Carbon Manag. 2024, 15, 2311655. [Google Scholar] [CrossRef]
  55. Wu, C.; Lu, R.; Zhang, P.; Dai, E. Multilevel ecological compensation policy design based on ecosystem service flow: A case study of carbon sequestration services in the Qinghai-Tibet Plateau. Sci. Total Environ. 2024, 921, 171093. [Google Scholar] [CrossRef]
  56. Brand, F.S.; Seidl, R.; Le, Q.B.; Brändle, J.M.; Scholz, R.W. Constructing consistent multiscale scenarios by transdisciplinary processes: The case of mountain regions facing global change. Ecol. Soc. 2013, 18, 43. [Google Scholar] [CrossRef]
  57. Kohler, M.; Stotten, R.; Steinbacher, M.; Leitinger, G.; Tasser, E.; Schirpke, U.; Tappeiner, U.; Schermer, M. Participative spatial scenario analysis for alpine ecosystems. Environ. Manag. 2017, 60, 679–692. [Google Scholar] [CrossRef]
  58. Loibl, W.; Walz, A. Generic regional development strategies from local stakeholders’ scenarios—The Montafon experience. Ecol. Soc. 2010, 15, 3. [Google Scholar] [CrossRef]
  59. Auty, R.M. Natural resources, capital accumulation and the resource curse. Ecol. Econ. 2007, 61, 627–634. [Google Scholar] [CrossRef]
  60. Davis, G.A.; Tilton, J.E. The resource curse. Nat. Resour. Forum 2005, 29, 233–242. [Google Scholar] [CrossRef]
  61. Xia, H.; Zhang, W.; He, L.; Ma, M.; Peng, H.; Li, L.; Ke, Q.; Hang, P.; Wang, X. Assessment on China’s urbanization after the implementation of main functional areas planning. J. Environ. Manag. 2020, 264, 110381. [Google Scholar] [CrossRef] [PubMed]
  62. Chongqing Planning and Natural Resources Bureau (CPNRB). Announcement on Public Solicitation of Opinions and Suggestions on the Master Plan of Chongqing Territorial Space (2021–2035). Available online: https://www.cq.gov.cn/zwgk/zfxxgkml/zdjcygk/zdjcyjzj/202105/t20210527_11479457.html (accessed on 29 November 2023).
  63. Chen, B.; Chen, F.; Ciais, P.; Zhang, H.; Lü, H.; Wang, T.; Chevallier, F.; Liu, Z.; Yuan, W.; Peters, W. Challenges to achieve carbon neutrality of China by 2060: Status and perspectives. Sci. Bull. 2022, 67, 2030–2035. [Google Scholar] [CrossRef]
  64. Hsu, C.-C.; Zhang, Y.; Ch, P.; Aqdas, R.; Chupradit, S.; Nawaz, A. A step towards sustainable environment in China: The role of eco-innovation renewable energy and environmental taxes. J. Environ. Manag. 2021, 299, 113609. [Google Scholar] [CrossRef] [PubMed]
  65. Jones, C.D.; Friedlingstein, P. Quantifying process-level uncertainty contributions to TCRE and carbon budgets for meeting Paris Agreement climate targets. Environ. Res. Lett. 2020, 15, 074019. [Google Scholar] [CrossRef]
  66. Mengis, N.; Partanen, A.-I.; Jalbert, J.; Matthews, H.D. 1.5 °C carbon budget dependent on carbon cycle uncertainty and future non-CO2 forcing. Sci. Rep. 2018, 8, 5831. [Google Scholar] [CrossRef]
  67. O’Neill, B.C.; Melnikov, N.B. Learning about parameter and structural uncertainty in carbon cycle models. Clim. Chang. 2008, 89, 23–44. [Google Scholar] [CrossRef]
  68. Malone, B.P.; Styc, Q.; Minasny, B.; McBratney, A.B. Digital soil mapping of soil carbon at the farm scale: A spatial downscaling approach in consideration of measured and uncertain data. Geoderma 2017, 290, 91–99. [Google Scholar] [CrossRef]
  69. Niu, J.Y.; Wu, J.Y.; Qin, W.M.; Wang, L.C.; Yang, C.; Zhang, M.; Zhang, Y.J.; Qi, Q.H. Projection of future carbon benefits by photovoltaic power potential in China using CMIP6 statistical downscaling data. Environ. Res. Lett. 2023, 18, 4013. [Google Scholar] [CrossRef]
  70. Wang, J.; Wei, J.; Zhang, W.; Liu, Z.; Du, X.; Liu, W.; Pan, K. High-resolution temporal and spatial evolution of carbon emissions from building operations in Beijing. J. Clean. Prod. 2022, 376, 134272. [Google Scholar] [CrossRef]
Figure 1. Overview of the study area. (a) Location of Chongqing in China; (b) the administrative division and functional division of Chongqing Municipality.
Land 13 01495 g001
Figure 2. Flowchart illustrating the methodology process.
Land 13 01495 g002
Figure 3. Carbon compensation zoning schemes for each county.
Land 13 01495 g003
Figure 4. Spatiotemporal distribution of carbon emissions in Chongqing from 2000 to 2022. (a) The spatial distribution of average carbon emission density; (b) the annual distribution of total carbon emissions.
Land 13 01495 g004
Figure 5. Carbon emission statistics at the county level.
Land 13 01495 g005
Figure 6. Spatiotemporal distribution of carbon sequestration in Chongqing from 2000 to 2022. (a) The spatial distribution of average carbon sequestration density; (b) the annual distribution of total carbon sequestration.
Land 13 01495 g006
Figure 7. Carbon sequestration statistics at the county level.
Land 13 01495 g007
Figure 8. Comparison of total carbon emissions, carbon sequestration, and carbon deficits in Chongqing.
Land 13 01495 g008
Figure 9. Distribution of carbon deficits by county from 2000 to 2021. For each boxplot, the boxes display the first quartile, median, and third quartile, the black dots represent the mean values, and whiskers represent the values of Q25 − 1.5*(Q75 − Q25) and Q75 + 1.5*(Q75 − Q25).
Land 13 01495 g009
Figure 10. Distribution of carbon compensation costs by county from 2000 to 2021. For each boxplot, the boxes display the first quartile, median, and third quartile, the black dots represent the mean values, and whiskers represent the values of Q25 − 1.5*(Q75 − Q25) and Q75 + 1.5*(Q75 − Q25).
Land 13 01495 g010
Figure 11. Present situation and trend analysis of carbon compensation costs in each county. (a) Average carbon compensation cost in the past three years; (b) Theil–Sen (TS) median index and Mann–Kendall (MK) test of carbon compensation costs from 2000 to 2021.
Land 13 01495 g011
Figure 12. The NEP data obtained in the study were validated for 2001, 2011, and 2020. Taking 2001, 2010, and 2021 as validation, our results are significantly correlated with the NEP dataset calculated by Han and Liu (R2 = 0.813, p < 0.05).
Land 13 01495 g012
Figure 13. The changes in the share of GDP after compensation. After compensation, the GDP share of the economically advantaged-CUAC region declined, while the GDP share of ecologically advantaged NEC and SEC regions rose.
Land 13 01495 g013
Table 1. Standard coal coefficient and carbon emission coefficient for converting the ten energy types.
Energy TypesRaw CoalCokeCrude OilGasolineKeroseneDiesel OilFuel OilLiquefied Petroleum GasNatural GasElectric Power
Standard coal coefficient0.71430.97141.42861.47141.47141.45711.42861.71431.21430.1229
Carbon-emission coefficient0.75590.85500.58570.55380.57140.59210.68150.50420.44830.7330
Table 2. Description and source of the dataset used in this study.
DataDescriptionSource
Energy consumptionCalculated the carbon emissions based on the consumption of 10 major energy sourcesNational Bureau of Statistics of China (http://www.stats.gov.cn)
PopulationSupports demographic statistics, carbon emission calculation, and spatial distribution simulationOak Ridge National Laboratory (https://landscan.ornl.gov)
Net primary production (NPP)Carbon sequestration calculationNASA Earth Observation Data
(https://www.earthdata.nasa.gov)
TemperatureSoil respiration calculationNational Earth System Science Data Center (http://auth.geodata.cn)
PrecipitationSoil respiration calculationNational Earth System Science Data Center (http://auth.geodata.cn)
SOCSoil respiration calculationA dataset of carbon density in Chinese terrestrial ecosystems (2010s) (http://www.csdata.org)
Land coverSOC spatializationThe 30 m annual land cover datasets and its dynamics in China from 1990 to 2021 (https://zenodo.org)
GDP and Engel coefficientCalculation of the carbon compensation costChongqing Bureau of Statistics (https://tjj.cq.gov.cn)
Carbon pricesExtract the highest and lowest trading pricesCarbon Trading Website (http://www.tanjiaoyi.com)
Table 3. Carbon compensation zoning of each county in Chongqing.
TypeCharacteristicsDistributionCounties
Key payment areaMean > 0, Ts > 0 and |Z| > 1.96Land 13 01495 i001Banan, Beibei, Bishan, Changshou, Dazu, Dianjiang, Jiangbei, Liangping, Nanan, Rongchang, Tongliang, Tongnan, Yongchuan, Yubei, Yuzhong
Transfer payment areaMean > 0, Ts < 0 and |Z| > 1.96NoneNone
Basic payment areaMean > 0, |Z| < 1.96Land 13 01495 i002Dadukou, Hechuan, Jiulongpo, Shapingba, Zhong
Key recipient areaMean < 0, Ts < 0 and |Z| > 1.96Land 13 01495 i003Fengdu, Fengjie, Fuling, Jiangjin, Kaizhou, Nanchuan, Pengshui, Qianjiang, Qijiang, Shizhu, Wanzhou, Wulong, Wushan, Wuxi, Xiushan, Youyang, Yunyang
Transfer recipient areaMean < 0, Ts > 0 and |Z| > 1.96NoneNone
Basic recipient areaMean > 0, |Z| < 1.96Land 13 01495 i004Chengkou
Disclaimer/Publisher’s Note: The statements, opinions and data contained in all publications are solely those of the individual author(s) and contributor(s) and not of MDPI and/or the editor(s). MDPI and/or the editor(s) disclaim responsibility for any injury to people or property resulting from any ideas, methods, instructions or products referred to in the content.

