

Spatio-Temporal Characteristics and Driving Mechanisms of Urban Expansion in the Central Yunnan Urban Agglomeration


Abstract
1. Introduction
2. Materials and Methods
2.1. Study Area
2.2. Data Source
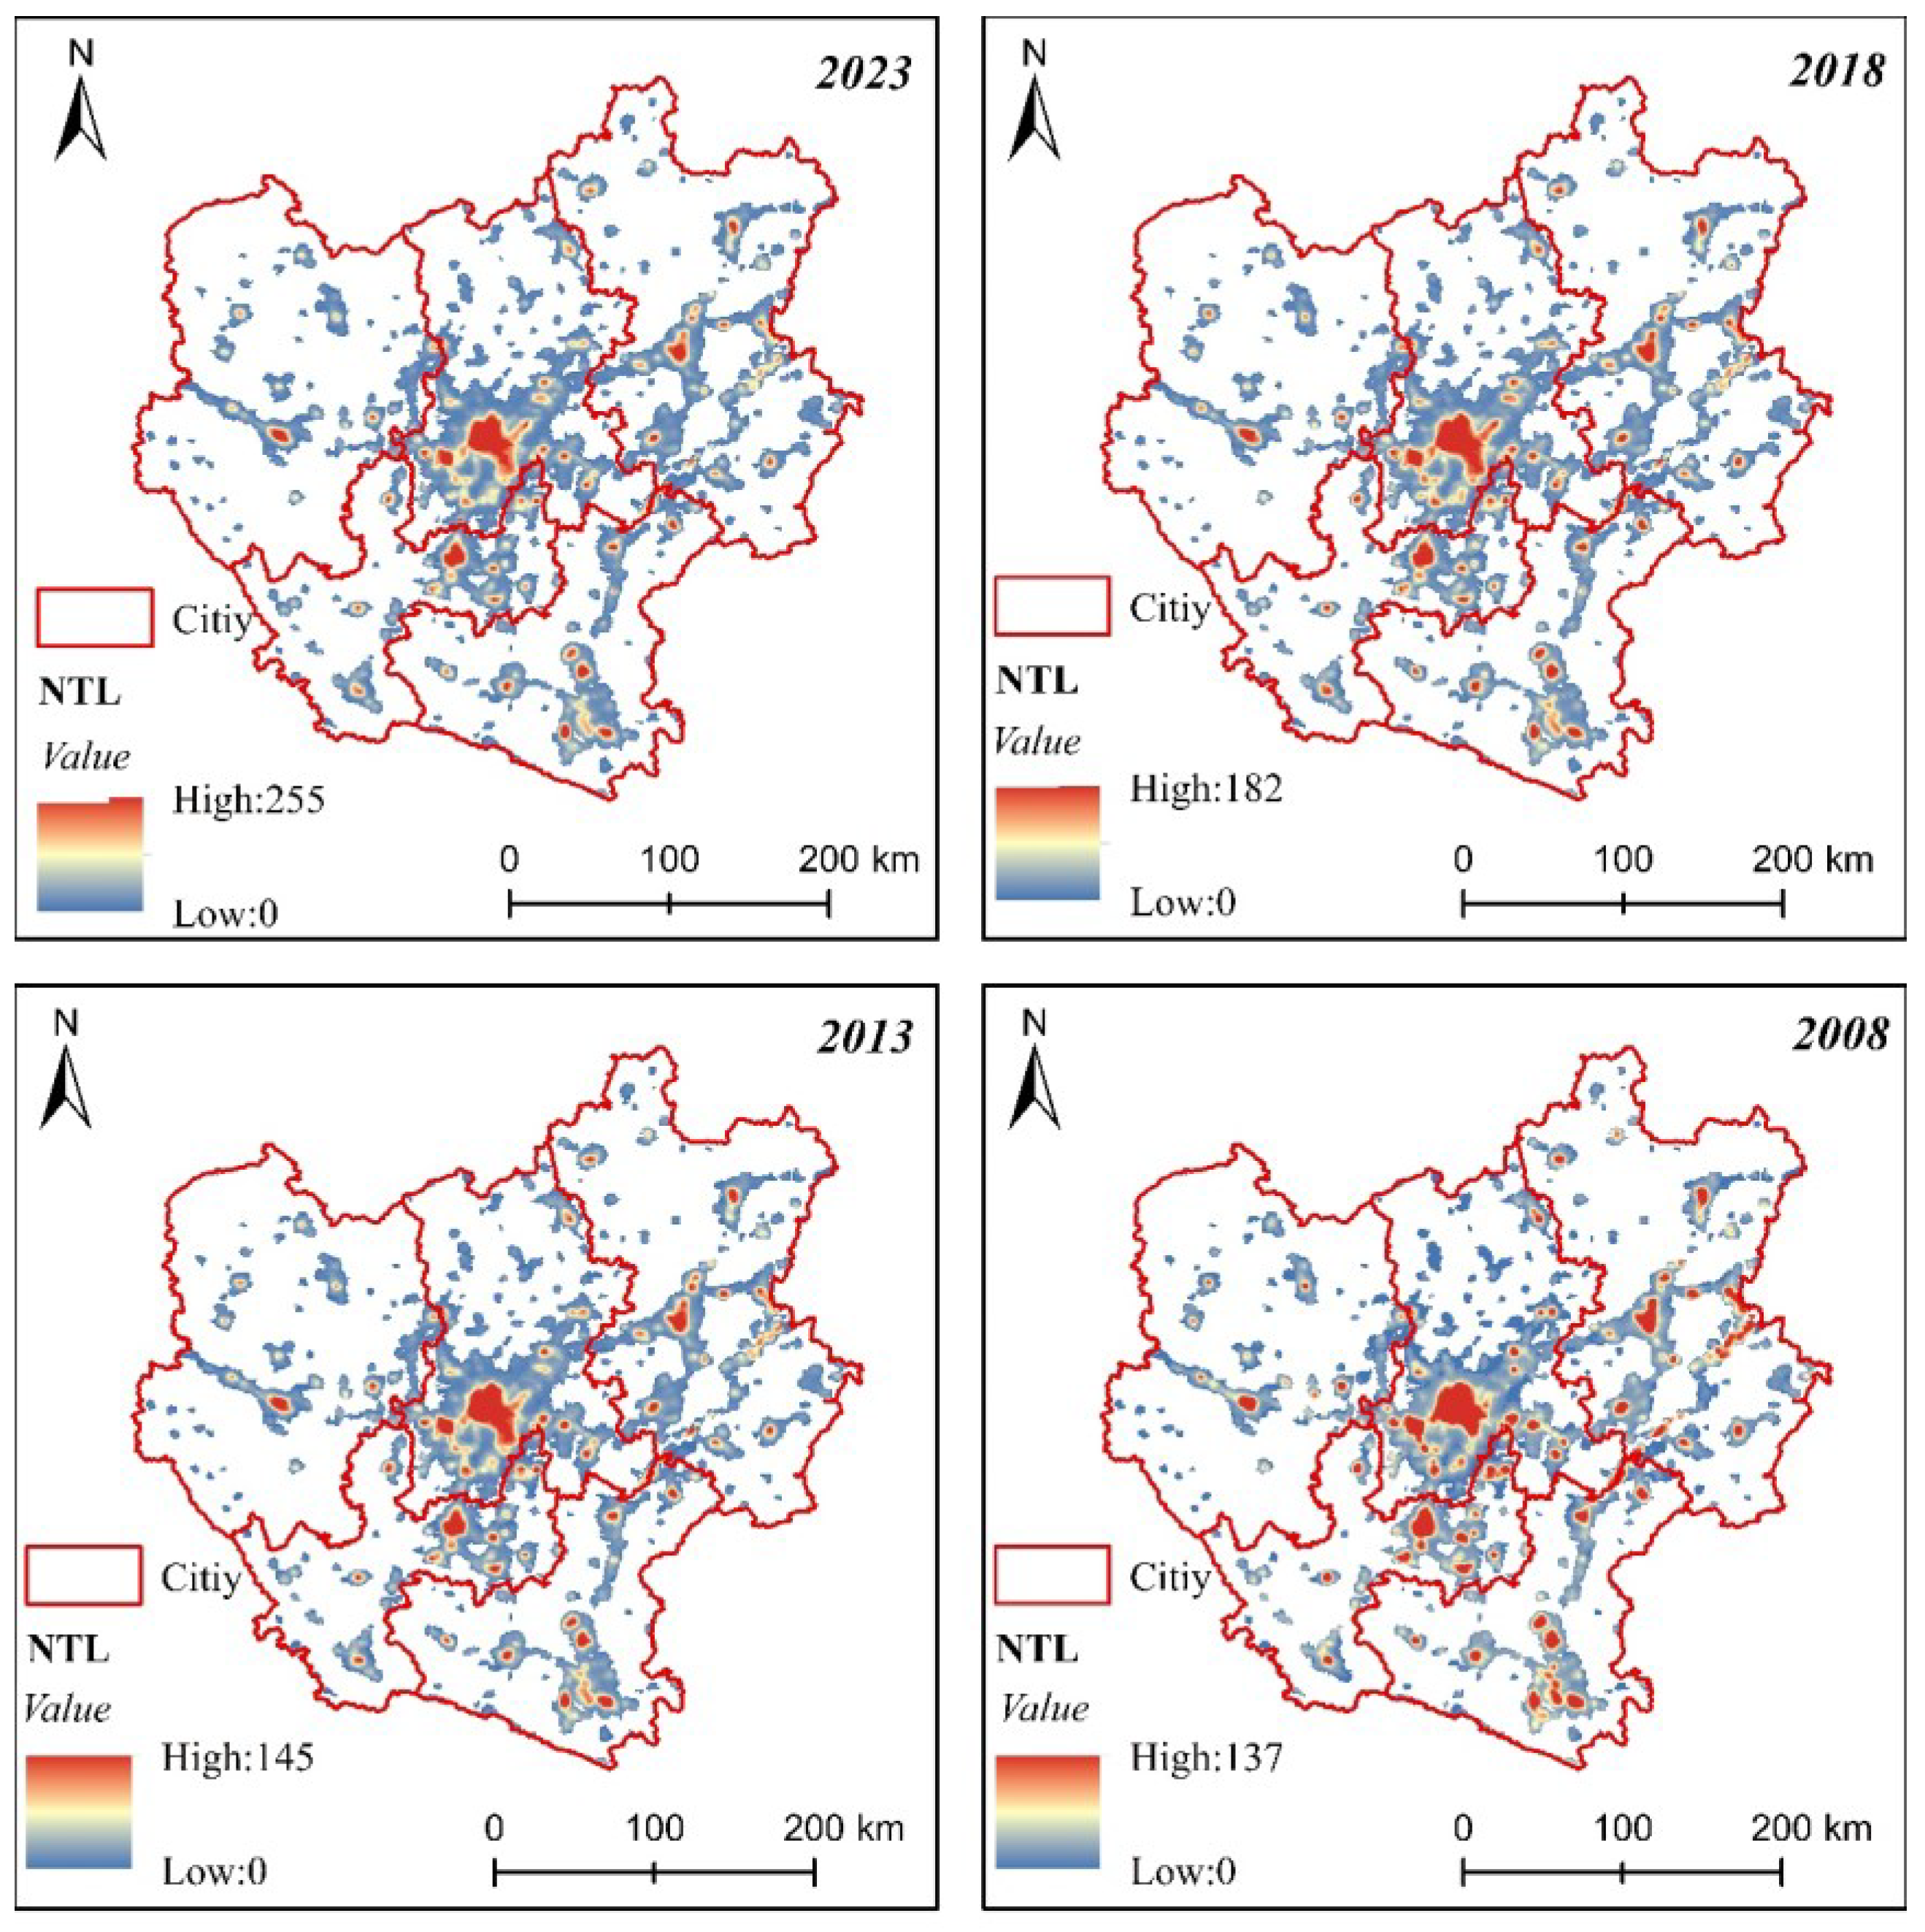
2.2.1. NTL Data
2.2.2. LandScan Data
2.3. Methods
2.3.1. Rank Size Rule
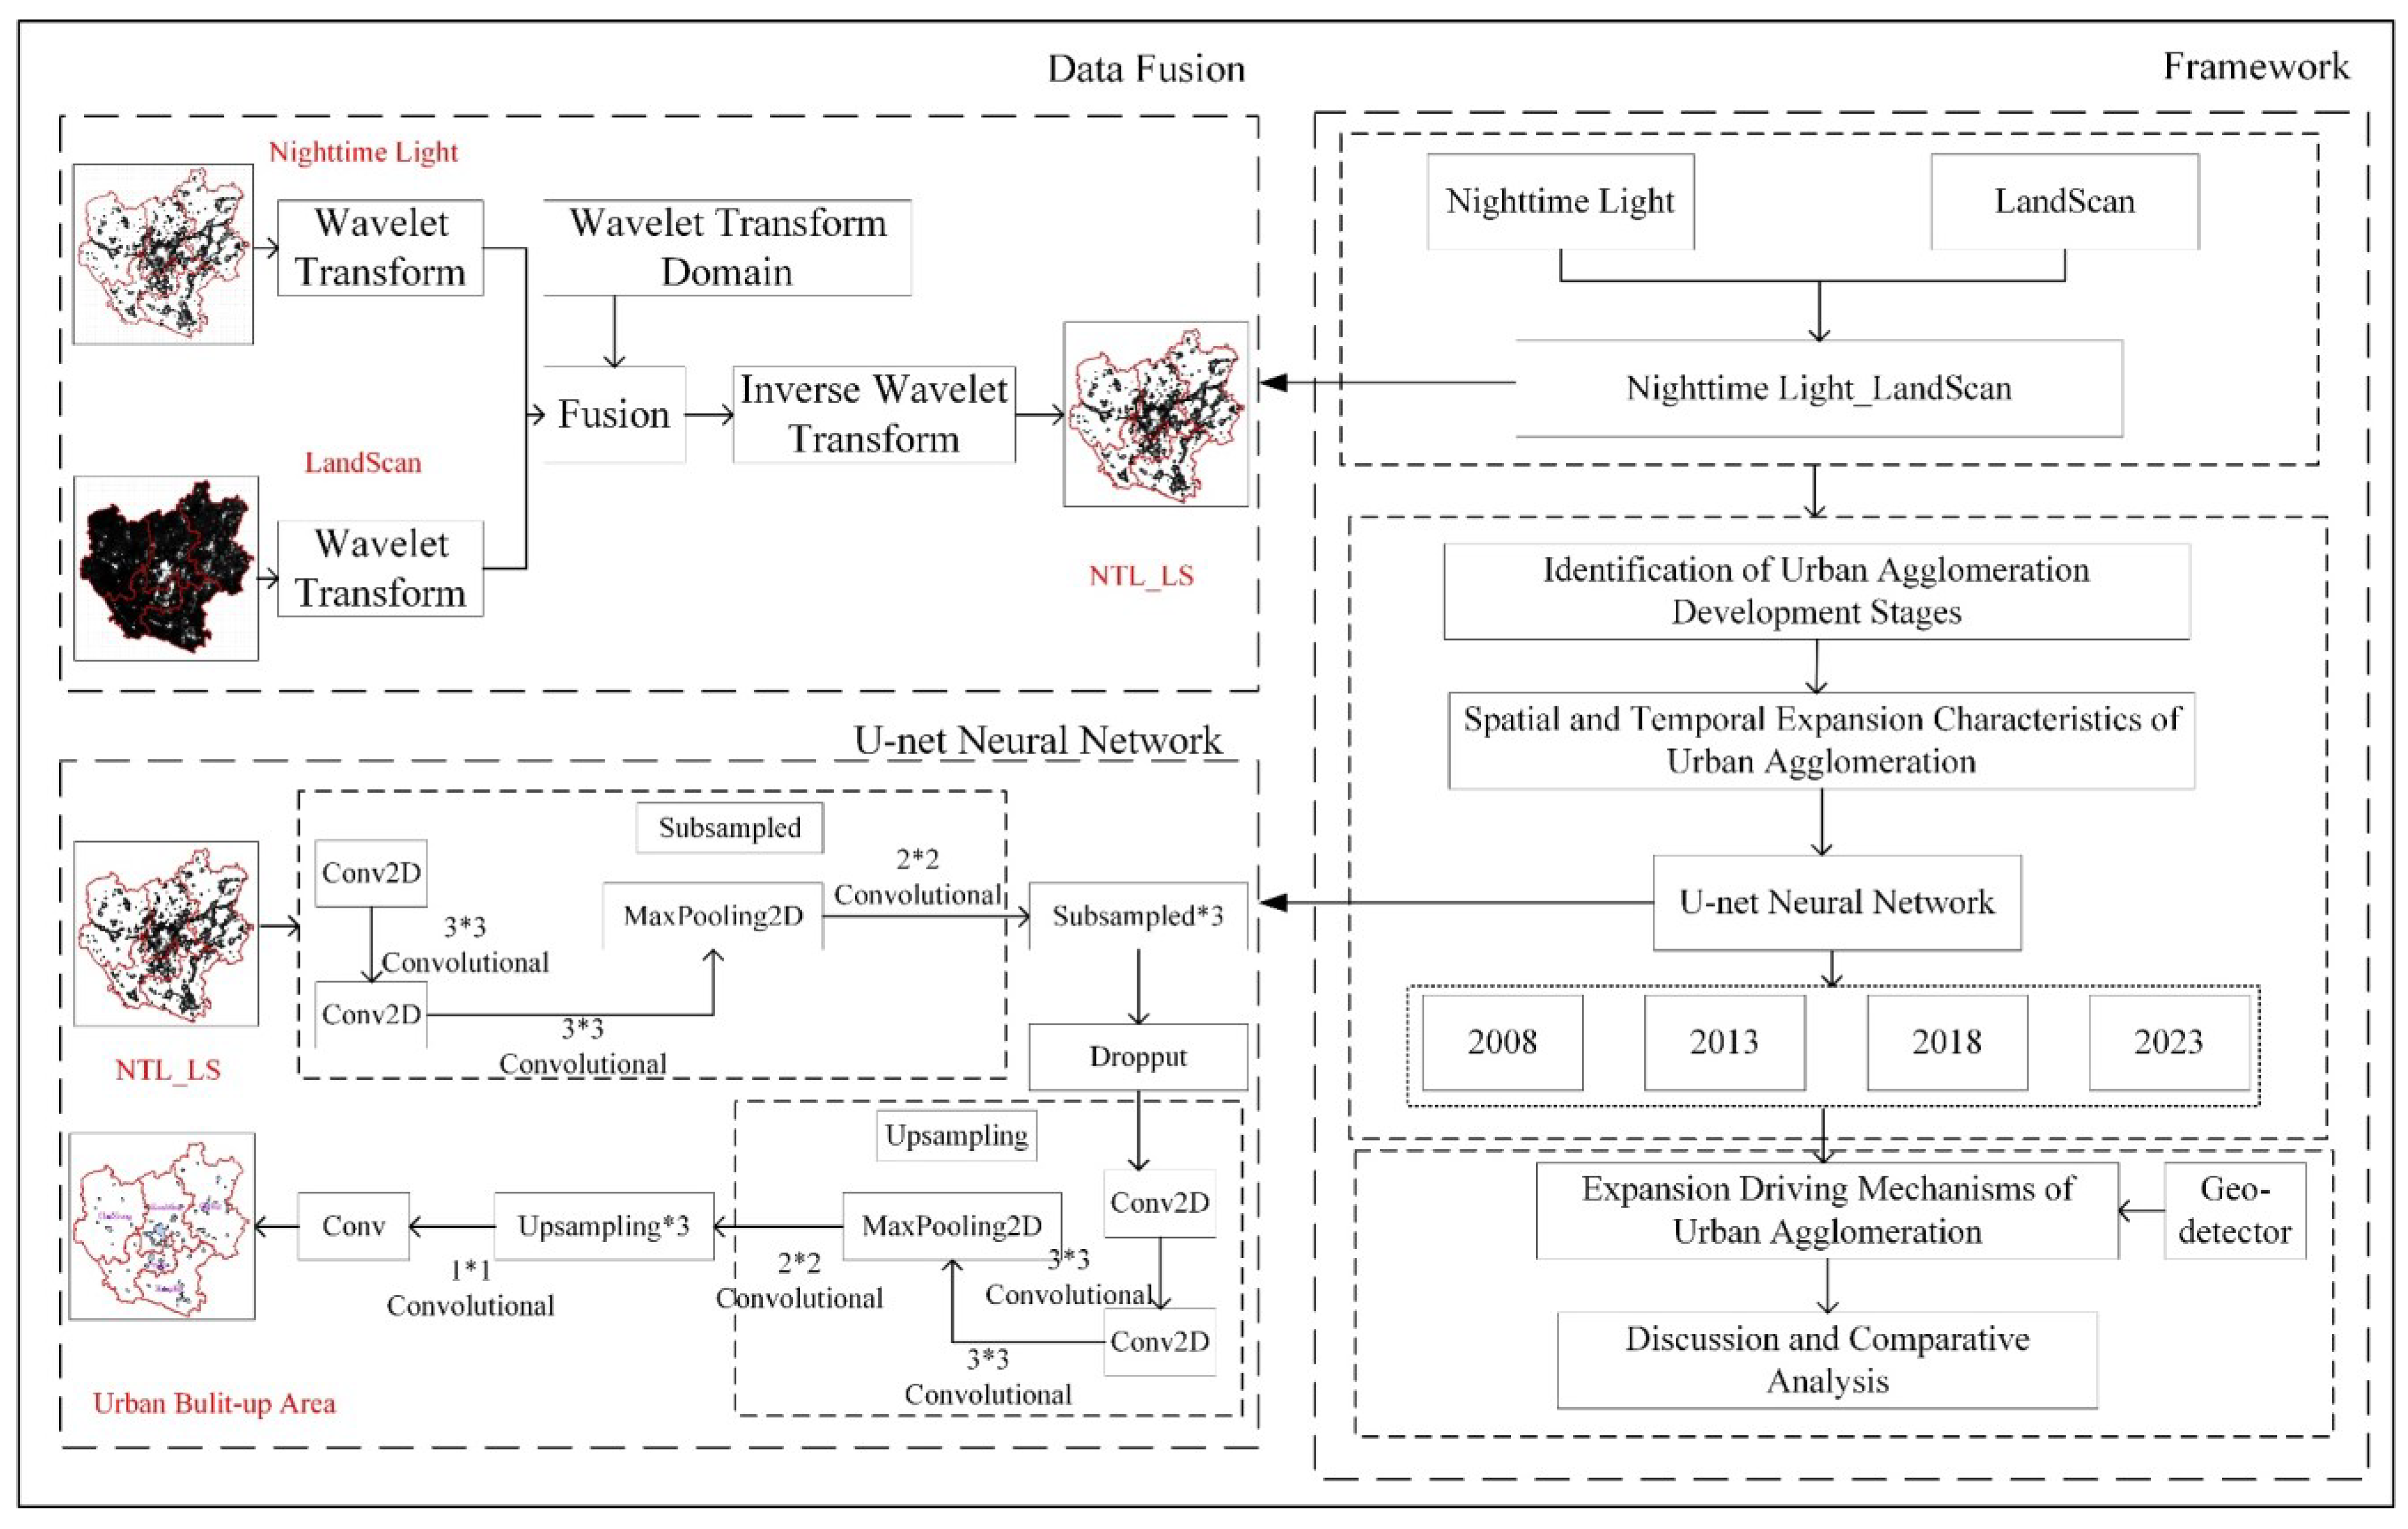
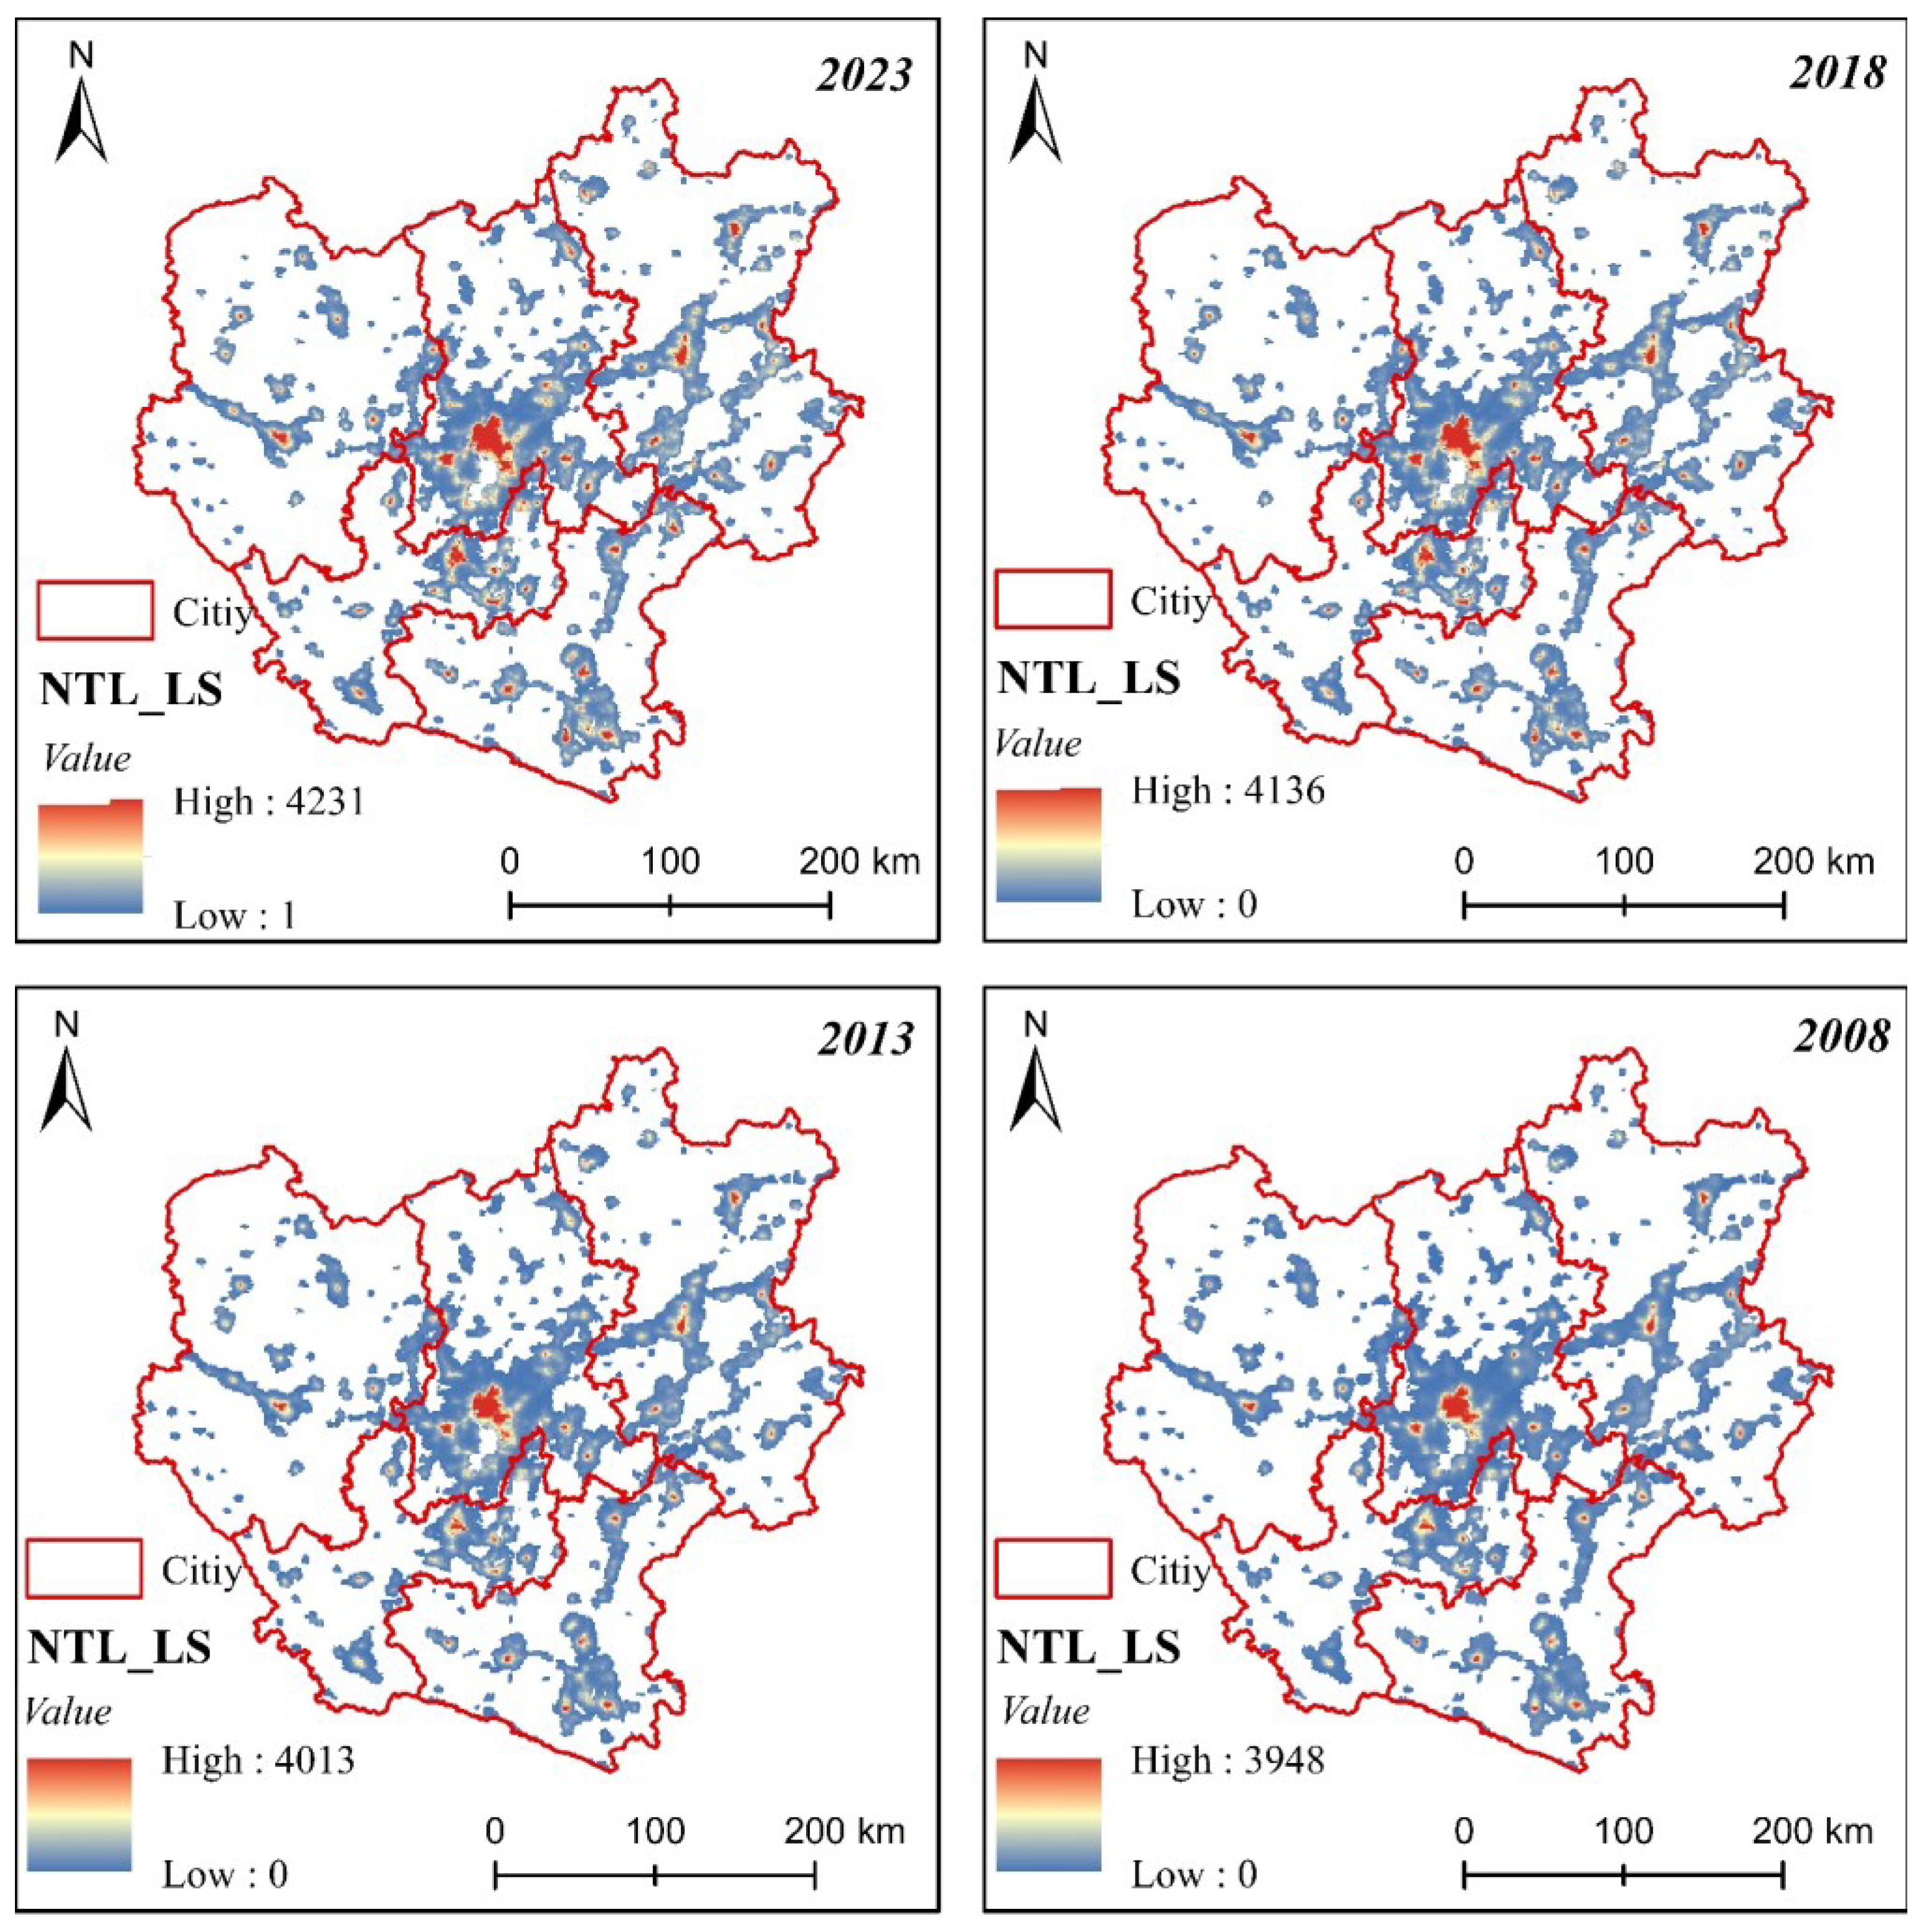
2.3.2. Data Fusion
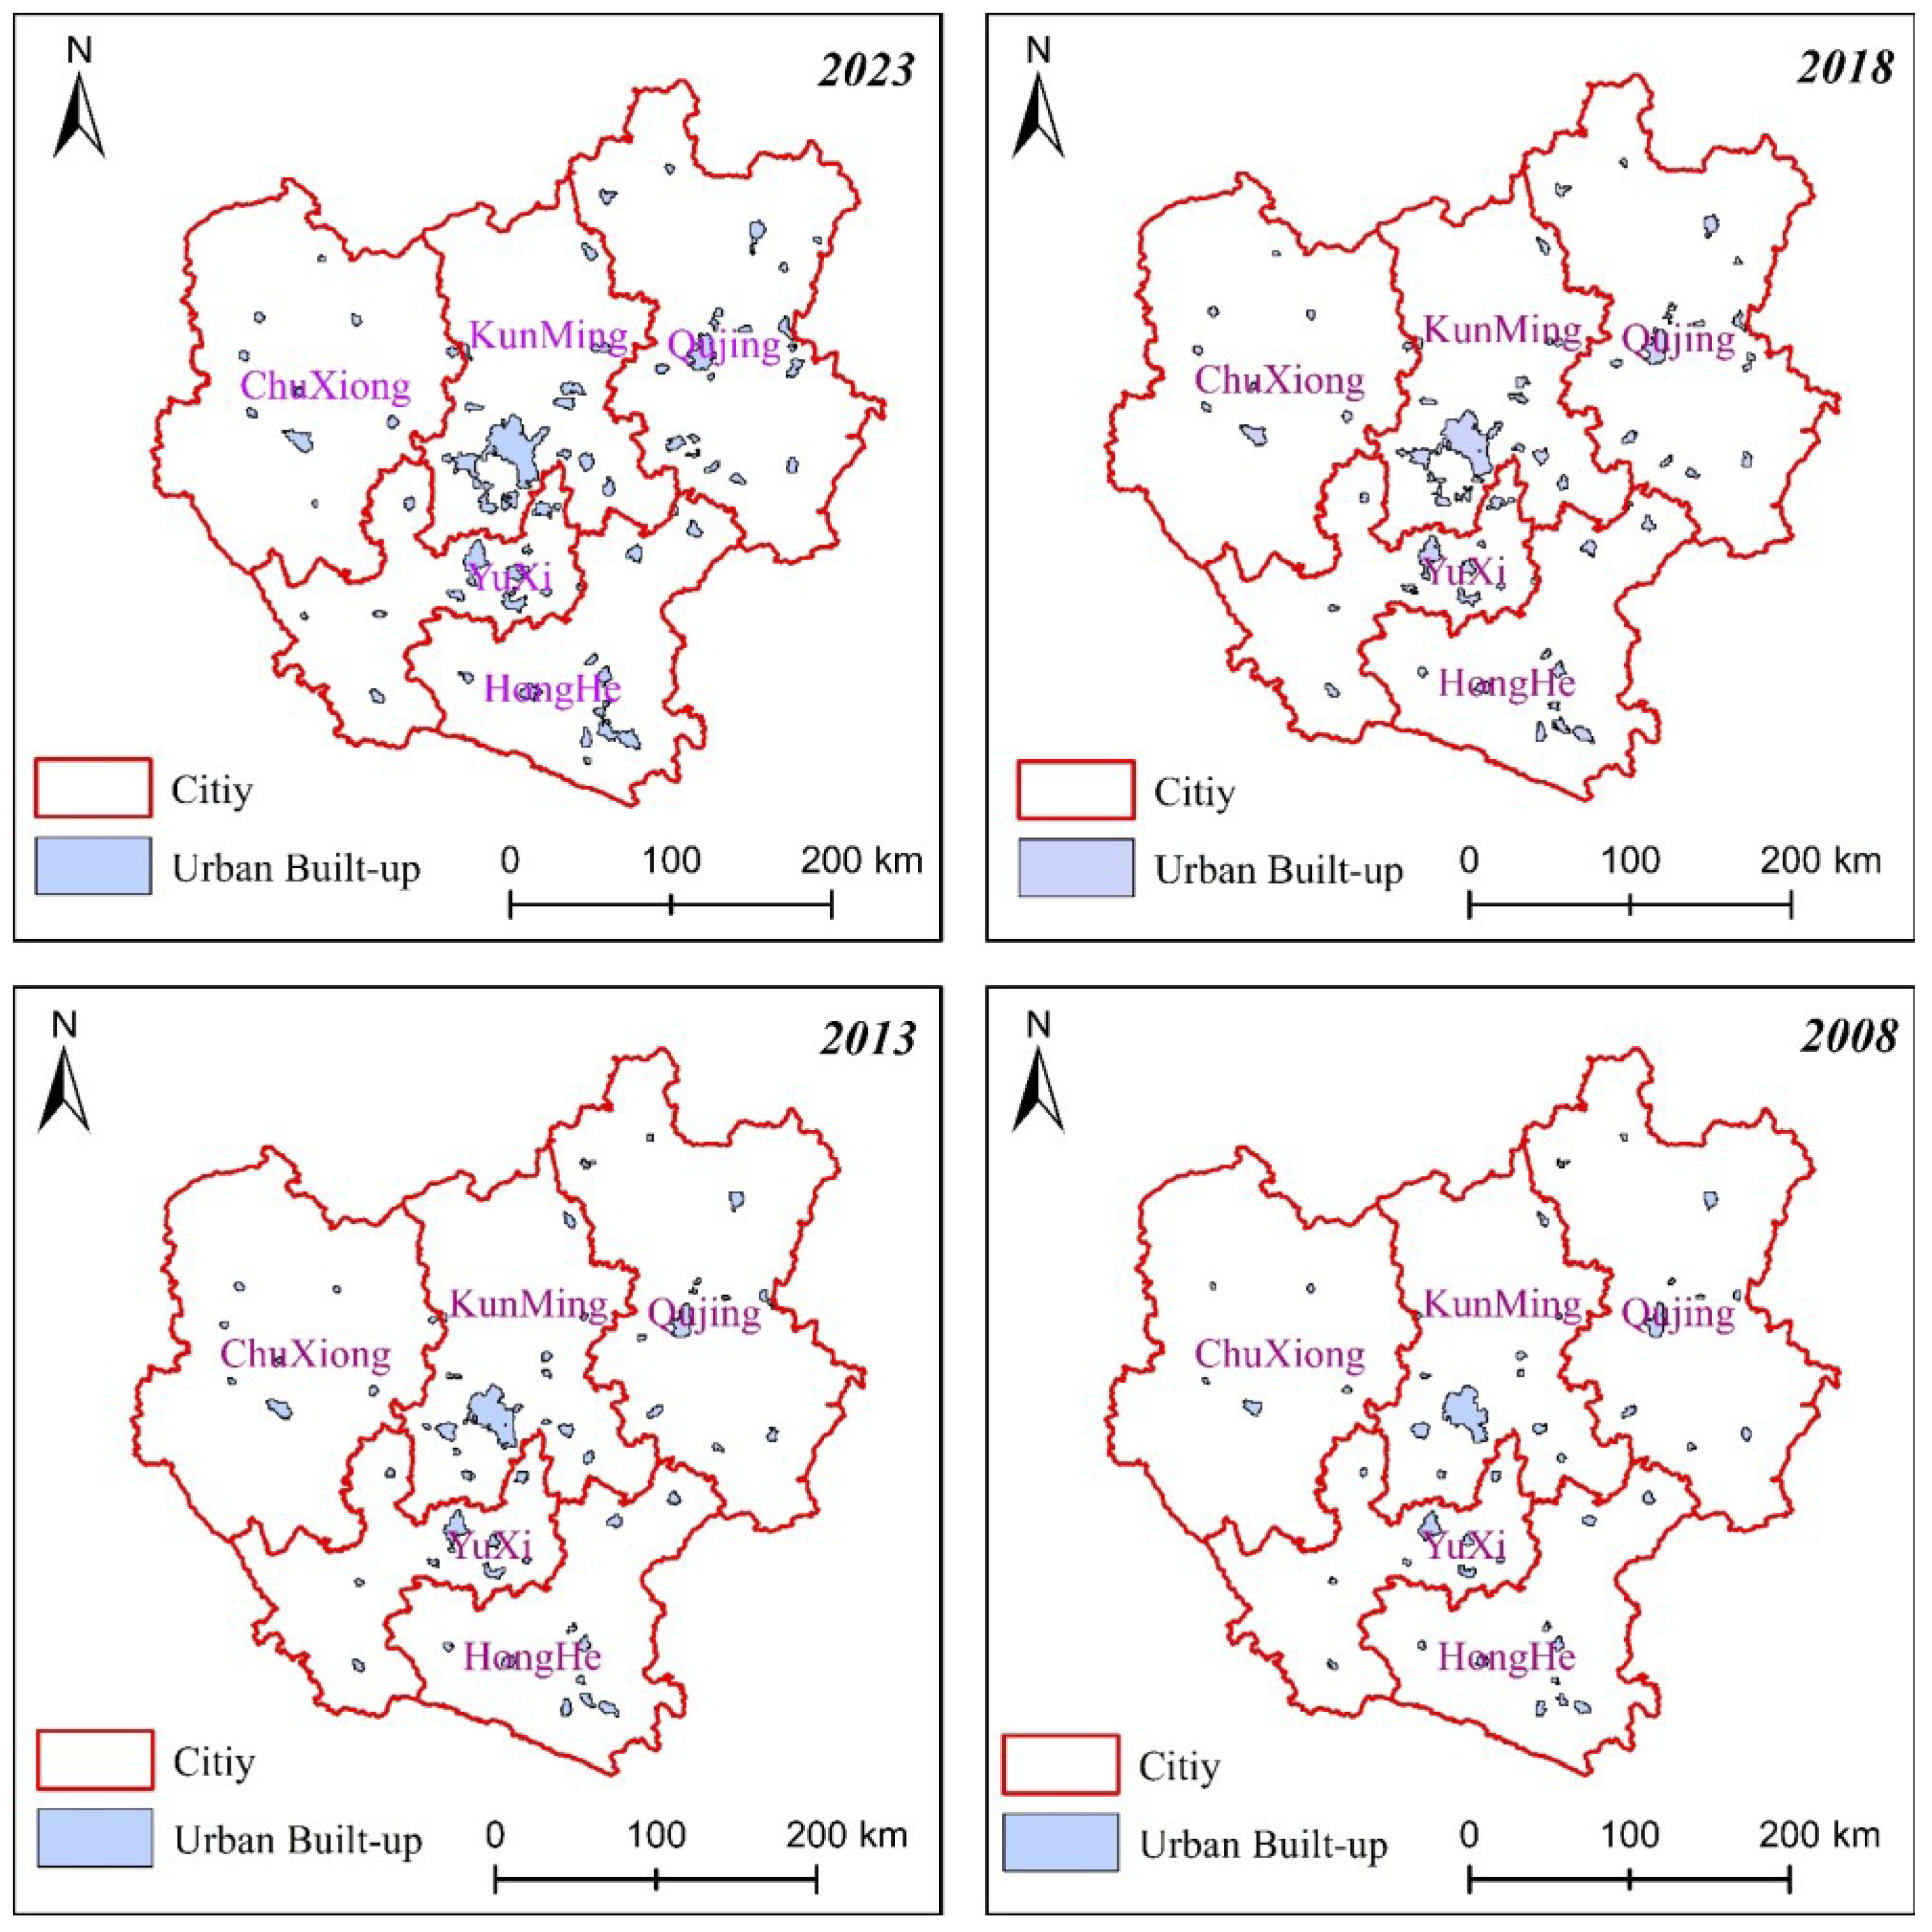
2.3.3. U-Net Neural Network
2.3.4. Geographical Detector (Geo-Detector)
3. Results
3.1. Multi-Source Big Data Fusion
3.2. Urban Agglomeration Development Stages
3.3. Spatiotemporal Characteristics of Urban Agglomeration Expansion
3.4. Expansion Driving Mechanisms of Urban Agglomeration
4. Discussion
5. Conclusions
Author Contributions
Funding
Data Availability Statement
Conflicts of Interest
References
- Alonso-Villar, O. Urban agglomeration: Knowledge spillovers and product diversity. Ann. Reg. Sci. 2002, 36, 551–573. [Google Scholar] [CrossRef]
- Billings, S.B.; Johnson, E.B. Agglomeration within an urban area. J. Urban Econ. 2016, 91, 13–25. [Google Scholar] [CrossRef]
- Wang, S.; Fang, C.; Sun, L.; Su, Y.; Chen, X.; Zhou, C.; Feng, K.; Hubacek, K. Decarbonizing China’s urban agglomerations. Ann. Am. Assoc. Geogr. 2019, 109, 266–285. [Google Scholar] [CrossRef]
- Li, W.; Yi, P.; Yu, H.; Lin, W.; Wu, X. Assessment on sustainable development of three major urban agglomerations in China based on sustainability-differentiation-combined weighting method. Sustain. Dev. 2023, 31, 2678–2693. [Google Scholar] [CrossRef]
- Ma, S.; Cai, Y.; Xie, D.; Zhang, X.; Zhao, Y. Towards balanced development stage: Regulating the spatial pattern of agglomeration with collaborative optimal allocation of urban land. Cities 2022, 126, 103645. [Google Scholar] [CrossRef]
- Tan, F.; Gong, C.; Niu, Z. How does regional integration development affect green innovation? Evidence from China’s major urban agglomerations. J. Clean. Prod. 2022, 379, 134613. [Google Scholar] [CrossRef]
- Yankovich, E.P.; Yankovich, K.S.; Baranovskiy, N.V. Dynamics of forest vegetation in an urban agglomeration based on Landsat remote sensing data for the period 1990–2022: A case study. Remote Sens. 2023, 15, 1935. [Google Scholar] [CrossRef]
- Broes, T.; Dehaene, M. Mastering the urbanization process. The urban questions of engineer August Mennes in the Antwerp agglomeration. Plan. Perspect. 2017, 32, 503–531. [Google Scholar] [CrossRef]
- Qu, L.; Zhang, T.; Liang, S. Waste management of urban agglomeration on a life cycle basis. Resour. Conserv. Recycl. 2013, 78, 47–53. [Google Scholar] [CrossRef]
- Liu, X.; Guo, P.; Yue, X.; Qi, X.; Guo, S.; Zhou, X. Measuring metabolic efficiency of the Beijing–Tianjin–Hebei urban agglomeration: A slacks-based measures method. Resour. Policy 2021, 70, 101928. [Google Scholar] [CrossRef]
- Xiong, W.; Qin, J.; Luo, W.; Cheng, Q. The Influence of the Spatial Structure of Urban Agglomeration on the Digital Economy and Its Impact Mechanism: Evidence from China. Int. Reg. Sci. Rev. 2024, 01600176241253289. [Google Scholar] [CrossRef]
- Huang, Q.; Liu, Y. The coupling between urban expansion and population growth: An analysis of urban agglomerations in China (2005–2020). Sustainability 2021, 13, 7250. [Google Scholar] [CrossRef]
- Lu, Q.; Lv, T.; Wang, S.; Wei, L. Spatiotemporal Variation and Development Stage of CO2 Emissions of Urban Agglomerations in the Yangtze River Economic Belt, China. Land 2023, 12, 1678. [Google Scholar] [CrossRef]
- Cao, R.; Huang, G.H.; Chen, J.P.; Li, Y.P. A fractional multi-stage simulation-optimization energy model for carbon emission management of urban agglomeration. Sci. Total Environ. 2021, 774, 144963. [Google Scholar] [CrossRef]
- Zhang, N.; Sun, F.; Hu, Y. Carbon emission efficiency of land use in urban agglomerations of Yangtze River Economic Belt, China: Based on three-stage SBM-DEA model. Ecol. Indic. 2024, 160, 111922. [Google Scholar] [CrossRef]
- Cui, Z.; Ren, F.R.; Wei, Q.; Xi, Z. What drives the spatio-temporal distribution and spillover of air quality in China’s three urban agglomerations? Evidence from a two-stage approach. Front. Ecol. Evol. 2022, 10, 977598. [Google Scholar] [CrossRef]
- Fang, C. The basic law of the formation and expansion in urban agglomerations. J. Geogr. Sci. 2019, 29, 1699–1712. [Google Scholar] [CrossRef]
- Ma, S.; Li, L.; Zuo, J.; Gao, F.; Ma, X.; Shen, X.; Zheng, Y. Regional integration policies and urban green innovation: Fresh evidence from urban agglomeration expansion. J. Environ. Manag. 2024, 354, 120485. [Google Scholar] [CrossRef]
- Liu, D.; Chen, N. Satellite monitoring of urban land change in the middle Yangtze River Basin urban agglomeration, China between 2000 and 2016. Remote Sens. 2017, 9, 1086. [Google Scholar] [CrossRef]
- He, X.; Zhou, C.; Zhang, J.; Yuan, X. Using wavelet transforms to fuse nighttime light data and POI big data to extract urban built-up areas. Remote Sens. 2020, 12, 3887. [Google Scholar] [CrossRef]
- Batty, M. The size, scale, and shape of cities. Science 2008, 319, 769–771. [Google Scholar] [CrossRef] [PubMed]
- Batty, M. The New Science of Cities; MIT Press: Cambridge, MA, USA, 2013. [Google Scholar]
- Bettencourt, L.M.A.; Lobo, J.; Helbing, D.; Kühnert, C.; West, G.B. Growth, innovation, scaling, and the pace of life in cities. Proc. Natl. Acad. Sci. USA 2007, 104, 7301–7306. [Google Scholar] [CrossRef] [PubMed]
- Arcaute, E.; Hatna, E.; Ferguson, P.; Youn, H.; Johansson, A.; Batty, M. Constructing cities, deconstructing scaling laws. J. R. Soc. Interface 2015, 12, 20140745. [Google Scholar] [CrossRef] [PubMed]
- Fu, Y.; Zhang, X. Mega urban agglomeration in the transformation era: Evolving theories, research typologies and governance. Cities 2020, 105, 102813. [Google Scholar] [CrossRef]
- Peng, K.; Jiang, W.; Deng, Y.; Liu, Y.; Wu, Z.; Chen, Z. Simulating wetland changes under different scenarios based on integrating the random forest and CLUE-S models: A case study of Wuhan Urban Agglomeration. Ecol. Indic. 2020, 117, 106671. [Google Scholar] [CrossRef]
- Liu, X.; Sun, R.; Yang, Q.; Su, G.; Qi, W. Simulating urban expansion using an improved SLEUTH model. J. Appl. Remote Sens. 2012, 6, 061709. [Google Scholar] [CrossRef]
- Liang, X.; Liu, X.; Li, D.; Zhao, H.; Chen, G. Urban growth simulation by incorporating planning policies into a CA-based future land-use simulation model. Int. J. Geogr. Inf. Sci. 2018, 32, 2294–2316. [Google Scholar] [CrossRef]
- Zhang, Z.; Liu, F.; Zhao, X.; Wang, X.; Shi, L.; Xu, J.; Yu, S.; Wen, Q.; Zuo, L.; Yi, L.; et al. Urban expansion in China based on remote sensing technology: A review. Chin. Geogr. Sci. 2018, 28, 727–743. [Google Scholar] [CrossRef]
- Hawash, E.; El-Hassanin, A.; Amer, W.; El-Nahry, A.; Effat, H. Change detection and urban expansion of Port Sudan, Red Sea, using remote sensing and GIS. Environ. Monit. Assess. 2021, 193, 723. [Google Scholar] [CrossRef]
- Shahtahmassebi, A.R.; Song, J.; Zheng, Q.; Blackburn, G.A.; Wang, K.; Huang, L.Y.; Pan, Y.; Moore, N.; Shahtahmassebi, G.; Haghighi, R.S.; et al. Remote sensing of impervious surface growth: A framework for quantifying urban expansion and re-densification mechanisms. Int. J. Appl. Earth Obs. Geoinf. 2016, 46, 94–112. [Google Scholar] [CrossRef]
- Khanal, N.; Uddin, K.; Matin, M.A.; Tenneson, K. Automatic detection of spatiotemporal urban expansion patterns by fusing OSM and landsat data in Kathmandu. Remote Sens. 2019, 11, 2296. [Google Scholar] [CrossRef]
- He, X.; Zhang, Z.; Yang, Z. Extraction of urban built-up area based on the fusion of night-time light data and point of interest data. R. Soc. Open Sci. 2021, 8, 210838. [Google Scholar] [CrossRef] [PubMed]
- He, X.; Yuan, X.; Zhang, D.; Zhang, R.; Li, M.; Zhou, C. Delineation of urban agglomeration boundary based on multisource big data fusion—A case study of Guangdong–Hong Kong–Macao Greater Bay Area (GBA). Remote Sens. 2021, 13, 1801. [Google Scholar] [CrossRef]
- Chen, Y.; Deng, A. Using POI data and Baidu migration big data to modify nighttime light data to identify urban and rural area. IEEE Access 2022, 10, 93513–93524. [Google Scholar] [CrossRef]
- Zhang, S.; Wei, H. Identification of Urban Agglomeration Spatial Range Based on Social and Remote-Sensing Data—For Evaluating Development Level of Urban Agglomeration. ISPRS Int. J. Geo-Inf. 2022, 11, 456. [Google Scholar] [CrossRef]
- Zeng, C.; Song, Y.; Cai, D.; Hu, P.; Cui, H.; Yang, J.; Zhang, H. Exploration on the spatial spillover effect of infrastructure network on urbanization: A case study in Wuhan urban agglomeration. Sustain. Cities Soc. 2019, 47, 101476. [Google Scholar] [CrossRef]
- Peng, J.; Lin, H.; Chen, Y.; Blaschke, T.; Luo, L.; Xu, Z.; Hu, Y.N.; Zhao, M.; Wu, J. Spatiotemporal evolution of urban agglomerations in China during 2000–2012: A nighttime light approach. Landsc. Ecol. 2020, 35, 421–434. [Google Scholar] [CrossRef]
- Ruan, L.; He, T.; Xiao, W.; Chen, W.; Lu, D.; Liu, S. Measuring the coupling of built-up land intensity and use efficiency: An example of the Yangtze River Delta urban agglomeration. Sustain. Cities Soc. 2022, 87, 104224. [Google Scholar] [CrossRef]
- Su, Y.; Lu, C.; Su, Y.; Wang, Z.; Huang, Y.; Yang, N. Spatio-temporal evolution of urban expansion based on a novel adjusted index and GEE: A case study of central plains urban agglomeration, China. Chin. Geogr. Sci. 2023, 33, 736–750. [Google Scholar] [CrossRef]
- He, X.; Zhou, Y. Urban spatial growth and driving mechanisms under different urban morphologies: An empirical analysis of 287 Chinese cities. Landsc. Urban Plan. 2024, 248, 105096. [Google Scholar] [CrossRef]
- Zhang, J.; Yuan, X.; Tan, X.; Zhang, X. Delineation of the urban-rural boundary through data fusion: Applications to improve urban and rural environments and promote intensive and healthy urban development. Int. J. Environ. Res. Public Health 2021, 18, 7180. [Google Scholar] [CrossRef] [PubMed]
- Chen, Y.; Zhang, J. Extraction of urban built-up areas based on data fusion: A case study of Zhengzhou, China. ISPRS Int. J. Geo-Inf. 2022, 11, 521. [Google Scholar] [CrossRef]
- Huang, X.; Hu, T.; Li, J.; Wang, Q.; Benediktsson, J.A. Mapping urban areas in China using multisource data with a novel ensemble SVM method. IEEE Trans. Geosci. Remote Sens. 2018, 56, 4258–4273. [Google Scholar] [CrossRef]
- Yu, M.; Xu, H.; Zhou, F.; Xu, S.; Yin, H. A Deep-Learning-Based Multimodal Data Fusion Framework for Urban Region Function Recognition. ISPRS Int. J. Geo-Inf. 2023, 12, 468. [Google Scholar] [CrossRef]
- Hänsch, R.; Hellwich, O. Fusion of multispectral LiDAR, hyperspectral, and RGB data for urban land cover classification. IEEE Geosci. Remote Sens. Lett. 2020, 18, 366–370. [Google Scholar] [CrossRef]
- Xing, J.; Wu, W.; Cheng, Q.; Liu, R. Traffic state estimation of urban road networks by multi-source data fusion: Review and new insights. Phys. A Stat. Mech. Its Appl. 2022, 595, 127079. [Google Scholar] [CrossRef]
- Wei, G.; He, B.J.; Liu, Y.; Li, R. How does rapid urban construction land expansion affect the spatial inequalities of ecosystem health in China? Evidence from the country, economic regions and urban agglomerations. Environ. Impact Assess. Rev. 2024, 106, 107533. [Google Scholar] [CrossRef]
- Zheng, Y.; Xu, W.; Dai, L. Urban growth in a post-2000 central Chinese urban agglomeration: Case study of the Changzhutan region. Growth Change 2020, 51, 464–487. [Google Scholar] [CrossRef]
- Wang, H.; Wu, Y.; Deng, Y.; Xu, S. Model construction of urban agglomeration expansion simulation considering urban flow and hierarchical characteristics. J. Geogr. Sci. 2022, 32, 499–516. [Google Scholar] [CrossRef]
- Poelmans, L.; Rompaey, A.V.; Ntegeka, V.; Willems, P. The relative impact of climate change and urban expansion on peak flows: A case study in central Belgium. Hydrol. Process. 2011, 25, 2846–2858. [Google Scholar] [CrossRef]
- Terfa, B.K.; Chen, N.; Liu, D.; Zhang, X.; Niyogi, D. Urban expansion in Ethiopia from 1987 to 2017: Characteristics, spatial patterns, and driving forces. Sustainability 2019, 11, 2973. [Google Scholar] [CrossRef]
- Rijal, S.; Rimal, B.; Stork, N.; Sharma, H.P. Quantifying the drivers of urban expansion in Nepal. Environ. Monit. Assess. 2020, 192, 633. [Google Scholar] [CrossRef] [PubMed]
- Zhu, X.; Zhang, P.; Wei, Y.; Li, Y.; Zhao, H. Measuring the efficiency and driving factors of urban land use based on the DEA method and the PLS-SEM model—A case study of 35 large and medium-sized cities in China. Sustain. Cities Soc. 2019, 50, 101646. [Google Scholar] [CrossRef]
- Azhdari, A.; Sasani, M.A.; Soltani, A. Exploring the relationship between spatial driving forces of urban expansion and socioeconomic segregation: The case of Shiraz. Habitat Int. 2018, 81, 33–44. [Google Scholar] [CrossRef]
- Wu, C.; Huang, X.; Chen, B. Telecoupling mechanism of urban land expansion based on transportation accessibility: A case study of transitional Yangtze River economic Belt, China. Land Use Policy 2020, 96, 104687. [Google Scholar] [CrossRef]
- Chioda, L.; De Mello, J.M.; Soares, R.R. Spillovers from conditional cash transfer programs: Bolsa Família and crime in urban Brazil. Econ. Educ. Rev. 2016, 54, 306–320. [Google Scholar] [CrossRef]
- Batisani, N.; Yarnal, B. Urban expansion in Centre County, Pennsylvania: Spatial dynamics and landscape transformations. Appl. Geogr. 2009, 29, 235–249. [Google Scholar] [CrossRef]
- Sakieh, Y.; Amiri, B.J.; Danekar, A.; Feghhi, J.; Dezhkam, S. Simulating urban expansion and scenario prediction using a cellular automata urban growth model, SLEUTH, through a case study of Karaj City, Iran. J. Hous. Built Environ. 2015, 30, 591–611. [Google Scholar] [CrossRef]
- Li, G.; Sun, S.; Fang, C. The varying driving forces of urban expansion in China: Insights from a spatial-temporal analysis. Landsc. Urban Plan. 2018, 174, 63–77. [Google Scholar] [CrossRef]
- Zhang, Z.; Wang, B.; Buyantuev, A.; He, X.; Gao, W.; Wang, Y.; Dawazhaxi; Yang, Z. Urban agglomeration of Kunming and Yuxi cities in Yunnan, China: The relative importance of government policy drivers and environmental constraints. Landsc. Ecol. 2019, 34, 663–679. [Google Scholar] [CrossRef]
- Hillger, D.; Seaman, C.; Liang, C.; Miller, S.; Lindsey, D.; Kopp, T. Suomi NPP VIIRS imagery evaluation. J. Geophys. Res. Atmos. 2014, 119, 6440–6455. [Google Scholar] [CrossRef]
- Antrop, M. Landscape change and the urbanization process in Europe. Landsc. Urban Plan. 2004, 67, 9–26. [Google Scholar] [CrossRef]
- Fujita, M.; Krugman, P.; Venables, A.J. The Spatial Economy: Cities, Regions, and International Trade; MIT Press: Cambridge, MA, USA, 1999. [Google Scholar]
- Dobson, J.E.; Bright, E.A.; Coleman, P.R.; Durfee, R.C.; Worley, B.A. LandScan: A global population database for estimating populations at risk. Photogramm. Eng. Remote Sens. 2000, 66, 849–857. [Google Scholar]
- Gabaix, X. Zipf’s law for cities: An explanation. Q. J. Econ. 1999, 114, 739–767. [Google Scholar] [CrossRef]
- Krugman, P. Confronting the mystery of urban hierarchy. J. Jpn. Int. Econ. 1996, 10, 399–418. [Google Scholar] [CrossRef]
- Konishi, Y.; Nishiyama, Y. Hypothesis testing in rank-size rule regression. Math. Comput. Simul. 2009, 79, 2869–2878. [Google Scholar] [CrossRef]
- Zipf, G.K. Human Behavior and the Principle of Least Effort; Addison-Wesley: Cambridge, MA, USA, 1949. [Google Scholar]
- Peng, J.; Liu, Y.; Ma, J.; Zhao, S. A new approach for urban-rural fringe identification: Integrating impervious surface area and spatial continuous wavelet transform. Landsc. Urban Plan. 2018, 175, 72–79. [Google Scholar] [CrossRef]
- Myint, S.W.; Zhu, T.; Zheng, B. A novel image classification algorithm using overcomplete wavelet transforms. IEEE Geosci. Remote Sens. Lett. 2015, 12, 1232–1236. [Google Scholar] [CrossRef]
- Delibasoglu, I.; Cetin, M. Improved U-Nets with inception blocks for building detection. J. Appl. Remote Sens. 2020, 14, 044512. [Google Scholar] [CrossRef]
- Sultonov, F.; Park, J.H.; Yun, S.; Lim, D.W.; Kang, J.M. Mixer U-Net: An improved automatic road extraction from UAV imagery. Appl. Sci. 2022, 12, 1953. [Google Scholar] [CrossRef]
- Zhang, X.; Gong, Z. Spatiotemporal characteristics of urban air quality in China and geographic detection of their determinants. J. Geogr. Sci. 2018, 28, 563–578. [Google Scholar] [CrossRef]
- Li, J.; Sun, Z. Urban function orientation based on spatiotemporal differences and driving factors of urban construction land. J. Urban Plan. Dev. 2020, 146, 05020011. [Google Scholar] [CrossRef]
- Mallat, S. A theory for multiresolution signal decomposition: The wavelet representation. IEEE Trans. Pattern Anal. Mach. Intell. 1989, 11, 674–693. [Google Scholar] [CrossRef]
- Li, S.; Kwok, J.T.; Wang, Y. Combination of images with diverse focuses using the spatial frequency. Inf. Fusion 2002, 2, 169–176. [Google Scholar] [CrossRef]
- Burt, P.J.; Adelson, E.H. The Laplacian pyramid as a compact image code. IEEE Trans. Commun. 1983, 31, 532–540. [Google Scholar] [CrossRef]
- He, X.; Zhou, Y.; Yuan, X.; Zhu, M. The coordination relationship between urban development and urban life satisfaction in Chinese cities-An empirical analysis based on multi-source data. Cities 2024, 150, 105016. [Google Scholar] [CrossRef]
- Ding, R.; Fu, J.; Zhang, Y.; Zhang, T.; Yin, J.; Du, Y.; Zhou, T.; Du, L. Research on the evolution of the economic spatial pattern of urban agglomeration and its influencing factors, evidence from the Chengdu-Chongqing urban agglomeration of China. Sustainability 2022, 14, 10969. [Google Scholar] [CrossRef]
- He, X.; Zhang, R.; Yuan, X.; Cao, Y.; Zhou, C. The role of planning policy in the evolution of the spatial structure of the Guangzhou metropolitan area in China. Cities 2023, 137, 104284. [Google Scholar] [CrossRef]
- Zhang, J.; Zhang, R.; Zhang, X.; Yuan, X. Polycentric Spatial Structure Evolution and Influencing Factors of the Kunming–Yuxi Urban Agglomeration: Based on Multisource Big Data Fusion. Land 2023, 12, 1340. [Google Scholar] [CrossRef]
- Zhang, J.; Zhang, R.; Li, Q.; Zhang, X.; He, X. Spatial Sifferentiation and Differentiated Development Paths of Traditional Villages in Yunnan Province. Land 2023, 12, 1663. [Google Scholar] [CrossRef]
- Zhou, K.; Liang, Y.; Zhong, C.; Zeng, J.; Zhou, Z. Spatial features of urban expansion in Vietnam based on long-term nighttime lights data. Land 2022, 11, 601. [Google Scholar] [CrossRef]
- Liu, X.; Li, X.; Chen, Y.; Tan, Z.; Li, S.; Ai, B. A new landscape index for quantifying urban expansion using multi-temporal remote sensing data. Landsc. Ecol. 2016, 31, 2035–2049. [Google Scholar]
- Zhou, Y.; Li, X.; Asrar, G.R.; Smith, S.J.; Imhoff, M. A global record of annual urban dynamics (1992–2013) from nighttime lights. Remote Sens. Environ. 2020, 232, 111273. [Google Scholar] [CrossRef]
- Yang, X.; Chen, L. The spatiotemporal pattern of urban land use efficiency and its influencing factors: A case study of the Bohai Rim Region. Land Use Policy 2018, 74, 245–255. [Google Scholar]
- Wang, J.; Zhang, W. Industrial structure optimization and economic resilience in China’s resource-based cities. Resour. Policy 2019, 64, 101515. [Google Scholar]
- Xu, W.; Li, J.; Wang, Q.; Liu, X. Government policies and urban growth dynamics in China: A spatial econometric approach. Urban Stud. 2017, 54, 2330–2349. [Google Scholar]
- Li, Y.; Yang, Z.; Song, W. Evaluating the effects of urban expansion on a metro-centric agricultural region using integrated environmental models: A case study of the Pearl River Delta. J. Clean. Prod. 2018, 171, 1524–1536. [Google Scholar]
- Alahmadi, M.; Mansour, S.; Martin, D.; Atkinson, P.M. An improved index for urban population distribution mapping based on nighttime lights (DMSP-OLS) data: An experiment in Riyadh Province, Saudi Arabia. Remote Sens. 2021, 13, 1171. [Google Scholar] [CrossRef]


Disclaimer/Publisher’s Note: The statements, opinions and data contained in all publications are solely those of the individual author(s) and contributor(s) and not of MDPI and/or the editor(s). MDPI and/or the editor(s) disclaim responsibility for any injury to people or property resulting from any ideas, methods, instructions or products referred to in the content. |
© 2024 by the authors. Licensee MDPI, Basel, Switzerland. This article is an open access article distributed under the terms and conditions of the Creative Commons Attribution (CC BY) license (https://creativecommons.org/licenses/by/4.0/).
Share and Cite
Li, Q.; Li, L.; Zhang, J.; He, X. Spatio-Temporal Characteristics and Driving Mechanisms of Urban Expansion in the Central Yunnan Urban Agglomeration. Land 2024, 13, 1496. https://doi.org/10.3390/land13091496
Li Q, Li L, Zhang J, He X. Spatio-Temporal Characteristics and Driving Mechanisms of Urban Expansion in the Central Yunnan Urban Agglomeration. Land. 2024; 13(9):1496. https://doi.org/10.3390/land13091496
Chicago/Turabian StyleLi, Qilun, Lin Li, Jun Zhang, and Xiong He. 2024. "Spatio-Temporal Characteristics and Driving Mechanisms of Urban Expansion in the Central Yunnan Urban Agglomeration" Land 13, no. 9: 1496. https://doi.org/10.3390/land13091496
APA StyleLi, Q., Li, L., Zhang, J., & He, X. (2024). Spatio-Temporal Characteristics and Driving Mechanisms of Urban Expansion in the Central Yunnan Urban Agglomeration. Land, 13(9), 1496. https://doi.org/10.3390/land13091496