Article

The Impact of Green Finance on Agricultural Non-Point Source Pollution: Analysis of the Role of Environmental Regulation and Rural Land Transfer

1
School of Philosophy and Social Development, Huaqiao University, Xiamen 361021, China
2
Institute of Quantitative Economics and Statistics, Huaqiao University, Xiamen 361021, China
*
Author to whom correspondence should be addressed.
Land 2024, 13(9), 1516; https://doi.org/10.3390/land13091516
Submission received: 1 August 2024 / Revised: 9 September 2024 / Accepted: 16 September 2024 / Published: 19 September 2024

Abstract

:
This study evaluates the impact of green finance on agricultural non-point source pollution control and emission reduction in 30 Chinese provinces from 2005 to 2022. Utilizing the entropy value method and the unit survey inventory method, the research measures the levels of green finance development and agricultural non-point source pollution. It employs a mediation effect model to empirically assess the pollution control efficacy of green finance and to elucidate the mechanisms underlying its influence. The findings indicate that green finance development significantly curtails agricultural non-point source pollution emissions. This conclusion is still valid after a series of robustness tests. The results of mechanism analysis show that environmental regulation and land transfer are important channels for green finance to reduce agricultural non-point source pollution. However, the slowing effect of green finance is stronger in provinces where the economic development level is still in the catch-up zone. Consequently, this study suggests strengthening green finance infrastructure in rural areas, coordinating green finance and environmental regulation policies, optimizing land transfer systems to promote scale management, and developing differentiated green finance policies based on regional economic development levels. These measures aim to augment the role of green finance in pollution treatment and emission reduction, thereby optimizing the green financial system, advancing environmental protection, and fostering sustainable development in China’s agricultural sector.

1. Introduction

As a major agricultural country, China’s total grain output has exceeded 650 million tons for five consecutive years, and its agricultural product exports account for a large share worldwide. With the expansion of agricultural production scale and the change in production mode, climate change and biodiversity damage caused by the excessive use of chemical fertilizers and pesticides in the production process have seriously affected the stability of the ecosystem and human health. According to the Environmental Performance Index (EPI) 2022, jointly released by Yale and Columbia Universities, China scored only 28.4, ranking 160, far behind other countries such as Denmark, the UK, and Finland [1]. Agricultural non-point source pollution (ANPSP) is the excessive accumulation of nutrients such as nitrogen, phosphorus, and organic matter caused by improper use of chemical substances such as fertilizers, pesticides, and mulching films in the process of agricultural production, as well as improper disposal of livestock and poultry manure and crop waste [2,3]. The chemical substances represented by phosphorus and nitrogen enter the water through mass surface runoff, soil flow, farmland drainage, and underground seepage, which will lead to water eutrophication and water quality deterioration and even threaten the green development of agriculture [4]. According to data from the Ministry of Agriculture, the pollution caused by fertilizers and pesticides in China’s agricultural agglomeration areas is very serious, with a utilization rate of only 35.2%. The annual production of livestock and poultry manure is 3.8 billion tons, but the comprehensive utilization rate is less than 60%. According to the Bulletin of the Second National Census of Pollution Sources, the chemical oxygen demand of agricultural water pollutants discharged in China was 10.6713 million tons, 216,200 tons of ammonia nitrogen, 1,414,900 tons of total nitrogen, and 21,200 tons of total phosphorus1. The problem of agricultural non-point source pollution (ANPSP) is an important factor restricting the sustainable development of Chinese agriculture. Increasing ecological pollution is one of the biggest and most pressing challenges facing the planet, and the development of the banking sector is critical to achieving environmental sustainability [5,6]. Achieving clean and low-carbon production is a vision shared by all countries in the world [7,8].
Green finance (GF) is an economic activity designed to support environmental improvement, climate change response, and efficient use of resources [9]. It mainly provides financial services for investment and financing, project operation, and risk management for environmental protection, energy conservation, clean energy, green transportation, and green building projects. Unlike traditional finance, which focuses on economic returns and financial risks, GF focuses more on environmental and social benefits. Its core concepts include sustainability, responsible investment, and environmental risk management [10]. The key to effectively solving the problem of agricultural non-point source pollution lies in the support of GF. Through instruments like green credit, green bonds, and other financial mechanisms, GF channels funds towards low-carbon, clean energy, and environmental protection projects. This facilitates the transition of capital from high-pollution industries to low-pollution sectors, enhances returns on investments in green industries, improves fund availability, and mitigates pollution emissions [11]. The 20th National Congress of the Communist Party of China (CPC) underscored the vital role of financial backing for green development. It explicitly advocated for the rational allocation of resources, promotion of resource transfer to green and low-carbon projects, and facilitation of the transition of traditional industries towards ecological practices and the development of new green industries. In this context, ANPSP, as a significant driver of systemic environmental pollution, plays a crucial role in achieving sustainable agricultural development and ensuring human health and safety [12].
However, due to the characteristics of ANPSP, despite China’s robust policy and financial support for controlling such pollution, administratively driven fiscal policies have encountered a “dysfunctional” dilemma, making ANPSP control a key and challenging aspect of environmental governance. Relevant research data show that the utilization rate of fertilizers and pesticides in China’s three main food crops is only about 40%, and the comprehensive utilization rate of livestock and poultry waste is only 76% [13]. It can be said that China’s ANPSP management efficiency is low. The dispersion, hidden nature, and delayed characteristics of ANPSP exacerbate the situation, leading to a yearly increase in government financial support. Urgent expansion and supplementation of the tools for managing ANPSP are necessary. In this regard, GF should serve as a means to manage ANPSP effectively and play its crucial role. The inclusion of “green financial standardization construction” as a key project during the “13th Five-Year Plan” period, along with the formulation of guiding opinions by the CPC Central Committee and the State Council to comprehensively strengthen ecological environmental protection and fight pollution, signifies the steady advancement of GF standardization in China. With a positive trend in financial market development, financial support has become a primary driver in promoting the management of ANPSP and the development of ecological civilization.
In the context of dealing with global climate change, how to use the power of finance to reduce carbon emissions is the focus of attention. However, environmental pollution emissions from agricultural production cannot be ignored. It contributes to soil and water pollution and is detrimental to the achievement of the UN Sustainable Development Goals (SDGs) 6, 14, and 15. Financial power is urgently needed to achieve sustainable agricultural development and protect biodiversity. A large number of published studies have analyzed the role of green finance in rural sustainable development [14,15,16], especially in agricultural green development [17,18], agricultural green total factor productivity [19,20,21], and efficient land use [22,23]. However, in the existing literature, GF prefers to use carbon emission reduction indicators when measuring agricultural cleaner production. However, the control of ANPSP has been neglected [24,25]. The goal of this study was to determine whether green finance could help reduce ANPSP. If the answer is yes, in addition to investment in agricultural green projects and green production by farmers, can ANPSP be indirectly reduced through changes in external economic forces? The market signals released by green investment, green credit, green bonds, and green bonds related to green finance significantly affect the strategic decisions of market players, so it is necessary to reveal the potential intermediary path. Based on this, this article conducts research on the impact of GF on ANPSP. The significance of this research mainly lies in four aspects:
(1)
The theoretical aspect. Using the latest panel data from 30 provinces in China, the relationship between GF and ANPSP was validated, expanding the application scope of GF theory. At this stage, researchers focus on how to use limited financial funds to achieve low-carbon and sustainable agricultural development. However, non-point source pollution from nitrogen (N), phosphorus (P), and chemical oxygen demand (COD) emissions in agricultural production has been neglected. This study has enriched the understanding of green finance and agricultural cleaner production, and its conclusions have contributed to the literature of agricultural pollution control.
(2)
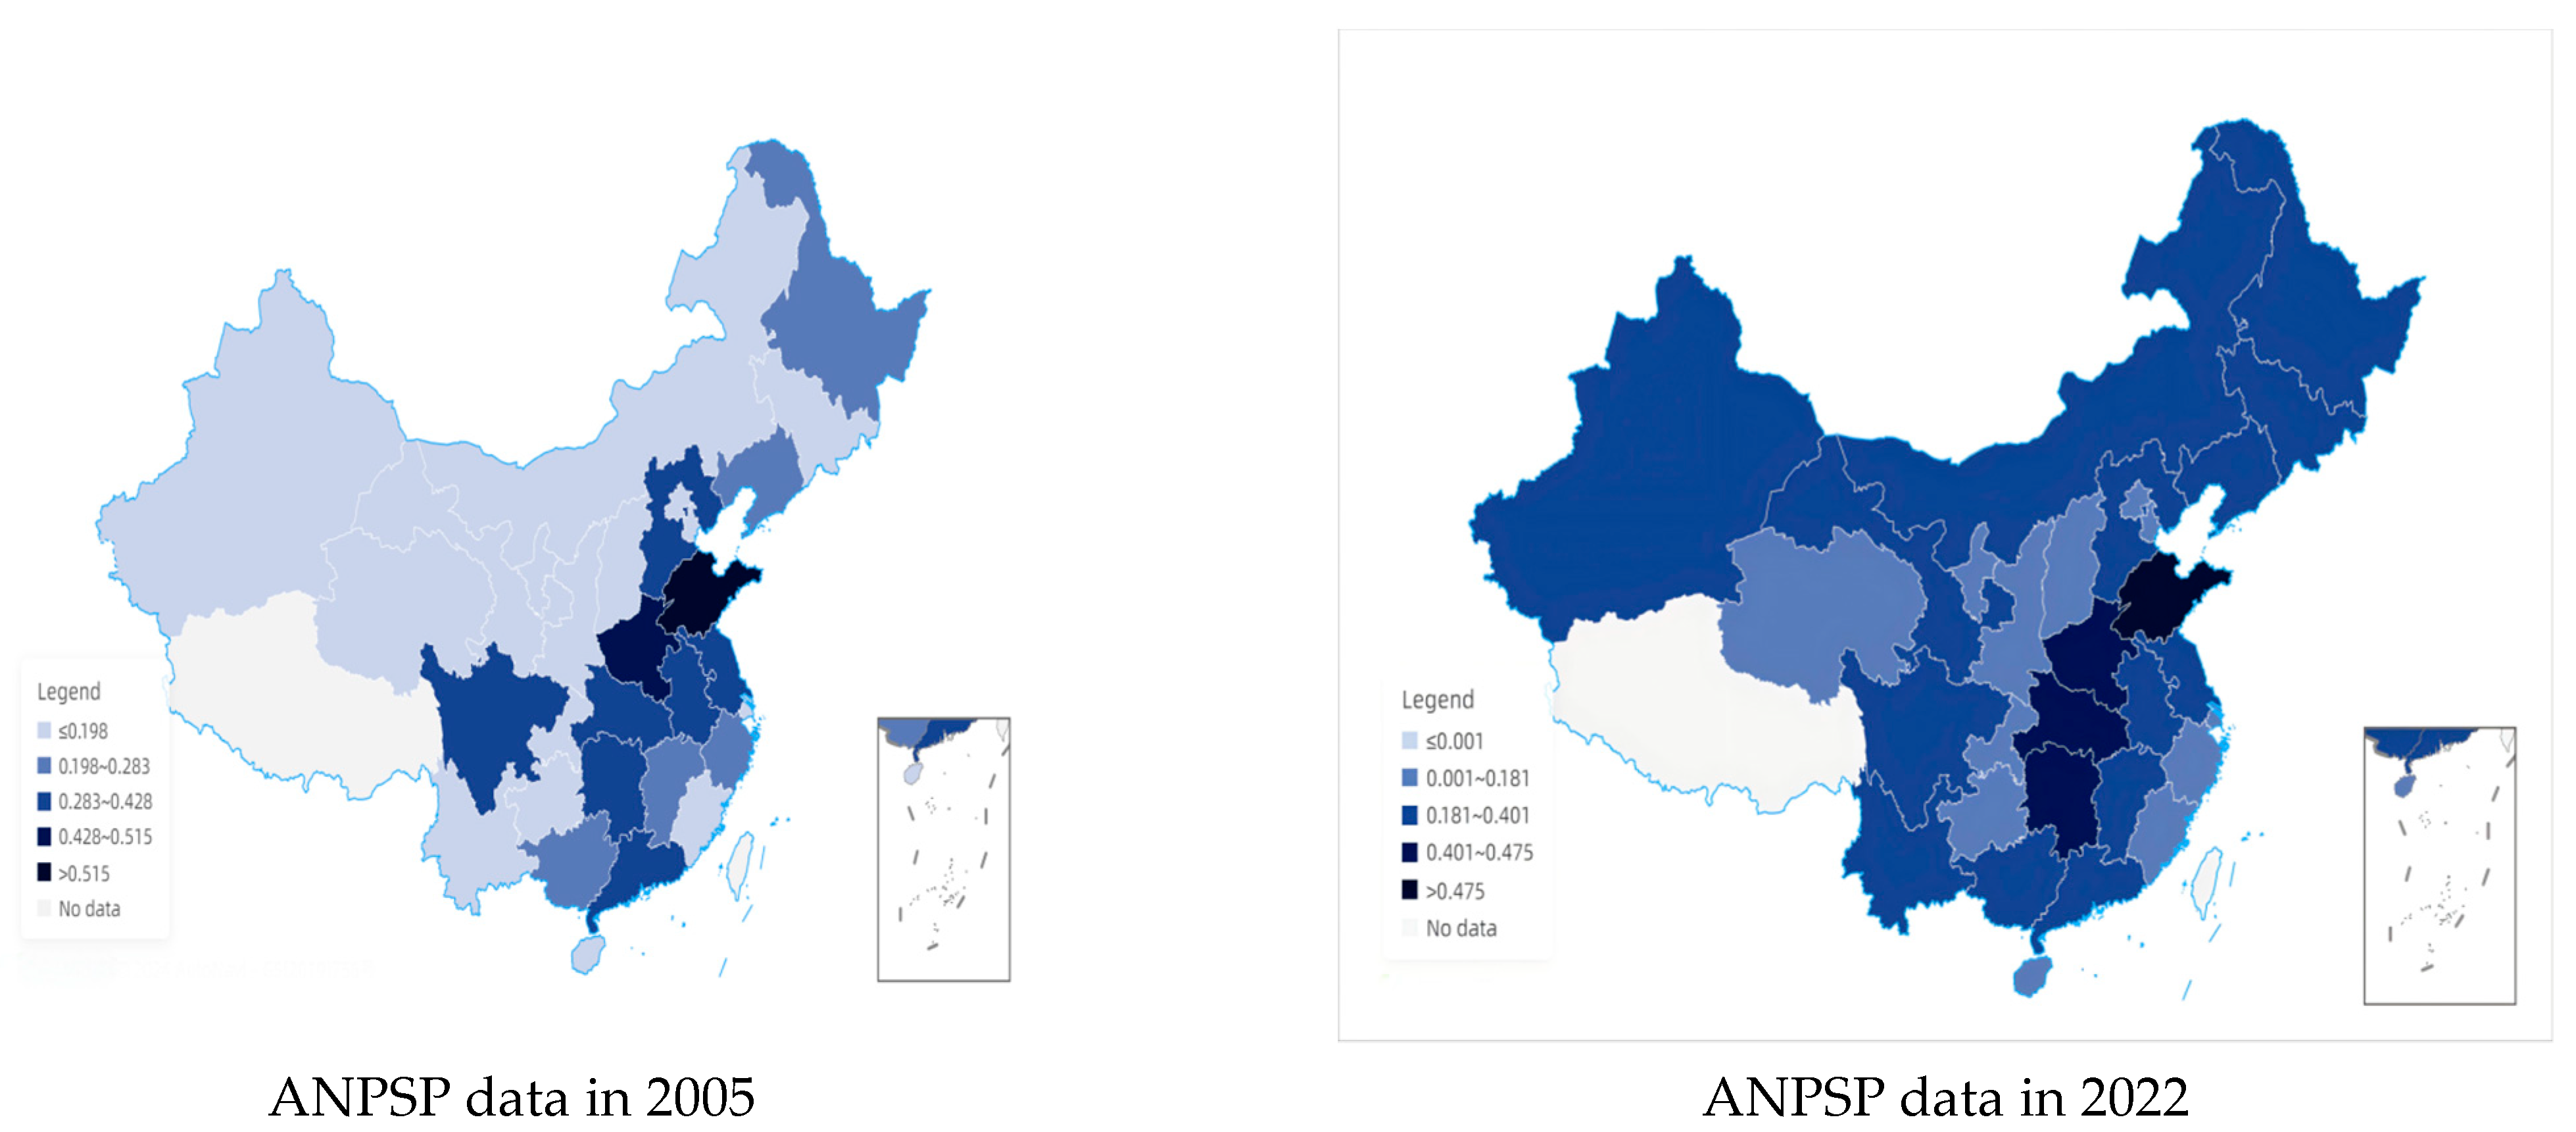
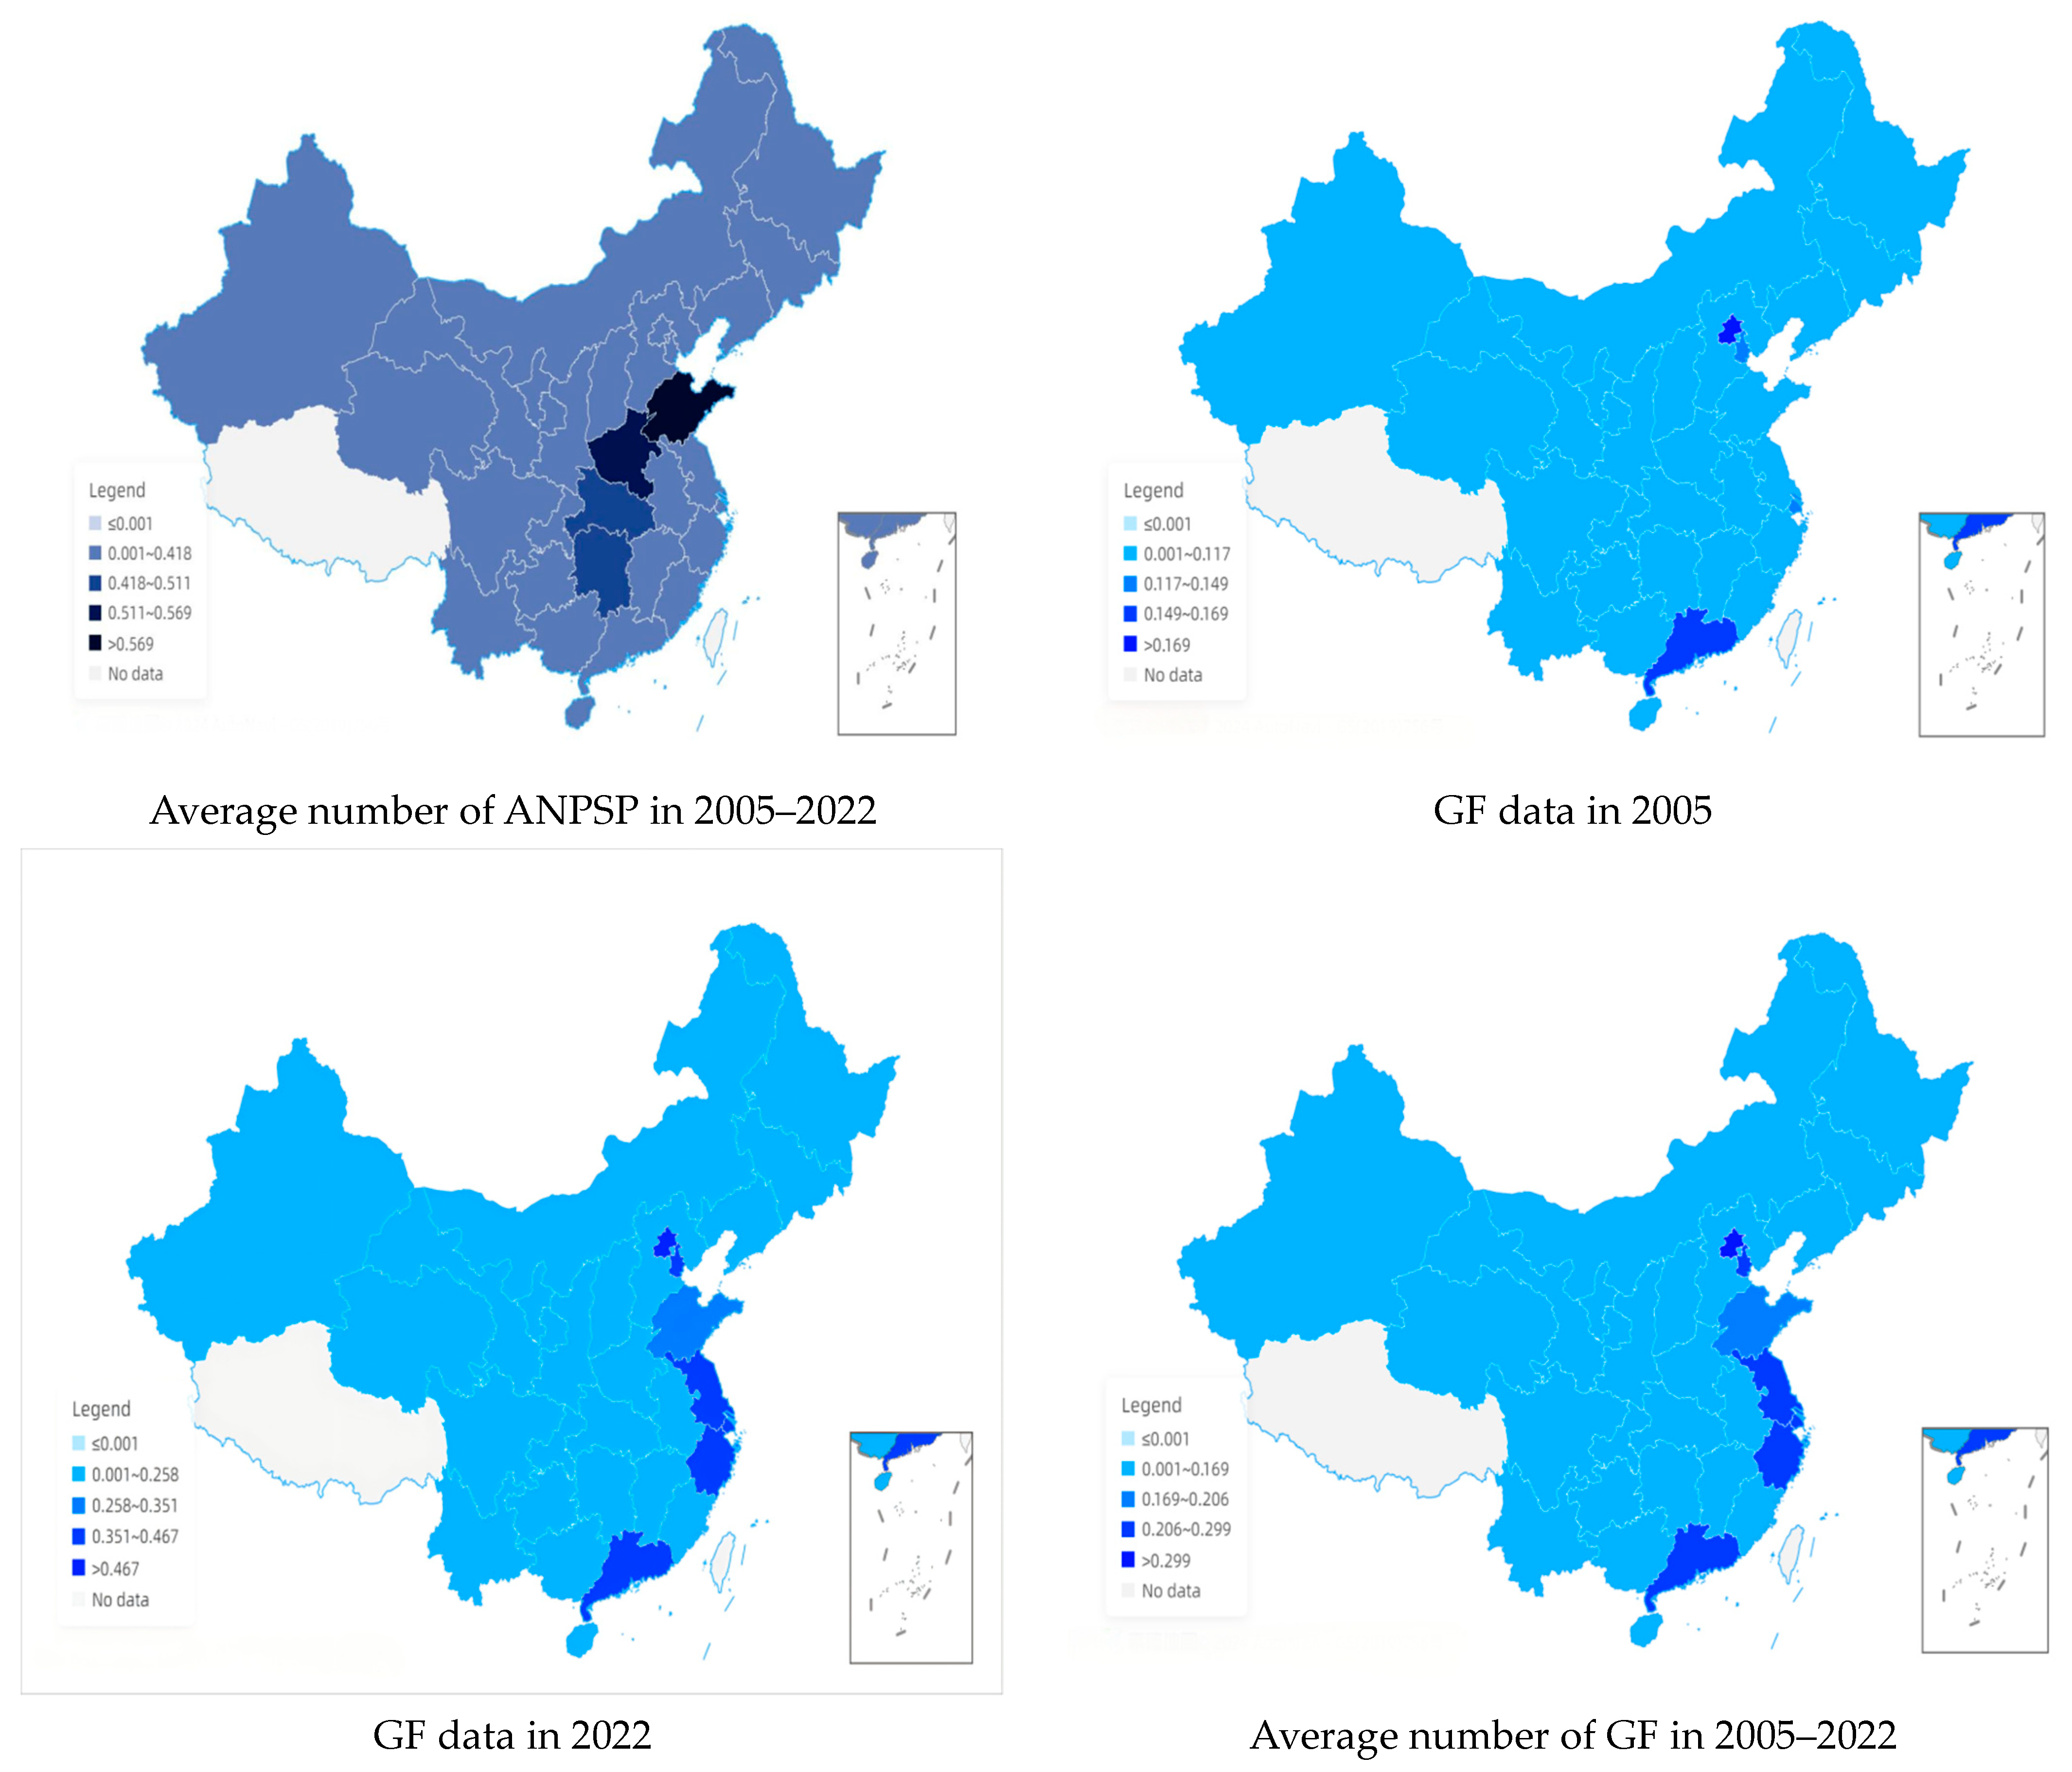
In terms of current situation analysis, by depicting the relevant status of GF and ANPSP, the preliminary effectiveness of ANPSP control can be described.
(3)
In terms of testing relationships. Clarifying the role of environmental regulation and land transfer as mediating variables in their relationship provides empirical evidence for understanding their mechanistic relationship. The conclusion is helpful for enriching the research perspective of financial and agricultural pollution control.
(4)
Policy guidance and sustainable development. Testing the relationship between GF and ANPSP, exploring whether the two have a positive or negative impact, and revealing the reasons behind it can provide practical decision-making guidance for policy makers. Since the main physical carriers of agricultural non-point source pollution are the soil and rivers, the conclusions of this study are particularly important for the achievement of the United Nations Sustainable Development Goals, especially SDG 6. It is obvious that in the process of controlling the flow of COD, P, and N to rivers, the water resources of urban and rural areas can be effectively protected. According to SDG 14 and 6, improving river water quality not only ensures the supply of clean water for cities and towns but also helps to protect underwater biodiversity. In addition, according to SDG 15, mitigation of soil pollution from non-point sources contributes to the protection, restoration, and promotion of sustainable use of land ecosystems and to halting the reversal of land degradation. Meanwhile, as the world’s largest developing country, China has the characteristics of a large population, large-scale agricultural production, rapid economic development, and increasingly prominent environmental issues, and these characteristics have a certain universality in the research practice of GF and ANPSP. Therefore, the research conclusions of this article can provide theoretical references for other countries and regions with similar situations.
The structure of this paper is as follows: The first part is the introduction, which outlines the research background, significance, gaps, and contributions. The second part is a literature review, analyzing the current research status of GF and ANPSP; the third part is theoretical analysis and research hypotheses, building a theoretical framework for the impact of GF on ANPSP. The fourth part is about methods, elaborating on data sources, research methods, and variable selection methods. The fifth part is empirical results and analysis, establishing a two-way fixed-effects model to test variable relationships, introducing mediating variables for mechanism analysis, and conducting heterogeneity analysis of economic development levels. The sixth part is the conclusion and policy implications based on the previous results, providing policy recommendations from the perspectives of financial institutions, governments, and others. Research limitations and prospects are also the focus of this section.

2. Literature Review

2.1. The Necessity of Using Green Finance to Reduce Agricultural Non-Point Source Pollution

GF, as a major driving force for sustainable and green development, has increasingly enriched its related research. GF can achieve sustainable environmental development through green supply chain management and innovative technologies [26]. In recent years, the Chinese government has actively promoted the establishment of a green financial system through various policy measures, including the introduction of green credit, green bonds, and support for the development and implementation of green projects [27]. China’s GF policy not only addresses urban environmental issues but also encompasses the agricultural sector, particularly focusing on the challenge of agricultural surface source pollution.
There are currently many studies on ANPSP, and many scholars have different research focuses. Driven by rainfall, terrain, and various influencing factors, monitoring ANPSP is challenging. With the rapid development of agriculture since the start of the 21st century, China’s major lakes and rivers have been increasingly affected by surface pollution, leading to the dangerous problem of eutrophication [28]. Due to the extensive use of fertilizers and the strengthening of modern agricultural practices, other countries and regions such as the headwaters in central Kentucky and the agricultural basins in the Korean Plateau are also facing ANPSP problems [29,30].

2.2. Measurement Methods and Treatment Measures of Agricultural Non-Point Source Pollution

After discussing the basic situation of ANPSP, we will examine its measurement and governance methods. There are two main methods for measuring agricultural surface source pollution. The experimental method involves selecting representative farms to test and measure pollutants discharged using modeling and monitoring methods [31]. The source strength estimation method, used for macro calculations, estimates pollutant loads per unit area from farmland fertilizers, livestock and poultry farming, farmland solid waste, and rural life [32]. In terms of governance instruments, two broad categories exist: “Pegu’s instruments” dominated by government macro-control and “Coase’s instruments” driven by market regulation mechanisms. Pegu’s approach advocates top-down government intervention to reduce environmental pollution by taxing polluters or subsidizing environmental protection efforts. The manure management regulations implemented by dairy farms in Wisconsin, USA, which regulate nutrients that pollute the environment, can have a significant impact on improving water quality [33]. Conversely, Coasean means rely on clear property rights definitions to transform environmental goods into private goods, thereby preventing the tragedy of the commons phenomenon and optimizing societal interests [34]. In studying the changing trends of ANPSP, the Environmental Kuznets Curve is often of concern. Durmaz et al. [35] confirmed the existence of an EKC curve relationship by studying the water abundance of the Kuznets curve in water pollution environments. However, there are certain differences in the direction and shape of the curve between developed and developing countries.

2.3. The Role and Challenge of Green Finance in Controlling Agricultural Surface Pollution

With the continuous development and evolution of the financial system, market-oriented green finance support has become an important tool to help govern ANPSP. Financial institutions can influence the environmental protection capacity of the production sector by incorporating environmental values into their financial products or services, thereby directing social funds to participate in pollution management, particularly in less developed areas [36]. Measures such as promoting organic fertilizers, improving livestock and poultry management, and supporting eco-agriculture not only reduce pollution but also enhance agricultural production efficiency, achieving economic and environmental benefits [37,38]. However, the application of GF in agriculture still faces numerous challenges. Some financial institutions may engage in greenwashing behavior, which involves raising funds through GF products but not investing in green agriculture projects and falsely disclosing environmental information. Furthermore, factors such as capital scarcity, technological limitations, and the immaturity of financial products and services may inhibit farmers’ adoption of ecological practices for soil and water conservation [39].

2.4. Research Gap

Although a small amount of the literature has analyzed the external forces to reduce ANPSP from different perspectives, the research on how to make full use of GF power to achieve agricultural cleaner production and reduce ANPSP is still worthy of further study. The gaps in the existing research are as follows:
(1)
GF, as an important tool for environmental protection, has been vigorously promoted, but there has been little in-depth exploration of its relationship with ANPSP. There is limited research on the relationship between China’s financial development and ANPSP, and the existing policies and financial instruments often fail to target specific problems in the agricultural sector, making the potential of GF in promoting agricultural technological innovation and sustainable practices yet to be fully explored [14]. Although a few studies have identified GF as an innovative solution to alleviate ANPSP, they have not analyzed the role of government environmental regulation and rural land transfer [40].
(2)
The measurement method and evaluation system of ANPSP need to be improved. When it comes to the measurement of agricultural surface pollution, the existing research is not comprehensive enough in their scope of measurement, mostly focusing on the pollution emissions of specific crops or specific regions, while there is insufficient systematic assessment of the agricultural sector as a whole [41]. Using a single or local source of pollution, such as fertilizer use or livestock farming, makes it difficult to fully cover all sources of pollution. The incomplete measurement of non-point source pollution may lead to the deviation of research results. This leads to a blind spot in the comprehensive understanding of pollution sources and the development of control strategies [42].
(3)
The existing research [41] has failed to explore the heterogeneity of GF and ANPSP at different economic levels. As a country with abundant geographical resources, China’s economy, agricultural production, environmental protection, and other situations vary among its provinces, and the impact of their institutional relationships may also differ.
Based on the aforementioned research gaps, the possible innovations of this article are reflected in three aspects. Firstly, innovatively integrating GF and ANPSP into a unified research framework. This method helps to further investigate the impact of GF on ANPSP, providing a new perspective and theoretical support for understanding how GF affects ANPSP through policy tools and market mechanisms. It also provides empirical evidence for optimizing the GF system and improving its efficiency in pollution control. Secondly, this study expanded the analysis scope of ANPSP by using a wide range of indicators, thus providing a more systematic and comprehensive evaluation of its comprehensive impact in China and providing solid data support and an analytical foundation for formulating more scientific and effective ANPSP governance policies. Thirdly, the heterogeneous effects of GF and ANPSP in regions with different levels of economic development were explored in depth. By comparing the dynamic relationship between GF and ANPSP at different levels of economic development, this study reveals the differences in the role of GF in ANPSP governance between economically developed and economically underdeveloped regions. Overall, this study fills the existing gap in the literature and provides more scientific and comprehensive insight into improving the effectiveness of GF in pollution control and emission reduction. Meanwhile, it provides a valuable reference for more effective management and prevention of ANPSP. In the research methods and research ideas, this paper utilizes panel data from 30 mainland Chinese provinces between 2005 and 2022. It constructs a GF index employing the entropy value method and assesses emissions from seven categories of agricultural non-point source pollutants (agricultural fertilizers, livestock and poultry farming, aquaculture, crops, rural life, pesticides, and agricultural films) using the inventory method. Moreover, this paper performs empirical analyses of the pollution control and emission reduction impacts of GF by developing a mediation effect model.

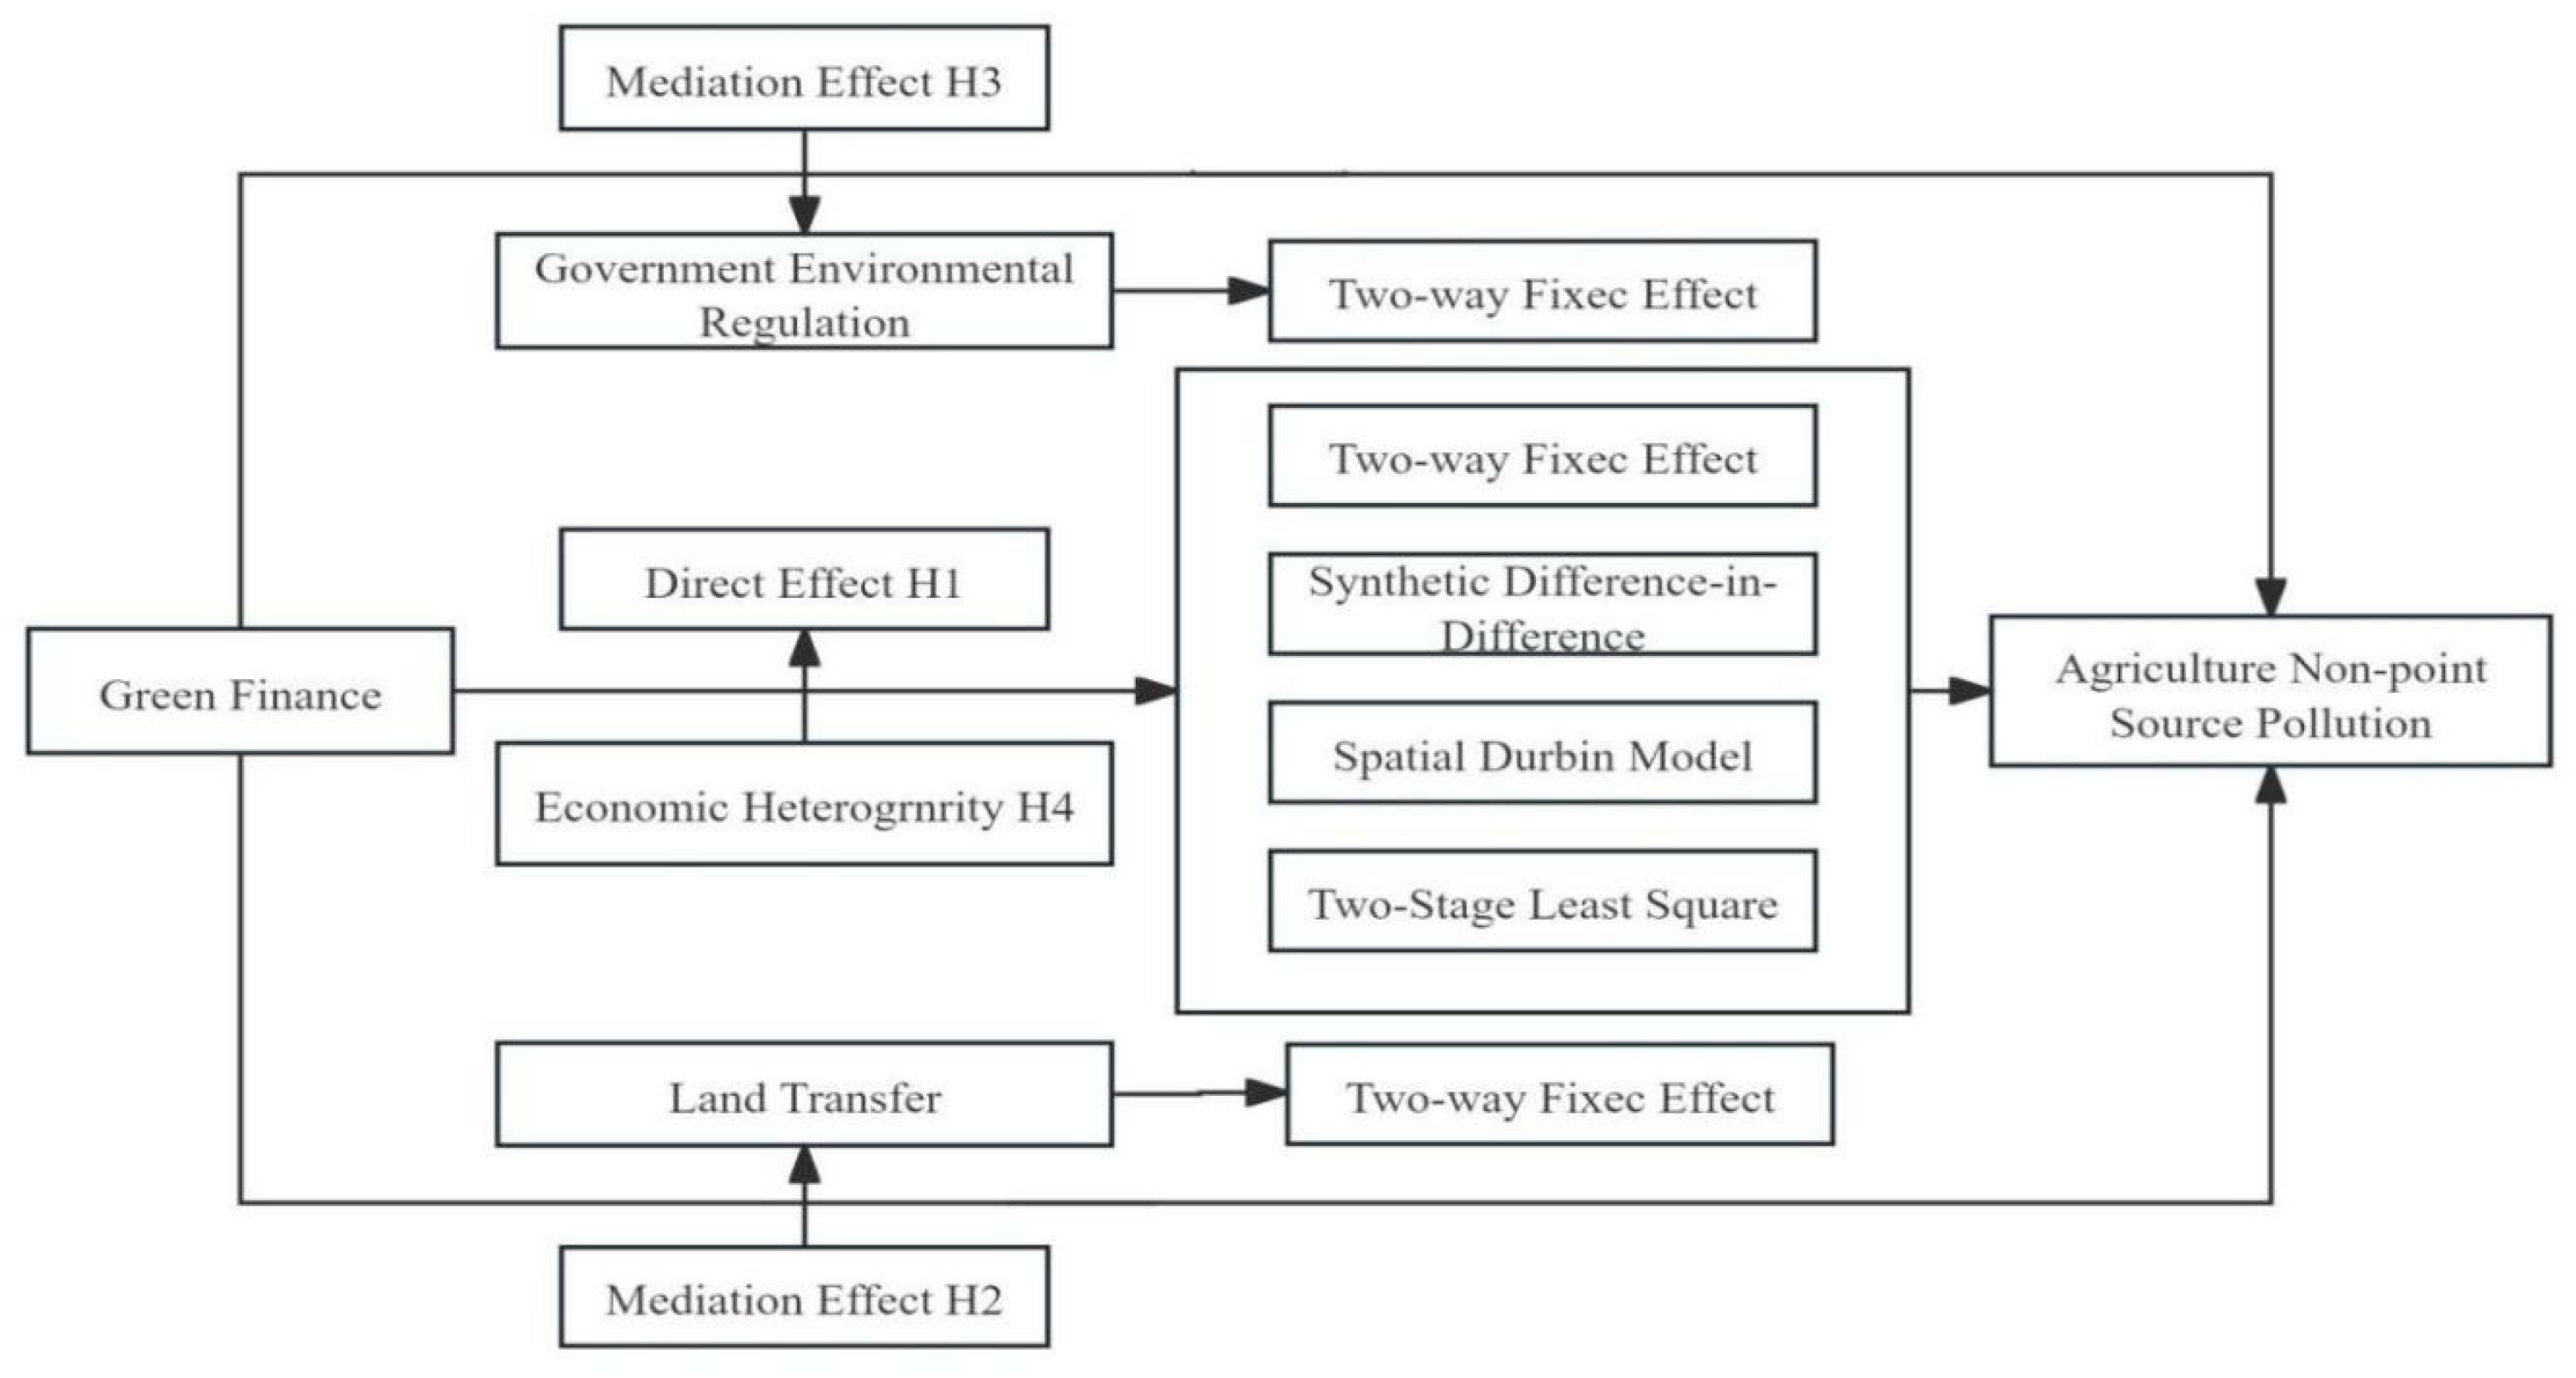
3. Theoretical Analysis and Research Hypotheses

3.1. Direct Effect of Green Finance on Agricultural Non-Point Source Pollution

Controlling ANPSP to achieve the green development of agriculture cannot be separated from financial support, especially in the field of agricultural science and technology innovation, and more medium- and long-term funds are needed to participate in improving the quality and efficiency of industrial development. GF, an emerging financial mechanism aimed at promoting environmentally friendly investments and projects, significantly influences the prevalence of ANPSP [43]. This impact is evidenced in several ways.
Firstly, GF fosters the sustainability of agricultural production by reallocating resources, thereby mitigating the adverse environmental effects of agricultural activities at their source. Compared with traditional financial services, GF pays more attention to the performance of indicators such as efficient use of resources and environmental protection in the production process. In the process of capital allocation, financial institutions will consider project profitability and green degree as a whole [44]. According to the assessment indicators required by green projects, agricultural production entities will be given preferential funds and financial supplies. In view of the differences in various subcategories of green agriculture and the development characteristics of different categories, financial institutions will consider credit models and product innovation. For example, institutions will use green credit, green bonds, and green funds to broaden financing channels and support green agricultural production in diversified ways. The green signal released by green credit will guide relevant market players to adopt clean production methods and control the input of fertilizers, pesticides, and agricultural film in agricultural production. For instance, green credit, China’s primary green financial product, imposes stringent environmental criteria for loan recipients and emphasizes rigorous credit assessment processes, indirectly raising financing costs for enterprises with high pollution and energy consumption levels.
Secondly, through resource reallocation, green credit reduces credit allocation to such enterprises, strictly prohibits support for restricted or newly established projects, increases the risk of exit for these high-polluting enterprises, sends market selection signals, and creates barriers for potential entrants [45]. Furthermore, GF facilitates the management of ANPSP through technological advancements. It promotes the adoption of eco-friendly agricultural technologies such as soil testing, precision fertilization, commercial organic fertilizers, and integrated water and fertilizer management. By supporting innovative research and development initiatives of enterprises, GF elevates the technological prowess of the agricultural sector. Consequently, the increased scientific and technical sophistication of farming operations drives the transition of agricultural production to large-scale and industrialized modern green agriculture. GF-derived green insurance also has the role of guiding the green development of agriculture.
Finally, GF promotes the green development intention of agricultural subjects through guiding incentive mechanism. With the support of relevant policies, GF attracts agricultural producers to develop green in their production and operation activities by providing attractive interest rate concessions and service convenience. For example, under the guidance of government subsidies and preferences, farmers take the initiative to reduce non-point source pollution generated in the process of production and operation and take corresponding measures to control it. By promoting green financial products in financial institutions, farmers will learn green financial knowledge and thus enhance their willingness to develop green agriculture. From the perspective of insurance products, green insurance mainly includes agricultural non-point source pollution environmental liability insurance, cultivated land capacity insurance, crop price (income) insurance, and forestry carbon sink index insurance. Its role in supporting the green development of agriculture is mainly reflected in the protection of cultivated land fertility, the control of agricultural non-point source pollution, and the harmless treatment of livestock and poultry. Hence, this paper posits the following hypothesis:
Hypothesis 1 (H1): 
GF helps to curb ANPSP.

3.2. Mediating Mechanism of Green Finance to Reduce Agricultural Non-Point Source Pollution

3.2.1. The Mediating Role of Government Environmental Regulation

Existing research indicates that intensifying government environmental regulation (ER) may initially reduce resource utilization efficiency [46], yet it is crucial to recognize that such regulation is instrumental in enhancing the effectiveness of environmental pollution control [47,48]. This is evident in two key aspects. First, ER creates cost-based comparative advantages across various agricultural sectors, thereby facilitating control and reduction of non-point source pollution. Specifically, sectors with high pollution levels incur greater “environmental taxes”, leading to increased production costs. These sectors often lack the research and development capacity to innovate technologically in the short term, thus eroding their comparative advantage. Conversely, green agriculture, with its inherent green competitive advantages, can mitigate environmental costs through optimized resource allocation and accelerated technological progress [49]. Secondly, ER spurs technological innovation and fosters the green transformation of the agricultural industry [50]. Green technology innovation and adoption are critical to achieving environmental sustainability [51]. As a result, agricultural enterprises enhance the quality of factor inputs, simultaneously phasing out obsolete production capacities and fostering emerging technological leaders. This process facilitates the diffusion of new knowledge, industries, and technologies, thereby advancing the green development of regional agriculture. Based on these considerations, this paper proposes the following hypothesis:
Hypothesis 2 (H2): 
GF inhibits the development of ANPSP through ER.

3.2.2. The Mediating Role of Rural Land Transfer

GF has the potential to curtail the advancement of ANPSP through land transfer, and its transmission mechanism can be delineated through the following three dimensions. Firstly, optimization of land resource allocation. GF, bolstered by financial backing, encourages agricultural stakeholders to embrace more efficient farming techniques. Consequently, this reduces the demand for land and other ecosystem resources, leading to diminished usage of ineffective inputs like chemical fertilizers and pesticides. This optimization effectively mitigates the negative externalities associated with agricultural production, fostering pollution control and emission reduction endeavors. Secondly, economic incentives for land transfer. GF incentivizes land transfer by providing economic inducements to agricultural producers who adopt sustainable agricultural practices. Through lowered financing costs and more lenient loan conditions, it facilitates financial support for agricultural producers, thereby facilitating the transition towards environmentally friendly agricultural production [52,53]. Thirdly, investment in agri-environmental technologies. GF support encompasses investment in environmentally friendly agricultural technologies. This implies that agricultural producers can secure funds to procure environmentally friendly agricultural tools such as conservation irrigation systems and eco-fertilizers. The application of these technologies aids in alleviating ecological pressures on land. Therefore, based on these observations, this paper posits the following hypothesis:
Hypothesis 3 (H3): 
GF inhibits the development of ANPSP through the degree of LT.

3.3. Economic Heterogeneity in the Impact of Green Finance and Agricultural Non-Point Source Pollution

Due to variations in economic development, resource distribution, and industrial composition across China’s regions, the advancement of GF also diverges accordingly. GF may further impede the proliferation of ANPSP in economically disadvantaged regions. This phenomenon can be attributed to two main factors.
Marginal improvement effect: In economically disadvantaged regions, the impact of GF interventions on environmental enhancement may be more pronounced due to the lower starting point of environmental governance. Even modest green investments and policy alterations could yield significant positive outcomes in these areas [54]. In economically developed areas, due to the maturity and completeness of the local environmental protection industry, the marginal improvement effect of GF is relatively limited, and its impact is not as significant as in economically disadvantaged areas.
Potential for technological catch-up. Backward regions have the capacity to directly adopt advanced environmental technologies and practices, bypassing traditional developmental stages. GF can furnish these regions with the requisite capital to embrace more efficient technologies, facilitating technological advancement. Through the integration of advanced technologies, lagging regions can expedite a synergistic relationship between environmental management and agricultural production, thereby further mitigating ANPSP. However, green innovation technologies in economically developed regions are already at the forefront of development, and their room for technological progress is not high, so their marginal benefits are also not as significant as those in economically underdeveloped regions.
Based on these observations, this paper posits the following hypothesis:
Hypothesis (H4): 
There is economic heterogeneity in the role of GF in ANPSP.

3.4. Research Framework

Grounded in the aforementioned assumptions, this paper develops a theoretical model to examine the impact of GF on ANPSP. Within this framework, GF is conceptualized as the level of green finance development, with ANPSP as the outcome variable. The model also combines the mediating effects of ER and LT to elucidate potential mechanisms. In terms of the application of econometrics, this article uses a two-way fixed-effects model for benchmark regression and mediation analysis. At the same time, in order to ensure the robustness of the results, this paper further used the synthetic differences-in-differences method, spatial Durbin model, and two-stage least square for robustness testing. The theoretical analysis model of this article is shown in Figure 1.

4. Methodology

4.1. Variable Setting

4.1.1. Explained Variable

Agricultural non-point source pollution. Agricultural production generates various forms of surface source pollution, predominantly consisting of total nitrogen (TN), total phosphorus (TP), chemical oxygen demand (COD), carbon emissions, and residues from pesticides and agricultural films. This pollution impacts the soil environment directly and also reaches water bodies through a combination of precipitation, topography-driven runoff (both surface and subsurface), and plant interception [55]. To measure agricultural pollution, this study employs the inventory analysis method based on unit surveys. This method points out that non-point source pollution in Chinese agriculture mainly comes from agricultural fertilizers, livestock and poultry breeding, solid waste from farmland, and rural life. Due to the complexity of environmental conditions in the basin, the scarcity of survey data, and the limitations of the mathematical model itself, the error caused by the traditional mathematical model is widely questioned by people. Under this background, the quantitative analysis method based on comprehensive investigation has been paid more and more attention and has become an important technique for the quantitative study of non-point source pollution [56]. Compared to large models such as the SWAT model, it is difficult to obtain data. The unit survey-based inventory method has the advantages of easy standardization and promotion and is suitable for agricultural non-point source pollution accounting at the provincial level [57,58].
Based on this, combined with the non-point source pollution coefficient of representative landform areas in the “Handbook of ANPSP Coefficient of the First National Pollution Source Census”, ANPSP is calculated. This article specifically estimates ANPSP from seven aspects: agricultural fertilizers, livestock and poultry farming, aquaculture, crops, rural population, insecticides, and agricultural plastic films. Table 1 provides a detailed list of the indicators used for this analysis.
The emission intensity of ANPSP is calculated as follows:
A N P S P = E T P + E T N + E C O D
E = i n E U i ρ i θ i
In Equation (3), the T E is the total emission of ANPSP; E T P , E T N , E C O D are the total emission of total nitrogen (TN), total phosphorus (TP), and chemical oxygen demand (COD), respectively. In Equation (4), the E U i is the statistic of the pollution unit i ; ρ i is the pollution production coefficient of the pollution unit; and θ i is the emission coefficient or loss rate. The pollution intensity of various units differs due to distinct influencing factors. For the calculation of emissions from ANPSP, the coefficients for the seven pollution units are utilized as follows:
(1)
Agricultural fertilizers. The primary pollutants from agricultural fertilizers include nitrogen, phosphorus, and compound fertilizers. This paper employs the output coefficient method to account for the variances in fertilizer loss rates due to different planting methods. Since the focus is on TN and TP pollution from fertilizer inputs, and the phosphorus fertilizer inputs in statistical yearbooks are indicated as phosphorus pentoxide (P2O5), these inputs are adjusted by multiplying them by 43.66%. Additionally, in line with recent domestic fertilizer practices and prior research findings, the compound fertilizer is converted to TN at 40% and P2O5 at 32%. The fertilizer loss coefficient is derived by averaging the results from different regional samples, based on existing studies [59]. This specific accounting approach is in accordance with the methods used in the second national pollution source census.
(2)
Livestock and poultry farming. The pollution emissions are calculated as the product of the total quantity of livestock and poultry (either in stock or slaughtered), multiplied by both the pollution discharge coefficient and the wastage coefficient. The discharge coefficients for feces and urine of livestock and poultry are sourced from SEPA data (2022). The formula applied is the following: livestock and poultry pollution intensity (kg per head per annum) = rearing cycle × fecal (urine) emission factor × fecal (urine) pollutant excretion coefficient. In this study, livestock and poultry statistics encompass cattle, sheep, and pigs. For cattle and sheep, which have a rearing period of more than one year, the total breeding amount is based on the year-end stock. For pigs, due to their rearing period of less than one year, the total breeding amount is determined by the current year’s output.
(3)
Aquaculture. ANPSP primarily arises from bait residues, aquaculture excreta, and chemicals. The extent of this pollution is contingent on the aquaculture type and method. The China Statistical Yearbook classifies aquaculture production into marine and freshwater categories. Given that artificial aquaculture is a significant pollution contributor, this paper exclusively utilizes data from freshwater aquaculture for its analyses. The primary aquaculture species include freshwater fish, crustaceans, shellfish, and other aquatic organisms. The production and discharge coefficients for aquaculture are derived from the First National Pollution Source Census: Handbook of Production and Discharge Coefficients for Pollution Sources in Aquaculture, supplemented by additional literature [60].
(4)
Crops. The primary pollutants from crops include residues, vegetable wastes, and other debris from agricultural production [61]. Given the diverse range of crops, this paper focuses on the seven most representative ones for analysis: rice, wheat, maize, beans, potatoes, oilseeds, and vegetables. The estimation of surface source pollution from agricultural solid waste involves calculating the crop residue yield based on the grass-to-grain ratio and determining the total nitrogen (TN), total phosphorus (TP), and COD content from the nutrient composition of the straw. Recognizing the varied straw utilization methods in rural areas, each with different nutrient loss rates, the final emission formula for farmland solid waste pollution is the following: emissions (tons) = total crop production (tons) × production coefficient × straw utilization structure × straw nutrient loss rate, where the production coefficient equals the grass-to-grain ratio multiplied by the straw nutrient content [62].
(5)
Rural life. Pollution in rural life primarily comprises domestic sewage and human feces. The annual production coefficients per capita for COD, TN, and TP in domestic wastewater are 5.84 kg/person, 0.584 kg/person, and 0.146 kg/person, respectively, with an emission factor of 100%. For human feces, the corresponding coefficients are 19.8 kg/person, 3.06 kg/person, and 0.64 kg/person, respectively, with an emission factor of 10% [63].
(6)
Pesticides. Pesticide residues are calculated as the amount of pesticides applied multiplied by a residue factor of 0.5.
(7)
Agricultural film. The amount of agricultural film residue is determined by multiplying the quantity of agricultural film used by a residue factor of 0.1.

4.1.2. Explanatory Variables

Green finance (GF). GF primarily aims to adhere to market economy principles while focusing on building an ecological civilization. China has started to comprehensively build a green financial strategy system since 2015, and in August 2016, the People’s Bank of China and seven other ministries and commissions jointly issued the Guiding Opinions on Building a Green Financial System, which guides and plans for the top-level design and system construction of GF and the innovation of green financial products and services, etc. China’s balance of local- and foreign-currency green loans and the scale of its domestic green bond stock have ranked in first and second place in the world, respectively. GF employs a range of financial tools, including credit, securities, insurance, and funds, to foster energy conservation, reduce consumption, and achieve a harmonious balance between economic resources and the environment. In the realm of existing literature, methodologies such as principal component analysis, the entropy value method, and hierarchical analysis are commonly used to determine the weights of GF development indicators. Following the approach of Li et al. [64], this paper develops indicators in seven domains: green credit, green investment, green insurance, green bonds, green support, green funds, and green rights and interests. Meanwhile, due to the objective entropy weight method determining indicator weights based on the degree of data dispersion, it can better reflect the advantages of subjective and objective weights and performs well in terms of scientificity, accuracy, and operability. This article uses the entropy weight method to integrate these indicators together to form the GF index, which evaluates the development level of GF. The entropy weight method is a method of calculating the entropy value of indicators and determining their weights based on the overall impact of changes in the numerical values of each indicator. The calculation steps are as follows: first, construct a judgment matrix, and then perform normalization processing, calculate information entropy, and determine entropy weight based on this, and finally calculate weight values. Detailed equations for the entropy weight method can be found in the published literature [65,66]. Table 2 provides detailed information on how to measure GF indicators and corresponding references.

4.1.3. Mediator Variables

Environmental regulation (ER). Most of the ER is conducted based on other environmental regulatory policies such as the sewage charging system, and China only formally started to implement environmental protection tax in 2018, successively amending the Law of the People’s Republic of China on Environmental Protection and the Law of the People’s Republic of China on Prevention and Control of Air Pollution and introducing the Law of the People’s Republic of China on Environmental Protection Tax, the Opinions on Complete and Accurate and Comprehensively Carrying out the New Development Philosophy of Doing Well in the Work of Carbon Peak Carbon-neutral Opinions on the Complete and Accurate Implementation of the New Development Concept and Good Carbon Peaking and Carbon Neutralisation Work and “Opinions on Deepening the Battle Against Pollution Prevention and Control”, and a series of environmental regulatory policies. The selection of the ER variable follows the methodology of Chai et al. [68]. This approach utilizes the frequency of terms related to “environmental protection” in local government work reports compared to the total word count of the report as an indicator. A higher frequency indicates a stronger commitment to environmental governance, thus reflecting the intensity of ER and addressing endogeneity concerns. Relevant terms include ecology, green, low carbon, pollution, energy consumption, emission reduction, sewage, sulfur dioxide, and carbon dioxide. As local government work reports are typically published early in the year, they predate and thus are not influenced by that year’s environmental conditions, further mitigating endogeneity issues.
Land transfer (LT). In China, under the policy guidance of building a strong agricultural country, guaranteeing national food security and the external drive of urbanization, the tendency of farmers to “leave farming” and “turn their backs on farming” has become more and more obvious, and the demand for land transfer has become more and more urgent. In May 2017, the General Office of the Central Committee of the Communist Party of China issued the Opinions on Accelerating the Construction of a Policy System to Cultivate New Agricultural Management Subjects, and the General Office of the State Council issued the Opinions on Accelerating the Construction of a Policy System and Cultivating New Agricultural Business Main Bodies; in the framework of the central policy, land transfer can promote agricultural operation and is an important part of the agricultural policy in various places. For the degree of LT, this paper adopts the rate of agricultural land transfer (calculated as the total area of family-contracted arable land transferred divided by the total area of family-contracted arable land operated) as the proxy variable. This rate is an effective measure of agricultural land transfer levels and is widely used in inter-provincial level studies.

4.1.4. Control Variable

Because there are many external factors that can reduce agricultural non-point source pollution emissions, the existence of these external factors beyond agricultural pollution has led to heterogeneity in the pollution reduction effect of GF. In order to reduce endogeneity issues caused by the omission of important variables, this study selected six external variables as control variables based on existing literature [17,20,26,35]. Firstly, the Environmental Kuznets Curve theory suggests that there may be an inverted U-shaped relationship between economic development and ANPSP pollutant emissions. Therefore, the per capita GDP based on 2005 prices is used to reflect the level of economic development (LED), and the results are controlled. Secondly, the improvement of regional transportation infrastructure can promote the transportation of agricultural production materials, thereby affecting ANPSP. Therefore, the year-end highway mileage is selected as the control variable to measure road accessibility (RA). Thirdly, technological progress can reduce resource redundancy in agricultural production, reduce unexpected output levels such as non-point source pollution, and optimize ecological efficiency. Therefore, this article chooses the number of invention patent applications at the end of the year to measure technological progress (TP). Fourthly, unlike point source pollution in the industrial sector, agricultural non-point source pollution has dispersed sources and is easily affected by hydrological and climatic characteristics. This article uses per capita water resources to measure climate conditions (NC). Fifth, the government can strengthen ANPSP prevention and control through administrative supervision, financial investment, and pilot demonstrations. This article uses the ratio of fiscal expenditures on agriculture, forestry, and related services to GDP to measure the government’s macroeconomic regulation of the agricultural sector. Sixth, optimizing the industrial structure and promoting the transformation and upgrading of agricultural production towards modernization and refinement can reduce the intensity of ANPSP from the source. Therefore, the proportion of the output value of the tertiary industry to the gross domestic product is chosen to measure the industrial structure (IS).

4.2. Data Sources

To ensure data availability and continuity, this study utilizes panel data from 30 provinces, autonomous regions, and municipalities in China, excluding Tibet, Hong Kong, Macao, and Taiwan, for the period 2005–2022 for empirical analysis. The reason for selecting the sample interval from 2005 to 2022 is that in 2005, the Kyoto Protocol came into effect; subsequently, various financial institutions gradually began to develop GF standards. For example, the International Capital Markets Association (ICMA) collaborated with international financial institutions to launch the Green Bond Principles (GBP), and the Climate Bond Initiative (CBI) developed the Climate Bond Standards (CBS). This year has certain policy representativeness. According to the development course of China’s agricultural economy, the Chinese government announced in 2005 that it would abolish the agricultural tax in 2006. The policy means that farmers do not have to pay any taxes or fees to the government. Under the guidance of predictable policies, farmers’ production enthusiasm will be greatly improved. The abolition of the agricultural tax may affect ANPSP emissions, as farmers are willing to expand their acreage. The reason for choosing 2022 is that the latest data available for the relevant variables is up to that year. The main data sources include CSMAR and Wind databases and the green patent database of China Research Data Service Platform, as well as various annual publications such as China Statistical Yearbook, China Industrial Statistical Yearbook, China Energy Statistical Yearbook, China Environmental Statistical Yearbook, China Rural Statistical Yearbook, China Agricultural Yearbook, and provincial statistical yearbooks. To address any minor data gaps, linear interpolation was employed, and logarithmic transformations were applied to all variables to mitigate heteroskedasticity bias arising from data extremes. Descriptive statistics of the empirical data are presented in Table 3.
Figure 2 shows the data for ANPSP and GF. Due to space constraints, only representative data were selected for presentation in this study. The picture is made according to the approval number GS (2019) 756.

4.3. Empirical Model

4.3.1. Benchmark Regression Model

To test the effect of GF on ANPSP, combined with Hypothesis 1 and relevant variable settings, this study constructed the following linear regression model:
A N P S P i t = α 0 + a 1 G F i t + a 2 C V i t + ν i + μ t + ε i t
In Equation (3), a 1 is the regression coefficient of GF, and its significance and symbolic direction are the focus of this study. Ideally, this study would consider the value of a 1 to be less than 0 and statistically significant. In the equation, α 0 is the constant term; CV is the set of control variables, which contains all the control variables mentioned in Section 4.1.4; a 2 is the regression coefficient of the control variable, μ t is the time fixed effect, υ i is the individual fixed effect, and ε i t is the random disturbance term subject to the white noise process.

4.3.2. Mediating Effects Modeling

Building upon prior analysis, it is posited that GF can influence ANPSP both directly and indirectly through the promotion of ER and the facilitation of land transfer. This paper advances the basic model (4), aiming to explore the mediating roles of ER and land transfer degree in the nexus between GF and ANPSP. The specific formulation of the model is presented as follows:
M V i t = α 0 + b 1 G F i t + b 2 C V i t + ν i + μ t + ε i t
In Equation (4), MV is the mediating variable, and b 1 is the regression coefficient of GF. The meanings of the remaining symbols are consistent with Equation (3). According to the theoretical framework of the existing literature, the two-stage intermediary effect model has the advantage of eliminating endogeneity. In Equation (4), this study focuses on whether the regression coefficient of GF is significantly positive.

5. Results

5.1. Benchmark Regression Results

To ensure the accuracy of the economic model, diagnostic tests were performed prior to regression analysis using a two-way fixed-effect model. The relevant diagnostic tests include the multicollinearity test, unit root test, and cointegration test. The results of Table A1 show that there are significant correlations among all variables, and the correlation coefficients of most variables are below 0.5. The results in Table A2 show that the maximum variance inflation factor (VIF) is 9.03 (in general, collinearity is only considered if the VIF is greater than 10), the minimum VIF is 1.64, and the average VIF is 4.47. The results in Table A1 and Table A2 imply that there is correlation but no common line between the selected variables in this study. Since standard short-panel data were used in this study, we performed the unit root test using four methods: HT, Breitung, IPS, and ADF. The results of Table A3 show that some variables fail the HT, IPS, and Breitung tests, so we have reason to believe that they are non-stationary. However, when we re-examine the first-order lag terms of the variables that fail the unit root test, we are surprised to find that all the variables pass the significance test. In this case, if the original variable is used for regression analysis, there will be a pseudo-regression phenomenon. However, if the first-order lag term of the variable is substituted into the equation, the economic significance of the model will be lost. Classical econometrics theory holds that if there is a long-term equilibrium relationship between economic variables in an economic model, regression analysis can be carried out by replacing the original variables. At this time, there is no need to worry about the problem of false regression. In order to accurately reflect the correlation between variables and retain the economic significance of the economic model, Kao, Pedroni, and Westerlund were, respectively, used to perform cointegration tests. The results of Table A4 show that the results of the three tests all show that the economic model constructed in this study passes the significance test and there is a long-term equilibrium relationship between the variables. All the test results show that the empirical model constructed in this study is scientifically reasonable. The empirical model can accurately reflect the relationship between GF and ANPSP.
Regression models commonly used in panel data analysis include ordinary least square method (OLS), random effect (RE) model, and fixed-effect (FE) model. The results of F test and Hausman test in Table 4 both show that the optimal regression model of the empirical model constructed in this study is FE. Based on the time continuity of the macro data, and in order to mitigate the endogeneity problem of missing important variables as much as possible, the two-way fixed-effect (TWFE) model was used as the baseline regression model. In addition, in order to satisfy the classical hypothesis of the linear regression equation as much as possible, we used the standard error of Driscoll and Kraay to deal with it. This method can ensure that the regression results are no longer threatened by heteroscedasticity, autocorrelation, and cross-sectional correlation.
The results in Table 4 show that, in the TWFE case, the regression coefficient of GF to ANPSP is −0.432, which is significant at the 5% level. The results suggest that GF could help reduce ANPSP emissions to some extent. The results of the other three models in Table 4 also show that the regression coefficient of GF on ANPSP is significantly negative. These results imply that Hypothesis 1 is valid. This indicates that, in terms of the development reality of China during the sample period, GF has had a suppressive effect on the increase in ANPSP levels.
GF is an important support for the governance of ANPSP in China. Firstly, green finance can meet the funding needs of environmental construction projects, fill the funding gap that government investment such as fiscal appropriations cannot meet, help improve the infrastructure construction of traditional agricultural production and operation, and develop high net worth green agriculture. Secondly, green finance intervenes in the agricultural production process by investing in agricultural projects, promoting the formation of new agricultural management entities. Finally, green finance also optimizes the agricultural industry structure by increasing the proportion of green industries. By providing financial resources to green enterprises and projects with high resource utilization and ecological friendliness, high polluting and high emission enterprises are forced to optimize their technologies or exit market competition.

5.2. Tests for Mediating Effects

In order to verify the mediating mechanism of GF to reduce the emissions of ANPSP emissions, this study performed a mediating effect test procedure according to Equation (4). Hypothesis 2 and Hypothesis 3 believe that ER and LT are important intermediary channels, so they are considered to be the explained variables of Equation (4).
The results in Table 5 show that the regression coefficient of GF to ER is 0.334, which is significant at the 1% level. This result means that GF will reduce ANPSP by providing the government with environmental oversight. Research Hypothesis 2 is tested. GF promotes the development of ER, thereby helping to reduce ANPSP. The reason behind this is that the financial support brought by green finance can optimize resource allocation and motivate more agricultural projects to undergo green transformation. At the same time, green finance policies and government environmental policies work together to provide guarantees for GF operation and further strengthen the effectiveness of ER. At this time, under multiple factors such as funding and government regulation, agricultural non-point source pollution is suppressed, promoting sustainable development of agriculture.
The results in Table 5 show that the regression coefficient of GF to LT is 0.132, which is significant at the 5% level. This result implies that GF will reduce ANPSP by promoting significant LT in rural areas. Research Hypothesis 3 is tested. The reason why GF can promote LT is that GF has expanded multiple financing channels through mortgage financing models such as carbon sinks, farmhouses, and rural land contract management rights, stimulated the willingness to transfer through multiple benefit distribution mechanisms, effectively solved the stubborn problems of traditional agricultural land transfer, and improved the efficiency of land transfer. When land transfer is significantly promoted, the spatial layout of farmland utilization is optimized. This not only helps promote the large-scale operation of agricultural land and achieve optimization and effective intensification of the agricultural industry but also significantly improves the ANPSP phenomenon caused by industrial development.

5.3. Robustness Tests

To ensure the reliability of the empirical findings, three robustness tests were used in this study.
Firstly, replace the core explanatory variable. On 31 August 2016, the People’s Bank of China and seven other ministries and commissions jointly issued the “Guidance on Building a Green Financial System”. The document aims to establish and improve China’s green financial system, give play to the function of the capital market to serve the real economy, and support and promote the construction of ecological civilization. The guideline also means that the Chinese government is actively exploring the high-quality development of green finance. The document mentions that green finance refers to economic activities that support environmental improvement, climate change response, and resource conservation and efficient use, that is, financial services provided for project investment and financing, project operation, and risk management in the fields of environmental protection, energy conservation, clean energy, green transportation, and green buildings. In 2017, the Chinese government implemented the green Finance Reform and Innovation Pilot Zone policy. The goal of the policy is to provide replicable experience for green finance innovation and related legal system improvement. Referring to the already published literature [69,70], this study uses the green finance reform innovation policies implemented in 2017 as a quasi-natural experiment. This study used the green finance reform and innovation Pilot Zone policy implemented in 2017 as a quasi-natural experiment, using the provinces where Huzhou, Quzhou, Nanchang, Guangzhou, Guiyang, Karamay, Hami, and Changji Hui Autonomous Prefecture are located as test zones and other provinces as control groups. Due to the small number of experimental groups compared with the control group, the difference-in-differences (DID) would cause bias in the regression results, so we adopted the synthetic difference-in-differences (SDID). SDID not only breaks through the limitation of the same trend hypothesis and the number of individuals in the treatment group but also has double robustness in its estimation results. The results in Table 6 show that after replacing the core explanatory variable, the average effect of GF on ANPSP is −0.136, which is significant at the 5% level. This result is consistent with the results in the baseline regression, which confirms the robustness of the results.
Second, replace the econometric model. This study selected the spatial Durbin model (SDM) to conduct robustness tests on the relationship between GF and ANPSP. Due to the regional and spatial correlation between GF and ANPSP. It will be influenced by various factors such as the natural environment, economic development level, agricultural production methods, and policy implementation intensity of the region, so its spatial factors need to be considered. The advantage of using spatial econometric models is that SDM models can capture spatial dependencies and heterogeneity between variables. By introducing a spatial weight matrix, it is possible to consider the spatial interactions between observations and estimate the impact of GF on ANPSP. As shown in model (6), the coefficient of GF’s impact on ANPSP is −0.377, which is significant at the 5% level, indicating that the development of GF can inhibit the development of ANPSP. This result indicates that after considering spatial factors, the benchmark regression results are still robust.
Finally, this study selects an instrumental variable (IV) for green finance and uses the two-stage least square (2SLS) method for regression analysis. The advantage of this method is to eliminate the potential endogeneity problems of the model, so that the conclusions can reflect the causal relationship between the variables. The endogeneity of economic models mainly comes from measurement errors, omission of important variables, and two-way causality. Although the TWFE used in this study has some advantages in eliminating missing important variables, reverse causality between variables cannot be avoided. For example, it is difficult to determine whether the rapid development of green finance is because the dire situation of rural environmental pollution has forced governments and financial institutions to focus on the urgency of financial responses. In general, the results obtained by TWFE are considered to be statistical correlations between variables. Assuming that researchers need to obtain causal correlations between GF and ANPSP, causal inference methods such as policy assessment and instrumental variables are required. According to the theoretical framework of the existing literature [71,72], this study uses two variables of the first-order lag term and the first-order difference term of green finance to construct a Batik instrumental variable. This tool variable is mainly constructed by using the interaction terms of two variables, that is, I V = L . G F × D .GF. As can be seen from Table 6, the results of the validity test of instrumental variables show that the LM statistic of the over-recognition test is 12.947, which is significant at the 1% level, which means that the instrumental variables are identifiable. The Cragg–Donald Wald F statistic of the weak instrumental variable test is 22.66, which is greater than the 10% critical value of 16.38, which means that the instrumental variable is valid. The results of 2SLS show that the regression coefficient of GF to ANPSP is −0.425, which is significant at the 5% level. This result implies that the conclusion that GF can reduce ANPSP emissions is robust based on the perspective of causal inference.

5.4. Heterogeneity Analysis

Considering the vast territory of China and the significant differences in resource endowments and economic development levels among different regions, the impact of GF on ANPSP may exhibit regional heterogeneity. Therefore, in order to investigate whether regional economic differences affect the effectiveness of GF in mitigating ANPSP, this study used the average GDP during the sample period as a standard to divide the whole sample into economic development leading areas (EDLAs) and economic development catch-up areas (EDCAs). This study mainly uses the subsample method to test the heterogeneity of pollution reduction caused by economic differences. The research method was TWFE. The reason for choosing to use average GDP as the basis for regional heterogeneity classification is that GDP measures the total value of the final results of production activities of all resident units in a country or region during a certain period of time and directly reflects the overall size and strength of the regional economy. Therefore, the difference in economic scale between different regions can be visually observed through the average GDP, thus reflecting regional heterogeneity.
As demonstrated in Table 7, a comparison of the estimated coefficients’ magnitude and significance reveals that GF impact on ANPSP is only pronounced in EDCAs. We can clearly see that the regression coefficients of GF in the two samples are 0.214 and −0.242, respectively, and the regression coefficient of GF passed the significance test only in EDCAs samples. This result implies that the effect of GF on ANPSP is stronger in provinces with a lower level of economic development. The possible reason behind this is that due to poor infrastructure and relatively weak environmental sanitation management in areas with lower levels of economic development, there is a more urgent demand for green financial products and services that promote green transformation and technological innovation, which makes the promotion of green growth policies in the region more effective. Meanwhile, residents in areas with lower levels of economic development may rely more on local natural resources and agricultural production, which makes the management of agricultural surface pollution more effective than in areas with higher levels of economic development [73]. Regions with higher levels of economic development also have higher levels of green innovation technology, and the transformation and upgrading of industrial structure can approach or even reach Pareto optimality. And the proportion of agricultural industry is relatively small, the production mode is cleaner, and the marginal utility of GF decreases. The GF practice case is in Xiangshan County, Ningbo City, Zhejiang Province, China. The total output value of agriculture, forestry, animal husbandry, and fishery in Xiangshan County ranks first in Ningbo City, and its agricultural development is somewhat representative. As an economically leading region, the implementation and execution of GF policies in this area are relatively good, and a “complementary fishing and light” green finance loan policy has been proposed. However, the marginal utility of implementing this policy is not high, and the revenue after the project is completed is not substantial.

6. Conclusions and Policy Implication

6.1. Conclusions

The analysis region of this article is China. As the world’s largest developing country and agricultural powerhouse, China’s practical experience in GF and ANPSP can inspire other countries with similar national conditions to explore green finance and agricultural pollution control paths that are suitable for their own national conditions. Meanwhile, it can assist in the innovation of GF products and the formulation of international standards, providing a more stable and transparent environment for cross-border investment and trade. ANPSP is an important cause of surface water quality damage. This paper examines the significant impact of GF on reducing ANPSP and explores its direct effects and mechanisms on ANPSP at a theoretical level. Utilizing panel data from 30 Chinese provinces from 2005 to 2022, this study applies panel fixed-effect and intermediary effect models to assess the impact and influence mechanisms of GF on ANPSP from a multi-dimensional perspective.
Although financial services can theoretically promote the green development of agriculture, empirical studies do not fully support this conclusion. On the contrary, some empirical studies show that the impact of financial services on the green development of agriculture is not significant and even has a negative correlation [74]. The existing literature finds that the emission reduction effect of green finance on ANPSP is not certain [75]. When the GF system is not perfect, farmers’ green development concept is weak, and green credit standards are not clear, GF will aggravate rural ecological environment problems. When the standard of the green agricultural production project is not clear, the agricultural credit of ordinary farmers increases the possibility of non-green agricultural capital input. In order to promote the increase in agricultural production, the financial support funds for agriculture are likely to lead farmers to increase the input of chemical elements, which will have adverse effects on the agricultural environment [76,77].
Consistent with the published literature [78,79], the results of this study suggest that GF will significantly reduce ANPSP. The conclusion is still valid after a series of robust tests. The clean production of agriculture cannot be separated from the support of financial funds. With the support of green and inclusive financial power, farmers and enterprises have the willingness and ability to scale up production and use green technologies for agricultural production [80,81,82]. With the rapid development of digital technology and Internet technology, financial technology has made revolutionary development. Green finance, with the support of information technology, provides financing for low-income groups and agricultural enterprises in green development [83]. ER and LT, as mediating variables, play a positive partial mediating role in the impact of GF on ANPSP. GF has partially reduced ANPSP emissions by strengthening government environmental regulation and promoting land transfer, which is consistent with the study by Li et al. [84]. The results of the heterogeneity analysis found that the negative effect of GF on ANPSP is more significant in regions with lower levels of economic development, which is also consistent with the findings of the published literature [69].
Contrary to the view in the existing literature [80,81,82,85] that GF and rural finance are detrimental to green rural development, the results of this study suggest that GF can help reduce ANPSP emissions. The conclusions of this study are consistent with those of the published literature [78,79,86]. Furthermore, this article verifies for the first time the mediating role of ER and LT in their relationship, which supplements the understanding of the impact mechanism of GF in the existing literature and provides a new perspective for theoretical and empirical research. Finally, this study also explored the significant heterogeneity of the impact of GF on ANPSP under different levels of economic development, providing richer theoretical support and empirical evidence for understanding its relationship in different contexts and mechanisms.

6.2. Policy Implication

Based on these findings, this paper recommends the following actions:
(1)
The relevant part needs to improve the infrastructure and product standards of green finance to support the green development of agriculture. To maximize the impact of GF on addressing ANPSP, it is imperative to clearly define the strategic direction and functional roles of financial institutions in supporting rural ecological civilization. This involves enhancing the provision of green credit by small- and medium-sized banks, expanding the scope of financial subsidies, and increasing incentives for investments in GF, particularly in areas of taxation and technological innovation. These measures aim to effectively curb the financial constraints associated with managing ANPSP. Additionally, optimizing the policy framework for the growth of agriculture-related GF is essential. This includes offering preferential treatment to green credit products and prioritizing compensation rights for green bonds and other financial instruments. China’s agricultural standards mainly focus on farm construction, production process, and the quality and safety of agricultural products. However, the standardization system for green environmental protection and ecological sustainability needs to be improved. The national agricultural authorities should speed up the establishment of green agriculture-related standards and provide reference standards for green credit, green bonds, and other financing instruments to provide access thresholds and supervise according to the standards to prevent “green bleaching” problems. Relevant government departments can guide agriculture-related enterprises and producers to pay attention to environmental testing, pollution control and ecological protection through the formulation of green agricultural credit evaluation standards.
(2)
Harmonizing GF and ER policies. Creating synergies between GF policies and ER is vital for effectively tackling ANPSP. Firstly, governments and regulatory bodies should establish and enforce transparent, equitable ER, including the implementation of environmental administrative agreements. These agreements should recognize the equal standing of governments and entities responsible for ANPSP, ensuring clear communication during negotiations to balance economic and environmental benefits. Secondly, enhancing environmental support through initial lenient ER policies encourages innovation that improves the efficiency of ANPSP control. Specific measures include offering subsidies, loans, or other financial aid for technological upgrades and industrial transformation to meet new environmental standards. Lastly, financial institutions must innovate green financial products and services in accordance with ER requirements to avoid problems such as mismatched financial products with green development needs and low market acceptance of green financial products.
(3)
Optimizing land transfer policies. To encourage farmers’ participation in land transfer and facilitate large-scale agricultural land management, government departments must enhance the rural land transfer system and environment. This includes refining the mechanism to incentivize practices that reduce ANPSP, implementing and improving the “three-rights partition” system of agricultural land, and establishing an efficient and reliable platform for agricultural land transfer and trading. The government should play a guiding role in the establishment and improvement of the rural property rights trading platform and standardize the agricultural land transfer market. This requires government departments to formulate a price guidance mechanism for large-scale land transfer according to local conditions and provide price consultation for both sides of land management right transfer negotiation. Financial institutions should not adopt a single or traditional way to support land circulation and should comprehensively consider the land circulation situation and other factors in each region according to their own business capabilities and advantages. The innovative financial products related to the transfer of agricultural land mainly include the mortgage of land management rights, agricultural land bonds, land securitization, land banks, and land funds. These financial products must be continuously innovated according to local conditions. Agricultural land trust transfer, as one of the innovative transferring methods, plays an important role in promoting land moderate scale management and clean production and creates good conditions for effectively releasing land management rights. In order to further activate the right of management of agricultural land and promote the promotion of trust transfer of agricultural land, the Chinese government should formulate normative documents of trust. At present, there is a Trust Law as legal support, but it is not detailed to the level of agricultural land trust. The authors suggest that this should be confirmed in the Trust Law, and the Rural Land Contract Law should clearly list the trust transfer of agricultural land.
(4)
Tailoring policies to regional economic heterogeneity. Policies must be adapted to the varying levels of regional economic development. In less economically developed areas, it is essential to strengthen and refine the rural financial system. This involves using tax incentives and other policies to motivate rural financial institutions, like the Agricultural Credit Union, to expand their lending to green agricultural production. Moreover, increasing awareness and education about GF in rural areas can improve farmers’ recognition and participation in green financial initiatives, fostering the growth and interaction of ecological products and GF. In contrast, regions with higher economic development require not only policy-based financial support for agriculture and improved financial literacy but also the establishment of a comprehensive rural financial supervision system. This system should regulate the financial activities of rural financial institutions through laws and regulations, aiming to redirect their investments from non-agricultural sectors to agricultural ones. At the same time, as an agricultural powerhouse, China has diversified its agricultural production, covering small-scale household contract farming to large-scale mechanized agriculture. The terrain is complex, and there are significant differences in agricultural production conditions among different regions. The mechanization level is higher in plain areas, and the opposite is true in hilly and mountainous areas. The climate is diverse, from the cold temperate zone in the north to the subtropical and tropical zones in the south, with diverse agricultural production environments and high levels of uncertainty. In this context, China’s agricultural development faces the challenge of balancing green development and efficiency improvement. Countries with similar agricultural conditions to China, such as India and Brazil, also face problems such as abundant natural resources but complex agricultural environments and high pressure on agricultural governance. Therefore, these countries can learn from China’s experience in GF and ANPSP governance and guide the transformation of agriculture towards sustainable development through fiscal and financial policy support.

6.3. Limitations and Future Research Directions

Although this article provides a relatively systematic exploration of the relationship between GF and ANPSP, there are still some limitations that need to be improved in future research.
Firstly, in terms of data selection, due to the availability of data, this study only relies on provincial-level data in China. This limitation may overlook important local changes and subtle differences, and the research results have limited reference value for other countries and regions. This article proposes possible future research directions. Firstly, future research can improve the analysis by utilizing Chinese prefecture level data, county-level data, or data from other countries, which will enable us to more accurately study the impact of GF on ANPSP in different countries and regions. As mentioned in the article, in 2017, the Chinese government issued the Guiding Opinions on Building a Green Finance System and selected some regions as pilot zones for green finance reform and innovation. Although this study used instrumental variable methods to make the conclusions more causal than simple statistical correlation, non-professional causal inference methods can also cause certain biases in the conclusions of this study. The authors strongly recommend using the 2017 policy document for policy assessment when using corporate or city data. In terms of research methods, DID and SDID are recommended.
Secondly, the time frame of this study is limited to the past 18 years, and no predictive analysis has been conducted on future trends. This limitation may affect the ability of the study to provide forward-looking policy recommendations. Machine learning and other methods combined with predictive analysis can improve the ability to predict future trends of GF and ANPSP, thereby providing more forward-looking policy recommendations.
Third, although this article used the inventory method to select and measure more than ten agricultural surface pollution indicators, it failed to include other factors such as climate change and water sources that affect ANPSP in the measurement scope, and the calculation of ANPSP is not comprehensive enough. Future research can integrate hydrological models such as the Soil and Water Assessment Tool or Hydraulic Simulation Program to better understand the relationship between ANPSP and geographical environmental factors such as climate and water sources.
Fourthly, this study used generic data to reach relevant conclusions. This is despite the fact that we show the superiority of green finance in reducing pollution from non-point agricultural sources. However, the conclusions we reached are only the relationships reflected at the data level, and the conclusions are also general. This study can only help researchers and relevant market players to realize that green finance is an important tool for protecting rural ecological environment and promoting sustainable development, but our conclusions cannot specifically guide financial institutions and farmers to formulate specific strategies. Empirical data analysis is flawed in guiding practice, so the authors call for case studies. In our opinion, the use of specific green credit cases is recommended. Grounded theory, interview survey, and ethnographic methods are highly recommended.
Finally, the rest of the world needs to be cautious in making policies. This study used macro panel data for China from 2005 to 2022. Although China is the largest developing country in the world, its achievements and advanced experience in agricultural environmental governance have contributed to global environmental governance. However, due to different national conditions, I suggest that relevant people should be cautious about the conclusions of this paper when formulating their own agricultural and financial policies.

Author Contributions

Conceptualization, G.G. and Y.S.; methodology, Y.S.; software, Y.S.; validation, G.G., C.D. and Y.S.; formal analysis, G.G.; investigation, C.D.; resources, G.G.; data curation, Y.S.; writing—original draft preparation, G.G. and C.D.; writing—review and editing, Y.S.; visualization, G.G.; supervision, Y.S. All authors have read and agreed to the published version of the manuscript.

Funding

This research received no external funding.

Institutional Review Board Statement

Not applicable.

Data Availability Statement

Data derived from public domain resources. The data presented in this study are available in China Statistical Yearbook [https://data.cnki.net/yearBook?type=type&code=A] (accessed on 24 February 2024) and Express Professional Superior data [https://www.epsnet.com.cn/index.html#/Index] (accessed on 25 March 2024).

Conflicts of Interest

The authors declare no conflicts of interest.

Appendix A

Table A1. Pearson correlation test results.
VariableANPSPGFPGDPTYZLRoadGovWater
ANPSP1
GF−0.232 ***1
PGDP−0.214 ***0.839 ***1
TY−0.444 ***0.774 ***0.673 ***1
ZL0.146 ***0.830 ***0.756 ***0.534 ***1
Road−0.774 ***−0.176 ***−0.190 ***−0.363 ***−0.198 ***1
Gov−0.073 *−0.247 **−0.201 ***0.101 ***0.314 ***0.194 **1
Water0.252 ***−0.290 ***−0.367 ***−0.276 ***−0.301 ***0.414 ***0.401 ***1
Note: *, **, and *** are significant at the 10%, 5%, and 1% levels, respectively.
Table A2. Results of multiple collinear tests.
VariableVIF1/VIF
GF9.030.111
TPs8.300.120
LED3.940.254
IS3.490.286
RA3.140.319
CN1.770.565
MR1.640.611
Mean VIF4.47
Table A3. The result of the unit root test.
VariableHTBreitungIPSADF
ANPSP−0.205 ***−8.955 ***−11.738 ***−11.381 ***
GF0.474 ***−1.741 **−2.804 ***−7.974 ***
TPs0.990 ***−1.067−0.673−8.388 ***
L.TPs0.307 ***−2.803 ***−1.843 **−7.929
LED0.9865.5611.377−9.677 ***
L.LED0.385 ***−2.732 ***−2.041 **−9.752 ***
CN0.069 ***−5.939 ***−9.542 ***−10.424 ***
MC0.439 ***−2.377 ***−5.707 ***−7.388 ***
RA10.3110.809−9.684 ***−6.232 ***
L.RA0.465 ***−1.387 *−9.342 ***−5.919 ***
IS0.832 ***−1.129−1.274−8.217 ***
L.IS0.513 ***−1.574 *−1.322 *−8.168 ***
Note: in the ADF test, this study reports the results of Inverse logit; *, **, and *** are significant at the 10%, 5%, and 1% levels, respectively.
Table A4. The result of the cointegration test.
MethodStatisticResult
KaoModified Dickey–Fuller t−15.669 ***
Dickey–Fuller t−17.637 ***
Augmented Dickey–Fuller t−7.168 ***
Unadjusted modified Dickey–Fuller t−24.389 ***
Unadjusted Dickey–Fuller t−19.211 ***
PedroniModified Phillips–Perron t6.025 ***
Phillips–Perron t−15.094 ***
Augmented Dickey–Fuller t−17.850 ***
WesterlundVariance ratio−2.036 **
Note: ** and *** are significant at the 5% and 1% levels, respectively.

Note

1
Data from the Ministry of Ecology and Environment, PRC: https://www.mee.gov.cn/home/ztbd/rdzl/wrypc/zlxz/202006/t20200616_784745.html (accessed on 9 September 2024).

References

  1. Zhou, D.; Kongkuah, M.; Twum, A.K.; Adam, I. Assessing the impact of international trade on ecological footprint in Belt and Road Initiative countries. Heliyon 2024, 10, e26459. [Google Scholar] [CrossRef] [PubMed]
  2. Du, B.; Wu, L.; Ruan, B.; Xu, L.; Liu, S.; Guo, Z. Can the best management practices resist the combined effects of climate and land-use changes on non-point source pollution control? Sci. Total Environ. 2024, 946, 174260. [Google Scholar] [CrossRef] [PubMed]
  3. An, Z.; Suo, L.; Liu, B. Prospect and research on agricultural non-point source pollution in China. J. Plant Nutr. Fertil. 2024, 30, 1422–1436. [Google Scholar] [CrossRef]
  4. Shi, W.; Wang, Y.; Min, J. Progress in research and engineering application cases of agricultural non-point source pollution control in China. Acta Pedol. Sin. 2023, 60, 1309–1323. [Google Scholar] [CrossRef]
  5. Wang, X.; Sarwar, B.; Haseeb, M.; Samour, A.; Hossain, M.E.; Kamal, M.; Khan, M.F. Impact of banking development and renewable energy consumption on environmental sustainability in Germany: Novel findings using the bootstrap ARDL approach. Heliyon 2023, 9, e20584. [Google Scholar] [CrossRef] [PubMed]
  6. Fan, L.; Usman, M.; Haseeb, M.; Kamal, M. The impact of financial development and energy consumption on ecological footprint in economic complexity-based EKC framework: New evidence from BRICS-T region. Nat. Resour. Forum 2024. Early Access. [Google Scholar] [CrossRef]
  7. Bai, T.; Qi, Y.; Li, Z.; Xu, D. Digital economy, industrial transformation and upgrading, and spatial transfer of carbon emissions: The paths for low-carbon transformation of Chinese cities. J. Environ. Manag. 2023, 344, 118528. [Google Scholar] [CrossRef]
  8. Bai, D.; Hu, J.; Irfan, M.; Hu, M. Unleashing the impact of ecological civilization pilot policies on green technology innovation: Evidence from a novel SC-DID model. Energy Econ. 2023, 125, 106813. [Google Scholar] [CrossRef]
  9. Dervi, U.D.; Khan, A.; Saba, I.; Hassan, M.K.; Paltrinieri, A. Green and socially responsible finance: Past, present and future. Manag. Financ. 2022, 48, 1250–1278. [Google Scholar] [CrossRef]
  10. Kumar, B.; Kumar, L.; Kumar, A.; Kumari, R.; Tagar, U.; Sassanelli, C. Green finance in circular economy: A literature review. Environ. Dev. Sustain. 2024, 26, 16419–16459. [Google Scholar] [CrossRef]
  11. Tian, C.; Li, X.; Xiao, L.; Zhu, B. Exploring the impact of green credit policy on green transformation of heavy polluting industries. J. Clean. Prod. 2022, 335, 130257. [Google Scholar] [CrossRef]
  12. Fan, H.; Huang, Z.; Feng, C.; Wu, Z.; Tian, Y.; Ma, F.; Li, H.; Huang, J.; Qin, X.; Zhou, Z.; et al. Functional keystone taxa promote N and P removal of the constructed wetland to mitigate agricultural nonpoint source pollution. Sci. Total Environ. 2024, 912, 169155. [Google Scholar] [CrossRef] [PubMed]
  13. Van Wesenbeeck, C.F.A.; Keyzer, M.A.; Van Veen, W.C.M.; Qiu, H. Can China’s overuse of fertilizer be reduced without threatening food security and farm incomes? Agric. Syst. 2021, 190, 103093. [Google Scholar] [CrossRef]
  14. Xu, H.; Wang, Y.; Yu, W.; Xia, X. Coupling and coordination between green finance and agricultural green development: Evidence from China. Financ. Res. Lett. 2023, 58, 104221. [Google Scholar] [CrossRef]
  15. Mo, Y.; Sun, D.; Zhang, Y. Green finance assists agricultural sustainable development: Evidence from China. Sustainability 2023, 15, 2056. [Google Scholar] [CrossRef]
  16. Yuan, X.; Zhang, J.; Shi, J.; Wang, J. What can green finance do for high-quality agricultural development? Fresh insights from China. Socio-Econ. Plan. Sci. 2024, 94, 101920. [Google Scholar] [CrossRef]
  17. Wang, B.; Zhang, K. Impact of green digital finance on green economic recovery and green agricultural development: Implications for green environment. Environ. Sci. Pollut. Res. 2023, 30, 107611–107623. [Google Scholar] [CrossRef]
  18. Van Veelen, B. Cash cows? Assembling low-carbon agriculture through green finance. Geoforum 2021, 118, 130–139. [Google Scholar] [CrossRef]
  19. Li, G.; Jia, X.; Khan, A.A.; Khan, S.U.; Ali, M.A.U.; Luo, J. Does green finance promote agricultural green total factor productivity? Considering green credit, green investment, green securities, and carbon finance in China. Environ. Sci. Pollut. Res. 2023, 30, 36663–36679. [Google Scholar] [CrossRef]
  20. Jiang, Y.; Han, G.; Yu, D. Digital finance and agricultural green total factor productivity: The mediating role of digital village development. Financ. Res. Lett. 2024, 67, 105948. [Google Scholar] [CrossRef]
  21. Qin, L.; Zhang, Y.; Wang, Y.; Pan, X.; Xu, Z. Research on the impact of digital green finance on agricultural green total factor productivity: Evidence from China. Agriculture 2024, 14, 1151. [Google Scholar] [CrossRef]
  22. Tian, F.; Hou, S. The impact of green finance on industrial land use efficiency: Evidence from 279 cities in China. Sustainability 2022, 14, 6184. [Google Scholar] [CrossRef]
  23. Xie, H.; Chen, Q.; Wang, W.; He, Y. Analyzing the green efficiency of arable land use in China. Technol. Forecast. Soc. Chang. 2018, 133, 15–28. [Google Scholar] [CrossRef]
  24. Atsu, F.; Adams, S. Do innovation, financial development and institutional quality matter in managing carbon risk? Sustain. Environ. 2024, 10, 2293214. [Google Scholar] [CrossRef]
  25. Wang, Y.; Zhang, T.; Wang, X.; Jiang, B.; Huang, X. Impact of technical progress and fiscal support to agriculture on agricultural carbon emissions. Cogent Food Agric. 2024, 10, 2300186. [Google Scholar] [CrossRef]
  26. Kholaif, M.M.N.H.K.; Tang, X. The role of green finance to achieve sustainability through green supply chain management and innovative technologies. Sustain. Dev. 2024. Early Access. [Google Scholar] [CrossRef]
  27. Li, G.; Wang, L.; Li, Z.; Guo, Z. Has pilot zones policy for green finance reform and innovations improved the level of green financial development and environmental quality? Environ. Sci. Pollut. Res. 2023, 30, 68667–68676. [Google Scholar] [CrossRef]
  28. Li, Q.; Ouyang, W.; Zhu, J.; Lin, C.; He, M. Discharge dynamics of agricultural diffuse pollution under different rainfall patterns in the middle Yangtze river. J. Environ. Manag. 2023, 347, 119116. [Google Scholar] [CrossRef]
  29. Jones, J.; Gyawali, B.R.; Acharya, S.; Cristan, R.; Gebremedhin, M. Assessing the influence of agricultural nonpoint source pollution on water quality in Central Kentucky’s headwater streams. Appl. Sci. 2024, 14, 2679. [Google Scholar] [CrossRef]
  30. Sadiqi, S.S.J.; Nam, W.H.; Lim, K.J.; Hong, E. Investigating nonpoint source and pollutant reduction effects under future climate scenarios: A SWAT-based study in a highland agricultural watershed in Korea. Water 2024, 16, 179. [Google Scholar] [CrossRef]
  31. Fang, S.; Deitch, M.J.; Gebremicael, T.G.; Angelini, C.; Ortals, C.J. Identifying critical source areas of non-point source pollution to enhance water quality: Integrated SWAT modeling and multi-variable statistical analysis to reveal key variables and thresholds. Water Res. 2024, 253, 121286. [Google Scholar] [CrossRef] [PubMed]
  32. Ding, L.; Qi, C.C.; Zhang, W.Q. Distribution characteristics of non-point source pollution of TP and identification of key source areas in Nanyi Lake (China) Basin: Based on InVEST model and source list method. Environ. Sci. Pollut. Res. 2023, 30, 117464–117484. [Google Scholar] [CrossRef] [PubMed]
  33. Skidmore, M.; Andarge, T.; Foltz, J. Effectiveness of local regulations on nonpoint source pollution: Evidence from Wisconsin dairy farms. Am. J. Agric. Econ. 2023, 105, 1333–1364. [Google Scholar] [CrossRef]
  34. Friesen, L.; MacKenzie, I.A.; Nguyen, M.P. Initially contestable property rights and Coase: Evidence from the lab. J. Environ. Econ. Manag. 2023, 120, 102842. [Google Scholar] [CrossRef]
  35. Durmaz, N.; Thompson, A. An Environmental Kuznets Curve for water pollution: Does water abundance affect the turning point? Sci. Total Environ. 2024, 913, 169657. [Google Scholar] [CrossRef]
  36. Tang, X.; Qin, T.; Kholaif, M.M.N.H.K.; Zhao, X. The attenuating effect of green finance on environmental quality and its mechanism: Spatial modified PTRM model. J. Clean. Prod. 2024, 436, 140512. [Google Scholar] [CrossRef]
  37. Lyu, J.; Wang, X.; Zhou, W. Has technological finance improved environmental pollution control levels in heavily polluting industries? Sustainability 2024, 16, 5996. [Google Scholar] [CrossRef]
  38. Wen, W.; Zhuang, Y.; Jiang, T.; Li, W.; Li, H.; Cai, W.; Xu, D.; Zhang, L. “Period-area-source” hierarchical management for agricultural non-point source pollution in typical watershed with integrated planting and breeding. J. Hydrol. 2024, 635, 131198. [Google Scholar] [CrossRef]
  39. Spearing, L.A.; Mehendale, P.; Albertson, L.; Kaminsky, J.A.; Faust, K.M. What impacts water services in rural Alaska? Identifying vulnerabilities at the intersection of technical, natural, human, and financial systems. J. Clean. Prod. 2022, 379, 134596. [Google Scholar] [CrossRef]
  40. Zou, L.; Liu, Y.; Wang, Y.; Hu, X. Assessment and analysis of agricultural non-point source pollution loads in China: 1978–2017. J. Environ. Manag. 2020, 263, 110400. [Google Scholar] [CrossRef]
  41. Wang, M.; Jiang, T.; Mao, Y.; Wang, F.; Yu, J.; Zhu, C. Current situation of agricultural non-point source pollution and its control. Water Air Soil Pollut. 2023, 234, 471. [Google Scholar] [CrossRef]
  42. Zhang, S.; Luo, Y.; Zhang, P. Economic driving characteristics of agricultural non-point source pollution and prevention suggestions: A case study from Shandong province in China. Front. Environ. Sci. 2024, 12, 1352412. [Google Scholar] [CrossRef]
  43. Guo, L.; Zhao, S.; Song, Y.; Tang, M.; Li, H. Green finance, chemical fertilizer use and carbon emissions from agricultural production. Agriculture 2022, 12, 313. [Google Scholar] [CrossRef]
  44. Ren, Y.; Ding, Z.; Liu, J. How green finance boosts carbon efficiency in agriculture: A quasi-experiment from China. China Agric. Econ. Rev. 2024, 16, 267–289. [Google Scholar] [CrossRef]
  45. Lan, J.; Wei, Y.; Guo, J.; Li, Q.; Liu, Z. The effect of green finance on industrial pollution emissions: Evidence from China. Resour. Policy 2023, 80, 103156. [Google Scholar] [CrossRef]
  46. Wang, Z.; Fu, Y.; Wu, J. The Impact of Environmental Regulation on Collaborative Innovation Efficiency: Is the Porter Hypothesis Valid in Chengdu–Chongqing Urban Agglomeration? Sustainability 2024, 16, 2223. [Google Scholar] [CrossRef]
  47. Lou, C. Green finance, environmental regulations, and green technologies in China: Implications for achieving green economic recovery. Economics 2024, 18, 20220106. [Google Scholar] [CrossRef]
  48. Bu, C.; Zhang, K.; Shi, D.; Wang, S. Does environmental information disclosure improve energy efficiency? Energy Policy 2022, 164, 112919. [Google Scholar] [CrossRef]
  49. Guo, X.; Yang, J.; Shen, Y.; Zhang, X. Impact on green finance and environmental regulation on carbon emissions: Evidence from China. Front. Environ. Sci. 2024, 12, 1307313. [Google Scholar] [CrossRef]
  50. Zhang, Y.; Gao, C.; Liu, C.; Li, P.; Chen, X.; Liang, Z. Evaluation of agricultural water resources allocation efficiency and its influencing factors in the Yellow River Basin. Agronomy 2023, 13, 2449. [Google Scholar] [CrossRef]
  51. Wasiq, M.; Kamal, M.; Ali, N. Factors influencing green innovation adoption and its impact on the sustainability performance of small- and medium-sized enterprises in Saudi Arabia. Sustainability 2023, 15, 2447. [Google Scholar] [CrossRef]
  52. Zang, D.; Yang, S.; Li, F. The relationship between land transfer and agricultural green production: A collaborative test based on theory and data. Agriculture 2022, 12, 1824. [Google Scholar] [CrossRef]
  53. Shen, Y.; Guo, X.; Zhnag, X. Digital financial inclusion, land transfer, and agricultural green total factor productivity. Sustainability 2023, 15, 6436. [Google Scholar] [CrossRef]
  54. Tang, X.; Zhou, X.; Kholaif, M.M.N.H.K. Does green finance achieve its goal of promoting coordinated development of economy–environment? Using the pollutant emission efficiency as a proxy. Environ. Dev. Sustain. 2024, 26, 9973–10002. [Google Scholar] [CrossRef]
  55. Ge, X.; Chen, X.; Liu, M.; Wang, C.; Zhang, Y.; Wang, Y.; Tran, H.; Joseph, S.; Zhang, T. Toward a better understanding of phosphorus nonpoint source pollution from soil to water and the application of amendment materials: Research trends. Water 2023, 15, 1531. [Google Scholar] [CrossRef]
  56. Lai, S.; Du, P.; Chen, J. Evaluation of non-point source pollution based on unit analysis. J. Tsinghua Univ. (Sci. Technol.) 2004, 45, 1184–1187. [Google Scholar] [CrossRef]
  57. Yan, L.; Xu, H. Temporal and spatial variation of agricultural non-point source pollution in the Pearl River Delta from 2010 to 2020. Pearl River 2024, 45, 28–33. [Google Scholar] [CrossRef]
  58. Xu, L.; Jiang, J.; Lu, M.; Du, J. Spatial-temporal evolution characteristics of agricultural intensive management and its influence on agricultural non-point source pollution in China. Sustainability 2023, 15, 371. [Google Scholar] [CrossRef]
  59. Wang, H.; He, P.; Shen, C.; Wu, Z. Effect of irrigation amount and fertilization on agriculture non-point source pollution in the paddy field. Environ. Sci. Pollut. Res. 2019, 26, 10363–10373. [Google Scholar] [CrossRef]
  60. Feng, Z.; Zhang, R.; Liu, X.; Peng, Q.; Wang, L. Agricultural nonpoint source pollutant loads into water bodies in a typical basin in the middle reach of the Yangtze River. Ecotoxicol. Environ. Saf. 2023, 268, 115728. [Google Scholar] [CrossRef]
  61. Zhao, H.; Li, J.; Zheng, H.; Li, J.; Wang, J.; Liao, L.; Ge, X.; Chen, Y.; Guo, X.; Zeng, W. Effects of Fertilization of Different Crops on Non-Point Source Pollution in the Upper Reaches of Erhai Lake Basin. Water Air Soil Pollut. 2023, 234, 581. [Google Scholar] [CrossRef]
  62. Ma, J.; Ding, Y.; Cheng, J.C.; Jiang, F.; Wan, Z. A temporal-spatial interpolation and extrapolation method based on geographic Long Short-Term Memory neural network for PM2.5. J. Clean. Prod. 2019, 237, 117729. [Google Scholar] [CrossRef]
  63. Luo, X.; Li, Y.; Wu, Q.; Wei, Z.; Li, Q.; Wei, L.; Shen, Y.; Wang, R. Characteristics of internal ammonium loading from long-term polluted sediments by rural domestic wastewater. Int. J. Environ. Res. Public Health 2019, 16, 4657. [Google Scholar] [CrossRef] [PubMed]
  64. Li, S.; Shao, Q. Greening the finance for climate mitigation: An ARDL–ECM approach. Renew. Energy 2022, 199, 1469–1481. [Google Scholar] [CrossRef]
  65. Lee, C.; Lee, C. How does green finance affect green total factor productivity? Evidence from China. Energy Econ. 2022, 107, 105863. [Google Scholar] [CrossRef]
  66. Yin, X.; Xu, Z. An empirical analysis of the coupling and coordinative development of China’s green finance and economic growth. Resour. Policy 2022, 75, 102476. [Google Scholar] [CrossRef]
  67. Zhang, W.; Ke, J.; Ding, Y.; Chen, S. Greening through finance: Green finance policies and firms’ green investment. Energy Econ. 2024, 131, 107401. [Google Scholar] [CrossRef]
  68. Chai, S.; Wei, M.; Tang, L.; Bi, X.; Yu, Y.; Yang, J.; Jie, Z. Can public opinion persuade the government to strengthen the use of environmental regulation policy tools? Evidence from policy texts. J. Clean. Prod. 2024, 434, 140352. [Google Scholar] [CrossRef]
  69. Hu, J.; Zhang, H. Has green finance optimized the industrial structure in China? Environ. Sci. Pollut. Res. 2023, 30, 32926–32941. [Google Scholar] [CrossRef]
  70. Zhu, R.; Wang, Y.; Li, R. Can green finance policies accurately promote corporate environmental investment?—A comprehensive evaluation from multiple aspects. Front. Environ. Sci. 2024, 12, 1396687. [Google Scholar] [CrossRef]
  71. Liu, S.; Ma, L. Green finance and high-quality trade growth—Based on the domestic value-added rate. Int. Bus. 2024, 219, 89–104. [Google Scholar] [CrossRef]
  72. Shen, Y.; Yang, Z.; Zhang, X. Impact of digital technology on carbon emissions: Evidence from Chinese cities. Front. Ecol. Evol. 2023, 11, 1166376. [Google Scholar] [CrossRef]
  73. Fang, L.; Zhao, B.; Li, W.; Tao, L.; He, L.; Zhang, J.; Wen, C. Impact of digital finance on industrial green transformation: Evidence from the Yangtze River economic belt. Sustainability 2023, 15, 12799. [Google Scholar] [CrossRef]
  74. Chu, D.; Zou, Y. Does financial support promote agricultural green development: A meta-analysis. J. Zhengzhou Univ. (Philos. Soc. Sci. Ed.) 2023, 56, 11–19. [Google Scholar] [CrossRef]
  75. Wang, J.; Yuan, T. Analysis on the evolution of China’s agricultural green development policy and policy tools. Hebei Acad. J. 2023, 43, 130–139. [Google Scholar] [CrossRef]
  76. Ye, C.; Hui, L. The impact of agricultural public financial expenditure on China’s agricultural green productivity. Wuhan Univ. J. (Philos. Soc. Sci.) 2016, 69, 48–55. [Google Scholar] [CrossRef]
  77. Li, Y.; Cheng, D.; Li, P. Does Agricultural Insurance Promote The Improvement of Agricultural Green Productivity in China. J. Guizhou Univ. Financ. Econ. 2018, 197, 101–108. [Google Scholar] [CrossRef]
  78. Cai, X.; Chen, G.; Wang, F. How Does Green Finance Policy Affect the Capacity Utilization Rate of Polluting Enterprises? Sustainability 2023, 15, 16927. [Google Scholar] [CrossRef]
  79. Lv, W.; Zhang, Z.; Zhang, X. The role of green finance in reducing agricultural non-point source pollution—An empirical analysis from China. Front. Sustain. Food Syst. 2023, 7, 1199417. [Google Scholar] [CrossRef]
  80. Lin, Q.; Cheng, Q.; Zhong, J.; Lin, W. Can digital financial inclusion help reduce agricultural non-point source pollution?—An empirical analysis from China. Front. Environ. Sci. 2022, 10, 1074992. [Google Scholar] [CrossRef]
  81. Cao, L.; Gao, J. The impact of green finance on agricultural pollution and carbon reduction: The case of China. Sustainability 2024, 16, 5832. [Google Scholar] [CrossRef]
  82. Li, J.; Khan, A.A.; Ali, M.A.S.; Luo, J. Does farmers’ agricultural investment is impacted by green finance policies and financial constraint? From the perspective of farmers’ heterogeneity in Northwest China. Environ. Sci. Pollut. Res. 2022, 29, 67242–67257. [Google Scholar] [CrossRef]
  83. Jiang, S.; Qiu, S.; Zhou, H.; Chen, M. Can FinTech development curb agricultural nonpoint source pollution? Int. J. Environ. Res. Public Health 2019, 16, 4340. [Google Scholar] [CrossRef]
  84. Li, X.; Cheng, B.; Zhang, J.; Wang, L.; Tian, Y. Impact mechanisms of environmental rules on haze pollution: An examination with the mediation effect. Environ. Eng. Manag. J. 2021, 20, 2077–2086. [Google Scholar] [CrossRef]
  85. Sun, Y.; Ding, G.; Li, M.; Zhang, M.; Agyeman, F.O.; Liu, F. The spillover effect of green finance development on rural revitalization: An empirical analysis based on China’s provincial panel data. Environ. Sci. Pollut. Res. 2023, 30, 58907–58919. [Google Scholar] [CrossRef]
  86. Mei, B.; Khan, A.A.; Khan, S.U.; Ali, M.A.S.; Luo, J. An estimation of the effect of green financial policies and constraints on agriculture investment: Evidences of sustainable development achievement in northwest China. Front. Public Health 2022, 10, 903431. [Google Scholar] [CrossRef]
Figure 1. Theoretical analytical framework for the impact of GF on ANPSP.
Land 13 01516 g001
Figure 2. Space–time evolution of ANPSP and GF.
Land 13 01516 g002aLand 13 01516 g002b
Table 1. Indicator set for ANPSP.
CategoriesElements of Pollution ProductionSurvey IndicatorsUnitPollutants
Agricultural fertilizersNitrogen fertilizer, phosphorus fertilizer, compound fertilizerRefractive index of application10,000 tonsTN, TP
Livestock and poultry breedingPigs, cows, sheepInventory/output10,000 headsTN, TP, COD
AquacultureFreshwater fish, crustaceans, shellfish, othersTotal production10,000 tonsTN, TP, COD
Farm cropsRice, corn, wheat, beans, potatoes, oilseeds, vegetablesTotal production10,000 tonsTN, TP, COD
Rural lifeRural domestic sewageAgricultural population10,000 personsTN, TP, COD
PesticidesPesticidesUtilization amount10,000 tonsPesticide loss
Agricultural plastic filmAgricultural plastic filmUtilization amount10,000 tonsAgricultural plastic film loss
Table 2. Comprehensive evaluation system of GF indicators.
NameNormMeasurementReferences
Green creditPercentage of credits for environmental projectsTotal credit for environmental projects in the province/total credit in the province[64]
Green investmentInvestment in environmental pollution control as % of GDPInvestment in environmental pollution control/GDP[67]
Green insuranceExtent of promotion of environmental pollution liability insuranceEnvironmental pollution liability insurance income/total premium income[64]
Green bondsExtent of green bond developmentTotal green bond issuance/total all bond issuance[64]
Green supportPercentage of fiscal expenditure on environmental protectionFinancial environmental protection expenditures/financial general budget expenditures[67]
Green fundsPercentage of green fundsTotal market capitalization of green funds/total market capitalization of all funds[64]
Green equityGreen equity development depthCarbon trading, energy rights trading, emissions trading/total equity market transactions[67]
Table 3. Descriptive statistics of variables.
VariableCodeMeanStandard DeviationMinMax
Agricultural non-point source pollutionANPSP−1.4740.777−4.787−0.135
Green financeGF−1.9110.517−3.121−0.042
Environmental regulationER9.2680.4868.09110.811
Land transferLR0.030.417−0.6941.667
Macro-controlMC−3.8920.709−5.984−2.214
Level of economic developmentLED10.3550.6388.52711.865
Climatic conditionCN7.0491.2463.9499.747
Road accessibilityRA11.5890.8729.00112.913
Technological progressTPs9.0251.6544.36912.398
Industrial structureIS3.7910.2023.3534.429
Table 4. Benchmark regression results.
VariableOLSOLSFETWFE
(1)(2)(3)(4)
GF−0.348 ***
(−4.15)
−0.415 ***
(−2.85)
−0.398 *
(−1.98)
−0.432 **
(−2.58)
CVNoYesYesYes
Individual fixed effectNoNoYesYes
Time fixed effectNoNoNoYes
N540540540540
F test 10.82 ***73.12 ***
Hausman test 27.59 ***35.50 ***
Note: ***, **, and * indicate significance at the 1%, 5%, and 10% levels, respectively, with t-values in parentheses.
Table 5. The results of the mediation effect test.
VariableERLT
GF0.334 ***
(3.25)
0.132 **
(2.35)
CVYesYes
Individual fixed effectYesYes
Time fixed effectYesYes
N540540
Note: *** and ** indicate significance at the 1% and 5% levels, respectively, with t-values in parentheses.
Table 6. Robustness test results.
(5)(6)(7)
SDIDSDM2SLS
GF−0.136 **
(2.02)
−0.377 **
(−2.20)
−0.425 **
(2.53)
CVYesYesYes
Individual fixed effectYesYesYes
Time fixed effectYesYesYes
Weak identification test 12.947 ***
Weak identification test 22.66
Note: *** and **, indicate significance at the 1% and 5%, levels, respectively, with t-values in parentheses.
Table 7. Regional economic heterogeneity in the impact of GF on ANPSP.
VariableEDLAsEDCAs
GF0.214
(1.59)
−0.242 **
(−2.52)
CVYesYes
Individual fixed effectYesYes
Time fixed effectYesYes
N192348
Note: **, indicates significance at the 5%, level,, with t-values in parentheses.
Disclaimer/Publisher’s Note: The statements, opinions and data contained in all publications are solely those of the individual author(s) and contributor(s) and not of MDPI and/or the editor(s). MDPI and/or the editor(s) disclaim responsibility for any injury to people or property resulting from any ideas, methods, instructions or products referred to in the content.

