Abstract
Urban green spaces are crucial for alleviating psychological stress, but the effect of multi-sensory experiences on psychological restoration remains underexplored. This study, conducted in Edinburgh, Scotland, with 40 participants, compares the effects of walking and sitting in different urban environments—built environments, semi-natural green spaces, and natural green spaces—on psychological restoration. The results reveal that while sensory quality positively correlates with psychological well-being, sensory perception and variety do not always have a positive effect on restoration. Moreover, supplementing visual and hearing experiences with tactility and smell in urban green spaces is more effective in reducing stress and enhancing overall well-being, particularly in terms of vitality, which is largely affected by non-visual sensory inputs. This study highlights the importance of creating balanced sensory environments in urban green spaces, integrating a variety of sensory experiences to maximize psychological benefits. These findings provide valuable insights for urban planners and designers aiming to optimize green spaces for enhanced mental health and overall quality of life.
1. Introduction
Since the 1950s, the world has entered a phase of rapid urbanisation. By the 21st century, urban development has increasingly tended towards high density [1]. It is estimated that by 2030, over 60% of the world’s population will be living in urban areas [2]. A densely developed urban artificial environment exerts tremendous pressure on urban resources [3] and raises concerns regarding the negative impacts on the health and well-being of urban residents [4]. For instance, crowded urban populations can foster and exacerbate the spread of infectious diseases [3]; highly intensive urban environments increase the risk of severe mental disorders among residents [5]; various urban pollutants can significantly raise negative emotions [6]; and a high-pressure and fast-paced urban lifestyle leads to chronic fatigue, stress, and anxiety, making people more prone to chronic diseases, such as obesity [7] and hypertension [8]. The relationship between urban green spaces and public health has always been a focal point in urban planning research [9]. Studies have shown that mental health issues are the most easily overlooked health crises, even though the state of mental health is crucial to the well-being of individuals, communities, and society as a whole [4].
Clark et al. were the first to establish a link between the built urban environment and mental health and identify green spaces as one of the most significant factors [10]. Subsequent studies have demonstrated that exposure to green environments positively affects mental health [11,12]. Jonides et al. found that walking in natural environments such as forests is more effective in reducing fatigue, restoring attention, and enhancing cognitive abilities than walking in urban areas based on grey spaces [13]. Some researchers have found that urban residents living in areas with higher levels of greenery generally experience lower psychological stress and higher life satisfaction [14,15]. Other studies have indicated that exposure to green environments, such as wooded green spaces in cities, with their rich biodiversity and multi-sensory experiences, can improve sleep quality, reduce the incidence of emotional disorders, and mitigate behavioural deviations caused by negative emotions [16]. The prevalence of activities such as forest therapy [17], the 20 min park effect [18], horticultural therapy [19], and restorative gardens [20] further supports the notion that interacting with green spaces, whether next to or within urban areas, is an effective way to improve physical fitness, alleviate stress, and restore attention.
Stress Reduction Theory (SRT) and Attention Restoration Theory (ART) hold significant positions in research on the multifaceted positive impacts of green environments on psychological restoration [21]. In 1979, Roger Ulrich proposed the SRT, which posits that exposure to natural environments can reduce mental and physical stress, enhance cognitive ability and behavioural performance, and promote health improvement [22]. The ART, proposed by Stephen Kaplan in 1983, identifies four characteristics of natural environments that aid attention restoration—Being away, Extent, Compatibility, and Fascination—which help recover directed attention fatigued by the demands of daily life [21]. Experts and scholars are working to further elucidate the mechanisms through which green spaces affect residents’ mental health. Dong et al. found that green visual exposure, the green view index, and the green space ratio positively impact residents’ mental health, with different measurement indicators having different mediating variables in their pathways of influence [9]. Zhao et al. investigated the effect of audio-visual combinations on the perceived restorative potential of urban green spaces and demonstrated that the degree of matching between auditory–visual associations and visual landscapes is crucial for enhancing the restorative capacity of sounds [23]. Other studies have indicated that visual, hearing, and smelling inputs in green spaces contribute to psychological restoration, thereby alleviating stress and attention fatigue [24,25]. Although the health benefits of green spaces have been confirmed, the specific mechanisms through which they operate are still being explored, with sensory landscapes in green spaces being essential.
Sensory experiences typically include vision, hearing, smell, tactile sensations, and taste, which are the most direct ways humans perceive the world. Green spaces provide positive stimulation to the eyes, ears, mouth, nose, and touch, relax nerves, and regulate brain waves, thereby eliminating fatigue and uplifting the spirit [19,26,27]. As early as the late 18th century, sensory experiences were used as an important therapeutic method to treat psychological disorders, such as neurasthenia [28]. Studies on the psychological restorative benefits of visual stimuli indicate that spatial, colour, and form designs in landscapes can create a sense of changing scenery, thereby providing rich visual experiences and achieving mental healing. In terms of hearing experiences, Vanhecke et al. emphasised that a balanced combination of natural sounds, especially birdsong, could better promote human health [29]. Regarding smell, pleasant and suitable scents can soothe nerves, calm the mind, and relieve stress [30]. Rich and pleasant tactile experiences in green spaces can stimulate visitors’ desire to explore an area, enhancing their sense of participation and identification with the environment [31]. In terms of taste, Hill pointed out that taste is actually a combination of smell, flavour, and texture, with smell playing a major role [32]. The Association for Psychological Science states that the influence of taste on psychological restoration is relatively minor compared to other senses [33]. Taste is usually less directly associated with environments that do not provide food and beverages, and the taste experiences available in urban spaces are limited, typically found only in certain sections of botanical gardens where edible plants are present [30]. Therefore, this study focuses on sensory experiences related to vision, hearing, smell, and tactile stimuli.
Several studies have explored the relationship between urban green spaces and residents’ mental health, as well as potential mediating factors [34]. For example, green spaces can promote mental restoration by improving air quality [35], reducing noise [36], and providing visual stimulation [37]. Additionally, green spaces can enhance residents’ physical fitness and foster neighbourhood interactions by providing spaces for outdoor and social activities [34], thereby increasing life satisfaction and mental relaxation. However, research on the specific mechanisms by which sensory experiences affect psychological restoration remains limited [38]. Studies have shown that human perception of the external world is formed through the interaction of multiple sensory organs [39]. A theory by the German aesthetician Fechner emphasises the importance of multi-sensory integration in aesthetic experiences, suggesting that only through the combined action of multiple senses can people fully and deeply appreciate beauty [40]. However, existing research has largely focused on the impact of single dimensions of sensory experience, particularly vision [37,41,42,43,44] and hearing [44,45,46,47], as well as the combined effects of visual and hearing stimuli [23,48,49,50]; relatively few studies have examined other sensory organs or multi-sensory integration [51]. Regarding sensory experience indicators, previous research has primarily focused on perception and quality. Perception can be understood as ‘whether a particular sensory experience in the environment is present or noticed’ [52]. Xu et al. integrated multi-sensory perception, behavioural experience, and landscape preference into a single framework, demonstrating that perception can serve as a key evaluation factor for sensory landscapes in green spaces [52]. Quality refers to whether a particular sensory experience in an environment brings about subjective well-being or pleasure [53]. In fact, previous studies using single/multi-sensory scales did not distinguish between the two sensory characteristics of perception and quality. Descriptors indicating quality (e.g., ‘harmonious man-made landscape’ or ‘rich colours’) and perception descriptors without subjective adjectives (e.g., ‘animal sounds’) often appeared at the same category [52]. To avoid introducing researchers’ subjective biases and explore the different effects of perception and quality, this study sets separate questions for these two indicators. Furthermore, based on the experiments by Liu et al. [54], the variety of sounds in the environment is also a key factor in visitors’ sensory experiences. This study hypothesised that similar effects may occur in other sensory experiences, leading to the introduction of the variety indicator. Additionally, most related research has been limited to longitudinal studies of urban green spaces as a broad category, lacking a systematic exploration of how different types of urban spaces promote psychological restoration through sensory experiences [55]. These gaps provide important research directions and entry points for this study.
This study aimed to explore the impact of sensory experiences on psychological restoration by comparing walking and sitting in three different urban spaces. Specific research questions included the following: (1) What are the differences in sensory experiences between walking and sitting in a built environment, semi-natural green spaces, and natural green spaces? (2) What are the differences in the psychological restoration effects of walking and sitting in built environments, semi-natural green spaces, and natural green spaces? (3) How do these sensory experiences collectively influence psychological restoration? This study aimed to reveal the unique role of sensory experiences in different urban spaces and uncover the mechanisms by which sensory experiences affect psychological restoration, thereby providing scientific evidence for green space design and environmental therapy.
2. Materials and Methods
According to experimental methods in a large number of previous studies regarding the restoration effect of different types of space on people [5], it is relatively common and effective to select appropriate groups of people as samples and fill in scales after completing the corresponding experimental procedures in sites. Based on our experimental goals, we chose this approach and made corresponding designs for the experiment.
2.1. Study Sites
Field experiments were conducted in various urban spaces within the city of Edinburgh, selected for their distinct characteristics. Edinburgh, the capital of Scotland, is renowned for its unique history and culture, with architectural styles that blend medieval and Georgian influences. The city’s streets are winding, lined with bustling shops and interspersed with numerous green spaces.
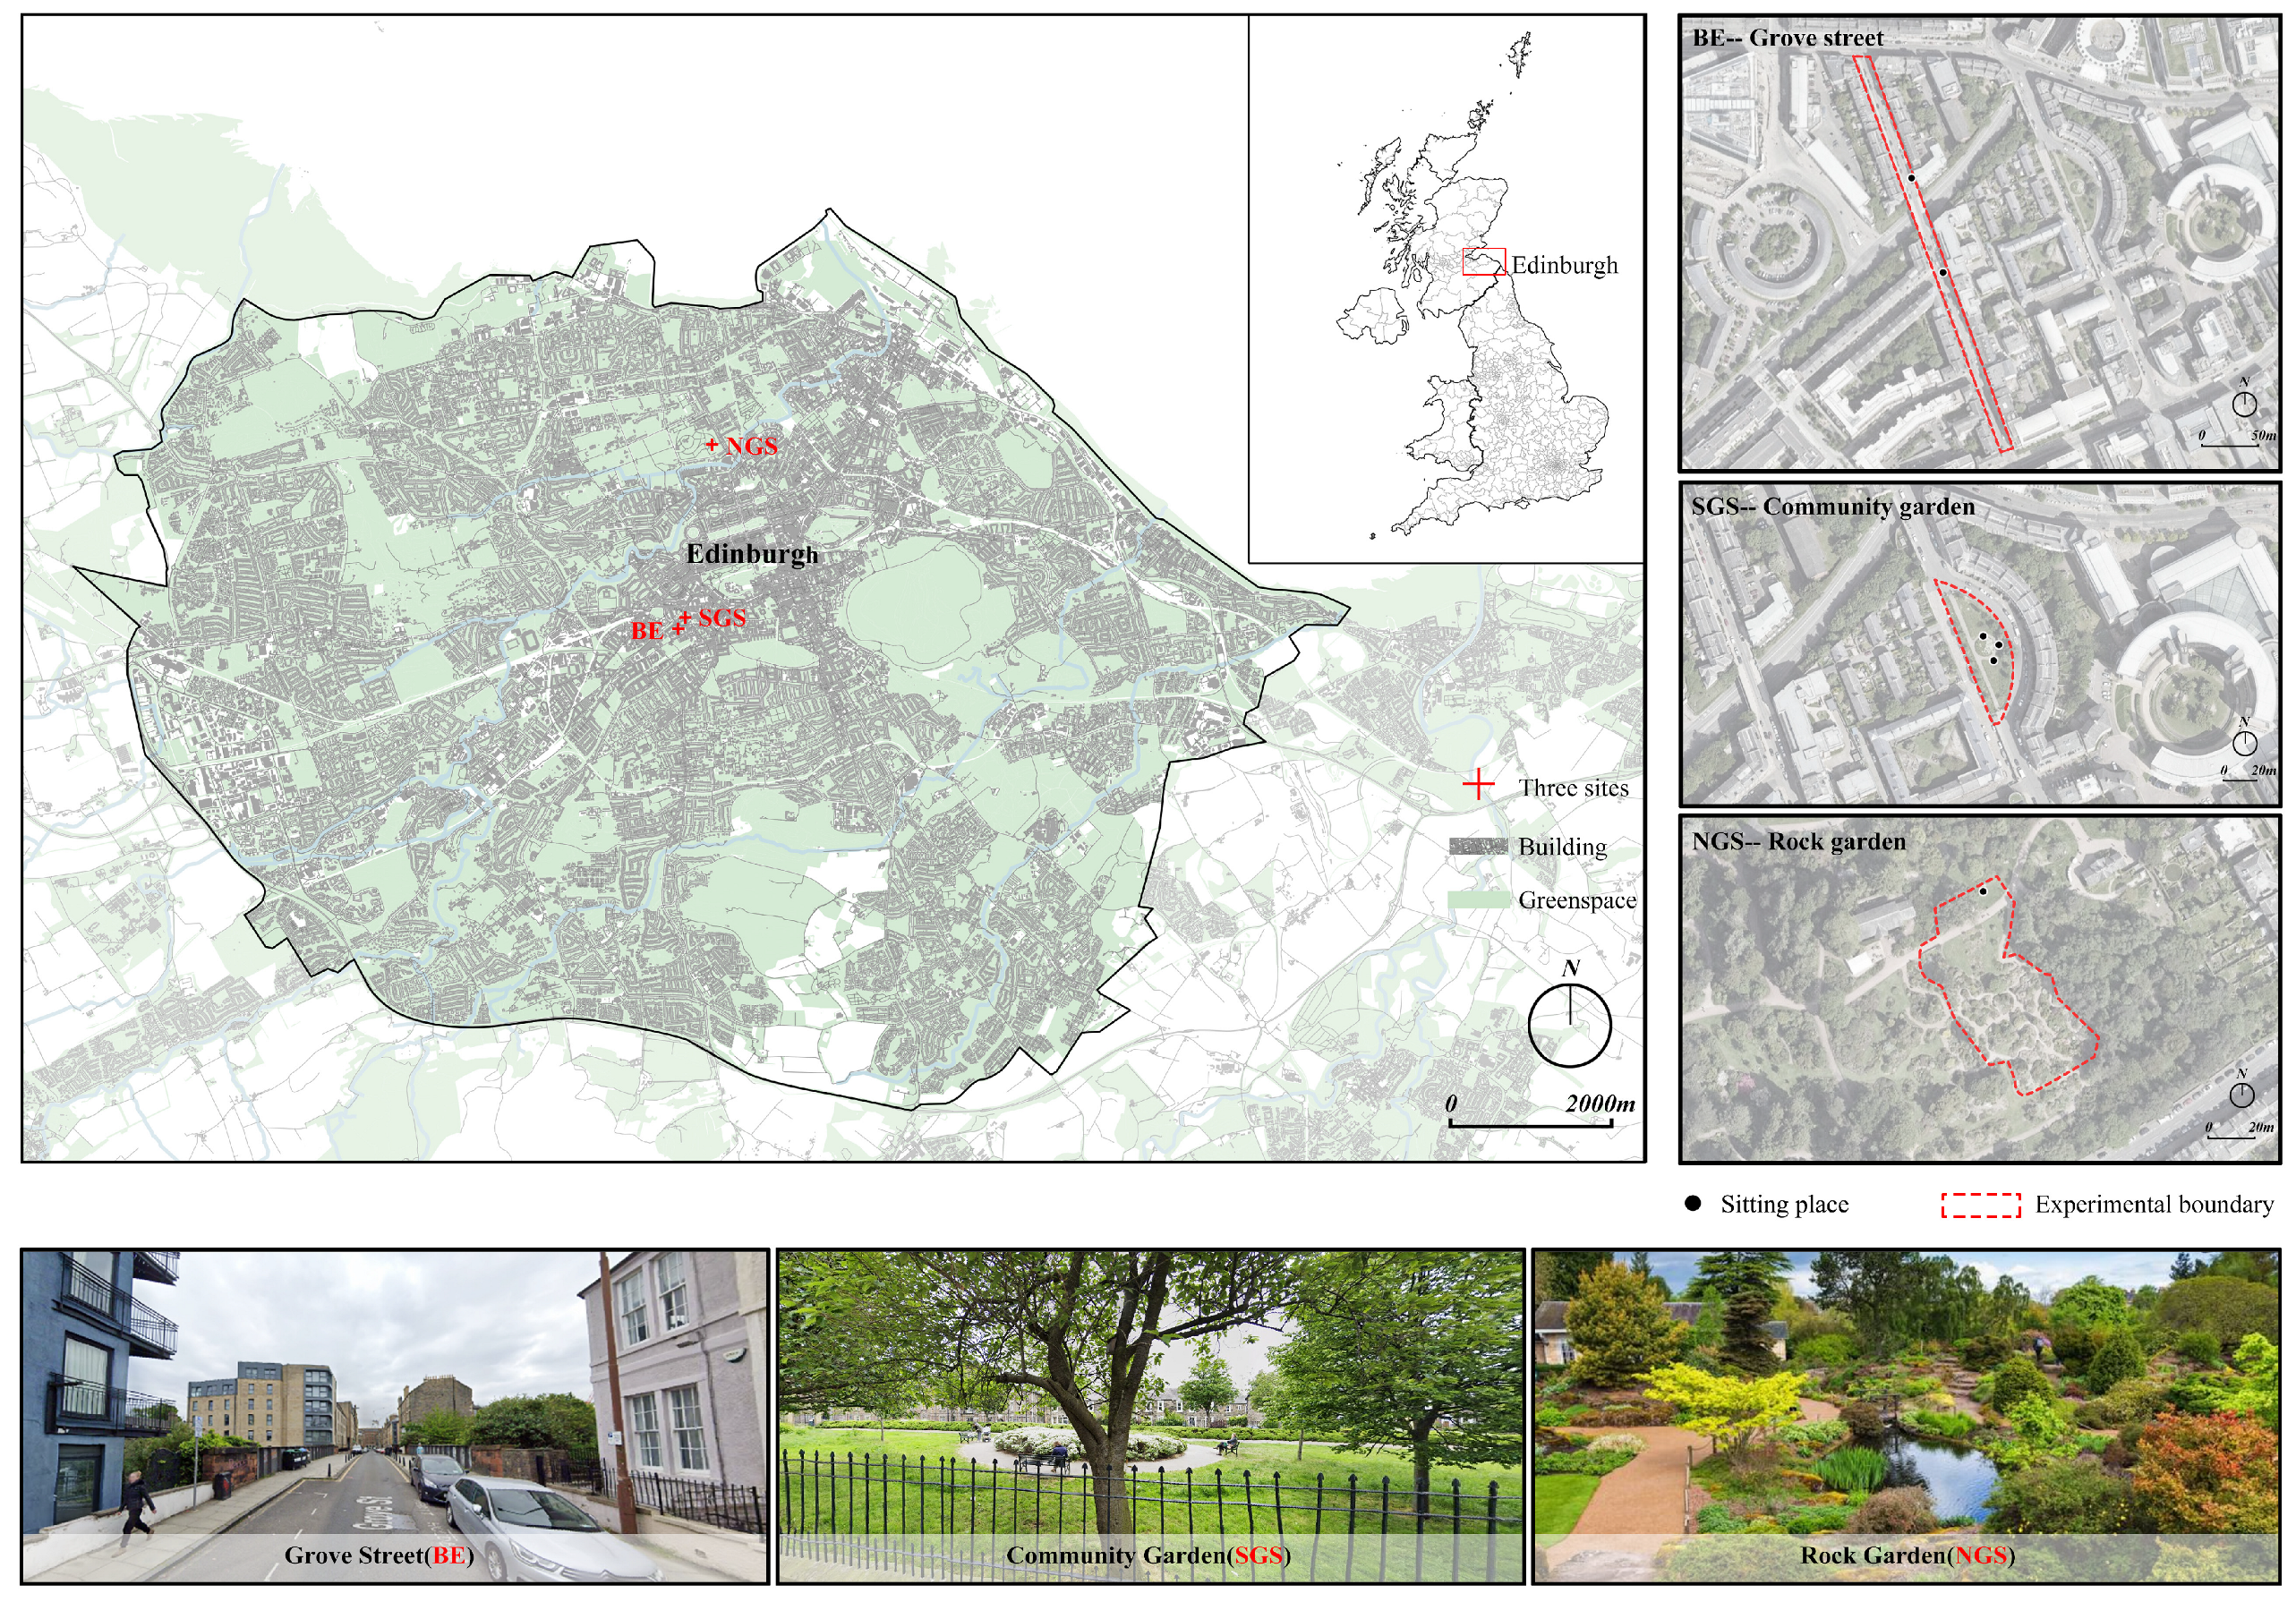
Scholars have classified urban spaces into three categories: large-scale urban green infrastructure, such as public parks and urban forests; small-scale urban green infrastructure, such as community gardens; and grey infrastructure, such as streets [56]. Other studies have defined public green spaces within urban environments as natural or semi-natural areas and spaces modified by human activity [57]. Based on previous research, this study identifies and categorizes three types of urban spaces for comparative analysis according to the degree of exposure to greenery and the built environment experienced by people within these spaces. The categories are as follows: built environment (BE), which includes urban spaces where the average green view rate is less than 30% throughout the area; semi-natural green space (SGS), which encompasses urban spaces with an average green view rate between 30% and 70% across the area; and natural green space (NGS), defined as urban spaces with an average green view rate exceeding 70% throughout the area (Figure 1). For the experiments, Grove Street, Gardner’s Crescent Community Garden, and the Rock Garden at the Edinburgh Royal Botanic Garden were chosen as the experimental sites corresponding to these three types of spaces, respectively, with detailed location descriptions provided in Table 1.
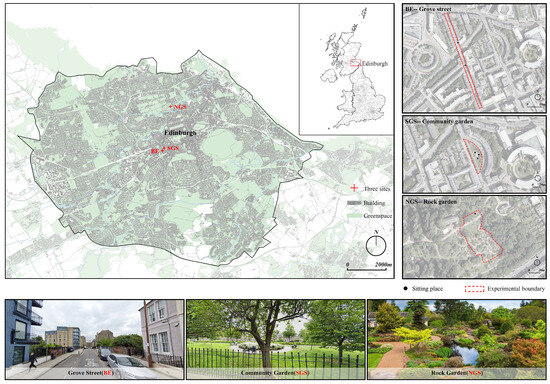
Figure 1.
Location, size and on-site natural images of study sites (map credit: Google maps and Digimaps).

Table 1.
Study sites’ profiles.
2.2. Participants
Forty participants (male: female = 1:1), aged 20–33 years were recruited through social media. All of the participants were current students from various disciplines at the University of Edinburgh. They were asked to maintain a regular schedule and avoid staying up late for three days before the experiment. During the experiment, they were required to abstain from alcohol, smoking, caffeine, and food intake, as well as refrain from using electronic devices and communicating with other participants. This study was conducted in accordance with the guidelines of the Declaration of Helsinki. No physical or physiological data were collected. All of the participants remained anonymous and provided signed informed consent. This study did not require submission to the ethics committee for review, according to the University Research Ethics Policy of the University of Edinburgh.
2.3. Experimental Design
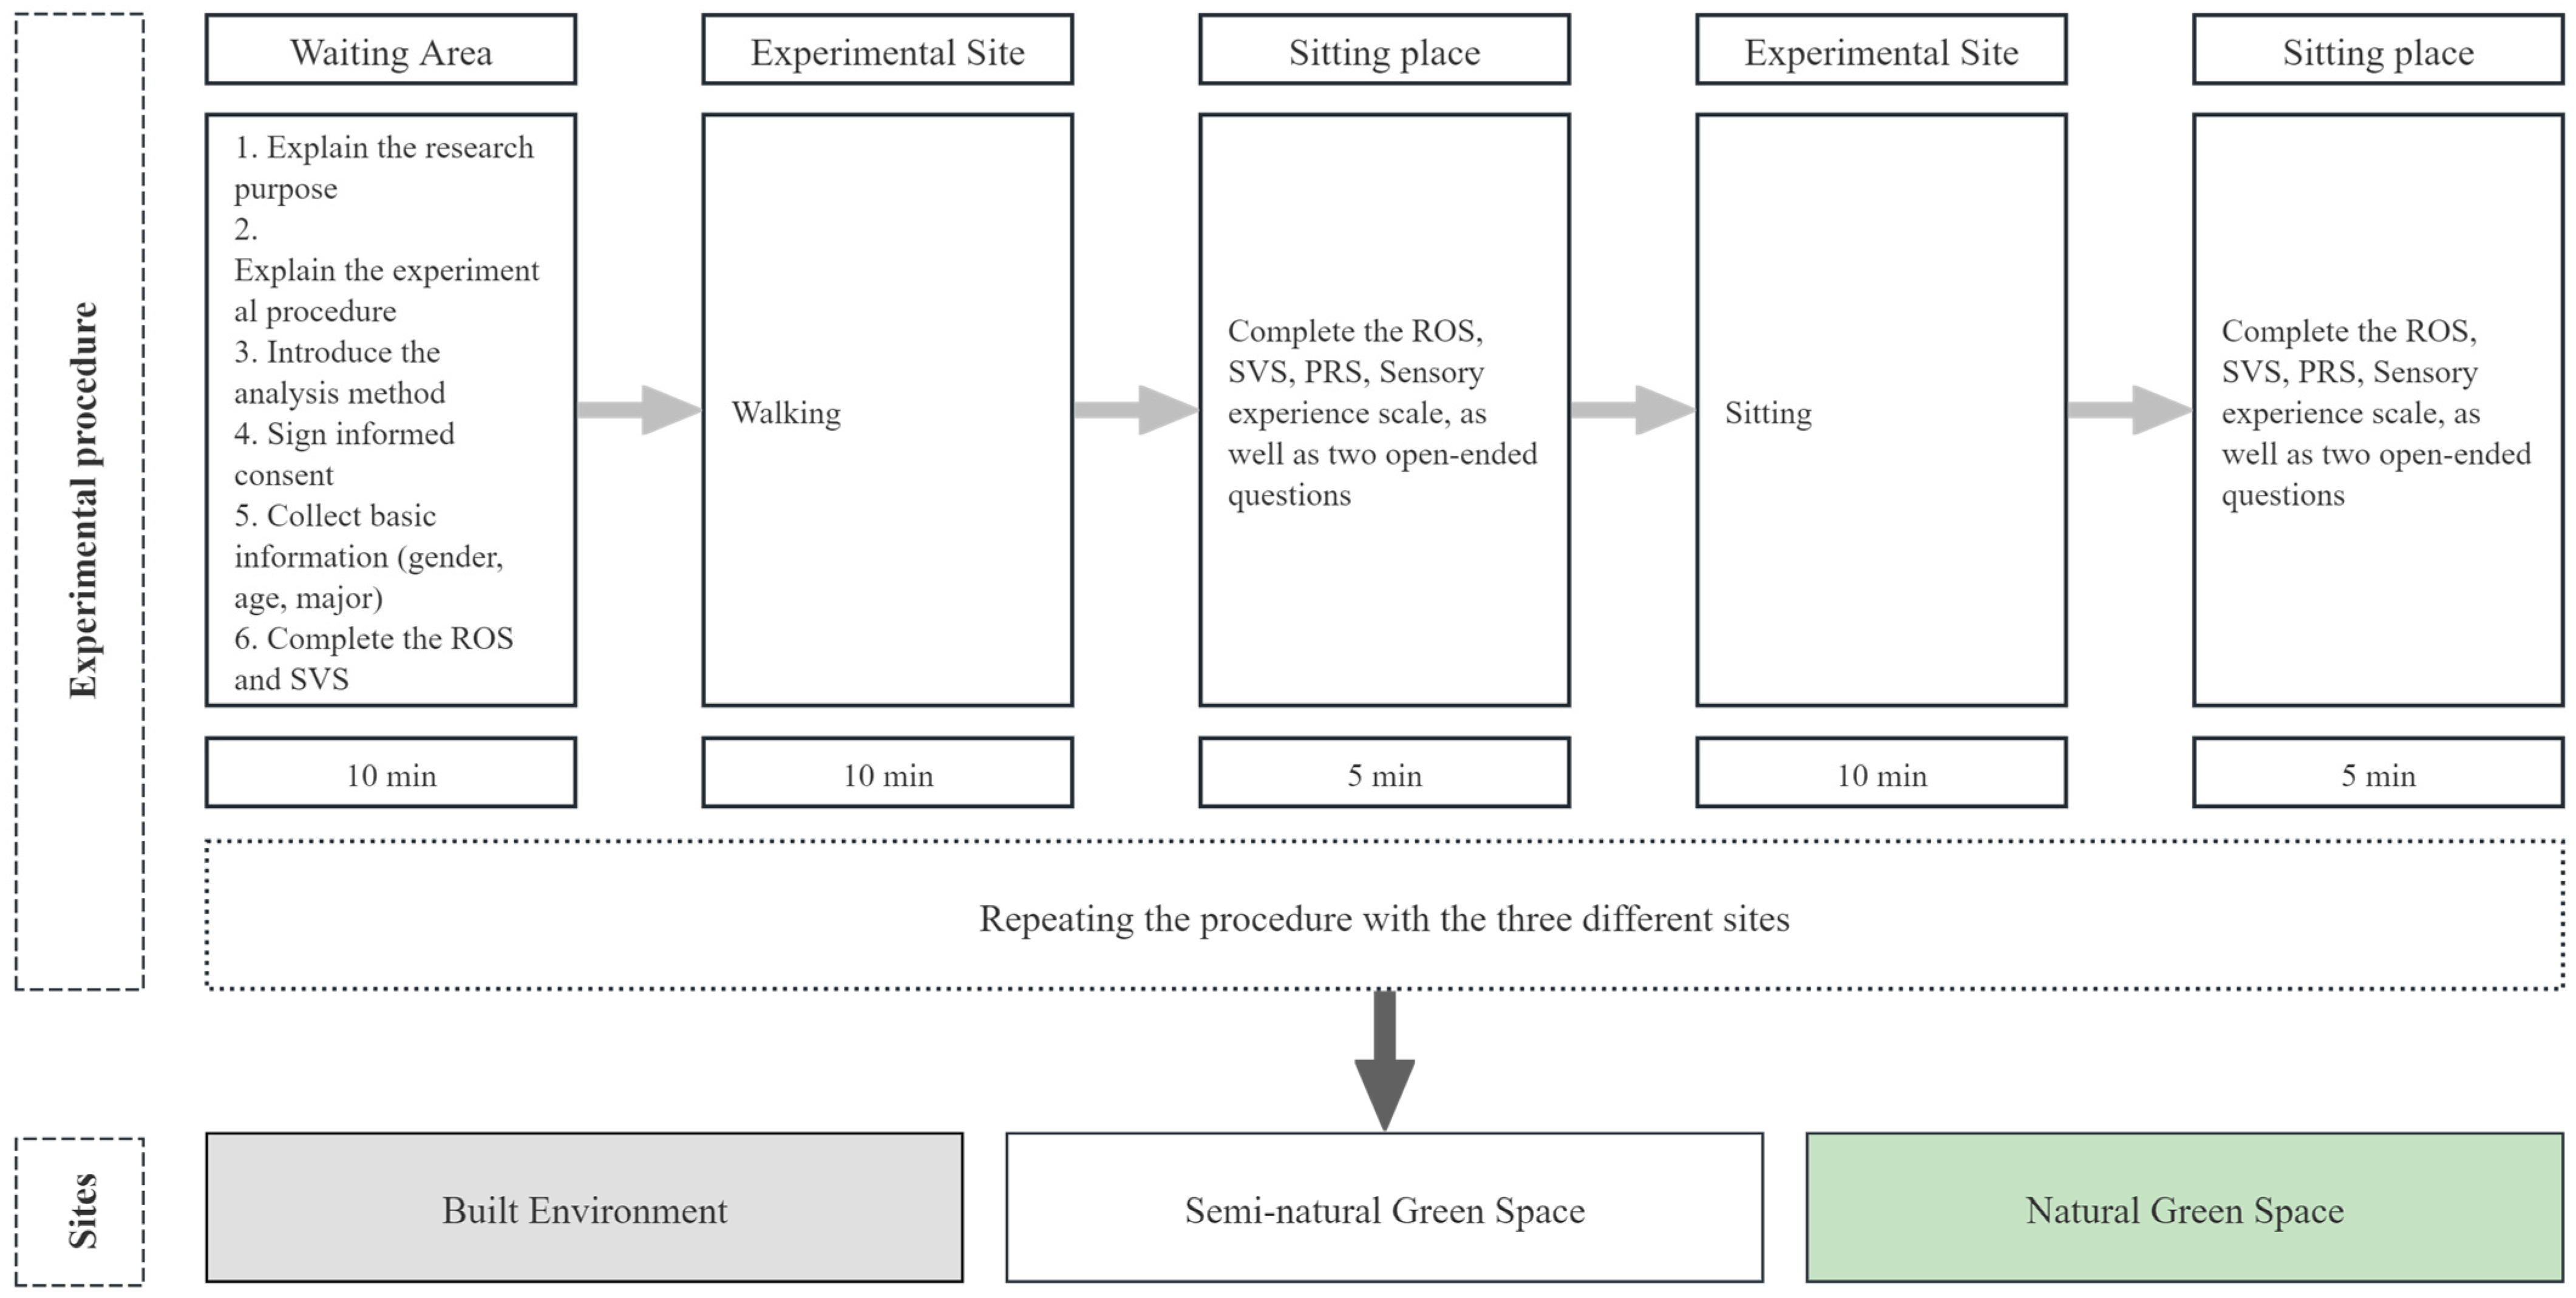
The same experimental procedure was applied across the three different experimental sites, as follows: Before entering the site, participants were guided to a rest area where the researchers explained the purpose of the study, the experimental procedure, and the data analysis methods. The participants voluntarily signed a written consent form and provided their basic information (gender, age, and major). Next, the participants completed the Restorative Outcome Scale (ROS) [58,59] and Subjective Vitality Scale (SVS) [60,61] before entering the experimental site. The first phase of the experiment involved a 10 min walk within the site, during which the participants were free to choose their own visiting routes. After the walk, the participants were asked to complete the ROS, SVS, Perceived Restorative Scale (PRS) [62,63], and a sensory experience scale [52,53,64,65,66], as well as answer open-ended questions about their sensory experiences and psychological restoration. Subsequently, the participants were required to sit on a bench within the site and observe the surrounding environment for 10 min. After this observation period, they were asked to complete the same set of scales and answer the open-ended questions again. The experiment at each site lasted 40–60 min (Figure 2).
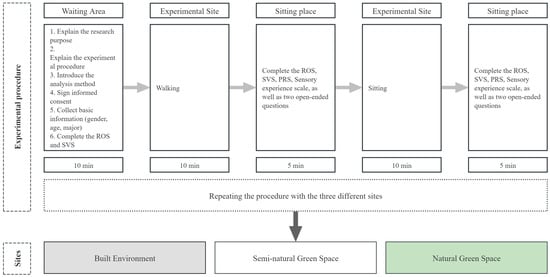
Figure 2.
Experimental procedures.
All 40 participants participated in the experiments at all three sites, with group sizes ranging from 1 to 6 participants per session. The participants were instructed to quietly, independently, and freely experience the sites to minimize the impact of participants on each other [5]. During the experiment, environmental variables such as temperature, humidity, illumination, and decibel levels were measured (Appendix A), and these measurements were used to control for environmental influences on the experimental results. A Kruskal–Wallis H test showed no significant differences in these environmental variables across different sites. The experiment was conducted from 7 May to 5 June 2024, with the timing determined by Edinburgh’s temperate maritime climate and latitude. May to June is springtime in Edinburgh, when outdoor conditions are favourable and the experimental sites offer a rich sensory experience. The specific dates of the experiment were arranged according to the participants’ schedules and weather conditions (sunny days). The participants completed the entire experimental procedure at all three sites, either between 9:00 AM and 12:00 PM or between 1:00 PM and 3:00 PM (Figure 2).
2.4. Measurements
During the experiment, the participants were asked to complete the ROS, SVS, PRS, and sensory experience scales (the items for each scale are detailed in Table 2). All of the scales were measured using a 7-point Likert scale, with ratings ranging from 1 (strongly disagree) to 7 (strongly agree).
Table 2.
Classification categories of the ROS, SVS, and PRS.
First, the ROS is based on the SRT and ART and is used to assess participants’ psychological responses in natural and green spaces [58,59]. Second, the SVS focuses on individuals’ intrinsic motivation, energy levels, and positive emotions, reflecting their vitality and health status in daily life [60]. The PRS, also based on the ART, is used to evaluate participants’ perceived restorative potential in specific environments, particularly how well these environments help alleviate psychological and physiological fatigue [62]. The scale covers several environmental characteristics, such as Being away (i.e., whether the environment helps participants temporarily escape daily worries), Extent (i.e., the expansiveness and coherence of the environment), Fascination (i.e., the environment’s ability to attract participants’ attention), and Compatibility (i.e., the degree to which the environment aligns with participants’ expectations). The PRS comprises 22 items [63]. As the PRS is specifically designed to assess attention restoration, this study omitted the item ‘My attention and alertness are significantly improved here’ from the original ROS.
The sensory experience scale addresses four sensory dimensions: vision, hearing, smelling, and tactility. As described in Section 1, based on previous research and expert consultations, we used perception, quality, and variety as indicators for each sensory experience and developed the corresponding scales (Table 2). Perception refers to the awareness and experience of environmental landscape elements through various senses, emphasising the amount and intensity of information received by an individual [52]. Quality refers to the overall satisfaction and enjoyment of various sensory experiences, focusing on the harmony and comfort of these experiences [53,64,65]. Variety refers to the number and types of different sensory experiences, reflecting the richness and variability of sensory experiences [66].
Finally, to further clarify the specific content of the sensory experiences provided by the three urban environments and their effects on the participants, as well as to supplement these scale results, we set two open-ended questions. The first question aimed to understand the participants’ perceptions of sensory landscape elements in the three urban spaces: ‘Please describe in a sentence your most memorable visual, hearing, smelling, and tactile experiences in site you just visited (you may skip any sense that did not leave an impression)’. The second question explored participants’ subjective physiological and psychological changes: ‘Please describe in a sentence how you felt and what changes you experienced after visiting the site (you may discuss your feelings or changes in psychological, physiological, or any other aspects)’. The participants were instructed to answer freely, with no word limits.
2.5. Statistical Analysis
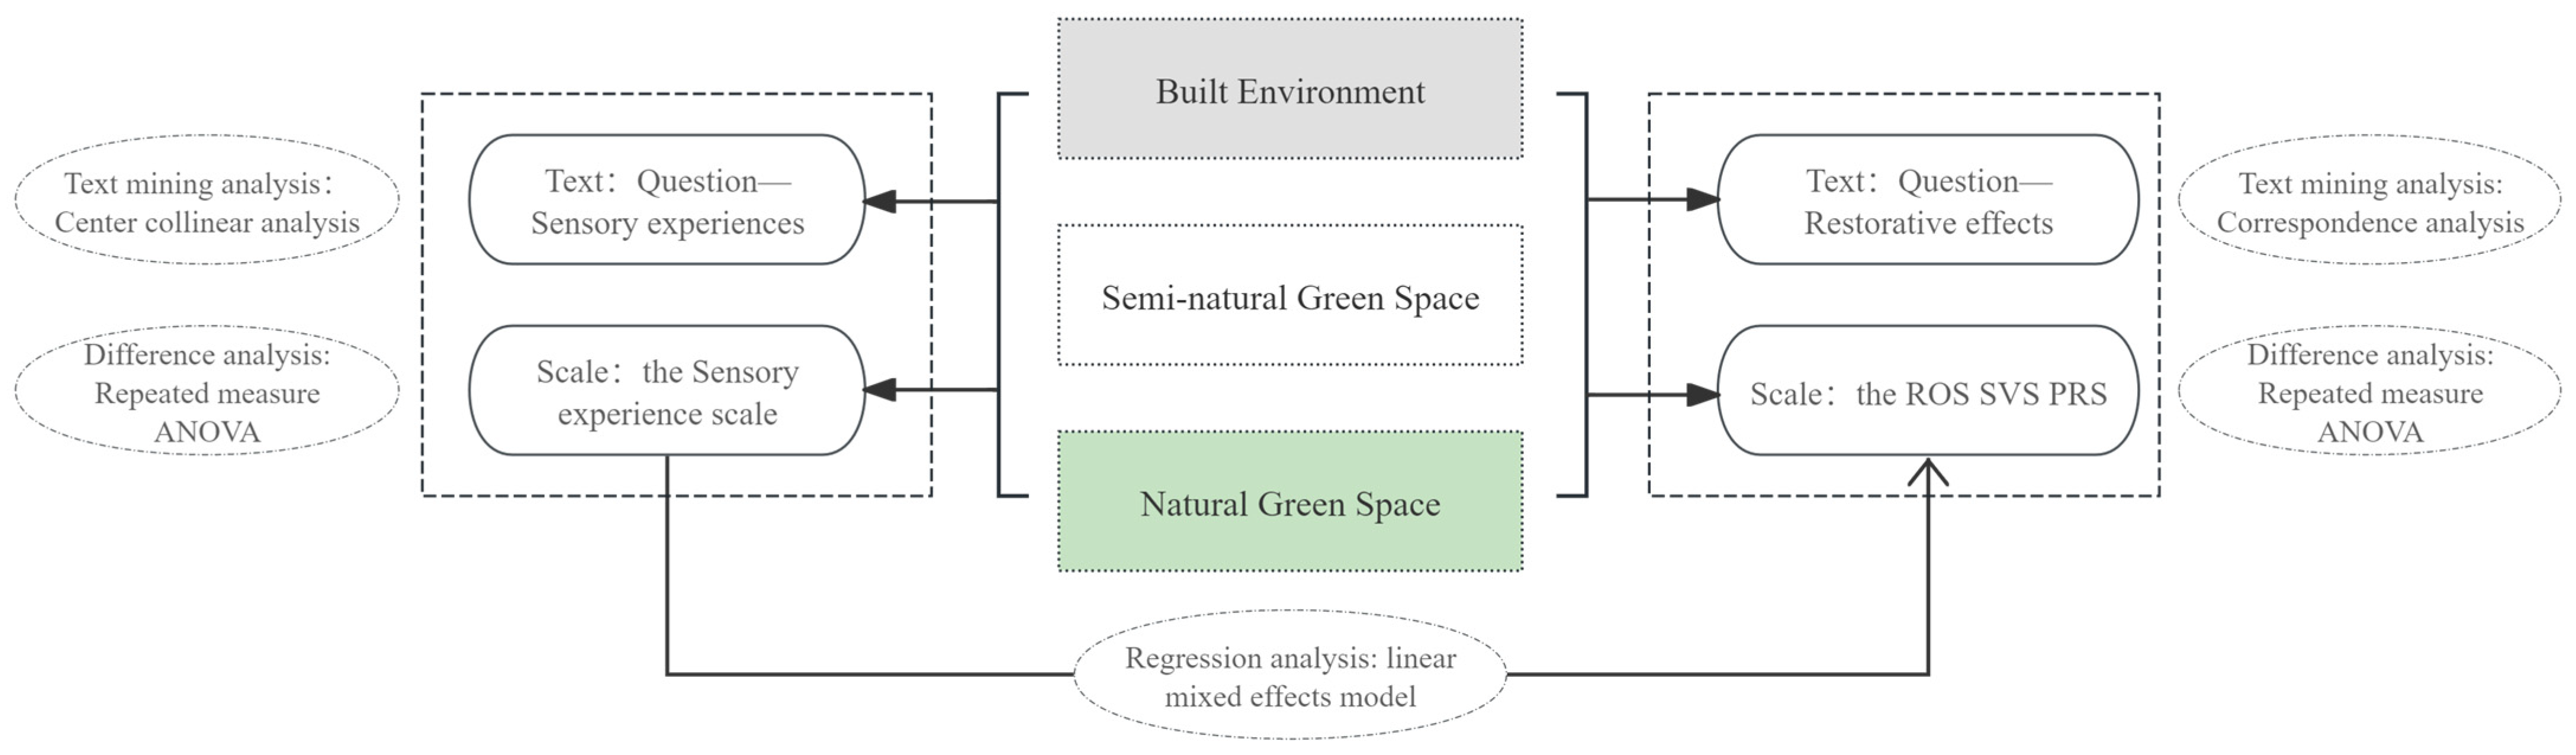
SPSS 27.0 was used to perform statistical analysis on the data collected from the 40 participants using various scales. First, a reliability analysis was conducted on all the data obtained from the ROS, SVS, and PRS, as well as the sensory experience scales. The Cronbach’s alpha for the ROS was 0.895, and for the SVS it was 0.869. The Cronbach’s alphas for the dimensions of the PRS scale—Being Away, Extent, Fascination, and Compatibility—were 0.958, 0.962, 0.751, and 0.948, respectively, with an overall Cronbach’s alpha of 0.963. For the sensory experience scales, the Cronbach’s alphas for the vision, hearing, smelling, and tactility dimensions were 0.879, 0.745, 0.849, and 0.929, respectively, with an overall Cronbach’s alpha of 0.928. All reliability coefficients exceeded 0.7, indicating high internal consistency. Next, following the research framework outlined in Figure 3, a repeated measures ANOVA was conducted using SPSS 27.0 to compare the differences between places and various intervention modes. Additionally, a linear mixed effects model was established to explore the sensory indicators that significantly influenced psychological restoration. For the open-ended questions, text mining analysis was performed using KH Coder, and the relationships between high-frequency words, places, and intervention modes were visualised.
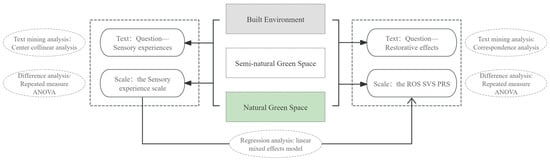
Figure 3.
The research framework.
3. Results
3.1. Sensory-Experience Differences across Places and Intervention Modes
3.1.1. Results of the Repeated Measures ANOVA of Scales
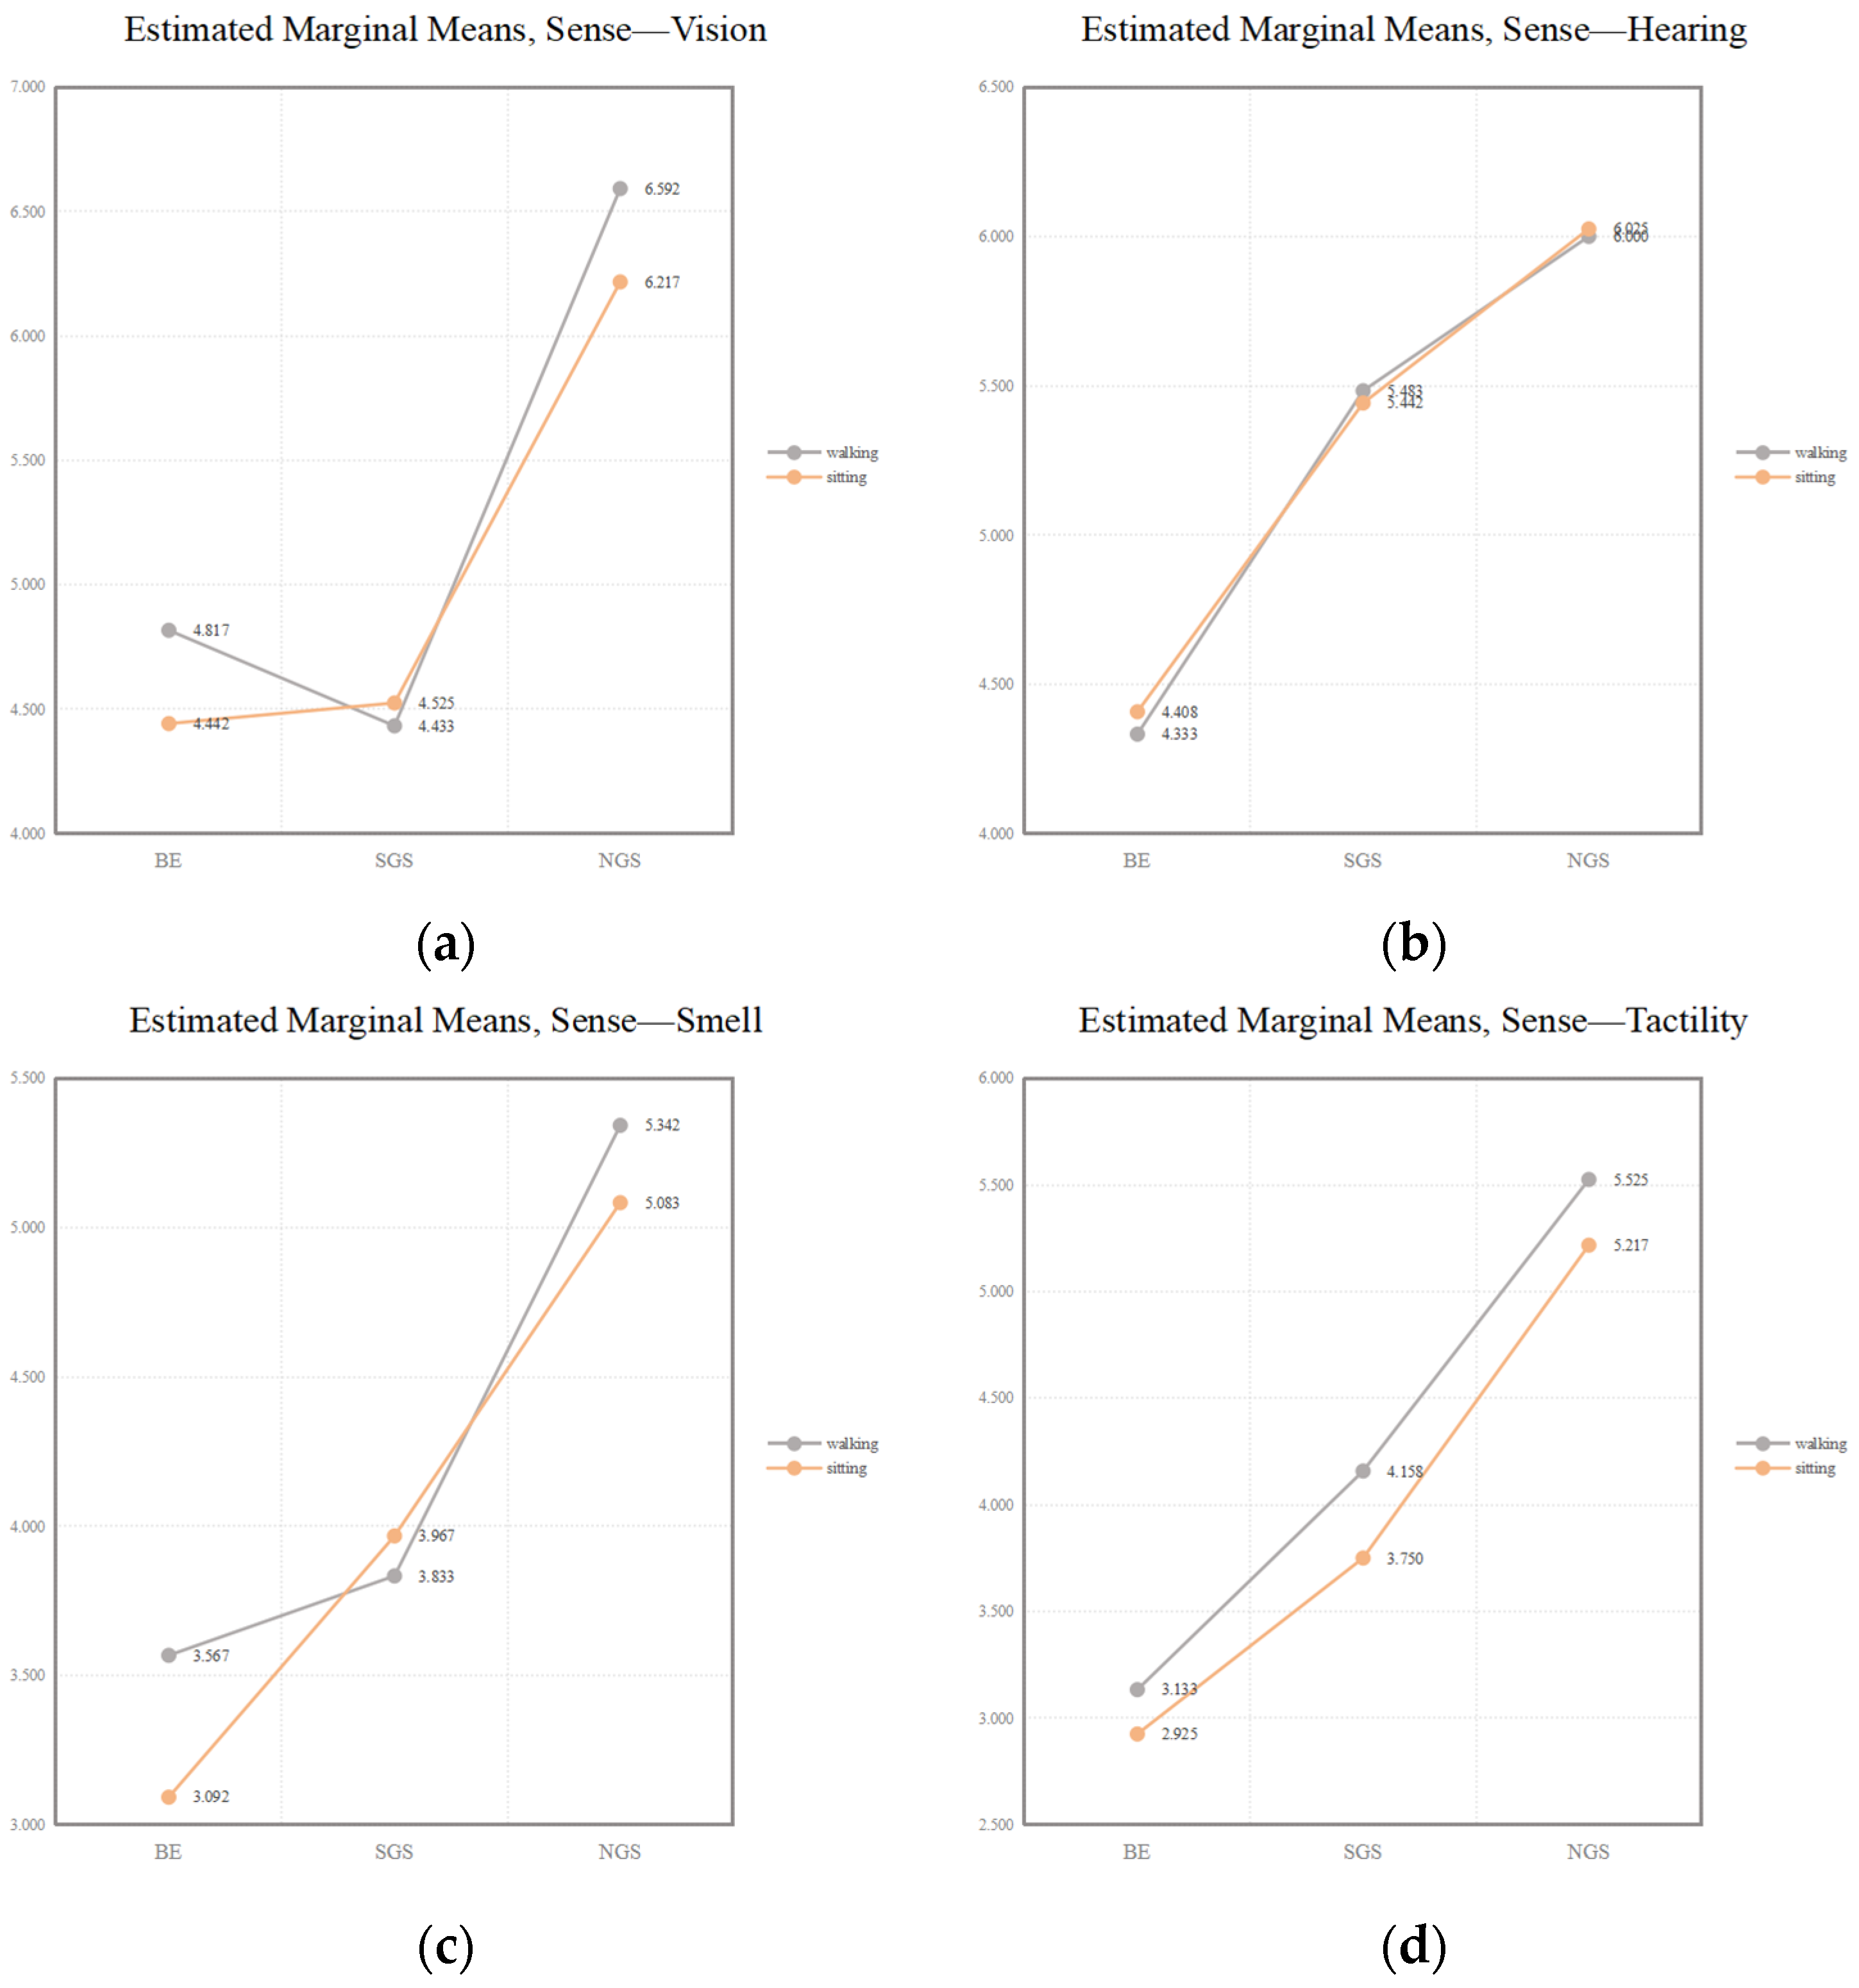
Table 3 indicates that place had a significant effect on all types of sensory experience. Pairwise comparisons for hearing, smelling, and tactile experiences were consistent in the order of NGS > SGS > BE. The trend for visual experience scores was similar to that of the other three senses, whereas the difference in visual experience between the SGS (M = 4.479, SD = 0.151) and BE (M = 4.629, SD = 0.154) was not significant. Intervention mode had no significant effect on any of the four sensory experiences, and the interaction between place and intervention mode was not statistically significant. However, Figure 4 illustrates that the degree to which different sensory experiences were influenced by the intervention modes varies, with the hearing experience being the least affected (Figure 4b). Additionally, in all three places, the participants’ tactile experiences were consistent—Walking > Sitting.
Table 3.
Sensory experience sores under the effects of place, intervention mode, and their interaction.
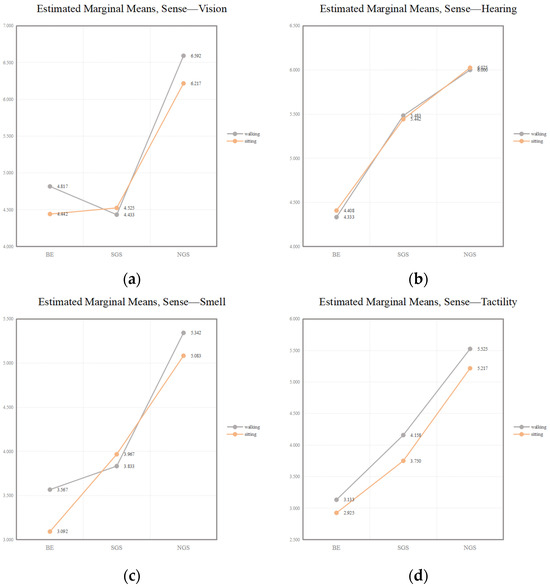
Figure 4.
Interaction graphs for vision (a), hearing (b), smell (c), and tactility (d). Note: BE = built environment; SGS = semi-natural green space; NGS = natural green space.
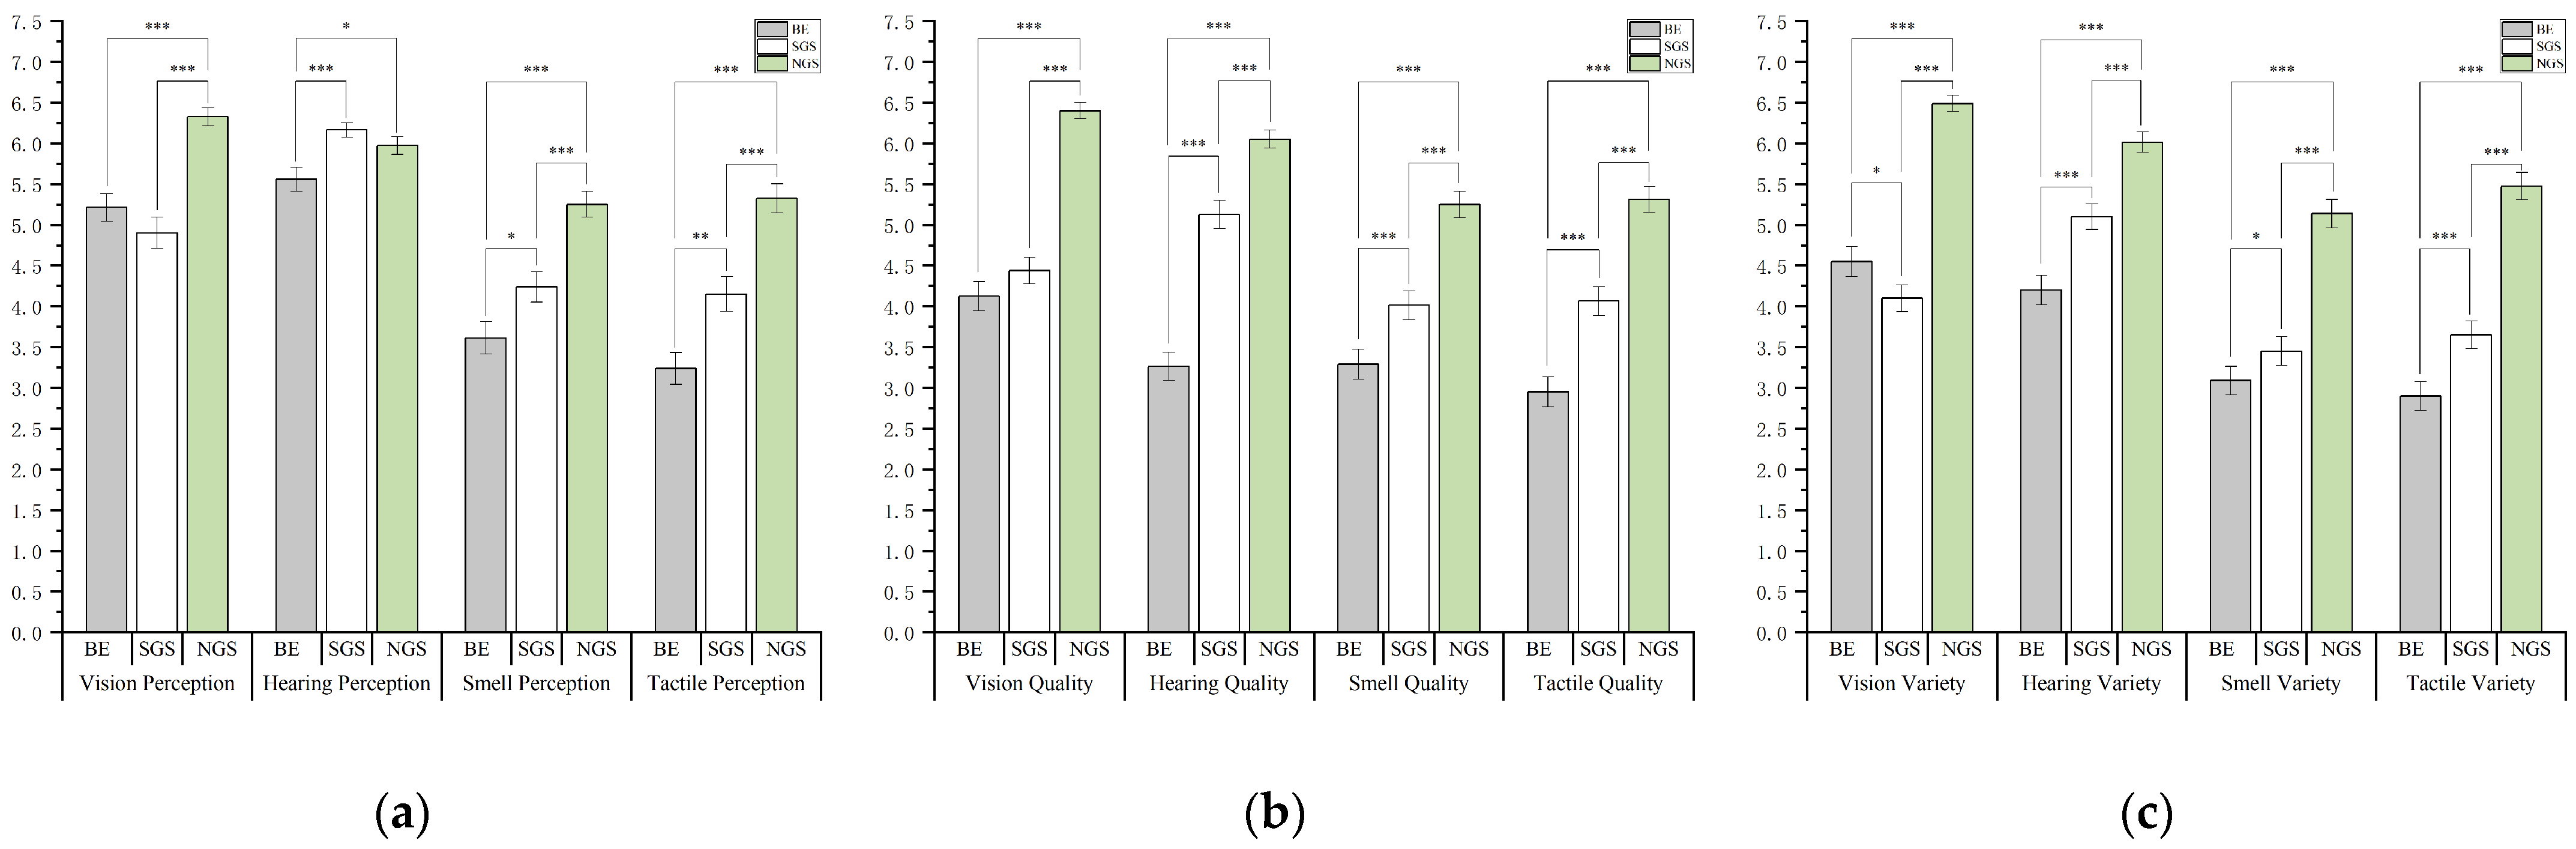
The results of the repeated measures ANOVA for the three indicators of perception, quality, and variety are presented in Figure 5. Figure 5a shows that the trends for smell and tactile perception scores across different places were similar, in the order of NGS > SGS > BE. Similarly, visual perception in the NGS was significantly stronger than in the other two urban spaces. However, people were more likely to notice hearing landscapes in the SGS. In terms of sensory quality, Figure 5b shows that all four senses followed the order NGS > SGS > BE, although the visual difference between the SGS and BE was not significant. Regarding sensory variety, Figure 5c shows that the NGS offered significantly more variety across all four senses than the SGS. The variety of hearing, smelling, and tactile experiences in the SGS was much higher than that in the BE. However, in terms of vision diversity, the BE offered more variety than the SGS.
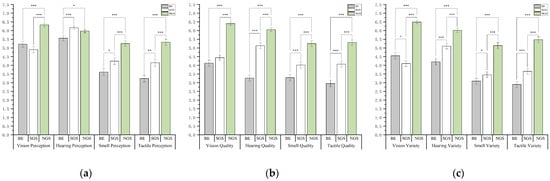
Figure 5.
Different results about sensory perception (a), quality (b), and variety (c) in three spaces. Note: BE = built environment, SGS = semi-natural green space; NGS = natural green space; * p < 0.05, ** p < 0.01, *** p < 0.001.
3.1.2. Text Mining Results About the Open Question on Sensory Experiences
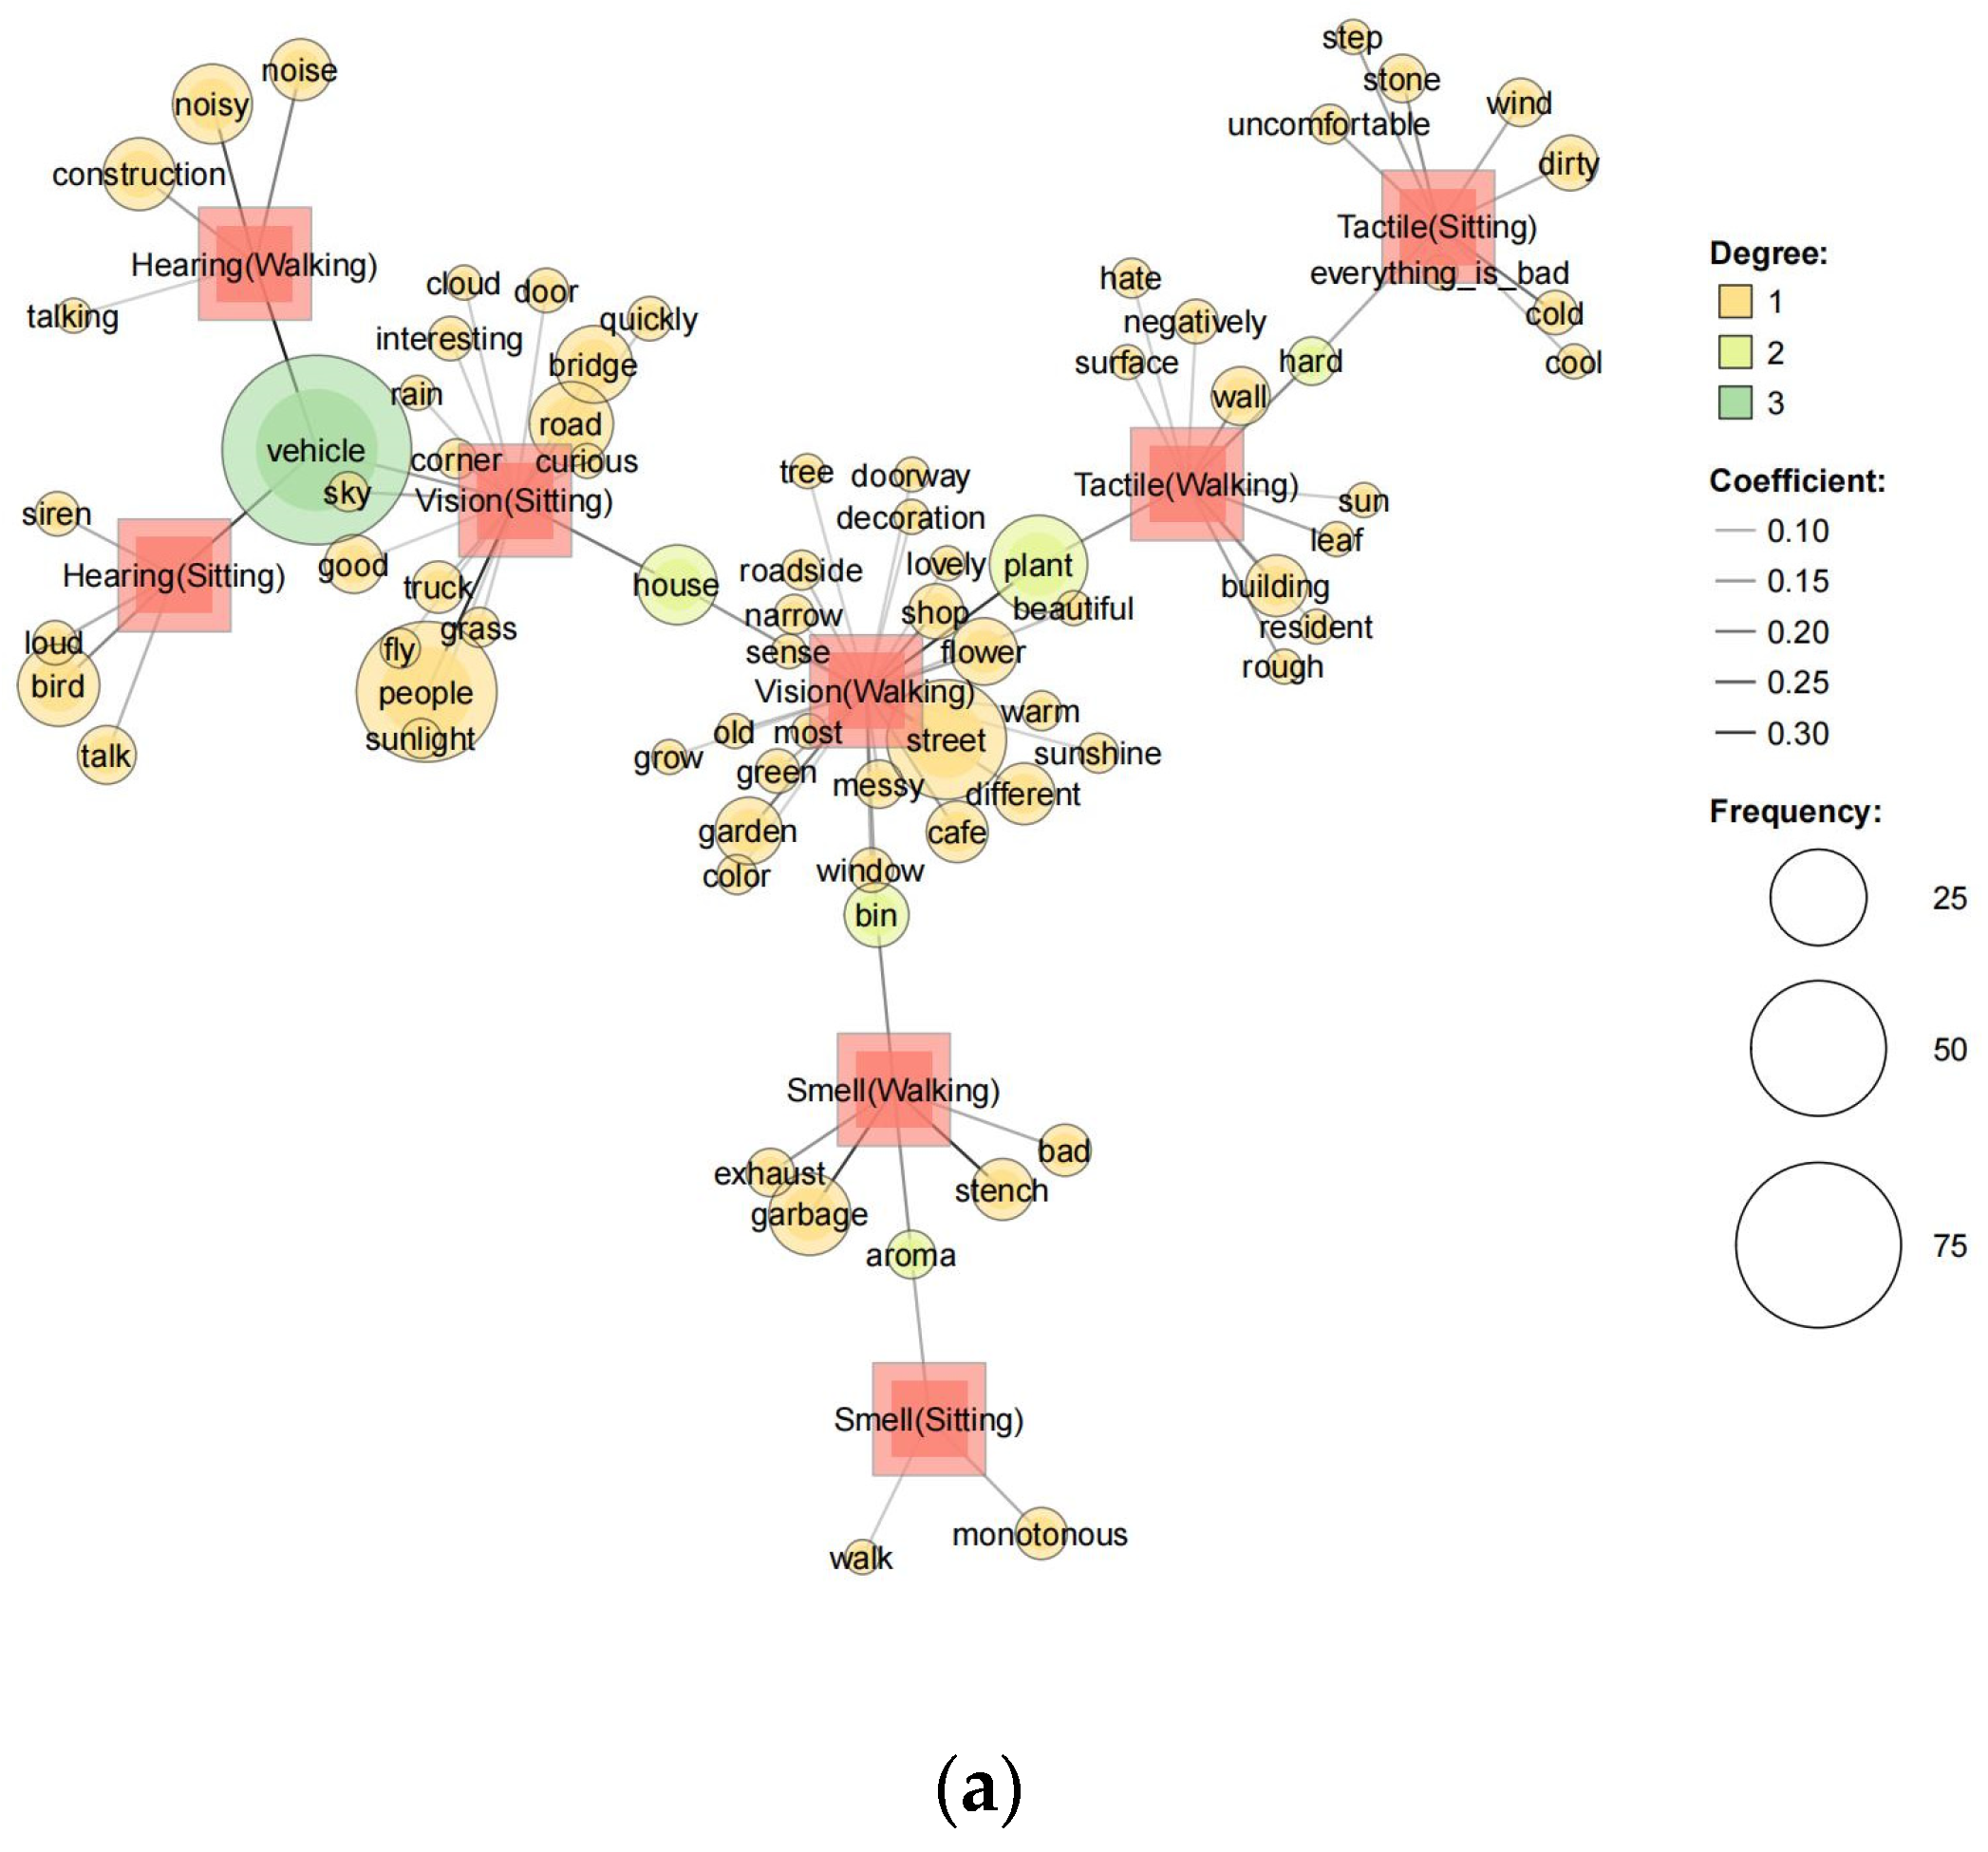
This study analysed the co-occurrence network of high-frequency words (correlation coefficient > 0.1) from the responses to the first question to explore the impact of the three urban spaces and different intervention modes on sensory experience. In the co-occurrence network shown in Figure 6, the most frequently occurring words are primarily nouns and adjectives. Nouns represent specific elements in an environment that attract sensory attention, whereas adjectives reflect the positive or negative nature of these experiences. Across all intervention modes in the three environments, high-frequency words related to visual landscapes outnumbered those related to other sensory experiences. However, in the NGS, high-frequency words associated with non-visual sensory experiences were significantly more prevalent than those in the SGS and BE, which aligns with the trends observed in Figure 5 for sensory perception and variety.
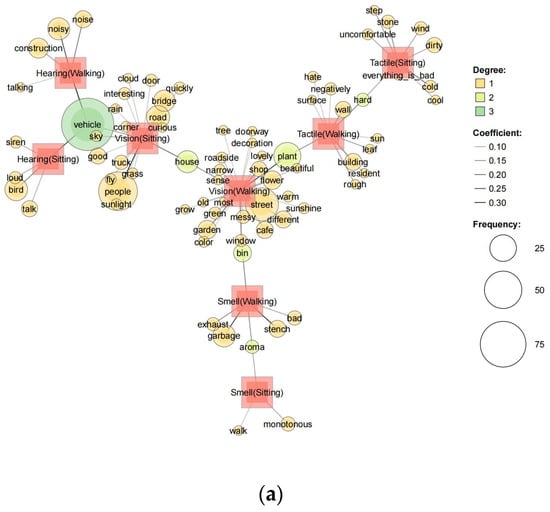
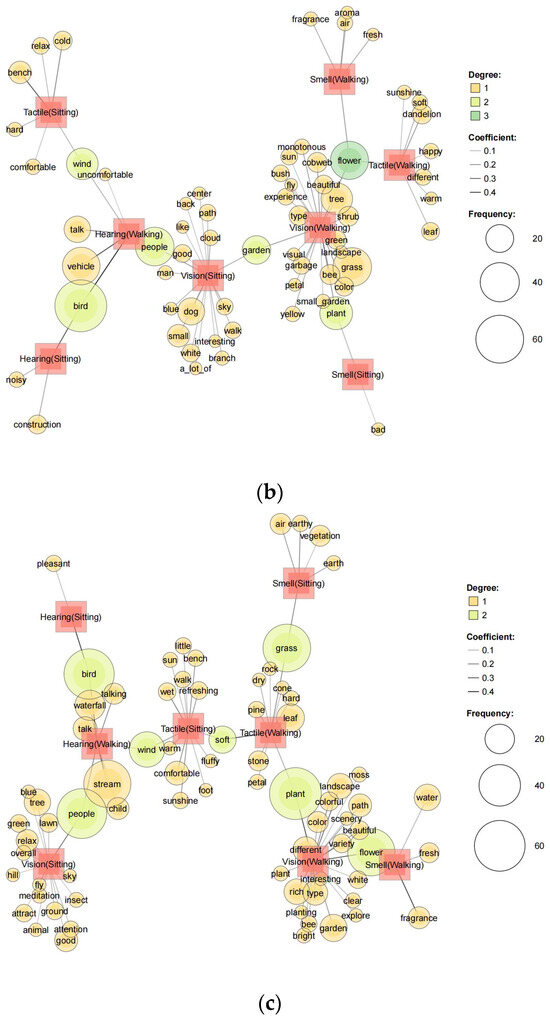
Figure 6.
Central co-occurrence among different sensory and intervention modes in BE (a), SGS (b), and NGS (c). Note: BE = built environment; SGS = semi-natural green space; and NGS = natural green space.
Additionally, many nouns in the BE co-occurrence network were associated with artificial elements and were accompanied by more negative adjectives. The participants in the BE typically noted streets/roads, hurried people, vehicles such as trucks, bridges, shops such as cafés, entry doors, and small private gardens. They frequently reported hearing vehicles, construction, sirens, and people talking. Tactile experiences often involved buildings, walls, steps, and stones, whereas smell experiences were associated with exhaust, stench, and garbage. Although the participants occasionally described their visual experiences in BE in positive terms such as ‘good’, ‘beautiful’, ‘lovely’, and ‘interesting’, negative adjectives such as ‘bad’, ‘dirty’, ‘uncomfortable’, ‘monotonous’, ‘noisy’, and ‘cold’ were more common. By contrast, text analysis for the NGS revealed that participants generally perceived the space to be rich in natural elements, high in the degree of exposure to greenery, less in the built environment experienced by people, and conducive to positive sensory experiences. Descriptions frequently included terms such as ‘beautiful landscapes or scenery’, ‘birdsong’, ‘talking’, and the ‘sounds of waterfalls and streams’. Tactile experiences involved natural elements, such as grass, leaves, rocks, pine, and petals, whereas smelling experiences were linked to the scents of grass, vegetation, and streams. Participants commonly used positive adjectives like ‘good’, ‘pleasant’, ‘relaxing’, and ‘comfortable’ to describe their experiences in the NGS. The SGS was perceived as a middle ground between the NGS and BE. Consistent with the repeated measures ANOVA results in Table 3 and Figure 4, the sensory experience ranking across the three urban spaces was as follows: NGS > SGS > BE.
Furthermore, text analysis of sensory experiences showed that, in all urban spaces, participants tended to focus on specific, static objects while walking, whereas their visual perception expanded while sitting, allowing them to capture more dynamic moments. For example, in the BE, walking participants were more likely to notice streets, plants, shops, and cafés, while sitting led them to focus more on vehicles, people, and bridges. In the NGS and SGS, sitting broadened participants’ observations beyond the immediate environment, introducing words like ‘blue’ and ‘cloud’ to describe the sky. While sitting in the NGS, participants also noted flying insects and passing pedestrians, and in the SGS, they paid attention to dynamic elements such as dogs playing in the grass and elderly people exercising. Tactile and smell experiences were affected by the intervention mode across different spaces. Sitting tended to limit participants’ tactile and smell perceptions, restricting their attention to nearby surroundings and resulting in less diverse experiences than walking. Text analysis suggested that the intervention mode had minimal impact on hearing input.
3.2. Restorative Effects Differences across Places and Intervention Modes
3.2.1. Results of the Repeated Measures ANOVA of Scales
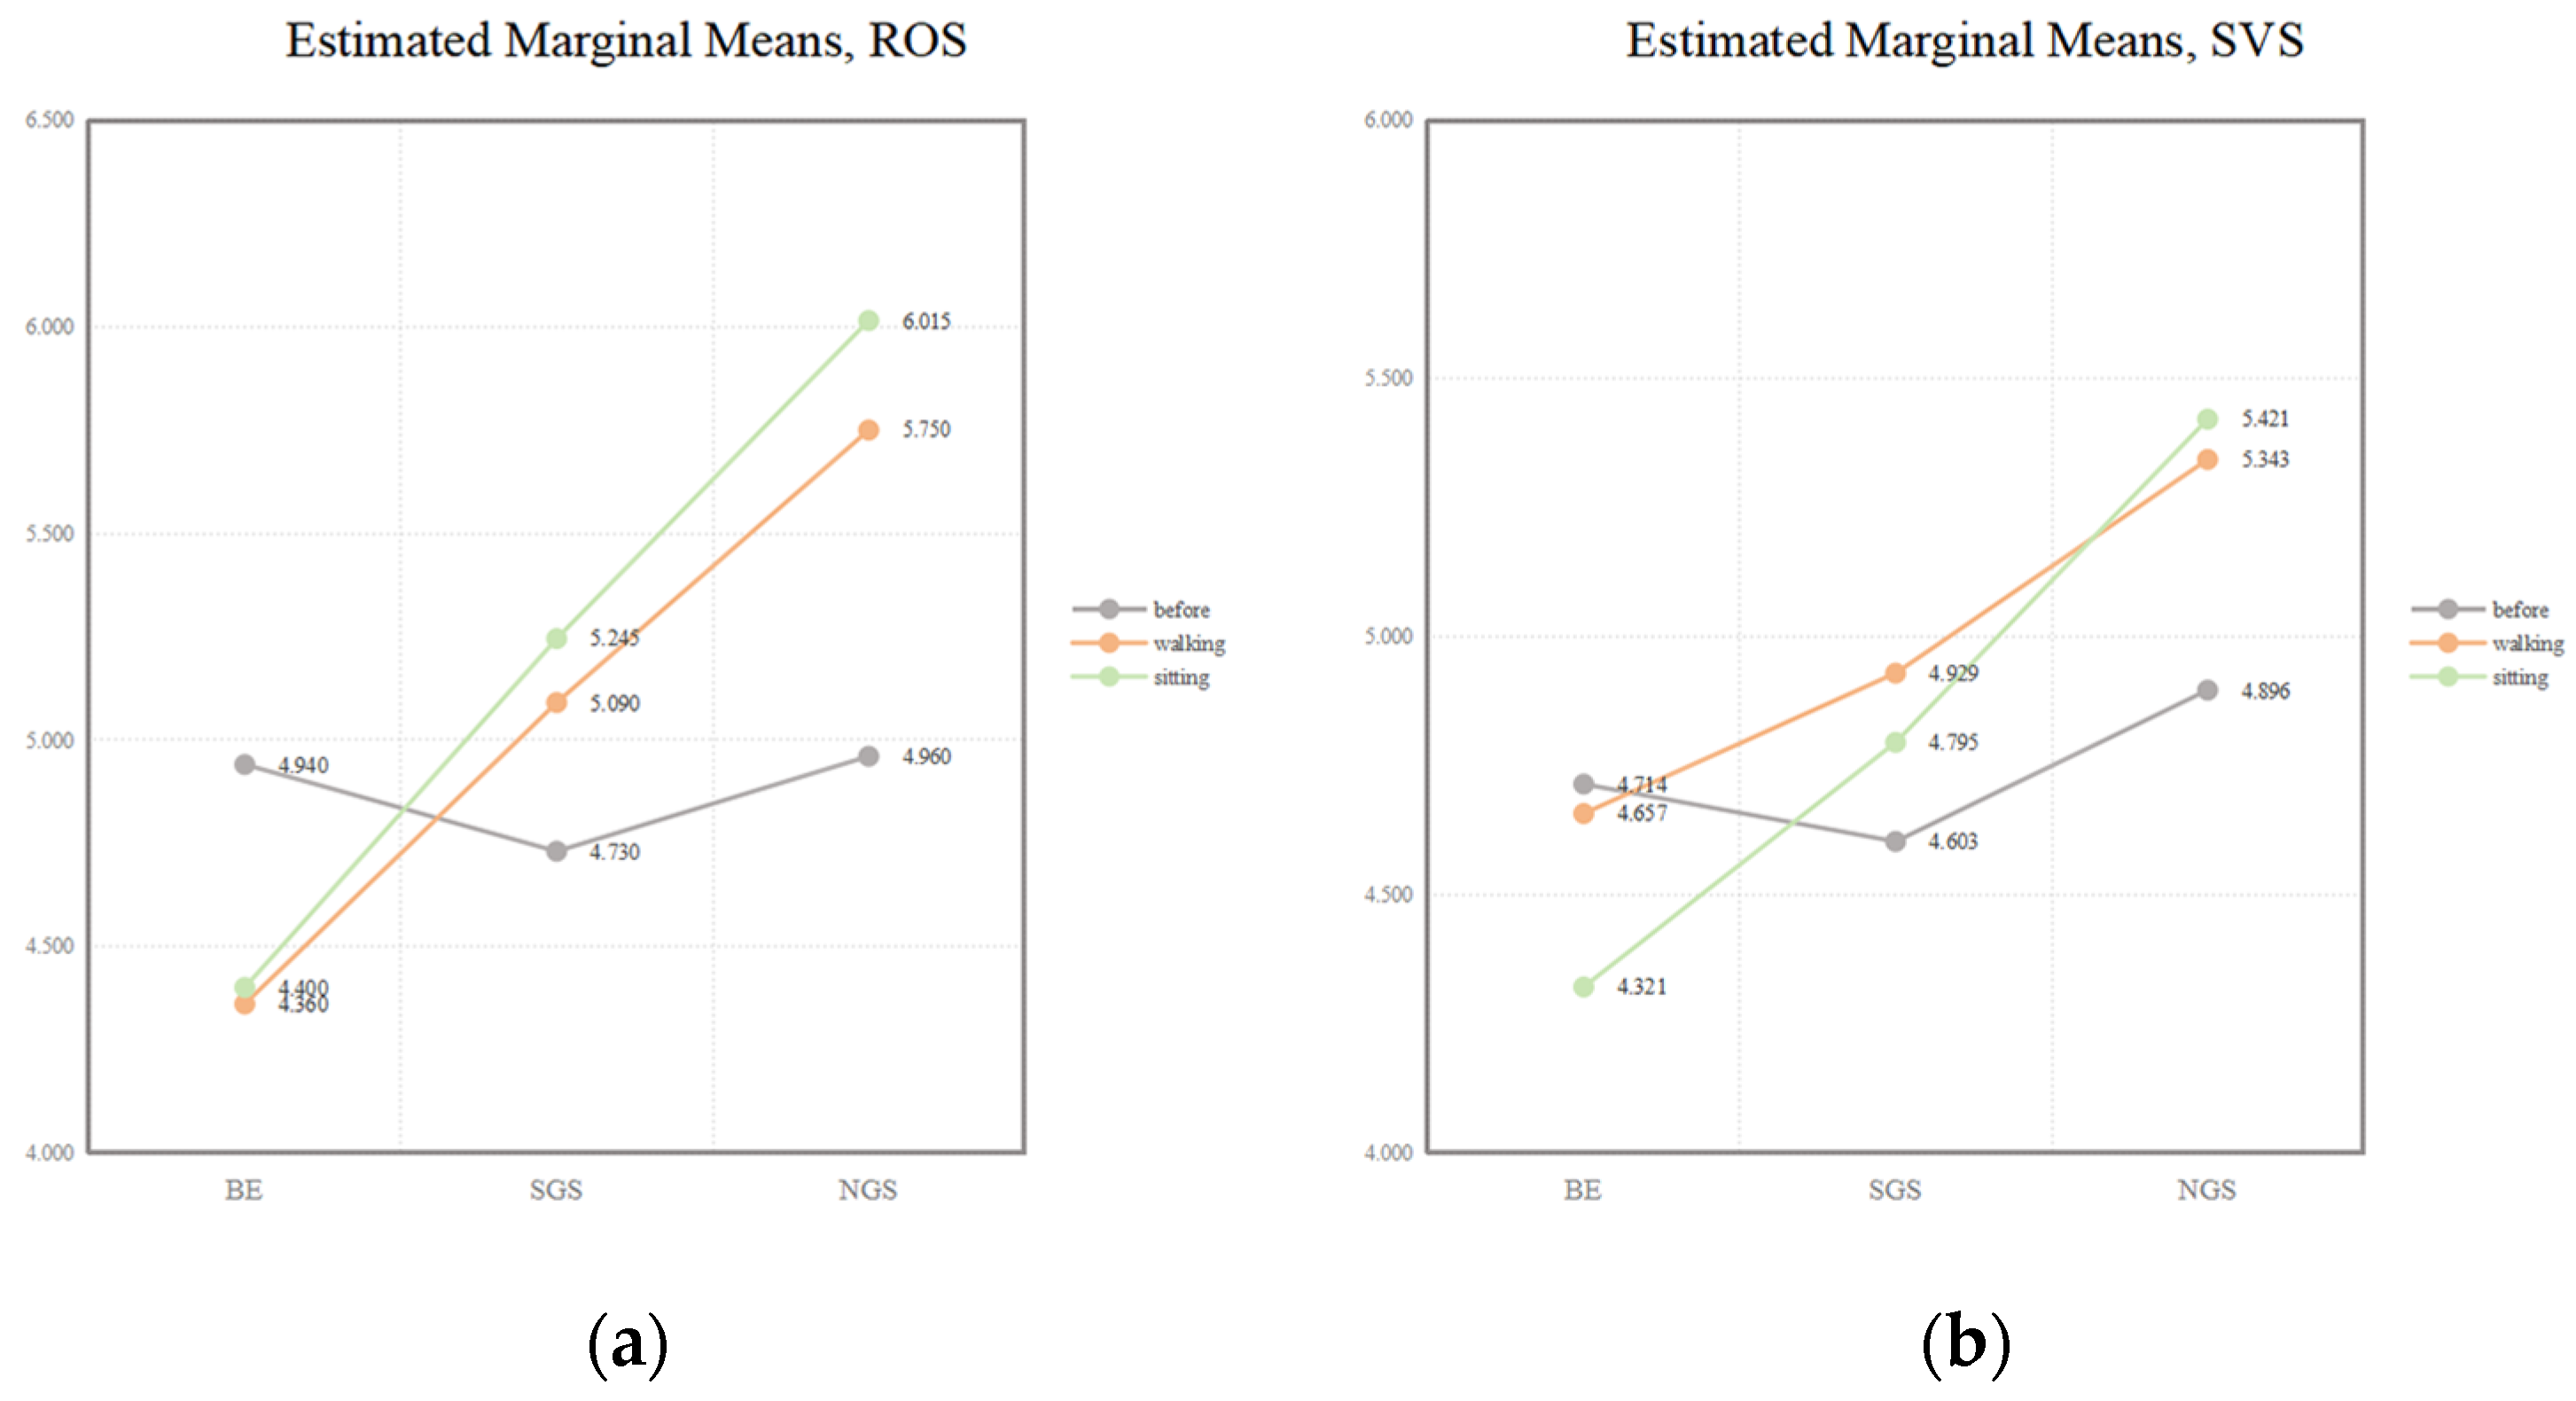
Table 4 shows that different urban space types have a significant impact on ROS and SVS scores. In terms of promoting mental relaxation and calmness, as well as enhancing vitality, the scores for the three spaces follow the following order: NGS > SGS > BE. Additionally, Table 2 indicates that the interaction between place and intervention mode had a statistically significant effect on ROS and SVS scores. To further explore this, we conducted a simple effects analysis for place and intervention mode separately (Table 5) and combined it with Figure 7 to obtain the following results: in both the NGS and SGS, participants’ scores were higher after entering sites, indicating that spaces with a higher average green view rate and those farther from boundary to the built environment could make individuals feel more energised, refreshed, relaxed, and clear-headed, although this effect was less pronounced in SGS. In the BE, whether walking or sitting, scores on both scales were lower than before entering the space, indicating the negative impact of the BE on psychological restoration. However, walking in the BE did not significantly affect subjective vitality.
Table 4.
ROS and SVS scores under the effects of place, intervention mode, and their interaction.
Table 5.
Simple effects analysis of the indicators that have significant interaction effects on ROS and SVS.
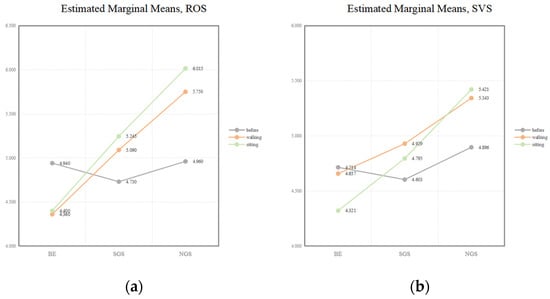
Figure 7.
Different results about ROS (a) and SVS (b) in three spaces. Note: BE = built environment; SGS = semi-natural green space; NGS = natural green space.
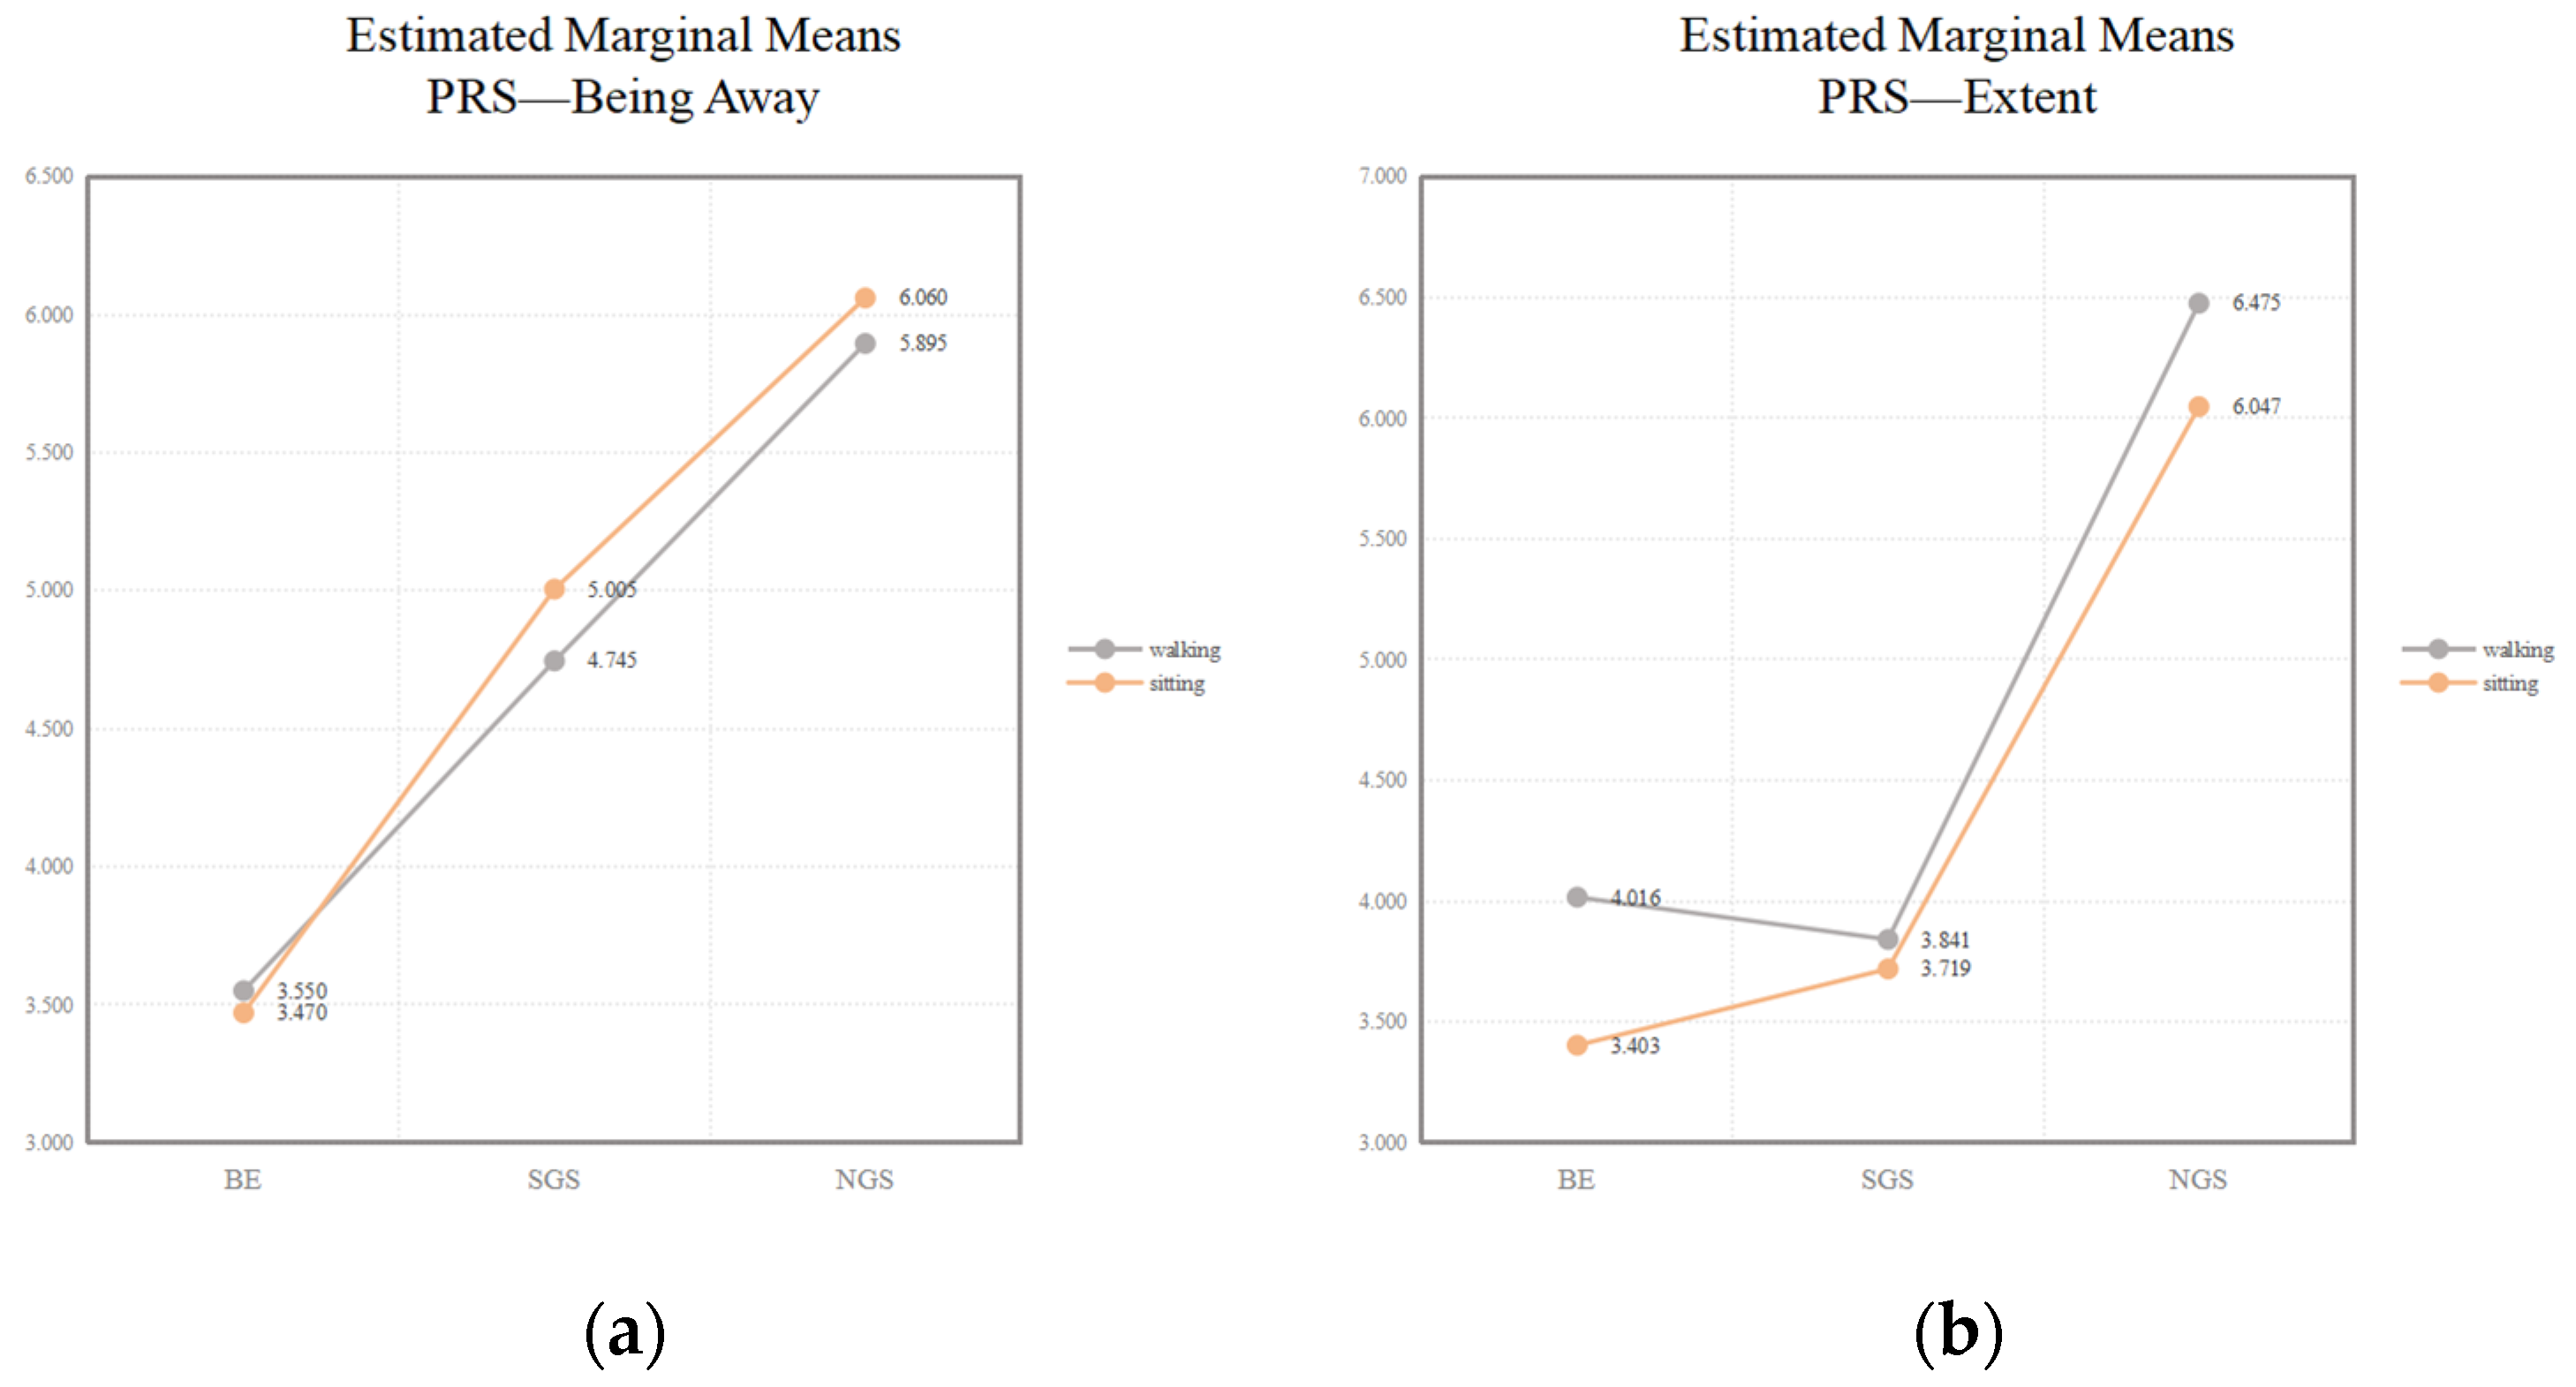
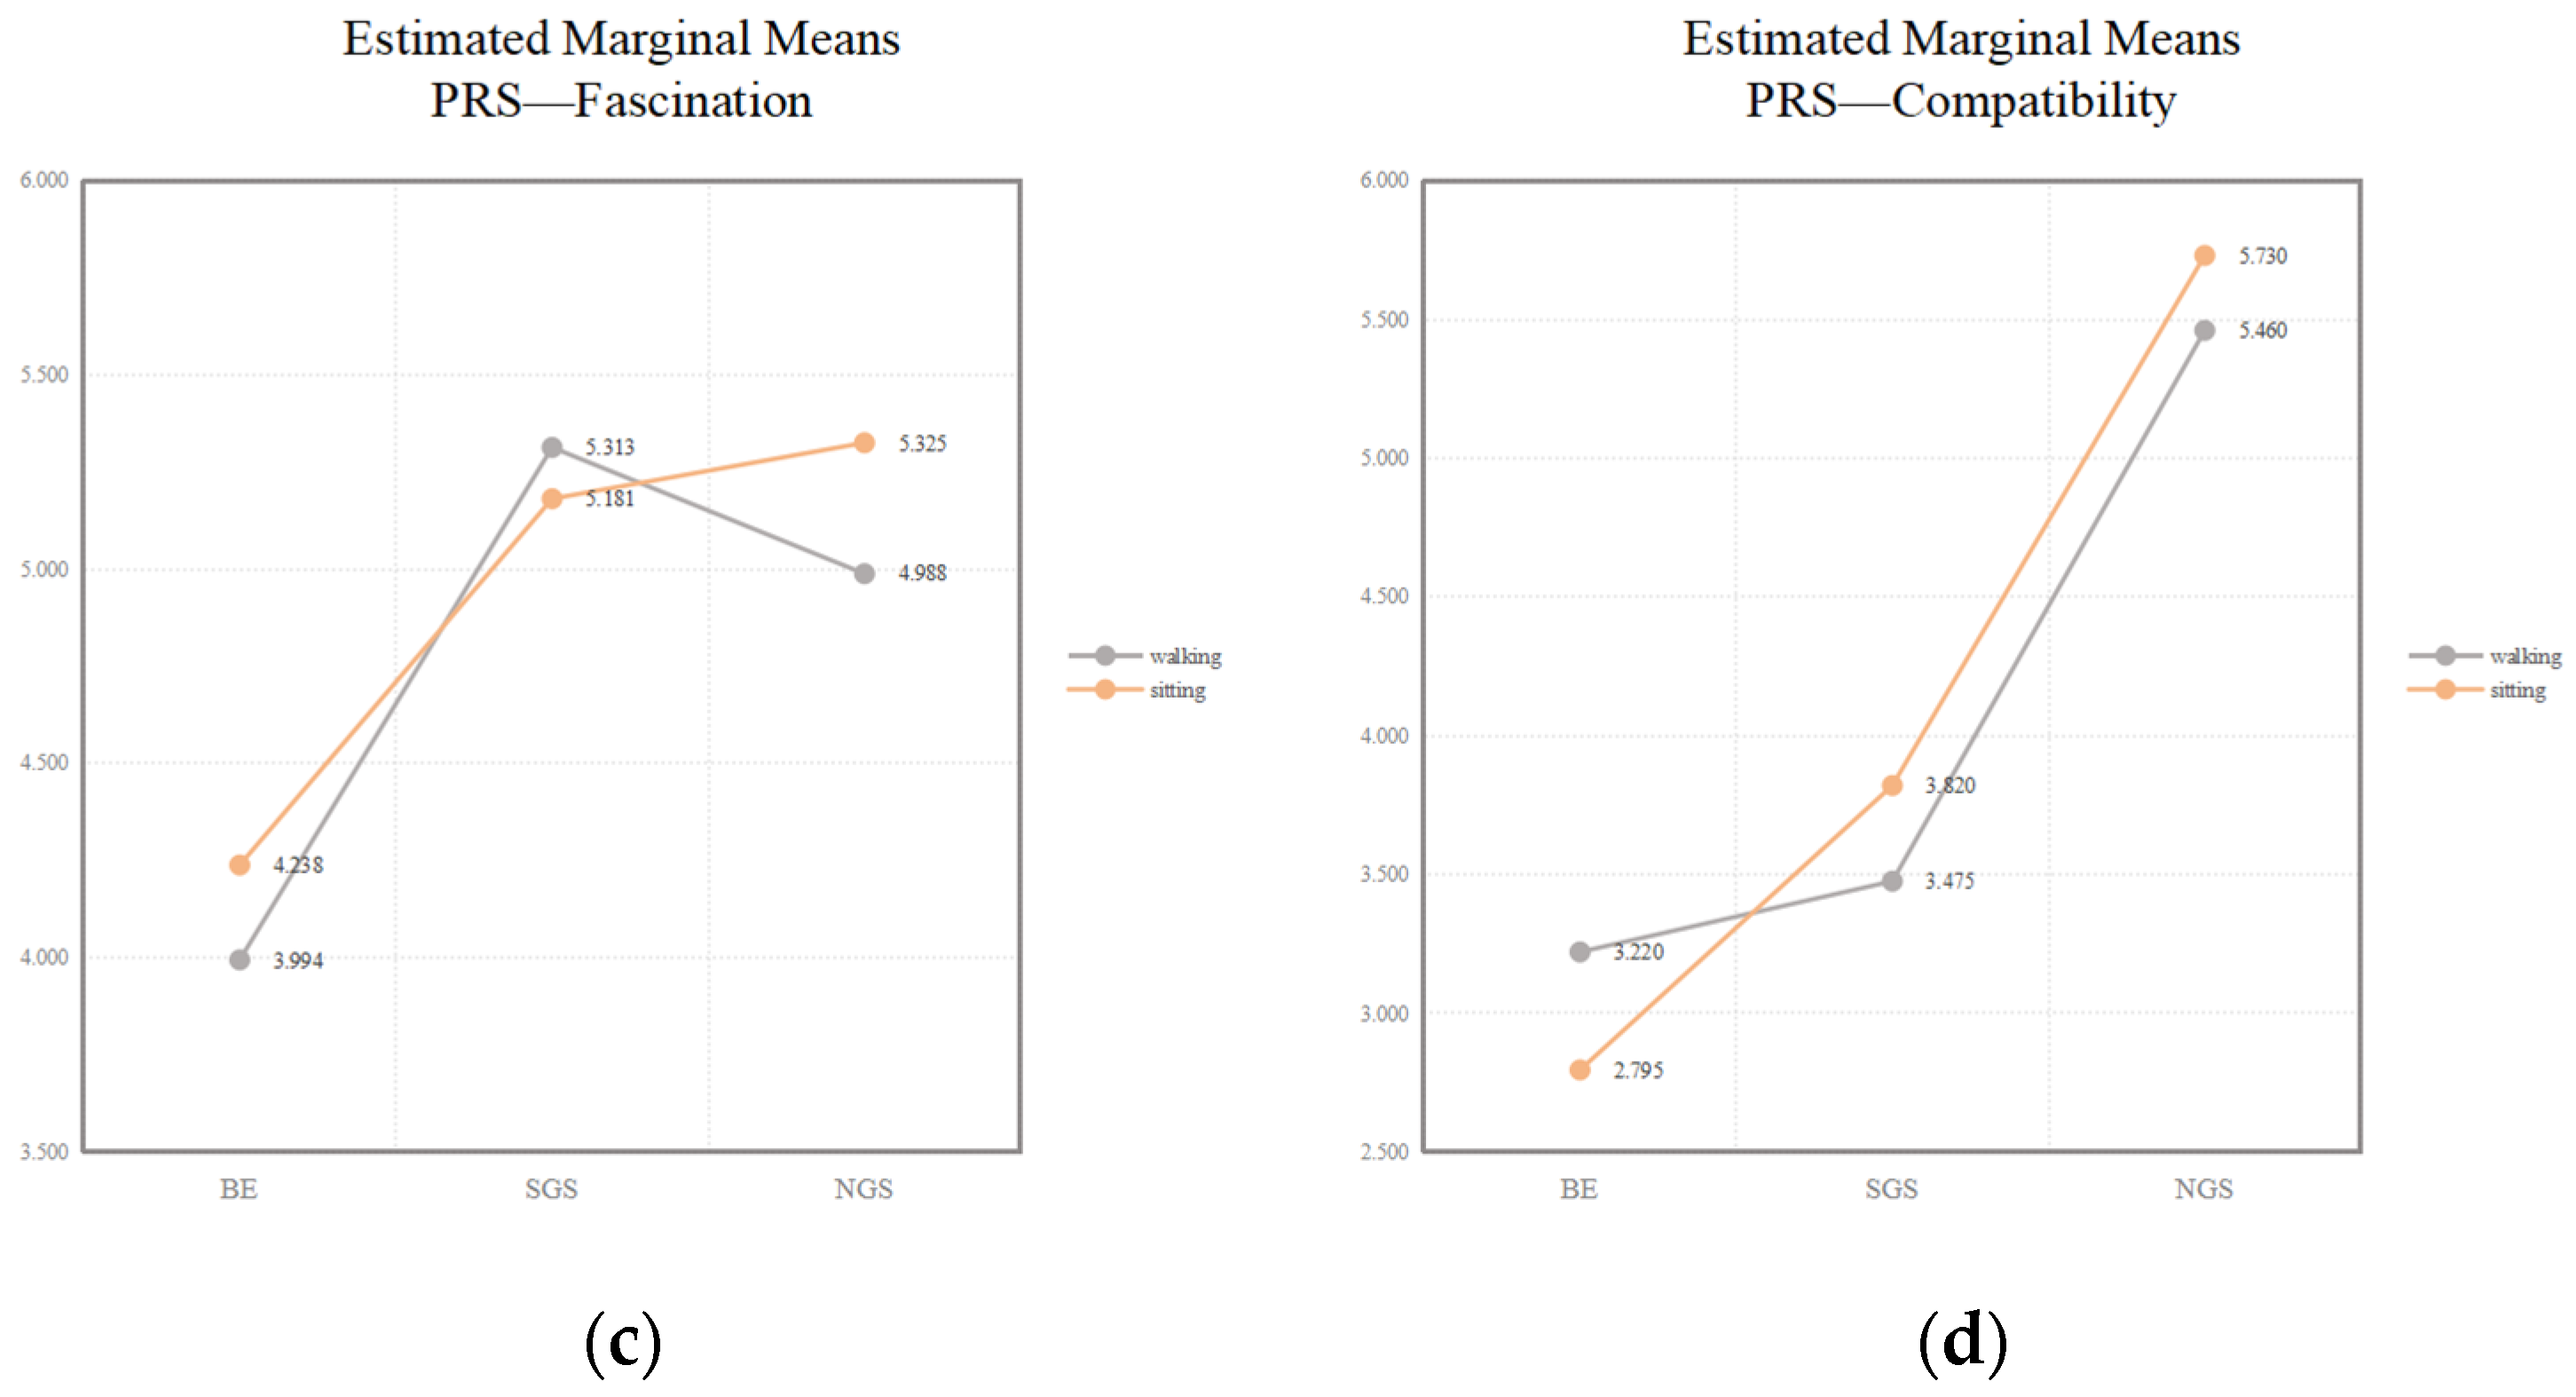
For the PRS scale, Table 6 shows that the space type had a statistically significant effect on the scores for Being away and Compatibility. According to the pairwise comparison results, the order of scores for these two dimensions across the three spaces was consistent—NGS > SGS > BE. This indicates that urban spaces with a higher average green view rate are more effective in helping individuals escape from daily tasks and stress, making it easier for their needs and expectations to be met, thus facilitating better mental restoration. However, the intervention mode and its interaction with place did not have a significant impact on the scores in these two dimensions. Similarly, Fascination showed significant differences only between spaces. Pairwise comparison results indicated that the scores for the NGS (M = 5.156) and SGS (M = 5.247) were similar, and both were significantly higher than those for the BE (M = 4.116), suggesting that green, natural spaces are more conducive to restoring directed attention than grey, artificial spaces. The Extent score showed significant differences between the different types of urban spaces (p < 0.001) and was influenced by the intervention mode (p = 0.037). Pairwise comparisons indicated that the scores for the SGS (M = 3.780) and BE (M = 3.709) were similar and both much lower than those for the NGS (M = 6.261). Sitting was found to be more effective for escaping daily concerns and meeting individual expectations, whereas walking was more effective for perceiving the expansiveness and coherence of the space (Figure 8).
Table 6.
PRS score under the effects of place, intervention mode, and their interaction.
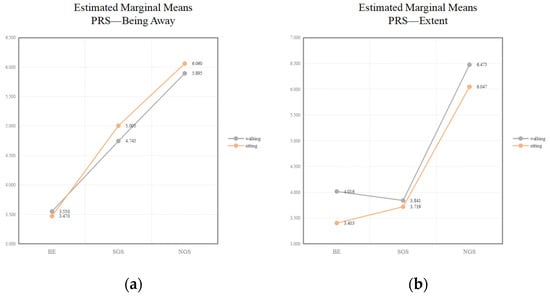
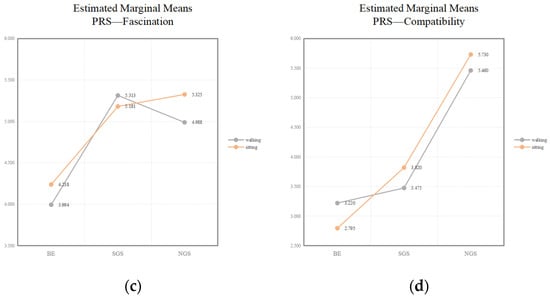
Figure 8.
Different results about PRS’s Being away (a), Extent (b), Fascination (c) and Compatibility (d) in three space. Note: BE = built environment; SGS = semi-natural green space; NGS = natural green space.
3.2.2. Text Mining Results about the Open Question on Restorative Effects
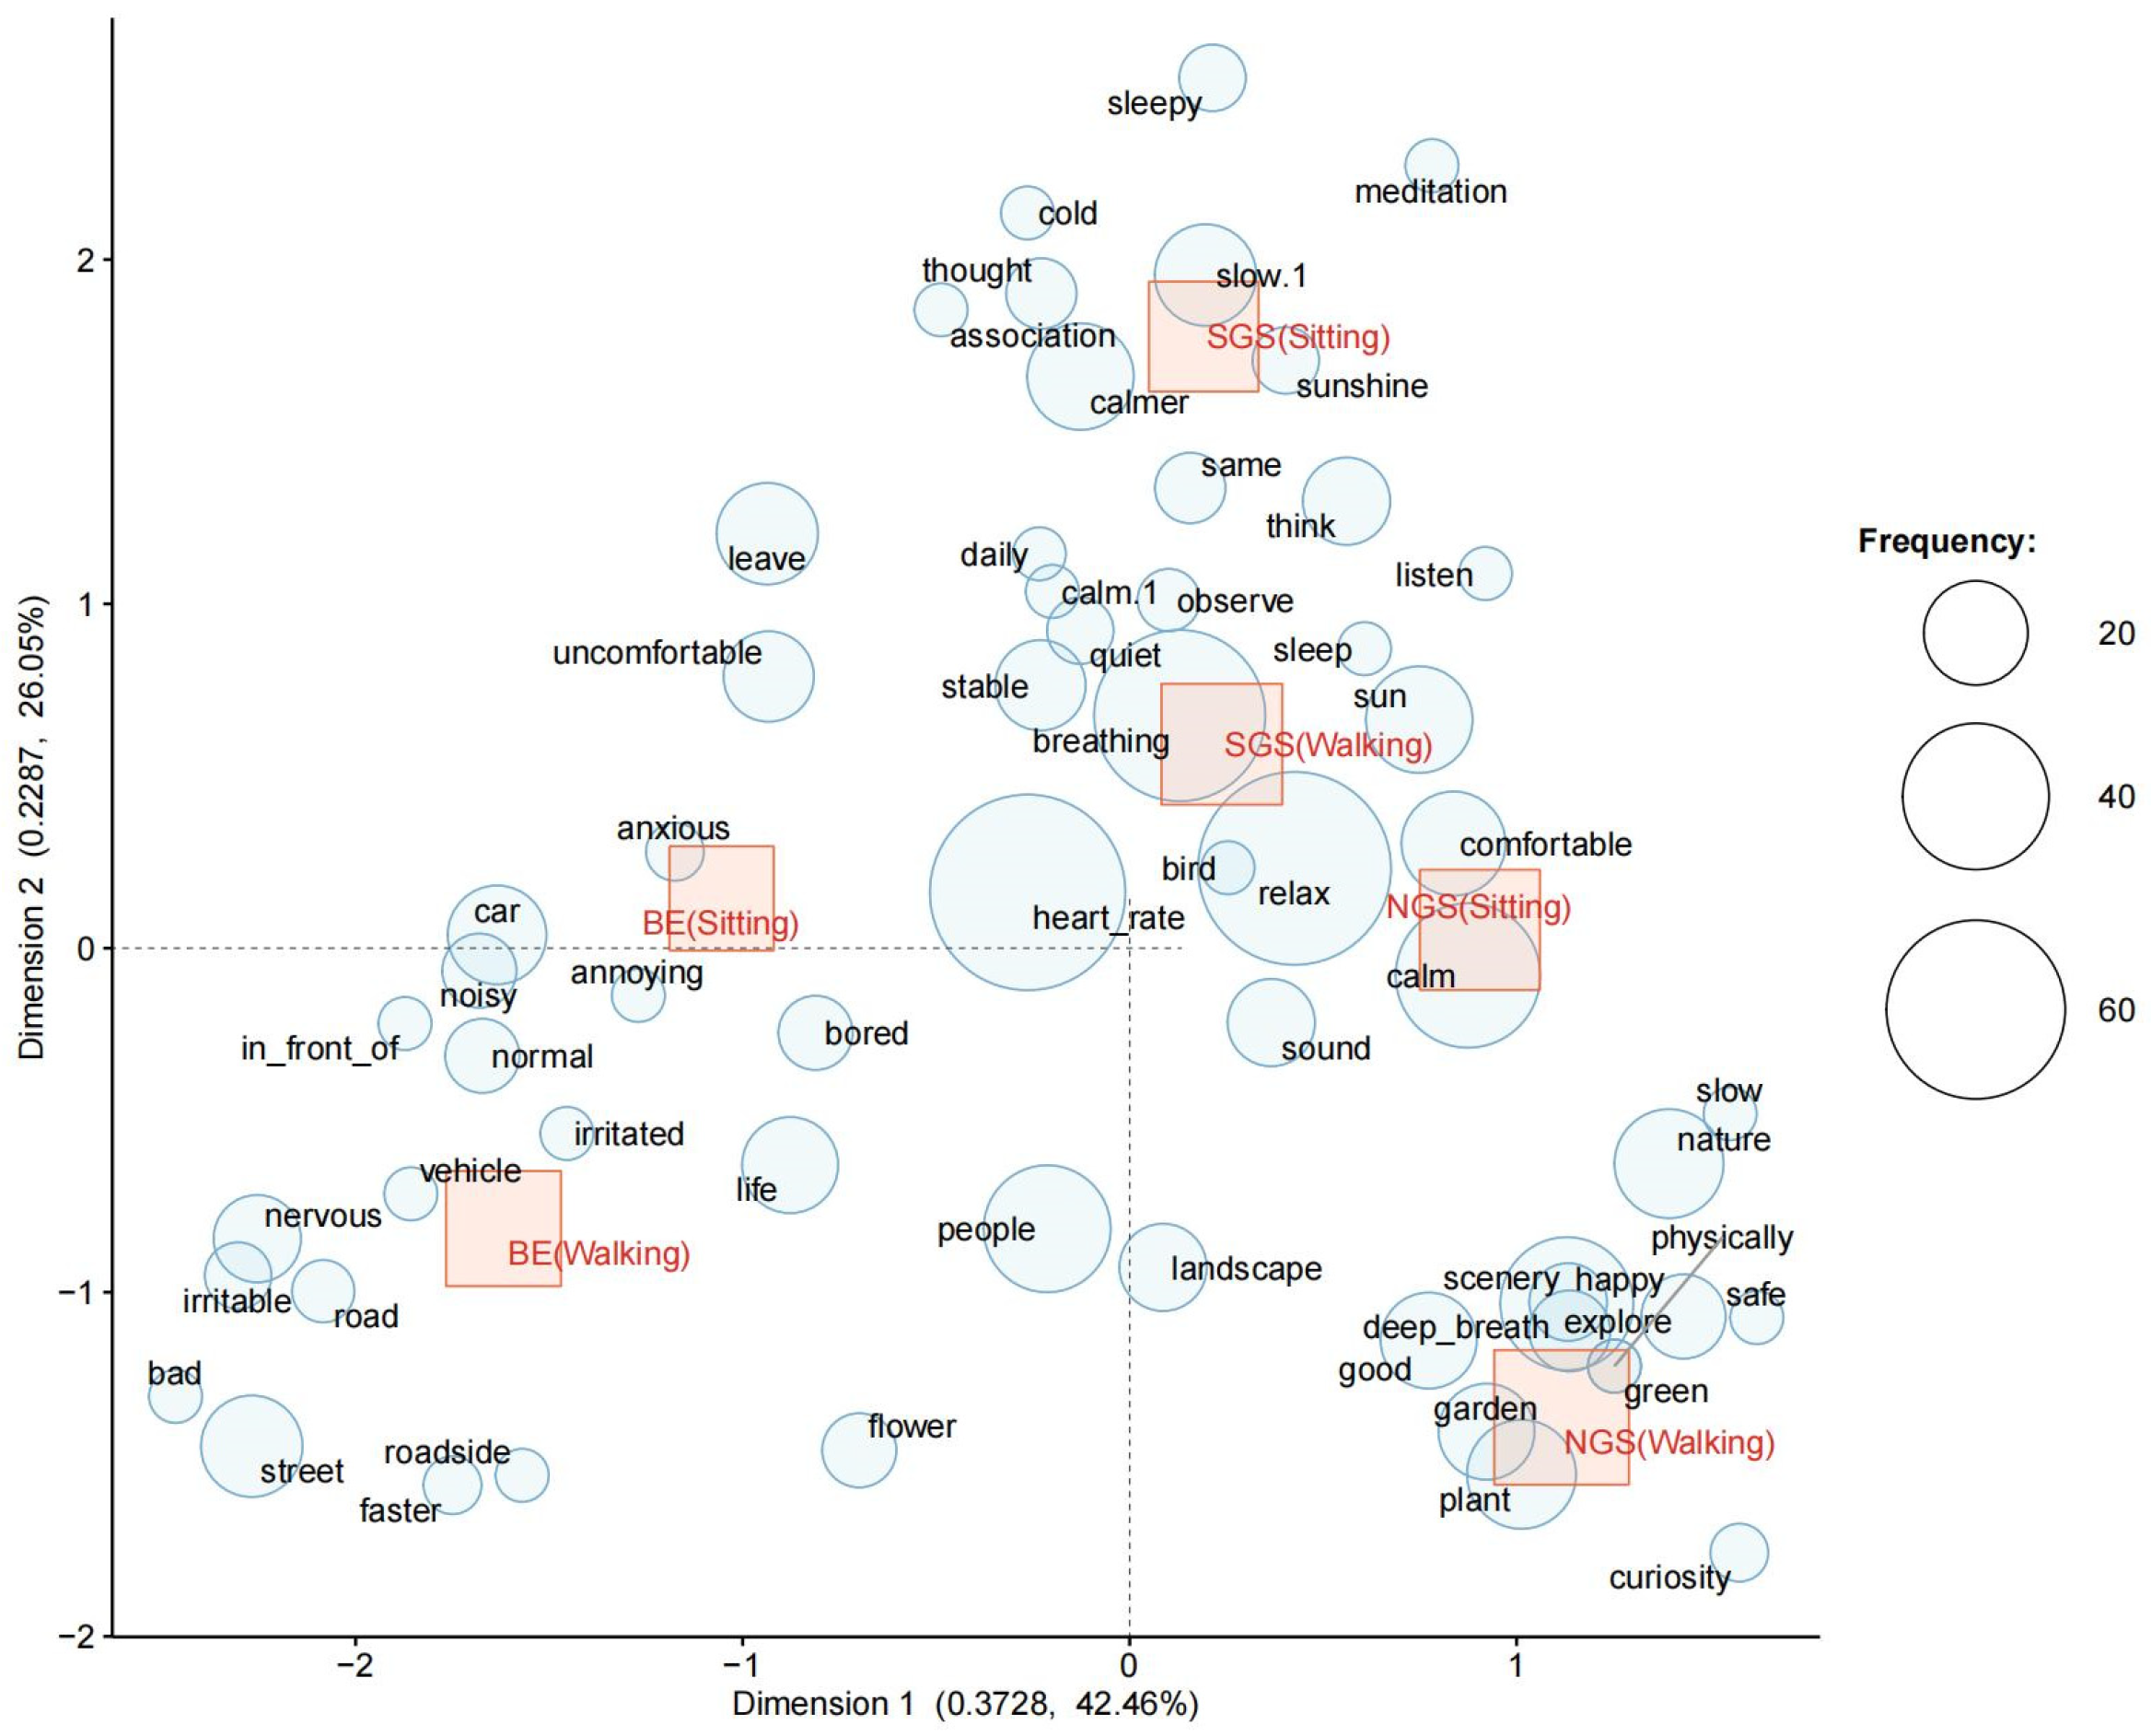
For the participants’ self-reported psychological experiences in different places and intervention modes, we applied a correspondence analysis and visualised the two key characteristic dimensions from the results. In Figure 9, the circles represent high-frequency words, and the squares represent places and intervention modes. Their positions and directions indicate the similarities or differences between objects, and the quadrants show the classification of objects across different dimensions. The percentage for each dimension reflects its importance in explaining the total variance in the data (Dimension 1 accounts for 42.46%, and Dimension 2 accounts for 26.05%). Consistent with the previous analysis, the mental restorative effects in the BE and NGS differed significantly, with the SGS falling between the two. In the BE, both sitting and walking are closely associated with negative emotion words such as ‘irritated’, ‘nervous’, ‘bored’, ‘annoying’, ‘noisy’, and ‘irritable’. In the SGS, both sitting and walking are linked with words like ‘calmer’, ‘quiet’, ‘sleepy’, and ‘stable’, reflecting the comfortable psychological state provided by this environment. Additionally, words like ‘meditation’, ’thought’, ‘think’, ‘association’, and ‘daily’ suggest that participants in the SGS can escape daily worries, immerse themselves in the green space, and engage in deep reflection, although they may also feel ‘cold’ while sitting. In the NGS, both sitting and walking are associated with words such as ‘relax’, ‘calm’, ‘comfortable’, ‘safe’, ‘deep breath’, ‘good’, ‘happy’, and ‘curiosity’, indicating that the NGS fosters positive emotions and provides effective psychological restoration.
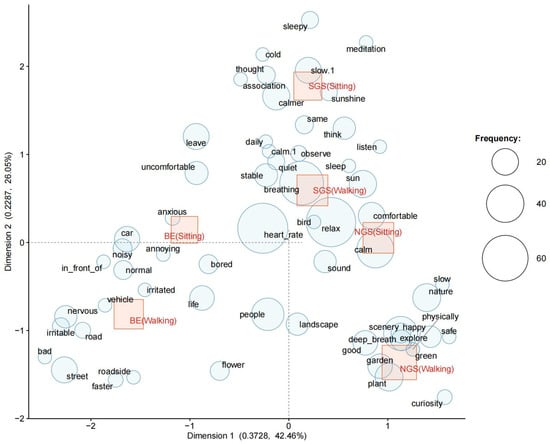
Figure 9.
Text correspondence analysis among different sensory and intervention mode in three different sites. Note: BE = built environment; SGS = semi-natural green space; NGS = natural green space.
3.3. Sensory Experiences as Predictors of Psychological Restoration
To further investigate the sensory factors that significantly impact psychological restoration, we treated 12 sensory factors (vision perception, vision quality, vision variety, hearing perception, hearing quality, hearing variety, smell perception, smell quality, smell diversity, tactile perception, tactile quality, and tactile variety) as fixed effects variables, and the results from three psychological scales (ROS, SVS, and the four dimensions of PRS) as dependent variables, to construct a linear mixed effects model. The fixed effects were selected based on a stepwise model simplification using multiple linear regression analysis. The final fixed effects, along with place and intervention type as random effects, were included in the model. The best-fitting model was selected based on the Akaike Information Criterion (Table 7). The residuals of the final model followed a normal distribution, with no significant autocorrelation, and all Variance Inflation Factor values were below 5.
Table 7.
Linear mixed effects models of sensory factors with ROS, SVS, and PRS outcomes.
Table 7 indicates that ROS scores are significantly associated with hearing quality, vision quality, smell quality, hearing perception, and vision perception, with hearing quality, vision quality, and hearing perception playing a particularly crucial role. For the SVS scale, smell quality, tactile perception, and hearing variety were statistically significant. Furthermore, analysis of the PRS revealed that vision perception, vision quality, hearing perception, and hearing quality were essential for Being away. Extent was significantly influenced by vision quality, vision variety, tactile variety, and hearing quality. Fascination was significantly affected by tactile quality, smell perception, vision variety, and vision quality, and, to some extent, by smell quality. Compatibility was significantly affected by vision quality, hearing quality, tactile variety, and vision perception. Additionally, place was included as a random effect in the four models related to the PRS to account for data variations not explained by fixed effects.
4. Discussion
4.1. Sensory Experiences and Psychological Restoration Effects across Different Places and Intervention Modes
Previous studies have consistently demonstrated that in urban spaces, green areas with a higher presence of natural elements exhibit stronger restorative effects, whereas green spaces dominated by built elements tend to have weaker restorative effects [67,68,69]. Even within restorative environments, the positive effects can vary depending on the specific environmental setting [5]. The findings of this study support this perspective. In all the psychological scales (ROS, SVS, PRS), the NGS with abundant vegetation, wildlife, water features, and varied topography scored the highest. These were followed by the SGS that are surrounded by urban roads and buildings and feature lawns and limited vegetation. By contrast, grey spaces (the BE), characterised by an abundance of artificial elements and minimal front-yard greenery, showed the lowest restorative effects and may even have had negative impacts.
This study also found that different types of urban spaces resulted in significantly different sensory experiences. The overall evaluations of vision, hearing, smell, and tactile sensation, as well as the scores for each sense on the dimensions of perception, quality, and variety, generally aligned with the order of psychological restoration effects, namely, NGS > SGS > BE.
However, in terms of vision experience, the difference between the BE and SGS was not significant. Further analysis of specific indicators revealed that while the BE showed higher vision variety, its vision quality was lower than that of the SGS. The BE, represented by the street, includes a variety of visual information. For example, in the first open-ended question, many participants visually focused on buildings, shops, and entry doors along the street, with these elements providing readable text and increasing colour richness. However, such complex and diverse visual elements do not necessarily contribute to a sense of pleasure. Vehicles, traffic signs, and other elements often detract from the aesthetic appeal of a landscape [43]. Moreover, the results of hearing perception indicate that the ranking of the three urban spaces (SGS > NGS > BE) was the exact opposite of the decibel levels recorded by the researcher (BE > NGS > SGS), suggesting that, in urban environments within the 40–70 dB range, people’s attention to sound is not determined by objective loudness [70]. To some extent, people become accustomed to certain noises in a street environment and ignore them [71,72,73,74,75], although some of the participants still noted the disruptive nature of traffic and construction noises. Combined with psychological restoration outcomes (Table 3 and Table 4 and Figure 5c), the ROS scores in the BE significantly decreased after entering, and the Fascination score in the BE was much lower than that in the other two spaces. This indicates that individuals in the BE still experienced high levels of stress and were unable to achieve a state of relaxation, comfort, and clear, rational thinking. The findings also suggest that the BE lacked attractiveness and failed to capture individuals’ attention naturally. Consequently, the BE led to residents being unable to immerse themselves in their surroundings, with diminished and fragmented attention, making it easier to overlook sounds in the environment. According to the text analysis results (Figure 6), in the two green spaces, positively rated sounds, such as birdsong, talking, wind, and water, attracted attention. In the SGS, vehicle and construction noises that disrupted these natural and harmonious sounds also received attention. Combining the evaluations of sensory perception and variety with the text analysis results (Figure 5a,c and Figure 6), we found that the sensory experiences in the BE and SGS were primarily based on vision and hearing stimuli, whereas the NGS offered significantly richer tactile and smell experiences than the other two places. This multi-sensory experience enhances the sense of immersion and contributes to psychological restoration [76]. This was also reflected in the Extent scores during activities in the NGS, which are much higher than those in the BE and even higher than those in the SGS. This suggests that urban spaces closer to nature can provide sufficient opportunities for exploration and good coherence and connectivity among environmental elements, allowing people to become immersed in the setting and lose track of time [77]. By contrast, small green spaces or entirely artificial environments segmented by man-made elements have limitations in providing consistency and a sense of security.
Unlike the impact of space type, the main effects of intervention modes on sensory experience were not significant. Hearing experiences across the three spaces remained largely consistent regardless of intervention mode. This can be attributed to the three-dimensional nature of sound, which can propagate widely through space [78], meaning that environmental sounds can be heard by individuals even at a considerable distance from the source. Additionally, as environmental sounds such as traffic, wind, water, and talking are persistent [79], and participants in this study were only required to stay briefly at the three experimental sites, they may have been exposed to similar auditory inputs within that short time frame, thereby reducing the impact of the intervention mode on the hearing experience. In terms of tactile experience, walking was found to be better than sitting. This is because sitting limits the range of physical activity and narrows the field of vision, thus reducing the level of interaction with the environment and significantly decreasing the number of objects that can be touched or that evoke a desire to touch [80]. Correspondingly, in terms of psychological restoration effects, Extent of the PRS, which assesses whether the environment provides sufficient scope and depth, was also influenced by similar factors; scores were higher during walking than sitting across all spatial types. Sitting restricted the participants’ interactions with the environment through close-range senses (tactile), leading to lower evaluations of the expansiveness and coherence of the space. Moreover, while walking, people are more likely to observe stationary objects, whereas sitting in one corner of a site allows for an expanded field of view, making it easier to observe dynamic moments. This phenomenon is related to human visual attention and perception mechanisms; during movement, the visual system reduces its sensitivity to dynamic backgrounds to minimise distractions, allowing for a greater focus on obstacles in the path. When sitting, with the body requiring little movement, the visual system is less burdened and can allocate attention more freely, thus providing it more resources to process dynamic information in the surrounding environment [81,82]. Additionally, frequent movements of the head and eyes during walking can make it more difficult for the visual system to capture fast-moving objects, whereas while sitting, the stability of the viewpoint makes it easier for the visual system to detect subtle movements, enhancing the perception of dynamic events [83].
4.2. The Mechanism by Which Sensory Experiences in Space Influence Psychological Restoration
This study confirmed that different types of urban spaces stimulate people’s senses, leading to diverse environmental experiences that can have varying positive or negative impacts on psychological restoration.
The results indicated that sensory quality was positively correlated with various psychological assessment metrics, whereas perception and variety exhibited uncertainty. This suggests that sensory experiences of the environment are not necessarily better when they are clearer or more diverse. According to Table 7, vision perception primarily affects the ROS and Being away and Compatibility of the PRS, and it does so negatively. This implies that the stronger and more attention-grabbing the visual stimuli in the environment, the more difficult it is for people to relax, leading to increased mental clutter. Additionally, such environments are less effective in helping individuals forget their daily worries and satisfy their personal needs, ultimately hindering psychological restoration. This finding is consistent with the results reported by Yakinlar and Akpinar [84]. Based on Figure 5a and Table 4 and Table 6, it can be inferred that in spaces such as the BE (represented by streets) and SGS (represented by community gardens), visual distractions from negative artificial elements (e.g., vehicles, streets, construction, and buildings) make it challenging for people to establish a pleasant and natural connection. Moreover, Fascination of the PRS is negatively influenced by smell perception and vision variety. This may be because strong odours and complex landscape features can cause stress and distract attention, making it difficult for individuals to focus on their current environment [84,85]. However, the findings of this study differ from those of Li et al., who found that combinations of multiple visual elements offer better restorative benefits than single elements [50]. Therefore, further research is needed, such as conducting separate experiments for each metric, controlling variables, and setting up multi-gradient comparisons, to better understand how ‘smell perception’ and ‘vision variety’ influence perceived restoration, stress levels, and psychological health.
Table 7 shows that compared to other senses, vision and hearing play a primary role in the scores of various psychological indicators, with vision quality being a key positive predictor of stress recovery and attention restoration. This finding is consistent with numerous studies [47,50,52]. Research indicates that 85% of human environmental perception is derived from visual input, while 10% comes from hearing input [31]. This underscores the crucial role of vision and hearing in processing external information, as changes in environmental cues perceived through these senses can significantly influence an individual’s psychological state. This is also why the perception and quality of vision and hearing are important predictors of Being away in the PRS. Indicators of psychological restoration other than Being away are influenced by multiple sensory patterns. This aligns with the findings of Hedblom et al. in their multi-sensory experience experiments in virtual natural environments [53] and Tate Sensorium [86] in a virtual environment and the research conclusions of Yildirim et al. in workplace settings [87]. These studies suggest that a multi-sensory experience plays a significant role in mental health, and that adding sound, taste, tactility, and smell to visual stimuli can help reduce stress, improve mood, and enhance overall well-being. SVS scores are mainly influenced by sensory inputs other than vision, further reinforcing the importance of multi-sensory integration. This also highlights the necessity of considering non-visual factors in future urban planning and design [88].
4.3. Research Significance and Action Implications
This study explored the role of sensory experiences in the environment as a crucial component of its psychological restorative functions, highlighting its significant research value.
Theoretically, this study analysed sensory experiences through the dimensions of perception, quality, and variety and proposed sensory indicators and their effects on stress reduction, vitality restoration, and attention recovery, thereby filling a gap in the existing literature.
Practically, first, the findings suggest that future urban planning and design should prioritize the creation of different spaces that adapt to different intervention modes and consider human visual attention and perception mechanisms when arranging pathways and seating areas [81,82,83], catering to the visual habits of individuals in urban spaces, such as focusing on stationary and immediate objects while walking and having an expanded field of view to capture dynamic moments when sitting. This includes designing smooth, coherent path systems for walkers, incorporating multi-sensory experiences at key points, and providing open views and dynamic visual elements in seating areas to enhance sensory experiences and psychological restoration. Second, this study advises urban planners and landscape designers to avoid overcrowding spaces with excessive design elements, because, based on this research, rich but low-quality landscapes are not necessarily pleasant and low-quality landscape design elements are often closely related to artificial elements (e.g., vehicles, streets, construction, and buildings, as well as vehicle and construction noises). Therefore, planners and designers should appropriately incorporate artificial elements into natural elements to decrease and balance the negative impact of artificial features through strategic layout, the use of sound barriers, or natural barriers (e.g., hedges, vegetation strips), even improving the perceived quality by increasing the rate of visual greenery in urban spaces with a high proportion of artificial elements. These approaches foster a more comfortable and harmonious connection between individuals and their environments. Third, future designs should place greater emphasis on the importance of multi-sensory experiences, especially smell and tactile experiences, which can be achieved through the introduction of aromatic plants and the creation of a varied tactile environment (e.g., diverse paving materials), thus enhancing the immersion and psychological recovery effect of the space.
Socially, this study’s findings provide specific recommendations for urban and landscape planners, aiding in the practical enhancement of the health benefits of urban spaces, improving residents’ quality of life, and increasing their happiness and satisfaction. These improvements could contribute to reducing suicide rates [89], increasing community cohesion [4], lowering crime rates [90], and promoting sustainable social development.
4.4. Limitations
This study has several limitations that should be addressed in future research. First, it focused only on visual, auditory, olfactory, and tactile experiences in the environment, without considering the potential value of gustatory perception. Although gustatory input plays a minor role in human sensory perception and is rarely utilised in landscape studies [44], it is important to acknowledge that activities and food culture are often integral to spatial experiences, and taste can contribute to feelings of pleasure and relaxation [91]. Second, the effect of exposure time on psychological restoration requires further investigation. Ann et al. found that spending more than 15 min in a natural environment significantly enhances vitality [92]. Therefore, future studies should explore whether longer periods of activity or sitting result in different psychological restoration outcomes. Third, this study’s sample size was limited, which may restrict the generalisability of its findings to a broader target population. Although we attempted to control for factors such as gender, age, and occupation when recruiting participants, this study was limited to a sample of university students, which constrains the applicability of the conclusions. Fourth, owing to cost and time constraints, this study selected only portions of urban streets, community gardens, and botanical gardens to represent the BE, SGS, and NGS urban space types, respectively. This selection may have introduced some bias. Future research should include experiments in additional green spaces within these three urban space types to supplement the current findings. Finally, beyond clarifying the differences in sensory experiences and psychological restoration across different urban environments and identifying the types and dimensions of sensory experiences that influence the effectiveness of spatial psychological restoration, future research should also aim to quantify the dimensional parameters of various sensory experiences through further experiments. This would provide valuable references for landscape design and planning.
5. Conclusions
Urban green spaces are a crucial component of green infrastructure in cities, significantly affecting the urban ecological environment and psychological health of residents. The development of different types of urban spaces is a key focus for urban planners and policymakers. This study adopted a multi-sensory perspective to examine sensory experience characteristics, restorative benefits, and their interrelationships in an urban BE, SGS, and NGS, providing valuable recommendations for urban green space development. In terms of sensory experiences and psychological restorative functions, the NGS, which is characterised by high vegetation coverage and the dense presence of natural elements, demonstrated stronger restorative effects, followed by the SGS. This study also drew on the strengths and limitations of the existing literature by conducting a more detailed analysis of each sensory modality using the indicators of perception, quality, and variety. This revealed the potential connections between sensory experiences and psychological health restoration, offering new insights into how sensory landscapes can be more precisely utilised to create effective urban healing spaces. Multi-sensory experiences in urban spaces are a promising area for further research. The roles of different sensory dimensions across various space types and population groups should be explored through additional experiments to obtain quantitative metrics. Additionally, future studies should incorporate objective physiological indicators (e.g., blood pressure, oxygen levels, skin conductance, and cortisol levels) for more in-depth mechanistic research, thereby supporting future planning and design efforts.
Author Contributions
Conceptualisation, S.Q. and R.M.; methodology, S.Q. and R.M.; software, S.Q.; formal analysis, S.Q.; investigation, S.Q.; data curation, S.Q.; writing—original draft preparation, S.Q.; writing—review and editing, R.M.; visualisation, S.Q.; supervision, R.M.; project administration, S.Q. All authors have read and agreed to the published version of the manuscript.
Funding
This research received no external funding.
Data Availability Statement
Data are contained within the article.
Acknowledgments
We thank all the reviewers for their valuable comments on this paper.
Conflicts of Interest
The authors declare no conflicts of interest.
Appendix A
Table A1.
Comparison of the environmental factors of the three environmental sites (M ± SD).
Table A1.
Comparison of the environmental factors of the three environmental sites (M ± SD).
| Parameter | Built Environment | Semi-Natural Green Space | Natural Green Space |
|---|---|---|---|
| Temperature (℃) | 16.45 (±2.27) | 15.91 (±2.18) | 17.11 (±1.81) |
| Humidity (%) | 73.27 (±12.15) | 75.64 (±11.40) | 71.18 (±10.99) |
| Absolute illumination (lx) | 28779 (±14982) | 24275 (±14822) | 35210 (±7018) |
| Noise (dB) | 59.68 (±6.23) | 50.15 (±8.77) | 51.80 (±11.15) |
References
- Callaghan, A.; McCombe, G.; Harrold, A.; McMeel, C.; Mills, G.; Moore-Cherry, N.; Cullen, W. The impact of green spaces on mental health in urban settings: A scoping review. J. Ment. Health 2020, 30, 179–193. [Google Scholar] [CrossRef]
- Wang, Z.; Zhang, C. Review on the Relationship between High-density Built Environment and Public Health. South Archit. 2023, 6, 21–31. [Google Scholar]
- Li, M.; Ye, C. Threshold standard and global distribution of high-density cities. World Reg. Stud. 2015, 24, 38–45. [Google Scholar]
- Jiang, B. Urban Natural Landscape and Citizens’ Mental Health: Key Issues. Landsc. Archit. 2020, 27, 17–23. [Google Scholar]
- Luo, S.; Xie, J.; Wang, H.; Wang, Q.; Chen, J.; Yang, Z.; Furuya, K. Natural dose of blue restoration: A field experiment on mental restoration of urban blue spaces. Land 2023, 12, 1834. [Google Scholar] [CrossRef]
- Ventriglio, A.; Bellomo, A.; di Gioia, I.; Di Sabatino, D.; Favale, D.; De Berardis, D.; Cianconi, P. Environmental pollution and mental health: A narrative review of literature. CNS Spectr. 2021, 26, 51–61. [Google Scholar] [CrossRef] [PubMed]
- Lopez, R.P.; Hynes, H.P. Obesity, physical activity, and the urban environment: Public health research needs. Environ. Health 2006, 5, 25. [Google Scholar] [CrossRef]
- Gao, Y. Research on the Impact Mechanism and Pathway of Urban Ecological Environment on Diseases. Environ. Dev. 2023, 5, 47–50. [Google Scholar]
- Li, Z.; He, Z.; Zhang, Y.; Jin, S.; Wang, X.; Zhu, J.; Liu, S. Impact of greenspace exposure on residents’ mental health: A case study of Nanjing City. Prog. Geogr. 2020, 39, 779–791. [Google Scholar] [CrossRef]
- Guite, H.F.; Clark, C.; Ackrill, G. The impact of the physical and urban environment on mental well-being. Public Health 2006, 120, 1117–1126. [Google Scholar] [CrossRef]
- Liu, Y.; He, J.; Wang, R.; Li, Z. The Impact of Urban Green Space on Mental Well-being: Research Progress and Recommendations. Trop. Geogr. 2023, 43, 1747–1759. [Google Scholar]
- Kabisch, N.; Qureshi, S.; Haase, D. Human-environment interactions in urban green spaces—A systematic review of contemporary issues and prospects for future research. Environ. Impact Assess. Rev. 2015, 50, 25–34. [Google Scholar] [CrossRef]
- Berman, M.G.; Jonides, J.; Kaplan, S. The cognitive benefits of interacting with nature. Psychol. Sci. 2008, 19, 1207–1212. [Google Scholar] [CrossRef] [PubMed]
- White, M.P.; Alcock, I.; Wheeler, B.W.; Depledge, M.H. Would you be happier living in a greener urban area? A fixed-effects analysis of panel data. Psychol. Sci. 2013, 24, 920–928. [Google Scholar] [CrossRef] [PubMed]
- Völker, S.; Kistemann, T. Developing the urban blue: Comparative health responses to blue and green urban open spaces in Germany. Health Place 2015, 35, 196–205. [Google Scholar] [CrossRef]
- Math, S.B.; Nirmala, M.C.; Moirangthem, S.; Kumar, N.C. Disaster management: Mental health perspective. Indian J. Psychol. Med. 2015, 37, 261–271. [Google Scholar] [CrossRef]
- Pratiwi, P.I.; Xiang, Q.; Furuya, K. Physiological and psychological effects of walking in urban parks and its imagery in different seasons in middle-aged and older adults: Evidence from Matsudo City, Japan. Sustainability 2020, 12, 4003. [Google Scholar] [CrossRef]
- Yuen, H.K.; Jenkins, G.R. Factors associated with changes in subjective well-being immediately after urban park visit. Int. J. Environ. Health Res. 2020, 30, 134–145. [Google Scholar] [CrossRef]
- Wang, J. Healing landscape design based on five-sense experience. Mod. Hortic. 2023, 14, 93–98. [Google Scholar]
- Vujcic Trkulja, M.; Tomicevic-Dubljevic, J.; Tosevski, D.L.; Vukovic, O.; Toskovic, O. Development of evidence-based rehabilitation practice in botanical garden for people with mental health disorders. Health Environ. Res. Des. J. 2021, 14, 242–257. [Google Scholar] [CrossRef]
- Liu, Y.; Zhang, J.; Liu, C.; Yang, Y. A review of attention restoration theory: Implications for designing restorative environments. Sustainability 2024, 16, 3639. [Google Scholar] [CrossRef]
- Ulrich, R.S. Stress reduction theory. In 100 Key Concepts in Environmental Psychology; Routledge: New York, NY, USA, 2024; pp. 143–146. [Google Scholar]
- Zhao, J.; Xu, W.; Ye, L. Effects of auditory-visual combinations on perceived restorative potential of urban green space. Appl. Acoust. 2018, 141, 169–177. [Google Scholar] [CrossRef]
- Xin, Y.; Lu, W.; Sun, P. Research and Prospect of Green Space from the Perspective of Public Mental Health. Landsc. Archit. 2022, 29, 79–85. [Google Scholar]
- Shu, X.; Shen, X.; Zhou, X.; Hao, P. Research on Strategies and Determinants of Nature Education Environment Design Based on Landscape Perception Theory. Landsc. Archit. 2019, 26, 48–53. [Google Scholar]
- Xiaolai, Z.; Bin, J. Cultivation of Grit: A Type of Nature Education for Urban Preschool Children. Landsc. Archit. 2019, 26, 40–47. [Google Scholar]
- Spence, C.; Ho, C. Multisensory interface design for drivers: Past, present and future. Ergonomics 2008, 51, 65–70. [Google Scholar] [CrossRef]
- Foucault, M. A History of Insanity in the Age of Reason; Routledge: London, UK, 2001. [Google Scholar]
- Van Renterghem, T.; Vanhecke, K.; Filipan, K.; Sun, K.; De Pessemier, T.; De Coensel, B.; Botteldooren, D. Interactive soundscape augmentation by natural sounds in a noise polluted urban park. Landsc. Urban Plan. 2020, 194, 103705. [Google Scholar] [CrossRef]
- Li, F.; Shao, J. Research on the application of five-sense design in therapeutic landscapes. Green 2023, 21, 67–69. [Google Scholar]
- Xue, J.; Xia, H. Application of Five-Sense Design in Landscape Design. Shaanxi J. Agric. Sci. 2021, 8, 97–99. [Google Scholar]
- Samarrai, F. Sense of Taste: Psychology Professor Examines Taste System. U. Va. News. 20 February 2015. Available online: https://news.virginia.edu/content/sense-taste-psychology-professor-examines-taste-system (accessed on 6 August 2024).
- Okayama, T.; Watanabe, H. Association between taste perception, nutrient intake, and mental health in young Japanese women. Nutr. Res. Pract. 2019, 13, 41–46. [Google Scholar] [CrossRef]
- Chen, K.; Zhang, T.; Liu, F.; Zhang, Y.; Song, Y. How does urban green space impact residents’ mental health: A literature review of mediators. Int. J. Environ. Res. Public Health 2021, 18, 11746. [Google Scholar] [CrossRef] [PubMed]
- Yuan, M.; Yan, M.; Shan, Z. Is compact urban form good for air quality? A case study from China based on hourly smartphone data. Land 2021, 10, 504. [Google Scholar] [CrossRef]
- Dzhambov, A.M.; Dimitrova, D.D. Urban green spaces’ effectiveness as a psychological buffer for the negative health impact of noise pollution: A systematic review. Noise Health 2014, 16, 157–165. [Google Scholar] [CrossRef] [PubMed]
- Ma, B.; Hauer, R.J.; Xu, C.; Li, W. Visualizing evaluation model of human perceptions and characteristic indicators of landscape visual quality in urban green spaces by using nomograms. Urban For. Urban Green. 2021, 65, 127314. [Google Scholar] [CrossRef]
- Song, C.; Cao, S.; Luo, H.; Huang, Y.; Jiang, S.; Guo, B.; Li, X. Effects of simulated multi-sensory stimulation integration on physiological and psychological restoration in virtual urban green space environment. Front. Psychol. 2024, 15, 1382143. [Google Scholar] [CrossRef]
- Mao, N.; Zhou, L. Design analysis of Kenya Hara’s works from the perspective of design psychology. Art Res. 2023, 5, 76–78. [Google Scholar]
- Yang, X.; Song, Y. Design Psychology; National University of Defense Technology Press: Changsha, China, 2005. [Google Scholar]
- Krisantia, I.; Faris, S.; Sazwani, S. Visual therapy through the application of plants and design elements in landscape. IOP Conf. Ser. Earth Environ. Sci. 2021, 737, 012008. [Google Scholar] [CrossRef]
- Gao, Y.; Zhang, T.; Zhang, W.; Meng, H.; Zhang, Z. Research on visual behavior characteristics and cognitive evaluation of different types of forest landscape spaces. Urban For. Urban Green. 2020, 54, 126788. [Google Scholar] [CrossRef]
- Qi, Z.; Duan, J.; Su, H.; Fan, Z.; Lan, W. Using crowdsourcing images to assess visual quality of urban landscapes: A case study of Xiamen Island. Ecol. Indic. 2023, 154, 110793. [Google Scholar] [CrossRef]
- Xi, L.; Qiu, E.; Zhang, Z.; Zhang, C.; Cao, L. Current Situation and Trend Analysis of International and National Five Sense Landscapes Research. World For. Res. 2020, 33, 31–36. [Google Scholar]
- Cui, Z.; Lyu, Y.; Yang, X. Analysis on the gradient evolution of soundscape between urban and rural areas in Nanjing Metropolitan area. J. Nanjing For. Univ. (Nat. Sci. Ed.) 2023, 47, 199–206. [Google Scholar]
- Liu, Y.; Zhao, B. Research on the characteristics of soundscape preference of forest tourists in China. Tech. Acoust. 2019, 38, 657–664. [Google Scholar]
- Liu, Y.; Hu, M.; Zhao, B. Knowledge map analysis of English references in soundscape research based on CiteSpace software. Tech. Acoust. 2020, 39, 468–474. [Google Scholar]
- Bulkin, D.A.; Groh, J.M. Seeing sounds: Visual and auditory interactions in the brain. Curr. Opin. Neurobiol. 2006, 16, 415–419. [Google Scholar] [CrossRef] [PubMed]
- Till, K.E. Artistic and activist memory-work: Approaching place-based practice. Mem. Stud. 2008, 1, 99–113. [Google Scholar] [CrossRef]
- Deng, L.; Luo, H.; Ma, J.; Huang, Z.; Sun, L.X.; Jiang, M.Y.; Li, X. Effects of integration between visual stimuli and auditory stimuli on restorative potential and aesthetic preference in urban green spaces. Urban For. Urban Green. 2020, 53, 126702. [Google Scholar] [CrossRef]
- Franco, L.S.; Shanahan, D.F.; Fuller, R.A. A review of the benefits of nature experiences: More than meets the eye. Int. J. Environ. Res. Public Health 2017, 14, 864. [Google Scholar] [CrossRef]
- Xu, J.; Chen, L.; Liu, T.; Wang, T.; Li, M.; Wu, Z. Multi-sensory experience and preferences for children in an urban forest park: A case study of Maofeng Mountain Forest Park in Guangzhou, China. Forests 2022, 13, 1435. [Google Scholar] [CrossRef]
- Hedblom, M.; Gunnarsson, B.; Iravani, B.; Knez, I.; Schaefer, M.; Thorsson, P.; Lundström, J.N. Reduction of physiological stress by urban green space in a multi-sensory virtual experiment. Sci. Rep. 2019, 9, 10113. [Google Scholar] [CrossRef]
- Liu, Y.; Liu, J.; Fan, X.; Hu, Y.; Guo, H.; Xue, F. Perceived birdsong diversity and restorativeness effect of soundscape: Interventions of birdsong audio and messaging. Biodivers. Sci. 2024, 32, 23230. [Google Scholar] [CrossRef]
- Markevych, I.; Schoierer, J.; Hartig, T.; Chudnovsky, A.; Hystad, P.; Dzhambov, A.M.; Fuertes, E. Exploring pathways linking greenspace to health: Theoretical and methodological guidance. Environ. Res. 2017, 158, 301–317. [Google Scholar] [CrossRef] [PubMed]
- Macháč, J.; Brabec, J.; Arnberger, A. Exploring public preferences and preference heterogeneity for green and blue infrastructure in urban green spaces. Urban For. Urban Green. 2022, 75, 127695. [Google Scholar] [CrossRef]
- Coventry, P.A.; Neale, C.; Dyke, A.; Pateman, R.; Cinderby, S. The mental health benefits of purposeful activities in public green spaces in urban and semi-urban neighbourhoods: A mixed-methods pilot and proof of concept study. Int. J. Environ. Res. Public Health 2019, 16, 2712. [Google Scholar] [CrossRef] [PubMed]
- Bielinis, E.; Takayama, N.; Boiko, S.; Omelan, A.; Bielinis, L. The effect of winter forest bathing on psychological relaxation of young Polish adults. Urban For. Urban Green. 2018, 29, 276–283. [Google Scholar] [CrossRef]
- Xie, J.; Liu, B. Study on the Influence of Urban Roadside Trees Canopy on Mental Health of Different Age Groups. In Proceedings of the 2nd Symposium on Health and Education 2019 (SOHE 2019), Suzhou, China, 25–26 May 2019; Atlantis Press: Amsterdam, The Netherland, 2019; pp. 136–146. [Google Scholar]
- Bostic, T.J.; McGartland Rubio, D.; Hood, M. A validation of the subjective vitality scale using structural equation modeling. Soc. Indic. Res. 2000, 52, 313–324. [Google Scholar] [CrossRef]
- Song, H.; Fu, M.; Yang, S. Vitality: A Long Lasting Issue. Adv. Psychol. Sci. 2015, 23, 1668. [Google Scholar] [CrossRef]
- Hartig, T.; Kaiser, F.G.; Bowler, P.A. Further Development of a Measure of Perceived Environmental Restorativeness; Institutet för Bostads-Och Urbanforskning: Uppsala, Sweden, 1997. [Google Scholar]
- Wang, X.; Wu, C.; Yan, J. Experimental study of the perceived restorative scale (PRS) in Chinese by evaluating the restorative qualities of urban park scenes. Chin. Landsc. Archit. 2019, 35, 4. [Google Scholar]
- Celikors, E.; Wells, N.M. Are low-level visual features of scenes associated with perceived restorative qualities? J. Environ. Psychol. 2022, 81, 101800. [Google Scholar] [CrossRef]
- Stoltz, J.; Grahn, P. Perceived sensory dimensions: Key aesthetic qualities for health-promoting urban green spaces. J. Biomed. Res. 2021, 2, 22–29. [Google Scholar]
- Zhang, Q.; Hu, Y.; Li, D. Research on Soundscape of Tianjin Water Park Based on Soundwalks. Chin. Landsc. Archit. 2019, 35, 48. [Google Scholar]
- Carrus, G.; Lafortezza, R.; Colangelo, G.; Dentamaro, I.; Scopelliti, M.; Sanesi, G. Relations between naturalness and perceived restorativeness of different urban green spaces. Psyecology 2013, 4, 227–244. [Google Scholar] [CrossRef]
- Sun, Q.; Cheng, H.; Liu, Y. Exposure to Positive and Negative Nature Affects Cooperative Behavior: The Mediating Role of Cooperative Expectations. Chin. J. Appl. Psychol. 2022, 29, 12–19. [Google Scholar]
- Grahn, P.; Stigsdotter, U.K. The relation between perceived sensory dimensions of urban green space and stress restoration. Landsc. Urban Plan. 2010, 94, 264–275. [Google Scholar] [CrossRef]
- Jhanwar, D. Noise pollution: A review. J. Environ. Pollut. Hum. Health 2016, 4, 72–77. [Google Scholar]
- Forster, S.M.; Gowans, S.C.; Case, J.; Maciej, K. An examination of the role of sound in defining the city in the context of Edinburgh. Eur. Acad. Res. 2014, 1, 10. [Google Scholar]
- Tao, Y.; Chai, Y.; Kou, L.; Kwan, M.P. Understanding noise exposure, noise annoyance, and psychological stress: Incorporating individual mobility and the temporality of the exposure-effect relationship. Appl. Geogr. 2020, 125, 102283. [Google Scholar] [CrossRef]
- Recio, A.; Linares, C.; Banegas, J.R.; Díaz, J. Road traffic noise effects on cardiovascular, respiratory, and metabolic health: An integrative model of biological mechanisms. Environ. Res. 2016, 146, 359–370. [Google Scholar] [CrossRef]
- Roswall, N.; Høgh, V.; Envold-Bidstrup, P.; Raaschou-Nielsen, O.; Ketzel, M.; Overvad, K.; Sørensen, M. Residential exposure to traffic noise and health-related quality of life—A population-based study. PLoS ONE 2015, 10, e0120199. [Google Scholar] [CrossRef]
- Stansfeld, S.; Haines, M.; Brown, B. Noise and health in the urban environment. Rev. Environ. Health 2000, 15, 43–82. [Google Scholar] [CrossRef]
- Song, W.Y. Outdoor Event Space Landscape Perception and Its Design Research. Master’s Thesis, Dalian University of Technology, Dalian, China, 2013. [Google Scholar]
- Milliken, S.; Kotzen, B.; Walimbe, S.; Coutts, C.; Beatley, T. Biophilic cities and health. Cities Health 2023, 7, 175–188. [Google Scholar] [CrossRef]
- Feng, J.-H. Perceptual senses and spatial cognition: Methods of language creation and recording. Taiwan Publ. Read. 2021, 110, 74–81. [Google Scholar]
- Farina, A. Soundscape Ecology: Principles, Patterns, Methods and Applications; Springer: Berlin/Heidelberg, Germany, 2013. [Google Scholar]
- De Groot, J.I.M. Environmental Psychology: An Introduction, 2nd ed.; Steg, L., Ed.; John Wiley & Sons: Hoboken, NJ, USA, 2018; pp. 1–448. ISBN 978-1-119-24111-9. [Google Scholar]
- Land, M.F. Eye movements and the control of actions in everyday life. Prog. Retin. Eye Res. 2006, 25, 296–324. [Google Scholar] [CrossRef] [PubMed]
- Carrasco, M. Visual attention: The past 25 years. Vis. Res. 2011, 51, 1484–1525. [Google Scholar] [CrossRef] [PubMed]
- Collewijn, H.; Kowler, E. The significance of microsaccades for vision and oculomotor control. J. Vis. 2008, 8, 20. [Google Scholar] [CrossRef] [PubMed]
- Akpınar, A. How perceived sensory dimensions of urban green spaces are associated with teenagers’ perceived restoration, stress, and mental health? Landsc. Urban Plan. 2021, 214, 104185. [Google Scholar] [CrossRef]
- Memari, S.; Pazhouhanfar, M.; Nourtaghani, A. Relationship between perceived sensory dimensions and stress restoration in care settings. Urban For. Urban Green. 2017, 26, 104–113. [Google Scholar] [CrossRef]
- Pursey, T.; Lomas, D. Tate Sensorium: An experiment in multisensory immersive design. Sens. Soc. 2018, 13, 354–366. [Google Scholar] [CrossRef]
- Yildirim, M.; Globa, A.; Gocer, O.; Brambilla, A. Multi-sensory nature exposure in the workplace: Exploring the restorative benefits of smell experiences. Build. Environ. 2024, 262, 111841. [Google Scholar] [CrossRef]
- Aristizabal, S.; Byun, K.; Porter, P.; Clements, N.; Campanella, C.; Li, L.; Bauer, B. Biophilic office design: Exploring the impact of a multi-sensory approach on human well-being. J. Environ. Psychol. 2021, 77, 101682. [Google Scholar] [CrossRef]
- Shen, Y.S.; Lung, S.C.C. Identifying critical green structure characteristics for reducing the suicide rate. Urban For. Urban Green. 2018, 34, 147–153. [Google Scholar] [CrossRef]
- Ha, J.; Choi, D.H.; Darling, L.E. Is the spatial distribution of urban green space associated with crime in Chicago? Urban For. Urban Green. 2024, 95, 128282. [Google Scholar] [CrossRef]
- Zhang, J. Landscape Thoughts; China Architecture & Building Press: Beijing, China, 2008; pp. 60–106. [Google Scholar]
- Tyrväinen, L.; Ojala, A.; Korpela, K.; Lanki, T.; Tsunetsugu, Y.; Kagawa, T. The influence of urban green environments on stress relief measures: A field experiment. J. Environ. Psychol. 2014, 38, 1–9. [Google Scholar] [CrossRef]

Disclaimer/Publisher’s Note: The statements, opinions and data contained in all publications are solely those of the individual author(s) and contributor(s) and not of MDPI and/or the editor(s). MDPI and/or the editor(s) disclaim responsibility for any injury to people or property resulting from any ideas, methods, instructions or products referred to in the content. |
© 2024 by the authors. Licensee MDPI, Basel, Switzerland. This article is an open access article distributed under the terms and conditions of the Creative Commons Attribution (CC BY) license (https://creativecommons.org/licenses/by/4.0/).