Abstract
The Messara Basin, a critical agricultural region in Crete, Greece, faces escalating geohazards, particularly land subsidence driven by intensive groundwater abstraction. Historical radar interferometry (1992–2009) indicated subsidence up to 20 mm·yr−1, while recent European Ground Motion Service data (2016–2021) show mean vertical velocities reaching −31.2 mm·yr−1. This study provides the first integrated hydrogeological assessment for the Basin, based on systematic field surveys, borehole inventories, and four coordinated campaigns (2021–2023) that established a basin-wide monitoring network of 767 stations. The dataset supports delineation of recharge zones, identification of potentiometric depressions, and mapping of aquifer-stress areas. Results show strong seasonality and extensive cones of depression, with local heads declining to ~−50 m below sea level. Land-use change (1990–2018 CORINE data; 2000–2020 agricultural censuses) combined with updated geological mapping highlights the vulnerability of post-Alpine formations, especially Quaternary and Plio–Pleistocene deposits, to deformation. The combined evidence links pumping-induced head decline with spatially coherent subsidence, delineates hotspots of aquifer stress, and identifies zones of elevated compaction risk. These findings provide a decision-ready baseline to support sustainable groundwater management, including enhanced monitoring, targeted demand controls, and managed aquifer-recharge trials.
1. Introduction
The Messara Basin (Figure S1), located in central-southern Crete, is the island’s largest and most intensively cultivated intramontane basin. Historically shaped by agriculture, the region has become increasingly reliant on groundwater, particularly for the irrigation of olive groves, which now dominate the landscape. Over the past decades, this dependency has intensified due to expanding irrigated land, climate variability, and prolonged dry seasons. These pressures have led to significant overexploitation of aquifer systems and the manifestation of geohazards, most critically land subsidence. In cases of overpumping with significant lowering of the piezometric surface across large aquifers, subsidence phenomena are frequently observed [1,2,3,4,5,6].
Evidence of land subsidence in the Messara Basin has been documented since the early 1990s, with radar interferometry studies consistently reporting measurable ground lowering in the central basin, particularly within the Geropotamos and western Anapodaris watersheds [7,8]. Reported rates vary across datasets but collectively confirm that the Basin has experienced persistent deformation over multiple decades.
Recent observations from the European Ground Motion Service (EGMS) over a five-year period (1 May 2016 to 22 December 2021) reveal mean vertical velocities of up to −31 mm·yr−1 (Figure 1) [9].
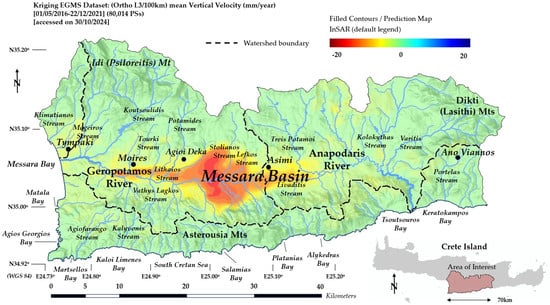
Figure 1.
Spatial extent of the Study Area. Overlaid is a prediction map based on geostatistical analysis (ordinary kriging) of mean vertical velocities (mm·yr−1) derived from 80,014 Persistent Scatterers (PSs). The dataset was obtained from the EGMS Data Explorer (accessed on 30 October 2024) and covers the period 1 May 2016 to 22 December 2021 [9]. See Supplementary S1—Notes on Kriging Diagnostics for model and cross-validation details.
The novelty and abundance of prototype datasets included in this study are exemplified by several key contributions: the first basin-wide, time-coordinated potentiometric maps for Messara (wet and dry seasons in 2021 and 2023), linked to a 767-station monitoring network; a homogenized 1:50,000 hydrolithological reclassification that distinguishes aquifer from aquitard behavior; the most comprehensive deep- and shallow-well census to date, including quantified abstraction rates; and an InSAR-validated interpretation of aquifer stress and subsidence. Together these advances reveal persistent cones of depression aligned with irrigated post-Alpine fines, quantify interannual drawdown under drought and overexploitation, and delineate zones of heightened compaction risk for risk-aware groundwater management.
2. The Study Area
The Messara Basin (Figure 1 and Figure S1)—the largest intramontane basin on the island of Crete—is located in the central-southern part of the island. It is bounded by Mount Idi (Psiloreitis) to the northwest, the Asterousia Mountains to the south, and the Dikti (Lasithi) Mountains to the east. Its western margin opens toward Messara Bay and the South Cretan Sea, while the southern boundary is further defined by the coastline south of the Asterousia range.
The Study Area, depicted in Figure 1 (delineated by a bold black line in Figure S1), encompasses the Messara Basin and covers an area of approximately 1536 km2. It spans about 70 km along its west–east axis and varies in width from north to south (approximately 33 km in the west and 18 km in the east).
The Basin includes two main watersheds: the Geropotamos watershed in the central-western section and the Anapodaris watershed in the central-eastern section (Figure 1). Additionally, the Klimatianos watershed is situated in the northwestern part of the Basin, while the Portelas watershed lies to the southeast. Smaller drainage basins associated with the steep, south-facing slopes of the Asterousia Mountains have been merged into a single unit referred to as the South Asterousia watersheds for presentation purposes.
This defined Study Area serves as the spatial framework for all subsequent figures, maps, and analyses presented in this study.
3. Background of Hydrogeological Research, Key Studies, and Groundwater Overexploitation
The earliest official records of groundwater exploitation in the Basin date back to before 1951, when 16 government-operated deep wells had already been established. In that same year, three additional exploratory wells were drilled by the Associated Drilling and Supply Company (Overseas) Ltd., (ADSCO), London, U.K., in collaboration with the Greek Ministry of Agriculture. This initiative formed part of an agreement signed on 27 January 1951, aimed at advancing the systematic investigation of groundwater resources in the Messara Basin. The project focused on identifying suitable sites for production drilling and conducting a comprehensive assessment of the region’s hydrogeological conditions [10].
At the time, irrigation practices relied primarily on surface water sources, and agricultural land use was more diverse. The presence of surface water is reflected in the cultivation of rice in areas such as the village of Petrokefali—located southwest of Moires and south of the Geropotamos River [11]—as well as in the remnants of historical water mills scattered throughout the wider Basin [12,13].
The significance of agriculture in the region is further underscored by early institutional developments, such as the establishment of the Agricultural School of Messara in 1920 [14].
The shift toward groundwater-intensive agriculture began after 1948 through private initiatives and was further accelerated following the hydrological survey of Crete by the Institute for Geology and Subsurface Research (IGSR) [15]. This study laid the groundwork for irrigation infrastructure and promoted groundwater use, facilitating the intensification of agriculture across the Basin.
Following the issuance of Greek Legislative Decree 3881 on 30 October 1958 [16], the Land Improvement Service of Irakleio (LIS) was officially established [17], initiating a more coordinated approach to water resource management. This period saw a sharp rise in the number of deep wells drilled across the Messara Basin to support expanding agricultural activity, reflecting a growing dependence on groundwater as the primary source of irrigation.
A key milestone in the region’s water governance was the establishment of the first Local Land Reclamation Organization (LLRO) in 1969 [18], which introduced a decentralized model for groundwater management. Today, eight LLROs operate throughout the wider Messara Basin [19], managing irrigation infrastructure and services at the local level. These organizations operate in alignment with the River Basin Management Plan of the Water District of Crete (EL13) [20,21], under the administrative supervision of the Water Directorate of Crete of the Decentralized Administration of Crete [22].
International cooperation also contributed significantly to irrigation development. A detailed hydrogeological investigation conducted by the United Nations Development Program (UNDP) and FAO between 1967 and 1972 yielded important data and insights into the groundwater regime of the Messara Basin [23,24,25,26,27,28,29,30,31,32,33,34,35,36].
Despite these advancements, groundwater exploitation in the Basin has primarily occurred through uncontrolled private drilling, resulting in an increasingly unsustainable dependency on groundwater for irrigation. Since the 1970s, escalating water demand—driven by the expansion of high water-demand olive groves and greenhouse cultivation—has led to widespread aquifer stress. In recent decades, this overexploitation has prompted a gradual policy shift toward the construction of surface water infrastructure, including irrigation dams, to supplement and alleviate groundwater use.
The increasing demand for groundwater—primarily to support extensive olive cultivation—has led to a dramatic rise in the number of recorded deep wells across the wider area of the Messara Basin in recent decades. According to recent data from a systematic inventory of water wells in Greece, a total of 2474 deep wells has been documented within the Study Area, representing 46.3% of all deep wells on the island of Crete [37].
Groundwater levels in the Messara Basin exhibit notable seasonal fluctuations, primarily driven by overexploitation for irrigation, particularly in the aftermath of a prolonged drought [38,39]. However, the monitoring of groundwater resources remains fragmented. Coordination among managing entities is limited, and no unified data-sharing framework currently exists. This lack of integration has hindered the regional consolidation of hydrogeological observations and the development of a comprehensive, Basin-wide groundwater management strategy.
In 2009, the Institute of Geology and Mineral Exploration (IGME) identified 65 deep wells and 14 springs within the Study Area as suitable for inclusion in the National Groundwater Monitoring Network as part of the broader project “Recording and Evaluation of the Hydrogeological Characteristics of the Groundwater and Aquifer Systems of Greece. Water District EL13” [40]. This effort supported the development of the River Basin Management Plan for the Water District of Crete, in alignment with the European Union’s Water Framework Directive and related environmental policies. Of these monitoring stations, 35—primarily located along the Basin’s margins—remain operational and are currently maintained by IGME’s successor, the Hellenic Survey of Geology and Mineral Exploration (HSGME) [41]. Smaller monitoring networks are also operated by Local Land Reclamation Organizations (LLROs) and the Water Directorate of Crete of the Decentralized Administration of Crete.
Numerous studies and models have been employed in hydrological, hydrogeological, geophysical, and environmental research across the broader Messara Basin area [42,43,44,45,46,47,48,49,50,51,52], either by focusing on specific subregions within the Basin or by including areas along its boundaries. These efforts build upon earlier investigations and datasets developed by the Land Improvement Service of Irakleio (LIS), with hardcopy records available since 1959; the Food and Agriculture Organization (FAO), which conducted extensive studies between 1967 and 1972 [23,24,25,26,27,28,29,30,31,32,33,34,35,36]; the Institute of Geology and Mineral Exploration (IGME) [40], whose work began in 1949 under its predecessor, the Institute for Geology and Subsurface Research (IGSR) [15]; and the Hellenic National Meteorological Service (HNMS), which has provided systematic meteorological data since 1971 [53,54].
In addition, numerous projects have been gradually commissioned by the Prefecture of Irakleion, Local Development Associations, Local Land Reclamation Organizations (LLROs), municipalities, local communities, Municipal Water Supply and Sewerage Enterprises (MWSEs), monastic institutions, and private stakeholders—each contributing to water-related research within their respective areas of interest. However, the absence of a unified master plan for groundwater exploitation has resulted in the uncontrolled drilling of deep wells and the progressive overexploitation of groundwater resources within the Basin.
4. Land Cover and Use
For the land cover analysis, the study utilizes the pan-European CORINE Land Cover (CLC) datasets provided by the Copernicus Land Monitoring Service (CLMS) [55,56,57,58,59,60]. For the Messara Basin, CLC data were extracted and clipped to match the Study Area, resulting in the identification of 27 distinct land cover classes. These data were analyzed to determine the dominant classes and to assess landscape changes over nearly three decades. Within the Study Area, 12 classes each occupy ≥ 0.5% of the total area (Table 1; Figure S2).

Table 1.
Dominant CORINE Land Cover (CLC) classes in the Study Area (area ≥ 0.5%) and their changes across the available datasets (1990, 2000, 2006, 2012, 2018).
Olive groves (CLC 223) represent the dominant land–cover class, accounting for approximately 40% of the total land area (Figure 2; Table 1). Although the Inland Waters—Water Bodies class (CLC 512) accounts for less than 0.5% of the Study Area, it first appears in the datasets from 2006 onward. This timing coincides with the construction of the Faneromeni (1999–2005) and Ini–Machairoi (2003–2006) dams, which were commissioned to address increasing irrigation water demand. During 2000–2006, changes in the Permanently Irrigated land class—primarily concentrated in the greenhouse–cultivation zone—are also recorded (Figure S3; Table 1).
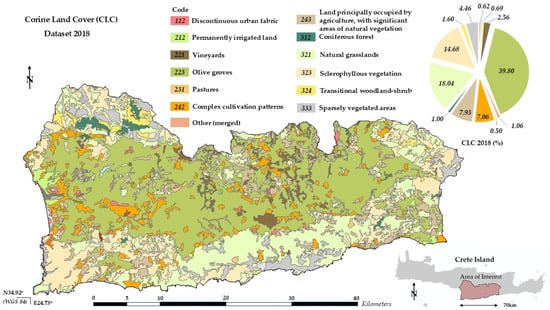
Figure 2.
Spatial distribution of CORINE Land Cover based on the most recent 2018 dataset, illustrating the thematic CLC classes and an associated pie chart depicting their percentage distribution in relation to the total Study Area.
Additionally, datasets from the Hellenic Statistical Authority (ELSTAT)—Division of Agriculture, Livestock, Fisheries, and Environmental Statistics—were used for the years 2000, 2009, and 2020, covering the Study Area [61]. These datasets provide detailed classifications of Utilized Agricultural Area (UAA). The most recent release, the 2020 Agricultural Census, also includes data on irrigated UAA (Table S1; Figure S4).
According to the 2020 dataset, olive groves occupy 40.49% of the Study Area, of which 58.29% are permanently irrigated (Table S1). The same dataset indicates that 46.17% of the Study Area is classified as Utilized Agricultural Area (UAA), with 26.47% of the total area under irrigation (Table S1; Figure S4). This implies that approximately 56.6% of the UAA is irrigated.
Although accurate groundwater–demand data are lacking, local–authority estimates suggest that more than 80 × 106 m3·yr−1 are required for irrigation in the region, with approximately 90% of this demand met by deep wells—underscoring the Basin’s dependency on groundwater for agricultural sustainability. Supporting this, the spatial distribution of 2474 deep wells closely align with olive plantations, the region’s dominant cultivated land use (Figure S5; see Section 6.2).
5. Geological and Hydrolithological Setting
5.1. Geological Setting
To describe the geological setting of the Messara Basin, seven 1:50,000 sheets of the Basic Geological Map of Greece were utilized, covering the Study Area—Melampes, Tympakion, Antiskarion, Epano Archanai, Achentrias, Mochos, and Ano Viannos—along with their lithostratigraphic columns (IGME originals 1984–2002 [62,63,64,65,66,67,68]; HSGME revisions 2019–2023 [69,70,71,72,73,74,75]). Building on these sources, simplified and homogenized lithostratigraphic columns were compiled for the Study Area (Figure 3), and a unified geological map at a scale of 1:50,000 was produced for the first time (Figure 4). The homogenization process involved standardizing lithostratigraphic nomenclature and symbology, reconciling unit boundaries across sheet margins, and aligning Alpine and post-Alpine formations, thereby eliminating cross-sheet inconsistencies that had previously hindered basin-scale interpretation. This integrated product (Figure 3 and Figure 4) forms the basis of the regional geological framework used in the subsequent hydrolithological classification (Figure 5).
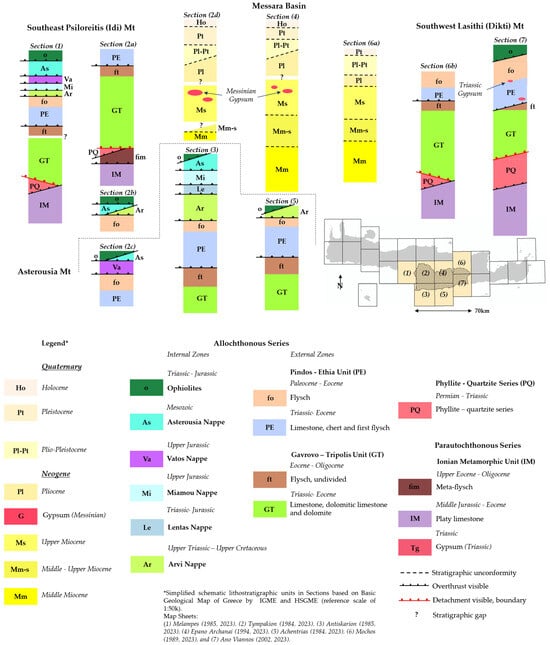
Figure 3.
Simplified lithostratigraphic columns compiled from seven 1:50,000 geological map sheets covering the Study Area: (1) Melampes (IGME 1985; HSGME 2023), (2) Tympakion (IGME 1984; HSGME 2023), (3) Antiskarion (IGME 1985; HSGME 2023), (4) Epano Archanai (IGME 1994; HSGME 2023), (5) Achentrias (IGME 1984; HSGME 2023), (6) Mochos (IGME 1989; HSGME 2023), and (7) Ano Viannos (IGME 2002; HSGME 2023). Section numbers correspond to the sheet indices shown in the inset map. The columns summarize Alpine and post-Alpine formations as depicted in the original IGME maps and their subsequent HSGME revisions [62,63,64,65,66,67,68,69,70,71,72,73,74,75].
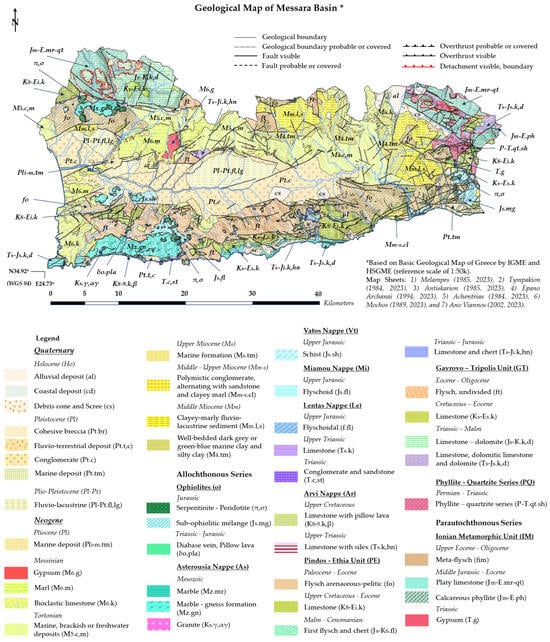
Figure 4.
1:50,000 geological map of the Study Area compiled from the Basic Geological Map of Greece (IGME originals; HSGME revisions). Source sheets: (1) Melampes (IGME 1985; HSGME 2023), (2) Tympakion (IGME 1984; HSGME 2023), (3) Antiskarion (IGME 1985; HSGME 2023), (4) Epano Archanai (IGME 1994; HSGME 2023), (5) Achentrias (IGME 1984; HSGME 2023), (6) Mochos (IGME 1989; HSGME 2023), and (7) Ano Viannos (IGME 2002; HSGME 2023) [62,63,64,65,66,67,68,69,70,71,72,73,74,75].
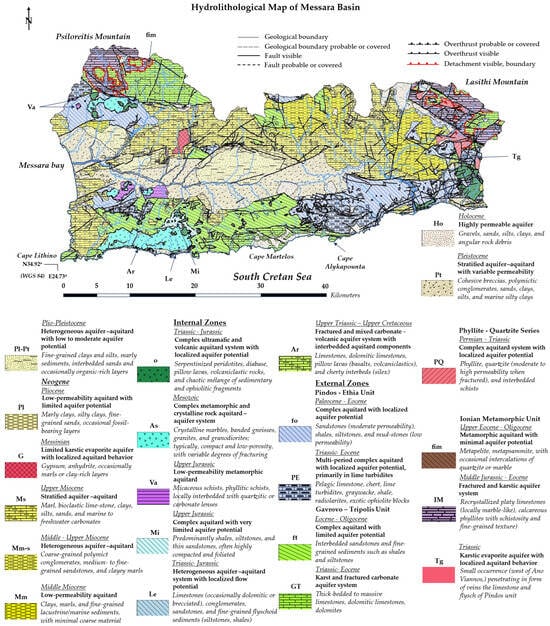
Figure 5.
Simplified hydrolithological map of the Study Area, derived by merging lithostratigraphic units based on the Basic Geological Map of Greece, produced by IGME and HSGME at a reference scale of 1:50,000. The map compilation incorporates data from seven official geological map sheets: Melampes (1985, 2023), Tympakion (1984, 2023), Antiskarion (1985, 2023), Epano Archanai (1994, 2023), Achentrias (1984, 2023), Mochos (1989, 2023), and Ano Viannos (2002, 2023) [62,63,64,65,66,67,68,69,70,71,72,73,74,75].
Along the mountain ranges that bound the Messara Basin—the Psiloreitis (Idi), Lasithi (Dikti), and Asterousia Mountains—the principal tectonostratigraphic units of Crete are prominently exposed (Figure 3 and Figure 4). These units were deposited in diverse marine environments and were later juxtaposed by large-scale tectonic processes associated with the Alpine orogeny. The lithostratigraphic relationships are illustrated in Figure 3, where (i) Sections 1, 2a, and 2b represent the southwestern Psiloreitis; (ii) Sections 2c, 3, and 5 correspond to the Asterousia Range; and (iii) Sections 6b and 7 depict the southeastern Lasithi Mountains.
The interior of the Messara Basin is dominated by sedimentary formations ranging from the Middle–Upper Miocene to the Quaternary (Figure 3: Sections 2d, 4, 6a), mapped in detail on the Geological Map of the Messara Basin (Figure 4). Within the post-Alpine succession of the Messara Basin, normal faulting generally follows the major fault systems observed in the surrounding mountain ranges (Figure 4). These faults are developed either within the Neogene formations or along their structural contacts with underlying Alpine units, reflecting the region’s active tectonics and the complex extensional regime that shapes the broader Basin architecture.
These post-Alpine formations host the main agricultural activities (as described in Section 4), particularly olive cultivation, where irrigation relies heavily on groundwater extraction from deep wells (see Section 6.2). The complexity and heterogeneity of the geological setting in the study area are highlighted by field observations and deep-well logs, which document the variable characteristics of both the Alpine and post-Alpine formations depicted on the geological map (Figure 4). For the purposes of this study—an overview of the geological setting at the scale considered—a simplified lithostratigraphic approach has been adopted (Figure 3). Future work will include the construction of geological cross-sections to provide a more detailed visualization of the subsurface framework of the Study Area.
A simplified and homogenized geological map of the Study Area was compiled from seven sheets of the Basic Geological Map of Greece, incorporating both IGME originals and HSGME revisions. This integrated map (Figure 4) resolves cross-sheet inconsistencies and aligns Alpine and post-Alpine formations, providing a coherent framework for basin-scale geological interpretation.
5.2. Hydrolithological Setting
The hydrolithological classification of the Messara Basin (Figure 5) builds upon the integrated geological framework established in Section 5.1.
This map was produced by merging lithostratigraphic units from the Basic Geological Map of Greece (Figure 3 and Figure 4) into hydrolithological classes. The legend provides an overview of the key lithologies and their corresponding hydrogeological behavior—serving as the framework for the subsequent presentation.
5.2.1. Post-Alpine-Basin Fill
The post-Alpine sedimentary formations of the Messara Basin (Middle Miocene–Holocene), illustrated in Figure 5 and further emphasized in Figure S6, exhibit a spectrum of hydrolithological behaviors that reflect their facies and depositional setting. In general, they are open to direct infiltration, and hydraulic connectivity develops between permeable horizons and fractured layers. Recharge is predominantly supplied by mountain-front infiltration from the surrounding ranges. The Holocene deposits (Ho)—comprising alluvial, coastal, and colluvial (scree and debris cone) facies—form highly permeable unconfined aquifer systems. Dominated by gravels, sands, and silts, these formations exhibit high porosity and permeability, particularly in lowland and coastal zones, although local variations occur where finer-grained materials are intercalated. The Pleistocene formations (Pt) present a stratified aquifer–aquitard system: polymictic conglomerates and sandy layers provide moderate permeability, while cohesive breccias, clays, and silts act as aquitards, resulting in discontinuous groundwater flow and compartmentalized aquifer behavior. The Plio-Pleistocene fluvio-lacustrine deposits (Pl-Pt), composed mainly of fine-grained clays, silts, and marls, form a low- to moderate-permeability system with limited aquifer potential, except in sandy intercalations where localized groundwater flow may occur. The Pliocene marine deposits (Pl) behave predominantly as aquitards due to their marly and silty composition, supporting only minimal and discontinuous groundwater movement. The high solubility of Messinian gypsum (G) facilitates the development of karstic conduits, enabling localized rapid groundwater flow, although interbedded anhydrite and clay layers of the Upper Miocene (Ms) often act as hydraulic barriers, compartmentalizing flow paths. The Upper Miocene formations (Ms)—consisting of bioclastic limestones, marls, and fine-grained clastics—form another stratified aquifer–aquitard system: limestones and sand-rich layers display moderate permeability, while the marly matrix and clay-rich deposits hinder hydraulic connectivity. The Middle to Upper Miocene formations (Mm-s), composed of polymictic conglomerates with interbedded sandstones and marls, define a heterogeneous aquifer–aquitard system, where coarse clastic units act as moderately permeable aquifers and the clayey marls restrict groundwater movement, reinforcing complex internal stratification. Finally, the Middle Miocene fluvio-lacustrine and marine formations (Mm)—composed almost entirely of clayey to marly fine-grained sediments—function as effective regional aquitards. These units exhibit very low permeability and limited groundwater storage or transmission, serving as significant hydrological boundaries within the Basin.
5.2.2. Alpine Formations—Surrounding Mountains
The Alpine formations, primarily located in the surrounding mountains, are depicted in Figure 5 and further emphasized in Figure S7. The ophiolitic complexes (o)—primarily composed of serpentinized peridotites, diabase veins, pillow lavas, and sub-ophiolitic mélanges—generally function as low-permeability aquitards. Groundwater flow is highly localized, occurring mainly within weathered serpentinites or fractured volcanic units. The mélanges, due to their chaotic and compacted structure, typically act as effective barriers to flow. The Asterousia Nappe (As), consisting of crystalline marbles, gneisses, and granitic rocks, forms a metamorphic and crystalline aquitard–aquifer system. Although primary porosity is low, fractured zones and fault-controlled structures within the marbles may locally support moderate aquifer potential. In contrast, granitic and gneissic rocks typically exhibit limited groundwater yield, relying almost entirely on secondary porosity features such as fractures and shear zones. The Vatos Nappe (Va), composed predominantly of micaceous and phyllitic schists, acts largely as a low-permeability aquitard. Groundwater flow is restricted to discrete structural discontinuities, including fracture networks and cleavage planes. The Miamou Nappe (Mi)—a compact flyschoid sequence dominated by shales and siltstones—forms a highly restrictive aquitard with minimal aquifer development. Groundwater circulation is confined to fractured sandstones or tectonic discontinuities, creating a compartmentalized hydrogeological regime. The Lentas Nappe (Le) presents a more heterogeneous local system. It includes fractured or locally karstified limestones, sandstones, and conglomerates that can support localized groundwater flow, interbedded with low-permeability flyschoid sediments that function as aquitards. The Arvi Nappe (Ar) features a mixed carbonate–volcanic local assemblage, including fractured limestones, dolomites, pillow lavas, and cherty interbeds. Moderate aquifer potential exists where fracturing or karstification is developed, although volcanic and siliceous layers often act as aquicludes, restricting lateral groundwater connectivity.
The Pindos–Ethia Unit exhibits a complex hydrogeological structure comprising both flysch (fo) and carbonate sequences (PE). The arenaceous–pelitic flysch (fo), dominated by shales, siltstones, and fine-grained sandstones, primarily functions as a low-permeability aquitard, with groundwater movement generally limited to fractured or coarser-grained horizons. Overlying carbonate formations (PE)—including pelagic limestones, cherts, and lime turbidites—display stratified hydrolithological behavior, where cherts and dense limestones typically impede flow, but fractured or turbiditic zones may locally support aquifer development.
The Gavrovo–Tripolis Unit is similarly heterogeneous. Its flysch component (ft) acts as a low-permeability aquitard due to its fine-grained nature, with groundwater flow limited to isolated sandstone interbeds. In contrast, the associated carbonate sequences (GT)—comprising thick-bedded limestones, dolomitic limestones, and dolomites—form highly productive karstic and fractured aquifers. These carbonates are characterized by high permeability, enhanced by dissolution features, conduits, and extensive fracture networks that enable significant groundwater storage and transmission.
The Phyllite–Quartzite Series (PQ) largely acts as an aquitard, dominated by fine-grained phyllites with low porosity. However, quartzitic intercalations, when fractured, can locally support groundwater flow, offering limited aquifer potential within an otherwise hydraulically restricted system.
The Ionian Metamorphic Unit (IM) displays dual hydrogeological behavior. The meta-flysch (fim), composed of metapelites and metapsammites, predominantly acts as a low-permeability aquitard, while the platy limestones and calcareous phyllites may function as fractured and weakly karstified aquifers. Groundwater movement within these units is typically confined to secondary porosity features such as fractures and minor dissolution pathways, with the surrounding fine-grained lithologies limiting overall hydraulic connectivity and promoting a compartmentalized groundwater flow regime.
6. Hydrogeological Setting
6.1. Shallow Wells (Unconfined Aquifers) and Surface Water Reservoirs
As previously noted, the Messara Basin comprises two principal hydrological watersheds: the Geropotamos in the west and the Anapodaris in the east (Figure 6). In addition, three marginal watersheds along the boundaries of the Study Area are included: the South Asterousia watershed (an aggregation of smaller catchments draining the steep southern slopes of the Asterousia Mountains), the Klimatianos watershed in the northwestern sector, and the Portelas watershed in the southeast. Collectively, these five watersheds delineate the Study Area, which spans 1535.71 km2.
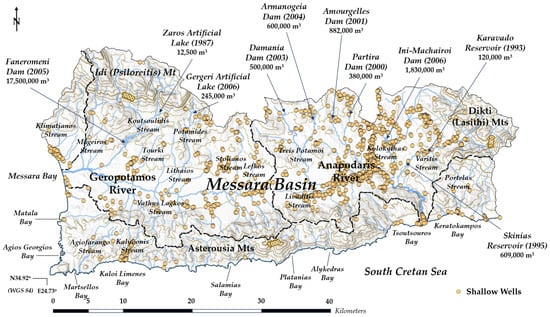
Figure 6.
Overview map of the Study Area showing the distribution of shallow wells along the primary hydrographic network and delineated watershed boundaries (see Table S2). Surface-water reservoir locations are also indicated, along with their respective storage capacities and year of construction (in parentheses; see Table S3).
According to the geodatabase of the Water Directorate of the Decentralized Administration of Crete, a total of 1345 shallow wells are recorded within the Study Area (Water Directorate of Crete, accessed: January 2025) [76]. The spatial distribution of these wells—primarily used for irrigation purposes—is presented in Figure 6 (see also Table S2), illustrating their alignment with the main hydrographic network across the Study Area. Most shallow wells are installed in alluvial deposits, targeting the unconfined Quaternary aquifers or the upper permeable layers of post-Alpine formations near riverbeds and stream channels, and typically reach depths of approximately 10–20 m.
Most shallow wells are seasonal, holding water primarily from November to May and typically running dry during the dry season (June–October). As a result, their use is constrained by low discharge rates, serving only small-scale, local irrigation needs. Over time, many of these wells are abandoned or replaced by deep wells to meet year-round—and increasing—irrigation demand. In favorable hydrological years, total discharge from shallow wells is estimated at 0.87–1.24 million m3·yr−1.
6.2. Deep Wells (Deep Aquifer Systems)
According to the HSGME Systematic Inventory of Water Wells for All Uses, 2474 deep wells are registered within the Study Area (see Table S4). This represents 46.3% of all deep wells recorded in the EL13 Water District (Crete and Gavdos) [37,77], underscoring the region’s strong reliance on groundwater—especially for irrigation. Figure S8 illustrates the spatial distribution of deep wells, which predominantly overlie the post-Alpine formations.
As shown in Table S4, a total of 1849 deep wells—representing 74.7% of the total—are currently operational, while 625 deep wells (25.3%) are classified as abandoned—having been originally drilled for irrigation or hydrogeological survey purposes. The estimated total groundwater discharge from deep wells within the Study Area is approximately 53.25 million m3/year. Additional statistical information about the deep wells is provided in Table S4, while their spatial distribution is illustrated in Figures S9 and S10.
The spatial distribution of deep wells aligns with the dominant land-use—olive groves—and greenhouse zones (Figure S5), which are mainly cultivated within the post-Alpine domain (Figure S8). Smaller clusters (Figure S5) associated with vineyards (Figure 2; Table 1 and Table S1), typically located on south-facing slopes, occur within Alpine terrains. The densest concentrations of deep wells are found across the central basin and within the main olive-production areas. Unlike shallow wells, deep wells operate year-round, forming the backbone of irrigation supply during the dry season.
From a hydrostratigraphic perspective, deep wells predominantly target (Figure S8): (i) permeable horizons within the Pleistocene and Plio–Pleistocene basin fill (conglomerates and sands); and (ii) aquifer intervals within the Upper Miocene and Middle–Upper Miocene sequences. Deep wells also target karstified and fractured carbonate formations along the internal margins of the basin—specifically the Gavrovo–Tripolis and Pindos–Ethia units—which are typically encountered under semi-confined to confined conditions.
Screening strategies differ according to lithology and depth, resulting in considerable spatial variability in well yields—ranging from 5 to 70 m3/h, with typical values around 20 m3/h—as well as in drawdown responses. A comprehensive analysis of pumping and recovery test data will be presented in a subsequent study. The spatial distribution of deep-well density coincides with zones of persistent hydraulic head decline and mapped deformation sites (see Section 6.4), particularly in areas where pumping targets compressible, fine-grained Plio–Pleistocene sequences. In these settings, sustained drawdown increases compaction susceptibility, thereby elevating the risk of land subsidence. By contrast, groundwater abstractions from marginal carbonate formations are primarily governed by conduit connectivity and boundary conditions.
6.3. Groundwater Network
A groundwater monitoring network is defined as a structured system designed for the systematic, continuous, or periodic observation and measurement of the dynamic state of the subsurface hydrological environment. Such networks are essential for both early warning and long-term groundwater resource management, particularly in regions characterized by complex hydrogeological settings (definition adapted from UNESCO, 1992; 2004) [78,79]. Hydrogeological processes vary considerably across spatial and temporal scales, presenting significant challenges for comprehensive and accurate data collection. Nonetheless, the delineation and characterization of groundwater systems—especially in geologically heterogeneous regions such as the Messara Basin—necessitate robust and spatially distributed temporal datasets. Recognizing this need, an extensive monitoring initiative was undertaken in the Messara Basin to develop a fully functional, basin-scale groundwater monitoring network.
As part of this initiative, 42 stations from the National Groundwater Monitoring Network of Greece [41] were reviewed for potential integration into the monitoring system, with 35 stations located along the margins of the Study Area. A total of 1149 water points—comprising deep wells, springs, and shallow wells—were initially surveyed across the broader Messara region (Figure S11). Following a detailed technical evaluation, 767 points were identified as suitable for groundwater level monitoring. Exclusions were based on criteria such as the absence of essential monitoring infrastructure (e.g., missing monitoring pipes), abandonment, or limited structural and logistical accessibility (Figure S12). Of the 767 selected points, 730 are located within the delineated boundaries of the Study Area (Figure 7), while an additional 37 points—predominantly situated along its northern perimeter—were included to enhance spatial coverage and facilitate more comprehensive hydrogeological analysis. Table S5 provides a summary of the distribution of these water points by type within each watershed.
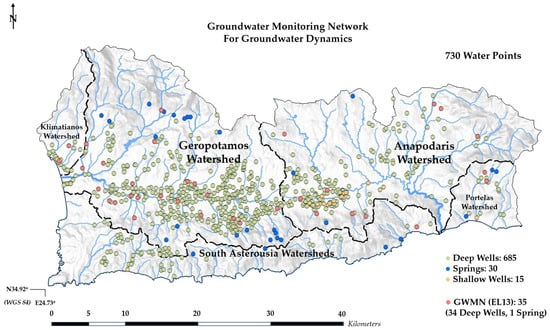
Figure 7.
Map of the Study Area showing the 730 water points selected for groundwater-level monitoring in this study: 685 deep wells, 30 springs, and 15 shallow wells. The map also highlights 35 stations from the National Groundwater Monitoring Network of Greece, which were integrated into the monitoring network. Dashed lines delineate the principal watershed boundaries.
The final network became fully operational in 2021, marking the first coordinated, basin-wide groundwater monitoring framework implemented in the Messara Basin. Its establishment is intended to support the development of a detailed hydrogeological map and to enable the systematic study of groundwater dynamics, including seasonal fluctuations, head gradients, and long-term trends. This initiative addresses critical knowledge gaps and underpins efforts toward sustainable groundwater resource management in the region. Although the Messara Basin includes a substantial number of shallow wells (1345), the majority are situated within alluvial deposits near riverbeds and stream channels. These shallow wells were excluded from the monitoring network due to their limited depth (typically ranging from 10 to 20 m) and high seasonal variability. Many become nearly dry by the end of the dry season, rendering them unsuitable for representing the hydraulic behavior of the deeper aquifer systems targeted in this study. Consequently, the selected network prioritizes water points capable of capturing long-term trends and spatial patterns in regional groundwater dynamics.
6.4. Groundwater Dynamics
6.4.1. Water Level Data—Survey Periods
Although multiple authorities are involved in the management of groundwater resources in the region, this study represents the first comprehensive and temporally consistent monitoring effort across the Messara Basin. Specifically, four systematic groundwater level monitoring campaigns were conducted in the Study Area between 2021 and 2023, in close coordination with key stakeholders. These included local authorities, municipal water and sewerage enterprises, presidents of local communities, local water distributors, representatives and personnel of LLROs and MWSEs, and the Water Directorate of the Decentralized Administration of Crete. The campaigns were strategically scheduled to capture the seasonal dynamics of the groundwater system and are summarized below:
- ▪
- End of the wet season 2021: 17 May–5 June 2021.
- ▪
- End of the dry season 2021: 20 September–9 October 2021.
- ▪
- End of the wet season 2023: 22 May–10 June 2023.
- ▪
- End of the dry season 2023: 18 September–7 October 2023.
No extended survey was conducted during 2022 due to logistical constraints and limited personnel availability. This study marks the first time that a basin-wide, time-consistent monitoring effort of groundwater levels has been accomplished in the Messara Basin. Previous investigations were typically fragmented, localized, or limited in temporal scope, often depending on specific projects or institutional mandates. In contrast, the monitoring campaigns conducted between 2021 and 2023 established a coordinated and systematic framework, ensuring consistency in both spatial coverage and seasonal timing. This unprecedented scale of measurement provides a reliable foundation for assessing groundwater dynamics, identifying trends, and linking water-level fluctuations with overexploitation and associated geohazards.
6.4.2. Water Level Data–Results
As illustrated in Figure 8 and Figure 9, the general pattern of the potentiometric surface indicates that groundwater flow largely mirrors the surface topography.
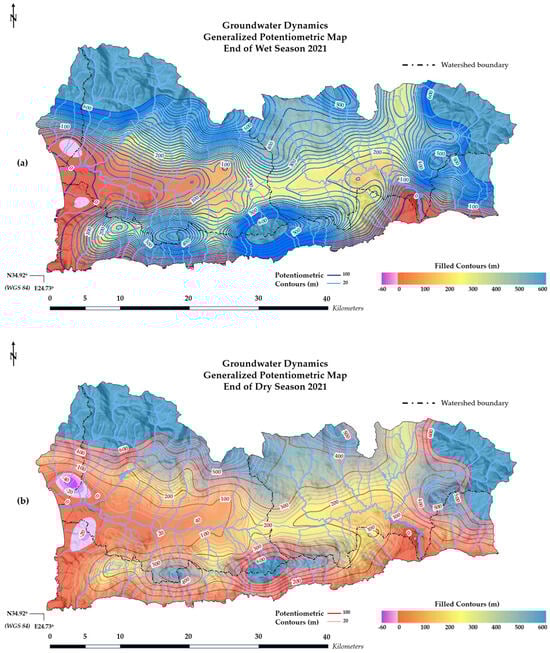
Figure 8.
Generalized potentiometric maps depicting the spatial distribution of groundwater level in 2021. (a) End of wet season 2021; (b) End of dry season 2021. Filled color contours illustrate the potentiometric surface with classification intervals of 10 m, supplemented by contour lines at 20 m intervals. Mapping is limited to elevations up to 600 m due to the absence of groundwater level data above this altitude, and contour intervals between 450 and 600 m are generalized and merged owing to sparse data coverage in these upland areas. Surfaces were generated by ordinary kriging; see Supplementary S1—Notes on Kriging Diagnostics for model and cross-validation details.
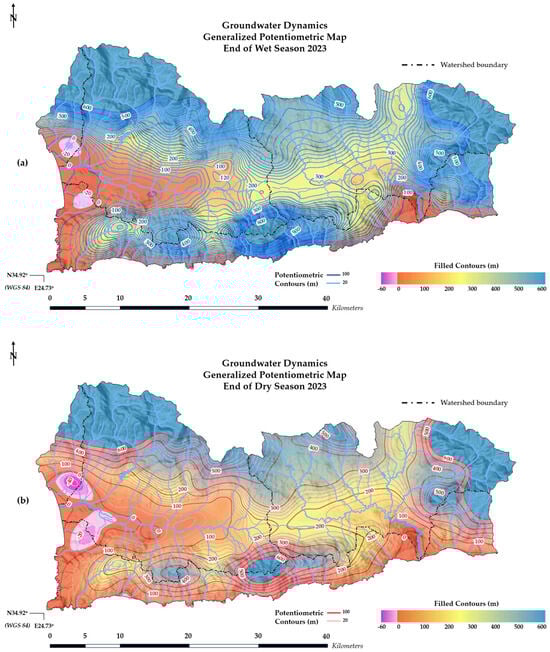
Figure 9.
Generalized potentiometric maps depicting the spatial distribution of groundwater level in 2023. (a) End of wet season 2023; (b) End of dry season 2023. Filled color contours illustrate the potentiometric surface with classification intervals of 10 m, supplemented by contour lines at 20 m intervals. Mapping is limited to elevations up to 600 m due to the absence of groundwater level data above this altitude, and contour intervals between 450 and 600 m are generalized and merged owing to sparse data coverage in these upland areas. Surfaces were generated by ordinary kriging; see Supplementary S1—Notes on Kriging Diagnostics for model and cross-validation details.
While direct recharge occurs through infiltration into permeable formations, the principal recharge zones for the deeper aquifers are concentrated along the major mountain ranges that encircle the basin. These elevated regions function as critical recharge areas, supplying groundwater to the lower-lying alluvial and sedimentary deposits of the basin via both lateral and vertical flow pathways. Groundwater movement clearly demonstrates the influence of three main recharge zones: Psiloreitis, Asterousia, and Lasithi.
The Psiloreitis Mountain range—positioned along the northwestern and central parts of the Study Area—plays a pivotal role in recharging the deeper aquifer systems of the northern Geropotamos watershed and the adjacent Klimatianos watershed. Its high elevation and extensive karstified formations make it a major recharge area. Subsurface flow from Psiloreitis also contributes to the groundwater supply in the northwestern sector of the Anapodaris watershed, highlighting a broader hydrogeological influence that extends beyond individual watershed boundaries.
Similarly, the Asterousia mountain range, located along the southern edge of the Basin, contributes northward to the recharge of the central-southern formations of the Geropotamos watershed and the southeastern sector of the Anapodaris watershed. To the east, the Lasithi Mountains are instrumental in replenishing groundwater resources in the northern and eastern parts of the Anapodaris watershed and also support the Portelas watershed in the southeastern Study Area.
Two distinct zones of extensive cones of depression caused by overexploitation have been identified in the western part of the Basin (highlighted in purple in Figure 8 and Figure 9, as shown in the legend). In the southern section of the Klimatianos watershed, near its boundary with the western Geropotamos watershed (north of the river), intensive groundwater abstraction has led to a pronounced decline in water levels, with groundwater tables falling below −34 m by the end of the 2021 dry season (Figure 8b) and reaching as deep as −55 m below sea level by the end of the 2023 dry season (Figure 9b). This area experiences chronic overexploitation, with numerous deep wells operating continuously throughout the year, rarely ceasing groundwater extraction. The persistence of the depression cone is also evident during the wet seasons, with groundwater levels dropping below −9 m in 2021 (Figure 8a) and below −13 m in 2023 (Figure 9a). The center of this extended cone of depression is located approximately 3.5 km inland from the coastline of Messara Bay, to the west.
The second extended zone of depression, where groundwater levels fall below sea level, is located in the southwestern section of the Geropotamos watershed, highlighted in purple in Figure 8 and Figure 9. By the end of the 2023 dry season, groundwater levels in this area had declined to more than -37 m, with some boreholes to the northeast recording depths exceeding −55 m (Figure 9b). At the end of the 2021 dry season, groundwater levels in the same zone were recorded at depths greater than −34 m (Figure 8b). This area of overexploitation is also evident during the wet seasons of both 2021 and 2023, as groundwater levels remained consistently below sea level (Figure 8a and Figure 9a). Chronic overexploitation persists northeast of this zone, where numerous deep wells operate continuously throughout the year with minimal or no interruption in groundwater extraction.
By the end of the dry season in 2023, groundwater levels had reached 0 m at approximately 17 km from Messara Bay and just 20 m at nearly 20 km inland. The 100 m potentiometric contour forms a pronounced tongue-shaped depression zone extending eastward into the Basin’s interior, reaching up to 25 km from the coastline. Over time, this depression has progressed toward the Geropotamos–Anapodaris watershed divide, delineating an increasingly extensive zone of groundwater depletion across the western and central parts of the Basin.
In the Anapodaris watershed, a groundwater depression zone is observed near the riverbed and the coastal region. This is attributed to the steep topography and the hydrolithological characteristics of the faulted and karstified limestones of the Pindos–Ethia (PE) Unit. In this area, a high degree of karstification enables direct hydraulic connectivity with the sea, resulting in groundwater levels reaching sea level.
Although the Anapodaris watershed does not exhibit the same dramatic groundwater level declines as observed in the Geropotamos watershed, a general reduction in water levels is apparent. This decline extends inland and gradually approaches the identified recharge zones, indicating a broader pattern of regional groundwater stress.
7. Discussion
The findings of this study underscore the urgent need for sustainable groundwater management strategies in the Messara Basin and the importance of building a long-term monitoring and planning framework to mitigate geohazard risks. By integrating land-use evolution, geological setting, hydrolithological characterization, and groundwater dynamics, this work provides—for the first time—a comprehensive, basin-wide baseline that is directly comparable across space and seasons.
Extensive cones of depression—particularly in the western and southwestern sectors of the Geropotamos watershed (Figure 8 and Figure 9)—highlight the severe impacts of chronic groundwater overexploitation. Groundwater level declines exceeding 50 m below sea level (b.s.l.), together with the persistence of these depressions even at the end of wet seasons (Figure 8a and Figure 9a), reflect an ongoing and unsustainable drawdown of aquifer reserves. These conditions pose a significant threat to the long-term viability of agriculture and substantially increase the risk of land subsidence and ground deformation, as independently confirmed by EGMS remote-sensing data.
Recent and ongoing declines are illustrated in Figure 10, which maps groundwater dynamics using contour lines of equal water-level differences between the end of the wet season of 2021 and the end of the dry season of 2023 (MJ21–SO23). In the central basin, declines reach up to approximately 60 m, while reductions of around 30 m are observed across several other areas. Along the perimeter of the Quaternary deposits—which coincide with the main recharge zones—declines of approximately 10 m are recorded over the same period. The filled contours in Figure 10 represent vertical velocities (mm/year) derived from 80,014 EGMS Persistent Scatterers (PSs) spanning 1 May 2016 to 22 December 2021. These data reveal a strong spatial correspondence between head declines and vertical ground motion, with mean vertical velocities reaching up to −31 mm·yr−1. This correlation reinforces the hydro-mechanical link between over-abstraction and ground deformation, highlighting the geohazard implications of unsustainable groundwater use.
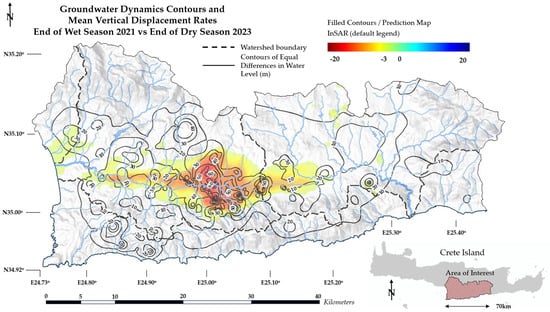
Figure 10.
Groundwater dynamics contours illustrating equal differences in water level between the end of the wet season of 2021 and the end of the dry season of 2023, overlaid on filled contours derived by ordinary kriging. The filled contours represent mean vertical velocities (mm/year) calculated from 80,014 Persistent Scatterers (PS) based on EGMS data for the period 1 May 2016 to 22 December 2021. Only negative velocities exceeding −3 mm/year are shown. See Supplementary S1—Notes on Kriging Diagnostics for kriging models and cross-validation details.
The hydrostratigraphic architecture of the Messara Basin reveals a layered system of aquifers and aquitards, where permeable Quaternary and Neogene deposits, karstified carbonates, and fractured lithologies interact dynamically. Shallow, unconfined (“phreatic”) water tables develop within surficial alluvium and coarse post-Alpine fans, while most production deep wells tap deeper, semi-confined to confined intervals within the Plio–Pleistocene fill and, locally, margin carbonates.
The post-Alpine succession consists of interbedded conglomerates and sands (functioning as aquifers) interspersed with laterally variable silts and clays (acting as aquitards), which impose vertical hydraulic gradients and result in delayed head responses. Under sustained pumping, these fine-grained, compressible horizons may undergo inelastic compaction once preconsolidation stress is exceeded, thereby contributing to land subsidence.
In contrast, abstractions from the Gavrovo–Tripolis and Pindos–Ethia carbonates occur within fracture/karst networks where storage and transmissivity are governed by conduit connectivity and boundary conditions. These units exhibit low bulk compaction susceptibility, making them less prone to deformation under stress.
Figure 11 integrates these controls by overlaying the hydrolithology (grayscale) with EGMS mean vertical velocities (mm·yr−1). Subsiding areas (negative velocities ≤ −3 mm·yr−1) coincide with thick, fine-grained Plio–Pleistocene and Quaternary packages in the Basin interior, while drawdown footprints tighten toward carbonate margins. The spatial coherence among potentiometric lows, head declines, and deformation concentrated in compressible Basin fill supports a hydro-mechanical subsidence mechanism under chronic pumping.
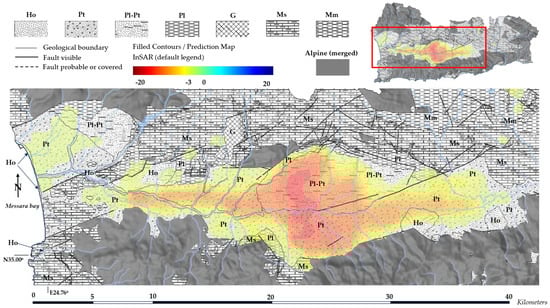
Figure 11.
The hydrolithology map (presented in grayscale using the same classification and patterning as in Figure 5 is overlaid with filled contours representing mean vertical velocities (mm/year), calculated from 80,014 Persistent Scatterers (PS) based on EGMS data for the period 1 May 2016 to 22 December 2021. Only negative velocities exceeding −3 mm/year are shown, highlighting areas affected by subsidence.
Figure 12 presents time series data from nine wells in the National Groundwater Monitoring Network of Greece, offering valuable context for observed groundwater dynamics. In the Moires–Petrokefali area, seasonal fluctuations of approximately 5 m prior to 1990 transitioned into a multidecadal decline exceeding 50 m, with the first occurrences of negative hydraulic heads at well M22 during 1997–1998. By around 2003, seasonal amplitudes had increased to 10–15 m, reflecting intensified abstraction pressures. In the coastal Tympaki area, limited fluctuations persisted until the early 1990s, suggesting relatively stable conditions prior to increased demand. Toward the Basin center—in the Agioi Deka–Gkagkales–Vagionia corridor—seasonal amplitudes of up to ~20 m at well M13 and less than 5 m at well M14 continued through 2002. The construction and initial operation of the Faneromeni Dam (1999–2005) produced a short-lived rise in groundwater levels between 2001 and 2005, particularly in the western Basin, illustrating the buffering role of surface-water inputs in mitigating aquifer stress.
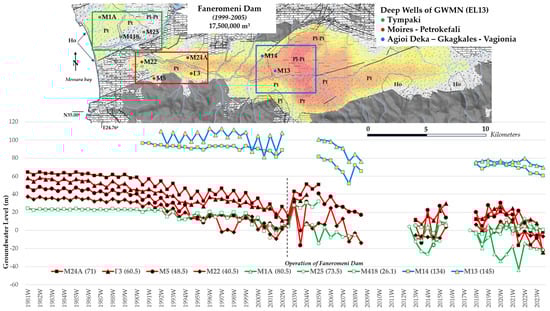
Figure 12.
Spatial focus on three sub-areas within the Study Area—Tympaki, Moires–Petrokefali, and Agioi Deka-Gkagkales-Vagionia—where a total of nine deep wells from the National Groundwater Monitoring Network of Greece provide available time-series measurements. The corresponding graphs illustrate groundwater level fluctuations over time for each deep well, offering insight into both seasonal variability and long-term trends in aquifer response.
After 2005, groundwater dependency across the Messara Basin intensified—driven primarily by the expansion of irrigated olive cultivation—alongside a marked increase in the density of deep wells. This shift is reflected in the growing amplitude of seasonal fluctuations, particularly in the western Basin during 2013–2016 and 2018–2023, and in the widespread occurrence of hydraulic heads below sea level after 2006. By the end of the 2021 dry season, groundwater levels locally declined to below −34 m, and by the end of the 2023 dry season, they reached depths of up to −55 m b.s.l. (Figure 8b and Figure 9b), underscoring the escalating pressure on aquifer reserves and the urgent need for adaptive water management.
Overexploitation for irrigation—predominantly unmetered and dominated by privately operated deep wells (~78.6%)—has led to significant groundwater depletion and the emergence of geohazards, with land subsidence documented in several parts of the Messara Basin. The integrated framework developed in this study—combining potentiometric surface mapping, head-change analysis, hydrostratigraphic characterization, and EGMS-derived ground motion data—effectively identifies critical hotspots where management intervention is most urgent and where future monitoring efforts (both hydraulic heads and deformation) should be prioritized.
This baseline provides a robust foundation for future, in-depth evaluations of groundwater dynamics and overexploitation within a geohazard-risk context and can inform risk-aware resource allocation, managed aquifer recharge (MAR) trials, and targeted demand management strategies.
8. Conclusions
This study delivers the first basin-wide, time-coordinated synthesis of groundwater conditions in the Messara Basin, achieved through the integration of land-use evolution, geological and hydrolithological context, dense synoptic water level surveys (2021–2023), and satellite-derived ground motion data. Collectively, these datasets establish a robust, multi-dimensional baseline against which future management interventions, climate stressors, and geohazard risks can be systematically evaluated. This framework not only enhances understanding of aquifer behavior under pressure but also supports risk-informed planning, targeted monitoring, and sustainable resource allocation across the Basin.
Three consistent findings emerge from this study:
- Extensive and persistent cones of depression dominate the western and southwestern Geropotamos sub-Basin and the central Messara plain. Hydraulic heads commonly fall below sea level by the end of the dry season, with interannual declines reaching several tens of meters in the central Basin between 2021 and 2023.
- While seasonal drawdown–recovery cycles are evident across the monitoring network, recovery remains incomplete in heavily abstracted zones, indicating a state of chronic overdraft and unsustainable aquifer stress.
- Independent EGMS data reveal spatially coherent subsidence collocated with zones of major head decline, particularly within thick Plio–Pleistocene successions. This correlation confirms a hydro-mechanical link between groundwater depletion, vertical ground deformation, and potential infrastructure risk.
The hydrostratigraphic framework developed in this study explains these patterns. Quaternary and Plio–Pleistocene deposits serve as the principal production aquifers but contain laterally variable fine-grained layers that act as transmissivity controls and are prone to inelastic compaction under sustained drawdown. In contrast, karstified and fractured carbonates along the Basin margins transmit water efficiently yet exhibit low susceptibility to compaction; accordingly, drawdown footprints are narrower and subsidence signals are weaker. This contrast underscores the need for management strategies tailored to local lithological conditions and aquifer storage behavior, ensuring that groundwater governance is both hydrologically informed and geohazard-aware.
Historical and recent time-series data corroborate the patterns revealed by synoptic groundwater mapping. The temporary rebound in groundwater levels following the commissioning of the Faneromeni Dam in the early 2000s illustrates the benefits of surface-water substitution. However, the subsequent expansion of irrigation demand—driven primarily by olive cultivation and a proliferation of privately operated, largely unmonitored deep wells—has led to renewed and deepening groundwater deficits. As a result, the system now operates close to or beyond sustainable yield in several sub-areas, with heightened exposure to land-subsidence hazards.
These findings carry clear management implications. In the short term, priority should be given to:
- ▪
- Targeted abstraction reductions in identified hotspots
- ▪
- Systematic metering and permitting of high-capacity deep wells
- ▪
- Efficiency upgrades and seasonal demand management in agriculture
- ▪
- Pilot, well-instrumented managed aquifer recharge (MAR) schemes, particularly on permeable alluvial fans, and Aquifer Storage and Recovery (ASR) trials in suitable inland deep wells to bank winter surplus and dampen dry-season cones
In parallel, coastal and central-Basin zones with persistent heads below sea level should be designated as high-risk areas, warranting protection against seawater intrusion and compaction-related geohazards.
A modern groundwater monitoring architecture is essential to support adaptive management and mitigate emerging geohazard risks. Key recommendations include:
- ▪
- Expanding the observation-well network with telemetered pressure and conductivity sensors to enable real-time data acquisition and improve spatial coverage.
- ▪
- Harmonizing reference datums across monitoring campaigns to ensure consistency and comparability of water-level measurements.
- ▪
- Continuing routine InSAR analysis to track ground deformation trends, particularly in subsidence-prone zones.
- ▪
- Publishing seasonal dashboards that integrate hydraulic head data, abstraction volumes, and ground motion metrics to enhance transparency, stakeholder engagement, and evidence-based decision-making.
Together, these measures will strengthen the Basin’s resilience to overexploitation and climate stress while enabling proactive, risk-informed groundwater governance.
In sum, the Messara Basin’s groundwater system exhibits strong, spatially structured depletion with demonstrable geomechanical consequences, including land subsidence and aquifer stress. Yet the same evidence reveals practical levers—including demand management, surface-water substitution, and managed aquifer recharge (MAR)—that offer pathways to stabilize hydraulic heads, mitigate subsidence risk, and safeguard agricultural productivity. The integrated baseline developed in this study provides both the diagnostic clarity and the monitoring blueprint necessary to transition from chronic overdraft toward sustainable, risk-aware groundwater stewardship. It lays the foundation for informed decision-making, adaptive management, and long-term resilience in one of Greece’s most intensively cultivated basins.
Supplementary Materials
The following supporting information can be downloaded at: https://www.mdpi.com/article/10.3390/land14112124/s1, Figure S1. The Study Area, located in the central-southern part of the island of Crete, is delineated by a bold black line. It encompasses the entire Messara Basin and covers approximately 1536 km2. Figure S2. Graph illustrating the dominant CORINE Land Cover (CLC) classes in the Study Area with a spatial coverage of at least 0.5%, depicting their temporal changes based on available datasets (1990, 2000, 2006, 2012, and 2018). Figure S3. Spatial distribution of CORINE Land Cover for the (a) 2000 and (b) 2006 datasets, illustrating the addition of the Faneromeni and Ini-Machairoi dams, as well as notable changes in Tympaki (the primary concentration area for greenhouses) and Arvi, where greenhouse cultivation is also concentrated. Table S1. Utilized Agricultural Land (Area in km2) and Corresponding Percentages (%) of the Total Study Area (1535.71 km2) based on Requested Datasets (2000, 2009, and 2020) from ELSTAT. Table S2. Spatial distribution of shallow wells and surface water reservoirs across the main watersheds of the Study Area. Total of 1345 shallow wells and 10 reservoirs distributed across five hydrological catchments covering 1535.71 km2. Figure S4. Percentage (%) contribution of different land cover classes (as defined in Table S1) to (a) the total utilized agricultural land in the years 2000, 2009, and 2020, and (b) their proportional share relative to the total Study Area. Table S3. Surface water reservoirs of the Study Area from West to East, including year of completion, surface area, and storage capacity. Figure S5. Spatial distribution of 2474 deep wells within the Study Area, illustrating a strong correlation with olive plantations in the region. Figure S6. Simplified hydrolithological map of the study area, with emphasis on post-Alpine formations. For presentation purposes, the Alpine formations are shown as a single merged unit. The legend for post-Alpine formations follows the classification used in the hydrolithological map of the Study Area (see Figure 5). Figure S7. Simplified hydrolithological map of the study area, highlighting the Alpine formations. For presentation purposes, the post-Alpine formations are merged into a single unit. Figure S8. Spatial distribution of deep wells overlying post-Alpine formations, highlighting hydrogeological zones within the post-Alpine domain. Table S4. Deep wells in the Study Area. Results from a systematic inventory of deep wells by HSGME. Distribution by municipality, use, and ownership. Figure S9. Spatial distribution of deep wells by (a) primary use and (b) watershed, from the HSGME systematic inventory. Figure S10. Spatial distribution of deep wells by (a) municipality and (b) ownership category, from the HSGME systematic inventory. Table S5. Summary of the 730 water points within the Study Area incorporated into the groundwater-level monitoring network. Figure S11. Map of the Study Area showing the locations of 1149 surveyed water points identified as suitable for groundwater monitoring. Figure S12. Map of the Study Area illustrating the spatial distribution of 730 surveyed water points assessed for their suitability in groundwater level monitoring. Glossary: Shallow vs. Deep Wells. Supplementary S1—Notes on Kriging Diagnostics. This study provides six interpolated surfaces produced with ordinary kriging: (Figure 1) EGMS mean vertical velocity (2016–2021); (Figure 8a,b and Figure 9a,b) groundwater heads at the end of the wet and dry seasons in 2021 and 2023 (MJ21, SO21, MJ23, SO23); and (Figure 10) cumulative head change (MJ21–SO23). Figure 10 is plotted over EGMS mean-velocity filled contours (as in Figure 1) to enable direct spatial comparison with deformation. Detailed variogram parameters and cross-validation metrics for each surface are reported in Supplementary Material Section.
Author Contributions
Conceptualization, I.M. and C.L.; methodology, I.M. and C.L.; validation, I.M. and C.L.; formal analysis, I.M. and C.L.; investigation, I.M. and C.L.; resources, I.M., E.T. and C.L.; data curation, I.M. and E.T.; writing—original draft preparation, I.M.; writing—review and editing, C.L.; visualization, I.M.; supervision, C.L. All authors have read and agreed to the published version of the manuscript.
Funding
This research received no external funding.
Data Availability Statement
The datasets used and/or analyzed during the current study are available from the authors upon request.
Acknowledgments
The authors express their sincere gratitude to the personnel of local authorities for their valuable support during the field campaigns. Special thanks are also extended to all individuals who supported the research efforts, particularly during field activities. The authors extend their sincere gratitude to Adonis Photiades of the Hellenic Survey of Geology and Mineral Exploration (HSGME), Department of General and Applied Geology, for his valuable review and insights regarding the geological setting of the Study Area. The authors gratefully acknowledge Stergios Spyroulis, of ELSTAT, for his assistance in providing detailed datasets from the Agricultural Census for the Study Area. Finally, the authors would like to acknowledge the European Ground Motion Service (EGMS) and the Copernicus Land Monitoring Service (CLMS) for providing free access to the datasets utilized in this study.
Conflicts of Interest
The authors declare no conflicts of interest.
Abbreviations
The following abbreviations are used in this manuscript:
| EGMS | European Ground Motion Service |
| b.s.l. | Below Sea Level |
| CLMS | Corine Land Monitoring Service |
| ELSTAT | Hellenic Statistical Authority |
| UAA | Utilized Agricultural Area |
| IGME | Institute of Geology and Mineral Exploration |
| HSGME | Hellenic Survey of Geology and Mineral Exploration |
| ADSCO | Associated Drilling and Supply Company (Overseas) |
| IGSR | Institute for Geology and Subsurface Research |
| LLRO | Local Land Reclamation Organization |
| LIS | Land Improvement Service |
| FFHC | Freedom From Hunger Campaign |
| MWSE | Municipal Water and Sewage Enterprise |
| FAO | Food and Agriculture Organization |
| UNDP | United Nations Development Program |
| UNESCO | United Nations Educational Scientific and Cultural Organization |
| HNMS | Hellenic National Meteorological Service |
| WGS 84 | World Geodetic System 1984 |
| MAR | Managed Aquifer Recharge |
| ASR | Aquifer Storage and Recovery |
References
- Zhang, Y.; Xue, Y.Q.; Wu, J.C.; Yu, J.; Wei, Z.X.; Li, Q.F. Land Subsidence and Earth Fissures Due to Groundwater Withdrawal in the Southern Yangtze Delta, China. Environ. Geol. 2008, 55, 751–762. [Google Scholar] [CrossRef]
- Loupasakis, C.; Angelitsa, V.; Rozos, D.; Spanou, N. Mining Geohazards—Land Subsidence Caused by the Dewatering of Opencast Coal Mines: The Case Study of the Amyntaio Coal Mine, Florina, Greece. Nat. Hazards 2014, 70, 675–691. [Google Scholar] [CrossRef]
- Raspini, F.; Loupasakis, C.; Rozos, D.; Adam, N.; Moretti, S. Ground Subsidence Phenomena in the Delta Municipality Region (Northern Greece): Geotechnical Modeling and Validation with Persistent Scatterer Interferometry. Int. J. Appl. Earth Obs. Geoinf. 2014, 28, 78–89. [Google Scholar] [CrossRef]
- Svigkas, N.; Papoutsis, I.; Loupasakis, C.; Tsangaratos, P.; Kiratzi, A.; Kontoes, C. Land Subsidence Rebound Detected via Multi-Temporal InSAR and Ground Truth Data in Kalochori and Sindos Regions, Northern Greece. Eng. Geol. 2016, 209, 175–186. [Google Scholar] [CrossRef]
- Papoutsis, I.; Kontoes, C.; Alatza, S.; Apostolakis, A.; Loupasakis, C. InSAR Greece with Parallelized Persistent Scatterer Interferometry: A National Ground Motion Service for Big Copernicus Sentinel-1 Data. Remote Sens. 2020, 12, 3207. [Google Scholar] [CrossRef]
- Kamali, M.; Papoutsis, I.; Loupasakis, C.; Abuelgasim, A.; Omari, K.; Kontoes, C. Monitoring of Land Surface Subsidence Using Persistent Scatterer Interferometry Techniques and Ground Truth Data in Arid and Semi-Arid Regions: The Case of Remah, UAE. Sci. Total Environ. 2021, 776, 145946. [Google Scholar] [CrossRef] [PubMed]
- Mertikas, S.; Papadaki, E.; Paleologos, E. Radar Interferometry Techniques for Monitoring Subsidence Induced by Excessive Groundwater Pumping in Crete, Greece. In Proceedings of the Fringe Workshop, Frascati, Italy, 30 November–4 December 2009. [Google Scholar]
- Kaskara, M.; Barberopoulou, A.; Papoutsis, I.; Kontoes, C.; Ganas, A.; Karastathis, V. Analysis of the Deformation Pattern along the Subduction Zone of Crete, Greece, from Multi-Temporal ERS Data. In Proceedings of the Fringe 2015 Workshop, Frascati, Italy, 23–27 March 2015. ESA SP-731, May 2015. [Google Scholar]
- Michalakis, I.; Tsolaki, E.; Loupasakis, C.; Voudouris, K.; Kontoes, C. Groundwater level dynamics of the Messara Basin, Crete Island. Bulletin of the Geological Society of Greece, Special Publication 10, Extended Abstract GSG 2022-162. In Proceedings of the 16th International Congress of the Geological Society of Greece, Patras, Greece, 17–19 October 2022; pp. 553–554. [Google Scholar]
- Beeby-Thompson, A.; Paver, G.L. Report on the Survey and Exploration of Groundwater Resources in the Messara Plain Area (Covering Work Carried Out up to November 1951); Associated Drilling & Supply Co. (Overseas) Ltd. (ADSCO): London, UK, 1951. [Google Scholar]
- e-Messara. Messara: Rice Cultivation in Petrokefali over Time. Available online: https://e-mesara.gr/mesara-ryzokalliergeia-sto-petrokefali-sto-perasma-toy-chronoy/ (accessed on 5 March 2024). (In Greek).
- Cretan Magazine. The Old Watermills of Messara (Part A). Available online: https://www.cretanmagazine.gr/i-palii-neromyli-tis-mesaras-meros-a/ (accessed on 30 November 2024). (In Greek).
- Cretan Magazine. The Old Watermills of Messara (Part B). Available online: https://www.cretanmagazine.gr/i-palii-neromyli-tis-mesaras-meros-v/ (accessed on 30 November 2024). (In Greek).
- Hellenic Agricultural Organization (ELGO)—DIMITRA. School of Rural Education, Heraklion Prefecture—Agricultural School of Messara. Available online: https://www.elgo.gr/index.php?option=com_content&view=article&id=3110:diek-p-e-irakleiou-me-eidikotita-tis-thermokipiakes-kataskeves-kai-kalliergeies&catid=294&Itemid=2399 (accessed on 3 December 2024). (In Greek).
- Aronis, G. General Hydrological Survey of the Island of Crete (Includes Geological Map of Crete, Scale 1:500,000); Institute for Geology and Subsurface Research (IGSR): Athens, Greece, 1949. [Google Scholar]
- National Printing Office. On Land Improvement Projects. Royal Greek Government Gazette; Royal Decree 3881/30 October 1958, Issue 181, 30 October 1958; National Printing Office: Athens, Greece, 1958. (In Greek) [Google Scholar]
- National Printing Office. On the Organization, Structure, Responsibilities, etc. of the Regional Land Improvement Service. Greek Government Gazette; Royal Decree. 13 September 1959, Issue 220A, 12 October 1959; National Printing Office: Athens, Greece, 1959. (In Greek) [Google Scholar]
- Local Land Reclamation Organization of Messara—Zone A’. Official Website. Available online: http://www.toebazoni.gr/ (accessed on 30 November 2024). (In Greek).
- Ministry of Environment and Energy. Special Secretariat for Water. 1st Revision of the River Basins Management Plan of the Water District of Crete (EL13), Interim Phase 2: Deliverable 14—Study of the Design and Organization of the Consultation and Recording of Social Partners; December 2016. Available online: https://wfdver.ypeka.gr/wp-content/uploads/2017/05/EL13_1REV_P14_Organosi_Diavouleusis_v01.pdf#page=4.45 (accessed on 5 December 2024). (In Greek).
- Ministry of Environment and Energy. General Secretariat for Water. 2nd Revision of the River Basin Management Plan of the Water District of Crete (EL13); 28 May 2024. Available online: https://wfdver.ypeka.gr/wp-content/uploads/2024/07/EL13_2REV_sdlap.pdf#page=71.08 (accessed on 5 July 2024). (In Greek).
- Ministry of Environment and Energy. General Secretariat for Water. River Basin Management Plans (as Defined in Article 13 and Annex VII of Directive 2000/60/EC and Article 10 and Annex VII of Presidential Decree 51/2007). Available online: https://wfdver.ypeka.gr/en/management-plans-en/approved-management-plans-en (accessed on 5 July 2024).
- Water Directorate of Crete. Decentralized Administration of Crete. Monitoring–Protection of Water Resources. Available online: https://www.apdkritis.gov.gr/el/Παρακολούθηση-Προστασία-Υδατικών-Πόρων (accessed on 3 May 2024).
- Re, R. Study of Water Resources and their Exploitation for Irrigation in Eastern Crete, Greece/Evaporation in Southern Crete. Technical Note No 4 (Provisional Document) (FAO/SF: 166/GRE); Food and Agriculture Organization of the United Nations (FAO): Iraklion, Greece, 1969. [Google Scholar]
- Del Brassinne, J. Study of Water Resources and Their Exploitation for Irrigation in Eastern Crete, Greece/Estimation des Besoins en eau des Cultures en Messara. Technical Note No 6 (Provisional Document) (FAO/SF: 166/GRE); Food and Agriculture Organization of the United Nations (FAO): Iraklion, Greece, 1969. [Google Scholar]
- Underhill, H.V.; Schenkeveld, M.M.; Goodwill, I.M. Study of Water Resources and Their Exploitation for Irrigation in Eastern Crete, Greece/Trials of Mathematical Watershed Model for Runoff Simulation. Technical Note No 10 (Provisional Document) (FAO/SF: 166/GRE); Food and Agriculture Organization of the United Nations (FAO): Iraklion, Greece, 1970. [Google Scholar]
- Underhill, H.V.; Schenkeveld, M.M.; Goodwill, I.M. Study of Water Resources and Their Exploitation for Irrigation in Eastern Crete, Greece/Hydrology and Water Balances of the Messara Plain. Technical Note No 11 (Provisional Document) (FAO/SF: 166/GRE); Food and Agriculture Organization of the United Nations (FAO): Iraklion, Greece, 1970. [Google Scholar]
- Dietrich, G. Study of Water Resources and Their Exploitation for Irrigation in Eastern Crete, Greece/Hydrogeology of Western Messara. Technical Note No 13 (Provisional Document) (FAO/SF: 166/GRE); Food and Agriculture Organization of the United Nations (FAO): Iraklion, Greece, 1970. [Google Scholar]
- Underhill, H.V. Study of Water Resources and Their Exploitation for Irrigation in Eastern Crete, Greece/Hydrology and Water Balances of the Messara Plain. Technical Note No 13 (Pro-visional Document) (FAO/SF: 166/GRE); Food and Agriculture Organization of the United Nations (FAO): Iraklion, Greece, 1970. [Google Scholar]
- Dietrich, G.; Kilakos, J. Groundwater Quality in the Messara Plain in Eastern Crete, Greece. Working Document No. 18 (FAO/SF: 17/GRE); Food and Agriculture Organization of the United Nations (FAO): Iraklion, Greece, 1971. [Google Scholar]
- Samuelsson, B. Study of Water Resources and Their Exploitation for Irrigation in Eastern Crete, Greece/Hydrology and Water Balances of the Messara Plain. Working Document, No 34 (FAO/AGL/SF: 31/GRE); Food and Agriculture Organization of the United Nations (FAO): Iraklion, Greece, 1971. [Google Scholar]
- Chatziagorakis, D. Study of Water Resources and Their Exploitation for Irrigation in Eastern Crete, Greece/Geometric and Hydraulic Characteristics of the Aquifers in the Western Messara. Technical Note No 104/Supplement to Technical Note No 101 (Provisional Document) (FAO/AGL/SF: 17/GRE); Food and Agriculture Organization of the United Nations (FAO): Iraklion, Greece, 1971. [Google Scholar]
- Brenzik, M.; Chatziagorakis, D. Study of Water Resources and Their Exploitation for Irrigation in Eastern Crete, Greece/Geometric and Hydraulic Characteristics of the Aquifers in the Western Messara. Technical Note No 101, Volume 1—Text (Provisional Document) (FAO/AGL/SF: 17/31/GRE); Food and Agriculture Organization of the United Nations (FAO): Iraklion, Greece, 1971. [Google Scholar]
- Brenzik, M.; Chatziagorakis, D. Study of Water Resources and Their Exploitation for Irrigation in Eastern Crete, Greece/Geometric and Hydraulic Characteristics of the Aquifers in the Western Messara. Technical Note No 101, Volume 2—Graphs (Provisional Document) (FAO/AGL/SF: 17/31/GRE); Food and Agriculture Organization of the United Nations (FAO): Iraklion, Greece, 1971. [Google Scholar]
- Brenzik, M.; Chatziagorakis, D. Study of Water Resources and Their Exploitation for Irrigation in Eastern Crete, Greece/Geometric and Hydraulic Characteristics of the Aquifers in the Eastern Messara. Technical Note No 102, Volume 1—Text (Provisional Document) (FAO/AGL/SF: 17/GRE); Food and Agriculture Organization of the United Nations (FAO): Iraklion, Greece, 1971. [Google Scholar]
- Ridder, N.A.; Dietrich, G. Study of Water Resources and Their Exploitation for Irrigation in Eastern Crete, Greece/Drillings and Pumping Tests in the Messara. Working Document, No 26 (FAO/AGL/SF: 31/GRE); Food and Agriculture Organization of the United Nations (FAO): Iraklion, Greece, 1972. [Google Scholar]
- Dietrich, G. Study of Water Resources and Their Exploitation for Irrigation in Eastern Crete, Greece/Hydrogeology of Eastern Messara. Working Document, No 37 (FAO/AGL/SF: 31/GRE); Food and Agriculture Organization of the United Nations (FAO): Iraklion, Greece, 1972. [Google Scholar]
- Michalakis, I.; Tsolaki, E. Water Wells in Crete: Distribution by Municipality, Use, and Ownership—Results of a Systematic Inventory in Greece; Bulletin of the Geological Society of Greece, Special Publication Vol. H; Extended Abstract 209; Geological Society of Greece: Athens, Greece, 2025; pp. 981–986. [Google Scholar]
- Water Directorate of Crete. Drought of the Current Hydrological Year—Proposed Water Scarcity Measures; Decentralized Administration of Crete: Crete, Greece, 2024. Available online: https://apdkritis.gov.gr/el/node/4951 (accessed on 3 May 2024).
- Michalakis, I. Hydrogeological Conditions and Sustainability Challenges in the Messara Basin, Crete. In Proceedings of the 10th International Symposium on Sustainable Mineral Processing (SIPS 2024), Crete, Greece, 20–24 October 2024; p. 493. [Google Scholar]
- Institute of Geology and Mineral Exploration (IGME). Recording and Evaluation of the Hydrogeological Characteristics of the Groundwater and Aquifer Systems of Greece. Water District EL13; IGME: Rethymno, Greece, 2009. (In Greek) [Google Scholar]
- Hellenic Survey of Geology and Mineral Exploration (HSGME). Groundwater Monitoring Network of Greece. Available online: https://gaia.igme.gr/portal/apps/dashboards/ae94b7fa2a504a6ab171b96657f46c35 (accessed on 14 January 2025).
- Voudouris, K.; Mavromatis, T.; Krinis, P. Assessing runoff in future climate conditions in Messara valley in Crete with a rainfall-runoff model. Meteorol. Appl. 2013, 20, 182–190. [Google Scholar] [CrossRef]
- Varouchakis, E.A. Spatiotemporal Geostatistical Modelling of Groundwater Level Variations at Basin Scale. Hydrol. Res. 2018, 49, 1131–1142. [Google Scholar] [CrossRef]
- Varouchakis, E.A.; Kalaitzaki, E.; Trichakis, I.; Corzo Perez, G.A.; Karatzas, G.P. An Integrated Method to Study and Plan Aquifer Recharge. Hydrol. Res. 2023, 54, 1–13. [Google Scholar] [CrossRef]
- Croke, B.; Cleridou, N.; Kolovos, A.; Vardavas, I.; Papamastorakis, J. Water Resources in the Desertification-Threatened Messara Valley of Crete: Estimation of the Annual Water Budget Using a Rainfall–Runoff Model. Environ. Model. Softw. 2000, 15, 387–402. [Google Scholar] [CrossRef]
- Vardavas, I.M.; Papamastorakis, J.; Fountoulakis, A.; Manousakis, M. Water Resources in the Desertification-Threatened Messara Valley of Crete: Estimation of Potential Lake Evaporation. Ecol. Model. 1997, 102, 363–374. [Google Scholar] [CrossRef]
- Kritsotakis, M. Water Resources Management in Mesara Valley of Crete. Ph.D. Thesis, Technical University of Crete, Chania, Greece, 2010. (In Greek). [Google Scholar]
- Kritsotakis, M.; Tsanis, I. An Integrated Approach for Sustainable Water Resources Management of Messara Basin, Crete, Greece. Eur. Water 2009, 27–28, 15–30. [Google Scholar]
- Pipatpan, S.; Blindow, N. Geophysical Saltwater-Intrusion Mapping in Timbaki, Crete: Selection and Application of Geophysical Methods for Aquifer Characterization and Detection of Saline Intrusions; Institute for Geophysics, Westfälische Wilhelms-Universität Münster: Münster, Germany, 2005. [Google Scholar]
- Paritsis, S.N. Simulation of Seawater Intrusion into the Tymbaki Aquifer, South Central Crete, Greece; Department of Management of Water Resources of the Region of Crete: Heraklion, Greece, 2005. [Google Scholar]
- Zacharioudakis, G.; Paramastorakis, D. Conceptual Model and Model Idealisation Report of Tymbaki Basin in South Crete; Office for Official Publications of the European Communities: Luxembourg, 2005. [Google Scholar]
- Zacharioudakis, G.; Paramastorakis, D. Tymbaki Basin Transient Groundwater Flow Model Design and Calibration; Report within MEDIS Project: Towards Sustainable Water Use on Mediterranean Islands. European Commission Contract No. EVK1-CT-2001-00092; European Commission: Brussels, Belgium, 2005.
- Hellenic National Meteorological Service (HNMS). HNMS Stations Network (Official Website). Available online: https://emy.gr/en/hnms-stations (accessed on 15 February 2025).
- Hellenic National Meteorological Service (HNMS). Climate Atlas of Greece (Official Website). Available online: http://climatlas.hnms.gr/sdi/ (accessed on 15 February 2025).
- CORINE Land Cover. Available online: https://land.copernicus.eu/en/products/corine-land-cover (accessed on 12 February 2025).
- CORINE Land Cover 1990 (vector), Europe, 6-yearly—Version 2020_20u1, May 2020 (CLC1990). Available online: https://doi.org/10.2909/5c1f2e03-fcba-47b1-afeb-bc05a47bada0 (accessed on 12 February 2025).
- CORINE Land Cover 2000 (vector), Europe, 6-yearly—Version 2020_20u1, May 2020 (CLC2000). Available online: https://doi.org/10.2909/8b85b479-6afb-42c6-817c-11d1a5260b83 (accessed on 12 February 2025).
- CORINE Land Cover 2006 (vector), Europe, 6-yearly—Version 2020_20u1, May 2020 (CLC2006). Available online: https://doi.org/10.2909/93eede6e-c196-40e3-9253-7f2237b49de1 (accessed on 12 February 2025).
- CORINE Land Cover 2012 (vector), Europe, 6-yearly—Version 2020_20u1, May 2020 (CLC2012). Available online: https://doi.org/10.2909/916c0ee7-9711-4996-9876-95ea45ce1d27 (accessed on 12 February 2025).
- CORINE Land Cover 2018 (vector), Europe, 6-yearly—Version 2020_20u1, May 2020 (CLC2018). Available online: https://doi.org/10.2909/71c95a07-e296-44fc-b22b-415f42acfdf0 (accessed on 12 February 2025).
- Hellenic Statistical Authority (ELSTAT). Agricultural Census 2000, 2009, 2020; Dataset Request ID: 49,101/12-03-2025. Available online: https://www.statistics.gr/en/statistics/-/publication/SPG31/2020 (accessed on 14 March 2025).
- Institute of Geology and Mineral Exploration (IGME). Geological Map of Greece, Melambes Sheet, 1st ed.; Scale 1:50,000; IGME: Athens, Greece, 1985. [Google Scholar]
- Institute of Geology and Mineral Exploration (IGME). Geological Map of Greece, Timbakion Sheet, 1st ed.; Scale 1:50,000; IGME: Athens, Greece, 1984. [Google Scholar]
- Institute of Geology and Mineral Exploration (IGME). Geological Map of Greece, Antiskarion Sheet, 1st ed.; Scale 1:50,000; IGME: Athens, Greece, 1985. [Google Scholar]
- Institute of Geology and Mineral Exploration (IGME). Geological Map of Greece, Epano Archanae Sheet, 1st ed.; Scale 1:50,000; IGME: Athens, Greece, 1994. [Google Scholar]
- Institute of Geology and Mineral Exploration (IGME). Geological Map of Greece, Akhendhrias Sheet, 1st ed.; Scale 1:50,000; IGME: Athens, Greece, 1984. [Google Scholar]
- Institute of Geology and Mineral Exploration (IGME). Geological Map of Greece, Mochos Sheet, 1st ed.; Scale 1:50,000; IGME: Athens, Greece, 1989. [Google Scholar]
- Institute of Geology and Mineral Exploration (IGME). Geological Map of Greece, Ano Viannos Sheet, 1st ed.; Scale 1:50,000; IGME: Athens, Greece, 2002. [Google Scholar]
- Hellenic Survey of Geology and Mineral Exploration (HSGME). Geological Map of Greece, Melambes Sheet, 2nd ed.; Scale 1:50,000; HSGME: Acharnes, Greece, 2023. [Google Scholar]
- Hellenic Survey of Geology and Mineral Exploration (HSGME). Geological Map of Greece, Tymbakion Sheet, 2nd ed.; Scale 1:50,000; HSGME: Acharnes, Greece, 2023. [Google Scholar]
- Hellenic Survey of Geology and Mineral Exploration (HSGME). Geological Map of Greece, Antiskarion Sheet, 2nd ed.; Scale 1:50,000; HSGME: Acharnes, Greece, 2023. [Google Scholar]
- Hellenic Survey of Geology and Mineral Exploration (HSGME). Geological Map of Greece, Epano Archanae Sheet, 2nd ed.; Scale 1:50,000; HSGME: Acharnes, Greece, 2023. [Google Scholar]
- Hellenic Survey of Geology and Mineral Exploration (HSGME). Geological Map of Greece, Achentrias Sheet, 2nd ed.; Scale 1:50,000; HSGME: Acharnes, Greece, 2023. [Google Scholar]
- Hellenic Survey of Geology and Mineral Exploration (HSGME). Geological Map of Greece, Mochos Sheet, 2nd ed.; Scale 1:50,000; HSGME: Acharnes, Greece, 2023. [Google Scholar]
- Hellenic Survey of Geology and Mineral Exploration (HSGME). Geological Map of Greece, Ano Viannos Sheet, 2nd ed.; Scale 1:50,000; HSGME: Acharnes, Greece, 2023. [Google Scholar]
- Water Directorate of Crete. Datasets; Decentralized Administration of Crete: Irakleion, Greece. Available online: https://data.apdkritis.gov.gr/search?s=&sort_by=changed&sort_order=DESC&f%5B0%5D=content_type%3Adataset (accessed on 27 January 2025).
- Hellenic Survey of Geology and Mineral Exploration (HSGME)/Regional Branch of Crete (RBC). Systematic Inventory of Water Wells of Every Use throughout the Country of Greece (2019–2023); Preliminary Technical Reports: Municipalities of Crete, Rethymno, Greece. Available online: https://eagme.gr/programs/bsamy-ii-b-systhmatikh-apografh-ydrogewtrhsewn-kathe-xrhshs-se-olh-thn (accessed on 4 December 2024).
- UNESCO. International Glossary of Hydrology; United Nations Educational, Scientific and Cultural Organization: Paris, France, 1992; p. 413. [Google Scholar]
- Kovalevsky, V.S.; Kruseman, G.P.; Rushton, K.R. Groundwater Studies: An International Guide for Hydrogeological Investigations; IHP-VI Series on Groundwater No. 3; UNESCO: Paris, France, 2004; ISBN 92-9220-005-4. [Google Scholar]


Disclaimer/Publisher’s Note: The statements, opinions and data contained in all publications are solely those of the individual author(s) and contributor(s) and not of MDPI and/or the editor(s). MDPI and/or the editor(s) disclaim responsibility for any injury to people or property resulting from any ideas, methods, instructions or products referred to in the content. |
© 2025 by the authors. Licensee MDPI, Basel, Switzerland. This article is an open access article distributed under the terms and conditions of the Creative Commons Attribution (CC BY) license (https://creativecommons.org/licenses/by/4.0/).