Abstract
This study investigates the scale-dependent alpha and beta diversity patterns in the subalpine grasslands of the Central Balkan Mountains following decades of reduced grazing. We examined two distinct vegetation patches: pure grasslands (N-type) and grasslands mixed with dwarf shrubs (V-type), focusing on coarse-scale (among stands) and fine-scale (within stands) heterogeneity. Using micro-quadrat transects and dissimilarity analyses, we assessed the species composition variability and spatial complexity of the two vegetation patches. The results showed that the N-type exhibited higher coarse-scale beta diversity, attributed to fluctuating dominant grass proportions, and lower fine-scale diversity due to competitive exclusion. Conversely, V-type vegetation displayed lower coarse-scale but higher fine-scale diversity, reflecting the heterogeneous spatial matrix created by dwarf-shrub encroachment. Fine-scale spatial complexity, quantified by the compositional diversity of dominants, strongly correlated with species richness and diversity. Two main conclusions emerged: (a) Grazing decline-driven succession toward grass–dwarf shrub mixtures enhanced local diversity while reducing landscape heterogeneity. Conversely, regeneration toward typical dominant grasses diminished local diversity but increased landscape heterogeneity. (b) A balanced fine-scale spatial mixture of dominant species was found to reduce their individual negative impact on other species’ diversity. Effective high-mountain pasture management requires the consideration of scale and local plant co-existence.
1. Introduction
Semi-natural subalpine grasslands are valuable ecological systems, harboring rich taxonomic diversity and serving as important agricultural resources for breeding herbivores [1]. Many ecologists recognize grazing intensity as a key factor influencing vegetation composition and the structure of the semi-natural grassland communities in the mountain ranges of Europe [2,3,4,5,6,7,8,9,10,11]. Excessive grazing pressure, including overgrazing and trampling [12], leads to severe disturbance, resulting in grassland degradation characterized by soil compaction, erosion [13], and monodominance [14]. Conversely, the widespread abandonment of European mountain pastures often promotes woody plant encroachment [1,15], which is typically linked to reduced biodiversity [6,8]. A comprehensive understanding of the natural processes in mountain grasslands, including regional specificities, is essential for implementing effective restoration measures.
Several studies emphasize the prevalence of grasses due to long-term grazing, particularly the quantitative share of Nardus stricta L. as an indicator of pasture management quality [1,7,16,17,18,19]. Generally, an abundance of Nardus stricta exceeding 75% is regarded as a final stage of degradation due to overgrazing, while a decrease in its abundance in favor of other grasses indicates regeneration following a reduction in grazing. The decrease or cessation of grazing often results in shrub encroachment, which many researchers [1,3,14,20] view as a natural step in secondary succession leading to the dominance of woody species. There is insufficient knowledge regarding the interaction of these two phenomena, especially regarding how initial diversity and composition affect transitional processes in grasslands. Myster and Pickett [21] emphasize that the initial state of vegetation—whether of good quality (a mixture of desirable fodder species) or degraded (characterized by a high abundance of mat grass)—has a significant influence on the compositional changes accompanying succession.
Given the global trend of declining grazing, the direction of vegetation transformation and its impact on biodiversity will become increasingly important issues. Palaj et al. [22] report that the most common transition is toward a mosaic landscape with patches of grasslands and dwarf shrubs at various spatial scales. However, studies examining diversity patterns in shrub succession mediated by grazing have reached different conclusions. Trindade et al. [23] observed a reduction in the overall species richness with an increase in woody plants’ abundance. Klinkovská et al. [24] reported a transition of species-rich grasslands to heathlands or tall-forb vegetation, accompanied by the loss of plant diversity. While transformations in vegetation cover are well documented across European mountain regions, previous studies [24,25,26,27] have primarily focused on landscape-scale processes driven by broad environmental and land-use factors. Little attention has been paid to the effect of scale on patch organization and the fine-scale changes through which large-scale transformations take place [28].
The Central Balkan Mountains serve as a case study for examining the effects of extreme land-use changes on different trajectories of vegetation dynamics. This dynamic land-use history has resulted in vegetation developing as a patchwork of transitional communities. Existing research [29] delineates pure grasslands (N-type) and a mixture of grass and dwarf shrub vegetation (V-type) within the studied landscape, according to species and trait composition. In line with the established knowledge on succession after the abandonment of semi-natural mountain grasslands [22,24,26,27], these vegetation patches are interpreted as products of land-use-mediated vegetation dynamics. The current study focuses on species composition dissimilarities within each vegetation type to explore their coarse-scale and fine-scale alpha and beta diversity.
In general, beta diversity represents the degree of compositional distinctiveness among communities (or sample units) along environmental gradients or within a system of vegetation patches [30,31,32]. In this study, we investigated the beta diversity of the patch mosaic in subalpine pastures at two spatial scales: coarse scale (regional heterogeneity) and fine scale (local heterogeneity).
To identify ecologically relevant processes, we considered spatial scale in terms of both extent and grain size [33]. Spatial grain in vegetation surveys generally corresponds to the sample plot size, while spatial extent refers to the area where the sample plots are distributed. A small number of highly abundant and competitive plant species can significantly influence community structure. These species, referred to as dominants [34], shape stand structure, microclimate, and plant litter, thereby creating a distinct vegetation matrix that serves as a microhabitat for subordinate species [35,36,37]. The fine-scale diversity and heterogeneity were assessed through an innovative approach founded on the microcoenology concept [38,39].
We aimed to demonstrate and interpret the changes in the spatial patterns of a poor, mono-dominated vegetation when subjected to spontaneous recovery and succession due to decreased grazing. Specifically, this study examines (i) the scale-dependent (regional and local) patterns of alpha and beta diversity in two differentiated vegetation patches in the dynamics of subalpine grasslands after reduced grazing and (ii) the role of fine-scale spatial complexity, mediated by dominant species heterogeneity, in shaping diversity.
2. Materials and Methods
2.1. Study Area
The research area was situated within the Central Balkan National Park (Protected Area II category) (42°46′ N; 24°38′ E). The study sites were located in the treeless zone, at elevations between 1560 and 1700 m above sea level, on the slightly acidic and clay-rich Umbric Leptosols, which lie over intrusive rocks. The climate in this area is characterized by cold winters and cool summers, with an average annual temperature of 7.5 °C and monthly averages ranging from −8 °C in winter to 10°C in summer. The long-term average annual rainfall is 1139 mm, and there is significant snow cover lasting about 142 days, with an average depth of approximately 41 cm, along with strong winds averaging 5 m/s [40].
An analysis of the plant species and their functional traits in the study area in a previous study [29] identified two vegetation types: The first vegetation type (termed N-type) was characterized by subalpine mat-grass swards corresponding to the Potentillo ternatae–Nardion strictae alliance, while the second group (termed V-type) consisted of a mosaic of grass swards and Vaccinium L. spp., which correspond to the Bruckenthalion spiculifoliae alliance. Functionally, the V-type species were taller, grew more slowly, and had thicker, more lignified leaves compared to the N-type species. Both groups illustrate states in subalpine pasture recovery following different grazing intensities.
The study region has experienced centuries of intensive grazing, followed by a gradual and stepwise decline in livestock numbers [25] and a current increase in the grazing pressure resulting from the implementation of the Common Agricultural Policy in Bulgaria [41]. Overgrazing had been a significant issue in the area, with transhumant nomadic groups grazing around 160,000 sheep over a period of 500 years until the 1940s [25]. This heavy exploitation led to extensive mat grass swards at higher elevations and a decline in dwarf shrubs and junipers [14]. Following political and economic changes after 1944, grazing intensity decreased, with a notable 80% reduction in livestock between 1983 and 2007 [26]. According to data from the National Park Directorate, the number of sheep grazing in the park decreased from 20,978 to 12,869 between 2012 and 2023.
2.2. Field Sampling Design
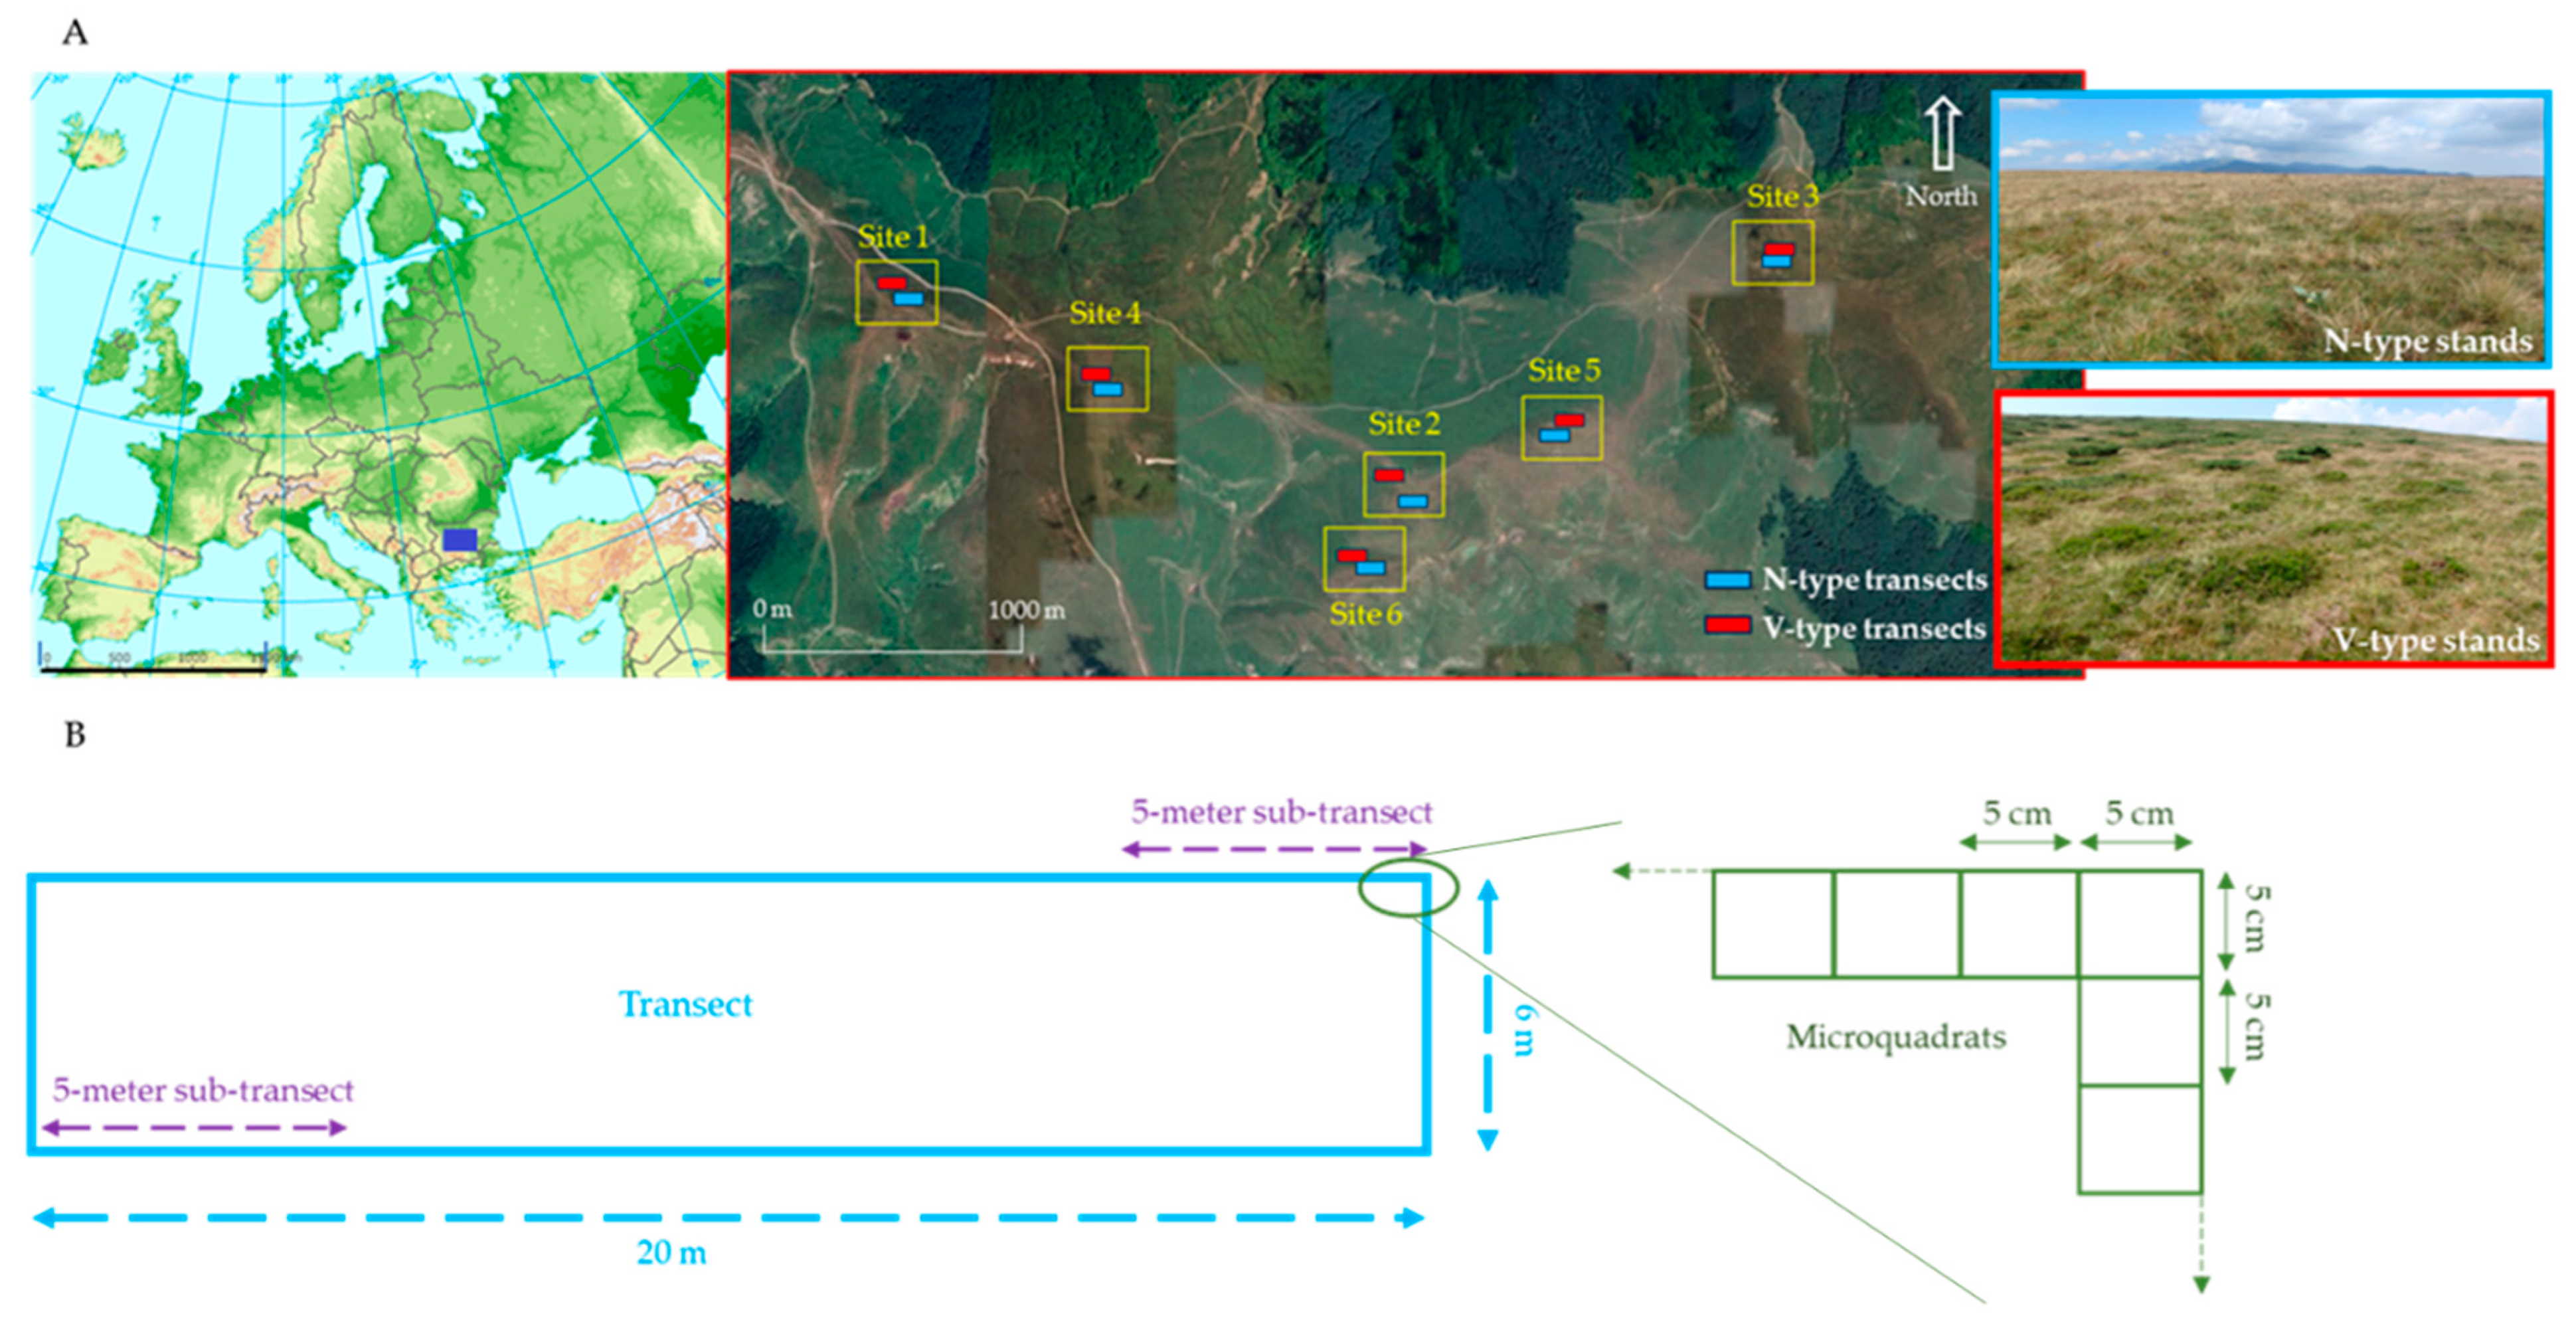
We established six study sites spanning 4.5 km of the ride along an east–west direction (Figure 1A). All sites followed a uniform ridgeline, and they expressed a similar elevation range, parent geology, slope, aspect, and soil depth. At each site, a pair of adjacent stands (distance varied between 20 m and 100 m) of V- and N-vegetation types were established (Figure 1B). The proximity of the two stands aimed to maximize the site level environmental homogeneity in terms of similar abiotic conditions and grazing availability, as was also carried out by Prevosto et al. [42] and Terziyska et al. [29]. To account for expected minor environmental variations among the sampling sites, we employed a Generalized Linear Model (GLM) to evaluate the potential effects of altitude, slope, aspect, and maximum soil depth on diversity. The complete analysis and results are detailed in the Supplementary Material, ensuring a concise main text.
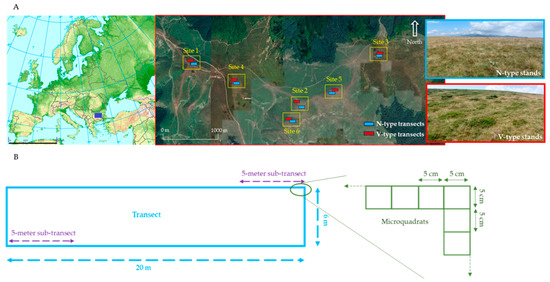
Figure 1.
(A) A map of the study area in the Central Balkan Mountains, Bulgaria, illustrating its location within Europe and the paired transect design. The insets show photographic examples of vegetation types N and V. The European map is adapted from the European Environmental Agency’s map of Major mountain ranges of Europe (1500 km scale). The study site map was generated using Google Earth (1000 m scale). (B) A schematic diagram of a transect, composed of 1040 contiguous 5 × 5 cm micro-quadrats.
We selected our sites carefully so that they visually correspond to the same situation within the grazing history of the vegetation dynamics. Signs of the results of (1) past excessive exploitation, (e.g., high abundance of N. stricta, moderate abundance of dwarf shrubs, missing or scarce juniper individuals) and (2) current intermediate grazing intensity, (e.g., freshly grazed swards, droppings, and actual presence of animals) were easily recognized in all 6 sites. So, we can reasonably accept these six sites as replicates (as far as the uncontrolled conditions allow).
2.3. Vegetation Data
Within each vegetation type in a visibly homogenous area, we established one rectangular 52 m long transect (20 m × 6 m). The transect was represented by a rope marked at 5 cm intervals to delineate micro-quadrats with the aid of additional sticks. We followed standardized field sampling techniques [43,44,45] and collected species presence data using basic units of 0.05 × 0.05 m (henceforth, referred to as micro-quadrats).
We recorded all species rooted in every micro-quadrat along the rectangular transect, providing a precise estimate of the patterns of local species co-existence. The small size and the large number of micro-quadrats ensure the precise assessment of species frequencies and provide detailed information on the fine-scale spatial distribution of plants. Species frequency data were used as estimates of species abundance. This sampling method facilitated the creation of secondary sampling units of varying sizes by digitally combining 2, 3, 4…n micro-quadrats.
We used whole transects as samples for calculating coarse-scale alpha and beta diversity, resulting in six N-type and six V-type samples. Then, we extracted five 5 m long sub-transects from each transect as samples by merging 100 micro-quadrats to analyze local alpha and beta diversity. We chose the 5 m long sub-transect as a sample unit because it forms an elongated 0.25 m2 sampling plot (5 m × 0.05 m), a standard unit size in vegetation studies. This yielded 30 N-type and 30 V-type sub-transect samples. We assumed that our elongated sampling plots adhered to the established principle [46] that elongated and square plots produce comparable results.
Micro-quadrats within sub-transects served as the basic units for assessing the fine-scale heterogeneity of abundant species and spatial matrix complexity [38,44].
Field data were collected during the optimal growth period, July to August 2015. Plant species nomenclature followed the Euro + Med Plant Base (2006) [47].
2.4. Data Analysis
2.4.1. Scale-Dependent Alpha and Beta Diversity
To assess overall compositional diversity at coarse and at fine scales, we calculated traditionally used alpha diversity measures of species richness (number of species) and the Shannon index [48], calculated from species composition within each transect and sub-transect using the full species dataset. Shannon index accounts for species number and abundance, with greater sensitivity to rare species.
To evaluate coarse-scale (regional) beta diversity within each vegetation type, we performed pairwise comparisons of all corresponding transects using the Bray–Curtis dissimilarity measure, expressed as percentage dissimilarity [49]. To assess fine-scale (local) beta diversity, we calculated pairwise Bray–Curtis dissimilarity among all five sub-transects within each transect.
A paired t-test was then conducted to compare alpha and beta diversity between N-type and V-type vegetation at coarse and fine scales. Variables included species richness and Shannon index for alpha diversity, and Bray–Curtis dissimilarities among transects (coarse scale) and sub-transects (fine scale) for beta diversity. This test was appropriate for paired measurements of stands with (V-type) and without (N-type) dwarf shrubs at each site.
Pairwise dissimilarity and alpha diversity measures were calculated using PRIMER V.7 software [50], and statistical analysis and plotting were performed using SIGMAPLOT V.16 software [51].
2.4.2. Fine-Scale Heterogeneity of Dominant Species
As the most abundant species in the community determine its spatial structure and complexity [52], we identified species with relative abundances equal to or exceeding 10% in transects and sub-transects, hereafter referred to as dominants. This threshold aimed to differentiate the two vegetation types, revealing structural differences largely unaffected by subordinate species [36,53]. To examine the patterns of the spatial complexity created by the dominant species, we evaluated the within-stand heterogeneity created by the dominant species [54]. For this purpose, we calculated the max. Number of Realized Combinations (max. NRC) as a step toward determining the max. compositional diversity (max. CD) of abundant species within each sub-transect. These measures originate in the information theory models created by Juhasz-Nagy [38,39]. Max. NRC represents the total number of species combinations along the sub-transect and max. CD represents the variability of species combinations weighted by their abundances (frequency). CD was calculated as the Shannon index [48], but instead of species, we used species combinations as basic units. NRC can vary from one occurring combination, meaning zero compositional diversity, to all combinations being different, meaning an absolute maximum of local compositional diversity. Max. CD was obtained by calculating the CD across a range of plot sizes by computerized sampling, merging consecutive micro-quadrats (methodological details not presented here) [44].
By applying linear regression analysis, we explored the relationship between the number of abundant species and max. CD within sub-transects, as well as the dependence of alpha diversity (species richness and Shannon index) on max. CD.
We used the “comspat” function from the comspat R package to calculate the max. NRC and max. CD [55] and SigmaPLot V. 17 software for regression analysis and plotting [51].
3. Results
3.1. Regional (Coarse-Scale) Diversity and Species Abundances
We recorded a total of 72 vascular plant species for the study area, in which 53 plant species were identified as V-type and 33 plant species as N-type patches. Common for both vegetation types were 51 species. Specific to the grass patch were 5 species, and 16 were specific to the dwarf-shrub patch.
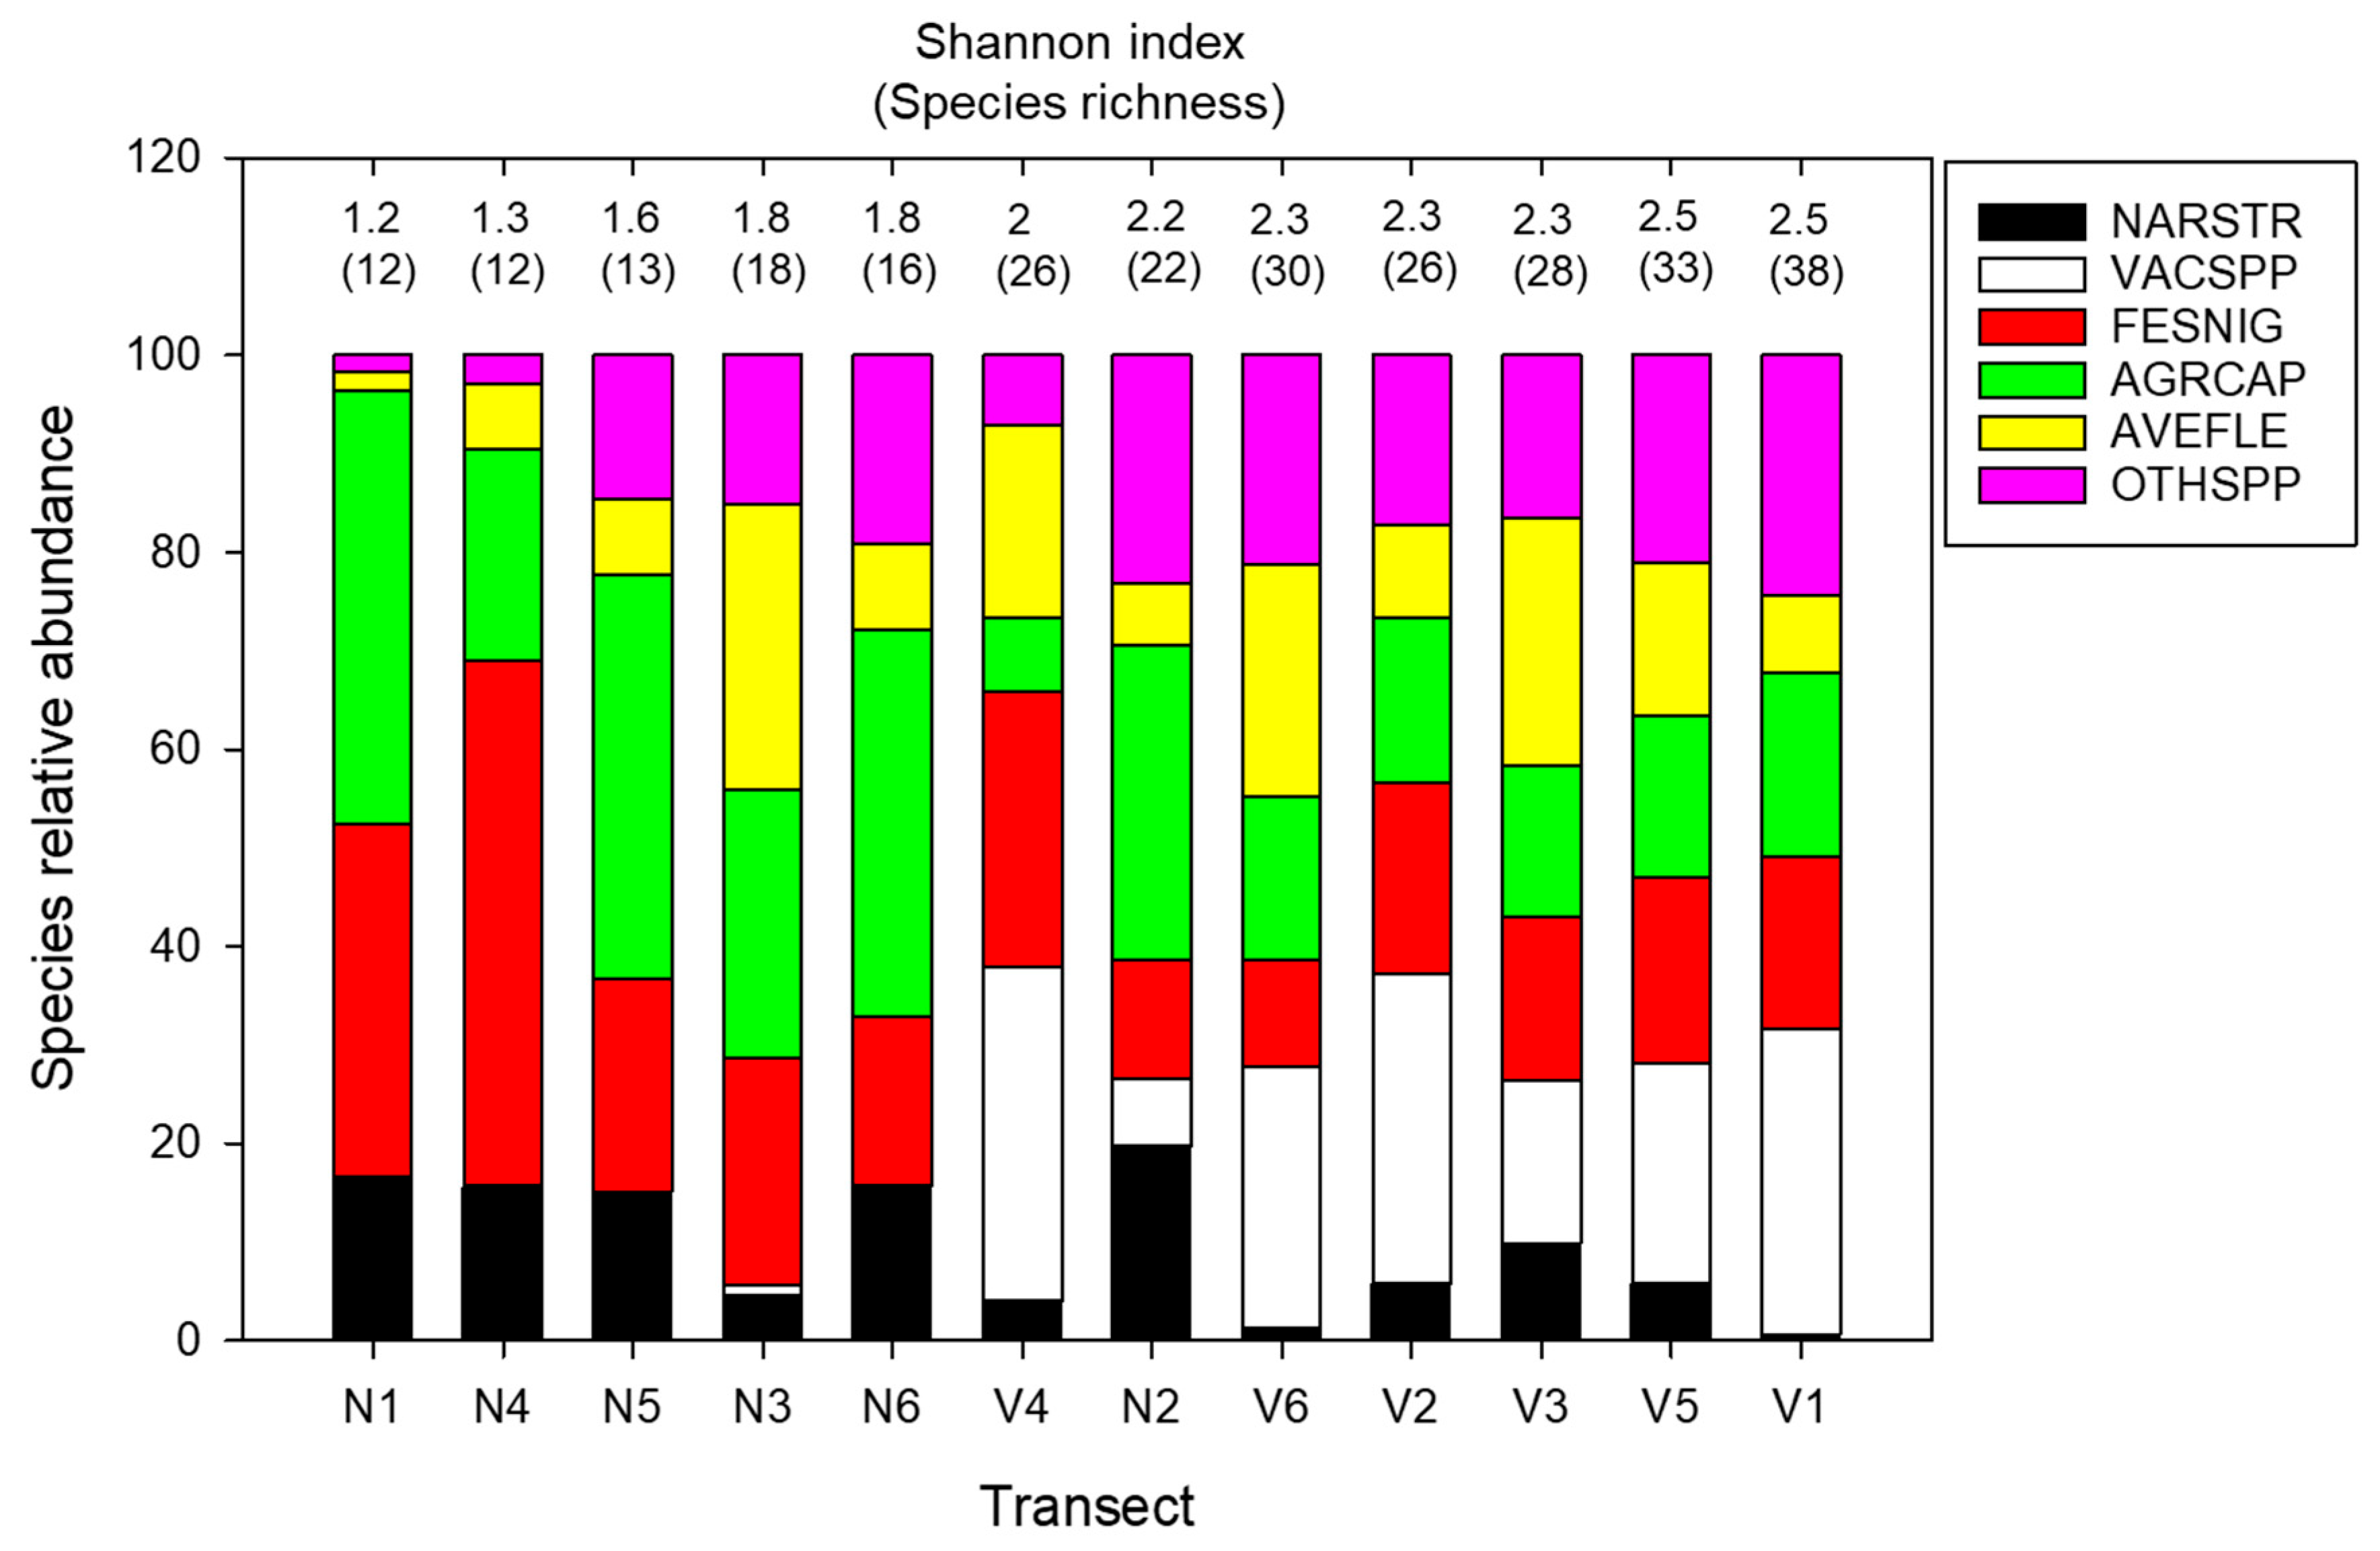
Dominants exhibited low diversity in both communities at the coarse scale (Figure 2). In N-type stands, the perennial grasses Agrostis capillaris L., Festuca nigrescens Lam., and Nardus stricta were the only species exceeding 10% abundance in all six transects, with F. nigrescens and A. capillaris being particularly prevalent. Avenella flexuosa (L.) Drejer also consistently surpassed the 10% abundance threshold. In V-type stands, A. capillaris, F. nigrescens, A. flexuosa, and the dwarf shrub Vaccinium myrtillus L. all exceeded 10% abundance in all six transects. While N. stricta was consistently present, its abundance was lower than F. nigrescens, A. capillaris, and A. flexuosa in V-type vegetation.
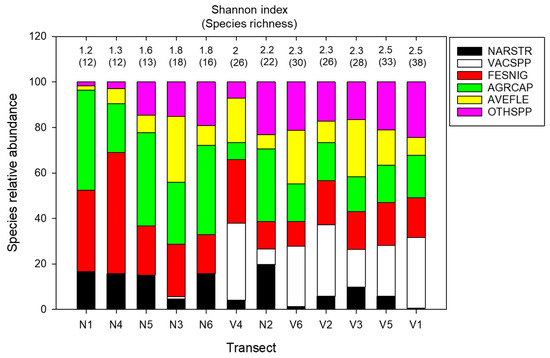
Figure 2.
The relative abundances of species and alpha diversity in each transect: N1–N6 and V1–V6 are the transects positioned in grass-type and mixed-type vegetation, respectively. Species with more than 10% abundance are plotted independently (NARSTR—N. stricta; VECSPP—Vaccinium spp; FESNIG—F. nigrescens; AGRCAP—A. capillaris; AVEFLE—A. flexuosa). The abundances of species below the 10% threshold are presented together as other species (OTHSPP). The transects are sorted in ascending order of increase in the Shannon index.
Generally, the proportion of graminoid species (A. capillaris, F. nigrescens, and N. stricta) was notably lower in V-type vegetation, while the abundance of other (subordinate) species increased. Shannon index and species richness (alpha diversity) were higher in V-type vegetation, coinciding with an increase in the number of dominants (due to the presence of Vaccinium species) and a decrease and equalization of the relative abundances of N. stricta, F. nigrescens, and A. capillaris (Figure 2).
3.2. Regional (Coarse-Scale) vs. Local (Fine-Scale) Beta Diversity
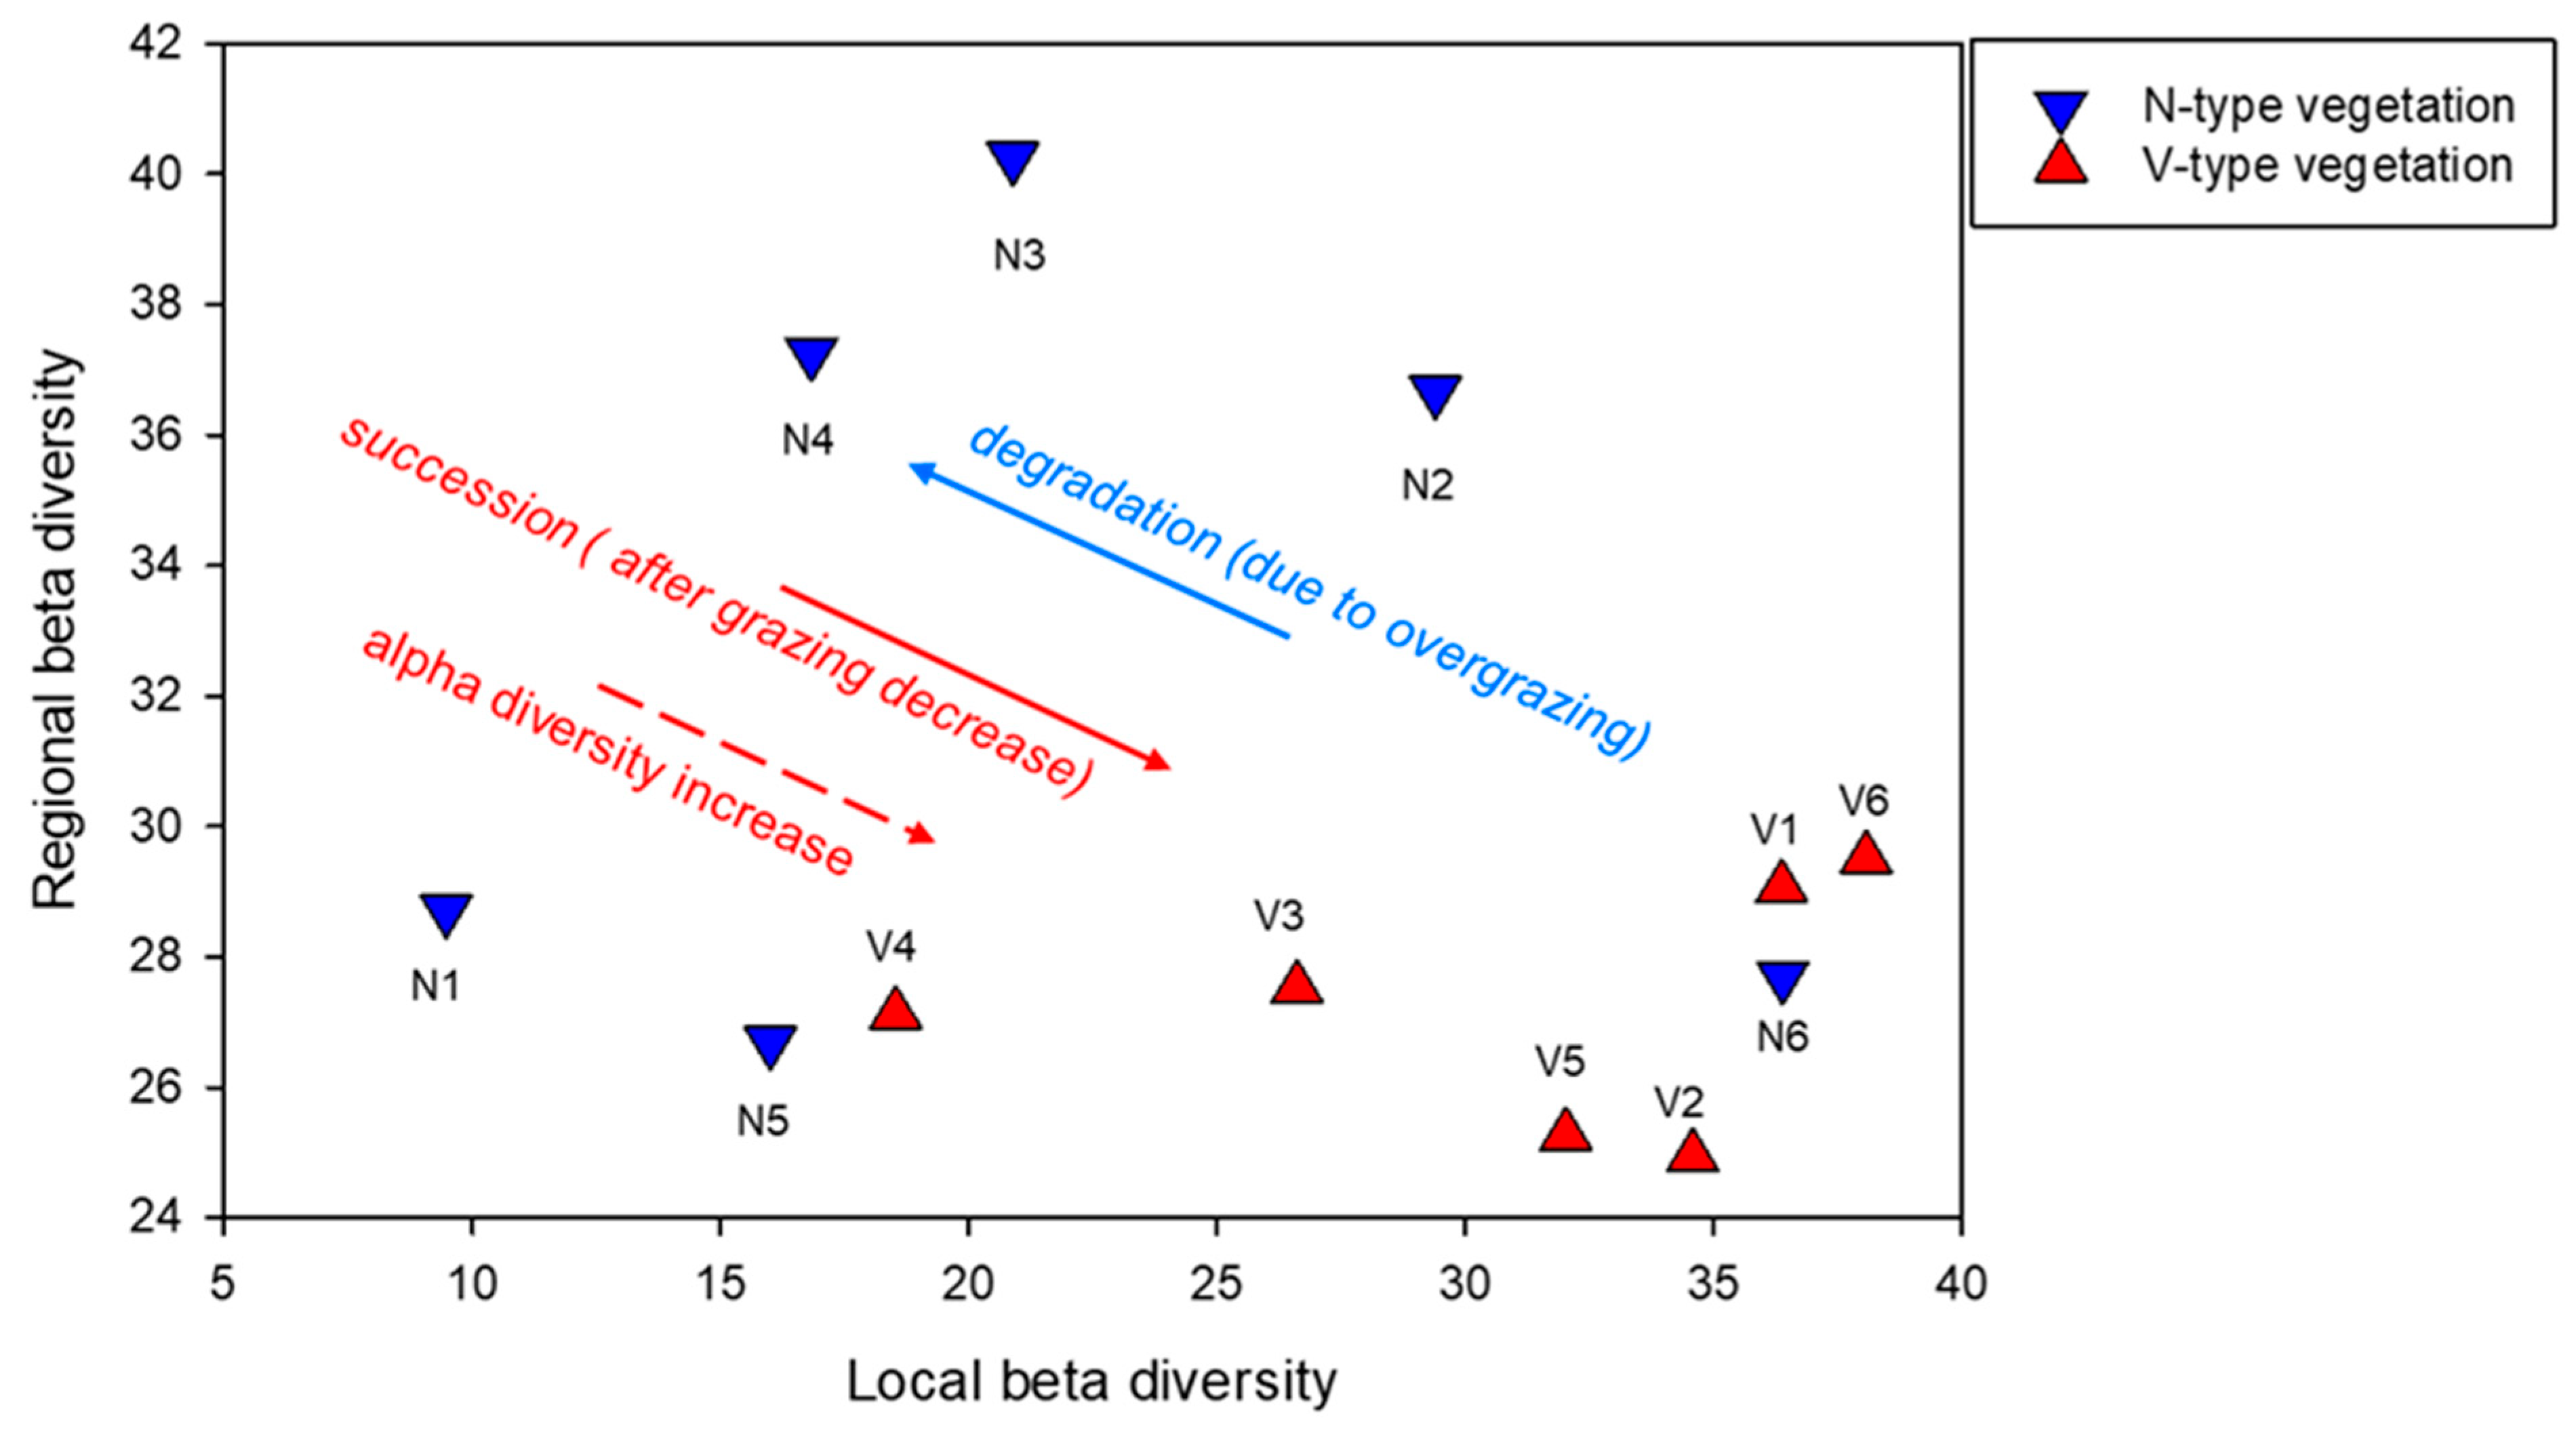
Paired t-tests comparing stands with dwarf shrubs (V-type) and stands without dwarf shrubs (N-type) at coarse and fine scales revealed significant differences in the Shannon index and the Bray–Curtis dissimilarity at the fine scale and in species richness at the coarse scale. Differences in Shannon index and Bray–Curtis dissimilarity at the coarse scale were marginally significant. Since the species richness data at the fine scale did not meet the assumptions of normality, a Wilcoxon Signed-Rank Test was conducted to compare the median species richness between the N-type and V-type vegetation. The results revealed significantly higher fine-scale species richness in the V-type vegetation (W = 420; N = 30; Z = 4.5; p < 0.001). Table 1 summarizes the descriptive statistics and paired t-test results, highlighting the differences and variation within N-type and V-type vegetation concerning alpha and beta diversity. The higher mean and the greater variability in Bray–Curtis dissimilarities among transects in N-type vegetation indicate higher coarse-scale dissimilarity, signifying greater regional beta diversity in N-type vegetation. Conversely, the significantly higher mean fine-scale dissimilarity in V-type vegetation compared to N-type indicates greater local beta diversity within V-type stands (Table 1, Figure 3). Figure 3 illustrates the trends in alpha and beta diversity across the transition from grassland to mixed vegetation.

Table 1.
The basic statistics of the estimated diversity characteristics (beta diversity and alpha diversity) in the two vegetation types (all species considered). Significant differences between vegetation types were evaluated by paired t-test, and all comparisons with a significant difference between the groups Coarse-scale N vs. Coarse-scale V and Fine-scale N vs. Fine-scale V, where p ≤ 0.001, are indicated in bold.
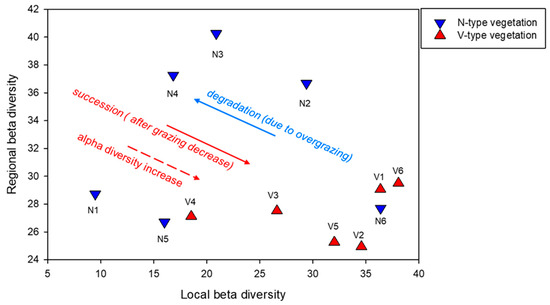
Figure 3.
A conceptual graph illustrating the link between scale-dependent beta diversity and vegetation dynamic, which is developed in the Discussion section. Regional beta diversity is calculated for each stand (N1–N6; V1–V6) as the average of all pairwise dissimilarities (%) between the respective transect and all other transects of the vegetation type. Local beta diversity is calculated for each stand as the average of all pairwise dissimilarities (%) between the sub-transects within the respective transect.
3.3. Dominants’ Heterogeneity and Diversity Dependence
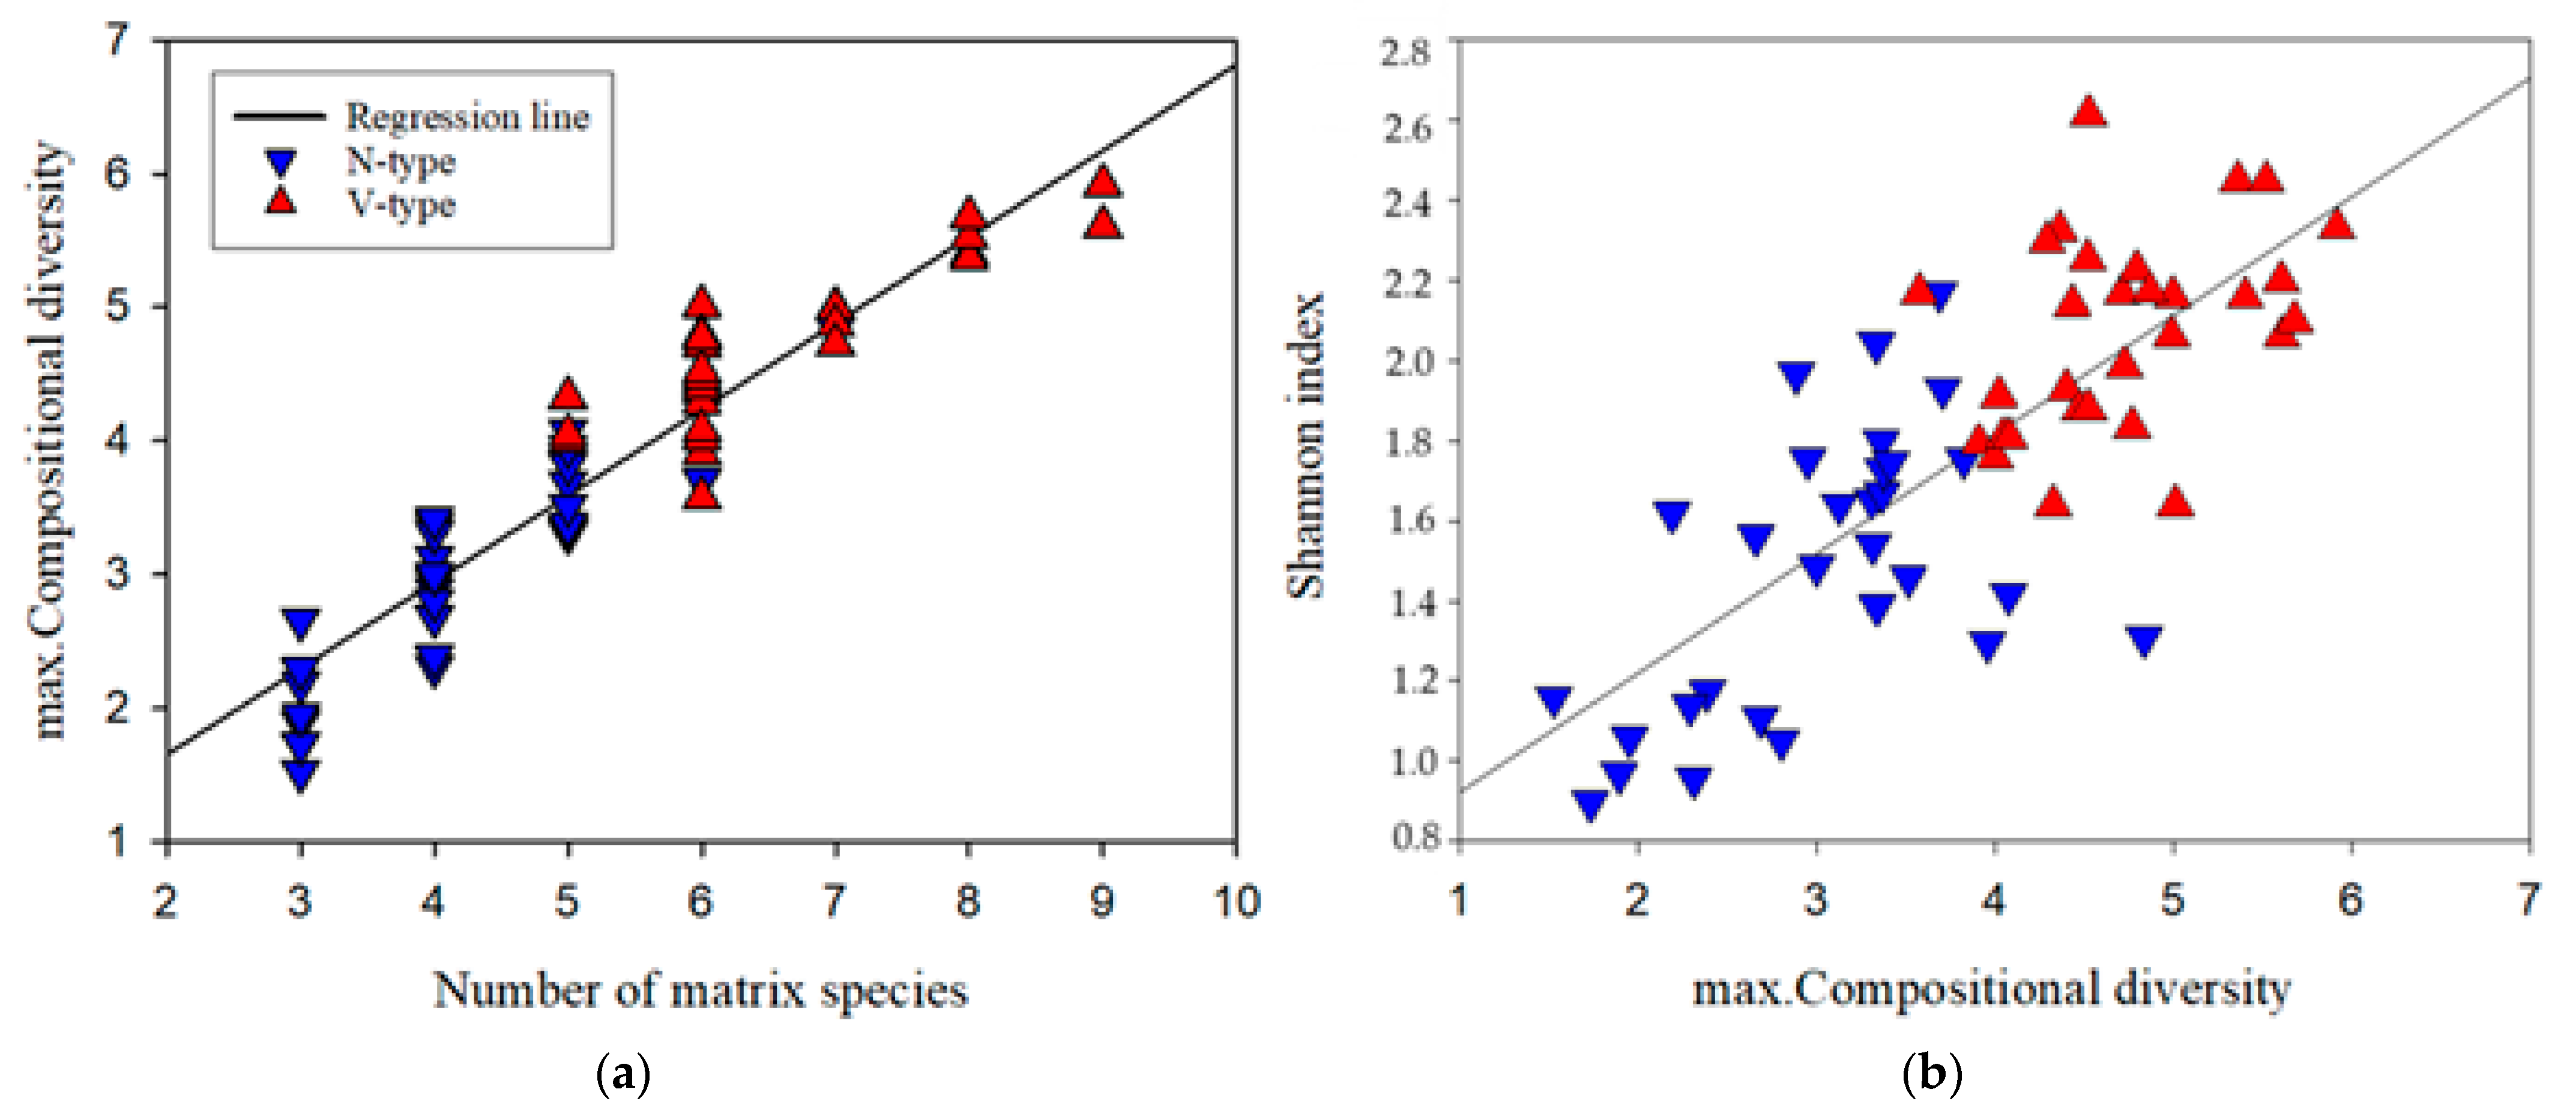
The number of dominants within sub-transects varied from 3 to 9 (Figure 4a). Spatial complexity, as measured by maximum compositional diversity (max. CD), showed a strong positive correlation with the number of dominants (R2 = 0.9, p < 0.001) and was generally higher in V-type vegetation. However, an overlap in max. CD values was observed between V-type and N-type sub-transects when the number of dominants was 5 or 6 (Figure 4a).
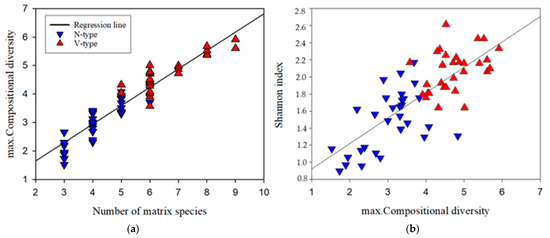
Figure 4.
(a) The relationship between the number of abundant species and the spatial complexity of the vegetation matrix (max. compositional diversity). (b) The dependence of alpha diversity (Shannon index) on the spatial complexity of the vegetation matrix (max. compositional diversity).
Regression analysis revealed a significant positive correlation between Shannon index and max. CD (R2 = 0.6, p < 0.001), indicating that increased fine-scale heterogeneity of the dominants positively influences alpha diversity. Figure 4b further illustrates the overall higher complexity and alpha diversity in V-type vegetation.
No significant correlations were found between environmental proxies and diversity, confirming our assumption of environmental unity (see Supplementary Material).
4. Discussion
After three decades of reduced grazing in the high mountain pastures of the Balkan Mountains, significant changes in vegetation were observed. These changes included the retreat of mat grass swards and the encroachment of dwarf shrubs, resulting in a mosaic of compositionally distinct heath-like and grasslandvegetation. Despite these changes, many shared species indicate a continuity in vegetation dynamics influenced by spatial variability in succession rates.
4.1. Alpha and Beta Diversity Patterns
Beta diversity is widely recognized as an indicator of ecosystem health and naturalness, reflecting the complexity of spatial structure and its association with ecosystem functioning efficiency [44].
In this study, we observed higher, although not definitive, mean coarse-scale beta diversity in the pure grassland compared to mixed vegetation. The inconclusive result is compensated for by the large variability in the pairwise dissimilarities of the N-type transects, also indicative of higher coarse-scale beta diversity (Table 1, Figure 3). Conversely, vegetation with dwarf shrubs exhibited greater fine-scale complexity (Table 1, Figure 3). These findings align with those of Bartha et al. [44] and Virágh et al. [45], although ours were of greater magnitude. They found that regional beta diversity decreases while local beta diversity increases during vegetation recovery. Additionally, we support the trends observed by Bartha et al. [43] of regional beta diversity decreasing while local beta diversity increases during vegetation recovery succession. The observed coarse-scale homogenization during successional turnover aligns with the findings of Anthelme et al. [56], who suggest that shrub encroachment leads to convergence at the regional scale. However, the encroachment of dwarf shrubs increases species richness and diversity, supporting the observed trend of landscape homogenization alongside an increase in alpha diversity, as reported by Jurasinski and Kreyling (2007) [57]. Our results differ from those of Zehnder et al. [58], but it is important to note that their study focuses on shrub encroachment rather than dwarf-shrub encroachment. As Maestre et al. [59] and Zehnder et al. [58] point out, the impact of shrub colonization on diversity varies depending on the species of the colonizing shrub and the type of grasslands they invade.
The spatial vegetation pattern was not affected by the small variations among sites (Supplementary Material) but was rather shaped by the rate and manner of N. stricta decline following reduced grazing, specifically whether this decline favors other grasses or dwarf shrubs. Differences in successional trajectories may arise from stochastic dispersal events and the closer proximity of V-type stands to woody species sources [8]. N. stricta’s high abundance in the study area is a product of historical heavy grazing [25,60]. The specific environmental conditions, especially the poor and drained soils in the area, limit the competitiveness of mat grass [16,22]. Reduced grazing allows the more palatable grasses like A. capillaris, F. nigrescens, and A. flexuosa to expand in varying proportions throughout the landscape. This benefits pasture quality and coarse-scale diversity, though not necessarily alpha diversity. Simultaneously, reduced grazing promotes Vaccinium spp. spread [60], increasing alpha diversity and fine-scale heterogeneity while homogenizing the landscape and limiting palatable species. The present vegetation pattern shows that the potential effects and limitations that could be exerted on species abundances by the environmental conditions have been strongly moderated by grazing pressure.
4.2. Drivers and Constraints of Species Assembly
The N-type vegetation shows clear signs of degradation, characterized by a substantial regional and local abundance of highly competitive grasses (Figure 2), excluding or severely limiting other species [53]. In contrast, V-type vegetation supported species coexistence through a heterogeneous fine-scale matrix (Figure 3 and Figure 4). This resulted in distinct spatial structures under similar grazing densities, as also noted by Ludvíková et al. [61].
Dwarf shrub recovery is a slower process at higher and windy sites [20] than the increase in graminoid abundance [62]. Grasses, with their rapid dispersal and clonal growth [53], exhibited more pronounced fluctuations in species proportions across sites, leading to shifts in coarse-scale composition. In grass-dominated vegetation, changes in N. stricta, F. nigrescens, and A. capillaris proportions led to greater coarse-scale variability [17]. Lower local alpha and beta diversity in N-type stands resulted from competitive perennial grasses forming monotonous, segregated patches [63] with low complexity at a fine scale.
Conversely, the V-type represents a diverse fine-scale spatial complexity formed by the mixture of dominant species populations [64], promoting higher alpha and beta diversity. Maximum compositional diversity (max. CD) drove species diversity (Figure 4), highlighting the role of dominant species mixtures in counteracting individual exclusion effects. Similar trends were observed by LaPlante and Souza [64] and Partzsch et al. [65], emphasizing the balancing effect of co-dominance. The balancing effect of the dominance mixture would be especially useful for counteracting the highly suppressive nature of F. nigrescens, as is the case with other Festuca species [53,65].
The N-type fine-scale structure is a product of the strong dominance effect. In contrast, in the V-type, the fine-scale mixture of dominants and the modification of microclimatic conditions by Vaccinium spp. [20] promote “associational resistance” [66] and greater fine-scale beta diversity (Figure 3). With the creation of microhabitats and the modification of microclimates by Vaccinium spp., subordinate species get intermingled in space with dominating grasses and dwarf shrubs, resulting in greater fine-scale heterogeneity. The balanced mixture of dominants in the V-type, in which grasses give place to dwarf shrubs and forbs, enriches the overall vegetation composition, as established also by Anthelme et al. [56] in their study about succession after the abandonment of semi-natural grasslands and Kasari et al. [67] in their study about low-cover (up to 30%) shrub encroachment in alvar communities.
We support the need to manage traditional landscapes’ spatial patchiness and multifunctionality [68] in high-mountain regions for maintaining best ecosystem services and their associated socio-economic benefits [60].
5. Conclusions
This study revealed contrasting, scale-dependent diversity patterns within the dynamic patchwork of subalpine semi-natural grasslands. Natural succession toward grass–dwarf shrub mixtures increased alpha diversity and local complexity while simultaneously homogenizing the landscape. Conversely, grassland regeneration toward dominance by characteristic species, such as Festuca nigrescens and Agrostis capillaris, resulted in lower complexity and alpha diversity but enhanced regional variability. Notably, we identified a novel function of dominance: a balanced spatial mixture of dominant species mitigated their individual exclusionary effects on other species. Overall, patch mosaic systems proved beneficial for vegetation diversity and functionality. In our study area, the positive trends observed in vegetation transition necessitate careful consideration and management. To maintain diverse patch mosaics, we recommend intermediate grazing pressure coupled with even grazing distribution. We emphasize that future research on vegetation structure, diversity, and species co-existence, employing spatial scaling and high-resolution sampling, is crucial for accurately interpreting vegetation dynamics.
Supplementary Materials
The following supporting information can be downloaded at: https://www.mdpi.com/article/10.3390/land14040823/s1, Analytical details and results from a test for potential effects of environmental conditions on diversity.
Author Contributions
Conceptualization, T.T., J.T. and S.B.; methodology, S.B. and T.T.; software, J.T.; validation, S.B. and J.T.; formal analysis, T.T., J.T. and S.B.; investigation, T.T.; resources, T.T.; data curation, T.T.; writing—original draft preparation, T.T.; writing—review and editing, I.A. and D.S.; visualization, T.T.; supervision, S.B. and I.A.; project administration, D.S. and I.A.; funding acquisition, T.T. All authors have read and agreed to the published version of the manuscript.
Funding
This research received no external funding.
Data Availability Statement
The data presented in this study are available on request from the corresponding authors, as it is held in a private database.
Acknowledgments
We thank Zita Zimmerman, Gábor Szabó, and Camilla Wellstein for their support in the field activities.
Conflicts of Interest
Author James Tsakalos is employed by the company Alcoa of Australia. The remaining authors declare that the research was conducted in the absence of any commercial or financial relationships that could be construed as a potential conflict of interest.
Abbreviations
The following abbreviations are used in this manuscript:
| CD | Compositional Diversity |
| NRC | Number of Realized Combinations |
References
- Korzeniak, J. Mountain Nardus Stricta Grasslands as a Relic of Past Farming—The Effects of Grazing Abandonment in Relation to Elevation and Spatial Scale. Folia Geobot. 2016, 51, 93–113. [Google Scholar] [CrossRef]
- Austrheim, G.; Gunilla, E.; Olsson, A.; Grøntvedt, E. Land-Use Impact on Plant Communities in Semi-Natural Sub-Alpine Grasslands of Budalen, Central Norway. Biol. Conserv. 1999, 87, 369–379. [Google Scholar] [CrossRef]
- Tasser, E.; Tappeiner, U. Impact of Land Use Changes on Mountain Vegetation. Appl. Veg. Sci. 2002, 5, 173–184. [Google Scholar] [CrossRef]
- Poschlod, P.; Bakker, J.P.; Kahmen, S. Changing Land Use and Its Impact on Biodiversity. Basic Appl. Ecol. 2005, 6, 93–98. [Google Scholar] [CrossRef]
- Komac, B.; Alados, C.L.; Bueno, C.G.; Gómez, D. Spatial Patterns of Species Distributions in Grazed Subalpine Grasslands. Plant Ecol. 2011, 212, 519–529. [Google Scholar] [CrossRef]
- Galvánek, D.; Lepš, J. The Effect of Management on Productivity, Litter Accumulation and Seedling Recruitment in a Carpathian Mountain Grassland. Plant Ecol. 2012, 213, 523–533. [Google Scholar] [CrossRef]
- Anderson, R.M. Biodiversity Change in the Irish Uplands—The Effects of Grazing Management; University College Cork: Cork, Ireland, 2013; Available online: https://hdl.handle.net/10468/1290 (accessed on 1 April 2025).
- Gartzia, M.; Alados, C.L.; Pérez-Cabello, F. Assessment of the Effects of Biophysical and Anthropogenic Factors on Woody Plant Encroachment in Dense and Sparse Mountain Grasslands Based on Remote Sensing Data. Prog. Phys. Geogr. Earth Environ. 2014, 38, 201–217. [Google Scholar] [CrossRef]
- Czortek, P.; Eycott, A.E.; Grytnes, J.-A.; Delimat, A.; Kapfer, J.; Jaroszewicz, B. Effects of Grazing Abandonment and Climate Change on Mountain Summits Flora: A Case Study in the Tatra Mts. Plant Ecol. 2018, 219, 261–276. [Google Scholar] [CrossRef]
- Mayer, R.; Erschbamer, B. Long-Term Effects of Grazing on Subalpine and Alpine Grasslands in the Central Alps, Austria. Basic Appl. Ecol. 2017, 24, 9–18. [Google Scholar] [CrossRef]
- Malatesta, L.; Tardella, F.M.; Tavoloni, M.; Postiglione, N.; Piermarteri, K.; Catorci, A. Land Use Change in the High Mountain Belts of the Central Apennines Led to Marked Changes of the Grassland Mosaic. Appl. Veg. Sci. 2019, 22, 243–255. [Google Scholar] [CrossRef]
- Mysterud, A. The Concept of Overgrazing and Its Role in Management of Large Herbivores. Wildl. Biol. 2006, 12, 129–141. [Google Scholar] [CrossRef]
- Gong Li, S.; Harazono, Y.; Oikawa, T.; Zhao, H.L.; Ying He, Z.; Chang, X.L. Grassland Desertification by Grazing and the Resulting Micrometeorological Changes in Inner Mongolia. Agric. For. Meteorol. 2000, 102, 125–137. [Google Scholar] [CrossRef]
- Velev, N.; Apostolova, I. Successional Changes of Nardus Stricta Communities in the Central Balkan Range (Bulgaria). Phytol. Balc. 2008, 14, 75–84. [Google Scholar]
- Mastrogianni, A.; Kiziridis, D.A.; Karadimou, E.; Pleniou, M.; Xystrakis, F.; Tsiftsis, S.; Tsiripidis, I. Community-Level Differentiation of Grime’s CSR Strategies along a Post-Abandonment Secondary Successional Gradient. Flora 2023, 308, 152399. [Google Scholar] [CrossRef]
- Grant, S.A.; Torvell, L.; Sim, E.M.; Small, J.L.; Armstrong, R.H. Controlled Grazing Studies on Nardus Grassland: Effects of Between-Tussock Sward Height and Species of Grazer on Nardus Utilization and Floristic Composition in Two Fields in Scotland. J. Appl. Ecol. 1996, 33, 1053–1064. [Google Scholar] [CrossRef]
- Hulme, P.D.; Pakeman, R.J.; Torvell, L.; Fisher, J.M.; Gordon, I.J. The Effects of Controlled Sheep Grazing on the Dynamics of Upland Agrostis–Festuca Grassland. J. Appl. Ecol. 1999, 36, 886–900. [Google Scholar] [CrossRef]
- Ross, L.C.; Woodin, S.J.; Hester, A.J.; Thompson, D.B.A.; Birks, H.J.B. Biotic Homogenization of Upland Vegetation: Patterns and Drivers at Multiple Spatial Scales over Five Decades. J. Veg. Sci. 2012, 23, 755–770. [Google Scholar] [CrossRef]
- Buzhdygan, O.Y.; Tietjen, B.; Rudenko, S.S.; Nikorych, V.A.; Petermann, J.S. Direct and Indirect Effects of Land-Use Intensity on Plant Communities across Elevation in Semi-Natural Grasslands. PLoS ONE 2020, 15, e0231122. [Google Scholar] [CrossRef]
- Zeidler, M.; Banaš, M. Bilberry Expansion in the Changing Subalpine Belt. Plants 2024, 13, 2633. [Google Scholar] [CrossRef]
- Myster, R.W.; Pickett, S.T.A. Initial Conditions, History and Successional Pathways in Ten Contrasting Old Fields. Am. Midl. Nat. 1990, 124, 231–238. [Google Scholar] [CrossRef]
- Palaj, A.; Kollár, J.; Michalová, M. Changes in the Nardus Grasslands in the (Sub)Alpine Zone of Western Carpathians over the Last Decades. Biologia 2024, 79, 1081–1090. [Google Scholar] [CrossRef]
- Trindade, V.L.; Ferreira, M.C.; Costa, L.S.; Amaral, E.d.J.; Bustamante, M.M.d.C.; Munhoz, C.B.R. The Effect of Woody Encroachment on Taxonomic and Functional Diversity and Soil Properties in Cerrado Wetlands. Flora 2024, 316, 152524. [Google Scholar] [CrossRef]
- Klinkovská, K.; Kučerová, A.; Pustková, Š.; Rohel, J.; Slachová, K.; Sobotka, V.; Szokala, D.; Danihelka, J.; Kočí, M.; Šmerdová, E.; et al. Subalpine Vegetation Changes in the Eastern Sudetes (1973–2021): Effects of Abandonment, Conservation Management and Avalanches. Appl. Veg. Sci. 2023, 26, e12711. [Google Scholar] [CrossRef]
- Pedashenko, H.; Apostolova, I.; Oldeland, J. The Effects of Livestock Numbers and Land Cover Transformation Processes on Rangelands in the Balkan Mountains between 1947 and 2012. Tuexenia 2015, 35, 417–432. [Google Scholar] [CrossRef]
- De Toma, A.; Carboni, M.; Bazzichetto, M.; Malavasi, M.; Cutini, M. Dynamics of Dwarf Shrubs in Mediterranean High-Mountain Ecosystems. J. Veg. Sci. 2022, 33, e13143. [Google Scholar] [CrossRef]
- Zeidler, M.; Husek, V.; Banaš, M.; Krahulec, F. Homogenization and Species Compositional Shifts in Subalpine Vegetation during the 60-Year Period. Acta Soc. Bot. Pol. 2023, 92, 1–10. [Google Scholar] [CrossRef]
- Austrheim, G.; Eriksson, O. Plant Species Diversity and Grazing in the Scandinavian Mountains—Patterns and Processes at Different Spatial Scales. Ecography 2001, 24, 683–695. [Google Scholar] [CrossRef]
- Terziyska, T.; Tsakalos, J.; Bartha, S.; Apostolova, I.; Sopotlieva, D.; Zimmermann, M.Z.; Szabo, G.; Wellstein, C. Species and Functional Differences between Subalpine Grasslands with and without Dwarf Shrub Encroachment. Plant Biosyst. Int. J. Deal. Asp. Plant Biol. 2020, 154, 568–577. [Google Scholar] [CrossRef]
- Anderson, M.J.; Crist, T.O.; Chase, J.M.; Vellend, M.; Inouye, B.D.; Freestone, A.L.; Sanders, N.J.; Cornell, H.V.; Comita, L.S.; Davies, K.F.; et al. Navigating the Multiple Meanings of β Diversity: A Roadmap for the Practicing Ecologist. Ecol. Lett. 2011, 14, 19–28. [Google Scholar] [CrossRef]
- Legendre, P.; De Cáceres, M. Beta Diversity as the Variance of Community Data: Dissimilarity Coefficients and Partitioning. Ecol. Lett. 2013, 16, 951–963. [Google Scholar] [CrossRef]
- McGill, B.J.; Dornelas, M.; Gotelli, N.J.; Magurran, A.E. Fifteen Forms of Biodiversity Trend in the Anthropocene. Trends Ecol. Evol. 2015, 30, 104–113. [Google Scholar] [CrossRef] [PubMed]
- Götzenberger, L.; de Bello, F.; Bråthen, K.A.; Davison, J.; Dubuis, A.; Guisan, A.; Lepš, J.; Lindborg, R.; Moora, M.; Pärtel, M.; et al. Ecological Assembly Rules in Plant Communities—Approaches, Patterns and Prospects. Biol. Rev. 2012, 87, 111–127. [Google Scholar] [CrossRef] [PubMed]
- Olff, H.; Bakker, J.P. Do Intrinsically Dominant and Subordinate Species Exist? A Test Statistic for Field Data. Appl. Veg. Sci. 1998, 1, 15–20. [Google Scholar] [CrossRef]
- Deák, B.; Valkó, O.; Kelemen, A.; Török, P.; Miglécz, T.; Ölvedi, T.; Lengyel, S.; Tóthmérész, B. Litter and Graminoid Biomass Accumulation Suppresses Weedy Forbs in Grassland Restoration. Plant Biosyst. Int. J. Deal. Asp. Plant Biol. 2011, 145, 730–737. [Google Scholar] [CrossRef]
- Alves, C.; Marcos, B.; Gonçalves, J.; Verburg, P.; Pellissier, L.; Lomba, A. Co-Occurrences and Species Distribution Models Show the Structuring Role of Dominant Species in the Vez Watershed, in Portugal. Ecol. Indic. 2023, 151, 110306. [Google Scholar] [CrossRef]
- Zuo, X.; Gornish, E.S.; Koerner, S.E.; van der Plas, F.; Wang, S.; Liang, M. Dominant Species Determine Grazing Effects on the Stability of Herbaceous Community Production at Multiple Scales in Drylands. J. Appl. Ecol. 2023, 60, 1917–1928. [Google Scholar] [CrossRef]
- Juhász-Nagy, P.; Podani, J. Information Theory Methods for the Study of Spatial Processes and Succession. Vegetatio 1983, 51, 129–140. [Google Scholar] [CrossRef]
- Juhász-Nagy, P. Notes on Compositional Diversity. In Intermediate Disturbance Hypothesis in Phytoplankton Ecology; Padisák, J., Reynolds, C.S., Sommer, U., Eds.; Springer: Dordrecht, The Netherlands, 1993; pp. 173–182. [Google Scholar] [CrossRef]
- Velev, S. Climatic Zoning. 2002. Available online: https://cir.nii.ac.jp/crid/1574231874009440768 (accessed on 4 March 2025).
- Nori, S.; Gemini, M. The Common Agricultural Policy Vis-à-Vis European Pastoralists: Principles and Practices. Pastor. Res. Policy Pract. 2011, 1, 27. [Google Scholar] [CrossRef]
- Prévosto, B.; Kuiters, L.; Bernhardt-Römermann, M.; Dölle, M.; Schmidt, W.; Hoffmann, M.; Van Uytvanck, J.; Bohner, A.; Kreiner, D.; Stadler, J.; et al. Impacts of Land Abandonment on Vegetation: Successional Pathways in European Habitats. Folia Geobot. 2011, 46, 303–325. [Google Scholar] [CrossRef]
- Bartha, S.; Campetella, G.; Canullo, R.; Bodis, J.; Mucina, L. On the Importance of Fine-Scale Spatial Complexity in Vegetation Restoration Studies. Int. J. Ecol. Environ. Sci. 2004, 30, 101–116. [Google Scholar]
- Bartha, S.; Campetella, G.; Kertesz, M.; Hahn, I.; Kroel-Dulay, G.; Redei, T.; Kun, A.; Viragh, K.; Fekete, G.; Kovacs-Lang, E. Beta Diversity and Community Differentiation in Dry Perennial Sand Grasslands. Ann. Bot. 2011, 1, 9–18. [Google Scholar]
- Virágh, K.; Horváth, A.; Bartha, S.; Somodi, I. A Multiscale Methodological Approach for Monitoring the Effectiveness of Grassland Management. Community Ecol. 2008, 9, 237–246. [Google Scholar] [CrossRef]
- Podani, J. Analysis of Mapped and Simulated Vegetation Patterns by Meansof Computerized Sampling Techniques. Acta Bot. Hung. 1984, 30, 403–425. [Google Scholar]
- Euro+Med PlantBase Home. Available online: https://www.emplantbase.org/home.html (accessed on 4 March 2025).
- Shannon, C.E. A Mathematical Theory of Communication. Bell Syst. Tech. J. 1948, 27, 379–423. [Google Scholar] [CrossRef]
- Bray, J.R.; Curtis, J.T. An Ordination of the Upland Forest Communities of Southern Wisconsin. Ecol. Monogr. 1957, 27, 326–349. [Google Scholar] [CrossRef]
- Clark, K.R.; Gorley, R.N. PRIMER v7: User Manual/Tutorial PRIMER-E: Plymouth; Primer-E Ltd.: Devon, UK, 2015. [Google Scholar]
- SigmaPlot v16 (Upgrade from v15). Grafiti LLC. Available online: https://grafiti.com/product/sigmaplot-v15/ (accessed on 4 March 2025).
- Grime, J.P. Benefits of Plant Diversity to Ecosystems: Immediate, Filter and Founder Effects. J. Ecol. 1998, 86, 902–910. [Google Scholar] [CrossRef]
- Arnillas, C.A.; Borer, E.T.; Seabloom, E.W.; Alberti, J.; Baez, S.; Bakker, J.D.; Boughton, E.H.; Buckley, Y.M.; Bugalho, M.N.; Donohue, I.; et al. Opposing Community Assembly Patterns for Dominant and Nondominant Plant Species in Herbaceous Ecosystems Globally. Ecol. Evol. 2021, 11, 17744–17761. [Google Scholar] [CrossRef]
- Bartha, S.; Házi, J.; Purger, D.; Zimmermann, Z.; Szabó, G.; Guller, Z.E.; Csathó, A.I.; Csete, S. Beta Diversity Is Better—Microhabitat Diversity and Multiplet Diversity Offer Novel Insights into Plant Coexistence in Grassland Restoration. Diversity 2024, 16, 769. [Google Scholar] [CrossRef]
- Tsakalos, J.L.; Chelli, S.; Campetella, G.; Canullo, R.; Simonetti, E.; Bartha, S. Comspat: An R Package to Analyze within-Community Spatial Organization Using Species Combinations. Ecography 2022, 2022, e06216. [Google Scholar] [CrossRef]
- Anthelme, F.; Villaret, J.-C.; Brun, J.-J. Shrub Encroachment in the Alps Gives Rise to the Convergence of Sub-Alpine Communities on a Regional Scale. J. Veg. Sci. 2007, 18, 355–362. [Google Scholar] [CrossRef]
- Jurasinski, G.; Kreyling, J. Upward Shift of Alpine Plants Increases Floristic Similarity of Mountain Summits. J. Veg. Sci. 2007, 18, 711–718. [Google Scholar] [CrossRef]
- Zehnder, T.; Lüscher, A.; Ritzmann, C.; Pauler, C.M.; Berard, J.; Kreuzer, M.; Schneider, M.K. Dominant Shrub Species Are a Strong Predictor of Plant Species Diversity along Subalpine Pasture-Shrub Transects. Alp. Bot. 2020, 130, 141–156. [Google Scholar] [CrossRef]
- Maestre, F.T.; Eldridge, D.J.; Soliveres, S. A Multifaceted View on the Impacts of Shrub Encroachment. Appl. Veg. Sci. 2016, 19, 369–370. [Google Scholar] [CrossRef] [PubMed]
- Pakeman, R.J.; Fielding, D.A.; Everts, L.; Littlewood, N.A. Long-Term Impacts of Changed Grazing Regimes on the Vegetation of Heterogeneous Upland Grasslands. J. Appl. Ecol. 2019, 56, 1794–1805. [Google Scholar] [CrossRef]
- Ludvíková, V.; Pavlů, V.; Pavlů, L.; Gaisler, J.; Hejcman, M. Sward-Height Patches under Intensive and Extensive Grazing Density in an Agrostis Capillaris Grassland. Folia Geobot. 2015, 50, 219–228. [Google Scholar] [CrossRef]
- Olofsson, J. Short-and Long-Term Effects of Changes in Reindeer Grazing Pressure on Tundra Heath Vegetation. J. Ecol. 2006, 94, 431–440. [Google Scholar] [CrossRef]
- Hines, J.; Keil, P. Common Competitors and Rare Friends. Nat. Ecol. Evol. 2020, 4, 8–9. [Google Scholar] [CrossRef]
- LaPlante, E.; Souza, L. Plant Dominance in a Subalpine Montane Meadow: Biotic vs. Abiotic Controls of Subordinate Diversity within and across Sites. PeerJ 2018, 6, e5619. [Google Scholar] [CrossRef]
- Partzsch, M.; Faulhaber, M.; Meier, T. The Effect of the Dominant Grass Festuca Rupicola on the Establishment of Rare Forbs in Semi-Dry Grasslands. Folia Geobot. 2018, 53, 103–113. [Google Scholar] [CrossRef]
- Montané, F.; Casals, P.; Taull, M.; Lambert, B.; Dale, M.R.T. Spatial Patterns of Shrub Encroachment in Neighbouring Grassland Communities in the Pyrenees: Floristic Composition Heterogeneity Drives Shrub Proliferation Rates. Plant Ecol. 2010, 211, 267–278. [Google Scholar] [CrossRef]
- Kasari, L.; Gazol, A.; Kalwij, J.M.; Helm, A. Low Shrub Cover in Alvar Grasslands Increases Small-Scale Diversity by Promoting the Occurrence of Generalist Species. Tuexenia 2013, 33, 293–308. [Google Scholar]
- Sebastià, M.-T.; de Bello, F.; Puig, L.; Taull, M. Grazing as a Factor Structuring Grasslands in the Pyrenees. Appl. Veg. Sci. 2008, 11, 215–222. [Google Scholar] [CrossRef]
Disclaimer/Publisher’s Note: The statements, opinions and data contained in all publications are solely those of the individual author(s) and contributor(s) and not of MDPI and/or the editor(s). MDPI and/or the editor(s) disclaim responsibility for any injury to people or property resulting from any ideas, methods, instructions or products referred to in the content. |
© 2025 by the authors. Licensee MDPI, Basel, Switzerland. This article is an open access article distributed under the terms and conditions of the Creative Commons Attribution (CC BY) license (https://creativecommons.org/licenses/by/4.0/).

