Abstract
Nature reserves are integral to sustaining ecological balance, functioning like a precise ecological regulator, where various species depend on and constrain one another to collectively form a stable ecosystem. Nevertheless, in the wake of economic development, pollutants like heavy metal contamination have insidiously emerged, imperceptibly influencing all these processes. To understand the ecological risk of heavy metals in an estuarine nature reserve, this study focused on the Yellow River Delta Nature Reserve (YRDNNR) and analyzed the distribution, potential environmental risks, and possible sources of heavy metals (Mn, Cu, Zn, Cr, As, Cd, Pb) in the surface sediments of this region. The results indicated that YRDNNR was rich in As and Cd, with Cd presenting the most substantial ecological risk. Further analysis suggested that the high levels of As and Cd could be ascribed to agricultural activities. This study also found that agricultural practices have made a significant contribution to the carcinogenic risk and pose certain risks to the natural environment and human health. More in-depth monitoring and testing of As and Cd levels in YRDNNR should be carried out, and measures should be adopted in accordance with their development. Moreover, the systematic regulation of fertilizer and pesticide use, along with enhancements to farmers’ ecological awareness, is of great significance to alleviating pollution hazards. The findings of this study carry significant implications for the ecological conservation of coastal wetlands, serving as a critical alert to the potential proliferation of heavy metal contamination in other areas of the delta.
1. Introduction
The formation of a delta is the consequence of ceaseless interaction between the land and sea, thereby rendering it an ecological transition zone. It amasses a variety of substances transported from the terrestrial ecosystem, and simultaneously, marine-derived materials also gather in this deltaic area under the influence of ocean waves and sedimentation processes [1,2]. This enriches the delta soil with resources such as organic matter and oil [3]. Moreover, delta wetlands offer crucial habitats for birds, plants, and animals across the globe, and the benthic organisms inhabiting these wetlands serve as an essential food supply for them [4]. Consequently, the ecological health of deltas may directly influence biodiversity worldwide, making it a focal point for research [5]. However, delta wetland areas globally have long grappled with the issue of how to achieve a balance between wetland protection and economic development. As global research on deltaic environments has progressed in recent years, it has become increasingly clear that heavy metal pollution stems from multiple sources [6,7]. Among these, human-induced factors are the most significant contributors [2].
Research has indicated that the Mekong Delta has been damaged by heavy metals introduced through industrial wastewater and agricultural drainage [8,9,10]. The Nile Delta has experienced significant environmental degradation due to agricultural intensification, petroleum-related activities, and the discharge of industrial, fishery, and domestic waste [11,12]. The Ganges–Brahmaputra–Meghna Delta is exposed to substantial anthropogenic threats, with higher levels of As contamination than many other deltaic regions worldwide [13]. Murray–Darling Delta wetlands have been no exception because human activities such as fertilizer use and deforestation increase the risk of heavy metal pollution there [14]. With the intensification of urban industrial activities, heavy metal pollution has gradually emerged in Danube Delta [15]. Even vessel abandonment can worsen the heavy metal contamination in a delta, as has affected the Amazon Delta [16].
Heavy metals, as environmental pollutants, are prone to accumulation and difficult to degrade. Their sources are extensive. Agricultural fertilization, pesticide spraying, industrial wastewater discharge, oil extraction, and other activities can all introduce heavy metals [17]. Since sediments are excellent carriers of heavy metals, the latter will accumulate in them. Once the heavy metal content surpasses a certain limit, it will inflict irreversible harm on benthic organisms, native plants, marine life, and human beings [18,19,20,21,22,23,24]. From the perspective of birds, Pb, Zn, and Cu can affect their nervous systems, blood cells, kidneys, intestines, and other organs, causing bird poisoning or even death [25]. Even more distressingly, poisoned birds will carry heavy metals to other delta areas around the world, potentially resulting in heavy metal pollution in more regions. Regarding human health, Cu, Zn, Cr, As, Cd, and Pb can cause several adverse effects on the human body and central nervous system and increase the risk of cancer in humans [26,27,28,29]. Therefore, it is impossible to overlook the environmental issues brought on by heavy metals.
The Yellow River Delta (YRD) was shaped by the copious amounts of sediment carried by the world-renowned, highly turbid Yellow River, which empties into the Bohai Sea. Through progressive sediment accumulation, it has evolved into one of the few estuarine deltas globally recognized for its rapid land-building [30]. These newborn lands offer favorable living conditions for birds and function as stop-over sites for birds along the East Asian–Australasian Flyway and the Western Pacific Flyway [31]. In addition, this nascent wetland ecosystem is underdeveloped, delicate, and precarious, resulting in a buffering capacity that is just 33% of that found in mature wetlands. As a result, the ecological risk under the same pollution load will be considerably magnified [32]. For this purpose, the government specifically established YRDNNR in 1992 to safeguard tidal flat vegetation, benthic animals, and bird habitats from the interference of human activities [33]. However, the Yellow River is approximately 5687 km in length, has a basin area of 813,122 km2, and traverses nine provinces within the country. The central part of the Yellow River is home to numerous industrial provinces. Central Plains is in the rapid urbanization phase, with economic resurgence, industrial relocation, dense cities, and a large population. Consequently, the Yellow River is unavoidably influenced by agricultural practices, industrial operations, and urban construction [34]. These factors legitimize estimating whether the YRD in China has likewise been polluted by heavy metals, what the pollution level is, and whether it displays usual symptoms of human activity.
While previous research has focused on the heavy metal pollution in YRD [35,36,37], most of these studies have treated the YRD as a homogenized geographical entity, neglecting ecologically sensitive areas such as YRDNNR. YRDNNR, serving as a crucial hub for migratory flight paths, facilitates more efficient transfer of heavy metals through the food chain from sediments to birds compared to terrestrial ecosystems. Thus, conducting specialized research on YRDNNR is invaluable scientifically. Accordingly, this study was conducted within the core protected area of YRDNNR, assessing the degree of heavy metal pollution (Mn, Cu, Zn, Cr, As, Cd, Pb) in the surface sediments, as well as quantifying its potential sources. This method allows for an assessment of the current heavy metal pollution levels in YRDNNR and the degree of impact of human activities, thus providing comprehension of the general situation in terms of pollution in the YRD. As the core protected area of YRD, YRDNNR represents the quintessential characteristics of an estuarine wetland ecosystem. Data on its environmental quality serve as a crucial benchmark for the assessment and management of other analogous areas.
2. Materials and Methods
2.1. The Research Location
Among China’s most prominent river deltas, the YRD stands out as a prime example. Located in a mid-latitude temperate continental monsoon climate zone, the region experiences favorable conditions for abundant precipitation [38]. YRD is located on the North China platform of old land of the Zhou Dynasty, and the crystalline basement is Archean metamorphic rock, such as granite–gneiss, granite, and so on. The upper Archean unconformity encompassed the Sinian system, which consisted of transgression–regression series, with clastic rocks in the lower part and carbonate and argillaceous rocks in the middle and top parts. The upper Sinian unconformity was covered by the Cambrian–Middle Ordovician, which was primarily made up of shallow marine carbonate and argillaceous rocks. The Upper Ordovician to the Lower Carboniferous was missing. The Middle Carboniferous–Permian system was an interoceanic and continental deposit. The Jura–Cretaceous system was made up of multiple fault-block inland basin deposits, primarily clastic rocks with volcanic rocks interspersed throughout. The Cenozoic period progressively evolved into a cohesive depression basin with a flu-lacustrine facies deposit. The Quaternary geology was around 400 m thick and gradually thinned to roughly 100 m to the east. The upper genetic types were generally uniform, primarily alluvial and marine deposits. The YRD’s surface layer was mostly formed of sediment transported by the Yellow River, which originated in the weathered material of the Loess Plateau in the middle reaches and was deposited into the estuary area after long-distance transit [39].
Our study area is located in YRDNNR, which primarily protects the newly formed wetland ecosystem and rare, endangered bird species. YRDNNR was designated as a Ramsar Convention Wetland of International Importance in 2013. YRDNNR has a total area of 1530 km2, and it is divided into two noncontiguous regions, namely the southern and northern regions, according to geographical location. The southern region, located at the current river mouth, encompasses an area of 1045 km2. The northern region, situated at the mouth of the Diaokou River (an old course before the diversion of the Yellow River in 1976), spans 485 km2.
2.2. Soil Sample Collection and Analysis
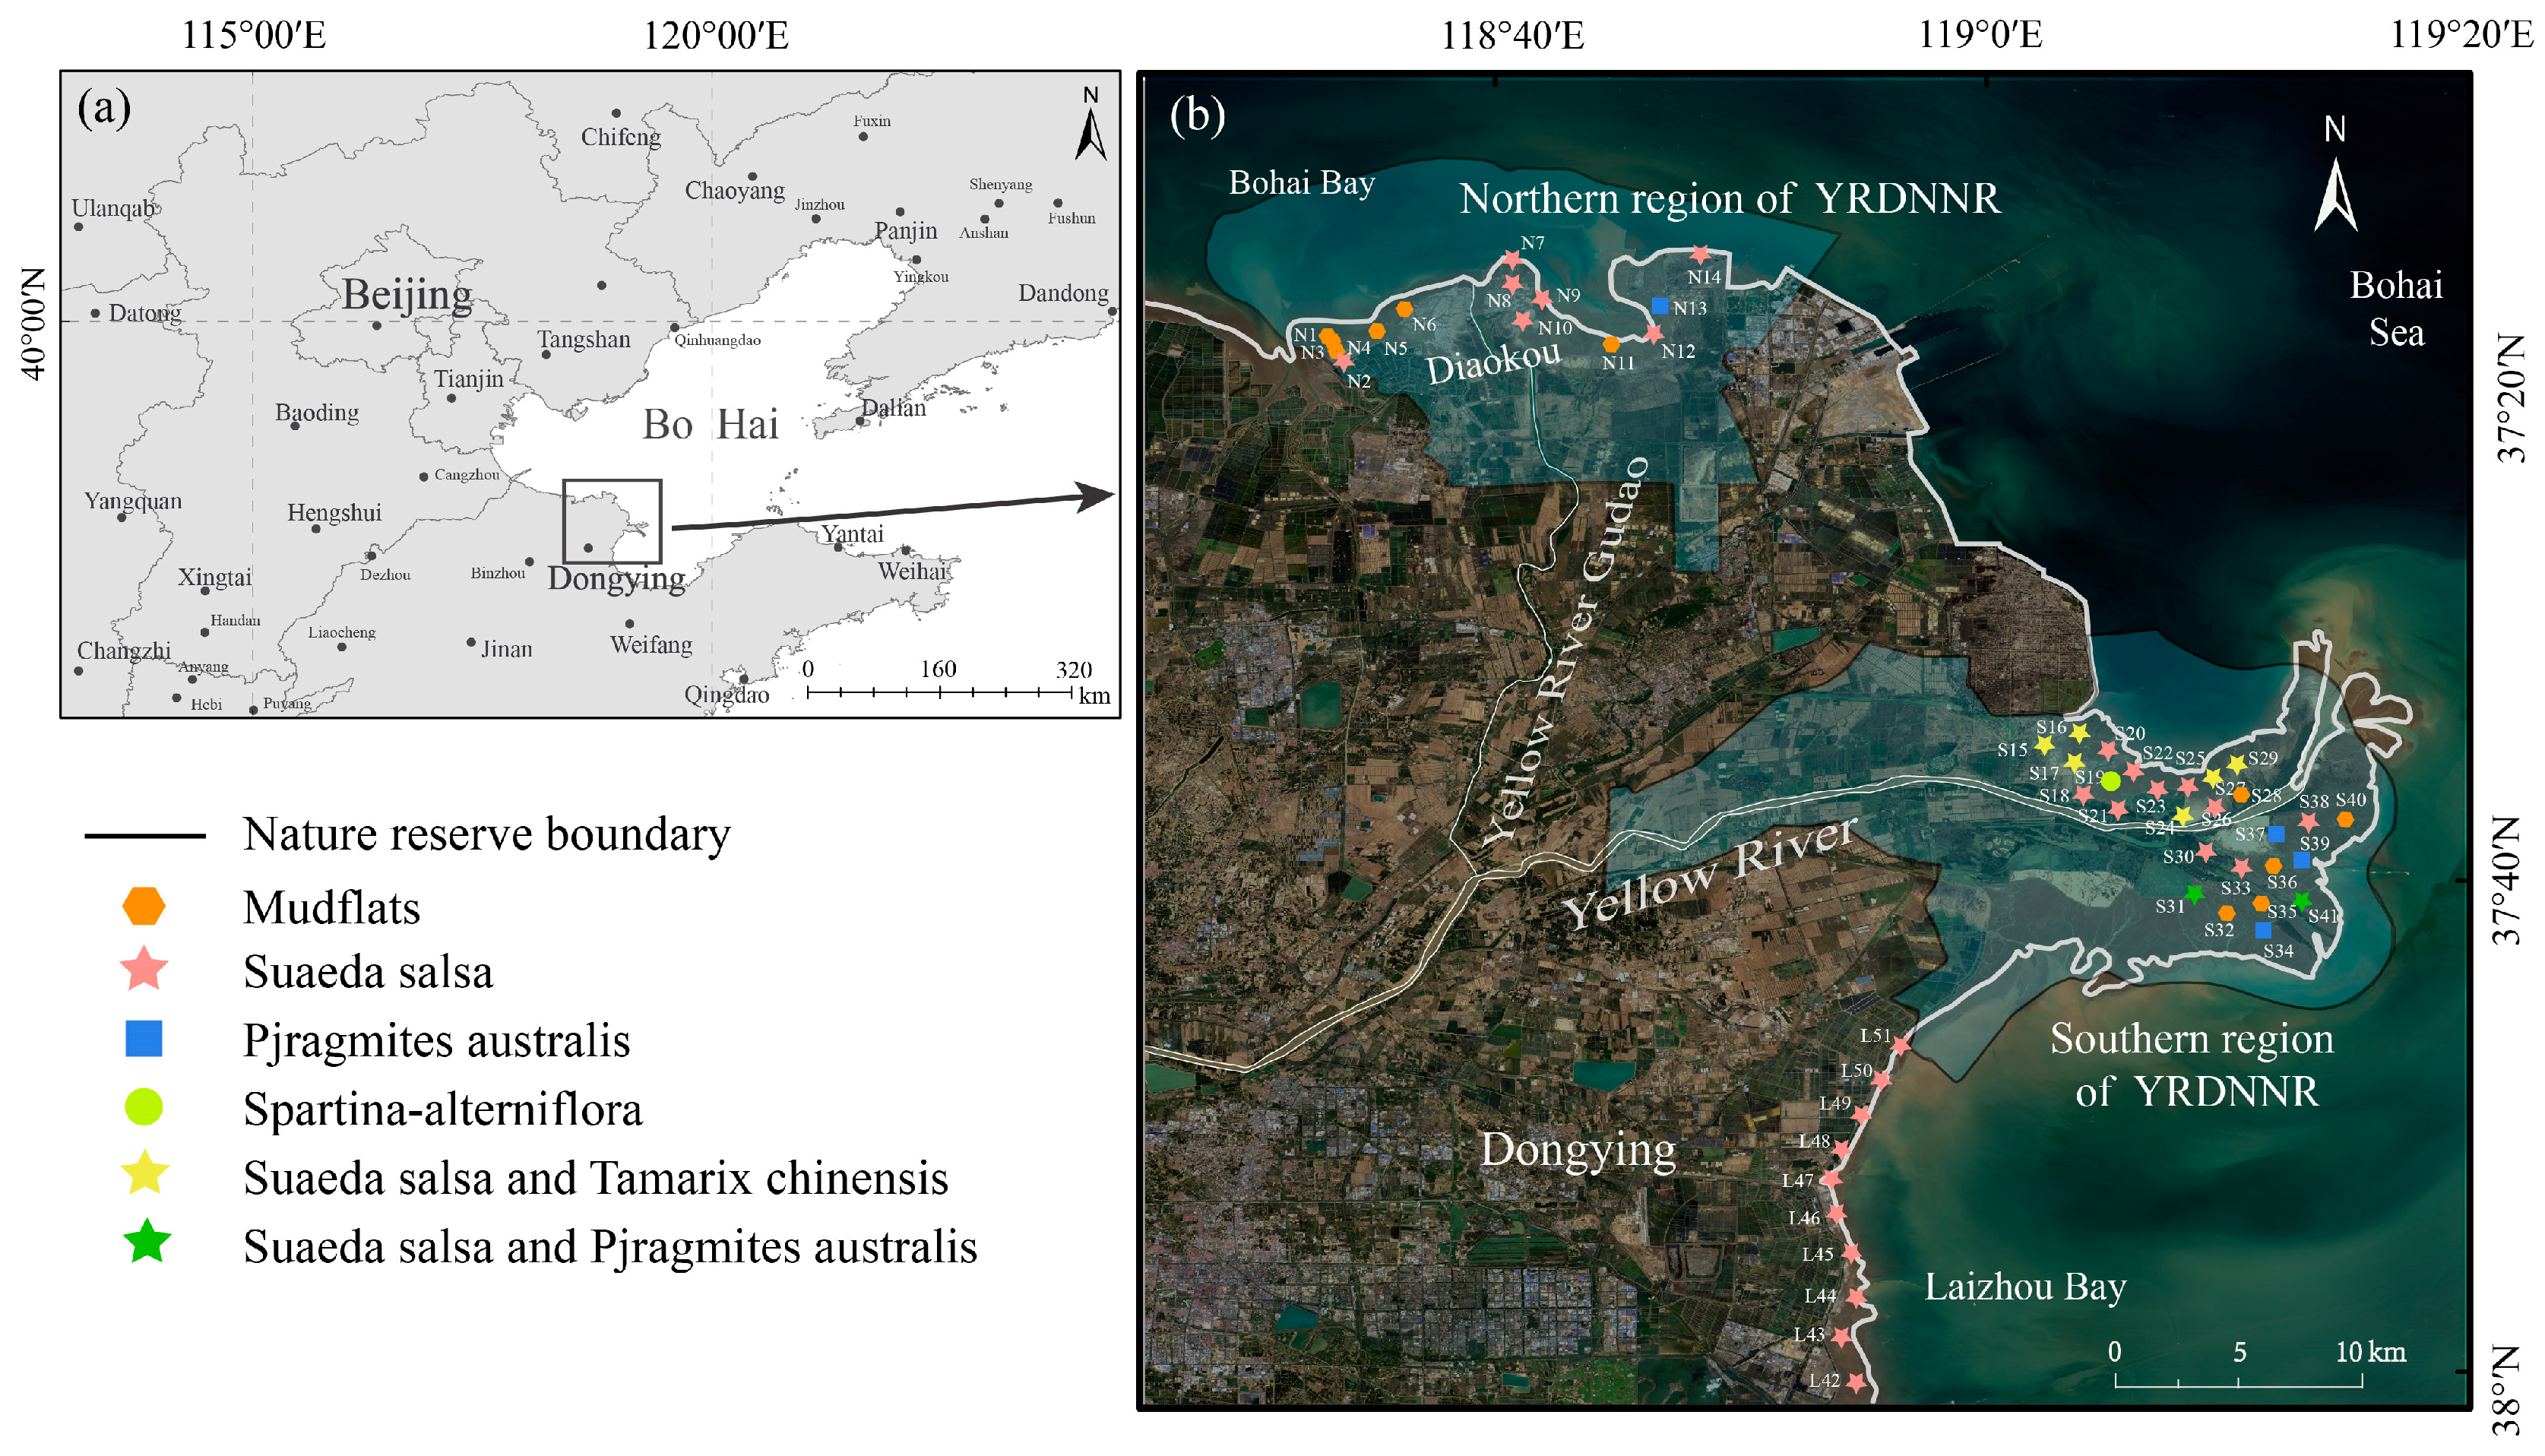
Sampling points were established in YRDNNR coastal wetlands, encompassing the northern region (n = 14) and the southern region (n = 27), during the period from 2 July to 7 2023 (Figure 1), for the purpose of collecting wetland sediment samples. Meanwhile, sampling locations along the coast of Laizhou Bay (n = 10) were established to gather comparative samples for evaluating the protection efficiency of YRDNNR. Sampling was conducted at 2 km intervals as much as humanly possible. For each sample point, five surface samples (0–10 cm) were uniformly blended into one using the five-point sampling method in a 10 m × 10 m quadrant. And we avoided touching plant roots. A total of 51 topsoil samples were obtained. As expeditiously as possible, the samples were transported back to the laboratory in insulated boxes along with ice bags. Once they were brought back to the laboratory, large debris was removed, and the soil samples were then evenly mixed. Part of the samples was stored in a freezer maintained at −20 °C, while the rest was air-dried. Subsequently, the air-dried samples were sieved through 20-mesh sieves (0.850 mm) and 100-mesh sieves (0.150 mm) to determine the soil’s physical and chemical properties, such as water content, electrical conductivity (EC), pH, total carbon (TC), and total nitrogen (TN), as well as heavy metal elements (Fe, Mn, Cu, Zn, Cr, As, Cd, and Pb). The collection, storage, and transportation of the samples were conducted in compliance with the appropriate marine monitoring standards.
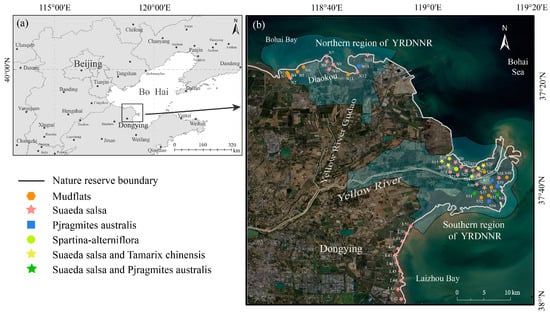
Figure 1.
(a) Location of YRDNNR; (b) sampling sites in coastal wetlands of YRDNNR, including two subregions: Northern region of YRDNNR and Southern region of YRDNNR.
In the laboratory, the water immersion method was adopted with a volume–mass ratio of 2.5:1. A pH meter (PHS-3E, INESA, Shanghai, China) was utilized to measure the pH value of the sediment. The EC values of the sediment were measured using a conductivity meter (DDS-307A, INESA, Shanghai, China). A vario ISOTOPE cube (Elementar, Frankfurt, Germany) was employed to determine the TC and TN in the sediments. The concentrations of Fe, Mn, Cu, and Zn were measured using an inductively coupled plasma optical emission spectrometer (ICP-OES, Prodigy Spec, TELEDYNE, Thousand Oaks, CA, USA), while the concentrations of Cr, As, Cd, and Pb were measured using inductively coupled plasma mass spectrometry (ICP-MS, iCAP RQ, Thermo, Waltham, MA, USA). The samples were pretreated with aqua regia. In each batch of pretreatment samples, two 0.5 g (±0.0001 g) stream sediment standard reference samples (GBW07312) and two blank samples were added for quality control.
2.3. Data Analysis
IBM SPSS Statistics 25 software was utilized for the principal component analysis, the KMO–Bartlett’s test, and the analysis of the distribution of the heavy metal sources using APCS-MLR. Origin 2024 and R software (4.3.2) were employed to create the Sankey diagram and the histogram for heavy metal pollution index evaluation.
2.4. Methods
2.4.1. The Enrichment Factor (EF)
The EF is a geochemical parameter that assesses the heavy metal concentrations in sediment in comparison to their background geochemical levels. Prior to the calculation of the EF, it is essential to standardize the metallic element data with the aid of conservative elements. This study employed Fe for normalization, as recommended by Saha et al. (2024) [40]. Given the significant differences between the heavy metal concentrations in YRDNNR and the average composition of the upper continental crust (UCC), we prioritized regional specificity by selecting the background values of the Yellow River Delta to calculate the enrichment factors (EFs) [41]. Calculation of the EF is carried out as follows:
EF = (Csediment/CFe)/(Bsediment/BFe)
Csediment and CFe represent the measured heavy metal content and the measured Fe content in the sediment samples, respectively. Bsediment and Breference are the geochemical background values of heavy metals and Fe content, respectively. We referred to Zhao and Yan (1992) [41] for the values of CFe and BFe. The evaluation criteria for the EFs in the sediments are presented in Table S1.
2.4.2. Potential Ecological Risk Index (RI)
The RI has been established through the integration of the diverse levels of risk that different heavy metals pose to organisms [42]. The RI is computed by means of Equations (2) and (3):
The RI represents the cumulative risk of all heavy metal contaminants in the sediment. is a potential ecological risk factor; and is a substance’s “toxic-response” factor. is the actual content of a heavy metal i. is the reference background value for heavy metal i. Table S2 shows the relationship between potential ecological risk and the evaluation indices ( and RI). Table S3 shows the values.
2.4.3. Sediment Quality Guidelines (SQGs)
SQGs are a commonly employed technique for assessing whether and to what extent aquatic ecosystems have been damaged by heavy metals [43,44,45]. There are numerous evaluation systems for this method, among which the commonly used ones are ERL (effect range-low) and ERM (effect range-median) [46,47], as well as the TEL (threshold effect level) and the PEL (probable effect level) [48,49]. This work used MacDonald’s (1996) [49] proposed TEL and PEL values to forecast the detrimental effects of heavy metal contamination on benthic organisms in YRDNNR. The TEL value indicates that adverse responses are rare and will scarcely exert any negative impacts on organisms when the pollutant concentration is below this value. However, the PEL value demonstrates that harmful responses usually occur when the pollutant concentration exceeds this threshold, thereby endangering ecosystems and biota. Concentrations between the two thresholds signify occasional adverse effects [49].
To integrate these element-specific SQG values and ascertain the potential biological impact of combined toxicant groups, we computed the mean PEL quotients (mPEL-Q) as follows.
Csediment represents the heavy metal content measured within the sediment samples, while PEL denotes the PEL value for heavy metal content corresponding to Csediment. Six heavy metals were evaluated in this study.
2.4.4. Health Risk Assessment (HRA)
The HRA encompassed a non-carcinogenic risk assessment and a carcinogenic risk assessment, which was an estimation of the probability that environmental pollutants would cause harm to human health through ingestion, inhalation, and dermal contact [50]. Different individual populations also vary in their tolerance to risk. The equations utilized for these assessments were as follows:
The hazard quotient (HQ) and the hazard index (HI) for each exposure route can be employed to depict the non-carcinogenic risk. The carcinogenic risk (CR) and the total carcinogenic risk (TCR) represented the risk of carcinogenic elements such as heavy metals like Cd, Cr, Ni, and Pb in each exposure route. The HQ, HI, CR, and TCR were assessed by means of the average daily dose (ADD) of the main exposure routes, and these were calculated using Equations (5)–(11).
Csediment is the heavy metal content (mg/kg) in the sediment. Refer to Table S4 for the other factors.
HQ = ADDingestion/RfDingestion = ADDinhalation/RfDinhalation = ADDderm contact/RfDderm contact
CR = ADDingestion × SFingestion = ADDinhalation × SFinhalation = ADDderm contact × SFderm contact
Refer to Table S5 for the values of RfDingestion, RfDinhalation, RfDderm contact, SFingestion, SFinhalation, and SFderm contact.
When the HI < 1.0, there is a low non-carcinogenic risk, while when the HI > 1.0, there is a significant health risk. In general, a TCR < 1 × 10⁻⁶ can be ignored, a TCR between 1 × 10⁻⁶ and 1 × 10⁻⁴ is tolerable, and a TCR > 1 × 10⁻⁴ indicates a significant carcinogenic risk [51,52].
3. Results and Discussion
3.1. The Heavy Metal Concentrations in YRDNNR
In order to comprehend the degree of heavy metal pollution in YRDNNR, samples of sediment were gathered from specific locations and subjected to an analysis for their levels of seven heavy metals, as depicted in Figure 2. The amounts of Mn, Cu, Zn, Cr, As, Cd, and Pb in the northern region of YRDNNR ranged from 440.64 to 671.39 mg/kg, 8.23 to 25.92 mg/kg, 35.96 to 74.08 mg/kg, 33.52 to 54.93 mg/kg, 9.43 to 17.59 mg/kg, 0.07 to 0.12 mg/kg, and 11.55 to 23.07 mg/kg, respectively. The amounts of Mn, Cu, Zn, Cr, As, Cd, and Pb in the southern region of YRDNNR ranged from 164.25 to 874.51 mg/kg, 2.85 to 35.68 mg/kg, 10.83 to 119.23 mg/kg, 23.00 to 77.09 mg/kg, 3.85 to 27.15 mg/kg, 0.05 to 0.25 mg/kg, and 10.99 to 37.91 mg/kg, respectively. In general, the minimum and maximum ranges of the metal elements in the southern region were larger than those in the northern region, but the average values of Mn, Cu, Zn, and As in the northern region were slightly higher than those in the southern region. These results indicated that the heavy metal content in YRDNNR presented a distinct spatial pattern of “homogeneity in the northern region and heterogeneity in the southern region” as a whole. And the average concentrations were prone to extreme values.
Several criteria were utilized to determine the level of heavy metals in YRDNNR. In the assessment of heavy metal contamination, it has generally been believed that the parent rock is a significant element in determining the heavy metal composition of sediments [53]. To begin, we compared the element concentrations in YRDNNR to those in the global upper continental crust composition [54], as well as the background values for China [55] (Figure 2). The mean Cu, Zn, Cr, and Pb concentrations in YRDNNR were all lower than the global and Chinese background values. The mean value for As was higher than both the global and Chinese background values. The mean Cd value was close to both the global and Chinese background values. The mean Mn concentration was lower than the Chinese background value (Figure 2).
Furthermore, the natural reserve’s mean concentrations of Mn, Cu, Zn, As, Cd, and Pb were higher than the equivalent background values for the YRD [41], although they did not surpass the threshold values for marine sediment quality (Class I). This indicated that these six metals have experienced varying degrees of enrichment. In particular, the average As concentration was nearly twice the background value. Specifically, all seven heavy metal concentrations were below the threshold values for marine sediment quality (Class I) in the northern region. However, the Cu content at sampling point S36 and the As content at sampling points S36, S37, and S39 in the southern region exceeded the threshold values for marine sediment quality (Class I). The Cr content at all of the sampling points in the northern region was found to be below the background value, suggesting that the Cr levels had largely remained within their natural background concentrations and had been minimally affected by external disturbances. Although the southern region’s average Cr concentration was below the background value, the Cr content at sampling points S21, S34, S36, S37, and S39 exceeded the background value. The levels of Mn, Cu, Zn, Cr, As, Cd, and Pb at S36, S37, and S39 were generally higher compared to those at the other sampling points. This could be explained by the fact that these three sampling points were located at the midpoint of the triangle formed by the abandoned Qingshuigou flow path and the current flow path. Over time, the heavy metal content had continuously accumulated due to the action of this river. Moreover, it was noted that there were significant differences in the distribution of the seven heavy metals among the sampling stations in the southern region. This variation might be ascribed to the pathway of the current Yellow River estuary in this area. Because of the continuous interaction between the Yellow River and Bohai Sea, the sediments undergo complex changes because of the reciprocating flow between the land and sea, resulting in constant fluctuations in the heavy metal content [56,57].
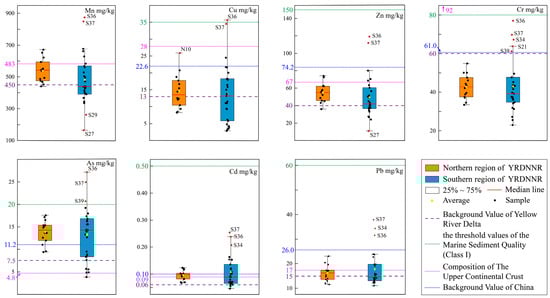
Figure 2.
Heavy metal concentrations in coastal wetlands of YRDNNR [41,54,55,58].
Figure 2.
Heavy metal concentrations in coastal wetlands of YRDNNR [41,54,55,58].
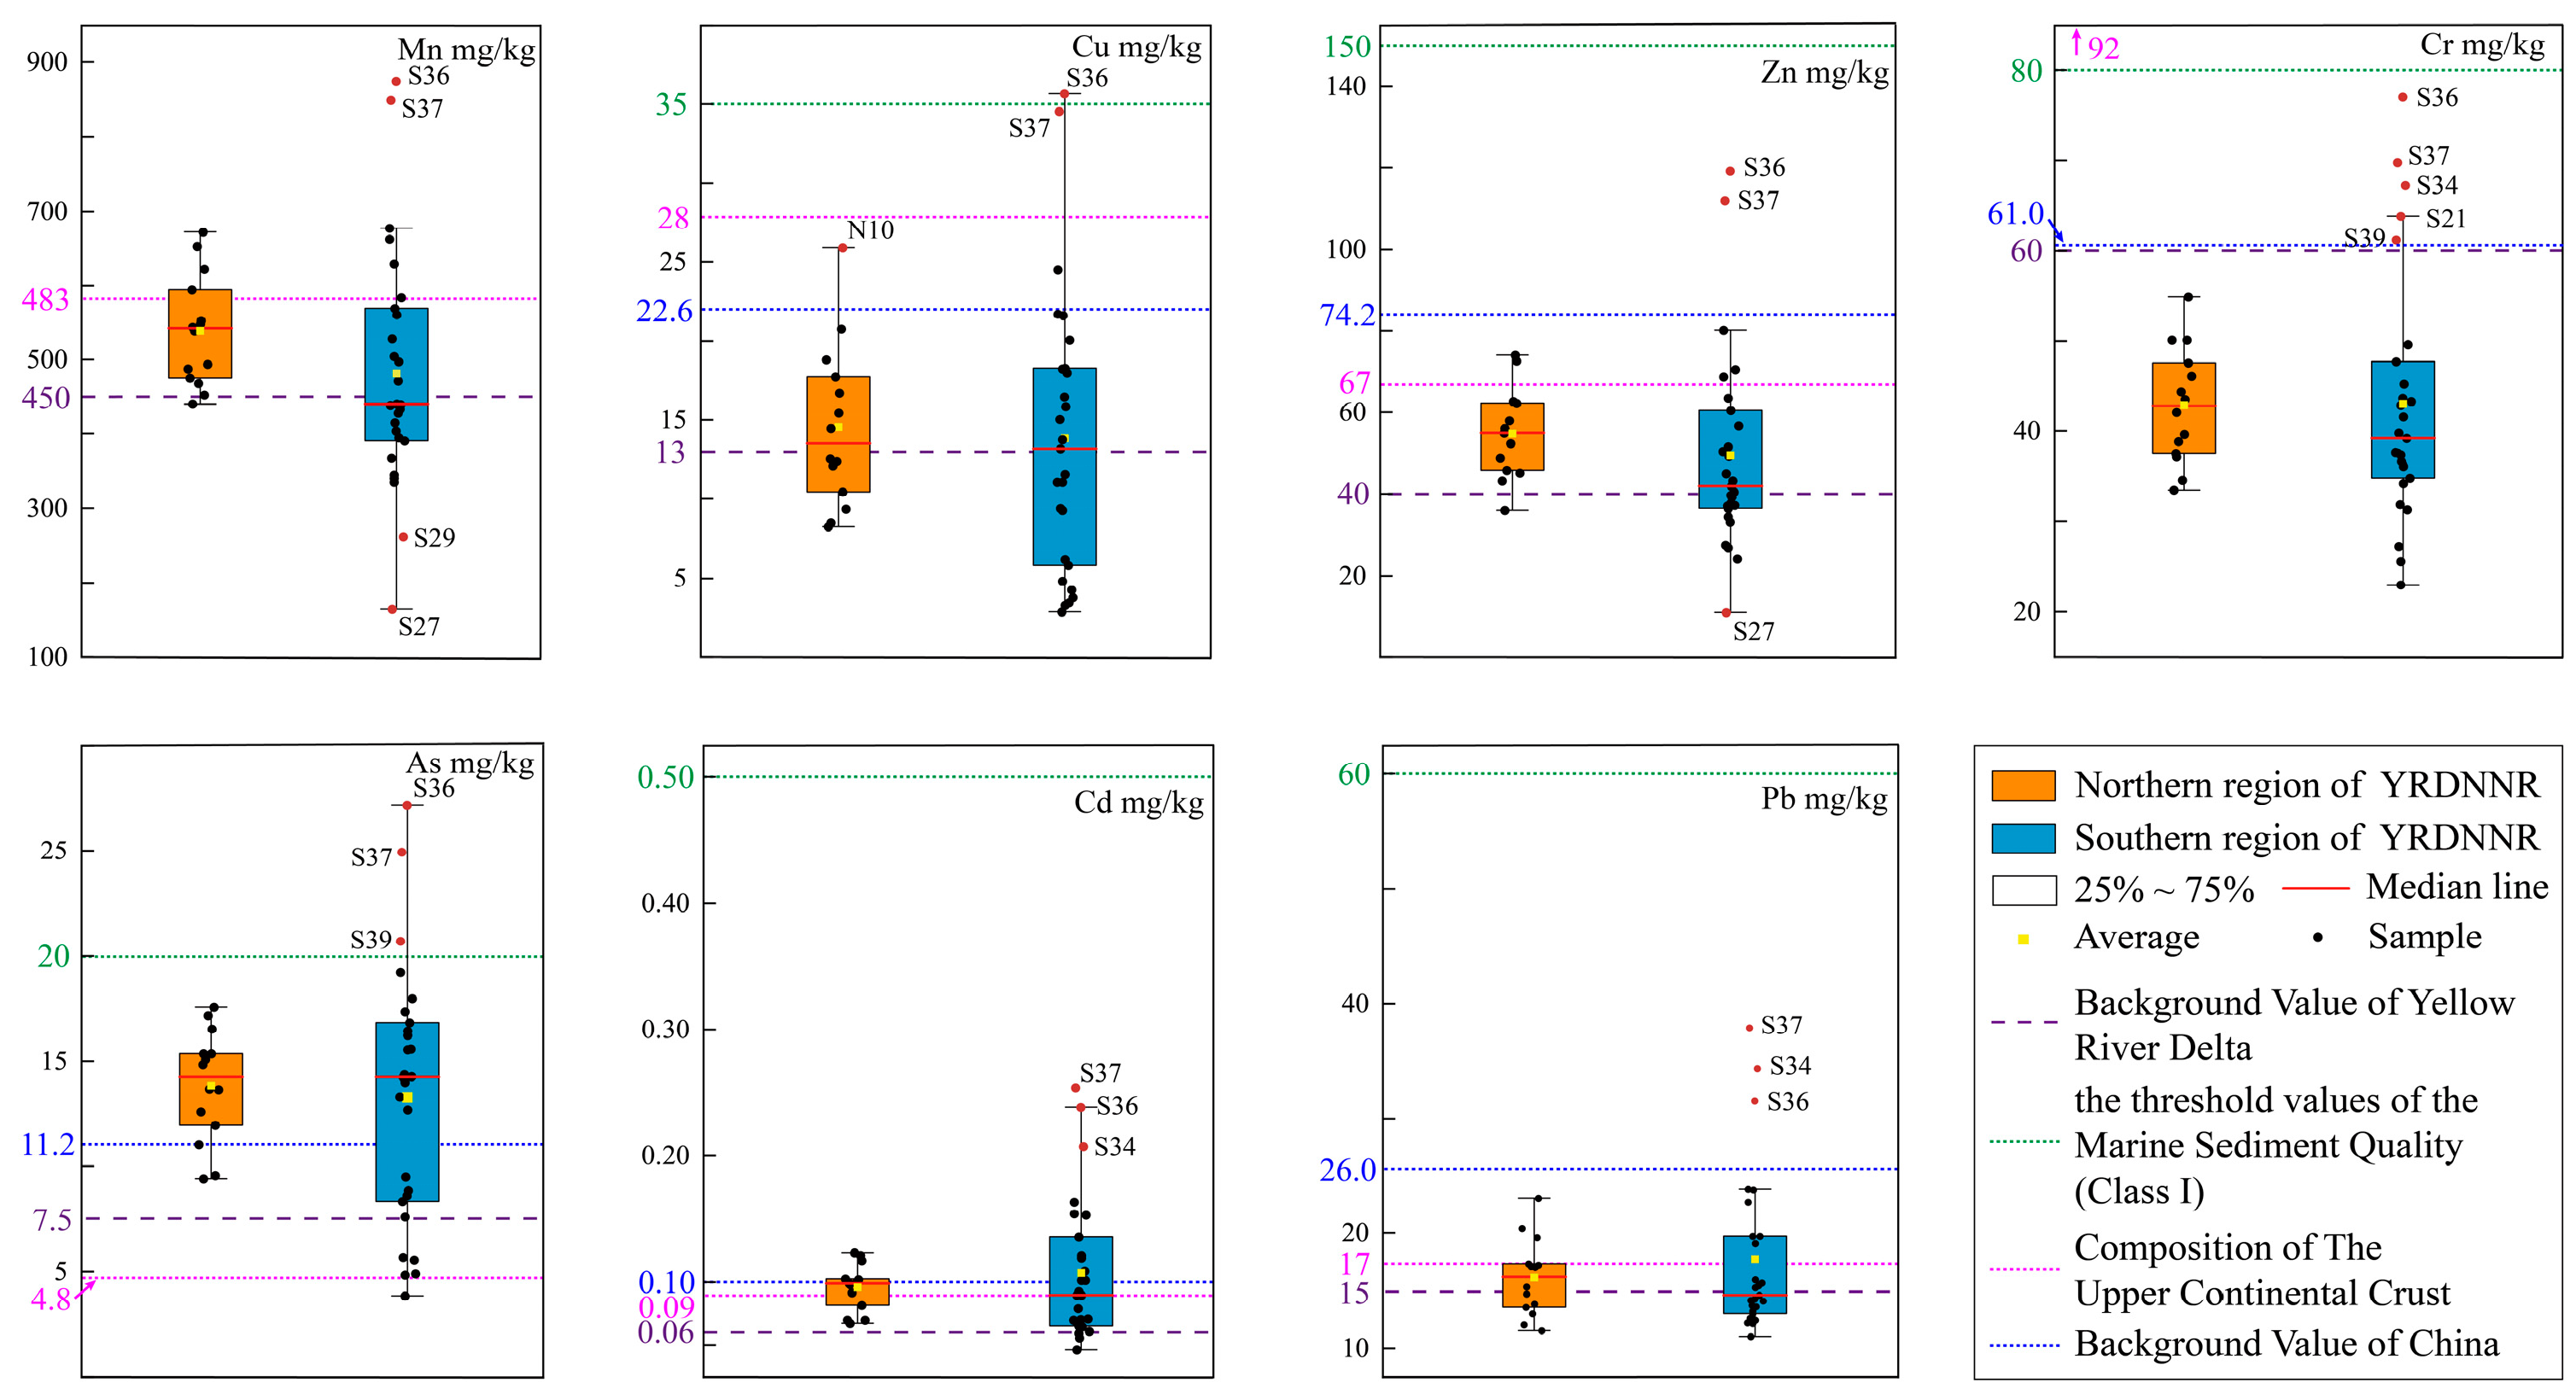
Table 1 presents the concentrations of heavy metals in the sediments of YRDNNR and the Laizhou Bay coast, thereby highlighting the management efficacy of YRDNNR. The data manifested minor variations in the Mn and Pb levels between the northern and southern regions of YRDNNR, indicating a relatively balanced environmental quality across the protected area. Nevertheless, future ecological conservation endeavors should adopt regionally differentiated management strategies, tailoring protective measures in accordance with the distinct characteristics of each sub-region. The average concentrations of Mn, Cu, Zn, and Pb in YRDNNR were lower than those detected in Laizhou Bay, whereas the average concentration of Cr was higher in YRDNNR. In contrast, the average levels of As and Cd were nearly the same in both regions. The overall concentrations of heavy metals in YRDNNR were either lower than or a par with those in Laizhou Bay, suggesting that the degree of heavy metal pollution in YRDNNR was relatively slight. These findings indicate that since the reserve’s establishment, not only has the biological environment improved and have bird populations increased but the reserve has also had a favorable impact on heavy metal control. Although heavy metals are inherently resistant to degradation and transformation, their concentrations can still be effectively managed through enhanced regional protection measures and strict regulation of human activities.

Table 1.
Concentrations of heavy metals in coastal sediments from YRDNNR and Laizhou Bay (mg/kg).
Furthermore, a comparison with data from other national nature reserves in China (Table 2) demonstrated that generally, the heavy metal content in YRDNNR was lower than that in other reserves, with the exception of As. Remarkably, the concentrations of Cu, Zn, Cr, and Pb in the YRDNNR were significantly lower, indicating a relatively mild level of heavy metal pollution in its sediments. Among the compared protected areas, the Cd content in YRDNNR was at a medium–low level, whereas the As content was at a medium–high level. The elevated As levels in YRDNNR might be ascribed to the geological background of the YRD and the inputs from the lower reaches of the Yellow River. Compared to other national nature reserves, YRDNNR has certainly received As pollutants carried by the Yellow River’s runoff near the current estuary, and the highly hydrodynamic conditions in the estuary have made it easier for As to dissolve and concentrate [59]. In brief, the environmental quality of YRDNNR was relatively good, and the ecological functions of the reserve remained stable. Nevertheless, greater attention should be directed toward understanding the sources of As and assessing its potential ecological risks.
Table 2.
Average concentrations of heavy metals in sediments from this study and other national nature reserves in China.
3.2. The Degree of Heavy Metal Contamination in YRDNNR
3.2.1. The EF
Figure 3 presented the EF findings regarding the seven heavy metals in YRDNNR. We found considerable disparities in the ranges of the EFs between the northern and southern regions of YRDNNR. The EF range for each element in the northern region was rather concentrated, with the greatest value not exceeding 1.84 (As). In contrast, the maximum EF values for all of the elements in the southern region were higher than those in the northern region, with the maximum values for As (0.54–2.53), Cd (0.70–2.97), and Pb (0.74–1.98) reaching 2.53, 2.97, and 1.98, respectively, significantly exceeding the maximum values of the corresponding elements in the northern region (Cd: 1.62; As: 1.84; Pb: 1.15). The maximum EF for Cd (2.97) in the southern region demonstrated moderate enrichment (2 ≤ EF < 5), while the maximum in the northern region (1.62) was only slightly enriched. In addition, YRDNNR was most prominently enriched in these two heavy metals, especially As, on account of its higher median value. The YRD is typified by saline–alkali soil and mainly engaged in winter wheat cultivation. To boost grain production, a substantial amount of N-P-K fertilizer has been applied, and the continuous utilization of phosphorus fertilizer might have led to the accumulation of heavy metals, particularly Cd, in the soil [67]. During the water–sediment regulation scheme, a large volume of freshwater is released into the downstream area within a short time span. Consequently, the sediments containing Cd on both sides of the river channel are carried into the sea, along with freshwater, and deposited into the estuary. This may help to explain why the southern portion of the reserve’s surface sediments is more noticeably enriched in Cd.
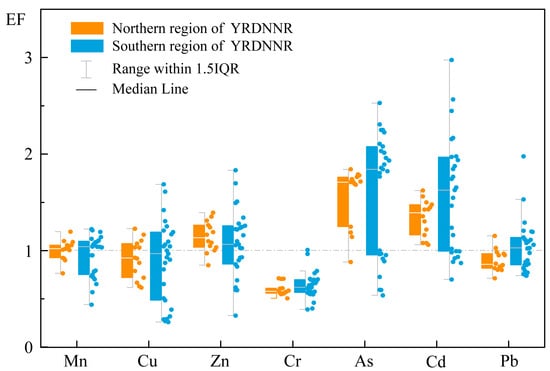
Figure 3.
EF values for heavy metals in YRDNNR.
As and Cd were the most toxic metallic elements to living organisms. The co-occurrence of As and Cd in sediments poses a substantial environmental and public health risk, especially through their bioaccumulation in rice and aquatic organisms [68,69]. Human activities, including the application of fertilizer and other agricultural operations, have made a more significant contribution to the increased concentrations of As and Cd in the environment in comparison to natural processes such as weathering [70,71]. All of the EF values for Cr were below 1, indicating no enrichment. Mn, Cu, Zn, and Pb were either not enriched or were only slightly enriched in YRDNNR.
3.2.2. RIs
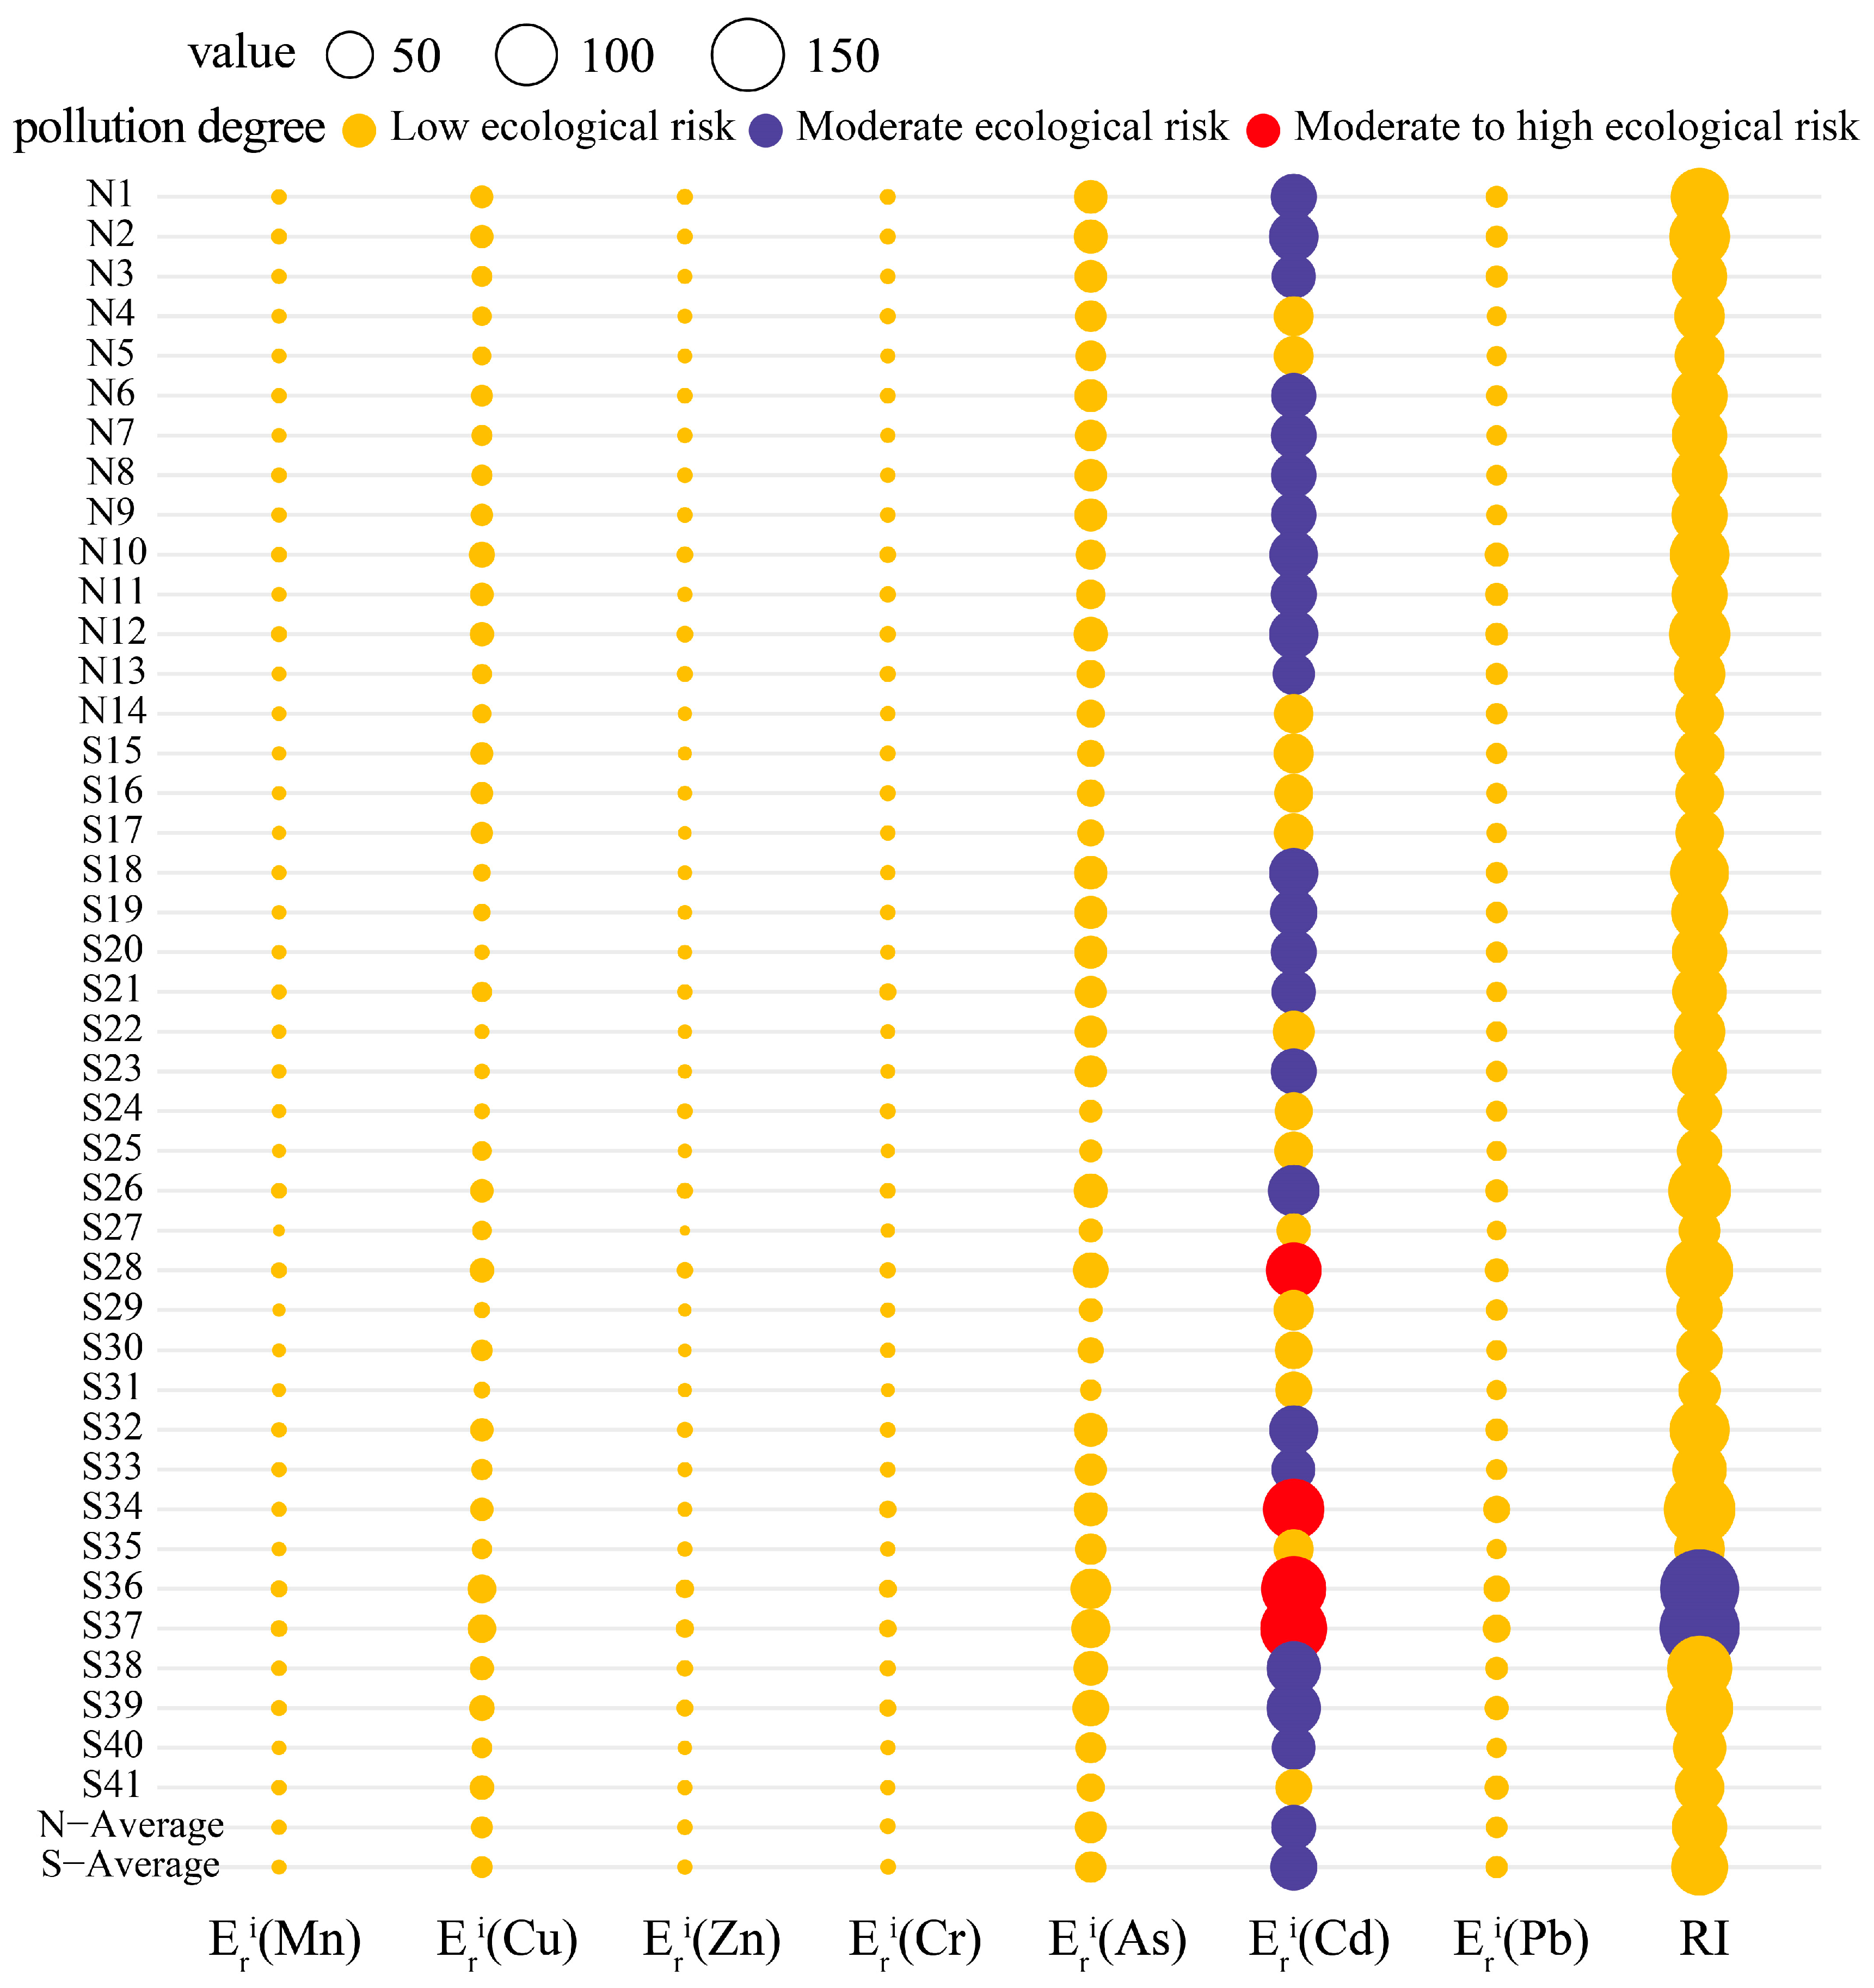
We evaluated the RIs (Figure 4) for the heavy metals in the YRDNNR coastal wetlands to evaluate the impact of toxic heavy metals on the local biota. The of the six metals (Mn, Cu, Zn, Cr, As, and Pb) exhibited minimal variation among the sampling points, with all indicating a low ecological risk ( < 40). In the northern region, the RI range was 57.80 to 103.53, and the potential ecological risk was relatively stable. However, the for Cd presented a moderate ecological risk (40 ≤ < 80), but the overall potential risk was relatively controllable. In contrast, the southern region demonstrated a higher indication of potential pollution, with significant differences in the Cd levels detected at several sampling points. S28 ( = 81.83), S34 ( = 103.5), S36 ( = 119.40), and S37 ( = 127.10) had a moderate to high ecological risk, with the maximum (127.10) increasing by 106% compared to that in the northern region. These sites became the most prominent sources of potential contamination. Furthermore, the comparison of the RIs indicated the potential hazard in the southern region, where the maximum RI reached 193.31, representing an 87% increase over that in the northern region (103.53), suggesting that Cd greatly enhanced the environmental risk. Given its high toxicity value, it can be concluded that Cd was the main factor driving the RI in YRDNNR’s surface sediments. In addition, the significant volatility and severe concentrations of several elements (particularly Cd) in the southern region may indicate the impact of human activities such as fertilizer usage, which should be confirmed in conjunction with studies on their sources.
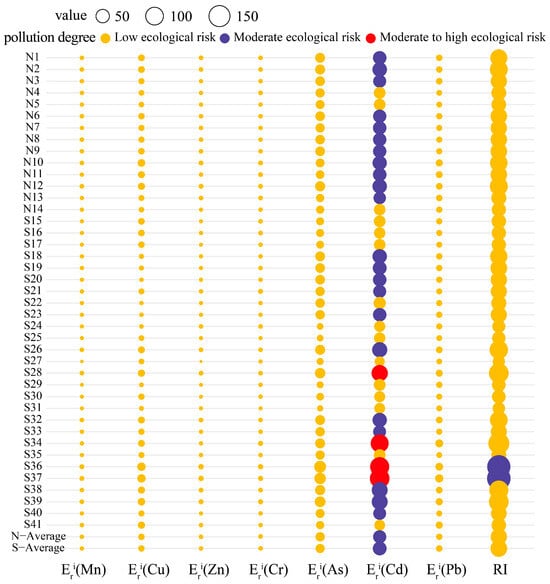
Figure 4.
RIs for heavy metal pollution in YRDNNR.
The results on the EFs revealed significant accumulation of As and Cd in the coastal wetlands, with As being more highly concentrated. The primary hazardous factor identified using the RIs was Cd since the potential ecological risk was closely linked to the inherent toxicity of this substance. The toxicity response coefficient for Cd was three times that of As [42]. Consequently, even though the EF value indicated that the Cd contamination was lower than As contamination, it remains crucial to consider the possible ecological implications of Cd.
There were indications of metal pollution even though there has not been any human activity in the reserve for a long time. This not only indicated the persistent presence of heavy metals but also raised the possibility that more severe heavy metal contamination might exist in other delta regions. Currently, the Yellow River estuary is in the south. The four sampling points in this area showed moderate to high levels of Cd contamination, suggesting that human activities have contributed to the pollution of the downstream sections of the Yellow River, leading to the accumulation of heavy metals at the estuary. Moreover, it is not inconceivable that heavy metals incurred by marine processes have also accumulated in this region.
3.2.3. SQGs
Table S6 presents the initial limits for the six heavy metals and the distribution of the samples within different ranges (the limit for Mn was not specified in the method). Cu, Cr, As, and Pb might occasionally exert adverse impacts on biota and aquatic ecosystems. As was the most common element contaminating biota and aquatic environments, with 88% of the samples being between the TEL (7.24 mg/kg) and PEL (41.6 mg/kg), showing that it occasionally had negative impacts on aquatic life. The Cu content was second, with 22% of the samples surpassing the TEL (18.7 mg/kg) but not the PEL (108 mg/kg). Cr and Pb had relatively low contamination levels, with 15% and 7% of the samples being within the TEL to PEL range, respectively. Fortunately, none of these samples exceeded the PEL, suggesting that biota and ecosystems would not be harmed by the concentrations of the six heavy metals in sediments. Only a small percentage of the sample points sporadically had negative consequences, yet As requires more attention.
Based on these findings, we deduced the likelihood of collective toxic effects of these metallic elements, namely the mPEL-Q. According to Long (1998) [72], the probability of toxicity for an mPEL-Q < 0.1 is 8%; for 0.11 < mPEL-Q < 1.5, it is 21%; for 1.51 < mPEL-Q < 2.3, it is 49%; and for mPEL-Q > 2.3, it is 73%. In this study, the average mPEL-Q value for the YRDNNR was 0.18, with a range from 0.09 to 0.37 (Figure S1). Consequently, the combination of the six heavy metals at most of the sampling points had a toxicity probability of 21%.
3.2.4. The HRA
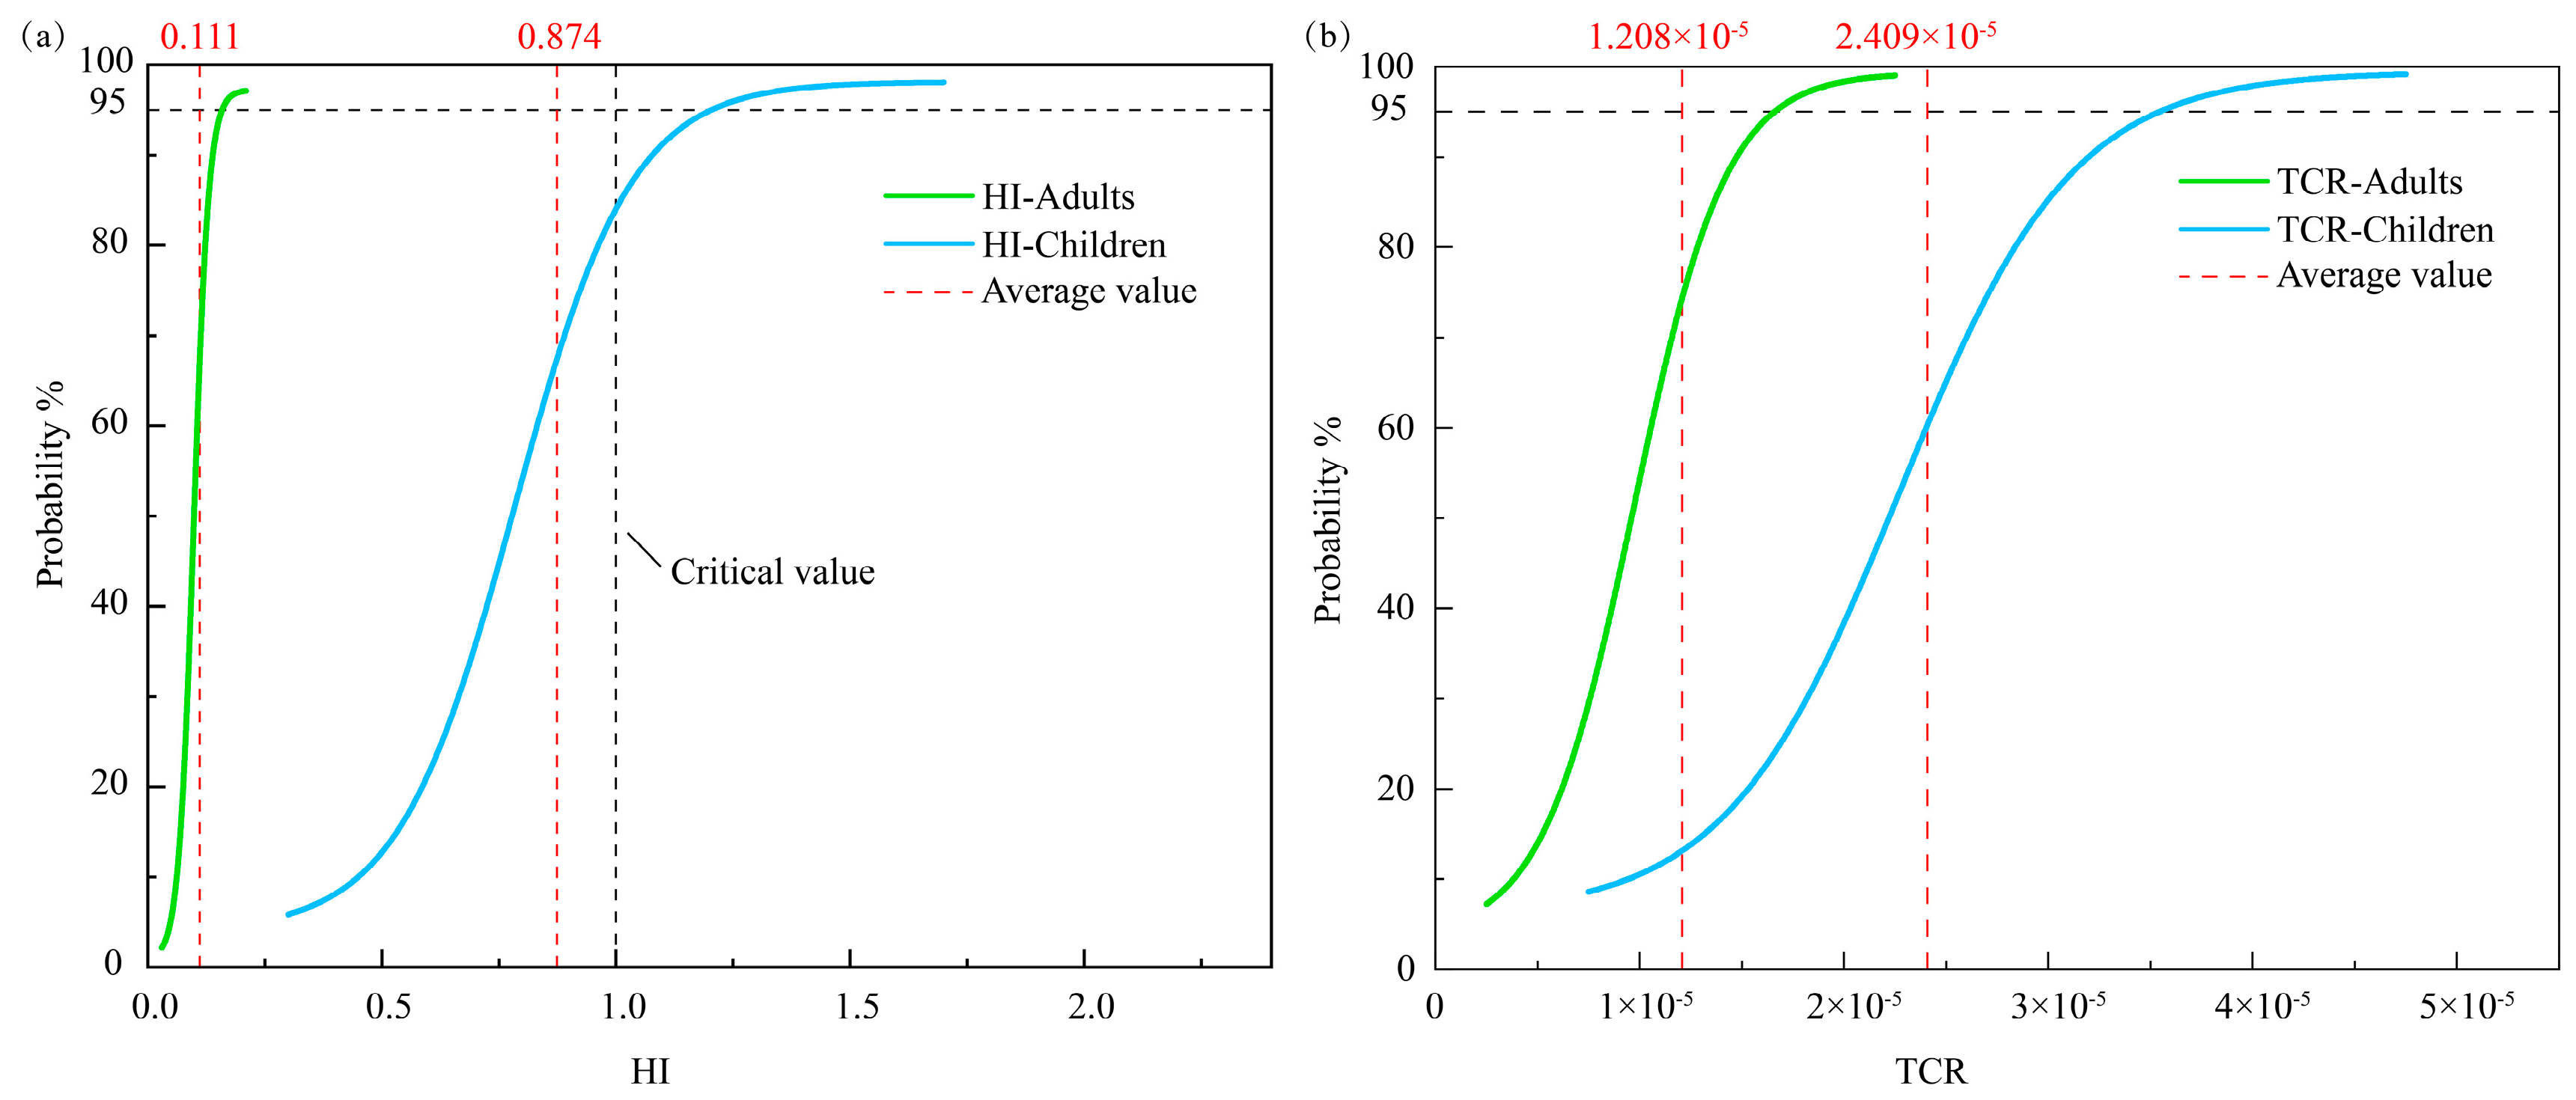
The findings of the health risk assessment indicated that the TCR for both adults and children fell within the permitted range (1 × 10⁻⁶ to 1 × 10⁻⁴), as depicted in Figure 5b. Nevertheless, the average TCR value for children (2.409 × 10⁻⁵) was double that for adults (1.208 × 10⁻⁵), suggesting that children were more prone to cancer. This discrepancy is likely due to a combination of factors. Firstly, children typically have higher exposure to pollutants relative to their body weight, such as through direct contact with contaminated soil or through consuming tainted produce, compared to that in adults. Secondly, children’s blood–brain barrier, liver, and kidney detoxification systems are not fully developed, and their ability to metabolize metallic elements like As and Cd is weaker, leading to an extended half-life of these elements in their bodies, thereby increasing the risk of cancer [73]. Furthermore, children undergo active cell division during the growth and development stage, and their incomplete DNA repair mechanisms leave them more susceptible to irreparable harm [74]. Regarding the HI, the average value for children (0.874) was approximately eight times larger than that for adults (0.111). Additionally, the HI for adults was found to be lower than the critical value (HI < 1.0). In contrast, 26.83% of the samples (primarily in the southern region of YRDNNR) exceeded the critical values for the children’s HI, indicating a potential risk of non-carcinogenic effects on children in specific local areas (Figure 5a). The disparity in the TCR and HI between adults and children not only signified variations in their exposure patterns but also underscored children’s susceptibility in terms of physiological metabolism, sensitivity to toxic substances, and environmental interactions.
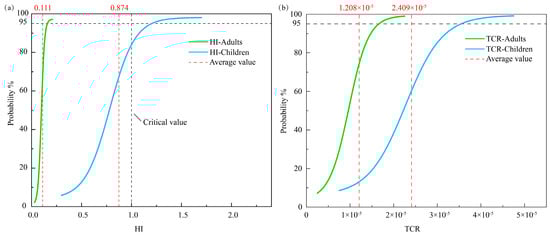
Figure 5.
Probability density functions of the (a) HI and (b) TCR of heavy metals in YRDNNR.
The HQ values for ingestion, dermal contact, and inhalation declined successively regarding the non-carcinogenic hazards associated with the primary exposure pathways (Figure S2). Although the risk of dermal contact was secondary to that of ingestion, in humid southern climates, the increased soil moisture may have increased the transdermal permeability of metallic elements. And the contribution of this pathway may have been exacerbated by children’s prolonged outdoor activity and weakened skin barrier function [75]. In addition, ingestion also carried a higher carcinogenic risk than that of the other two pathways. It is widely acknowledged that pesticides and fertilizers are indispensable to our agriculture. Elements such as As, Cd, and Pb are among the most frequently used. As agricultural production has advanced, these substances have continuously been introduced, and some remain in agricultural products, thereby becoming part of the food web and silently entering the human body [76]. It was noteworthy that the current risk assessment models were based on the linear superposition of heavy metal contamination and the synergistic effects of multiple metals in the actual environment. The multiplication of oxidative damage caused by combined exposure to As and Cd may be underestimated [77]. Since children are more vulnerable to toxic substances than adults are, this makes it crucial to monitor contaminants that are more easily accessible to children during the developmental stage.
3.3. The Relationship Between Heavy Metals and the Measured Environmental Parameters
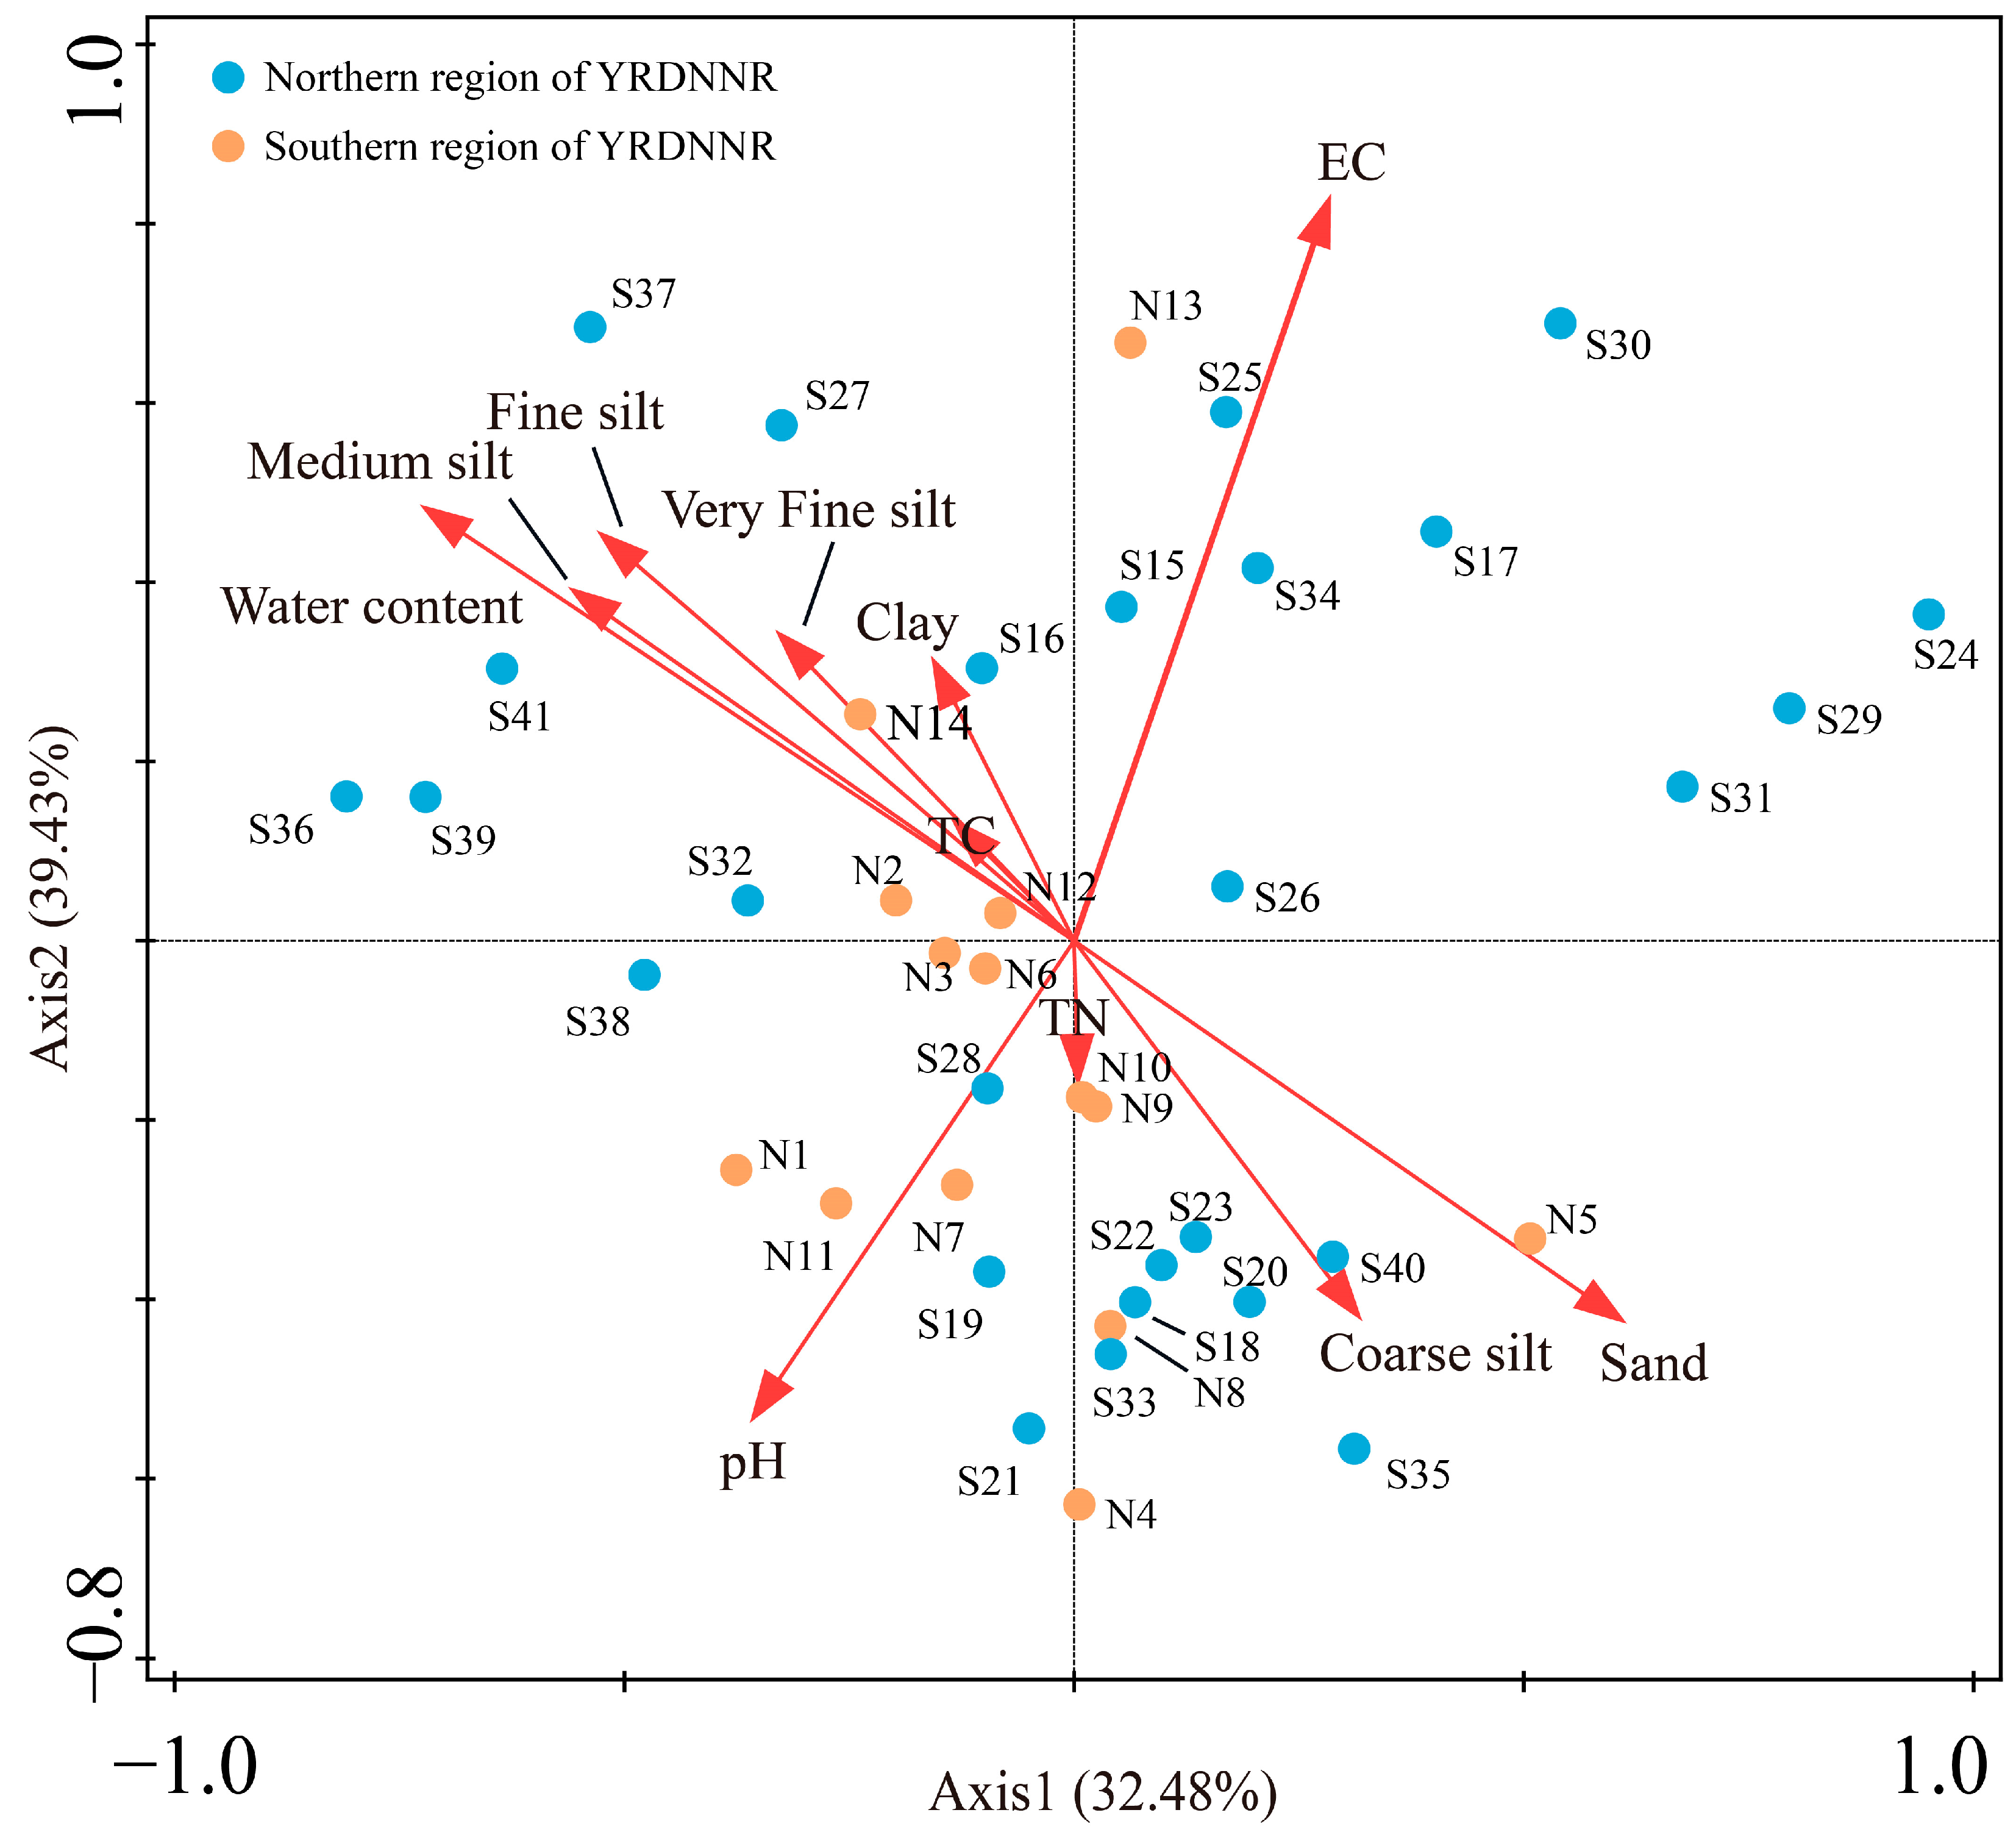
A redundancy analysis (RDA) was used to describe the relationship between the heavy metals and the measured environmental parameters. In Figure 6, the seven heavy metals from each sampling point are presented as species information, while the physicochemical indicators and sediment particle sizes are regarded as environmental factor information. The findings indicated that the sampling points in YRDNNR were primarily impacted by EC and water content in terms of the heavy metal concentrations, with TC and TN having the least influence. However, the distribution of the sampling points was nearly uniform in all four quadrants, indicating a certain degree of spatial heterogeneity. Even when the vegetation types were the same, their heavy metal concentrations did not show significant similarity, which may also have been related to the vegetation density. The strong correlation between water content and medium silt, fine silt, very fine silt, and clay suggested that the higher water content in the sediments was associated with an increased presence of suspended particles in the water, facilitating the absorption of heavy metal ions. Sampling points S36, S37, and S39, located in the second quadrant, were affected by the five influencing factors, which could explain the generally higher content of the seven heavy metals at these locations compared to that at the others (Figure 2).
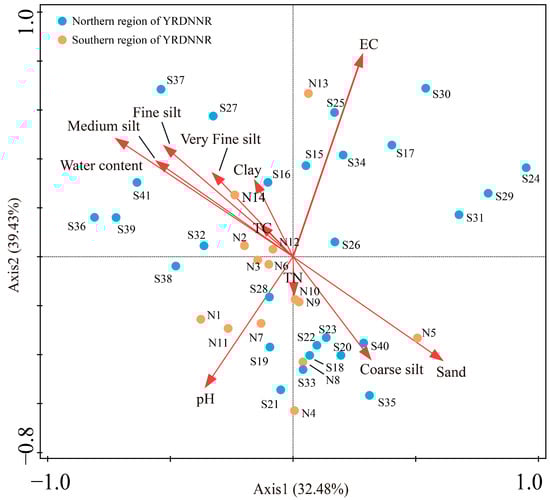
Figure 6.
RDA of heavy metals, particle size, and environmental factors in YRDNNR.
3.4. The Traceability Analysis of the Heavy Metals
3.4.1. Multivariate Statistical Analysis
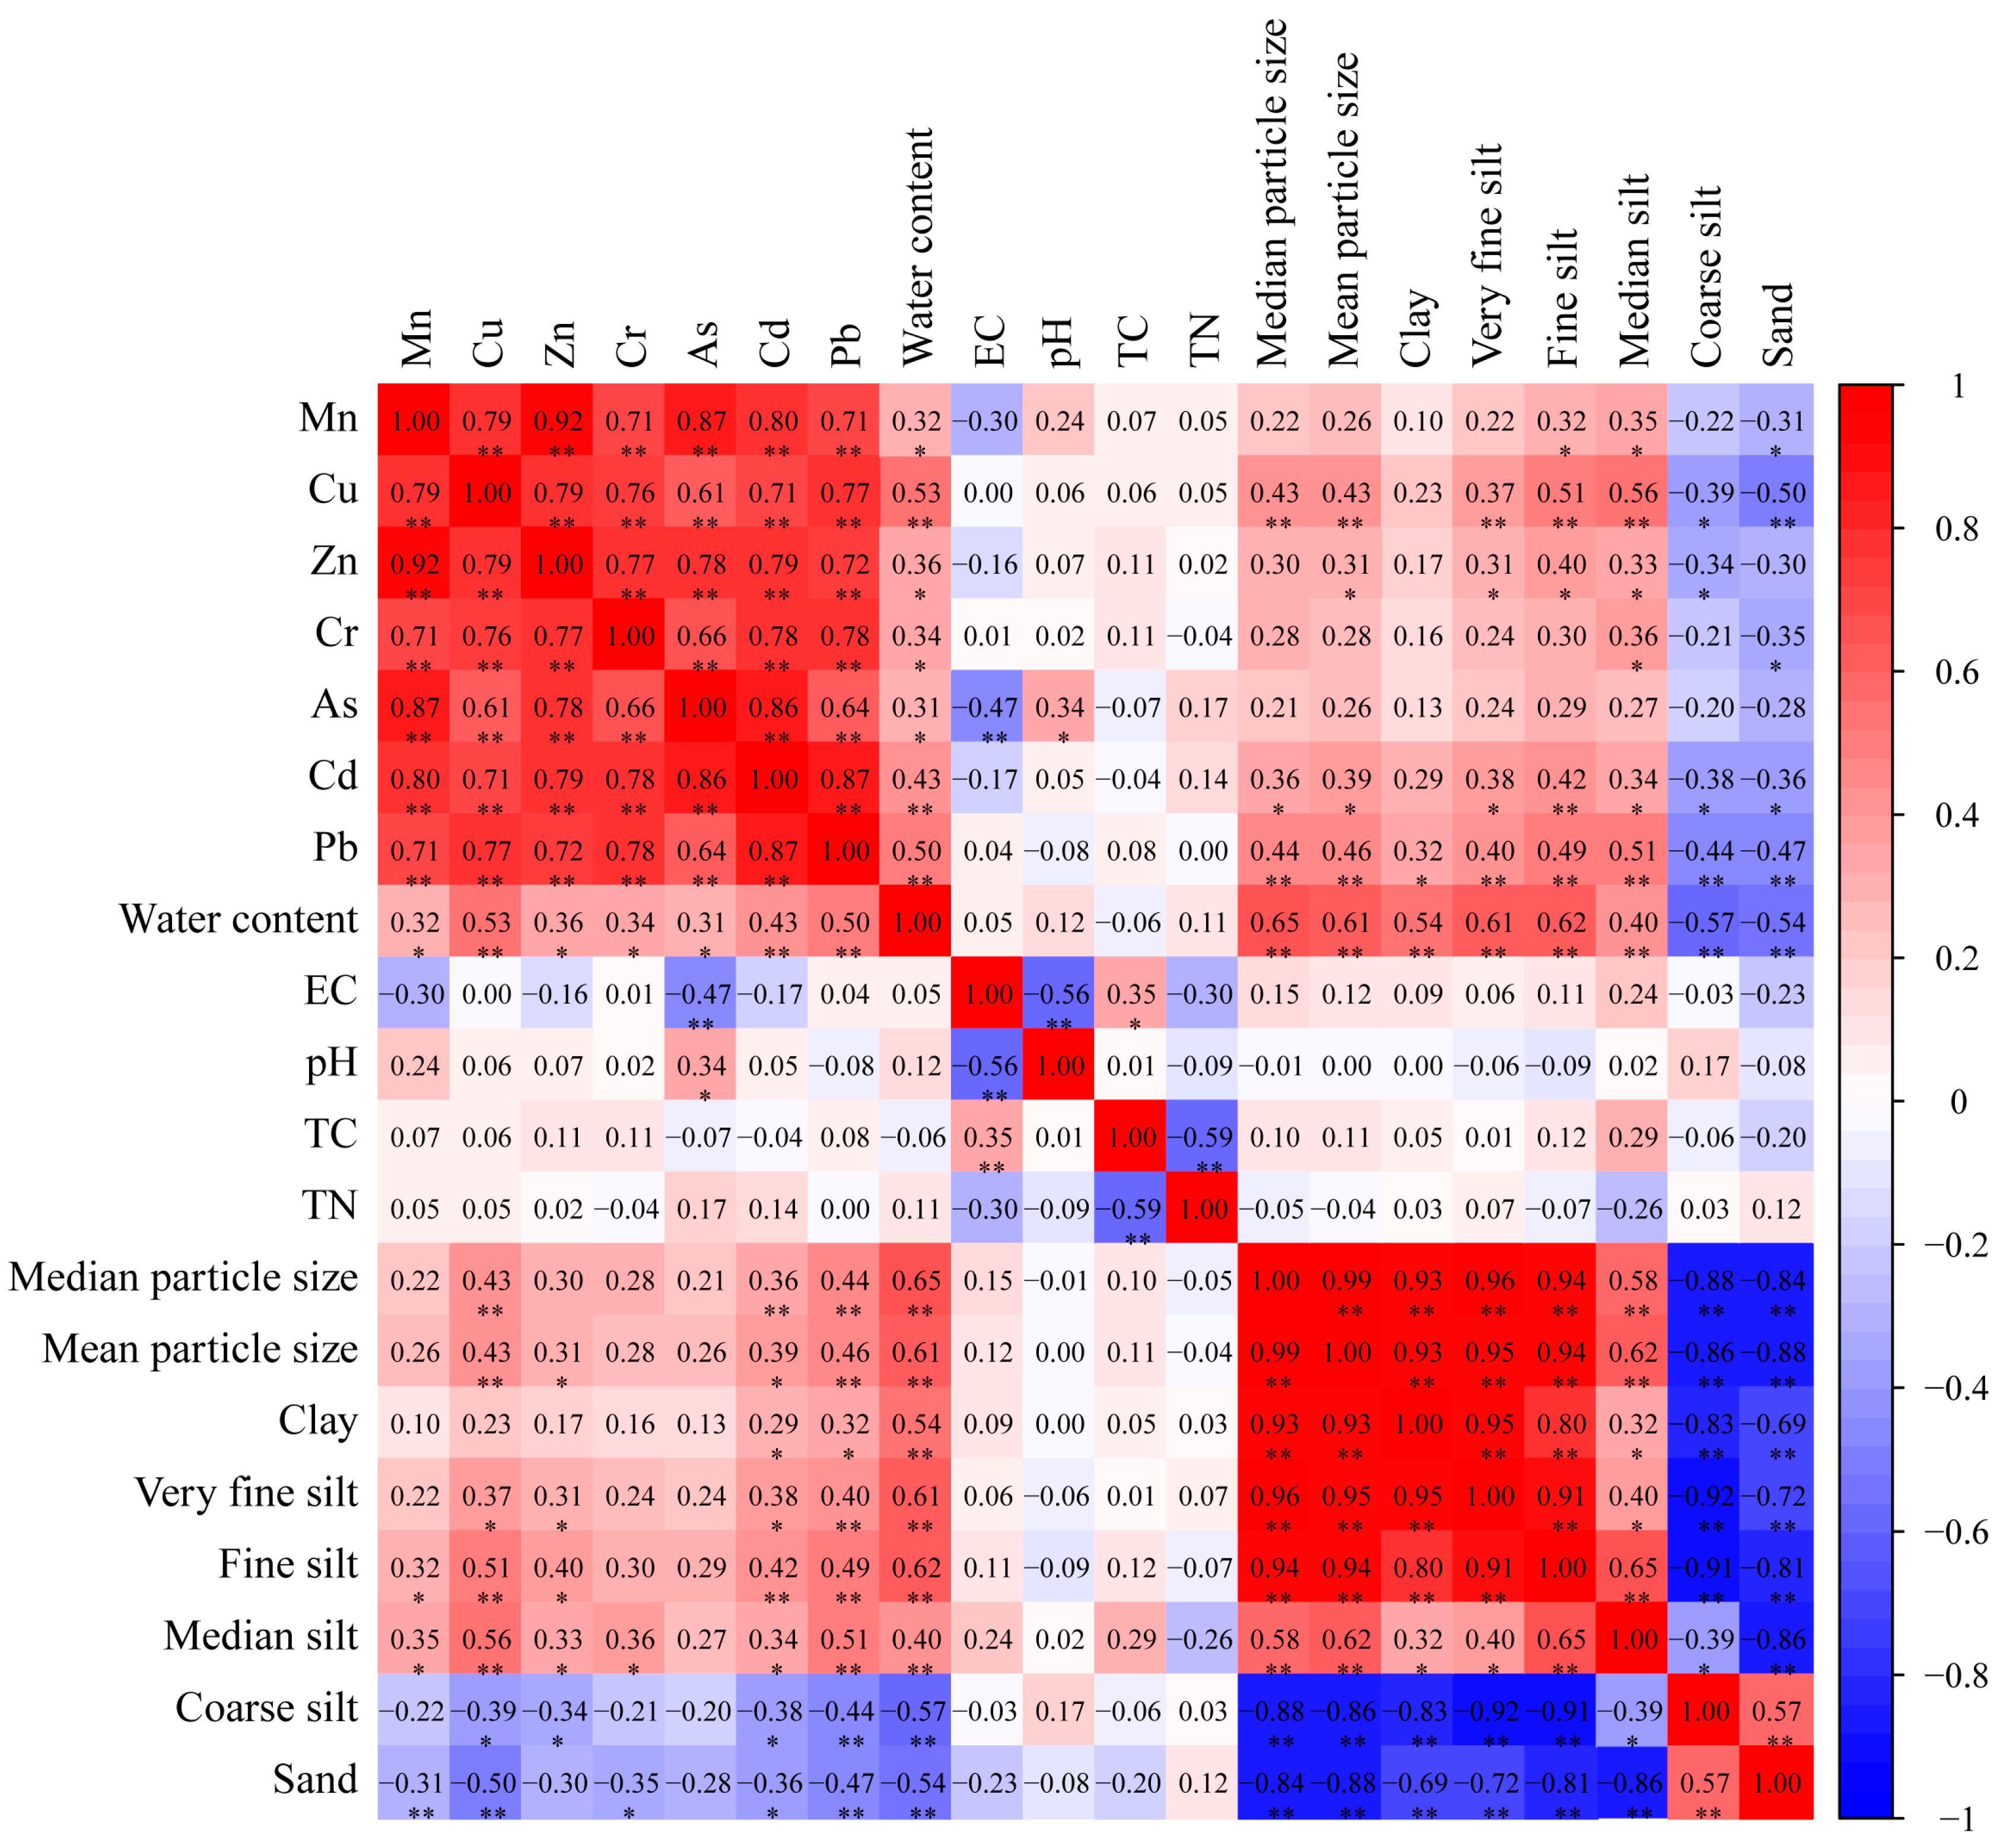
To probe into the intrinsic connections and potential sources of heavy metals in YRDNNR, a Pearson’s correlation analysis was carried out for the seven heavy metals, water content, EC, pH, TC, TN, and sediment particle size (Figure 7). Given that heavy metals tend to be adsorbed by particles smaller than 0.025 mm, silt was classified into very fine silt, fine silt, medium silt, and coarse silt [78]. Generally, there are two primary sources of heavy metals in sediments, natural sources and human-induced activities, which are conveyed to coastal wetlands via rivers. Strong correlations between metals are considered to signify that they stem from similar origins [79]. In YRDNNR, the seven heavy metals exhibited a robust positive correlation (p < 0.01), implying that compound pollution might have been their source. Moreover, the metal elements presented homogeneity and accompanying components [80]. Furthermore, a strong positive association between the seven metals and water content was discovered, indicating that water content was a crucial factor influencing the heavy metal concentrations in YRDNNR.
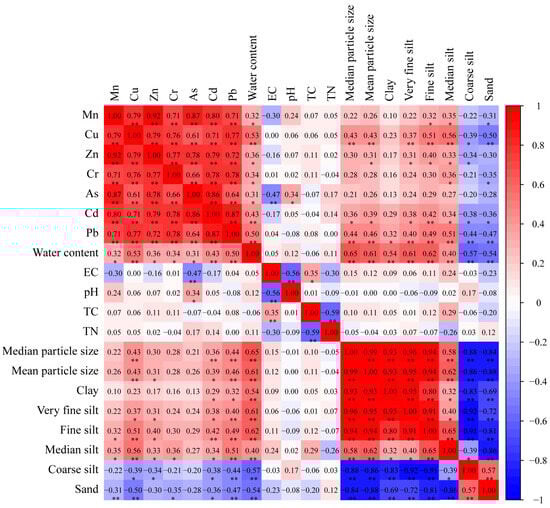
Figure 7.
Correlation analysis of heavy metal concentrations in YRDNNR. Note: * p < 0.05, ** p < 0.01.
Cu, Zn, Cd, and Pb had a significant positive correlation with very fine silt, fine silt, and medium silt while demonstrating a significant negative correlation with coarse silt. This suggested that sediment particle size was an important parameter restricting the heavy metal content [81]. In contrast, there was no substantial correlation between As and sediment particle size; however, there was a markedly significant negative correlation with EC and a significant positive correlation with pH.
The significant positive correlation and the high correlation coefficient among the seven heavy metals in the sediment discloses their mutual dependence and common origins, indicating that an increase in one element in any pollution source may increase the content of other metals [82,83]. Although sediment structure was important to trace metal transfer, this study found that not all of the metal elements were strongly correlated with the sediment particles, suggesting that metal accumulation was influenced by multiple factors rather than a single one.
To more intuitively distinguish the sources of heavy metals in the sediment, this study employed a principal component analysis (PCA) on the same dataset used for the correlation analysis, resulting in the findings presented in Table 3. The KMO–Bartlett’s test, which was performed prior to the PCA, yielded a result of 0.794 (Sig < 0.01). Its value was less than 0.5, indicating that the results of the PCA were reliable for identifying potential pollution sources in YRDNNR [84]. A total of 87.468% of the observed data’s variance can be explained by the two principal components (PC1 and PC2) that were found (Table 3).
Table 3.
Rotated composition matrix of heavy metal content factor analysis.
PC1 was accountable for 45.084% of the variation, with high positive loadings for Cu, Cr, and Pb, which might signify natural sources. Figure 7 indicated that the three metals were associated with sediment particle size, and earlier research has noted that Cu, Cr, and Pb are predominantly obtained from natural deposition [85,86]. Moreover, based on the EFs, the enrichment levels of these three elements were lower than those for the other metallic elements, suggesting less influence from human activities (Figure 3). Consequently, PC1 was regarded to represent natural sources, specifically the source of the sediment parent material.
PC2 could explain 42.384% of the variance, with major positive loadings for Mn, Zn, and As which might imply a relation to agricultural activities. The YRD is an important food supply base, characterized by diverse crop systems, such as vegetable and fruit systems and rice systems [87]. Inorganic arsenic compounds Ca3(AsO4)2, Pb3(AsO4)2, and Na₃AsO₄ are mostly used as herbicides or insecticides. A great number of studies have also shown that phosphate fertilizers are important sources of As in the soil [88,89]. MnSO₄ has often been added to fertilizers to enhance soil fertility and promote normal crop growth because crops lacking Mn are prone to chlorosis. Additionally, the application of manganese-containing pesticides can prevent pests and diseases while increasing crop yields. However, research has demonstrated that relatively little of these fertilizers and pesticides is used and that the majority of it—approximately 70%—ends up in the soil, air, and surface runoff [90]. Zn has frequently been added to livestock feed as a trace element; yet since a significant portion is not absorbed by livestock, it accumulates in the soil, as organic fertilizers are widely used in agricultural practices. Intensive farming practices have led to the accumulation of Mn, Zn, and As in sediments. Moreover, due to erosion during the rainy season, sediments laden with heavy metals enter runoff and settle in the estuary, which has increased the concentrations of Mn, Zn, and As in the surface sediments of the coastal wetlands. Consequently, PC2 was regarded to represent the human impacts of agricultural activity as a source.
3.4.2. The Apportionment of Ecological and Health Hazards Based on Metal Sources
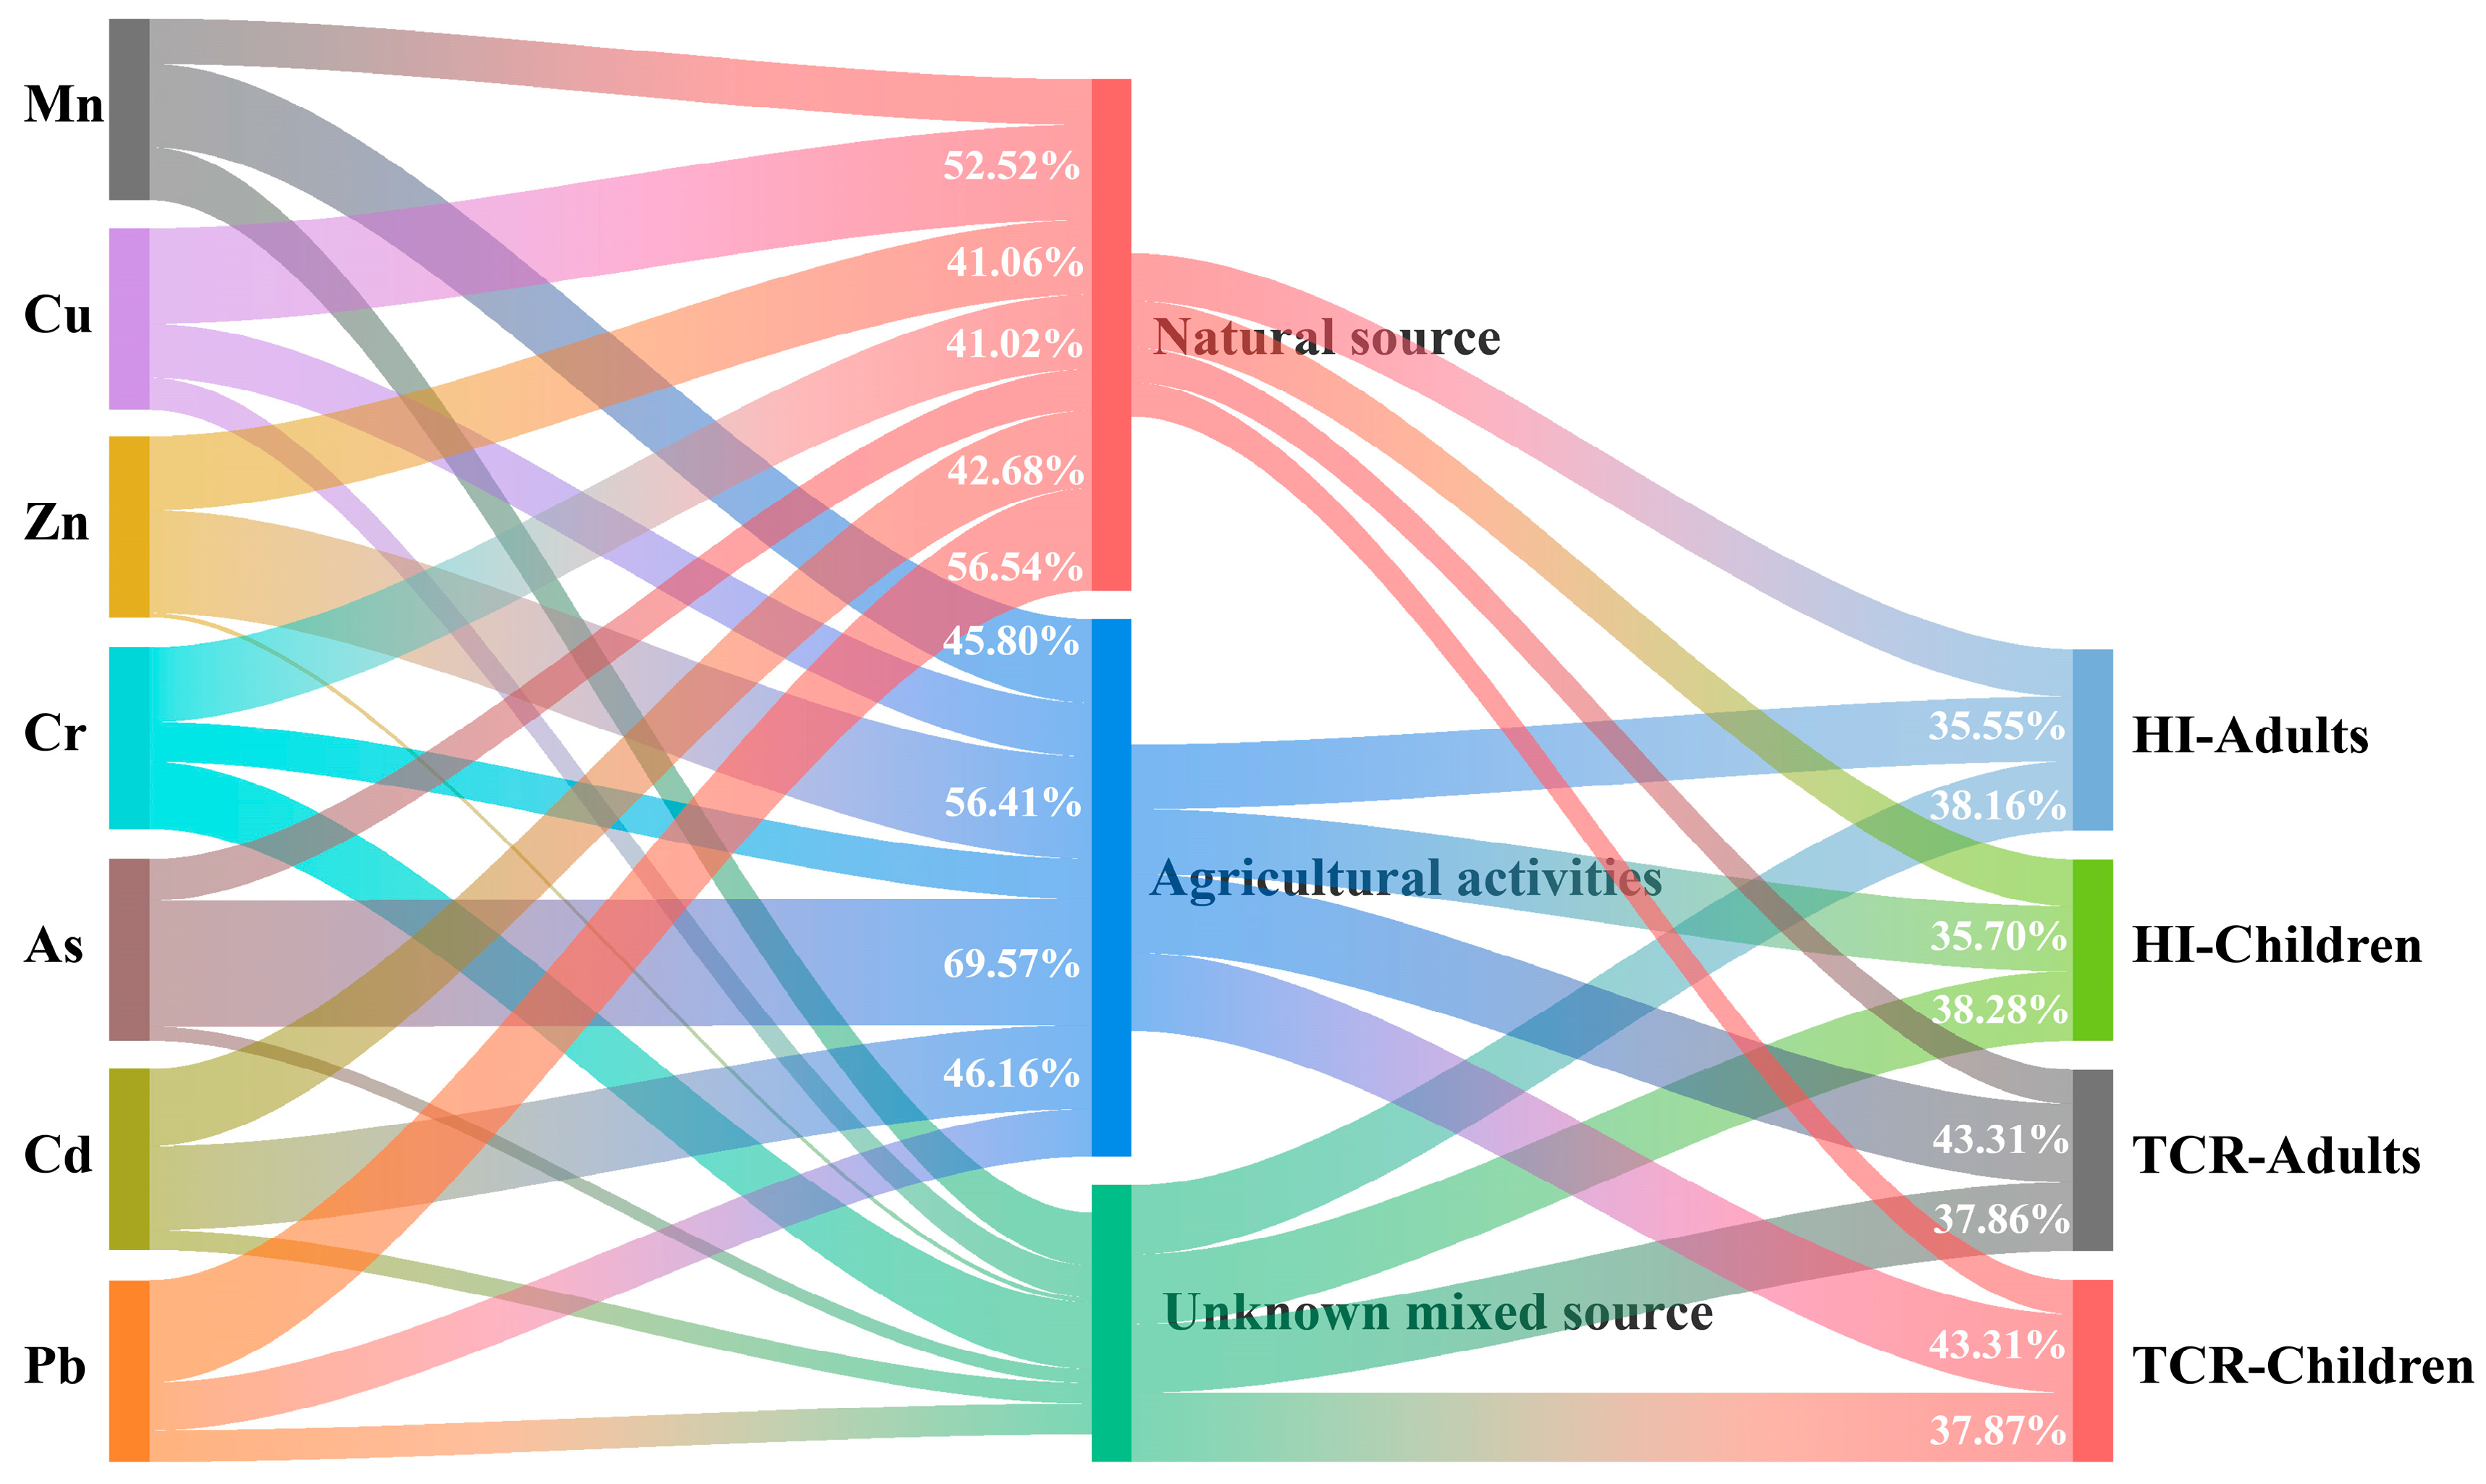
In an effort to pinpoint the origins of the metal elements in YRDNNR and to mitigate ecological risks better, we employed APCS-MLR to assess the proportional impact of various pollution sources on heavy metal contamination. We converted the principal component scores obtained from the principal component analysis into APCSs. Subsequently, a linear regression analysis was conducted for each APCS [91] (Cai et al., 2024). As depicted in Figure 8, natural sources had the greatest impact on Cu and Pb, contributing 52.52% and 56.54%, respectively. Following these, they contributed 42.68%, 41.06%, and 41.02%, respectively, to Cd, Zn, and Cr. The contributions to Mn and As were the lowest, at 25.16% and 22.78%. Agricultural activities made significant contributions to the levels of As, Zn, Cd, and Mn, accounting for 69.57%, 56.41%, 46.16%, and 45.80%, respectively. In contrast, the contributions to Cu and Pb were relatively minor, at 29.68% and 26.29%. As and Cd, which were two heavy metals with severe accumulation in YRDNNR, mainly originated from farming. The primary source of Cd was agricultural activities, with a significant proportion also stemming from natural sources. This is probably because approximately 90% of the sediment parent material in the delta consists of alluvial material from the Yellow River. Cd was deposited into the estuary along with the sediment carried from the middle and upper reaches of the Loess Plateau [32,92]. The accumulation of Cd has been intensified during its continuous migration. Controlling the use of As and Cd in agriculture is crucial for mitigating ecological risks in YRDNNR.
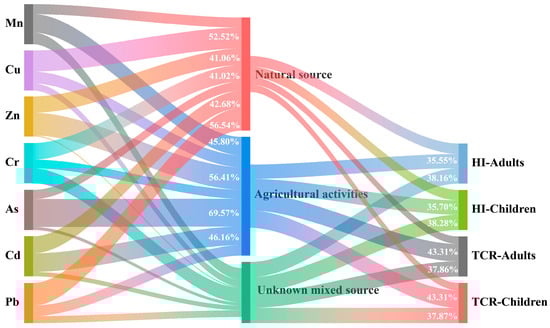
Figure 8.
A Sankey diagram depicting the relationships among heavy metals, pollution sources, and health risks. The corresponding contributions of the elements and sources of pollution are indicated by the width of the colored curves.
By combining APCS-MLR with the HRA, the rates at which various pollution sources have contributed to health hazards were calculated, as illustrated in Figure 8. In the YRDNNR, the carcinogenic risk to local people was primarily attributed to agricultural activities. This has mostly been brought on by the high toxicity and concentration of As and Cd used in agricultural activities.
4. Conclusions
This study evaluated the pollution levels and human health impacts of seven heavy metals (Mn, Cu, Zn, Cr, As, Cd, and Pb) in YRDNNR, identifying agricultural activities as a significant source of pollution and a major contributor to carcinogenic risk. The concentrations of Cu, Zn, Cr and Pb were close to or lower than those in the composition of the upper continental crust, except that the level of As was higher than the global background. The mean concentrations of Mn, Cu, Zn, As, Cd, and Pb were higher than the YRD background values, although they did not surpass the threshold values for marine sediment quality (Class I). Initial comparisons with other national nature reserves in China revealed that YRDNNR maintains a relatively favorable environmental quality and stable ecological functions. However, the sources of As and its potential ecological risks warrant heightened attention. Through the EFs and RIs analyzed, As and Cd were found to pose significant ecological risks. The SQGs indicated that Cu, Cr, As, and Pb occasionally exert adverse effects on biological and aquatic ecosystems, with As being particularly concerning. The HRA results showed that both the HI and TCR for adults and children remained below the critical thresholds; however, children exhibit an approximately eight times greater susceptibility to non-carcinogenic harm than that in adults. Apportionment of the sources using APCS-MLR identified natural and agricultural activities as the primary sources of heavy metals in YRDNNR. Agricultural activities have significantly contributed to As, Zn, Cd, and Mn levels and were the dominant factors in carcinogenic risk. These findings suggest that the existing control measures in YRDNNR (such as restricting industrial activities and protecting wetland ecosystems) have been effective. Future efforts should prioritize addressing low-concentration yet potentially hazardous pollutants, such as As and Cd. Additionally, optimization of the current measures is recommended, including enhancing farmers’ environmental awareness, promoting scientific agricultural practices, reducing fertilizer and pesticide usage, and improving their efficiency to minimize heavy metal inputs. From a research view, this study was limited by the dynamic characteristics of the surface sediments and the data acquisition conditions. Future studies should also explore the regulatory mechanisms behind the lithology background of the natural baseline further.
Supplementary Materials
The following supporting information can be downloaded at: https://www.mdpi.com/article/10.3390/land14040845/s1. References [93,94,95,96] are cited in the Supplementary Materials.
Author Contributions
Conceptualization, K.Z. and S.C.; Methodology, K.Z. and S.C.; Software, K.Z. and Y.Q.; Formal analysis, K.Z.; Investigation, K.Z., S.C., Z.C. and Q.L.; Data curation, K.Z., Y.Q., Z.C. and Q.L.; Writing—original draft, K.Z.; Writing—review & editing, Y.Q. and S.C.; Visualization, K.Z. and Y.Q.; Supervision, S.C.; Project administration, S.C.; Funding acquisition, S.C. All authors have read and agreed to the published version of the manuscript.
Funding
This study was funded by the National Natural Science Foundation of China (U1706214) and a project of China Petroleum and Chemical Corporation (Grant No. 323022).
Data Availability Statement
The original contributions presented in this study are included in the article/Supplementary Material. Further inquiries can be directed to the corresponding author.
Conflicts of Interest
The authors declare no conflict of interest.
References
- Jokinen, S.A.; Jilbert, T.; Tiihonen-Filppula, R.; Koho, K. Terrestrial organic matter input drives sedimentary trace metal sequestration in a human-impacted boreal estuary. Sci. Total Environ. 2020, 717, 137047. [Google Scholar] [CrossRef] [PubMed]
- Li, C.; Wang, H.; Liao, X.; Xiao, R.; Liu, K.; Bai, J.; Li, B.; He, Q. Heavy metal pollution in coastal wetlands: A systematic review of studies globally over the past three decades. J. Hazard. Mater. 2022, 424, 127312. [Google Scholar] [CrossRef] [PubMed]
- Li, Y.; Li, W.; Xu, Y.H.; Xu, J.Y.; Su, K.M.; Liu, H.; Dou, L.X. Transport and deposition of terrestrial organic matter in marine littoral deltas: New evidence from flume experiments and 3D laser scanning. Sediment Geol. 2025, 475, 106784. [Google Scholar] [CrossRef]
- Grand, J.; Meehan, T.D.; DeLuca, W.V.; Morton, J.; Pitt, J.; Calvo-Fonseca, A.; Dodge, C.; Gómez-Sapiens, M.; González-Sargas, E.; Hinojosa-Huerta, O.; et al. Strategic restoration planning for land birds in the Colorado River Delta, Mexico. J. Environ. Manag. 2024, 351, 119755. [Google Scholar] [CrossRef] [PubMed]
- Chen, K.X.; Cong, P.F.; Qu, L.M.; Liang, S.X.; Sun, Z.C.; Han, J.B. Biological connectivity and its driving mechanisms in the Liaohe Delta wetland, China. Ecol. Inform. 2023, 76, 102028. [Google Scholar] [CrossRef]
- Huang, Y.T.; Wu, J.Y. Spatial and temporal driving mechanisms of ecosystem service trade-off/synergy in national key urban agglomerations: A case study of the Yangtze River Delta urban agglomeration in China. Ecol. Indic. 2023, 154, 110800. [Google Scholar] [CrossRef]
- Li, J.; Wang, W.; Li, X.; Liu, S.; Xu, X.; Ren, S. Heavy metals in the continuous river−estuary−sea system of the Yellow River Delta, China: Spatial patterns, potential sources, and influencing factors. Mar. Pollut. Bull. 2024, 209, 117247. [Google Scholar] [CrossRef]
- Tran, D.D.; Halsema, G.; Hellegers, P.J.G.J.; Ludwig, F.; Wyatt, A. Questioning triple rice intensification on the Vietnamese mekong delta floodplains: An environmental and economic analysis of current land-use trends and alternatives. J. Environ. Manag. 2018, 217, 429–441. [Google Scholar] [CrossRef]
- Berg, H.; Lan, T.H.P.; Da, C.T.; Tam, N.T. Stakeholders assessment of status and trends of ecosystem services in the Mekong Delta for improved management of multifunctional wetlands. J. Environ. Manag. 2023, 338, 117807. [Google Scholar] [CrossRef]
- Abotalib, A.Z.; Abdelhady, A.A.; Heggy, E.; Salem, S.G.; Ismail, E.; Ali, A.; Khalil, M.M. Irreversible and large-scale heavy metal pollution arising from increased damming and untreated water reuse in the nile delta. Earths Future 2023, 11, e2022EF002987. [Google Scholar] [CrossRef]
- El-Said, G.F.; Abdel-Mohsen, H.A.; El-Sadaawy, M.M.; Khedawy, M.; Shobier, A.H. Ecotoxicological, ecological, and human health risks of total carbohydrates and some inorganic pollutants on the Nile Delta region along the Egyptian Mediterranean Coast. Mar. Pollut. Bull. 2024, 207, 116816. [Google Scholar] [CrossRef] [PubMed]
- Truchet, D.M.; Buzzi, N.S.; Negro, C.L.; Mora, M.C.; Marcovecchio, J.E. Integrative assessment of the ecological risk of heavy metals in a South American estuary under human pressures. Ecotoxicol. Environ. Saf. 2021, 208, 111498. [Google Scholar] [CrossRef]
- Biswas, T.; Pal, S.C.; Saha, A.; Ruidas, D.; Islam, A.R.M.; Shit, M. Hydro-chemical assessment of groundwater pollutant and corresponding health risk in the Ganges delta, Indo-Bangladesh region. J. Clean. Prod. 2023, 382, 135229. [Google Scholar] [CrossRef]
- Tao, H.; Al-Hilali, A.A.; Ahmed, A.M.; Mussa, Z.H.; Falah, M.W.; Abed, S.A.; Deo, R.; Jawad, A.H.; Maulud, K.N.A.; Latif, M.T.; et al. Statistical and spatial analysis for soil heavy metals over the Murray-Darling river basin in Australia. Chemosphere 2023, 317, 137914. [Google Scholar] [CrossRef]
- Simionov, I.A.; Cristea, D.S.; Petrea, S.M.; Mogodan, A.; Nicoara, M.; Plavan, G.; Baltag, E.S.; Jijie, R.; Strungaru, S.A. Preliminary investigation of lower Danube pollution caused by potentially toxic metals. Chemosphere 2021, 264, 128496. [Google Scholar] [CrossRef] [PubMed]
- Guimarães, R.H.E.; Wallner-Kersanach, M.; Correa, J.A.M. Assessment of anthropogenic metals in shipyard sediment in the Amazon delta estuary in northern Brazil. Environ. Sci. Pollut. Res. 2022, 29, 77007–77025. [Google Scholar] [CrossRef]
- Vahidipour, M.; Raeisi, E.; van der Zee, S.E.A.T.M. Potentially toxic metals in sediments, lake water and groundwater of the Ramsar wetlands Bakhtegan–Tashk, south Iran: Distribution and source assessment. Environ. Technol. Innov. 2022, 28, 102789. [Google Scholar] [CrossRef]
- Triassi, M.; Montuori, P.; Provvisiero, D.P.; Rosa, E.D.; Duca, F.D.; Sarnacchiaro, P.; Diez, S. Occurrence and spatial-temporal distribution of atrazine and its metabolites in the aquatic environment of the Volturno River estuary, southern Italy. Sci. Total Environ. 2022, 803, 149972. [Google Scholar] [CrossRef]
- Jaskuła, J.; Sojka, M. Assessment of spatial distribution of sediment contamination with heavy metals in the two biggest rivers in Poland. Catena 2022, 211, 105959. [Google Scholar] [CrossRef]
- Zhang, K.; Song, S.X.; Li, S.S.; Bai, L.Y.; Liu, H.; Sun, M.; Yu, X.J.; Dai, J.L. Evaluation of cadmium phytoextraction potential of peanut and the rhizospheric properties of specific cultivars. J. Clean. Prod. 2024, 452, 142228. [Google Scholar] [CrossRef]
- Su, J.H.; Zhang, Q.; Peng, H.J.; Feng, J.P.; He, J.; Zhang, Y.J.; Lin, B.; Wu, N.P.; Xiang, Y.T. Exploring the impact of intensity and duration of Cu (II) depression on aniline-degrading biosystem: Performance, sludge activity and microbial diversity. Bioresour. Technol. 2022, 360, 127548. [Google Scholar] [CrossRef] [PubMed]
- Li, S.Z.; Zhao, B.; Jin, M.; Hu, L.; Zhong, H.; He, Z.G. A comprehensive survey on the horizontal and vertical distribution of heavy metals and microorganisms in soils of a Pb/Zn smelter. J. Hazard. Mater. 2020, 400, 123255. [Google Scholar] [CrossRef]
- Mushtaq, Z.; Liaquat, M.; Nazir, A.; Liaquat, R.; Iftikhai, H.; Anwar, W.; Itrat, N. Potential of plant growth promoting rhizobacteria to mitigate chromium contamination. Environ. Technol. Innov. 2022, 28, 102826. [Google Scholar] [CrossRef]
- Manzoor, N.; Ali, L.; Al-Huqail, A.A.; Alghanem, S.M.S.; Al-Haithloul, H.A.S.; Abbas, T.; Chen, G.W.; Huan, L.Y.; Liu, Y.; Wang, G. Comparative efficacy of silicon and iron oxide nanoparticles towards improving the plant growth and mitigating arsenic toxicity in wheat (Triticum aestivum L.). Ecotox. Environ. Saf. 2023, 264, 115382. [Google Scholar] [CrossRef]
- Gogoi, B.; Acharjee, S.A.; Bharali, B.; Sorhie, V.; Walling, B. Alemtoshi. A critical review on the ecotoxicity of heavy metal on multispecies in global context: A bibliometric analysis. Environ. Res. 2024, 248, 118280. [Google Scholar] [CrossRef] [PubMed]
- Chen, L.; Zhou, M.X.; Wang, J.Z.; Zhang, Z.Q.; Duan, C.J.; Wang, X.X.; Zhao, S.L.; Bai, X.H.; Li, Z.J.; Li, Z.M.; et al. A global meta-analysis of heavy metal (loid)s pollution in soil near copper mines: Evaluation of pollution level and probabilistic health risks. Sci. Total Environ. 2022, 835, 155441. [Google Scholar] [CrossRef]
- Raturi, G.; Chaudhary, A.; Rana, V.; Mandlik, R.; Sharma, Y.; Barvkar, V.; Salvi, P.; Tripathi, D.K.; Kaur, J.; Deshmukh, R.; et al. Microbial remediation and plant-microbe interaction under arsenic pollution. Sci. Total Environ. 2023, 864, 160972. [Google Scholar] [CrossRef]
- Sevak, P.; Pushkar, B. Arsenic pollution cycle, toxicity and sustainable remediation technologies: A comprehensive review and bibliometric analysis. J. Environ. Manag. 2024, 349, 119504. [Google Scholar] [CrossRef] [PubMed]
- Wang, R.Y.; Sang, P.T.; Guo, Y.H.; Jin, P.; Cheng, Y.L.; Yu, H.; Xie, Y.F.; Yao, W.R.; Qian, H. Cadmium in food: Source, distribution and removal. Food Chem. 2022, 405, 134666. [Google Scholar] [CrossRef]
- Yu, M.; Li, Y.Z.; Zhang, K.; Yu, J.B.; Guo, X.L.; Guan, B.; Yang, J.S.; Zhou, D.; Wang, X.H.; Li, X.; et al. Studies on the dynamic boundary of the fresh-salt water interaction zone of estuary wetland in the Yellow River Delta. Ecol. Eng. 2023, 188, 106893. [Google Scholar] [CrossRef]
- Mitsch, W.J.; Gosselink, J.G. Wetlands, 5th ed.; John Wiley & Sons, Inc.: New York, NY, USA, 2015. [Google Scholar]
- Bai, J.H.; Xiao, R.; Zhang, K.J.; Gao, H.F. Arsenic and heavy metal pollution in wetland soils from tidal freshwater and salt marshes before and after the flow-sediment regulation regime in the Yellow River Delta, China. J. Hydrol. 2012, 450, 244–253. [Google Scholar] [CrossRef]
- Li, D.; Li, B.; Hou, X.Y.; Wang, X.L.; Li, X.W.; Zhang, Y.X. Habitat suitability assessment for Saunders’s Gull (Saundersilarus saundersi) in the Yellow River Delta, China. Ecol. Inform. 2024, 79, 102393. [Google Scholar] [CrossRef]
- Ran, Y.C.; Xie, J.X.; Li, X.L. Socio-Economic Development and Its Effects on the Ecological Environment of the Yellow River Source Zone. In Landscape and Ecosystem Diversity, Dynamics and Management in the Yellow River Source Zone, 14th ed.; Brierley, G., Li, X., Cullum, C., Gao, J., Eds.; Springer: Cham, Switzerland, 2016; pp. 331–353. [Google Scholar]
- Gan, Y.D.; Huang, X.M.; Li, S.S.; Liu, N.; Li, Y.C.; Freidenreich, A.; Wang, W.X.; Wang, R.Q.; Dai, J.L. Source quantification and potential risk of mercury, cadmium, arsenic, lead, and chromium in farmland soils of Yellow River Delta. J. Clean. Prod. 2019, 221, 98–107. [Google Scholar] [CrossRef]
- Yu, Y.; Ling, Y.; Li, Y.Z.; Lv, Z.B.; Du, Z.H.; Guan, B.; Wang, Z.K.; Wang, X.H.; Yang, J.S.; Yu, J.B. Distribution and influencing factors of metals in surface soil from the Yellow River Delta, China. Land 2022, 11, 523. [Google Scholar] [CrossRef]
- Yang, Z.K.; Sui, H.L.; Song, Y.Q.; Li, Y.Q.; Shao, H.J.; Wang, J. Spatial distribution, sources and risk assessment of potentially toxic elements contamination in surface soils of Yellow River Delta, China. Mar. Pollut. Bull. 2022, 184, 114213. [Google Scholar] [CrossRef]
- Zhou, J.G.; Zhang, L.L.; Zhang, J.F.; Gan, S.C.; Lu, Z.; Qin, G.M.; Huang, X.Y.; Chen, H.; He, H.; Li, Y.X.; et al. Blue carbon storage of tidal flats and salt marshes: A comparative assessment in two Chinese coastal areas. Palaeogeogr. Palaeoclimatol. Palaeoecol. 2024, 655, 112509. [Google Scholar] [CrossRef]
- Cheng, G.D.; Xue, C.T. Sedimentary Geology of Yellow River Delta; Geology Publishing House: Beijing, China, 1997. [Google Scholar]
- Saha, A.; Gupta, B.S.; Patidar, S.; Hernandez-Martinez, J.L.; Martín-Romero, F.; Meza-Figueroa, D.; Martínez-Villegas, N. A comprehensive study of source apportionment, spatial distribution, and health risks assessment of heavy metal(loid)s in the surface soils of a semi-arid mining region in Matehuala, Mexico. Environ. Res. 2024, 260, 119619. [Google Scholar] [CrossRef]
- Zhao, Y.Y.; Yan, M.C. Comparison of sediment chemical elements abundances in the Yellow River, Yangtze River, and Chinese shallow seas. Chin. Sci. Bull. 1992, 13, 1202–1204. [Google Scholar]
- Hakanson, L. An ecological risk index for aquatic pollution control a sedimentological approach. Water Res. 1980, 14, 975–1001. [Google Scholar] [CrossRef]
- Zhao, Y.T.; Dong, X.X.; Wang, L.M.; Qi, Y.M.; You, L.P.; Sun, S.; Ma, Y.Q. Selection and comparison of different methods for ecological risk assessment of heavy metals in marine sediments of Laizhou Bay. Bull. Mar. Sci. 2019, 38, 353–360. [Google Scholar]
- Sun, P.; Zhang, L.B.; Luo, S.N. Speciation and risk characteristics of Heavy metals in the sediments of the Songhua River estuary. J. Environ. Sci. Manag. 2020, 45, 142–145. [Google Scholar]
- Wang, P.; Zhang, L.J.; Lin, X.; Yan, J.S.; Zhang, P.; Zhao, B.; Zhang, C.; Yu, Y.H. Spatial distribution, control factors and sources of heavy metal in the surface sediments of Fudu Estuary waters, East Liaodong Bay, China. Mar. Pollut. Bull. 2020, 156, 111279. [Google Scholar] [CrossRef] [PubMed]
- Birch, G.F.; Taylor, S.E. Application of sediment quality guidelines in the assessment and management of contaminated surficial sediments in Port Jackson (Sydney Harbour), Australia. J. Environ. Manag. 2002, 29, 860–870. [Google Scholar] [CrossRef]
- Long, E.R.; Macdonald, D.D.; Smith, S.L.; Calder, F.D. Incidence of adverse biological effects within ranges of chemical concentrations in marine and estuarine sediments. J. Environ. Manag. 1995, 19, 81–97. [Google Scholar] [CrossRef]
- Long, E.R.; Morgan, L.G. The Potential for Biological Effects of Sediment-Sorbed Contaminants Tested in the National Status and Trends Program; National Oceanic & Atmospheric Administration (NOAA): Silver Spring, MD, USA, 1990. [Google Scholar]
- MacDonald, D.D.; Carr, R.S.; Calder, F.D.; Long, E.R.; Ingrtsoll, C.G. Development and evaluation of sediment quality guidelines for Florida coastal waters. Ecotoxicology 1996, 5, 253–278. [Google Scholar] [CrossRef]
- Chen, H.Y.; Teng, Y.G.; Lu, S.J.; Wang, Y.Y.; Wu, J.; Wang, J.S. Source apportionment and health risk assessment of trace metals in surface soils of Beijing metropolitan, China. Chemosphere 2016, 144, 1002–1011. [Google Scholar] [CrossRef]
- Shi, W.; Li, T.; Feng, Y.; Su, H.; Yang, Q. Source apportionment and risk assessment for available occurrence forms of heavy metals in Dongdahe Wetland sediments, southwest of China. Sci. Total Environ. 2022, 815, 152837. [Google Scholar] [CrossRef]
- Liu, Z.; Du, Q.; Guan, Q.; Luo, H.; Shan, Y.; Shao, W. A Monte Carlo simulation-based health risk assessment of heavy metals in soils of an oasis agricultural region in northwest China. Sci. Total Environ. 2023, 857, 159543. [Google Scholar] [CrossRef] [PubMed]
- Hošek, M.; Pavlíková, P.; Šoltýs, M.; Tůmová, Š.; Matys Grygar, T. Distinguishing Geogenic Load and Anthropogenic Contribution to Soil Contamination in Mineralised Mountain Landscape of Ore Mountains (Czech Republic) Using Cumulative Distribution Functions. Land 2024, 13, 218. [Google Scholar] [CrossRef]
- Rudnick, R.L.; Gao, S. Treatise on Geochemistry: Composition of the continental crust. In The Crust: Treatise on Geochemistry; Rudnick, R.L., Holland, H.D., Turekian, K.K., Eds.; Elsevier-Pergamon: Oxford, UK, 2003; Volume 3, pp. 1–64. [Google Scholar]
- Wei, F.S.; Chen, J.S.; Wu, Y.Y.; Zheng, C.J. Study on the background contents on 61 elements of soils in China. Chin. J. Environ. Sci. 1994, 12, 12–19. [Google Scholar]
- Xia, P.; Meng, X.W.; Yin, P.; Cao, Z.M.; Wang, X.Q. Eighty-year sedimentary record of heavy metal inputs in the intertidal sediments from the Nanliu River estuary, Beibu gulf of South China Sea. Environ. Pollut. 2011, 159, 92–99. [Google Scholar] [CrossRef] [PubMed]
- Rousseau, T.C.C.; Sonke, J.E.; Chmeleff, J.; van Beek, P.; Souhaut, M.; Boaventura, G.; Seyler, P.; Jeandel, C. Rapid neodymium release to marine waters from lithogenic sediments in the Amazon estuary. Nat. Commun. 2015, 6, 7592. [Google Scholar] [CrossRef]
- GB 18668-2002; Marine Sediment Quality. General Administration of Quality Supervision, Inspection and Quarantine: Beijing, China, 2002.
- Tian, L.P.; Sun, Z.G.; Wang, C.Y.; Sun, W.L.; Li, J.; Chen, B.B. Spatial distribution of heavy metals and As concentrations and assessment of their ecological risk in inshore sediments, affected by the Flow-sediment Regulation Scheme in the Yellow River estuary. Acta Ecol. Sin. 2018, 38, 5529–5540. [Google Scholar]
- Hu, X.F.; Du, Y.; Feng, J.W.; Fang, S.Q.; Gao, X.J.; Xu, S.Y. Spatial and seasonal variations of heavy metals in wetland soils of the tidal flats in the Yangtze Estuary, China: Environmental implications. Pedosphere 2013, 23, 511–522. [Google Scholar] [CrossRef]
- Wu, H. Evaluation on International Importance Wetlands Ecosystem—A Case Study of Shuangtai Hekou Nature Reserve, Liaoning Province; Zhejiang A&F University: Lin’an, China, 2014. [Google Scholar]
- Xie, Z.L.; Zhu, G.R.; Xu, M.; Zhang, H.; Yi, W.B.; Jiang, Y.H.; Liang, M.X.; Wang, Z.F. Risk assessment of heavy metals in a typical mangrove ecosystem—A case study of Shankou Mangrove National Natural Reserve, southern China. Mar. Pollut. Bull. 2022, 178, 113642. [Google Scholar] [CrossRef] [PubMed]
- Zheng, R.Y.; Liu, Y.R.; Zhang, Z.H. Trophic transfer of heavy metals through aquatic food web in the largest mangrove reserve of China. Sci. Total Environ. 2023, 899, 165655. [Google Scholar] [CrossRef]
- Wang, J.; Du, H.H.; Xu, Y.; Chen, K.; Liang, J.H.; Ke, H.W.; Cheng, S.Y.; Liu, M.Y.; Deng, H.X.; He, T.; et al. Environmental and ecological risk assessment of trace metal contamination in mangrove ecosystems: A case from Zhangjiangkou Mangrove National Nature Reserve, China. Biomed Res. Int. 2016, 2016, 2167053. [Google Scholar] [CrossRef]
- Yang, Q.; Shen, X.Y.; Jiang, H.J.; Luan, T.G.; Yang, Q.; Yang, L.H. Key factors influencing pollution of heavy metals and phenolic compounds in mangrove sediments, South China. Mar. Pollut. Bull. 2023, 194, 115283. [Google Scholar] [CrossRef]
- Ji, Y.N.; Zhao, Z.Z.; Wu, D. Accumulation and distribution of heavy metals in sediments of mangrove wetland and kandelia candel in dongzhai harbor. Saf. Environ. Eng. 2015, 22, 1556–1671. [Google Scholar]
- Fang, Y.; Sun, X.Y.; Yang, W.J.; Ma, N.; Xin, Z.H.; Fu, J.; Liu, X.C.; Liu, M.; Mariga, A.M.; Zhu, X.F.; et al. Concentrations and health risks of lead, cadmium, arsenic, and mercury in rice and edible mushrooms in China. Food Chem. 2014, 147, 147–151. [Google Scholar] [CrossRef]
- Irshad, M.K.; Noman, A.; Alhaithloul, H.A.S.; Adeel, M.; Rui, Y.; Shah, T.; Zhu, S.; Shang, J. Goethite-modified biochar ameliorates the growth of rice (Oryza sativa L.) plants by suppressing Cd and As-induced oxidative stress in Cd and As co-contaminated paddy soil. Sci. Total Environ. 2020, 717, 137086. [Google Scholar] [CrossRef]
- Rahman, M.A.; Hasegawa, H.; Lim, R.P. Bioaccumulation, biotransformation and trophic transfer of arsenic in the aquatic food chain. Environ. Res. 2012, 116, 118–135. [Google Scholar] [CrossRef] [PubMed]
- Vaezi, A.; Lak, R. Contamination and environmental risk assessment of potentially toxic elements in the surface sediments of Northwest Persian Gulf. Reg. Stud. Mar. Sci. 2023, 67, 103235. [Google Scholar] [CrossRef]
- Zhao, F.J.; Ma, Y.; Zhu, Y.G.; Tang, Z.; McGrath, S.P. Soil contamination in China: Current status and mitigation strategies. Environ. Sci. Technol. 2015, 49, 750–759. [Google Scholar] [CrossRef] [PubMed]
- Long, E.R.; Field, L.J.; MacDonald, D.D. Predicting toxicity in marine sediments with numerical sediment quality guidelines. Environ. Toxicol. Chem. 1998, 17, 714–727. [Google Scholar] [CrossRef]
- Clarkson, T.W.; Magos, L. The toxicology of mercury and its chemical compounds. Crit. Rev. Toxicol. 2006, 36, 609–662. [Google Scholar] [CrossRef]
- Smith, A.H.; Marshall, G.; Yuan, Y.; Ferreccio, C.; Liaw, J.; von Ehrenstein, O.; Steinmaus, C.; Bates, M.N.; Selvin, S. Increased mortality from lung cancer and bronchiectasis in young adults after exposure to Arsenic in utero and in early childhood. Environ. Health Perspect. 2006, 114, 1293–1296. [Google Scholar] [CrossRef]
- USEPA. Exposure Factors Handbook: 2011 Edition; EPA/600/R-09/052F; USEPA: Washington, DC, USA, 2011.
- Sun, L.; Guo, D.K.; Liu, K.; Meng, H.; Zheng, Y.J.; Yuan, F.Q.; Zhu, G.H. Levels, sources, and spatial distribution of heavy metals in soils from a typical coal industrial city of Tangshan, China. Catena 2019, 175, 101–109. [Google Scholar] [CrossRef]
- Pan, S.X.; Lin, L.F.; Zeng, F.; Zhang, J.P.; Dong, G.H.; Yang, B.Y.; Jing, Y.; Chen, S.J.; Zhang, G.; Yu, Z.Q.; et al. Effects of lead, cadmium, arsenic, and mercury co-exposure on children’s intelligence quotient in an industrialized area of southern China. Environ. Pollut. 2018, 235, 47–54. [Google Scholar] [CrossRef]
- Horowitz, A.J.; Elrick, K.A. The relation of stream sediment surface area, grain size and composition to trace element chemistry. Appl. Geochem. 1987, 2, 437–451. [Google Scholar] [CrossRef]
- Varol, M.; Ustaoğlu, F.; Tokatl, C. Ecological risks and controlling factors of trace elements in sediments of dam lakes in the Black Sea Region (Turkey). Environ. Res. 2022, 205, 112478. [Google Scholar] [CrossRef] [PubMed]
- Wang, Y.Z.; Duan, X.J.; Wang, L. Spatial distribution and source analysis of heavy metals in soils influenced by industrial enterprise distribution: Case study in Jiangsu Province. Sci. Total Environ. 2020, 710, 134953. [Google Scholar] [CrossRef]
- Que, W.P.; Yi, L.W.; Wu, Y.T.; Li, Q.P. Analysis of heavy metals in sediments with different particle sizes and influencing factors in a mining area in Hunan Province. Sci. Rep. 2024, 14, 20318. [Google Scholar] [CrossRef] [PubMed]
- Saha, N.; Rahman, M.S. Multivariate statistical analysis of metal contamination in surface water around Dhaka export processing industrial zone, Bangladesh. Environ. Nanotechnol. Monit. Manag. 2018, 10, 206–211. [Google Scholar] [CrossRef]
- Ustaoğlu, F.; Tepe, Y. Water quality and sediment contamination assessment of Pazarsuyu stream, Turkey using multivariate statistical methods and pollution indicators. Int. Soil Water Conserv. Res. 2019, 7, 47–56. [Google Scholar] [CrossRef]
- Chen, X.; Fu, X.Y.; Li, G.L.; Zhang, J.M.; Li, H.B.; Xie, F.Z. Source-specific probabilistic health risk assessment of heavy metals in surface water of the Yangtze River Basin. Sci. Total Environ. 2024, 926, 171923. [Google Scholar] [CrossRef]
- Li, Y.; Zhang, H.; Chen, X.; Tu, C.; Luo, Y.; Christie, P. Distribution of heavy metals in soils of the Yellow River Delta: Concentrations in different soil horizons and source identification. J. Soil. Sediments 2014, 14, 1158–1168. [Google Scholar] [CrossRef]
- Fan, S.X.; Wang, X.D.; Lei, J.; Ran, Q.Q.; Ren, Y.X.; Zhou, J.H. Spatial distribution and source identification of heavy metals in a typical Pb/Zn smelter in an arid area of northwest China. Hum. Ecol. Risk Assess. Int. J. 2019, 25, 1661–1687. [Google Scholar] [CrossRef]
- He, H.; Miao, Y.J.; Zhang, Q.; Chen, Y.; Gan, Y.D.; Liu, N.; Dong, L.F.; Dai, J.L.; Chen, W.F. The structure and diversity of nitrogen functional groups from different cropping systems in Yellow River Delta. Microorganisms 2020, 8, 424. [Google Scholar] [CrossRef]
- Cai, L.M.; Xu, Z.C.; Ren, M.Z.; Guo, Q.W.; Hu, X.B.; Hu, G.C.; Wan, H.F.; Peng, P.G. Source identification of eight hazardous heavy metals in agricultural soils of Huizhou, Guangdong Province, China. Ecotoxicol. Environ. Saf. 2012, 78, 2–8. [Google Scholar] [CrossRef]
- Wang, S.; Cai, L.M.; Wen, H.H.; Luo, J.; Wang, Q.S.; Liu, X. Spatial distribution and source apportionment of heavy metals in soil from a typical county-level city of Guangdong Province, China. Sci. Total Environ. 2019, 655, 92–101. [Google Scholar] [CrossRef] [PubMed]
- Cai, L.M.; Huang, L.C.; Zhou, Y.Z.; Xu, Z.C.; Peng, X.C.; Yao, L.A.; Zhou, Y.; Peng, P.A. Heavy metal concentrations of agricultural soils and vegetables from Dongguan, Guangdong. J. Geogr. Sci. 2010, 20, 121–134. [Google Scholar] [CrossRef]
- Cai, Z.Q.; Ren, B.Z.; Xie, Q.; Deng, X.P.; Yin, W.; Chen, L.Y. Toxic element characterization against a typical high geology background: Pollution enrichment, source tracking, spatial distribution, and ecological risk assessment. Environ. Res. 2024, 255, 119146. [Google Scholar] [CrossRef] [PubMed]
- Gong, S.Y.; Xiong, G.S. The origin and transport of sediment of the Yellow River. In Proceedings of the International Symposium on Sedimentation on the Continental Shelf with Special Reference to the East China Sea, Hangzhou, China, 12–16 April 1983; Guang Hua Press: Beijing, China, 1983. [Google Scholar]
- Bispo, F.H.A.; de Menezes, M.D.; Fontana, A.; Sarkis, J.E.d.S.; Gonçalves, C.M.; de Carvalho, T.S.; Curi, N.; Guilherme, L.R.G. Rare earth elements (REEs): Geochemical patterns and contamination aspects in Brazilian benchmark soils. Environ. Pollut. 2021, 289, 117972. [Google Scholar] [CrossRef] [PubMed]
- USEPA. Supplemental Guidance for Developing Soil Screening Levels for Superfund Sites, OSWER 9355; Office of Emergency and Remedial Response: Washington, DC, USA, 2002.
- USEPA. Region IX, regional screening levels (formerly PRGs). San Francisco, CA 94105. 2013. Available online: http://www.epa.gov/region9/superfund/prg/ (accessed on 23 March 2025).
- Huang, J.H.; Guo, S.T.; Zeng, G.M.; Li, F.; Gu, Y.L.; Shi, Y.H. A new exploration of health risk assessment quantification from sources of soil heavy metals under different land use. Environ. Pollut. 2018, 243, 49–58. [Google Scholar] [CrossRef]

Disclaimer/Publisher’s Note: The statements, opinions and data contained in all publications are solely those of the individual author(s) and contributor(s) and not of MDPI and/or the editor(s). MDPI and/or the editor(s) disclaim responsibility for any injury to people or property resulting from any ideas, methods, instructions or products referred to in the content. |
© 2025 by the authors. Licensee MDPI, Basel, Switzerland. This article is an open access article distributed under the terms and conditions of the Creative Commons Attribution (CC BY) license (https://creativecommons.org/licenses/by/4.0/).