Article

The Impact of a Ski Piste on the Stock and Stoichiometry of Soil Carbon, Nitrogen, and Phosphorus: A Case Study on a Forest Area in Northeast China

1
School of Ecology, Northeast Forestry University, Harbin 150040, China
2
Key Laboratory of Sustainable Forest Ecosystem Management–Ministry of Education, Northeast Forestry University, Harbin 150040, China
3
College of Exercise Science and Health, Harbin Sport University, Harbin 150006, China
*
Authors to whom correspondence should be addressed.
Land 2025, 14(4), 846; https://doi.org/10.3390/land14040846
Submission received: 20 February 2025 / Revised: 31 March 2025 / Accepted: 10 April 2025 / Published: 12 April 2025
(This article belongs to the Section Land, Soil and Water)

Abstract

:
The construction of sports spaces such as ski resorts leads to deforestation, soil degradation and carbon (C) loss. However, the impact of ski pistes on soil C and nutrients remains unclear. The impact of an 18-year-old ski piste operation on the stock and stoichiometry of soil C, nitrogen (N), phosphorus (P), bulk density, and water content across a 0–100 cm profile in a forest area in Northeast China was quantitatively assessed using the equivalent soil mass method and fixed depth method. The fixed depth method overestimated soil C, N and P stocks of the SP by 5% to 8% of 0–100 cm stocks of soil C and nutrients relative to the equivalent soil mass method used as a reference. The equivalent soil mass method demonstrated that the ski piste soil C, N, and P stocks were significantly reduced by 27.4%, 21.3%, and 27.5%, respectively, in comparison to the undisturbed forest. Surface layers (0–10 cm) exhibited the highest C and N losses, while deep soil (>50 cm) showed significant C, N and P depletion. The ski piste significantly reduced surface C:N (15.8%) and C:P (38.0%) ratios, indicating decoupled nutrient constraints on C loss. Soil compaction increased bulk density in surface layers (0–10 cm) but reduced it in deeper strata, correlating with altered C physical interdependencies. The findings highlight the vertical stratification of disturbance effects, emphasizing the critical role of stoichiometric controls and methodological considerations in assessing anthropogenic impacts on soil ecosystems. These insights are vital for the sustainable management of ski resorts to mitigate soil degradation.

1. Introduction

Global warming, driven primarily by anthropogenic greenhouse gas emissions [1,2], poses one of the most serious challenges to both natural ecosystems and human society. Addressing this challenge requires urgent efforts to reduce carbon (C) emissions while enhancing C sinks [3]. In terrestrial ecosystems, soil represents the largest organic C reservoir—exceeding the combined C stocks of vegetation and the atmosphere—and consequently plays a pivotal role in global C cycling [4]. As the planet’s largest active carbon pool, soil C is therefore crucial for climate change mitigation [5]. While various measures can enhance soil C sequestration [6,7], this reservoir is vulnerable to disturbance [8,9]. Deforestation and harvesting, for instance, have been shown to reduce soil organic C by 24–52% [10,11], highlighting the need to understand the mechanisms underlying such changes to mitigate emissions from land use conversion [10,12].
The dynamics of soil organic carbon are governed by multiple factors, including microbial processes and mineral stabilization [6,13], as well as nutrient availability through ecological stoichiometry [14,15,16,17,18]. Among these nutrients, nitrogen (N) and phosphorus (P) frequently limit productivity in terrestrial ecosystems [10]. Stoichiometric ratios (C:N, C:P, and N:P) serve as sensitive indicators of both soil nutrient status and ecosystem functioning: C:N reflects C and N stocks [19], C:P influences microbial decomposition rates and P availability [15], and N:P indicates nutrient limitation thresholds [19]. Collectively, these ratios provide valuable insights into soil fertility and its response to land use change [20,21,22,23]. However, despite their importance, research has disproportionately focused on C dynamics, with comparatively less attention given to nutrient responses (particularly P) following disturbances [10,24,25]. This knowledge gap limits our understanding of how C:N:P stoichiometry responds to forest conversion, which is critical for developing effective ecosystem management strategies to maintain soil C stocks.
Emerging evidence from meta-analyses reveals that soil C responses to forest harvesting intensity exhibit significant variability [26,27,28]. This differential response appears mediated through three key mechanisms: (1) physical alterations including soil compaction and structural degradation [29], (2) biochemical changes affecting organic matter decomposition pathways [30], and (3) depth-dependent dynamics across soil profiles [27]. Notably, harvesting-induced reductions in organic matter input coupled with accelerated respiratory C losses create competing fluxes that vary with management intensity [30]. These processes demonstrate pronounced vertical stratification, as soil C storage mechanisms differ fundamentally between surface layers (primarily input-driven) and deeper horizons (stabilization-dependent) [12]. Current research efforts remain disproportionately focused on surface (usually 0–10 cm) and mid-soil (10–50 cm) layers, creating critical knowledge gaps regarding deep soil systems (>50 cm) that constitute roughly 50% of profile C stocks [28]. This shallow sampling bias fundamentally limits our understanding of whole-profile C dynamics, particularly given that harvesting impacts on two key structural parameters—bulk density (BD) and soil water content (SWC)—exhibit depth-dependent variation that may mediate C loss mechanisms [31,32]. The potential interaction between these structural modifications and microbial decomposition processes at different soil depths represents a critical but understudied dimension of disturbance ecology. Furthermore, the fixed depth method may lead to an underestimation of disturbance effects on carbon/nutrient stocks and C:N:P stoichiometry due to soil compaction artifacts. Although the equivalent mass approach has been advocated as a superior methodology versus the fixed depth approach for a more accurate quantification of biogeochemical responses to disturbance [18,33,34], limited attention has been given to comparative assessments between methodological approaches in deep soils. Resolving these depth-dependent patterns represents an essential prerequisite for developing vertically stratified C management strategies.
In recent years, ice–snow tourism and ski resorts have experienced explosive growth globally, with China emerging as a key contributor to this trend [35]. While the construction of ski resorts fulfills recreational demands, their land use conversion from natural ecosystems (e.g., forests and grasslands) to artificial SP and facilities has triggered severe vegetation and soil degradation [36,37,38,39,40]. Critically, despite these documented ecological impacts, two pivotal knowledge gaps persist: (1) the full-profile (0–100 cm) effects of SP construction/operation on soil C stocks remain unquantified, and (2) the ecological stoichiometric mechanisms governing C retention in disturbed SP soils are poorly understood. These gaps directly hinder the development of ecological criteria for sustainable ice–snow tourism. To address this, we conducted the first comprehensive vertical analysis comparing soil C, N, and P stocks, BD and SWC in an SP and adjacent natural forests near Harbin, China. The specific objectives were as follows: (1) quantifying C-N-P stock depletion across the entire soil profile with the equivalent soil mass method and fixed depth method, (2) revealing allometric shifts in C:N:P stoichiometry as potential constraints on carbon loss, and (3) testing the hypothesis that synergistic changes in SWC and BD drive C-N-P stock depletion. The findings provide mechanistic insights critical for designing soil conservation frameworks specific to temperate climate ski resorts.

2. Materials and Methods

2.1. Site Description

This study was conducted in the Harbin Sport University Ski Resort, located in the Dafangzi Village, Maoershan Town, Shangzhi City, Heilongjiang Province (45.2569° N, 127.4565° E). It has a continental monsoon climate, featuring a short, warm summer and a long, cold and dry winter. The soil type is Haplumbrepts or Eutroboralfs (Alfisols). The vegetation belongs to the Changbai flora and it is a typical natural secondary forest area in the eastern part of Northeast China. The average annual temperature is 2.8 °C, and the annual precipitation is 723 mm. The native forest is dominated by Acer pictum subsp. mono with Ulmus laciniata, Juglans mandshurica, Betula costata, and Acer tegmentosum as accompanying species. The forest was whole-tree harvested, mechanically compacted and smoothed, and then converted into an SP (usually grassland) in 2004.

2.2. Experimental Design

In 2004, the natural forest (NF) was whole-tree harvested and converted to an SP. The snow cover period was from December to March, and the snow depth on the SP was no less than 50 cm. The experimental plots were set up on the SP and in the NF in 2022. The elevation ranged from 245 m to 575 m. Four blocks along the slope from the toe slope to near the hilltop were set up in the adjacent forest and on the SP (Figure 1). In each block, one plot was set up in the NF as the control, and its counterpart was set up in the same slope position on the SP. The slope angles ranged from 3 to 20°, with a mean of 12°. In each plot, soil samples at six layers were collected from the 0–100 cm soil profile. The SP was grass-seeded to reduce soil erosion [37]. In the two plots on the upper slope of the SP (SP3 and SP4), only small red bean was planted in the sampling year of 2022.

2.3. Sample Collection and Processing

In September 2022, three soil pits with a depth of 100 cm were dug in each plot. Soil samples were evenly collected from each soil layer of 0–10 cm, 10–20 cm, 20–30 cm, 30–50 cm, 50–70 cm, and 70–100 cm. The samples were, respectively, put into numbered sealed bags. They were immediately taken back to the laboratory, passed through a 2 mm sieve to remove plant residues and gravels, mixed evenly, and air-dried naturally for the determination of chemical properties. In addition, one or two samples were taken from each soil layer with a 100 cm−3 soil ring knife. The samples were weighted for the soil fresh mass, then dried at 105 °C for 12 h, and weighed for the dry mass to calculate SWC (the water content relative to the dry mass) and BD. The gravels with a diameter larger than 2 mm were washed, dried, and weighted to correct the errors caused by the gravel content in the BD in the stocks of soil C, N, and P.
A 100 mg pulverized soil sample, dried at 65 °C, was used to determine the soil C concentration using the Multi N/C 2100 analyzer (Analytik Jena AG, Jena, Germany) equipped with the HT 1500 solid module. Given that the soil in this area is slightly acidic, the total soil C is considered equivalent to the soil organic C. A 250 mg soil sample was used for measuring total N and total P concentrations. In total, 2 g of K2SO4:CuSO4 (9:1) and 5 mL of concentrated sulfuric acid were added into the soil sample in a digestion tube and digested at 400 °C for 60 min. The N and P concentrations were determined using a continuous flow analyzer (AA3, Seal Analytical, Norderstedt, Germany).
The soil C, N, and P densities (pool sizes) were calculated using two approaches [33]. Soil C was given as an example. The first approach is the fixed depth method (FDM), of which the calculation formula [41] is given as
C i , f i x e d = C c o n i × T i × B D i ÷ 10 ,
where Ci,fixed represents the C density (t ha−1) at a fixed depth of the soil, i is the layer number corresponding to the soil profile, Cconi is the concentration of soil organic C (mg g−1) in the i-th layer of the soil profile, Ti is the soil thickness (cm) of the i-th layer, BDi is the soil bulk density (g cm−3), and 10 is the unit conversion factor. Summing up the values of each layer gives the soil C density (t ha−1) in the 0–100 cm soil layer.
The second approach is the equivalent soil mass method (ESM), which considers that compaction during the construction and operation of the ski slope increased soil BD and changed the sampling depth. The soil C mass corresponding to the ski slope soil mass equivalent to the reference mass of soil per unit area at a depth of 0–100 cm in the natural forest [41] can be calculated as follows:
C i , e q u i v = C i , f i x e d C c o n t o p M i 1 , a d d + C c o n b o t t o m M i , a d d M i 1 , a d d ,
M i , a d d = M i , e q u i v M i
where Ci,equiv represents the equivalent C mass (t ha−1), Mi,equiv is the selected equivalent soil mass, and Mi−1,add and Mi,add are the additional soil masses used to reach the equivalent soil mass (positive values for loose soil and negative values for compacted soil). The C concentration of the additional soil masses (Ccontop and Cconbottom) is determined by the position of the soil mass used when correcting errors between soil layers.
The detailed layers were grouped into surface (0–10 cm), middle (20–50 cm) and deep (50–100 cm) layers for comparison with previous studies. In addition, the soil C, N, and P concentrations and C:N, C:P, and N:P for the whole-profile values were also calculated using the stocks and total soil mass of 0–100 cm by the ESM.

2.4. Data Analysis and Processing

The C, N, and P concentrations were expressed as the mass of the element per gram of dry soil (mg g−1), while C:N, C:P, and N:P were expressed as mass ratios. Linear mixed effects models were employed to analyze SP effects on soil C and nutrients with the lme4 R package. The model included treatment (SP and NF) as the fixed effect, with the block (a paired-plot at the same slope position) and pit (nested within the block) as random effects to account for the hierarchical structure in the experimental design. The implementation of the block design effectively mitigated the confounding effects of slope position variations on treatment efficacy through spatial variance control. The Duncan test was used to determine significant differences between soil layers with SPSS 26.0 software (IBM SPSS Statistics, Armonk, NY, USA). The potential difference in stocks of C and nutrients between the FDM and ESM was tested by the paired t test with SPSS 26.0 software. Standard major axis (SMA) regression was used to analyze the allometric relationships between any two elements of the C, N, and P in each soil layer and the C concentration vs. SWC and BD. SMA was completed using SMATR 2.0 software [42], in which the likelihood ratio test and Wald test were used for the homogeneity of slopes and intercepts, respectively. The graphs were created using Origin 2022 software (OriginLab, Northampton, MA, USA).

3. Results

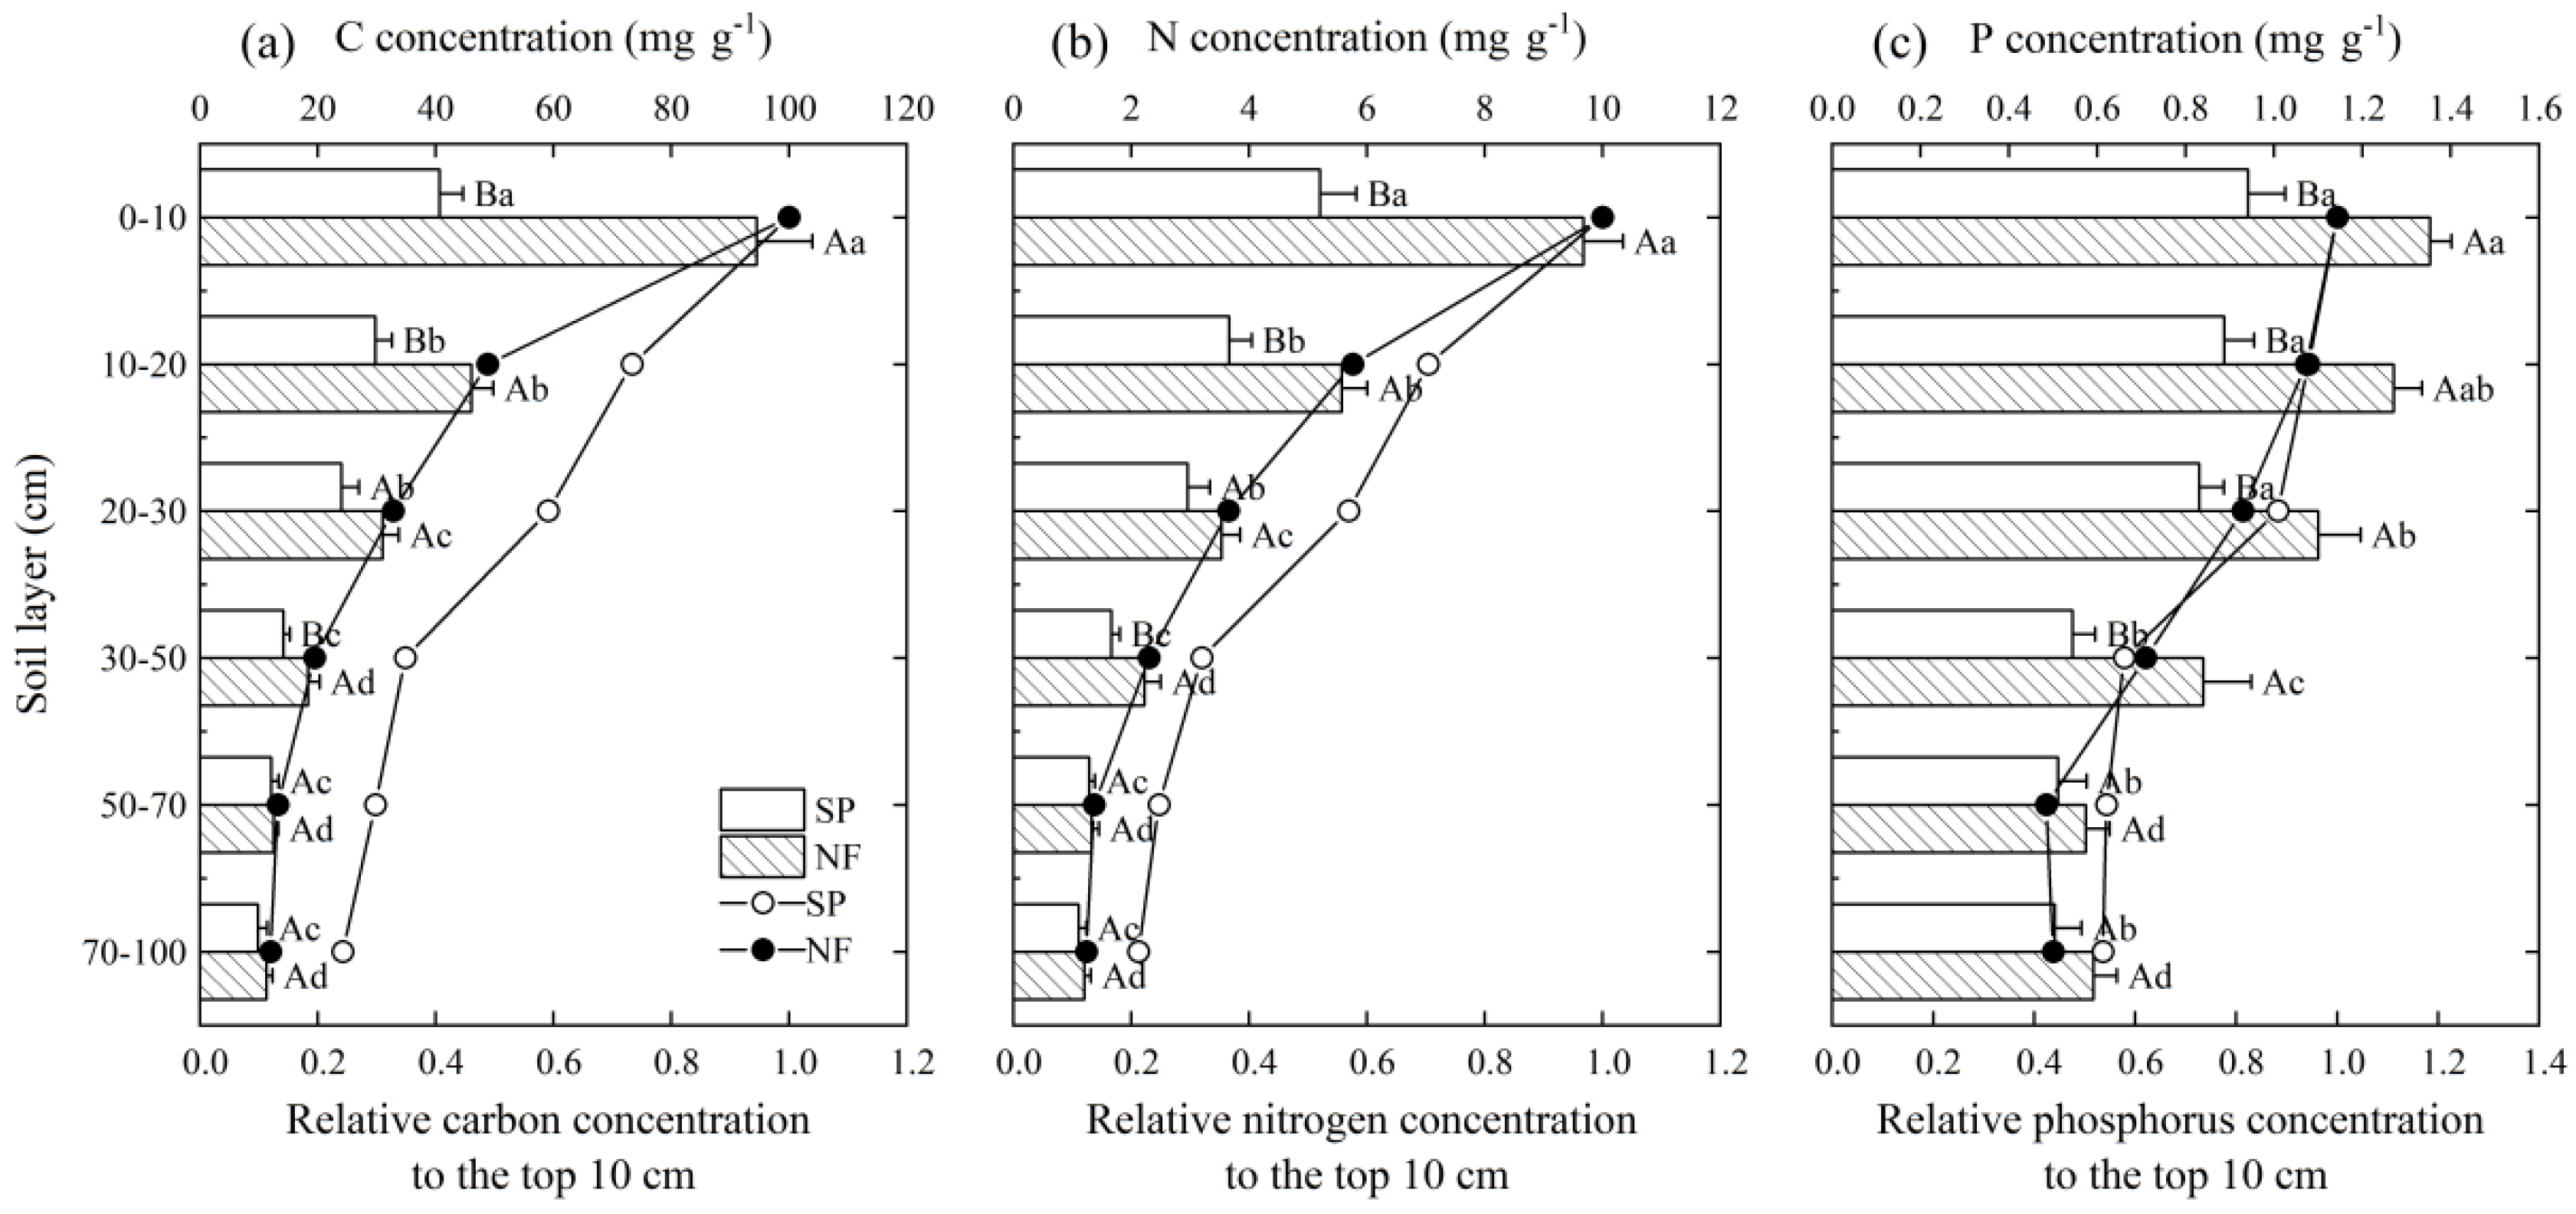
3.1. Concentrations and Stocks of Soil C, N, and P

The SP reduced the gradient of the decrease in soil C, N, and P concentrations with increasing soil depth compared with the adjacent forest (Figure 2). The SP effect was most obvious in the surface layer soil and gradually decreased with increasing soil depth. In the 0–10 cm and 10–20 cm soil layer, the soil C concentration of the SP was reduced by 57.0% and 35.4% compared to the forest. In the 30–50 cm soil layer, the soil C concentration of the SP decreased significantly by 22.9%. The change in soil N concentration was like that in soil C concentration, among which the reduction in the 0–10 cm soil layer of the SP reached 46.3%, while the decreases in the 10–20 cm and 30–50 cm soil layer was 34.3% and 25.3%. In the 0–10 cm, 10–20 cm, 20–30 cm, and 30–50 cm soil layers, the soil P concentration of the SP was 30.5%, 30.1%, 24.5%, and 35.3% lower than that of the natural forest, respectively. In addition, the vertical variation in the decrease in soil P concentration with increasing soil depth was lower than that of C and N. Across the SP profile, there were significant differences in soil C and N concentrations between the 0–10 cm, 10–30 cm and other layers, while significant differences in soil P concentration were shown between the 0–30 cm and the 30–100 cm soil layers.
The method for the density calculation impacted the assessment of the effect of the SP operation on soil C, N and P stocks for the 0–100 cm profile (Table 1). The FDM overestimated soil C, N and P stocks of the SP by 5.3% (p = 0.019), 4.8% (p = 0.012) and 7.5% (p = 0.008), respectively, relative to the ESM. According to the FDM, the construction of the SP led to significant decreases in C, N and P densities by 23.5%, 17.5%, and 22.0% of the total profile. Using the ESM, it was discerned that the soil C decrease due to the SP reached 27.4% (60.30 t ha−1), while N and P reduction increased to 21.3% (5.21 t ha−1) and 27.5% (2.12 t ha−1), respectively.
The reduction in C mainly occurred in the surface layer (0–10 cm) and the deep soil below 50 cm, while the reduction in N and P mainly took place in the deep soil (Figure 3). In the 0–10 cm soil layer, the C density of the SP was significantly reduced by 31.8% compared to that of the natural forest. In the 50–70 cm and 70–100 cm soil layer, the C density of the SP was 27.9% and 40.9% lower than that of the natural forest, and the N density of the SP was significantly reduced by 26.1% and 34.2%, respectively. The impact of the SP on P density was similar to that on N density. In the 30–50 cm, 50–70 cm and 70–100 cm soil layers, the P density of the SP was significantly reduced by 29.6%, 32.2% and 36.8%, respectively.

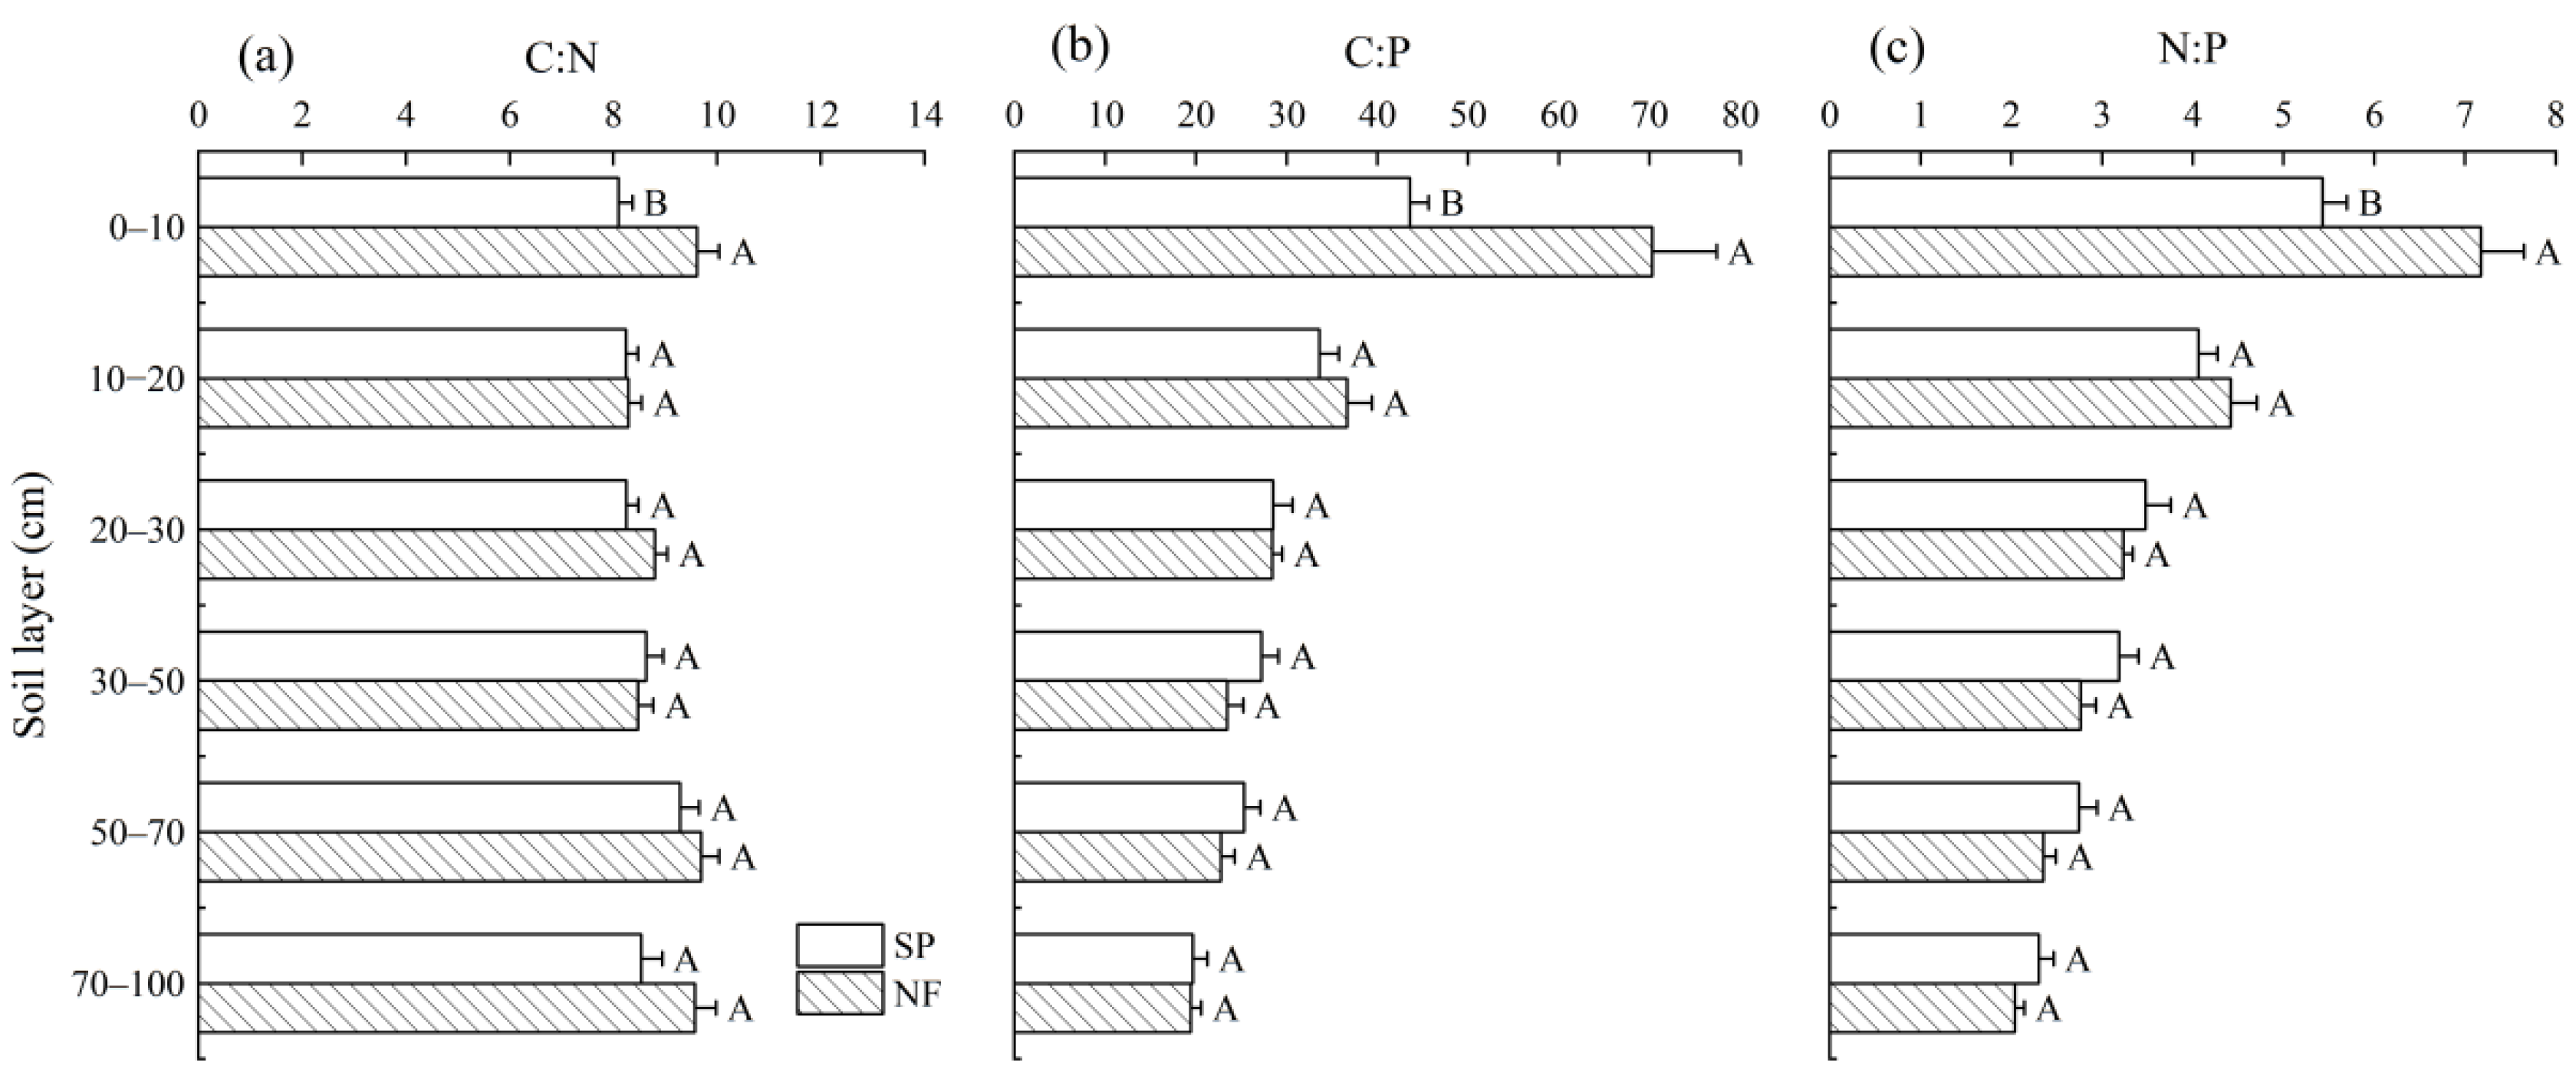
3.2. Stoichiometry of Soil Carbon, N, and P

Across the entire soil profile, the operation of the SP resulted in a 7.3% reduction in the C:N ratio (an absolute decrease of 0.66, p = 0.009) when calculated using the equivalent soil mass method. However, neither the C:P ratio (0.25 [0.9%], p = 0.902) nor the N:P ratio (0.30 [9.3%], p = 0.151) showed statistically significant reductions under the SP treatment. In the 0–10 cm soil layer, however, the C:N, C:P, and N:P ratios of the SP soil were 15.8%, 38.0%, and 24.3% lower than those of the natural forest, respectively (Figure 4). There were no significant differences between SP and the undisturbed forest in other soil layers. The vertical variation gradient of the C:N ratio was markedly less pronounced compared to those of C:P and N:P, with the latter two ratios exhibiting progressive attenuation with increasing soil depth.
There were significant linear relationships between the concentrations of soil C, N, and P in each soil layer, except for the C-P and N-P relationships in the 0–10 cm and 10–20 cm soil layers of the natural forest (Figure 5). The SP-induced modulation of soil C-N-P stoichiometric relationships exhibited element-specific and depth-stratified responses. For the C-N relationship, the SP induced a lower slope in the 0–10 cm layer but increased the slope in deep soils. In the 20–30 cm, the SP increased the intercept of C-N relationship. For the C-P relationship, the operation of the SP decreased the SMA slope in the surface layer but increased that in the 20 cm layer. The SP only increased the N-P slope in the 20–30 cm layer. Across the entire profile, the SP significantly decreased the allometric slope of soil C-N-P stoichiometric relationships (Table 2).

3.3. Interdependence of Soil C with Soil Water Content and Bulk Density

The differences in SWC between the SP and forest soil varied with soil layers (Figure 6). The SWC in the 0–10 cm layer of the SP (68.2%) was significantly higher than that of the natural forest (59.0%), while the increase in SWC caused by the SP operation was not significant for other layers (Figure 6a). In the 0–10 cm and 10–20 cm soil layers, the BD of the SP (0.91 g cm−3 and 1.11 g cm−3) was 58.4% and 37.5% higher than that of the forest (0.58 g cm−3 and 0.81 g cm−3), respectively. However, the BD increment caused by the SP operation diminished with increasing depth and even reversed to BD reduction in deep layers (>50 cm) (Figure 6b).
Ski piste implementation altered C physical interdependencies across discrete soil strata (Table 3). Soil C was negatively related to SWC and BD. In the 0–10 cm soil layer, the slope of the SMA regarding the relationship between soil C and the SWC of the SP soil was significantly higher than that in the forest soil. The SP significantly decreased the SMA intercept of the relationship between soil C and BD. In the 10–20 cm soil layer, the SP significantly decreased the intercepts of the relationships between soil C and SWC and BD. In the 20–30 cm soil layer, the SP significantly increased the intercept of the relationship between soil C and SWC. In the 30–50 cm soil layer, the SP did not significantly change the slopes and intercepts of the relationships between soil C and SWC (and BD). In the 50–70 cm soil layer, the SP significantly altered the SMA slope of the relationship between soil C and BD. In the 70–100 cm soil layer, the SP significantly decreased the slopes of the relationships between soil C and SWC and BD.

4. Discussion

The impact of the 18-year-old SP operation on soil C, N and P concentrations and stocks, and their coupling across a 0–100 cm profile, was quantified in a temperate forest region. The results demonstrated the vertical stratification of disturbance effects, with surface layer dominance for depletions of C, N and P concentrations and significant decreases in C, N and P densities in both surface and deep soil layers. The SP operation induced a large depletion of soil C, N and P stocks in the 100 cm profile, with 27.4% for C, 21.3% for N and 27.5% for P discerned by the equivalent soil mass method. Notably, for C-N-P coupling, hydraulic and mechanical regulation through SWC and BD were identified as critical mechanisms mitigating C loss following anthropogenic disturbance.

4.1. Impacts of Ski Piste on Soil C, N and P

Long-term SP operations reduced soil C by 27.4% compared to the forest soil (Figure 3), with distinct vertical stratification patterns (Figure 2 and Figure 4). In a mountainous area in the Mediterranean region with a background vegetation of grassland, SP operation decreased 0–30 cm soil C stock by 34.4% [43]. Clear cutting or converting forests into other land use types reduced organic matter input and increased decomposition and erosion, leading to a sharp decline in surface C concentration [10,27,28,44]. Changes in soil C pool depend on the balance between the input of above-ground and root litter and the output through mineralization and leaching [45]. Soil C mainly comes from the decomposition and turnover of above-ground and root litter and microbial residues [6,7]. In this natural forest, the leaf and root litter was mainly inputted to the surface soil, resulting in the surface enrichment of soil organic C. The SP was covered with grassland in summer but mowed in autumn; thus, the input of litter greatly decreased as the vegetation coverage significantly reduced [9]. The 57.0% decrease in soil C concentration in the surface soil layer of the SP (Figure 2a) was very close to the 52% mean soil organic matter loss by deforestation noted in a recent meta-analysis [10]. The high surface C loss was due to the high aggregation of C in the cold climate [46], higher decomposition rate due to higher microbial biomass [47], and higher erosion due to lower vegetation cover (particularly in the steeper slope position) [40]. Therefore, revegetation on the SP such as seed sowing can effectively reduce surface C and nutrient losses [40].
The insignificant changes in mid-soil (20–50 cm) C were due to the high clay content in the illuvial horizon for the Eutroboralfs soil, which was similar to the meta-analyses of the forest harvesting effect on soil C [27,48]. The moving of surface C to subsoil layers partly compensated the localized C loss [27]. However, we detected a significant loss (40.9%) of C below 70 cm, higher than the 17.7% loss below 60 cm according to a meta-analysis of forest harvest on soil C [48], but contrary to the insignificant change in soil C below 20 cm in temperate forests after harvest [49]. It seems that the harvesting or disturbance effect is sampling depth-dependent. For instance, no significant effects of whole-tree harvesting on mineral soil C pool were detected in northern forests, but the positive effect of harvesting on C concentration increased with soil depth [24]. These inconsistencies across studies may arise from variations in disturbance intensity, duration since disturbance, restoration methodology, and sampling protocol design (particularly depth selection). Nevertheless, the paucity of deep soil data limited our quantification of the C loss of the whole soil profile [28,48]. The higher deep soil C loss was attributed to the high eluviation in the parent material horizon with a coarse texture for the Eutroboralfs. These results further demonstrated that soil layer and texture (or taxonomy) must be considered when making a comparison of the disturbance effect on soil properties [27,48,49].
The vertical pattern of soil N concentration decrease was close to that of soil C (Figure 2b). The 21.3% loss of N of the profile was consistent with the significant reduction in the mineral soil N pool in another meta-analysis on the harvesting effect [24] and 51% reduction in a meta-analysis on deforestation (including land use conversion) [10]. Whole-tree harvesting decreased the N stock of a 0–100 cm profile by 31.0% in a subtropical Pinus taeda forest [50]. The management of an SP decreased 0–30 cm soil N stock by only 12.5% in a mountainous Mediterranean region in Spain [43]. The greater N concentration decreases in the surface and subsurface layers (43.6% and 24.3% in the 0–10 cm and 10–20 cm) suggested significant N loss, similar to previous meta-analyses on whole-tree harvesting and deforestation [10,25]. The reduction in soil N was slightly less than that in soil C (Figure 2, Figure 3 and Figure 4), consistent with the results of meta-analyses [25,30]. These findings jointly indicate that N changes more slowly than organic C after vegetation and soil are disturbed, and N may have a constraining effect on C loss. However, the paucity of data limits the mechanical interpretation of soil N loss after the disturbance of SP construction.
The reduction in soil P concentration in the SP mainly occurred in the surface layer (Figure 2c), but the P density declined in deep soil layers (Figure 3c). The significant decrease in the P concentration of the SP in the surface soil (Figure 2c) was mainly due to reduced P input from litter and increased leaching. The significant reduction in deep-layer P density was mainly due to the decrease in BD and significant leaching of P in the coarse-textured parent material horizon. The surprising BD decrease in the parent material horizon might be a result of a strengthened weathering effect due to enhanced freeze–thaw cycles [51] via higher thermal conductivity as a result of removing the litter layer and compacted surface layer. The slightly high loss of P relative to N pools (27.5% vs. 21.3%) suggests a potential prolonged P limitation vs. N after an intense disturbance because N stock can be recovered progressively after a disturbance, as can C stock [18]. We note that the soil P pool was even rarely reported compared to the N pool in forest disturbance and harvesting studies. The 40% reduction seen in a recent meta-analysis [10] was contradicted by the insignificant changes in 7 scenarios recorded by Hume, Chen and Taylor [24]. New observational data are indispensable to reconcile the inconsistent results among these limited studies.

4.2. Variations in Ecological Stoichiometry of Soil C, N, and P

Eighteen years’ SP operation significantly decreased the C:N ratio of the total depth by 7.35%, mainly attributed to the surface and deep soil layers (Figure 4). The decreasing ratios of C:P and N:P with soil depth was consistent with the results of previous studies [52,53]. The impact of 14-year SP management on the 0–30 cm soil C:N ratio was up to −25.0% in a mountainous Mediterranean region, Spain [calculated from the C and N stocks, [43]]. This decline was also consistent with the results of a meta-analysis on the deforestation effect on soil C:N [10] but opposite to that of forest harvesting recorded by Hume, Chen and Taylor [24]. For the 0–100 cm depth in a subtropical Pinus taeda forest, whole-tree harvesting insignificantly decreased the C:N ratio by 4.8% [50]. The decrease in the C:N and C:P ratios in the SP surface layer was a result of higher C loss (respiration and erosion) versus N and P losses. The decline in the N:P ratio indicated a higher susceptibility to N loss compared to P in the surface [10]. The insignificant decline in C:P and N:P ratios for the whole profile was consistent with the partial offset in C:P and N:P changes among the layers (Figure 4).
A significant reduction in the C:N, C:P and N:P of the surface soil may impact the soil microbial communities. A decrease in C:N, C:P and N:P indicated a decreased substrate quality and elemental imbalance, suppressing the activity of soil microbes [54], which might in turn mitigate soil C and nutrient losses [6]. On the contrary, the lower plant nutrient availability of the SP soil inhibited the growth of grass, which limited the input of new organic matter to the degraded soil [55]. Whether these complex interactions of C:N:P and soil C are maintained after a disturbance will be further explored in the future [54].
The effect of SP management on the allometric relationships of C-N-P (Figure 5) was roughly consistent with that on C:N and C:P ratios in the top soil (Figure 4). The significant reduction in the allometric slope of the C-N-P stoichiometry of the 0–100 cm profile (Table 2) was mainly due to the surface layer reduction (Figure 5). The slopes or intercepts between C, N, and P in the 0–10 cm, 20–30 cm and 50–100 cm (only for C-N stoichiometric relationships) soil layers indicate that the losses of N and P were slower than that of C. The slopes of the C-N, C-P, and N-P relationships suggested that the dependence of soil C on nutrient supply in the natural state is stronger than that after a disturbance [14]. The SP-induced reduction in the scaling slope of C-N-P stoichiometry was more sensitive than the C:N:P stoichiometric ratios across the 0–100 cm profile. The inconsistent impacts on the soil C:N:P ratio and C-N-P stoichiometric relationships due to disturbances indicate that they complement each other in expressing C-N-P coupling; therefore, we recommend using both SMA regression and ratios to quantify the response of C-N-P stoichiometry to disturbance.
The changes in C, N and P stock and stoichiometry caused by SP operation also have implications on conservation strategies that aim to minimize environmental impacts. The most effective approach may be improving the vegetation cover and biomass on the SP [43]. On the one hand, increasing vegetation cover can reduce surface soil erosion [32]. On the other hand, the input of plant litter, the most important source of soil C and nutrients, can be increased via vegetation restoration [6]. Fertilizer may also be helpful to mitigate soil C loss because soil fertility can limit vegetation recovery [56,57].

4.3. Methodological Consideration of Disturbance Effects on Soil C and Nutrients

An assessment of disturbance effects on soil C and nutrients requires a careful consideration of three methodological factors: reporting units (concentration vs. pool), total sampling depth, and quantification approaches (the ESM vs. the FDM) for soil C and nutrient pools. Surface soil compaction from anthropogenic activities like site preparation [58] introduces complex interactions between increasing BD and decreasing concentration. The confounding of BD change demonstrates depth-dependent variability: while the FDM tends to underestimate disturbance impacts from forest harvesting and SP operation, its measurement biases diminish with increasing profile depths [59]. The heterogeneity of vertical concentration profiles (Figure 1) and BD distributions (Figure 5) further complicates impact quantification, creating non-linear responses to disturbance intensity that vary by soil type. We recommend reporting both concentration and pool together with BD by layers and discerning the best way to sample deep soil (e.g., 100 cm).
Although the ESM improved the estimates of soil C, N and P losses, there were still limitations. There are clear advantages of the ESM compared to the FDM in quantifying the disturbance effect on soil C and other mineral properties because the ESM considers the change in soil BD [34]. However, in the case of soil compaction, if the surface soil is eroded, and/or a significant proportion of deep mineral soil materials is leached, the ESM can also underestimate the losses of C and mineral elements due to sampling extra deep soil. This type of error may also interact with the vertical profile of concentration, with a smaller expectant error for deeper vertical concentration gradients.

4.4. Synergistic Changes in Soil C with Soil Water Content and Bulk Density

Soil disturbance damages soil structure [31] and reduces the porosity of the surface soil, thus increasing BD [9,28]. The construction and operation of the SP significantly increased the soil BD in the 0–20 cm layer, which was consistent with previous research findings [58,60]. Soil erosion by runoff due to reduced vegetation coverage and snow compaction together increased soil BD. The increasing BD corresponded to soil porosity and permeability reduction [60], which suppresses microbial activity and thus mitigates soil C loss.
The changes in soil physical properties caused by SP operation were consistent with those of soil C. This is because soil structure is closely associated with soil organic C [7,32]. Soil BD reflects the composition of minerals, organic matter and pores, and it is one of the most prominent indicators of soil structure [61]. The operation of the SP changed the regression slope of C and BD (Table 3), which was in accordance with the opposite impacts of SP operation on BD (Figure 6) and soil C concentration (Figure 2) in the surface soil. Nave, Vance, Swanston and Curtis [49] reviewed 432 forest logging studies and found that greater physical disturbances during logging cause more soil C losses.
The negative correlation between soil C and SWC (Table 3) indicated that higher SWC mitigated soil C loss. Transforming forests into an SP (often restored to grassland) decreases vegetation transpiration, which in turn raises SWC in the 0–10 cm layer (Figure 6a) [62]. SWC was positively related to surface soil disturbance caused by machinal disturbance [63]. Note that SWC in this study was measured at a late stage of the growing season, when the SWC was relatively higher than its summer mean [64]. It was assumed that this one-time measurement did not change the SP effect and its relationship with soil C because the SWC in SP soil was likely higher than that in forest soil sampled in summer. Soil moisture affects the activity of soil microorganisms and the decomposition rate of organic matter by suppressing soil aeration in this humid site.

5. Conclusions

Our findings demonstrate that 18 years of ski piste construction and operation substantially depleted soil C, N, and P stocks throughout the 0–100 cm profile, with both surface (0–10 cm) and deep soil layers (>50 cm) experiencing significant stock losses. The FDM systematically underestimated total stock measurements compared to the ESM approach by 5% to 8%, revealing inherent biases induced by soil compaction effects. The ESM-based quantification showed over 20% reductions in total soil C and nutrient pools, emphasizing the high vulnerability of forest soil to anthropogenic disturbance. The substantial C depletion observed in deep soil layers (>50 cm) underscores the necessity of comprehensive vertical profiling in ecological impact assessments. The disturbance regime decreased surface soil stoichiometric ratios and scaling slopes of C-N-P, suggesting nutrient-driven mechanisms on post-disturbance C stabilization. While increased BD and SWC in surface layers partially mitigated C loss, vegetation restoration emerges as an effective mitigation strategy through enhanced erosion control and organic matter replenishment. Future research should prioritize standardized deep soil sampling protocols and unified stock quantification methodologies to accurate assess disturbance effect, ultimately supporting evidence-based policies for sustainable winter tourism management.

Author Contributions

Conceptualization, H.Z. (Haiyan Zhang) and X.W.; methodology, X.W. and L.Z.; formal analysis, Y.H. and L.Z.; investigation, Y.H., Y.D., H.Z. (Huabin Zhao) and X.W.; resources, H.Z. (Haiyan Zhang); data curation, X.W. and H.Z. (Haiyan Zhang); writing—original draft preparation, Y.H. and X.W.; writing—review and editing, Y.H., Y.D., H.Z. (Huabin Zhao), L.Z., X.W. and H.Z. (Haiyan Zhang); supervision, X.W.; project administration, H.Z. (Haiyan Zhang); funding acquisition, H.Z. (Haiyan Zhang). All authors have read and agreed to the published version of the manuscript.

Funding

This research was funded by the Heilongjiang Provincial Higher Education Institutions Basic Scientific Research Business Fee Project for Supporting Young Academic Talents, grant number 2022KYYWF-FC02, and the Harbin Sport University Research Start-up Fund for Introduced Talents, grant number RC20-202103.

Data Availability Statement

The raw data supporting the conclusions of this article will be made available by the corresponding authors.

Acknowledgments

The Maoershan Forest Ecosystem Research Station provided field logistic support.

Conflicts of Interest

The authors declare no conflicts of interest.

Abbreviations

The following abbreviations are used in this manuscript:
CCarbon
NNitrogen
PPhosphorus
SPSki piste
NPNatural forest
SWCSoil water content on a dry mass basis
BDBulk density
C:NC-to-N mass ratio
C:PC-to-P mass ratio
N:PN-to-P mass ratio
SMAStandard major axis
FDMFixed depth method
ESMEquivalent soil mass method

References

  1. Gillett, N.; Kirchmeier-Young, M.; Ribes, A.; Shiogama, H.; Hegerl, G.; Knutti, R.; Gastineau, G.; John, J.; Li, L.; Nazarenko, L.; et al. Constraining human contributions to observed warming since the pre-industrial period. Nat. Clim. Change 2021, 11, 1–6. [Google Scholar] [CrossRef]
  2. IPCC. Climate Change 2023: Synthesis Report. Contribution of Working Groups I, II and III to the Sixth Assessment Report of the Intergovernmental Panel on Climate Change; IPCC: Geneva, Switzerland, 2023; pp. 35–115. [Google Scholar]
  3. Wang, F.; Harindintwali, J.D.; Yuan, Z.; Wang, M.; Wang, F.; Li, S.; Yin, Z.; Huang, L.; Fu, Y.; Li, L.; et al. Technologies and perspectives for achieving carbon neutrality. Innovation 2021, 2, 100180. [Google Scholar] [CrossRef] [PubMed]
  4. Tang, B.; Rocci, K.S.; Lehmann, A.; Rillig, M.C. Nitrogen increases soil organic carbon accrual and alters its functionality. Glob. Change Biol. 2023, 29, 1971–1983. [Google Scholar] [CrossRef] [PubMed]
  5. Minasny, B.; Malone, B.P.; McBratney, A.B.; Angers, D.A.; Arrouays, D.; Chambers, A.; Chaplot, V.; Chen, Z.-S.; Cheng, K.; Das, B.S.; et al. Soil carbon 4 per mille. Geoderma 2017, 292, 59–86. [Google Scholar] [CrossRef]
  6. Feng, X.; Dai, G.; Liu, T.; Jia, J.; Zhu, E.; Liu, C.; Zhao, Y.; Wang, Y.; Kang, E.; Xiao, J.; et al. Understanding the mechanisms and potential pathways of soil carbon sequestration from the biogeochemistry perspective. Sci. China-Earth Sci. 2024, 67, 3386–3396. [Google Scholar] [CrossRef]
  7. Wiesmeier, M.; Urbanski, L.; Hobley, E.; Lang, B.; von Luetzow, M.; Marin-Spiotta, E.; van Wesemael, B.; Rabot, E.; Liess, M.; Garcia-Franco, N.; et al. Soil organic carbon storage as a key function of soils—A review of drivers and indicators at various scales. Geoderma 2019, 333, 149–162. [Google Scholar] [CrossRef]
  8. Lal, R. Forest soils and carbon sequestration. For. Ecol. Manag. 2005, 220, 242–258. [Google Scholar] [CrossRef]
  9. Jandl, R.; Lindner, M.; Vesterdal, L.; Bauwens, B.; Baritz, R.; Hagedorn, F.; Johnson, D.W.; Minkkinen, K.; Byrne, K.A. How strongly can forest management influence soil carbon sequestration? Geoderma 2007, 137, 253–268. [Google Scholar] [CrossRef]
  10. Mgelwa, A.S.; Ngaba, M.J.Y.; Hu, B.; Gurmesa, G.A.; Mwakaje, A.G.; Nyemeck, M.P.B.; Zhu, F.; Qiu, Q.; Song, L.; Wang, Y.; et al. Meta-analysis of 21st century studies shows that deforestation induces profound changes in soil characteristics, particularly soil organic carbon accumulation. For. Ecosyst. 2025, 12, 100257. [Google Scholar] [CrossRef]
  11. Wang, Y.; Chen, L.; Xiang, W.; Ouyang, S.; Zhang, T.; Zhang, X.; Zeng, Y.; Hu, Y.; Luo, G.; Kuzyakov, Y. Forest conversion to plantations: A meta-analysis of consequences for soil and microbial properties and functions. Glob. Change Biol. 2021, 27, 5643–5656. [Google Scholar] [CrossRef]
  12. Hobley, E.; Baldock, J.; Hua, Q.; Wilson, B. Land-use contrasts reveal instability of subsoil organic carbon. Glob. Change Biol. 2017, 23, 955–965. [Google Scholar] [CrossRef] [PubMed]
  13. Lavallee, J.M.; Soong, J.L.; Cotrufo, M.F. Conceptualizing soil organic matter into particulate and mineral-associated forms to address global change in the 21st century. Glob. Change Biol. 2020, 26, 261–273. [Google Scholar] [CrossRef] [PubMed]
  14. Cleveland, C.C.; Liptzin, D. C:N:P stoichiometry in soil: Is there a “Redfield ratio” for the microbial biomass? Biogeochemistry 2007, 85, 235–252. [Google Scholar] [CrossRef]
  15. Tian, H.; Chen, G.; Zhang, C.; Melillo, J.M.; Hall, C.A.S. Pattern and variation of C:N:P ratios in China’s soils: A synthesis of observational data. Biogeochemistry 2010, 98, 139–151. [Google Scholar] [CrossRef]
  16. Sinsabaugh, R.L.; Hill, B.H.; Shah, J.J.F. Ecoenzymatic stoichiometry of microbial organic nutrient acquisition in soil and sediment. Nature 2009, 462, 795–798. [Google Scholar] [CrossRef]
  17. Xu, X.; Thornton, P.E.; Post, W.M. A global analysis of soil microbial biomass carbon, nitrogen and phosphorus in terrestrial ecosystems. Glob. Ecol. Biogeogr. 2013, 22, 737–749. [Google Scholar] [CrossRef]
  18. Li, D.; Niu, S.; Luo, Y. Global patterns of the dynamics of soil carbon and nitrogen stocks following afforestation: A meta-analysis. New Phytol. 2012, 195, 172–181. [Google Scholar] [CrossRef]
  19. Tessier, J.T.; Raynal, D.J. Vernal nitrogen and phosphorus retention by forest understory vegetation and soil microbes. Plant Soil 2003, 256, 443–453. [Google Scholar] [CrossRef]
  20. Gao, Y.; He, N.; Yu, G.; Chen, W.; Wang, Q. Long-term effects of different land use types on C, N, and P stoichiometry and storage in subtropical ecosystems: A case study in China. Ecol. Eng. 2014, 67, 171–181. [Google Scholar] [CrossRef]
  21. Chen, H.; Zhang, S.; Ma, C.; Xiang, Y.; Wu, J. Restoring farmland to forest increases phosphorus limitation based on microbial and soil C:N:P stoichiometry-a synthesis across China. For. Ecol. Manag. 2024, 556, 121745. [Google Scholar] [CrossRef]
  22. Zhao, F.; Sun, J.; Ren, C.; Kang, D.; Deng, J.; Han, X.; Yang, G.; Feng, Y.; Ren, G. Land use change influences soil C, N, and P stoichiometry under ’Grain-to-Green Program’ in China. Sci. Rep. 2015, 5, 10195. [Google Scholar] [CrossRef]
  23. Bing, H.; Wu, Y.; Zhou, J.; Sun, H.; Luo, J.; Wang, J.; Yu, D. Stoichiometric variation of carbon, nitrogen, and phosphorus in soils and its implication for nutrient limitation in alpine ecosystem of Eastern Tibetan Plateau. J. Soils Sediments 2016, 16, 405–416. [Google Scholar] [CrossRef]
  24. Hume, A.M.; Chen, H.Y.H.; Taylor, A.R. Intensive forest harvesting increases susceptibility of northern forest soils to carbon, nitrogen and phosphorus loss. J. Appl. Ecol. 2018, 55, 246–255. [Google Scholar] [CrossRef]
  25. Achat, D.L.; Deleuze, C.; Landmann, G.; Pousse, N.; Ranger, J.; Augusto, L. Quantifying consequences of removing harvesting residues on forest soils and tree growth—A meta-analysis. For. Ecol. Manag. 2015, 348, 124–141. [Google Scholar] [CrossRef]
  26. Petrenko, C.L.; Friedland, A.J. Mineral soil carbon pool responses to forest clearing in Northeastern hardwood forests. Glob. Change Biol. Bioenergy 2015, 7, 1283–1293. [Google Scholar] [CrossRef]
  27. Achat, D.L.; Fortin, M.; Landmann, G.; Ringeval, B.; Augusto, L. Forest soil carbon is threatened by intensive biomass harvesting. Sci. Rep. 2015, 5, 15991. [Google Scholar] [CrossRef]
  28. Mayer, M.; Prescott, C.E.; Abaker, W.E.; Augusto, L.; Cécillon, L.; Ferreira, G.W.; James, J.; Jandl, R.; Katzensteiner, K.; Laclau, J.-P. Tamm Review: Influence of forest management activities on soil organic carbon stocks: A knowledge synthesis. For. Ecol. Manag. 2020, 466, 118127. [Google Scholar] [CrossRef]
  29. Nazari, M.; Arthur, E.; Lamandé, M.; Keller, T.; Bilyera, N.; Bickel, S. A meta-analysis of soil susceptibility to machinery-induced compaction in forest ecosystems across global climatic zones. Curr. For. Rep. 2023, 9, 370–381. [Google Scholar] [CrossRef]
  30. Yang, L.; Zhang, H.; Qin, J.; Liu, X.; Mayer, M. A global meta-analysis of forest harvesting effects on soil respiration, its components, and temperature sensitivity. Agric. For. Meteorol. 2024, 358, 110259. [Google Scholar] [CrossRef]
  31. Bronick, C.J.; Lal, R. Soil structure and management: A review. Geoderma 2005, 124, 3–22. [Google Scholar] [CrossRef]
  32. Lal, R. Restoring soil quality to mitigate soil degradation. Sustainability 2015, 7, 5875–5895. [Google Scholar] [CrossRef]
  33. Rovira, P.; Sauras-Yera, T.; Romanya, J. Equivalent-mass versus fixed-depth as criteria for quantifying soil carbon sequestration: How relevant is the difference? Catena 2022, 214, 106283. [Google Scholar] [CrossRef]
  34. von Haden, A.C.; Yang, W.H.; DeLucia, E.H. Soils’ dirty little secret: Depth-based comparisons can be inadequate for quantifying changes in soil organic carbon and other mineral soil properties. Glob. Change Biol. 2020, 26, 3759–3770. [Google Scholar] [CrossRef] [PubMed]
  35. Tang, C.; Zeng, R.; Han, Y. Coupling coordination evaluation of economic development, ecological environment, and the tourism industry in ski resorts. J. Clean. Prod. 2023, 426, 139076. [Google Scholar] [CrossRef]
  36. Wipf, S.; Rixen, C.; Fischer, M.; Schmid, B.; Stoeckli, V. Effects of ski piste preparation on alpine vegetation. J. Appl. Ecol. 2005, 42, 306–316. [Google Scholar] [CrossRef]
  37. Rolando, A.; Caprio, E.; Rinaldi, E.; Ellena, I. The impact of high-altitude ski-runs on alpine grassland bird communities. J. Appl. Ecol. 2007, 44, 210–219. [Google Scholar] [CrossRef]
  38. Allegrezza, M.; Cocco, S.; Pesaresi, S.; Courchesne, F.; Corti, G. Effect of snowpack management on grassland biodiversity and soil properties at a ski resort in the Mediterranean basin (central Italy). Plant Biosyst. 2017, 151, 1101–1110. [Google Scholar] [CrossRef]
  39. Ciarkowska, K. Assessment of heavy metal pollution risks and enzyme activity of meadow soils in urban area under tourism load: A case study from Zakopane (Poland). Environ. Sci. Pollut. Res. 2018, 25, 13709–13718. [Google Scholar] [CrossRef] [PubMed]
  40. Kangas, K.; Tolvanen, A.; Kalkaja, T.; Siikamaki, P. Ecological impacts of revegetation and management practices of ski slopes in northern Finland. Environ. Manag. 2009, 44, 408–419. [Google Scholar] [CrossRef]
  41. Lee, J.; Hopmans, J.W.; Rolston, D.E.; Baer, S.G.; Six, J. Determining soil carbon stock changes: Simple bulk density corrections fail. Agric. Ecosyst. Environ. 2009, 134, 251–256. [Google Scholar] [CrossRef]
  42. Warton, D.I.; Wright, I.J.; Falster, D.S.; Westoby, M. Bivariate line-fitting methods for allometry. Biol. Rev. 2006, 81, 259–291. [Google Scholar] [CrossRef] [PubMed]
  43. Delgado, R.; Sanchez-Maranon, M.; Martin-Garcia, J.M.; Aranda, V.; Serrano-Bernardo, F.; Rosua, J.L. Impact of ski pistes on soil properties: A case study from a mountainous area in the Mediterranean region. Soil Use Manag. 2007, 23, 269–277. [Google Scholar] [CrossRef]
  44. Zummo, L.M.; Friedland, A.J. Soil carbon release along a gradient of physical disturbance in a harvested northern hardwood forest. For. Ecol. Manag. 2011, 261, 1016–1026. [Google Scholar] [CrossRef]
  45. Leppälammi-Kujansuu, J.; Aro, L.; Salemaa, M.; Hansson, K.; Kleja, D.B.; Helmisaari, H.-S. Fine root longevity and carbon input into soil from below-and aboveground litter in climatically contrasting forests. For. Ecol. Manag. 2014, 326, 79–90. [Google Scholar] [CrossRef]
  46. Mayer, M.; Baltensweiler, A.; James, J.; Rigling, A.; Hagedorn, F. A global synthesis and conceptualization of the magnitude and duration of soil carbon losses in response to forest disturbances. Glob. Ecol. Biogeogr. 2024, 33, 141–150. [Google Scholar] [CrossRef]
  47. Kong, Q. Effect of Detritus Removal on Soil Carbon Concentration and Mineralization in a Deciduous Forest in the Maoershan Mountain. Mater Thesis, Northeast Forestry University, Harbin, China, 2018. [Google Scholar]
  48. James, J.; Harrison, R. The effect of harvest on forest soil carbon: A meta-analysis. Forests 2016, 7, 308. [Google Scholar] [CrossRef]
  49. Nave, L.E.; Vance, E.D.; Swanston, C.W.; Curtis, P.S. Harvest impacts on soil carbon storage in temperate forests. For. Ecol. Manag. 2010, 259, 857–866. [Google Scholar] [CrossRef]
  50. Mushinski, R.M.; Boutton, T.W.; Scott, D.A. Decadal-scale changes in forest soil carbon and nitrogen storage are influenced by organic matter removal during timber harvest. J. Geophys. Res. Biogeosciences 2017, 122, 846–862. [Google Scholar] [CrossRef]
  51. Xu, C.; Zhang, Z.; Zhang, S.; Jin, D.; Yang, C.; Melnikov, A.; Jinbang, Z. Self-weighting of the overlying soil horizon catalyzed by freeze–thaw cycles leads to silt particle enrichment in the soil profile. Catena 2024, 237, 107815. [Google Scholar] [CrossRef]
  52. Jackson, R.; Schenk, H.; Jobbagy, E.; Canadell, J.; Colello, G.; Dickinson, R.; Field, C.; Friedlingstein, P.; Heimann, M.; Hibbard, K. Belowground consequences of vegetation change and their treatment in models. Ecol. Appl. 2000, 10, 470–483. [Google Scholar] [CrossRef]
  53. Chen, X.; Feng, J.; Ding, Z.; Tang, M.; Zhu, B. Changes in soil total, microbial and enzymatic C-N-P contents and stoichiometry with depth and latitude in forest ecosystems. Sci. Total Environ. 2022, 816, 151583. [Google Scholar] [CrossRef] [PubMed]
  54. Zechmeister-Boltenstern, S.; Keiblinger, K.M.; Mooshammer, M.; Peñuelas, J.; Richter, A.; Sardans, J.; Wanek, W. The application of ecological stoichiometry to plant–microbial–soil organic matter transformations. Ecol. Monogr. 2015, 85, 133–155. [Google Scholar] [CrossRef]
  55. Reynolds, L.L.; Lajtha, K.; Bowden, R.D.; Tfaily, M.M.; Johnson, B.R.; Bridgham, S.D. The path from litter to soil: Insights into soil C cycling from long-term input manipulation and high-resolution mass spectrometry. J. Geophys. Res. Biogeosciences 2018, 123, 1486–1497. [Google Scholar] [CrossRef]
  56. Barberis, D.; Lombardi, G.; Enri, S.R.; Pittarello, M.; Viglietti, D.; Freppaz, M.; Lonati, M. Nitrogen fertilizer enhances vegetation establishment of a high-altitude machine-graded ski slope. Restor. Ecol. 2023, 31, e13777. [Google Scholar] [CrossRef]
  57. Zhang, H.-S.; Zha, T.-G.; Yu, Y.; Ji, X.-D.; Jesus, R.-C. Assessing vegetation community distribution characteristics and succession stages in mountainous areas hosting coming Winter Olympics Games. J. Mt. Sci. 2021, 18, 2870–2887. [Google Scholar] [CrossRef]
  58. Walmsley, J.D.; Godbold, D.L. Stump harvesting for bioenergy—A review of the environmental impacts. Forestry 2010, 83, 17–38. [Google Scholar] [CrossRef]
  59. James, J.; Page-Dumroese, D.; Busse, M.; Palik, B.; Zhang, J.; Eaton, B.; Slesak, R.; Tirocke, J.; Kwon, H. Effects of forest harvesting and biomass removal on soil carbon and nitrogen: Two complementary meta-analyses. For. Ecol. Manag. 2021, 485, 118935. [Google Scholar] [CrossRef]
  60. Han, S.-K.; Han, H.-S.; Page-Dumroese, D.S.; Johnson, L.R. Soil compaction associated with cut-to-length and whole-tree harvesting of a coniferous forest. Can. J. For. Res. 2009, 39, 976–989. [Google Scholar] [CrossRef]
  61. Rabot, E.; Wiesmeier, M.; Schlüter, S.; Vogel, H.-J. Soil structure as an indicator of soil functions: A review. Geoderma 2018, 314, 122–137. [Google Scholar] [CrossRef]
  62. Mariani, L.; Chang, S.X.; Kabzems, R. Effects of tree harvesting, forest floor removal, and compaction on soil microbial biomass, microbial respiration, and N availability in a boreal aspen forest in British Columbia. Soil Biol. Biochem. 2006, 38, 1734–1744. [Google Scholar] [CrossRef]
  63. Allman, M.; Jankovský, M.; Messingerová, V.; Allmanová, Z. Soil moisture content as a predictor of soil disturbance caused by wheeled forest harvesting machines on soils of the Western Carpathians. J. For. Res. 2017, 28, 283–289. [Google Scholar] [CrossRef]
  64. Wang, C.; Han, Y.; Chen, J.; Wang, X.; Zhang, Q.; Bond-Lamberty, B. Seasonality of soil CO2 efflux in a temperate forest: Biophysical effects of snowpack and spring freeze–thaw cycles. Agric. For. Meteorol. 2013, 177, 83–92. [Google Scholar] [CrossRef]
Figure 1. Experiment design and sampling plots. Four blocks are set along the slope from low to high.
Land 14 00846 g001
Figure 2. Vertical profile of soil C, N and P concentrations in ski piste and adjacent natural forest. SP: ski piste, NF: natural forest. The bar is concentration, and the line is concentration of each layer relative to the top 10 cm. Different capital letters indicate significant differences in C, N, and P concentrations between SP and forest in the same soil layer, and different lowercase letters indicate significant differences in concentrations among different soil layers (p < 0.05). The same below.
Land 14 00846 g002
Figure 3. Comparison of C, N and P densities by soil layers between ski piste and adjacent forest. Different capital letters indicate significant differences in C, N, and P densities between SP and forest in the same soil layer.
Land 14 00846 g003
Figure 4. Effects of ski piste operation on mass ratios of soil C, N and P by soil layers. Different capital letters indicate significant differences in mass ratios between SP and forest in the same soil layer.
Land 14 00846 g004
Figure 5. Comparison of allometric relationships of soil carbon, N and P between ski piste and natural forest with the standardized major axis regression by soil layers. Blue square and orange circle represent ski piste and natural forest, respectively. Common slope and intercept are shown in black color. Dotted lines indicate insignificant regressions for C-P (p = 0.711), N-P (p = 0.251) in 0–10 cm soil layer and C-P (p = 0.136), N-P (p = 0.078) in 10–20 cm soil layer of natural forest.
Land 14 00846 g005
Figure 6. Effects of ski piste operation on soil water content and bulk density in different soil layers.
Land 14 00846 g006
Table 1. A comparison of C, N and P densities for the 100 cm profile between the ski piste and the adjacent forest. The equivalent soil mass method (ESM) is used as a reference to assess errors made by the fixed depth method (FDM). Different uppercase (lowercase) letters indicate that the density estimates with the FDM (ESM) are significantly different from the forest soil pool.
TreatmentC density (h ta−1)N density (h ta−1)P density (h ta−1)
NF220.39 ± 12.11 Aa24.53 ± 1.27 Aa7.72 ± 0.41 Aa
SP based on FDM168.62 ± 8.17 B20.23 ± 1.16 B6.02 ± 0.37 B
SP based on ESM160.09 ± 6.36 b19.32 ± 0.99 b5.60 ± 0.29 b
Table 2. A comparison of the allometric relationships of log10-transformed soil C, N and P between the ski piste and natural forest with the standardized major axis regression across the 0–100 cm profile. Different lowercase letters indicate significant differences in slopes between ski piste and natural forest.
YXTreatmentR2Slope [95% CI]LRTpIntercept
CNNatural forest (NF)0.76391.01 a [81.05, 102.19] −5.446
Ski piste (SP)0.91848.38 b [45.18, 51.81]66.0640.0015.968
CPNF0.439161.82 b [135.49, 193.28] 45.87
SP0.61669.68 a [60.14, 80.74]46.5650.00135.28
NPNF0.55916.08 a [13.74, 18.83] 4.942
SP0.5929.416 b [8.09, 10.96]22.1580.0014.471
Table 3. Test of homogeneity of slope and intercept by standardized major axis regression of soil carbon against soil water content (SWC) and bulk density (BD) in different soil layers. Different lowercase letters indicate significant differences in slopes and intercepts between ski piste and natural forest. Line is fitted by standardized major axis regression: soil carbon = a + b × X, where a is intercept, b is slope, and X is SWC or BD. Values of likelihood ratio test (LRT) and Wald test for homogeneity of slopes and intercepts are given.
XSoil Layer
(cm)
TreatmentR2pSlope [95% CI]LRTpInterceptWaldp
SWC0–10 cmSki piste (SP)0.927<0.001−1.71 b [−2.06, −1.41]13.990.001156.9
Natural forest (NF)0.3650.038−5.71 a [−9.75, −3.34] 431.1
10–20 cmSP0.798<0.001−1.95 a [−2.66, −1.42]2.950.092172.3 b11.650.001
NF0.5210.008−3.13 a [−5.01, −1.95] 267.4 a
20–30 cmSP0.6250.002−1.38 a [−2.10, −0.91]0.450.500125.4 a6.690.010
NF0.3180.056−1.11 a [−1.92, −0.64] 114.0 b
30–50 cmSP0.765<0.001−1.53 a [−2.14, −1.09]0.340.559134.3 a2.090.149
NF0.4030.027−1.28 a [−2.16, −0.76] 118.1 a
50–70 cmSP0.0010.938−1.34 a [−2.58, −0.70]1.690.201126.1 a0.580.448
NF0.5400.007−0.80 a [−1.27, −0.50] 79.2 a
70–100 cmSP0.1390.233−2.65 a [−4.90, −1.43]6.930.007242.4
NF0.2040.140−0.84 b [−1.53, −0.47] 83.6
BD0–10 cmSP0.810<0.001−69.60 a [−94.21, −51.42]4.130.054107.0 b6.020.014
NF0.1510.212−139.51 a [−256.92, −75.76] 175.9 a
10–20 cmSP0.762<0.001−68.68 a [−96.24, −49.02]1.470.218108.9 b4.600.032
NF0.4900.011−97.01 a [−157.41, −59.79] 124.7 a
20–30 cmSP0.6410.002−45.85 a [−69.12, −30.41]0.180.67678.8 a0.0020.969
NF0.6580.001−40.90 a [−61.08, −27.38] 73.3 a
30–50 cmSP0.5170.008−39.40 a [−63.16, −24.57]0.200.64466.8 a0.740.391
NF0.6350.002−34.49 a [−52.17, −22.80] 61.8 a
50–70 cmSP0.1260.25830.92 a [16.65, 57.39]4.230.048−37.5
NF0.742<0.001−14.85 b [−21.09, −10.46] 34.31
70–100 cmSP0.0060.809−56.06 a [107.88, −29.13]8.790.00620.5
NF0.4840.012−16.17 b [−26.31, -9.94] 37.0
Disclaimer/Publisher’s Note: The statements, opinions and data contained in all publications are solely those of the individual author(s) and contributor(s) and not of MDPI and/or the editor(s). MDPI and/or the editor(s) disclaim responsibility for any injury to people or property resulting from any ideas, methods, instructions or products referred to in the content.

