Article

Multi-Pattern Characteristics and Driving Mechanisms of Mixed Land Use: A Case Study of Changsha’s Built-Up Areas, China

School of Geographical Science, Hunan Normal University, Changsha 410081, China
*
Author to whom correspondence should be addressed.
Land 2025, 14(4), 895; https://doi.org/10.3390/land14040895
Submission received: 25 February 2025 / Revised: 9 April 2025 / Accepted: 16 April 2025 / Published: 18 April 2025

Abstract

:
Mixed land use (MLU) plays a pivotal role in promoting compact and sustainable urban development. This study examines Changsha’s built-up areas using the Place2vec model and Point of Interest (POI) data to identify MLU patterns. We quantitatively assess the degree of MLU through three dimensions: diversity, compatibility, and accessibility, and employ the Optimal Parameters-Based Geographical Detector (OPGD) model to uncover the driving factors influencing the MLU degree across different patterns. The results show that the Place2vec model identifies six mixed patterns in Changsha’s built-up areas, each encompassing diverse urban land types. The six mixed patterns exhibit significant differences in terms of diversity, compatibility, and accessibility, with the overall degree of MLU presenting a central–peripheral spatial structure. Although driving mechanisms vary across patterns, transport network connectivity and spatial utilization efficiency consistently exhibit dominant influences. These findings offer valuable insights for designing targeted urban planning strategies and optimizing land-use configurations to promote urban development.

1. Introduction

Contemporary studies on urban sustainability have demonstrated that mixed land use (MLU), which serves as an integrated development model to optimize spatial livability and residential quality [1,2,3], now constitutes a fundamental component in urban spatial planning and design frameworks [4]. MLU is a key instrument in both the “Compact City” concept [5] and the “New Urbanism” principles [6]. Furthermore, global exemplars, including Singapore and Los Angeles, and several cities in Canada, have incorporated MLU as one of the principles in their urban planning [7,8,9,10]. China’s ongoing transition to high-quality development is fundamentally transforming urban production systems and lifestyle patterns. This shift has rendered the conventional land-expansive urban growth model obsolete, necessitating innovative approaches to spatial governance. It is widely agreed that throughout this stage of high-quality development, “development increments” should be sought from the available land resources [11]. Investigating compact urban land utilization is essential to creating thriving cities and achieving intensive and efficient land use [12]. In this effort, improving the multifunctionality of land-use functions becomes especially crucial [13]. In China, cities such as Beijing, Shanghai, and Nanjing have also successively introduced policies to promote MLU, aiming to conserve and intensively use spatial resources through policy innovation, and to expand space for high-quality economic and social development [14,15]. MLU has emerged as a key strategy for raising the value of land resources, propelled by both regulatory initiatives and practical demand. To achieve high-quality urban development, mixed land-use planning and governance innovations have become essential.
MLU has been a prominent aspect of land development from the dawn of civilization, impacting the growth of cities and regions [16]. When the negative effects of MLU patterns became apparent after the Industrial Revolution [3], researchers looked to zoning regulations to solve urban problems. Following World War II, a lot of cities experienced urban renewal using the idea of “functional cities”. However, because absolute zoning had negative effects, like fewer service resources and higher travel costs [17], MLU theories have come back into vogue. “Diversity is nature to big cities” [18] is Jacobs’ proposal in The Death and Life of Great American Cities, which tackled urban problems including reduced vibrancy and unnecessary commuting brought on by functional zoning. MLU is now a vital strategy to support urban revitalization and improve urban land intensification as a result of the growth of sustainable development philosophies [9].
MLU was introduced to China in the 1990s [19] and has gradually gained attention from both the government and academia. From the initial introduction of international experiences [20,21,22] to the critical reconstruction of localized theoretical frameworks [23,24] and multidimensional empirical measurements [25,26], MLU has evolved from an academic consensus to a strategic policy instrument in China’s urban governance. It has provided a crucial foundation for formulating national and local urban development policies, as exemplified by the ‘15 min neighborhood life circle’—a representative practice of optimizing urban spatial structures through a functional mix.
There is still no universally accepted definition of MLU. The American Planning Association (APA) asserts that MLU development enhances walkability and fosters high-density, diverse spaces with functional compatibility [27]. The definition put forth by the Urban Land Institute in the United States is currently widely accepted: It entails planning projects that have three or more profitable uses; substantial physical and functional aspects of the project should be integrated, with a focus on walkable environments; planning should remain consistent. COUPLAND views MLU as the vertical integration of residential, commercial, and office functions within a single building [28]. Wang et al. define it as a mixed state of two or more land uses [29,30]. Some scholars, from a compatibility perspective, argue that MLU promotes the blending of compatible land uses to achieve the organic integration of different land-use types [10,21]. At the same time, MLU refers to the proximity of different land uses within a certain spatial range, featuring a higher intensity and density of use [31,32]. Comparative analysis shows that existing definitions vary in emphasis but share three core features: first, the integration of multiple land uses; second, the consideration of functional compatibility; third, the mixing occurs within a defined spatial area, with walkability as a key characteristic. In summary, MLU refers to a mixed state of land-use types with two or more compatible functions within a certain spatial range.
The measurement of MLU mainly revolves around the following four aspects. First, diversity of land-use types: Various methods are used to calculate the degree of MLU based on the diversity of land-use types, including the entropy index [33], Simpson Index [34], Shannon–Weaver Index [35], and Area Ratio Index [36]. Second, compatibility between different uses: Taleai et al. [37] have created a land compatibility evaluation model utilizing geographic information systems (GIS) platforms and techniques such as Terrestris. Zhuo et al. [38] enhanced MDI by putting out the formulas for the Vectorized Mix Degree Index (VMDI) and the Area-Weighted Vectorized Mix Degree Index (WVMDI) to gauge land compatibility. Third, the efficiency of a mixed layout through accessibility analysis: Space-based separation is commonly used to calculate the relative accessibility by measuring time distance, spatial distance, and other barriers between locations [39]. The potential measure, derived from Newton’s Law of Gravitation, was first applied in accessibility research by Hansen [40], considering distance decay factors. The cumulative-opportunity model is another widely used method due to its practicality and extensive application [41]. Fourth, the integration of multiple indicators for systematic evaluation [42]: Some studies combine diversity and accessibility indicators to measure regional MLU and explore its relationship with physical activities [43], social capital [3], urban vitality [44], etc. To comprehensively evaluate MLU, its measurement should incorporate diversity, compatibility, and accessibility [45]. Some scholars have developed composite indices to measure the degree of MLU from these three aspects [45,46]. However, current research on MLU still gives limited attention to compatibility [47], making it necessary to explore MLU by integrating diversity, compatibility, and accessibility.
With the gradual application of geospatial big data in urban computing, in academia, POI data have gradually been used to extract urban functional characteristics [48,49,50]. For example, compared to traditional land-use data, Yang believes that using POI data to measure urban MLU offers a finer level of granularity [35]. Li et al. used a random forest model to assign weights to POI data and studied the functional mixing degree of central urban areas [51]. Xia quantified the urban degree of MLU from a dynamic dimension using POI data [52]. However, some scholars rely solely on POI density to determine functional attributes, ignoring spatial correlations among POIs and hindering the analysis of regional functional differences. To address this issue, Yao [53] was the first to combine POI data with the Word2vec model, constructing a corpus by arranging natural language sequences based on the shortest-path approach to delineate urban functional zones. In reality, however, the sequential distribution of POI data differs significantly from that of natural language, and the shortest-path-based corpus strategy has limitations in capturing the spatial interaction characteristics of POIs. Yan [54] extended the Word2vec model into the Place2vec model, which efficiently identifies the semantic information and spatial relationships of POIs, reflecting their spatial interaction characteristics. Zheng [55] combined the Place2vec model with POI data to identify urban land functions. However, these models primarily focus on functional identification and have not further revealed the mixing characteristics under different functional patterns.
In addition to conducting the qualitative evaluation of the factors influencing the establishment of mixed areas from institutional and sociological perspectives [36,56], Kantor et al. [57] applied economic theory to quantify the driving forces underlying the formation of mixed urban areas.
The aforementioned research offers a strong basis for this work. However, although existing research can effectively extract spatial functional mixing patterns, it has not systematically explored the differences in multidimensional mixing characteristics under different patterns. Moreover, the measurement of the degree of MLU still primarily focuses on diversity and accessibility [47], with insufficient exploration of compatibility. Existing studies only look at the separate effects of different elements on MLU, ignoring their interrelationships. Additionally, there is a lack of classified discussions on the formation mechanisms of mixed land-use degrees under different patterns, which may lead to an incomplete analysis. Based on the limitations of the aforementioned research, the specific objectives of this study are as follows: (1) To utilize the Place2vec model to obtain comprehensive POI information for accurately extracting mixed land-use patterns in the built-up areas of Changsha; (2) to conduct an in-depth analysis of the current status of land-use diversity, compatibility, and accessibility in the built-up areas of Changsha and to explore the spatial distribution characteristics of the degree of mixed land use; (3) to uncover the driving factors of the degree of mixed land use under different mixed patterns, providing a scientific basis for urban planning and management. Thus, this study selects the built-up areas of Changsha as the research region, fully considering the spatial and geographic information of POIs. It adopts the Place2vec model, combined with frequency density and type proportion methods, to extract MLU patterns in the built-up areas of Changsha. On this basis, this study constructs a measurement method that combines diversity, compatibility, and accessibility to quantify the degree of MLU of a region. Furthermore, the driving forces behind the formation of mixed land-use degrees under different patterns are explored. This provides new insights and references for the governance of China’s existing spatial planning and promotes more efficient, harmonious, and sustainable urban development. Figure 1 presents the analytical framework of this study.

2. Research Area, Data Sources, and Methods
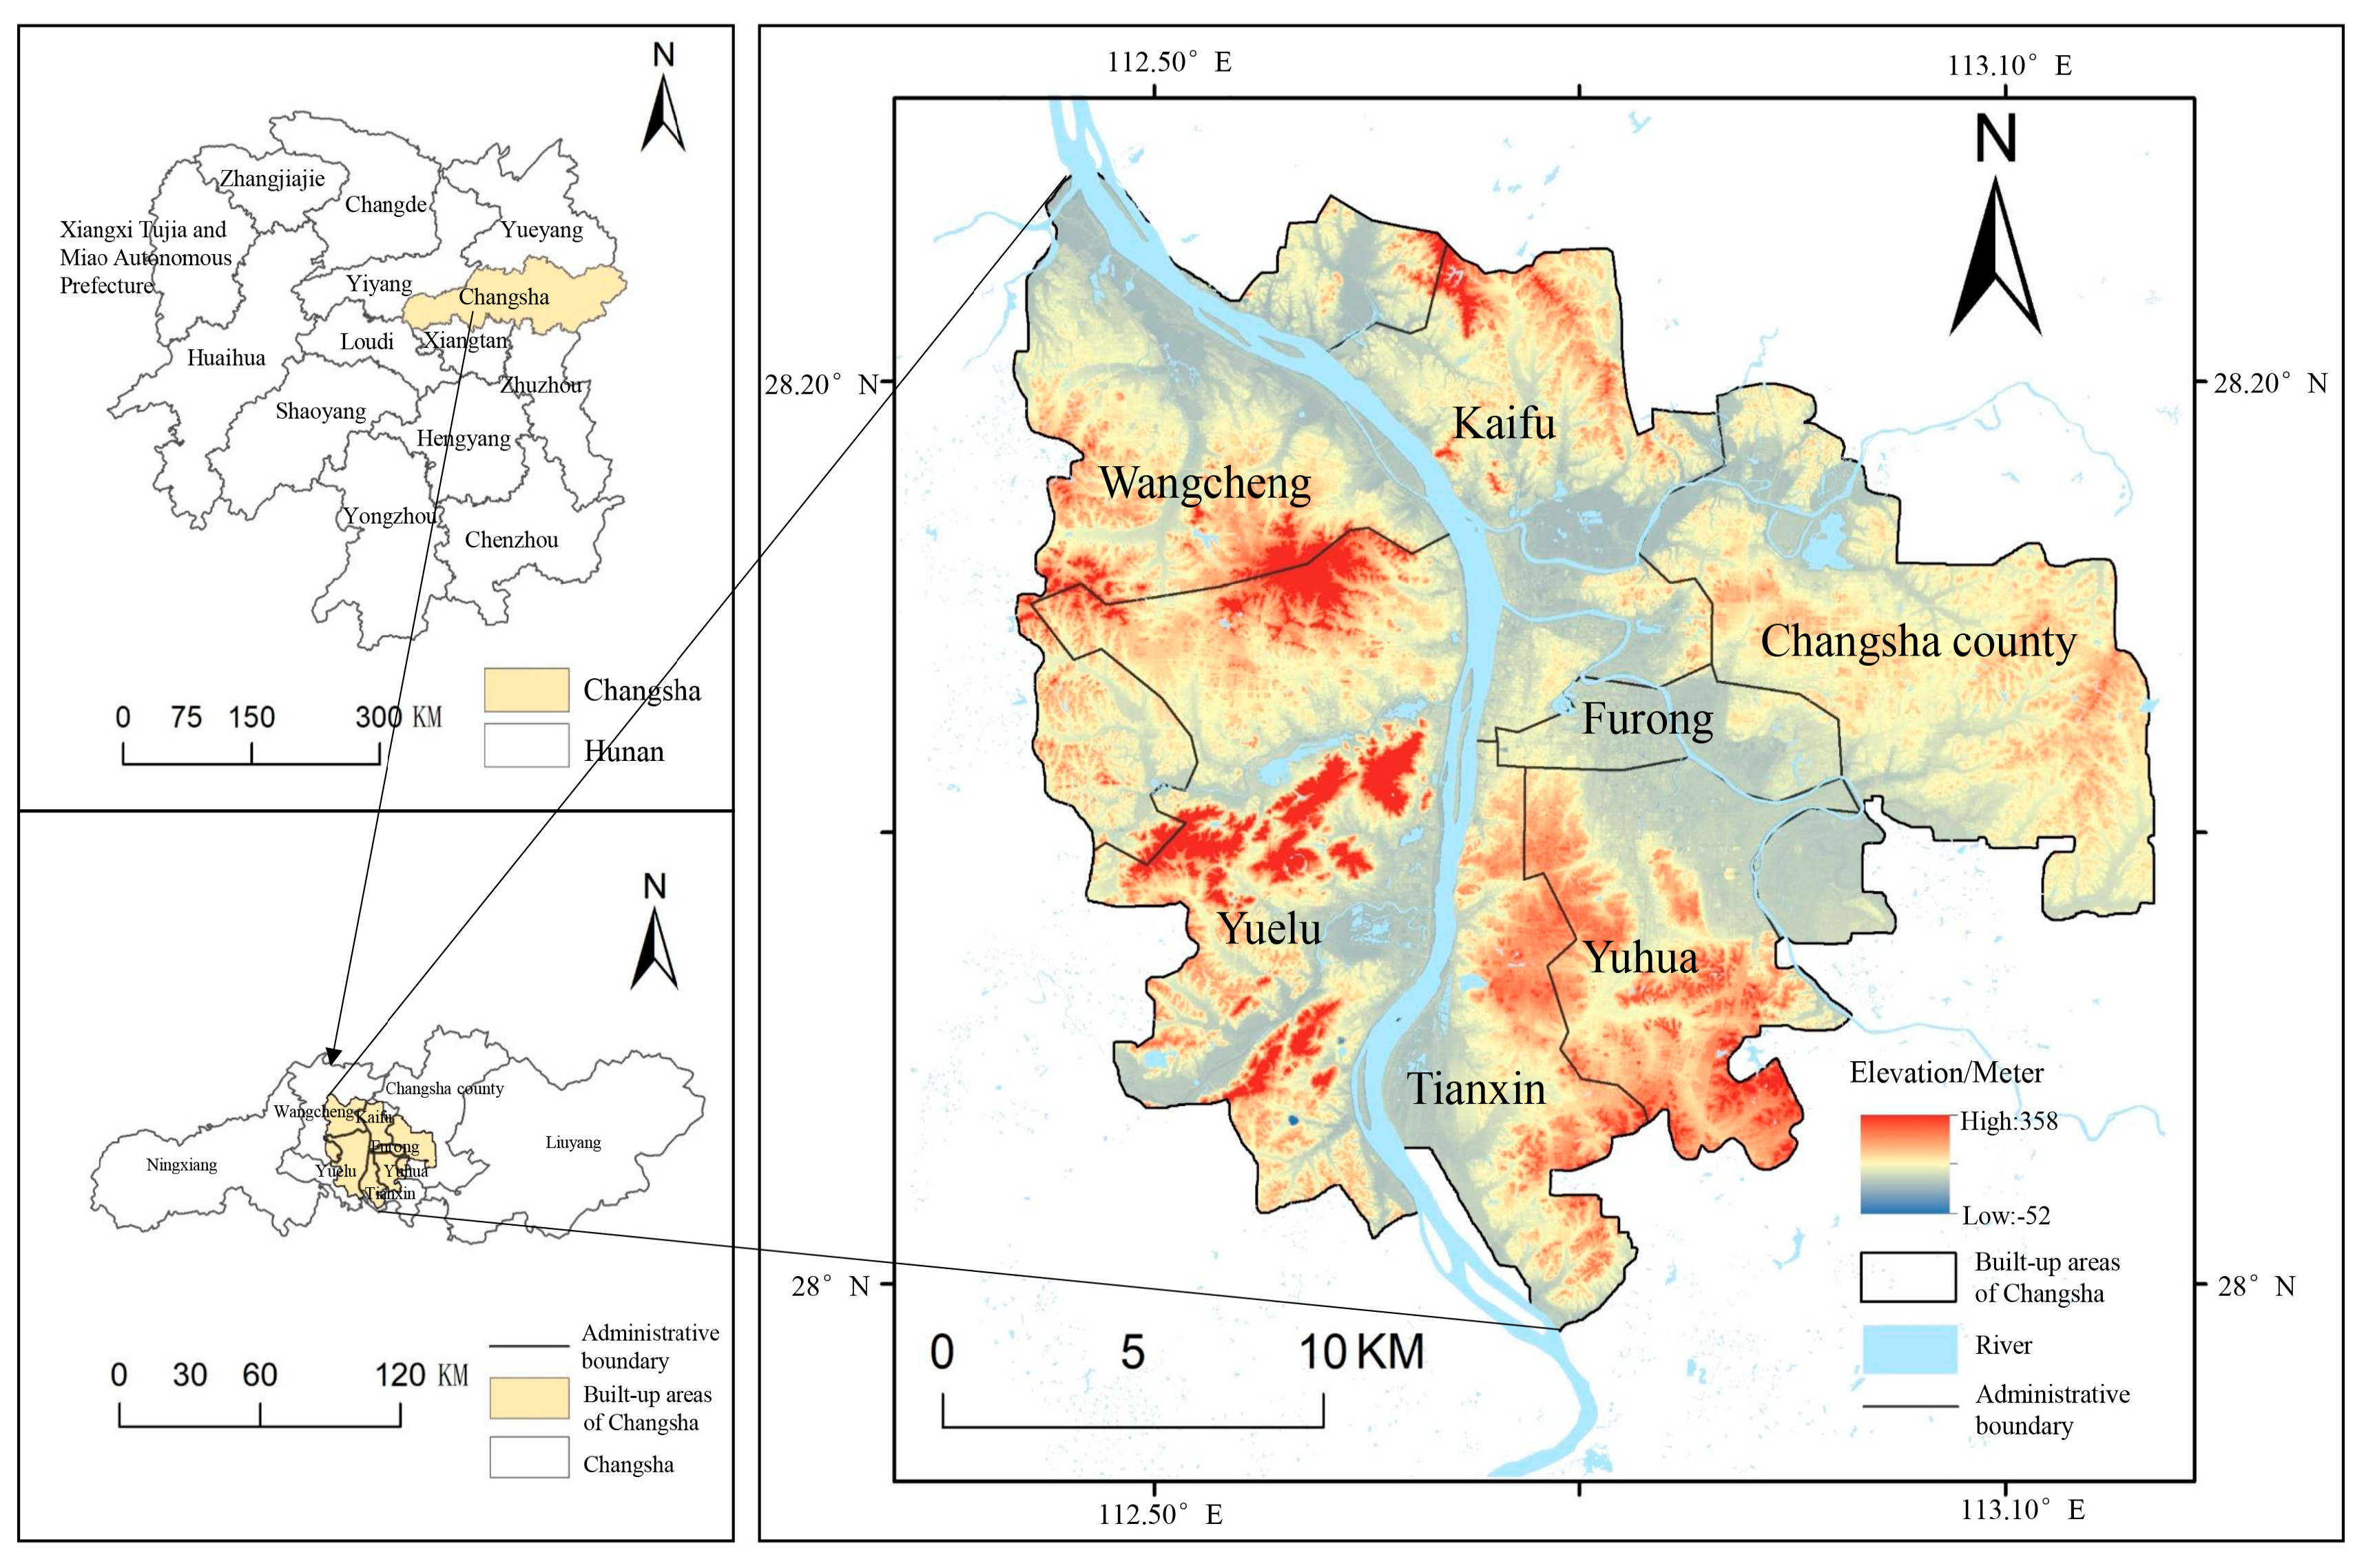
2.1. Research Area

Changsha is located between 111°53′ E–114°15′ E and 27°51′ N–28°40′ N (Figure 2). It is situated in the central region of China and occupies the northeastern part of Hunan Province. As the capital of Hunan Province, it is a major hub city in central China, the core engine of the Chang-Zhu-Tan urban agglomeration, and a strategic location in the Belt and Road Initiative. It is essential to the development of central China and the promotion of openness to the outside world. In the past decade, Changsha has witnessed tremendous expansion, and its urban spatial organization has been substantially solidified. However, it also faces common difficulties in large cities, making it typically representative. The built-up areas of Changsha serves as the research object for this paper, including Yuelu District, Tianxin District, Kaifu District, Furong District, Yuhua District, Wangcheng District, and Changsha County, and it is defined based on high-resolution imagery from Google Earth, the interpretation results from ArcGIS (10.5) software, and related findings [58]. In this study, the built-up areas was divided into a grid of 500 m × 500 m squares as the research units, and 4951 grid cells were demarcated within the study area based on the actual urban block design in Changsha.

2.2. Data Sources and Processing

The average housing price is obtained by scraping housing price websites to gather price information for each plot, and then taking the average of the housing prices for each plot; road data are downloaded from OpenStreetMap for analysis such as road network density; population data are downloaded from the WorldPop website; the urban surface impervious area is calculated using ENVI (6.1) as the platform, and the inverse value is taken to represent the green space ratio of each neighborhood; the vector data of building footprints and building height data are sourced from Baidu Maps. The POI data were scraped using Python (3.11) and primarily originate from Amap. Each of the 423,521 records that were acquired includes details like names, addresses, administrative districts, latitude, longitude, and others. Fifteen main categories are covered by the original data, including residential, dining, education, industrial land, and finance. There are numerous smaller categories inside each of the big categories, which are further subdivided into subcategories. The initial data categories are complicated, redundant, and plagued by problems like cross-repetition and ambiguous category classification. Consequently, data cleaning and filtering are required. Reorganizing the major, sub, and minor categories following classification criteria is necessary. The dataset is further de-identified from other less well-known categories [59], like convenience stores, small newsstands, and public toilets.
A final selection of 307,601 records was made following filtering. POIs are divided into six main categories based on the actual situation in Changsha and the “Urban Land Classification and Planning and Construction Land Standard” (GB 50137-2011) [60]: residential land, public administration and public service land, commercial land, industrial land, transportation land, and green space and square land (Table 1). POIs, represented as point data, lack area attributes and thus cannot accurately reflect the actual land area of geographical features. As a result, each type of POI needs to be given a weight. First, based on the urban public service facility planning standard GB50442 [61] (Revised Draft for Comments) and the average footprint area of representative POI data from actual sampling statistics, we assigned values ranging from 0 to 100, denoted as influence score b1. Then, taking into account that different POI data reflect different degrees of public influence on geographical entities, reference is made to relevant empirical studies [59]. We used a poll to gauge public knowledge of various POIs and standardized the results, which we then designated as relevance score b2. Lastly, each POI subcategory’s total weight was determined by multiplying the influence and relevance scores [62]: B = b1 × b2 (Table 2).

2.3. Methods

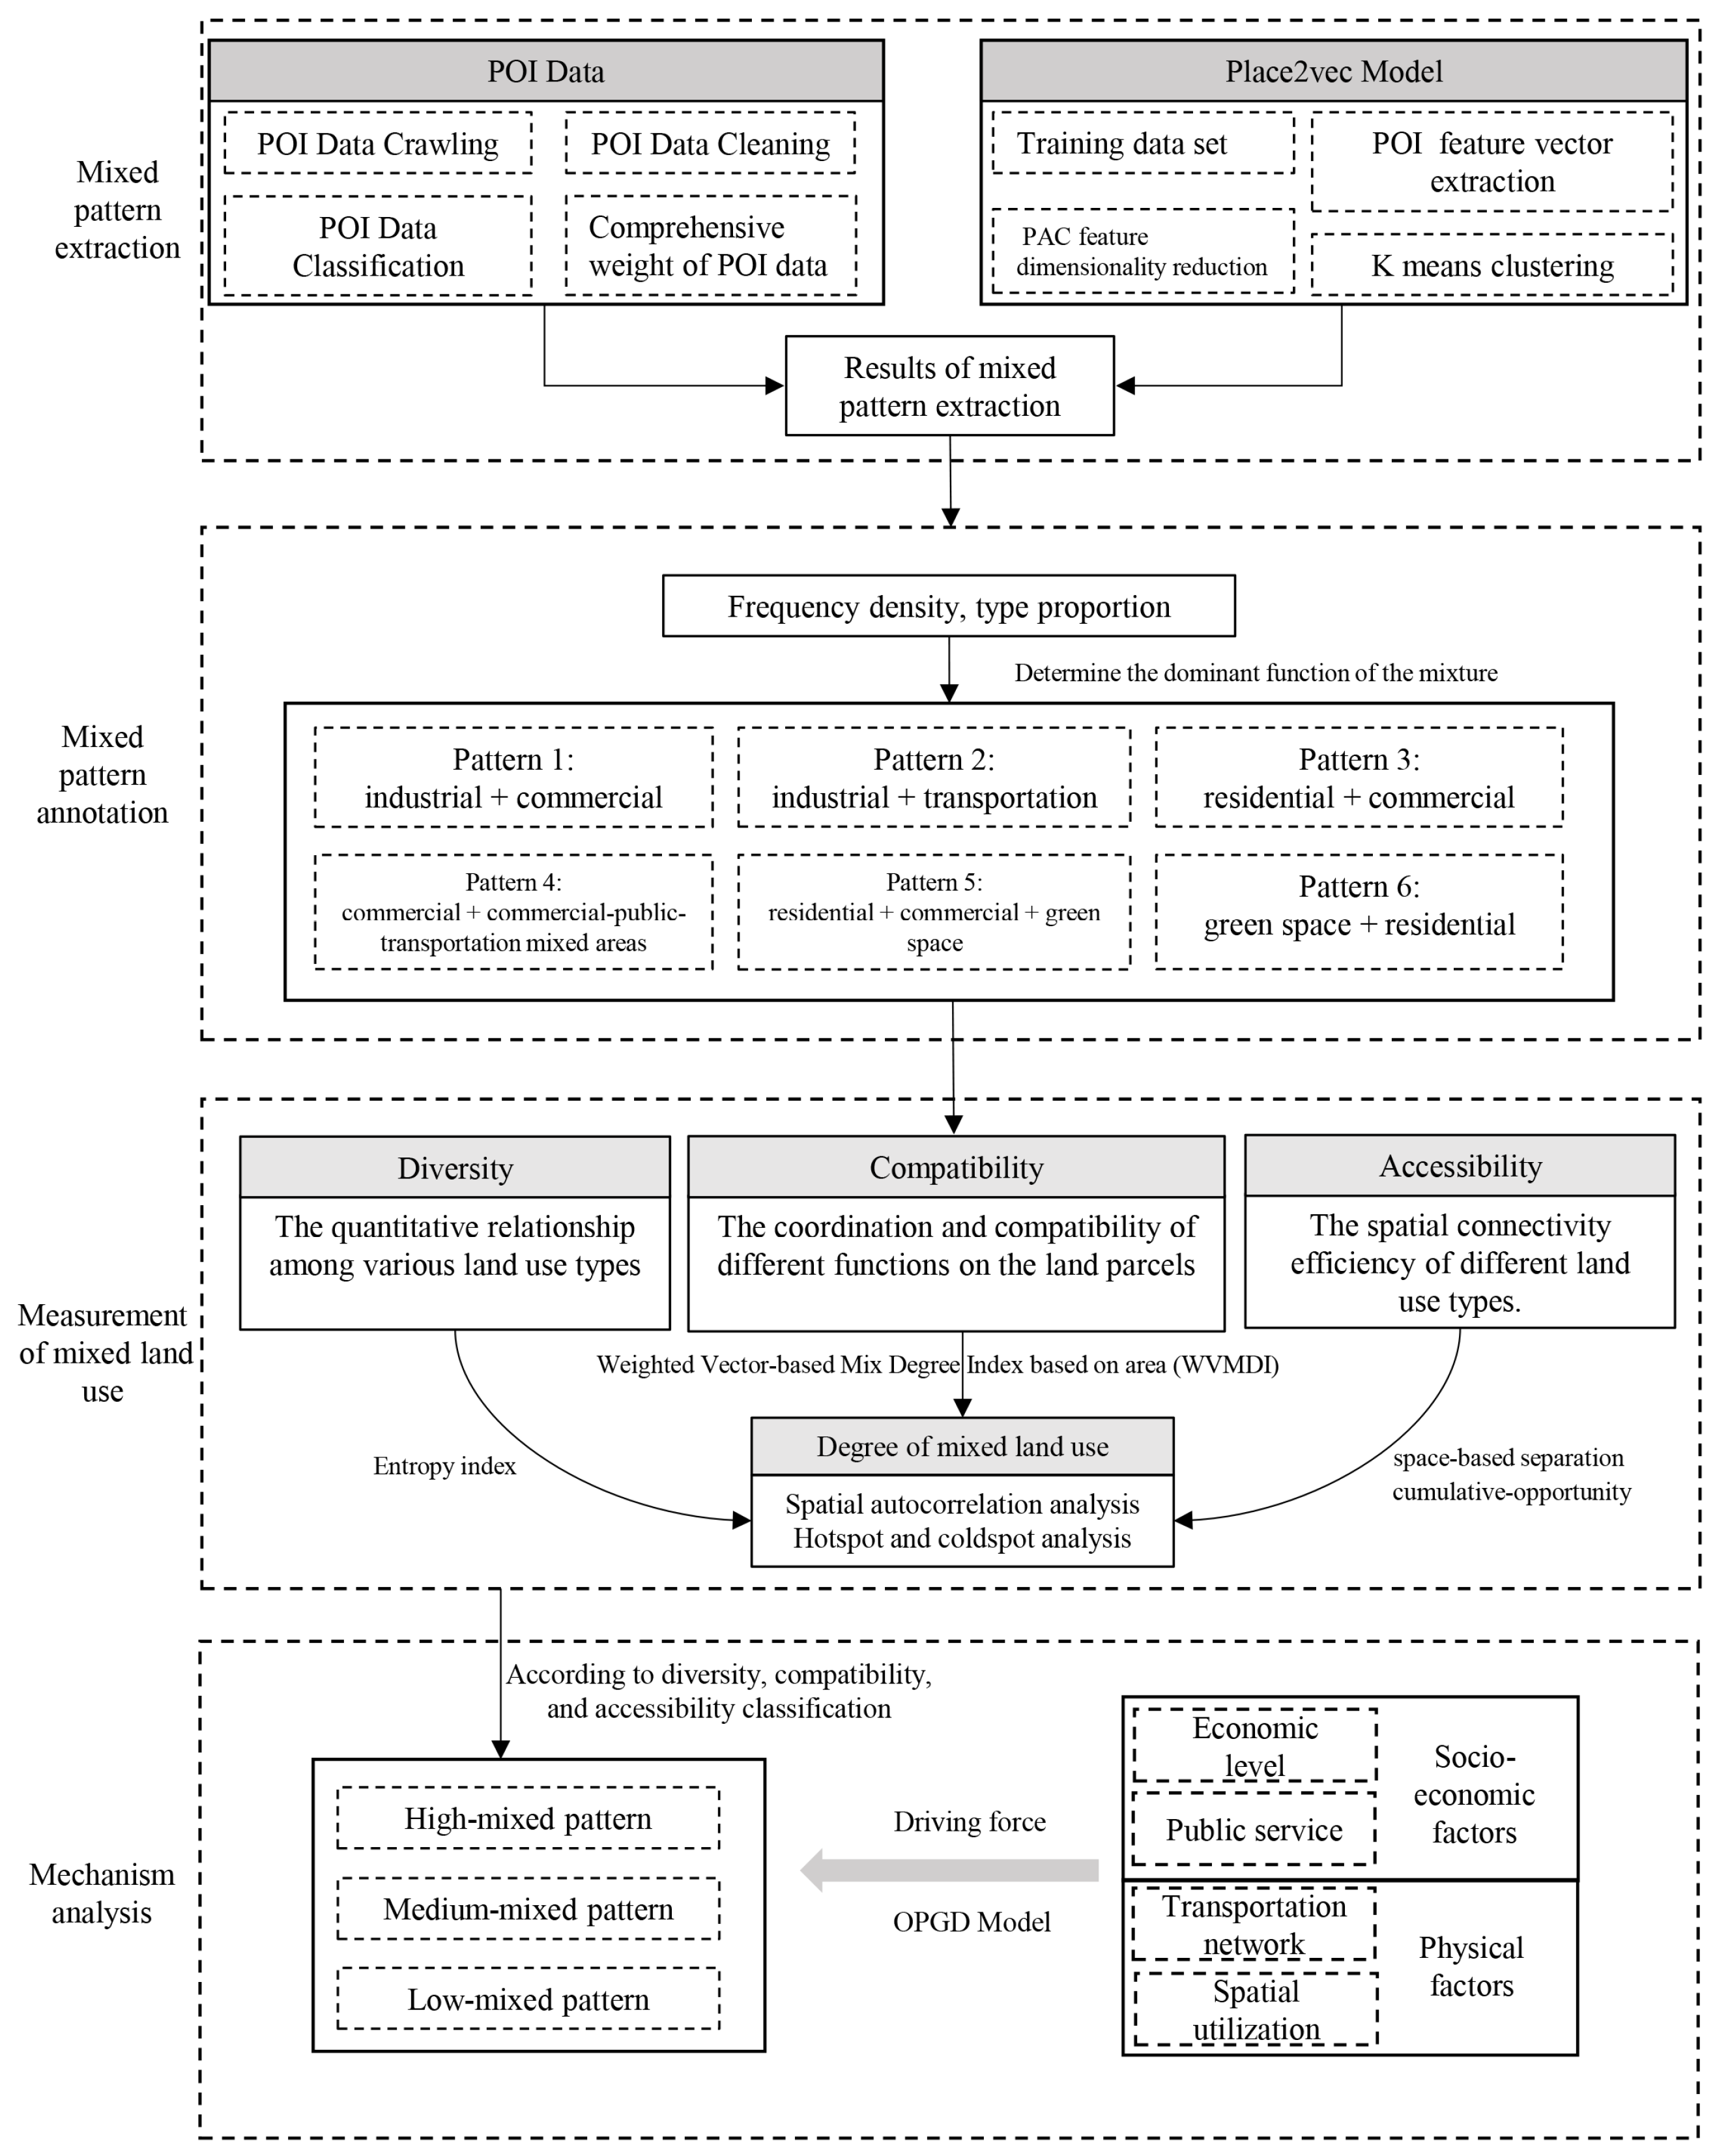
2.3.1. Research Approach

The research approach of this study is as follows: First, the Place2vec model is combined with POI data to extract urban mixed functional patterns. Then, based on the extracted mixed functional patterns, the degree of MLU under different patterns is quantified and measured by integrating the three dimensions of diversity, compatibility, and accessibility. Finally, an in-depth mechanism analysis is conducted on the spatial patterns of the degree of mixed land use under different patterns.

2.3.2. Research on Mixed Land-Use Functions Based on Place2vec

(1) Construction of the Training Dataset
In the field of natural language processing, a training dataset typically refers to a preprocessed collection of texts used for model training. In this study, the medium categories of POI types are used to construct the training dataset. The K-nearest neighbors (KNN) algorithm is employed to determine the neighboring points of each POI and record their types, forming training pairs.
d p , q = ( l a t p l a t q ) 2 + ( l o n p l o n q ) 2
p and q represent the p-th and q-th POIs, respectively; l a t p and l o n p denote the latitude and longitude of POIp, while l a t q and l o n q denote the latitude and longitude of POIq. q ( p , q ) represents the geographical distance between POIp and POIq.
(2) Acquisition of Feature Vectors for POI Types
After constructing the training dataset, this study uses the Skip-gram algorithm [54] in the Word2Vec model to map POI types into a low-dimensional vector space, thereby obtaining feature vectors for POI types. The objective is to learn the feature vector of each POI type through the contextual relationships of POI types.
m a x t = 1 T c j c , j 0 log p ( l t + j \ l t )
l t represents the type of the central POI, l t + j represents the type of the contextual POI, c denotes the size of the context window, and T is the total number of POI types in the training data.
After determining the central POI type, the probability of each contextual POI type is calculated using the Softmax function:
p l t + j \ l t = e x p ( v l t + j T v l t ) l = 1 L e x p ( v l T v l t )
v l t represents the vector representation of the central POI type, v l t + j represents the vector representation of the contextual POI type, and L is the total number of POI types.
(3) Feature Dimensionality Reduction Based on PCA
After obtaining the feature vectors of POI types, this study uses the covariance matrix in Principal Component Analysis (PCA) to reduce the dimensionality of the high-dimensional feature vectors, thereby reducing computational complexity and removing noise.
= 1 n 1 i = 1 n ( x i μ ) ( x i μ ) T
x i represents the feature vector of the I-th POI in the grid, μ represents the mean of all POI feature vectors in the grid, and n is the total number of POIs in the grid.
(4) Grid Clustering Based on K-means
After dimensionality reduction, this study uses K-Means Clustering [53] to divide the grids into different clusters, grouping grids with similar features.
(5) Mixed-Pattern Identification and Labeling
After completing grid clustering, it is necessary to identify and label the different clusters. This study determines the mixed patterns using the frequency density and type proportion formulas [63]. By calculating the frequency density and type proportion of POI types in the grids of different clusters, specific single-function zones and mixed-function zones are measured. The top two types with the highest proportion of grids in each cluster are used as the basis for labeling.
F i = n i N i   ( i = 1 ,   2 ,   ,   6 )
C i = F i i = 1 6 F i × 100 %   ( i = 1 ,   2 ,   ,   6 )
In the formula, Fi represents the frequency density of POIs of type i as a proportion of the total number of POIs of this type; ni represents the number of POIs of type i in the grid; Ni is the total number of POIs of type i; Ci represents the proportion of the frequency density of POIs of type i among the frequency densities of all types of POIs in the grid. The Ci value is used as the criterion for dividing functional zones. When the Ci value of a certain POI type in a grid is ≥50%, the grid is considered a single-function zone of that type. When the Ci values of all POI types in the grid are <50%, the grid is considered a mixed-function zone, and the mixed types are determined by the top three POI types with the highest Ci values in the grid.

2.3.3. Measurement of Mixed Land Use

There are currently too few quantitative studies on compatibility, and most research quantifies the degree of MLU based on diversity and accessibility. However, the patterns of MLU cannot be scientifically well represented by a single land diversity or accessibility indicator. Therefore, this paper combines the three dimensions of diversity, compatibility, and accessibility to construct a measurement method for the degree of MLU.
(1) Diversity: Using the entropy index [33] to measure the diversity of regional land functions. The following is the formula:
H = i = 1 n ( p i I n p i )
In the formula, H represents the land-use diversity, where a higher value indicates higher diversity; n is the total number of POI types, and Pi represents the proportion of POIs of type i within all types of POIs in the grid.
(2) Compatibility: This paper is based on the comprehensive weights corresponding to each type of POI in Table 2 and then obtains the area-weighted results for each land-use type, using the Weighted Vector-Based Mix Degree Index (WVMDI) to measure the compatibility of regional land functions [38]. The following is the formula:
W V M D I = 1 j n ( C i j A i / A j ) j n ( A i / A j )
In the formula, WVMDI represents land-use compatibility, where a higher value indicates higher compatibility. Cij denotes the compatibility value, with specific values for different land uses as shown in Table 3. Ai/Aj represents the ratio of weights between land use i and land use j.
(3) Accessibility: The accessibility of land-use functions in the study area is evaluated using the space-based separation model and the proximity method from the cumulative-opportunity model. The calculation steps are as follows:
1. Step 1: The space-based separation model [39] is used to calculate the relative accessibility of each grid. This involves summing the relative accessibility from each grid point to all service facility points within the grid:
A 1 i = 1 J j J i d i j
A1i represents the relative accessibility of the i-th grid, and i, j refer to the starting point and the end point, respectively. J refers to the set of all end points, and J-i denotes the set of all end points excluding the i-th point. The distance between the start point and the end point is denoted as dij. The smaller the distance (or the lower the barrier), the stronger the accessibility.
2. Step 2: The proximity distance accessibility in each grid is calculated using the proximity method from the cumulative-opportunity model [41]. This refers to the shortest proximity distance that each grid point needs to reach a service facility point.
A 2 i = d i j
Bi represents the proximity distance accessibility of the i-th grid. i and j refer to the starting point and the end point, respectively. dij represents the shortest proximity distance between the start point and the end point. The shorter the distance, the stronger the accessibility.
3. Step 3: The two accessibility indicators are combined to obtain a comprehensive accessibility value for the land functions in the region.
A 3 i = A 1 i + A 2 i 2  
(4) Degree of Mixed Land Use: Based on the previous analysis, the degree of the MLU measurement model in this paper is defined as the “land diversity mix + land compatibility mix + land accessibility mix”. The specific calculation steps are as follows: (1) Normalization of negative indicators: Accessibility is considered a negative indicator. In this paper, accessibility indicators are first normalized to positive values. (2) Standardization of indicators: To eliminate the influence of different units of measurement, the diversity values, compatibility values, and accessibility values are standardized. (3) Weighting of indicators: This paper considers these three indicators to be equally important for the degree of MLU. The average of these three indicators is used as the result for calculating the degree of MLU. The formula is as follows:
D = D 1 + D 2 + D 3 3
In the formula, D represents the degree of MLU, D1 represents land-use diversity, D2 represents land-use compatibility, and D3 represents land-use accessibility. The higher the value, the higher the degree of MLU.

2.3.4. Optimal Parameters-Based Geographical Detector Model (OPGD)

The geo-detector’s main purpose is to identify the variables that lead to geographical differentiation in the dependent variable so that their impact may be evaluated [65]. Traditional geo-detectors rely on human interaction to identify continuous variables, which frequently results in complications like the incorrect discretization of results. Intending to choose parameter combinations with the highest q-values for discretization, this study makes use of the GD package in R Studio (4.4.2) [66]. This method seeks to boost the outcome’s objectivity and accuracy. The GD package’s factor detection and interaction detection capabilities are used to figure out the key variables affecting Changsha’s built-up area’s mixed land use. The following is the calculation formula:
q = 1 h = 1 L N h σ h 2 N σ 2
In the formula, N represents the total number of samples, and N h represents the total number of samples in the h layer; σ h 2 and σ 2 denote the variance of the h layer and the entire region, respectively; L is the stratification of influencing factors. The q-value ranges from [0, 1], where higher values indicate a stronger factor influence, and lower values indicate a weaker influence.

3. Results

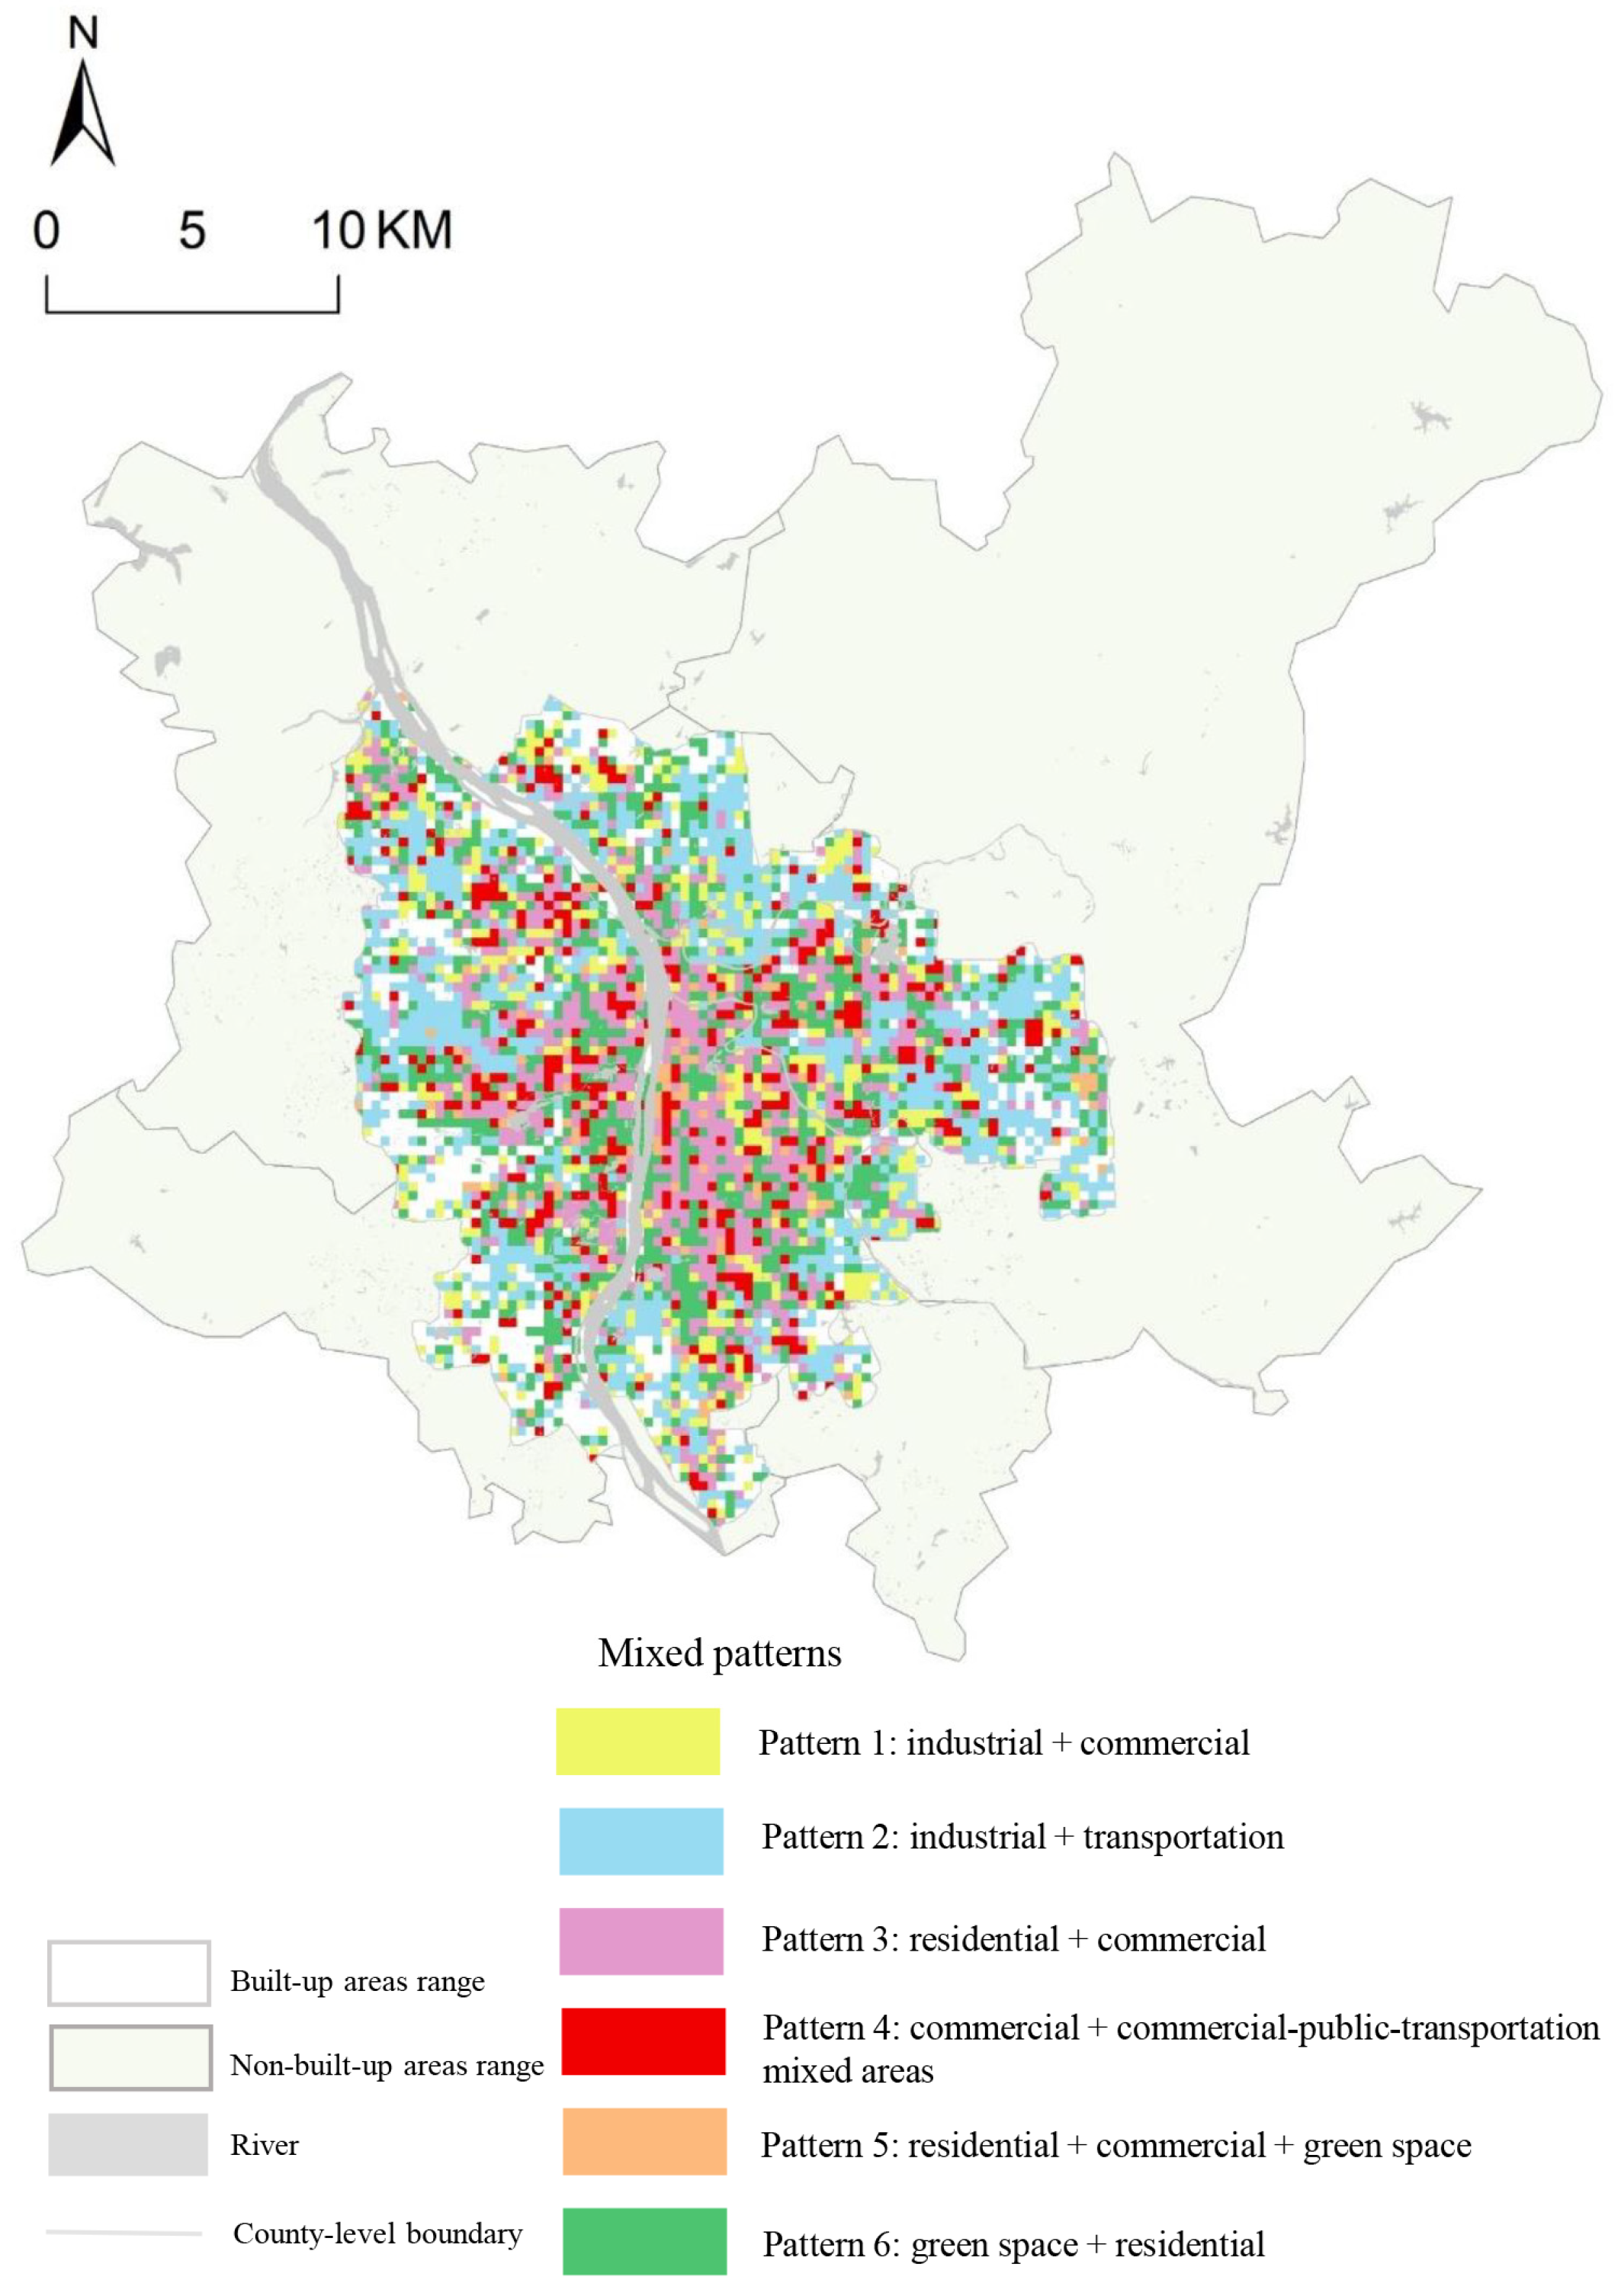
3.1. Mixed Land-Use Functional Pattern Extraction Results

By combining the Place2vec model with POI data, this study obtained the mixed land-use functional patterns in the built-up areas of Changsha, dividing the grids into six cluster regions, which represent six types of mixed patterns (Figure 3). Based on the calculation results of frequency density and type proportion for each grid, the six mixed patterns were labeled. Each cluster region encompasses diverse urban functional types, with the top two functional zones with the highest proportion in each cluster serving as the classification criteria (Table 4).
Pattern 1: industrial + commercial
This pattern has a moderate number of grids, totaling 514. Among them, industrial land grids and commercial land grids are the most numerous, with 96 and 95 grids, respectively, followed by green space land and residential land. In addition to industrial enterprise lands, such as Changzhou Industrial Park, Disaster Prevention Technology Industrial Center Park, and BYD Industrial Park, this pattern also includes large commercial service facilities such as Ceramic Building Materials and Sasseur Outlets. However, compared to pattern 2, the industrial enterprise lands in pattern 1 are smaller in scale and more sparsely distributed.
Pattern 2: industrial + transportation
This pattern has a large number of grids, totaling 1053. Compared to other patterns, the number of industrial land grids in this pattern far exceeds that of other patterns, reaching 855 grids. These grids are distributed with large factories, high-tech industrial parks, agricultural and fishery bases, and logistics and storage lands, such as Zoomlion Smart Industrial Park, Lugu Industrial Park, Gaoxing Logistics Park, Jinxia Economic Development Zone, and Shanhe Industrial City. Most of these are located in the peripheral areas of the city. Meanwhile, the number of transportation land grids ranks second, with 41 grids, covering areas such as highway entrances and toll stations, mainly distributed around industrial lands. This reflects the close integration of transportation and industrial development in Changsha, with high accessibility to industrial zones.
Pattern 3: residential + commercial
This pattern has 772 grids, with residential land grids and commercial land grids accounting for the highest proportions, with 51 and 40 grids, respectively. The number of grids dominated by residential land in residential–public–commercial mixed areas is 32, indicating that this pattern is primarily composed of residential land grids, including student dormitories, residential communities, and apartments. However, compared to pattern 6, the number of residential land grids in this pattern is relatively low. Commercial lands are mainly distributed in the eastern part of the Xiangjiang River, featuring commercial service facilities such as the Beichen Delta Commercial District. Overall, the grids of this pattern are evenly distributed throughout the built-up areas of Changsha.
Pattern 4: commercial + commercial–public–transportation mixed areas
This pattern has 444 grids, with commercial land grids being the most numerous, totaling 87, followed by commercial–public–transportation mixed area grids dominated by commercial land, totaling 25. In addition to large commercial centers such as Wangfujing Shopping Center, Wuyi Square Business District, and Furong Square Business District, this pattern also includes service facilities such as convenience stores and restaurants. This pattern also carries public management and service functions such as administrative offices, educational and research institutions, and cultural activities. For example, the Hexi University Town, general hospitals, and government agencies are located in this area.
Pattern 5: residential + commercial + green space
This pattern has the fewest grids, totaling only 140. Commercial land grids and residential land grids share the highest number, with 15 grids each, while green space land grids rank second, with 14 grids. In this pattern, residential areas, commercial facilities, and green space facilities are relatively balanced, mainly distributed in areas such as Chaozong Street and Shawan Park. These areas feature numerous residential communities, convenience stores, restaurants, entertainment facilities, green space squares, and small community parks, providing residents with convenient living services.
Pattern 6: green space + residential
This pattern has the largest number of grids, totaling 1020. The top two land types in terms of grid numbers are green space land and residential land, with 184 and 178 grids, respectively. Compared to other patterns, the number of grids for these two land types is significantly higher, covering many scenic spots and parks, such as Orange Isle Scenic Area, Yuelu Mountain Scenic Area, Xiangbiwo Forest Park, Yanghu Wetland Park, Songya Lake Wetland Park, Hunan Botanical Garden, and Houhu International Art Park. Moreover, the green space lands in this pattern are adjacent to residential lands, such as residential communities, housing estates, and villa areas, providing corresponding green space square facilities for residential areas.

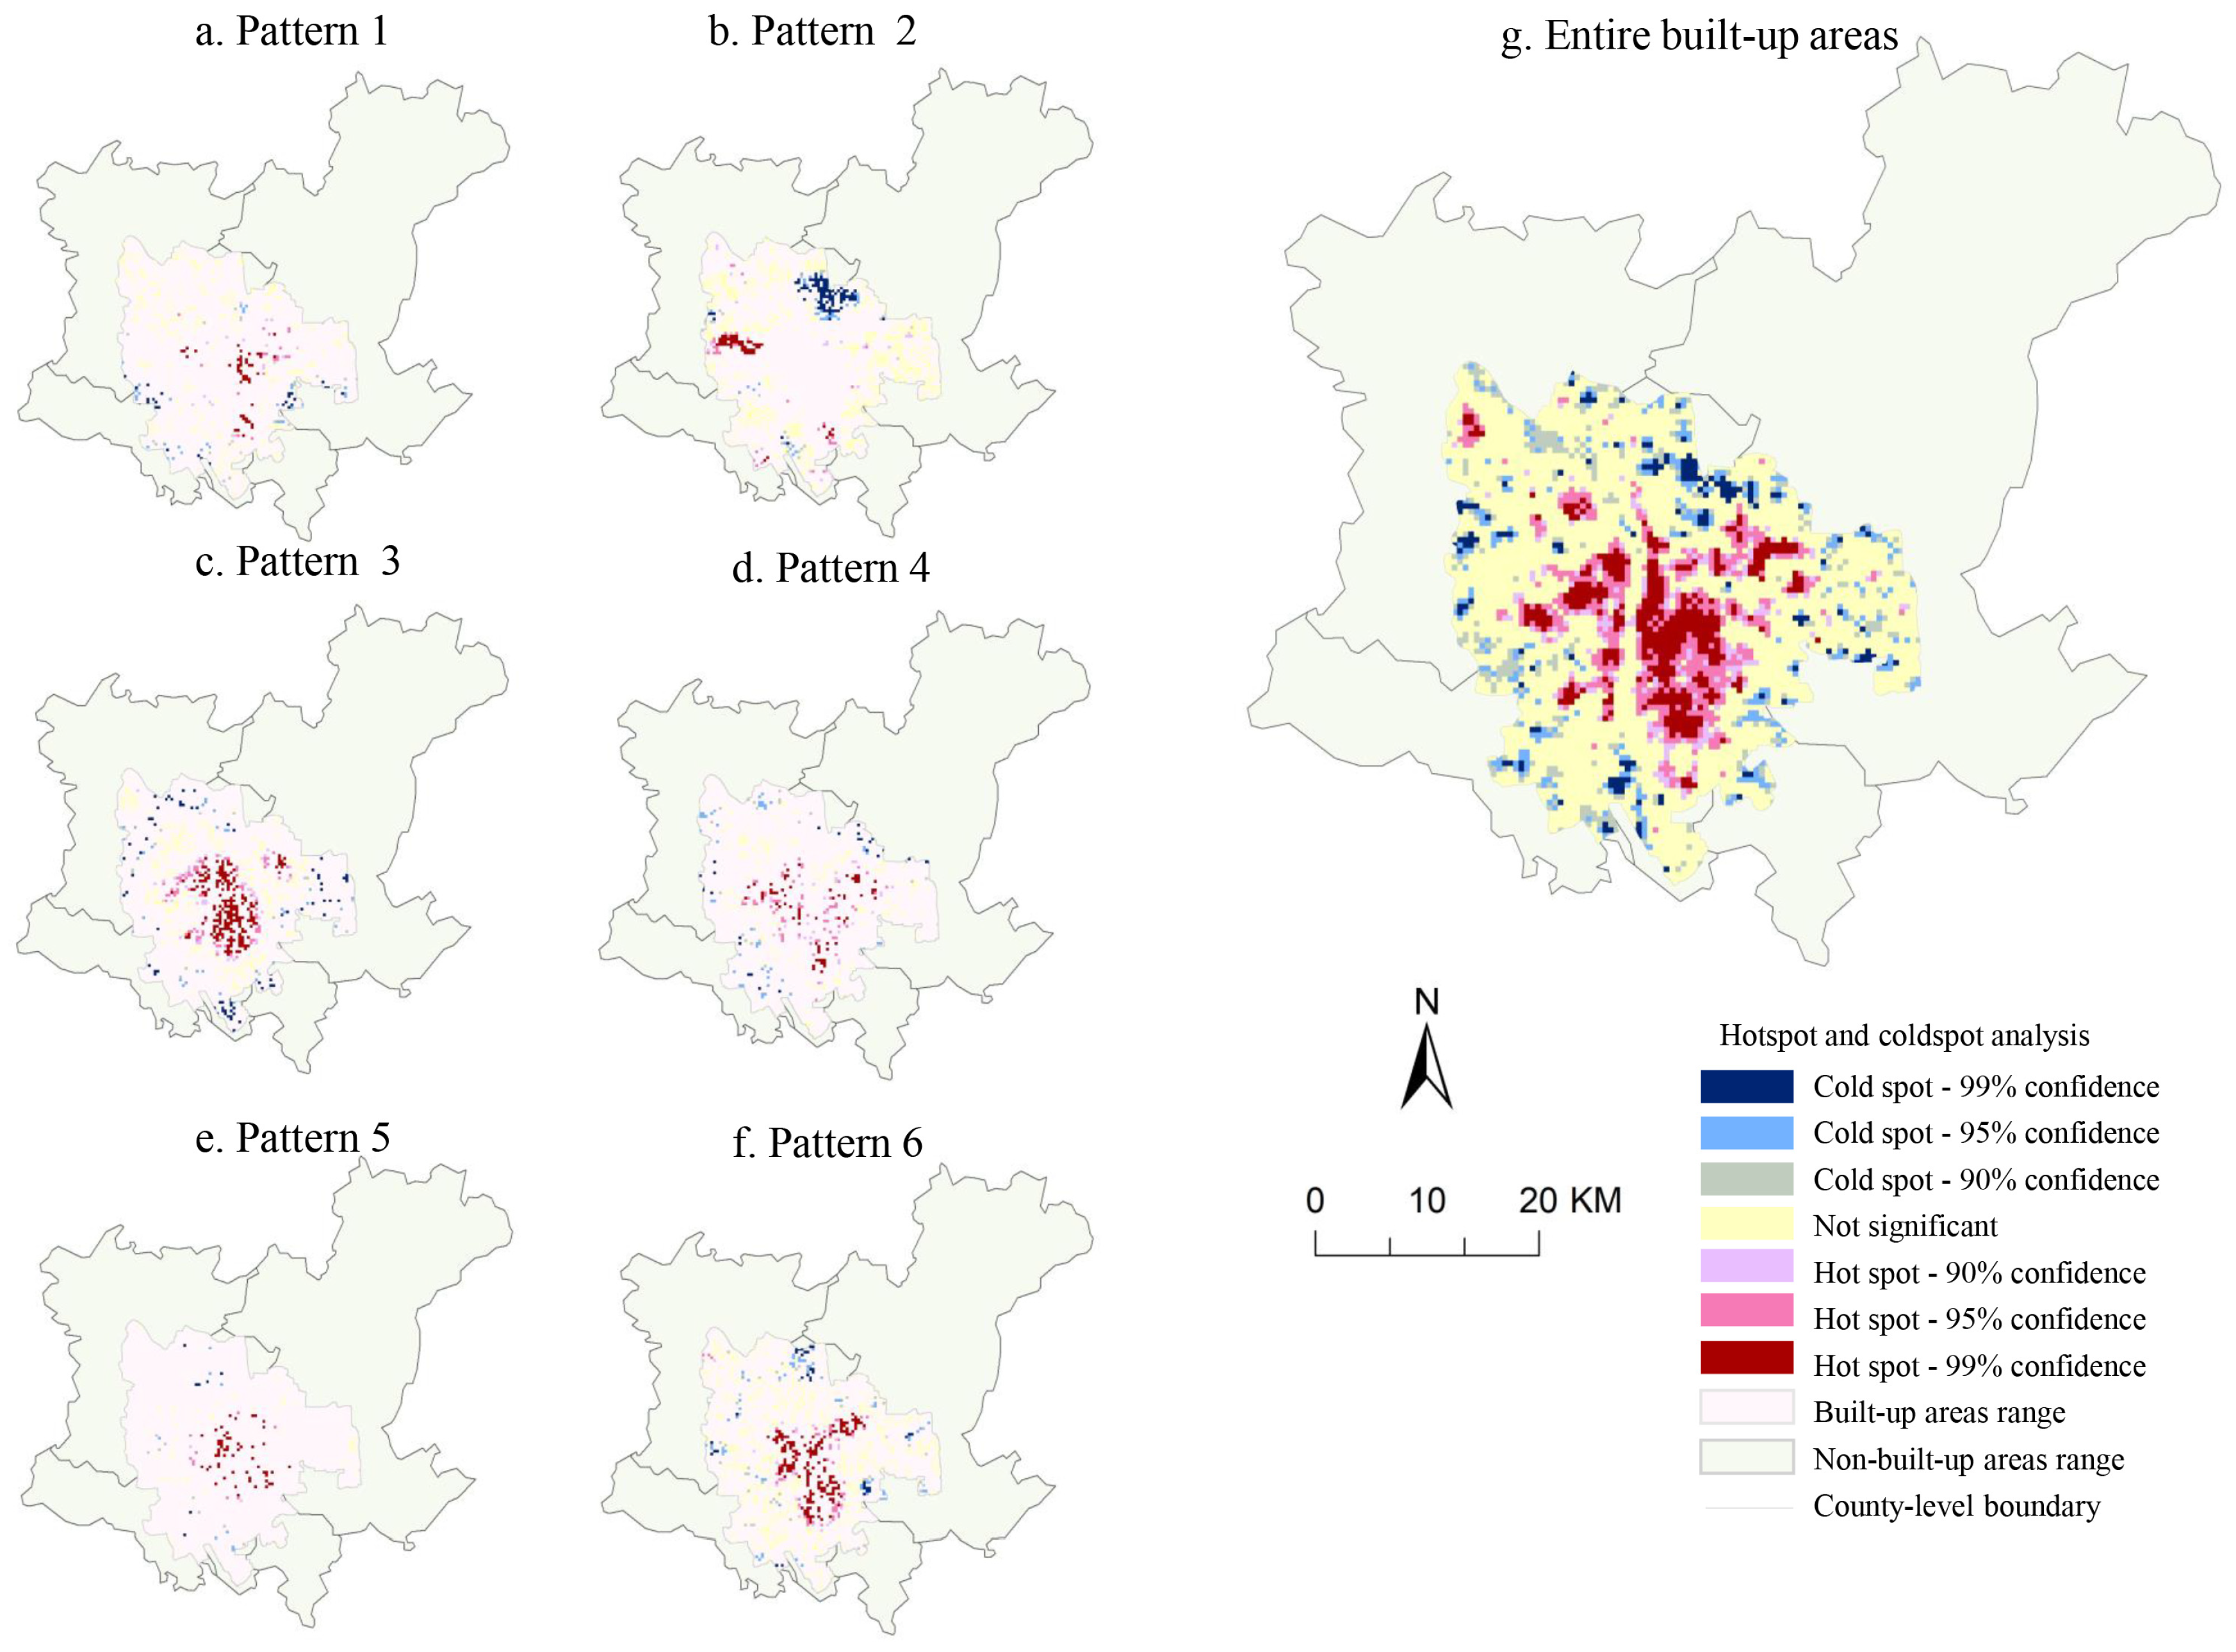
3.2. Mixed Land Use Measurement Results

3.2.1. Mixed Land-Use Diversity Measurement Results

From the perspective of diversity (Figure 4), pattern 3 (residential + commercial) and pattern 4 (commercial + commercial–public–transportation mixed areas) exhibit the highest land-use diversity levels, with average diversity values of 0.187 and 0.185, respectively. Pattern 5 (residential + commercial + green space) ranks second, while pattern 1 (industrial + commercial), pattern 6 (green space + residential), and pattern 2 (industrial + transportation) show lower levels of land-use diversity, with pattern 2 (industrial + transportation) having the lowest diversity, with an average value of 0.084. This is because the grids of pattern 3 (residential + commercial) and pattern 4 (commercial + commercial–public–transportation mixed areas) are primarily distributed along the riverbanks, which are the core urban areas. These grids are located at the junctions of Furong District, Tianxin District, Kaifu District, and Yuhua District, with major commercial hubs such as Wuyi Square, Huangxing Square, Furong Square, and Desiqin Square, as well as the Xingsha area in Changsha County. These regions are all commercial areas within the city, attracting a large amount of commercial and public service land use, which leads to higher diversity. In addition, these areas also have numerous technology industrial parks, and the land use is relatively balanced with complete supporting facilities for residential, green space, and square land, as well as public service facilities such as hospitals and schools, which contribute to their high diversity characteristics. The grids of pattern 5 (residential + commercial + green space), pattern 1 (industrial + commercial), and pattern 6 (green space + residential) are mostly distributed in the peripheral areas of the city core, mainly consisting of residential mixed areas, community parks, and large green spaces, with slightly lower diversity. The grids of pattern 2 (industrial + transportation) are mostly industrial and transportation land, covering large areas and dominated by large industrial parks, science and technology parks, and corporate enterprises, which are highly specialized and have a single land-use nature.

3.2.2. Mixed Land-Use Compatibility Measurement Results

The land-use compatibility in the built-up areas of Changsha is relatively high (Figure 4), with a mean compatibility value of 0.288 across the region. Pattern 4 (commercial + commercial–public–transportation mixed areas) and pattern 5 (residential + commercial + green space) exhibit a high level of compatibility, with average compatibility values of 0.302 and 0.299, respectively. Pattern 3 (residential + commercial) follows, with an average compatibility value of 0.296. This is because the grid regions of these three patterns are predominantly composed of functional types with high positive externalities, such as commercial and service facilities, residential areas, public service facilities, and green spaces, which generate little environmental pollution. Pattern 6 (green space + residential) and pattern 1 (industrial + commercial) have moderate levels of compatibility. Although these two patterns include some large scenic spots and park green spaces with high positive externalities, they also cover a few industrial parks and commercial and service facilities, which exhibit some internal functional conflicts. Pattern 2 (industrial + transportation) has the lowest level of compatibility, with a mean compatibility value of only 0.236. This pattern includes many companies, industrial parks, and enterprises, primarily industrial by nature, including aluminum and cement product industries, which conflict with the surrounding residential and green spaces, resulting in low compatibility.

3.2.3. Mixed Land-Use Accessibility Measurement Results

Pattern 3 (residential + commercial), pattern 4 (commercial + commercial-public-transportation mixed areas), and pattern 5 (residential + commercial + green space) demonstrate superior accessibility, with average accessibility values of 0.204, 0.201, and 0.195, respectively (Figure 4). These three patterns are predominantly distributed in the urban cores and around commercial centers, where the balanced and extensive distribution of functional facilities reduces commute distances and time costs, thereby enhancing regional accessibility. In contrast, pattern 1 (industrial + commercial) exhibits moderate accessibility, with an average accessibility value of 0.189. This pattern includes a small amount of industrial land, and the dispersed layout of industrial areas may limit the reach of commercial services, reducing their service efficiency and consequently affecting accessibility. The poorest accessibility is observed in pattern 6 (green space + residential) and pattern 2 (industrial + transportation), with average accessibility values of 0.182 and 0.179, respectively. This may be attributed to the fact that green spaces and residential areas are primarily single-function oriented, while the exclusivity of functions in industrial parks and zones reduces the appeal of the surrounding areas to service facilities. As a result, the spatial agglomeration effect of various facilities is insufficient. Furthermore, these two patterns are mainly located on the outskirts of the city, where service functions are sparse and spatially dispersed. This limits the connectivity of facilities and the coverage of services, ultimately impacting overall accessibility.

3.2.4. Comprehensive Mixed Land-Use Measurement Results

Spatial autocorrelation analysis and cold–hot spot analysis were conducted on the MLU across the entire built-up areas of Changsha and under six specific patterns (Figure 5). The results indicate that the MLU exhibits significant positive spatial autocorrelation, demonstrating spatial clustering characteristics. From a holistic spatial pattern perspective, the cold and hot spots of the degree of MLU exhibit a pronounced center–periphery structure. Specifically, hot spots form high-value clusters along the Xiang River in the urban core areas, while cold spots display fragmented and dispersed spatial characteristics in the urban periphery. Specifically, in pattern 1 (industrial + commercial), hot-spot clusters are mainly located near Martyrs’ Park and the Gaoqiao Market area, with cold-spot clusters concentrated in the Huangxing Town area. In pattern 2 (industrial + transportation), hot-spot clusters are distributed in the Lugu area, Sany Heavy Industry Industrial Park, and Zhanggongling, while cold-spot clusters are found in the vicinity of Wujialing and the surroundings of the Sizhou Ancient Temple. Pattern 3 (residential + commercial) forms multiple hot-spot clusters, primarily around the Changsha County Government, Beichen Delta, Sanxiang community, and Shazitang neighborhood, with cold-spot clusters mainly in the Nantuo subdistrict. Pattern 4 (commercial + commercial–public–transportation mixed areas) exhibited distinct clustering characteristics, with hot spots concentrated near the Wanjiali Plaza, the Xingsha Cultural Park, and the Red Star International Convention Center, while cold spots aggregated in the Taohua Village and the Hanpu District. Pattern 5 (residential + commercial + green space) features hot-spot clusters mainly in the Chaozong Street area and Shawan Park, and the cold-spot clusters are primarily concentrated near Huanghua Airport. Pattern 6 (green space + residential) has a higher number of hot-spot clusters, distributed around the Yuelu District Government, the Jiufeng District, and the Railway Campus, while cold-spot areas are scattered in the outer urban regions. It can be concluded that hot-spot areas of MLU generally coincide with urban commercial, residential, and public service facilities, whereas cold-spot areas are often located at the urban fringe or in functionally homogeneous zones, reflecting that high-density development in the core area facilitates a positive feedback effect on the functional mixture, whereas low-density sprawl in the periphery induces a spatial lock-in effect of functional homogenization.

4. Analysis of Influencing Factors

4.1. Theoretical Analysis and Indicator Selection of Influencing Factors

MLU refers to the coexistence of lands with different properties and functions within a certain spatial scope, which is influenced by multiple factors. The degree of MLU in regions under different mixed patterns exhibits distinct characteristics, and whether the level of mix is affected by specific factors is a question worth exploring. Based on the mean values of diversity, compatibility, and accessibility across the six pattern types, this study categorizes pattern 3 (residential + commercial), pattern 4 (commercial + commercial–public–transportation mixed areas), and pattern 5 (residential + commercial + green space) as high-mix patterns; pattern 1 (industrial + commercial) and pattern 6 (green space + residential) as medium-mix patterns; pattern 2 (industrial + transportation) as a low-mix pattern. The factor analysis and interaction analysis tools of the geographical detector are employed to explore the formation mechanisms of MLU under different mixed patterns.
Drawing on existing research and considering data availability, an indicator system consisting of 11 factors is constructed from four dimensions, economic level, transportation network, public services, and spatial utilization, to analyze the influencing factors of MLU in the built-up areas of Changsha (Table 5). The socioeconomic factors constitute a fundamental dimension in land-use change studies, offering critical insights into urban spatial structure dynamics. Housing prices and demographic characteristics serve as key indicators of economic performance, directly shaping mixed land-use patterns [67]. Extensive transport networks enhance accessibility [68], attracting population agglomeration and fostering multifunctional clustering. The integration of public services with street connectivity creates pedestrian-friendly environments that amplify neighborhood vitality. Spatial utilization achieves a balance between mixed-use potential and ecological constraints through the coordinated regulation of building density, floor area ratio, and green space allocation. As the foundation of urban development, the economy influences urban land use in multiple ways [44]. For instance, land use changes with economic growth, and land-use efficiency directly affects economic development. Transportation networks impact the formation of urban dense areas and the spatial patterns of land use [35], serving as a key element in shaping urban land-use patterns and spatial forms. For example, the effects of rail transit stations on land development vary across different urban areas, indicating an interactive relationship between transportation and land use [45,46]. Improvements in transportation also exhibit spatial spillover effects on urban land-use efficiency. The accessibility of public services attracts population and business agglomeration, thereby enhancing land value [47], which in turn influences land-use patterns. The high-quality utilization of urban space aims to achieve maximum comprehensive benefits with minimal input. Cities worldwide are increasingly exploring the vertical allocation of public demand floor area to address the challenge of land scarcity [48]. Therefore, the limited availability of urban land resources necessitates efficient spatial utilization, and the planning and construction of urban land play crucial roles in the development of MLU.

4.2. Single-Factor Detection Analysis

The MLU in the built-up areas of Changsha is influenced by multiple factors, and the explanatory power of different driving factors on the differentiation of MLU varies significantly. According to the single-factor detection results (Table 6), pattern 3 (residential + commercial), pattern 4 (commercial + commercial–public–transportation mixed areas), and pattern 5 (residential + commercial + green space) are primarily influenced by the closest distance to a bus station (X6), the floor area ratio (X10), the building density (X9), and the average housing price (X1). These three mixed patterns are mainly distributed in the core urban areas and commercial centers, where spatial resources are limited, and both building height and density are relatively high. Accommodating more built space on the land promotes the formation of mixed-use vertical spatial forms with diverse business types and differentiated functions. Public transportation stations attract population and service facilities, facilitating the development of high-density, mixed-use spatial structures in their vicinity. At the same time, the convenience of public transportation reduces residents’ reliance on private vehicles and increases the likelihood of walking and cycling, contributing to a more vibrant and diverse community environment. These three mixed patterns are primarily located in economically advanced areas such as Yuhua District and Tianxin District, where housing prices are also relatively high, resulting in a higher degree of MLU. This indicates that in areas with high housing prices, land resources are relatively scarce, and to maximize land value and improve land productivity, land use tends to become more mixed. Pattern 1 (industrial + commercial) and pattern 6 (green space + residential) are mainly influenced by the floor area ratio (X10) and building density (X9). In areas where industrial, commercial, and residential functions are mixed, a higher building density and plot ratio means a greater concentration of buildings, supporting the efficient operation of industrial production, commercial activities, and residential needs, thereby attracting more enterprises and commercial services. Pattern 2 (industrial + transportation) is primarily affected by the green space ratio (X11), accessibility to public services (X7), and the closest distance to a bus station (X6). In areas with a high concentration of industrial and transportation land uses, the distribution of bus stations directly affects the efficiency of worker commutes and logistics transportation. The synergy between industrial production and transportation facilities can enhance the diversity and convenience of regional functions. The availability of public service facilities directly impacts the quality of life of workers and the attractiveness of the area. Higher accessibility to public service facilities can attract more population agglomeration, increasing the regional mix. In areas with dense industrial and transportation facilities, a higher green space ratio can provide a better ecological environment, mitigate the environmental impact of industrial activities, improve the sustainability of land use, and promote land-use mixing.

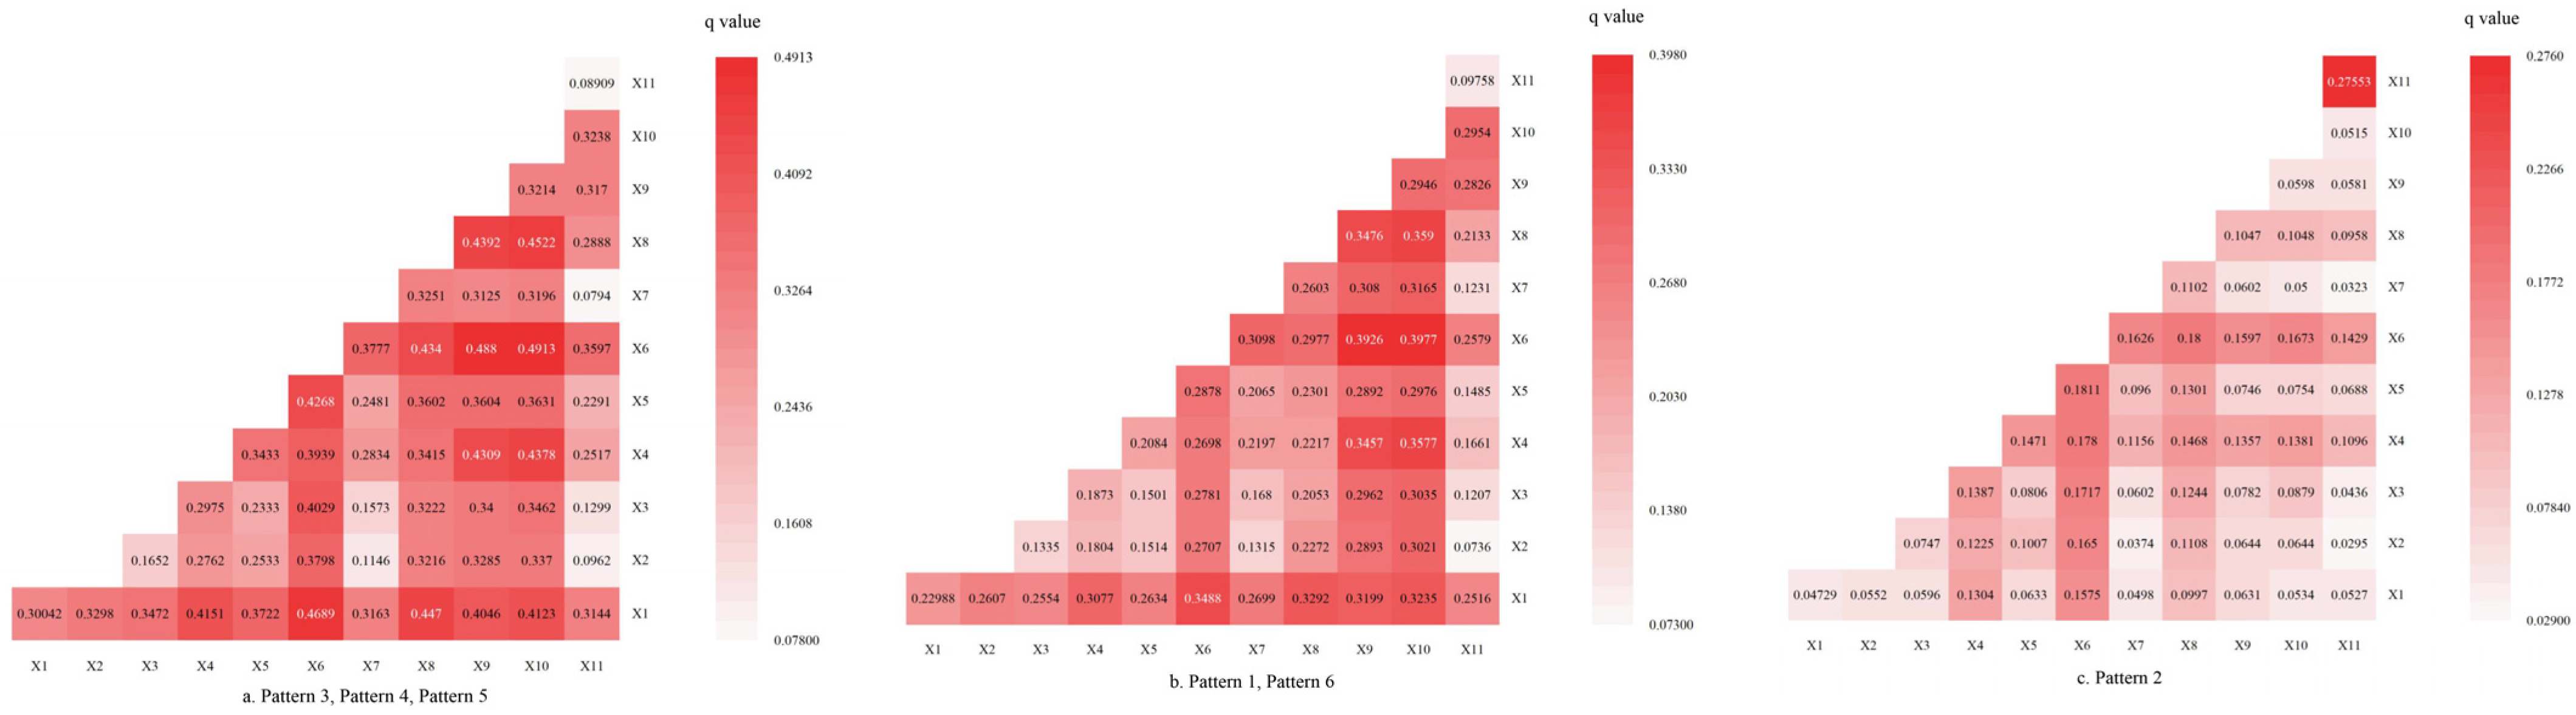
4.3. Interaction Detection Analysis

According to the interaction detection results of the geo-detector (Figure 6), the MLU in the built-up areas of Changsha is influenced by the interactions of multiple factors. Overall, the q-values of most factor interactions have increased. Among them, the strongest interacting factor combination for pattern 3 (residential + commercial), pattern 4 (commercial + commercial–public–transportation mixed areas), and pattern 5 (residential + commercial + green space) is the closest distance to a bus station (X6) and the floor area ratio (X10), with a post-interaction q-value of 0.491. Another strong interacting factor combination is the closest distance to a bus station (X6) and the building density (X9), with a q-value of 0.488. For pattern 1 (industrial + commercial) and pattern 6 (green space + residential), the strongest interacting factor combination is the closest distance to a bus station (X6) and the floor area ratio (X10), with a post-interaction q-value of 0.398, and another strong interacting factor combination is also the closest distance to a bus station (X6) and building density (X9), with a q-value of 0.393. For pattern 2 (industrial + transportation), the strongest interacting factor combination is the closest distance to a bus station (X6) and the closest distance to a metro station (X5), with a q-value of 0.181. This indicates that spatial utilization and transportation network development are the main factors influencing MLU in the built-up areas of Changsha.
In urban planning, the purpose of setting up public transportation stations is to accommodate a relatively large passenger flow and attract population agglomeration. This requires the surrounding buildings of public transportation stations to achieve intensive and efficient spatial utilization, with higher allowable plot ratios and building densities promoting the mixed development of different land uses and various business formats. This suggests that MLU in the built-up areas of Changsha is more influenced by urban transportation and the spatial arrangements of buildings. Therefore, the further optimization of urban transportation network construction and the spatial layouts of buildings is necessary to promote the efficient utilization of land resources and sustainable urban development.

5. Discussions

This study extracted MLU patterns in the built-up areas of Changsha by combining the Place2vec model with POI data and quantified mixed land-use under different patterns based on the dimensions of diversity, compatibility, and accessibility. Compared to traditional POI density analysis methods, the Place2vec model better captures the spatial interaction characteristics between POIs [54], thereby more accurately identifying mixed patterns in urban functional areas and facilitating the exploration of differences in MLU under different mixed patterns. This study found that areas with mixed residential, commercial, and public service functions are more likely to form high levels of diversity, compatibility, and accessibility, which has practical implications for urban planning and management, improving land-use efficiency, and promoting sustainable urban development. Additionally, the previous measurements of MLU have primarily focused on a single dimension, such as diversity or accessibility [33,69,70]. However, the land-use diversity does not account for the functional complementarity of various land-use types; rather, it merely takes into account the numerical composition of land-use types. Although a singular accessibility indicator can assess the spatial convenience, it fails to discern the synergistic effects of land-use combinations. Land-use compatibility can reflect the interrelationship between two parcels [38], and adjacent parcels can produce both positive and negative externalities, with the latter resulting in the pollution of the environment, the deterioration of the quality of the living environment, and land availability being restricted [37]. Thus, in addition to the diversity and walkability of urban land use, more attention should be paid to the characteristics and connections of various land types to prevent the adverse effects brought on by incompatibility. In recent years, scholars have increasingly focused on the integrated consideration of diversity, compatibility, and accessibility in the measurement of MLU [45,71]. Building upon existing research, this study introduces Place2vec to identify different mixed-use patterns, measuring the differentiated characteristics of multidimensional dimensions under each pattern from a comprehensive perspective. We aim to contribute to the ongoing discussion on analyzing spatially heterogeneous urban mixed land-use characteristics. This study found that MLU in the built-up areas of Changsha exhibits significant spatial clustering characteristics, with higher mix levels in the urban core areas and lower levels in the peripheral areas, which aligns with the findings of Li [72]. Therefore, integrating the three indicators—compatibility, diversity, and accessibility—offers a more comprehensive understanding of the issues associated with Changsha’s land-use patterns and allows for an improved assessment of the degree of MLU. This method provides more accurate and scientific assistance for decision-making in land management and urban planning. Many researchers have investigated the elements that impact the degree of MLU from both a natural and socioeconomic standpoint [36,73]. Most studies, however, simply focus on how each contributing factor affects MLU separately, ignoring the consequences of how these elements interact. This study explored the formation mechanisms of MLU under different mixed patterns and investigated the interactions between factors to more accurately reflect the actual interactions between various factors, providing a new perspective for understanding the complexity of MLU. According to this study, MLU under different mixed patterns is influenced by different driving factors, but overall, the connectivity of transportation networks and spatial utilization efficiency have significant impacts on MLU across different patterns.
To summarize, in the framework of stock renewal, implementing mixed land-use development techniques eases the severe restrictions on urban land resources. It expands the multifaceted potential of land development by promoting the shift in urban land use toward functional variety and spatial multiplicity. This strategy is more in line with the evolving needs of urban development in the context of economic change. However, the study found that pattern 3 (residential + commercial), pattern 4 (commercial + commercial–public–transportation mixed areas), and pattern 5 (residential + commercial + green space) are mainly distributed around the urban core areas and commercial centers, with higher levels of MLU. In such cases, attention should be paid to optimizing the use of vertical space, encouraging mixed-use designs in high-rise buildings, such as commercial services on the ground floor, office spaces on the middle floors, and residential units on the upper floors. Implementing TOD strategies and small-block land-use patterns around public transportation stations can enhance walkability and livability, promoting the mixed-use development of commercial, residential, and public service facilities. For pattern 1 (industrial + commercial), it is recommended to promote functional upgrades in industrial zones and adjust the layout of factories and enterprises, relocating industries that conflict with commercial and green space functions to optimize urban space and alleviate land-use conflicts. Pattern 2 (industrial + transportation) is mainly concentrated in the urban periphery, with a large number of industrial enterprises and industrial parks, including cement and building materials industries, which have significant impacts on the surrounding environmental quality. The interaction between different land types can easily lead to environmental pollution and other negative externalities, resulting in lower levels of mixed land use. Therefore, it is essential to reconfigure functional elements to optimize land use and promote green industrial zones to mitigate industrial environmental impacts. Pattern 6 (green space + residential) features large green spaces, parks, and squares. Optimizing the public transportation network and increasing the coverage of bus and subway stations can improve residents’ mobility and green space accessibility. We should promote the development of 15 min living circles, introduce public service functions such as commercial services, education, and healthcare, enhance land-use efficiency, and increase community attractiveness.
This study extracted MLU patterns in the built-up areas of Changsha by combining the Place2vec model with POI data, constructed a measurement method integrating diversity, compatibility, and accessibility, quantified the degree of MLU under different patterns, and used the OPGD model to explore the influencing mechanisms of MLU formation under different patterns. However, due to the mixed functional layout of buildings in the vertical dimension within cities, it is difficult to quantify. The results of the measurements using POI data in the article are primarily based on horizontal dimensions, lacking research on vertical dimensions. Future research into the vertical dimension of MLU and thorough measurements in both planar and three-dimensional features should be bolstered.

6. Conclusions

Taking the built-up areas of Changsha as the research object, this study extracted mixed patterns based on the Place2vec model and POI data, constructed a method combining diversity, compatibility, and accessibility to measure MLU, and analyzed the spatial characteristics and influencing mechanisms of MLU under different mixed patterns.
The conclusions are as follows: (1) Based on the Place2vec model and POI data, the built-up areas of Changsha was classified into six mixed patterns: pattern 1 (industrial + commercial), pattern 2 (industrial + transportation), pattern 3 (residential + commercial), pattern 4 (commercial + commercial–public–transportation mixed areas), pattern 5 (residential + commercial + green space), and pattern 6 (green space + residential). Each cluster area encompasses diverse urban land-use types, reflecting the land-use characteristics and development patterns of different regions in the built-up areas of Changsha. (2) Pattern 3 (residential + commercial) and pattern 4 (commercial + commercial–public–transportation mixed areas) exhibit balanced and extensive distributions of functional facilities, demonstrating high diversity and accessibility. Pattern 4 (commercial + commercial–public–transportation mixed areas) and pattern 5 (residential + commercial + green space) exhibit high positive externalities in their functional land use, with greater compatibility. Pattern 2 (industrial + transportation), dominated by single-use industrial land, generates functional conflicts with adjacent areas, suppressing the spatial agglomeration of supporting facilities and resulting in low diversity, compatibility, and accessibility. The comprehensive degree of MLU displays spatial clustering, with hot spots predominantly concentrated in urban core zones, while cold spots are largely distributed in mono-functional peripheral areas. (3) The OPGD model results indicate that MLU under different mixed patterns is influenced by different driving factors. In terms of single factors, pattern 1 (industrial + commercial), pattern 3 (residential + commercial), pattern 4 (commercial + commercial–public–transportation mixed areas), pattern 5 (residential + commercial + green space), and pattern 6 (green space + residential) are mainly influenced by the floor area ratio (X10), building density (X9), the closest distance to a bus station (X6), and the average housing price (X1), while pattern 2 (industrial + transportation) is primarily affected by the green space ratio (X11) and the accessibility to public services (X7). In terms of interaction effects, for pattern 3 (residential + commercial), pattern 4 (commercial + commercial–public–transportation mixed areas), pattern 5 (residential + commercial + green space), pattern 1 (industrial + commercial), and pattern 6 (green space + residential), the closest distance to a bus station (X6) and the floor area ratio (X10) have the most significant impacts on their spatial layout of MLU. The interaction between the closest distance to a bus station (X6) and the closest distance to a metro station (X5) is the key factor combination affecting the spatial layout of MLU in pattern 2 (industrial + transportation).
Based on the aforementioned conclusions, the following policy recommendations are proposed: (1) Enhance the flexibility of regional MLU management. Allow for the adjustment of land parcel functions within controllable limits, moderately relax the rigidity of functional regulations in zoning plans, and consciously reduce the difficulty of the MLU approval process. This approach would guide urban functional renewal and expansion, achieving high-quality land integration. (2) Implement differentiated MLU control strategies. Research indicates that MLU phenomena in different areas of Changsha exhibit distinct influencing mechanisms. Therefore, investigations should be conducted based on varying regional economic levels, ecological constraints, urban functional positioning, and other factors. Differentiated regulatory policies should then be developed, such as mixed-function ratios, plot ratio adjustments, and negative lists, tailored to each specific area’s conditions. (3) Establish an MLU Efficiency Evaluation and Optimization Mechanism. This study reveals significant spatial heterogeneity in the degree of MLU across Changsha. It is necessary to implement mix-intensity limits in core commercial zones to maintain spatial quality, while initiating mix-enhancement programs in urban expansion areas to promote job–housing balance and functionally integrated communities.

Author Contributions

Conceptualization, M.H. and J.H.; Data Acquisition, M.H.; Methodology, M.H. and W.Z.; Formal Analysis, Q.C. and W.Z.; Validation, Q.C.; Writing—Original Draft, M.H.; Writing—Review and Editing, J.H., M.H., W.Z. and Q.C. All authors have read and agreed to the published version of the manuscript.

Funding

This research was funded by the National Natural Science Foundation of China (Grant No. 52008167). This research was funded by the Key Teaching Reform Research Project of Regular Higher Education Institutions in Hunan Province (Grant No. 202401000525).

Data Availability Statement

The data that support the findings of this study are available from the corresponding author upon reasonable request.

Conflicts of Interest

The authors declare no conflicts of interest.

References

  1. Deng, P.; Huang, Q.; Liu, F.; Wang, Z.; Liu, M. The research on identification and spatial pattern of urban mixed land-use: A case study of Chengdu. Ecol. Indic. 2023, 154, 110891. [Google Scholar] [CrossRef]
  2. He, J.; Li, X.; Liu, P.; Wu, X.; Zhang, J.; Zhang, D.; Liu, X.; Yao, Y. Accurate Estimation of the Proportion of Mixed Land Use at the Street-Block Level by Integrating High Spatial Resolution Images and Geospatial Big Data. IEEE Trans. Geosci. Remote Sens. 2021, 59, 6357–6370. [Google Scholar] [CrossRef]
  3. Nabil, N.A.; Abd Eldayem, G.E. Influence of mixed land-use on realizing the social capital. HBRC J. 2015, 11, 285–298. [Google Scholar] [CrossRef]
  4. Im, H.N.; Choi, C.G. Measuring pedestrian volume by land use mix: Presenting a new entropy-based index by weighting walking generation units. Environ. Plan. B Urban Anal. City Sci. 2020, 47, 1219–1236. [Google Scholar] [CrossRef]
  5. Burton, E. Measuring urban compactness in UK towns and cities. Environ. Plan. B Plan. Des. 2002, 29, 219–250. [Google Scholar] [CrossRef]
  6. Gyourko, J.E.; Rybczynski, W. Financing new urbanism projects: Obstacles and solutions. Hous. Policy Debate 2000, 11, 733–750. [Google Scholar] [CrossRef]
  7. Shi, Z.; Silvennoinen, H.; Chadzynski, A.; von Richthofen, A.; Kraft, M.; Cairns, S.; Herthogs, P. Defining archetypes of mixed-use developments using Google Maps API data. Environ. Plan. B Urban Anal. City Sci. 2023, 50, 1607–1623. [Google Scholar] [CrossRef]
  8. Manaugh, K.; Kreider, T. What is mixed use? Presenting an interaction method for measuring land use mix. J. Transp. Land Use 2013, 6, 63–72. [Google Scholar] [CrossRef]
  9. Hu, Q.; Shen, W.; Yan, J.; Kong, W.; Li, W.; Zhang, Z. Does existing mixed land development promote the urban spatial composite function? Evidence from Beijing, China. Land Use Policy 2024, 143, 107212. [Google Scholar] [CrossRef]
  10. Grant, J. Mixed use in theory and practice: Canadian experience with implementing a planning principle. J. Am. Plan. Assoc. 2002, 68, 71–84. [Google Scholar] [CrossRef]
  11. Dong, L.; Zhang, L. Spatial Coupling Coordination Evaluation of Mixed Land Use and Urban Vitality in Major Cities in China. Int. J. Environ. Res. Public Health 2022, 19, 15586. [Google Scholar] [CrossRef] [PubMed]
  12. Geyer, H.S., Jr. The theory and praxis of mixed-use development—An integrative literature review. Cities 2024, 147, 104774. [Google Scholar] [CrossRef]
  13. Yang, H.B.; Wang, L.; Tang, F.; Fu, M.C.; Xiong, Y.Q. Differences in Urban Vibrancy Enhancement among Different Mixed Land Use Types: Evidence from Shenzhen, China. Land 2024, 13, 1661. [Google Scholar] [CrossRef]
  14. Tang, S.; Zhang, J.; He, H.; Wang, Y.; Chen, J. Mixed-use development of land and institutional innovation based on the integration of planning, construction, and management. City Plan. Rev. 2023, 47, 4–14. (In Chinese) [Google Scholar]
  15. Kong, H.; Sui, D.Z.; Tong, X.; Wang, X. Paths to mixed-use development: A case study of Southern Changping in Beijing, China. Cities 2015, 44, 94–103. [Google Scholar] [CrossRef]
  16. Herndon, J.D. Mixed-Use Development in Theory and Practice: Learning from Atlanta’s Mixed Experiences; Georgia Institute of Technology: Atlanta, GA, USA, 2011. [Google Scholar]
  17. Kutty, A.A.; Kucukvar, M.; Onat, N.C.; Ayvaz, B.; Abdella, G.M. Measuring sustainability, resilience and livability performance of European smart cities: A novel fuzzy expert-based multi-criteria decision support model. Cities 2023, 137, 26. [Google Scholar] [CrossRef]
  18. Jacobs, J. The Death and Life of Great American Cities; Vintage Books: Vancouver, WA, USA, 2012. [Google Scholar]
  19. Zhu, X. Mixed-Use Human Settlements: The Evolution, Mechanism, and Construction of "Production-Living Integrated Communities"; China Architecture & Building Press: Beijing, China, 2014. (In Chinese) [Google Scholar]
  20. Xu, J.; Zhu, J.; Wang, J. A Study on Planning Guidance of Mixed Use of Urban Land at Home and Abroad. J. Hum. Settl. West China 2014, 29, 66–71. (In Chinese) [Google Scholar]
  21. Huang, L. Mixed Use and Statutory Planning in Hong Kong. Urban Plan. Int. 2002, 49–52. (In Chinese) [Google Scholar]
  22. Huang, J.; Du, B.; Wang, G. Flexibility Strategy of Regulatory Plan:Experience and Implication of White-Site Planning in Singapore. Urban Plan. Forum 2014, 104–111. (In Chinese) [Google Scholar]
  23. Chen, Y. Benign evolution mechanism of mixed-use development path. City Plan. Rev. 2021, 45, 62–71. (In Chinese) [Google Scholar]
  24. Xu, S.; Chen, Z. Conceptual Interpretation and Typological Exploration of Mixed-Use Development. Planners 2012, 28, 105–109. (In Chinese) [Google Scholar]
  25. Zheng, H.; Huang, J.; Zhuo, Y.; Xu, Z. Research Progress on the Measurement of Mixed Land Use. China Land Sci. 2019, 33, 95–104. (In Chinese) [Google Scholar] [CrossRef]
  26. Zhao, G.; Song, J. Improving the Measurement of Urban Land-use Mix. Urban Plan. Forum 2022, 51–58. (In Chinese) [Google Scholar] [CrossRef]
  27. American Planning Association. Planning and Urban Design Standards; John Wiley and Sons: Hoboken, NJ, USA, 2006. [Google Scholar]
  28. Coupland, A. Reclaiming the City: Mixed Use Development; Routledge: London, UK, 1997. [Google Scholar]
  29. Zhou, D.; Zhong, W.; Zhou, T.; Ql, J. Assessment on Urban Mixed Land Use and Analysis of lts Influencing Factors Based on POl Data: A Case of the Main Districts of Hangzhou City. China Land Sci. 2021, 35, 96–106. (In Chinese) [Google Scholar]
  30. Wang, K.J.; Xu, W.M.; Li, C.Y.; Shao, E.H.; Yang, H. A study on the function and structure of mixed land use in urban built-up areas from the perspective of spatial governance. J. Nat. Resour. 2023, 38, 1496–1516. [Google Scholar] [CrossRef]
  31. Zheng, H.; Wu, C.; Zheng, S.; Zhuo, Y.; Zhang, Q. The Spatial Consistency between Compact City and Mixed Land Use Development: A Case Study of Shanghai. China Land Sci. 2016, 30, 35–42. (In Chinese) [Google Scholar]
  32. Handy, S.L.; Boarnet, M.G.; Ewing, R.; Killingsworth, R.E. How the built environment affects physical activity: Views from urban planning. Am. J. Prev. Med. 2002, 23, 64–73. [Google Scholar] [CrossRef]
  33. Wang, Y.; Lu, D.; Levinson, D. Equilibrium or imbalance? Rail transit and land use mix in station areas. Transportation 2023, 50, 2403–2421. [Google Scholar] [CrossRef]
  34. Momeni, E.; Antipova, A. A micro-level analysis of commuting and urban land using the Simpson?s index and socio-demographic factors. Appl. Geogr. 2022, 145, 15. [Google Scholar] [CrossRef]
  35. Yue, Y.; Zhuang, Y.; Yeh, A.G.; Xie, J.-Y.; Ma, C.-L.; Li, Q.-Q. Measurements of POI-based mixed use and their relationships with neighbourhood vibrancy. Int. J. Geogr. Inf. Sci. 2017, 31, 658–675. [Google Scholar] [CrossRef]
  36. Shi, B.X.; Yang, J.Y. Scale, distribution, and pattern of mixed land use in central districts: A case study of Nanjing, China. Habitat Int. 2015, 46, 166–177. [Google Scholar] [CrossRef]
  37. Taleai, M.; Sharifi, A.; Sliuzas, R.; Mesgari, M. Evaluating the compatibility of multi-functional and intensive urban land uses. Int. J. Appl. Earth Obs. Geoinf. 2007, 9, 375–391. [Google Scholar] [CrossRef]
  38. Zhuo, Y.F.; Zheng, H.Y.; Wu, C.F.; Xu, Z.G.; Li, G.; Yu, Z.N. Compatibility mix degree index: A novel measure to characterize urban land use mix pattern. Comput. Environ. Urban Syst. 2019, 75, 49–60. [Google Scholar] [CrossRef]
  39. Weibull, J.W. An axiomatic approach to the measurement of accessibility. Reg. Sci. Urban Econ. 1976, 6, 357–379. [Google Scholar] [CrossRef]
  40. Hansen, W.G. How accessibility shapes land use. J. Am. Inst. Plan. 1959, 25, 73–76. [Google Scholar] [CrossRef]
  41. El-Geneidy, A.; Levinson, D. Making accessibility work in practice. Transp. Rev. 2022, 42, 129–133. [Google Scholar] [CrossRef]
  42. Wu, W.; Chen, W.Y.; Yun, Y.; Wang, F.; Gong, Z. Urban greenness, mixed land-use, and life satisfaction: Evidence from residential locations and workplace settings in Beijing. Landsc. Urban Plan. 2022, 224, 104428. [Google Scholar] [CrossRef]
  43. Hajna, S.; Dasgupta, K.; Joseph, L.; Ross, N.A. A call for caution and transparency in the calculation of land use mix: Measurement bias in the estimation of associations between land use mix and physical activity. Health Place 2014, 29, 79–83. [Google Scholar] [CrossRef] [PubMed]
  44. Chen, Z.Y.; Huang, B. Achieving urban vibrancy through effective city planning: A spatial and temporal perspective. Cities 2024, 152, 16. [Google Scholar] [CrossRef]
  45. Zhao, X.; Xia, N.; Li, M. 3-D multi-aspect mix degree index: A method for measuring land use mix at street block level. Comput. Environ. Urban Syst. 2023, 104, 102005. [Google Scholar] [CrossRef]
  46. Shi, Y.; Zheng, B.; Wang, Z.; Zheng, J. Mixed land use and its relationship with CO2 emissions: A comparative analysis based on several typical development zones in Shanghai. Land 2023, 12, 1675. [Google Scholar] [CrossRef]
  47. Zheng, H.; Zhuo, Y.; Xu, Z.; Wu, C.; Huang, J.; Fu, Q. Measuring and characterizing land use mix patterns of China’s megacities: A case study of Shanghai. Growth Chang. 2021, 52, 2509–2539. [Google Scholar] [CrossRef]
  48. Zhang, J.; Li, X.; Yao, Y.; Hong, Y.; He, J.; Jiang, Z.; Sun, J. The Traj2Vec model to quantify residents’ spatial trajectories and estimate the proportions of urban land-use types. Int. J. Geogr. Inf. Sci. 2021, 35, 193–211. [Google Scholar] [CrossRef]
  49. Liu, J.; Liu, Y.; Yi, D.; Yang, J.; Zhang, J. Extracting mixed topic patterns within downtown Beijing at the block level. J. Geo-Inf. Sci. 2020, 22, 1370–1382. (In Chinese) [Google Scholar]
  50. Döker, M.F.; Gül, A.; Kırlangıçoğlu, C.; Ocak, F.; Minaei, M. Identification of Urban Functional Areas Based on Point of Interest data and Thiessen Polygons for a Sustainable Urban Management. Soc. Indic. Res. 2025, 176, 1071–1092. [Google Scholar] [CrossRef]
  51. Li, Y.; Liu, C.; Li, Y. Identification of urban functional areas and their mixing degree using point of interest analyses. Land 2022, 11, 996. [Google Scholar] [CrossRef]
  52. Xia, F.; Lu, P. Can mixed land use promote social integration? Multiple mediator analysis based on spatiotemporal big data in Beijing. Land Use Policy 2023, 132, 106800. [Google Scholar] [CrossRef]
  53. Yao, Y.; Li, X.; Liu, X.; Liu, P.; Liang, Z.; Zhang, J.; Mai, K. Sensing spatial distribution of urban land use by integrating points-of-interest and Google Word2Vec model. Int. J. Geogr. Inf. Sci. 2017, 31, 825–848. [Google Scholar] [CrossRef]
  54. Yan, B.; Janowicz, K.; Mai, G.; Gao, S. From itdl to place2vec: Reasoning about place type similarity and relatedness by learning embeddings from augmented spatial contexts. In Proceedings of the 25th ACM SIGSPATIAL International Conference on Advances in Geographic Information Systems, Redondo Beach, CA, USA, 7–10 November 2017; p. 35. [Google Scholar]
  55. Zheng, Z.; Zheng, R.; Xu, J.; Wang, J. Identification of Urban Functional Regions Based on POl Data and Place2vec Model. Geogr. Geo-Inf. Sci. 2020, 36, 48–56. (In Chinese) [Google Scholar]
  56. Tian, L.; Liang, Y.L.; Zhang, B. Measuring residential and industrial land use mix in the peri-urban areas of China. Land Use Policy 2017, 69, 427–438. [Google Scholar] [CrossRef]
  57. Kantor, Y.; Rietveld, P.; van Ommeren, J. Towards a general theory of mixed zones: The role of congestion. J. Urban Econ. 2014, 83, 50–58. [Google Scholar] [CrossRef]
  58. Jiang, H.P.; Sun, Z.C.; Guo, H.D.; Xing, Q.; Du, W.J.; Cai, G.Y. A standardized dataset of built-up areas of China’s cities with populations over 300,000 for the period 1990–2015. Big Earth Data 2022, 6, 103–126. [Google Scholar] [CrossRef]
  59. Zhao, W.; Li, Q.; Li, B. Extracting hierarchical landmarks from urban POI data. Natl. Remote Sens. Bull. 2011, 15, 973–988. (In Chinese) [Google Scholar] [CrossRef]
  60. GB 50137-2011; Urban Land Classification and Planning and Construction Land Standard. China Academy of Urban Planning & Design: Beijing, China, 2011.
  61. GB50442; Urban Public Service Facility Planning Standard (Revised Draft for Comments). Ministry of Housing and Urban-Rural Development of the People’s Republic of China and China Academy of Urban Planning & Design: Beijing, China, 2018.
  62. Ll, J.; Qi, X.; Yuan, W. Spatial differentiation of multi-functional mixed use of construction land based on points of interest. Prog. Geogr. 2022, 41, 239–250. (In Chinese) [Google Scholar]
  63. Chi, J.; Jiao, L.; Dong, T. Quantitative Identification and Visualization of Urban Functional Area Based on POI Data. J. Geomat. 2016, 41, 68–73. (In Chinese) [Google Scholar]
  64. Shi, H.; Zhao, M.; Chen, P. Measuring the Functional Compatibility of Land from the Perspective of Land-Use Mix: A Case Study of Xiangtan. Trop. Geogr. 2021, 41, 746–759. (In Chinese) [Google Scholar] [CrossRef]
  65. Wang, J.; Xu, C. Geodetector: Principle and prospective. Acta Geogr. Sin. 2017, 72, 116–134. (In Chinese) [Google Scholar] [CrossRef]
  66. Song, Y.Z.; Wang, J.F.; Ge, Y.; Xu, C.D. An optimal parameters-based geographical detector model enhances geographic characteristics of explanatory variables for spatial heterogeneity analysis: Cases with different types of spatial data. GISci. Remote Sens. 2020, 57, 593–610. [Google Scholar] [CrossRef]
  67. Talen, E. Land use zoning and human diversity: Exploring the connection. J. Urban Plan. Dev. 2005, 131, 214–232. [Google Scholar] [CrossRef]
  68. Wu, B.; Levinson, D.M. A multi-modal analysis of the effect of transport on population and productivity in China. J. Transp. Geogr. 2024, 116, 103856. [Google Scholar] [CrossRef]
  69. Stead, D. Relationships between land use, socioeconomic factors, and travel patterns in Britain. Environ. Plan. B Plan. Des. 2001, 28, 499–528. [Google Scholar] [CrossRef]
  70. He, X.P. Energy effect of urban diversity: An empirical study from a land-use perspective. Energy Econ. 2022, 108, 9. [Google Scholar] [CrossRef]
  71. Zhang, B.L.; Zhang, R.J.; Jiang, G.H.; Cai, W.M.; Su, K.C. Improvement in the quality of living environment with mixed land use of rural settlements: A case study of 18 villages in Hebei, China. Appl. Geogr. 2023, 157, 10. [Google Scholar] [CrossRef]
  72. Li, J.; Huang, C. Analysis of Changes in Urban Land Use in Built-up Areas of Changsha. South Archit. 2023, 19–31. (In Chinese) [Google Scholar]
  73. Chen, H.J.; Su, K.C.; Peng, L.X.; Bi, G.H.; Zhou, L.L.; Yang, Q.Y. Mixed Land Use Levels in Rural Settlements and Their Influencing Factors: A Case Study of Pingba Village in Chongqing, China. Int. J. Environ. Res. Public Health 2022, 19, 5845. [Google Scholar] [CrossRef] [PubMed]
Figure 1. The analytical framework of this study.
Land 14 00895 g001
Figure 2. Overview of the research area.
Land 14 00895 g002
Figure 3. Patterns of mixed land use in the built-up areas of Changsha.
Land 14 00895 g003
Figure 4. Distribution of average diversity, compatibility, and accessibility values of mixed land use in the built-up areas of Changsha.
Land 14 00895 g004
Figure 5. Hot-spot and cold-spot analysis of mixed land use in the built-up area of Changsha.
Land 14 00895 g005
Figure 6. Interaction detection results of influencing factors on the degree of mixed land use in built-up areas of Changsha.
Land 14 00895 g006
Table 1. POI classification.
First ClassificationSecond ClassificationContent
Residential Land (residential)Residential arearesidential community, villa, dormitory
Community centercommunity service center
Public Administration and Public Service Land (public)Education and researchnewspaper offices, publishing houses, research institutions, universities, high schools, elementary schools
Social organizationsindustry associations
Cultural facilitieslibrary, exhibition hall, museum, art gallery, cultural center, convention center
Administrative officesgovernment agencies, tax authorities, traffic law enforcement, prosecutor’s office
Healthcaregeneral hospital, specialized hospital, health clinic
Commercial Land
(commercial)
Dining serviceschinese restaurant, fast food restaurant, pastry shop, tea house
Shopping servicesshopping mall, supermarket, specialty store
Financial and insurance servicesbank, insurance company
Commercial Residenceoffice building
Daily life servicespost office, travel agency, service hall, beauty salon, sports facility, entertainment venue
Accommodation serviceshotel, inn, guesthouse
Industrial Land
(industrial)
Companies and enterprisescompany, industrial park, factory
Transportation Land
(transportation)
Road-related facilitiesservice area, toll station
Transportation servicesdock, bus station, train station
Green Space and Square Land
(green space)
Scenic spotstourist attraction, memorial hall, temple or Taoist temple
Parks and squarescity square, park
Note: The content within () represents the abbreviations of the corresponding land-use types.
Table 2. POI weights.
First ClassificationSecond ClassificationInfluence
Score b1
Relevance
Score b2
Comprehensive
Weight B
Residential LandResidential area500.712635.63
Community center100.54165.416
Public Administration and Public Service LandEducation and research300.671720.151
Social organizations100.41384.138
Cultural facilities300.712621.378
Administrative offices300.513815.414
Healthcare200.712614.252
Commercial LandDining services100.81388.138
Shopping services150.813812.207
Financial and insurance services300.541616.248
Commercial—residential100.44164.416
Daily life services100.71267.126
Accommodation services100.54165.416
Industrial LandCompanies and enterprises300.488814.664
Transportation LandRoad-related facilities150.44166.624
Transportation services150.671710.0755
Green Space and Square LandScenic spots900.613855.242
Parks and squares900.712664.134
Table 3. Table of land-use compatibility values [30,64].
Residential AreaCommunity CenterEducation and ResearchSocial OrganizationsCultural FacilitiesAdministrative OfficesHealthcareDining ServicesShopping ServicesFinancial and Insurance ServicesCommercial—ResidentialDaily Life ServicesAccommodation ServicesClass IClass IIClass IIIRoad-Related FacilitiesTransportation ServicesScenic SpotsParks and Squares
Residential
area
00000000000000.10.40.80000
Community center00000000000000.10.40.80000
Education
and research
00000000.030.030.030.030.030.030.10.40.80000
Social
organizations
00000000.030.030.030.030.030.030.10.40.80000
Cultural
facilities
00000000.030.030.030.030.030.030.10.40.80000
Administrative offices00000000.030.030.030.030.030.030.10.40.80000
Healthcare00000000.030.030.030.030.030.030.10.40.80000
Dining
services
000.030.030.030.030.030000000.10.40.80000
Shopping
services
000.030.030.030.030.030000000.10.40.80000
Financial
and insurance services
000.030.030.030.030.030000000.10.40.80000
Commercial—residential000.030.030.030.030.030000000.10.40.80000
Daily life
services
000.030.030.030.030.030000000.10.40.80000
Accommodation services000.030.030.030.030.030000000.10.40.80000
Class I0.10.10.10.10.10.10.10.10.10.10.10.10.100.40.8000.10.1
Class II0.40.40.40.40.40.40.40.40.40.40.40.40.40.400.5000.40.4
Class III0.80.80.80.80.80.80.80.80.80.80.80.80.80.80.50000.80.8
Road-related facilities00000000000000000000
Transportation services00000000000000000000
Scenic spots00000000000000.10.40.80000
Parks and
squares
00000000000000.10.40.80000
Note: Class I refers to industrial land that has minimal or no interference with or pollution to the public environment, such as industries related to medical devices, electronics, etc. Class II refers to industrial land that causes some level of disturbance or pollution to the public environment, such as textile, food processing, etc. Class III refers to industrial land that causes significant disturbance, pollution, or safety hazards to the public environment, such as chemical, steel manufacturing, etc.
Table 4. Frequency statistics of land-use types for different patterns (top three).
PatternMost Frequent Land-Use TypeSecond Most Frequent Land-Use TypeThird Most Frequent Land-Use Type
Pattern 1industrial (96)commercial (95)green space (27)
Pattern 2industrial (855)transportation (41)residential (32)
Pattern 3residential (51)commercial (40)residential–public–commercial (32)
Pattern 4commercial (87)commercial–public–transportation (25)commercial–public–residential (24)
Pattern 5residential (15)commercial (15)green space (14)transportation (8)
Pattern 6green space (184)residential (178)transportation (121)
Note: Mixed functional zones are labeled according to the proportion of land-use types, with grid counts shown in parentheses.
Table 5. Indicators of factors influencing the degree of mixed land use in the built-up areas of Changsha.
Primary IndicatorSecondary IndicatorUnitCalculate
Economic levelAverage housing price (X1)CNY/m2Average housing price per unit area
Population density (X2)people/km2Average population density per unit area
Public servicesClosest distance to railway (X3)kmAverage distance to railway stations
Closest distance to main road (X4)kmAverage distance to the nearest urban arterial road
Closest distance to metro station (X5)kmAverage distance to subway stations
Closest distance to bus station (X6)kmAverage distance to bus stops
Transportation networkPublic service facility coverage (X7)unitsQuantity of medical, cultural/educational, sports, and basic support facilities
Road network density (X8)km/km2Road length per square kilometer
Spatial utilizationBuilding density (X9)%Ratio of building footprint area to plot area
Floor area ratio (X10)%Ratio of total building floor area to plot area
Green space ratio (X11)%Normalized Difference Vegetation Index (NDVI)
Table 6. Single-factor detection results of the degree of mixed land use in built-up areas of Changsha.
Pattern 3, Pattern 4, Pattern 5Pattern 1, Pattern 6Pattern 2
IndicatorqpqpqP
X10.300 0.000 0.230 0.000 0.047 0.998
X20.059 0.140 0.056 0.003 0.014 0.066
X30.112 0.000 0.073 0.000 0.025 0.015
X40.231 0.000 0.130 0.000 0.095 0.000
X50.213 0.000 0.106 0.000 0.039 0.022
X60.347 0.000 0.226 0.000 0.130 0.000
X70.151 0.000 0.189 0.000 0.146 0.000
X80.277 0.000 0.178 0.000 0.085 0.000
X90.307 0.000 0.270 0.000 0.044 0.998
X100.314 0.000 0.282 0.000 0.037 0.998
X110.089 0.000 0.098 0.000 0.276 0.000
Disclaimer/Publisher’s Note: The statements, opinions and data contained in all publications are solely those of the individual author(s) and contributor(s) and not of MDPI and/or the editor(s). MDPI and/or the editor(s) disclaim responsibility for any injury to people or property resulting from any ideas, methods, instructions or products referred to in the content.

