Article

The Spatiotemporal Dynamics of the Landscape of the Itombwe Nature Reserve and Its Periphery in South Kivu, the Democratic Republic of Congo

by
Cléophace Bayumbasire Citwara
1,2,3,*,
Trésor Mbavumoja Selemani
2,
Julien Bwazani Balandi
1,2,
Nadège Cizungu Cirezi
1,4,5,
André Nduwimana
6,
Léonard Mubalama Kakira
7,
Kouagou Raoul Sambieni
1,
Jean-Pierre Mate Mweru
1,
Jean-François Bastin
2,
Hervé Tchekote
8 and
Jan Bogaert
2,*
1
Ecole Régionale Post-Universitaire d’Aménagement et Gestion Intégrés des Forêts et Territoires Tropicaux (ERAIFT), Kinshasa P.O. Box 15.373, Democratic Republic of the Congo
2
Biodiversité, Ecosystème et Paysage, Gembloux Agro-Bio Tech, Université de Liège, 5030 Gembloux, Belgium
3
Département de l’Environnement, Centre de Recherche en Sciences Naturelles de Lwiro (CRSN-LWIRO), D.S.Bukavu, Democratic Republic of the Congo
4
TERRA Research and Teaching Center, Gembloux Agro-Bio Tech, Université de Liège, 5030 Gembloux, Belgium
5
Natural Resource Management Department, Faculty of Agricultural and Environmental Sciences, Université Evangélique en Afrique, Bukavu P.O. Box 3323, Democratic Republic of the Congo
6
Centre de Recherche en Sciences de Productions Animales Végétales et Environnementales (CRAVE), Université du Burundi, Bujumbura BP 1550, Burundi
7
Centre de Recherche en Gestion de la Biodiversité et Changement Climatique, ISDR Bukavu, Bukavu P.O. Box 2849, Democratic Republic of the Congo
8
Département de Géographie, Centre d’Études et de Recherche en Espaces, Arts et Humanités (CEREAH), Université de Dschang, Dschang P.O. Box 96, Cameroon
*
Authors to whom correspondence should be addressed.
Land 2025, 14(4), 907; https://doi.org/10.3390/land14040907
Submission received: 17 March 2025 / Revised: 12 April 2025 / Accepted: 16 April 2025 / Published: 21 April 2025

Abstract

:
This study examines the evolution of anthropogenic pressures on the Itombwe Nature Reserve and its periphery over the period 1990–2024 using satellite imagery. Two landscape ecology indices were employed: the Percentage of Landscape (PLAND) and the Largest Patch Index (LPI). The PLAND quantifies the overall extent of each habitat type, while the LPI provides insights into their spatial configuration. Eighty-three plots (each 2.5 km per side, i.e., 6.25 km2) were sampled in both the reserve and its periphery to generate robust landscape replications. Analysis focused on three key land use classes: forests, savannahs, and fields. Statistical comparisons using Kruskal–Wallis and Mann-Whitney U tests revealed a decline in forest cover within the reserve and its periphery, accompanied by a steady increase in savannahs and fields. The decline in forest cover is particularly pronounced along the reserve’s periphery. For instance, in the reserve, forest cover decreased from 78.4% in 1990 to approximately 60.2% in 2024, whereas on the periphery, it dropped from 37.5% to about 21.4%. In contrast, the savannah areas increased from 17.7% to 29.5% within the reserve and maintained a marked predominance on the periphery (rising from 53.9% to 55.2%). Additionally, the area dedicated to fields exhibited notable expansion, rising from 3.70% to 10.22% in the reserve and from 7.54% to 21.98% along the periphery. These findings underscore the significant impacts of anthropogenic pressure on the forest ecosystems in both the reserve and its periphery. They highlight the urgent need for enhanced conservation measures within the reserve, as well as the implementation of sustainable land use practices (e.g., agroforestry and sustainable agriculture) in the peripheral zones to reduce the local population’s dependence on forest resources.

1. Introduction

The Congo Basin, which constitutes a major part of the Democratic Republic of the Congo (DRC), is estimated to be covered by over 99% primary or regenerating forests rather than plantations [1]. Nonetheless, similar to other tropical regions, these forests are experiencing accelerated deforestation and degradation, leading to pronounced landscape fragmentation and substantial impacts on ecosystem integrity and the livelihoods of local communities [2]. The Democratic Republic of the Congo, with its 145 million hectares of forest, exhibits a vast diversity of ecosystems, including dense rainforests, mountain forests, dry forests, and savannah forest mosaics [3]. Despite this ecological richness, annual primary forest loss has accelerated from 150,000 hectares in the early 2000s to 450,000 hectares since 2014 [4,5]. Multiple drivers, ranging from rural dependence on agriculture and charcoal production [6] to weak governance, have intensified anthropogenic pressures, jeopardizing the provision of critical ecosystem services and underscoring the need for continuous forest monitoring [7].
In response to these challenges, the Democratic Republic of the Congo has designated 12% of its territory as a protected area, aiming to safeguard vital ecosystem services, including carbon sequestration, water regulation, and biodiversity conservation [8,9,10]. These protected areas also support key ecological processes, including pollination and seed dispersal, essential for maintaining ecosystem integrity [11].
However, conservation initiatives face significant socioeconomic constraints. Inadequate agricultural practices and widespread charcoal production further exacerbate habitat degradation [12,13,14]. Additionally, armed conflicts often driven by the pursuit of natural resources have contributed substantially to forest cover loss in the Democratic Republic of the Congo and elsewhere in Africa and Asia [15]. In the eastern Democratic Republic of the Congo, particularly in South Kivu, armed groups exploit resources illegally, impeding conservation efforts and destabilizing protected areas [16,17,18]. Similar patterns have been documented in the Ivory Coast, Angola, and Burundi, where socio-political crises have amplified anthropogenic activities in protected areas [19,20,21,22,23].
The Itombwe Nature Reserve exemplifies these challenges. Although co-management and conservation programs led by the Institut Congolais pour la Conservation de la Nature (ICCN) and its partners, including the WWF, have been initiated over the last two decades, illegal resource extraction continues to threaten the reserve’s biodiversity [18,24]. Notably, few detailed studies have addressed the spatiotemporal dynamics of land use within the Itombwe Nature Reserve and its peripheral zones. Existing research underscores the decline in forest cover [25,26], but has largely overlooked how the peripheral areas can both buffer and exacerbate pressures on the reserve [27,28]. Because local populations depend on the peripheral lands for subsistence, resource depletion in these buffer zones can spill over into protected areas, amplifying habitat fragmentation and reducing forest integrity.
To bridge this knowledge gap, the present study employs remote sensing and landscape ecology methods integrating Geographic Information Systems (GISs) with landscape metrics to quantify and analyze land cover changes within the Itombwe Nature Reserve and its periphery from 1990 to 2024 [29,30,31]. Specifically, the PLAND (Percentage of Landscape) and the LPI (Largest Patch Index) are used to assess both the composition and configuration of forest, savannah, and agricultural patches [32]. By comparing the patterns in the reserve’s core and its periphery, we aim to evaluate the extent of forest reduction, the expansion of savannah and agricultural lands, and the resulting habitat fragmentation. The overarching goal is to clarify how peripheral anthropogenic pressures shape landscape dynamics, thereby informing more targeted and sustainable management strategies for both the reserve and its periphery [33].
Based on the observed trends, the hypothesis is that the Itombwe Nature Reserve has experienced a substantial reduction in forest cover, alongside the expansion of savannah and agricultural areas, resulting in smaller and more fragmented forest patches. This study further posits that the reserve’s core still retains larger continuous forest patches compared to the periphery, where forest fragments are typically smaller and more scattered. Systematically comparing these two zones, this study sheds light on the cumulative impacts of agricultural encroachment, resource extraction, and socio-political instability, contributing critical insights to the ongoing discourse on tropical forest conservation and sustainable land management.

2. Materials and Methods

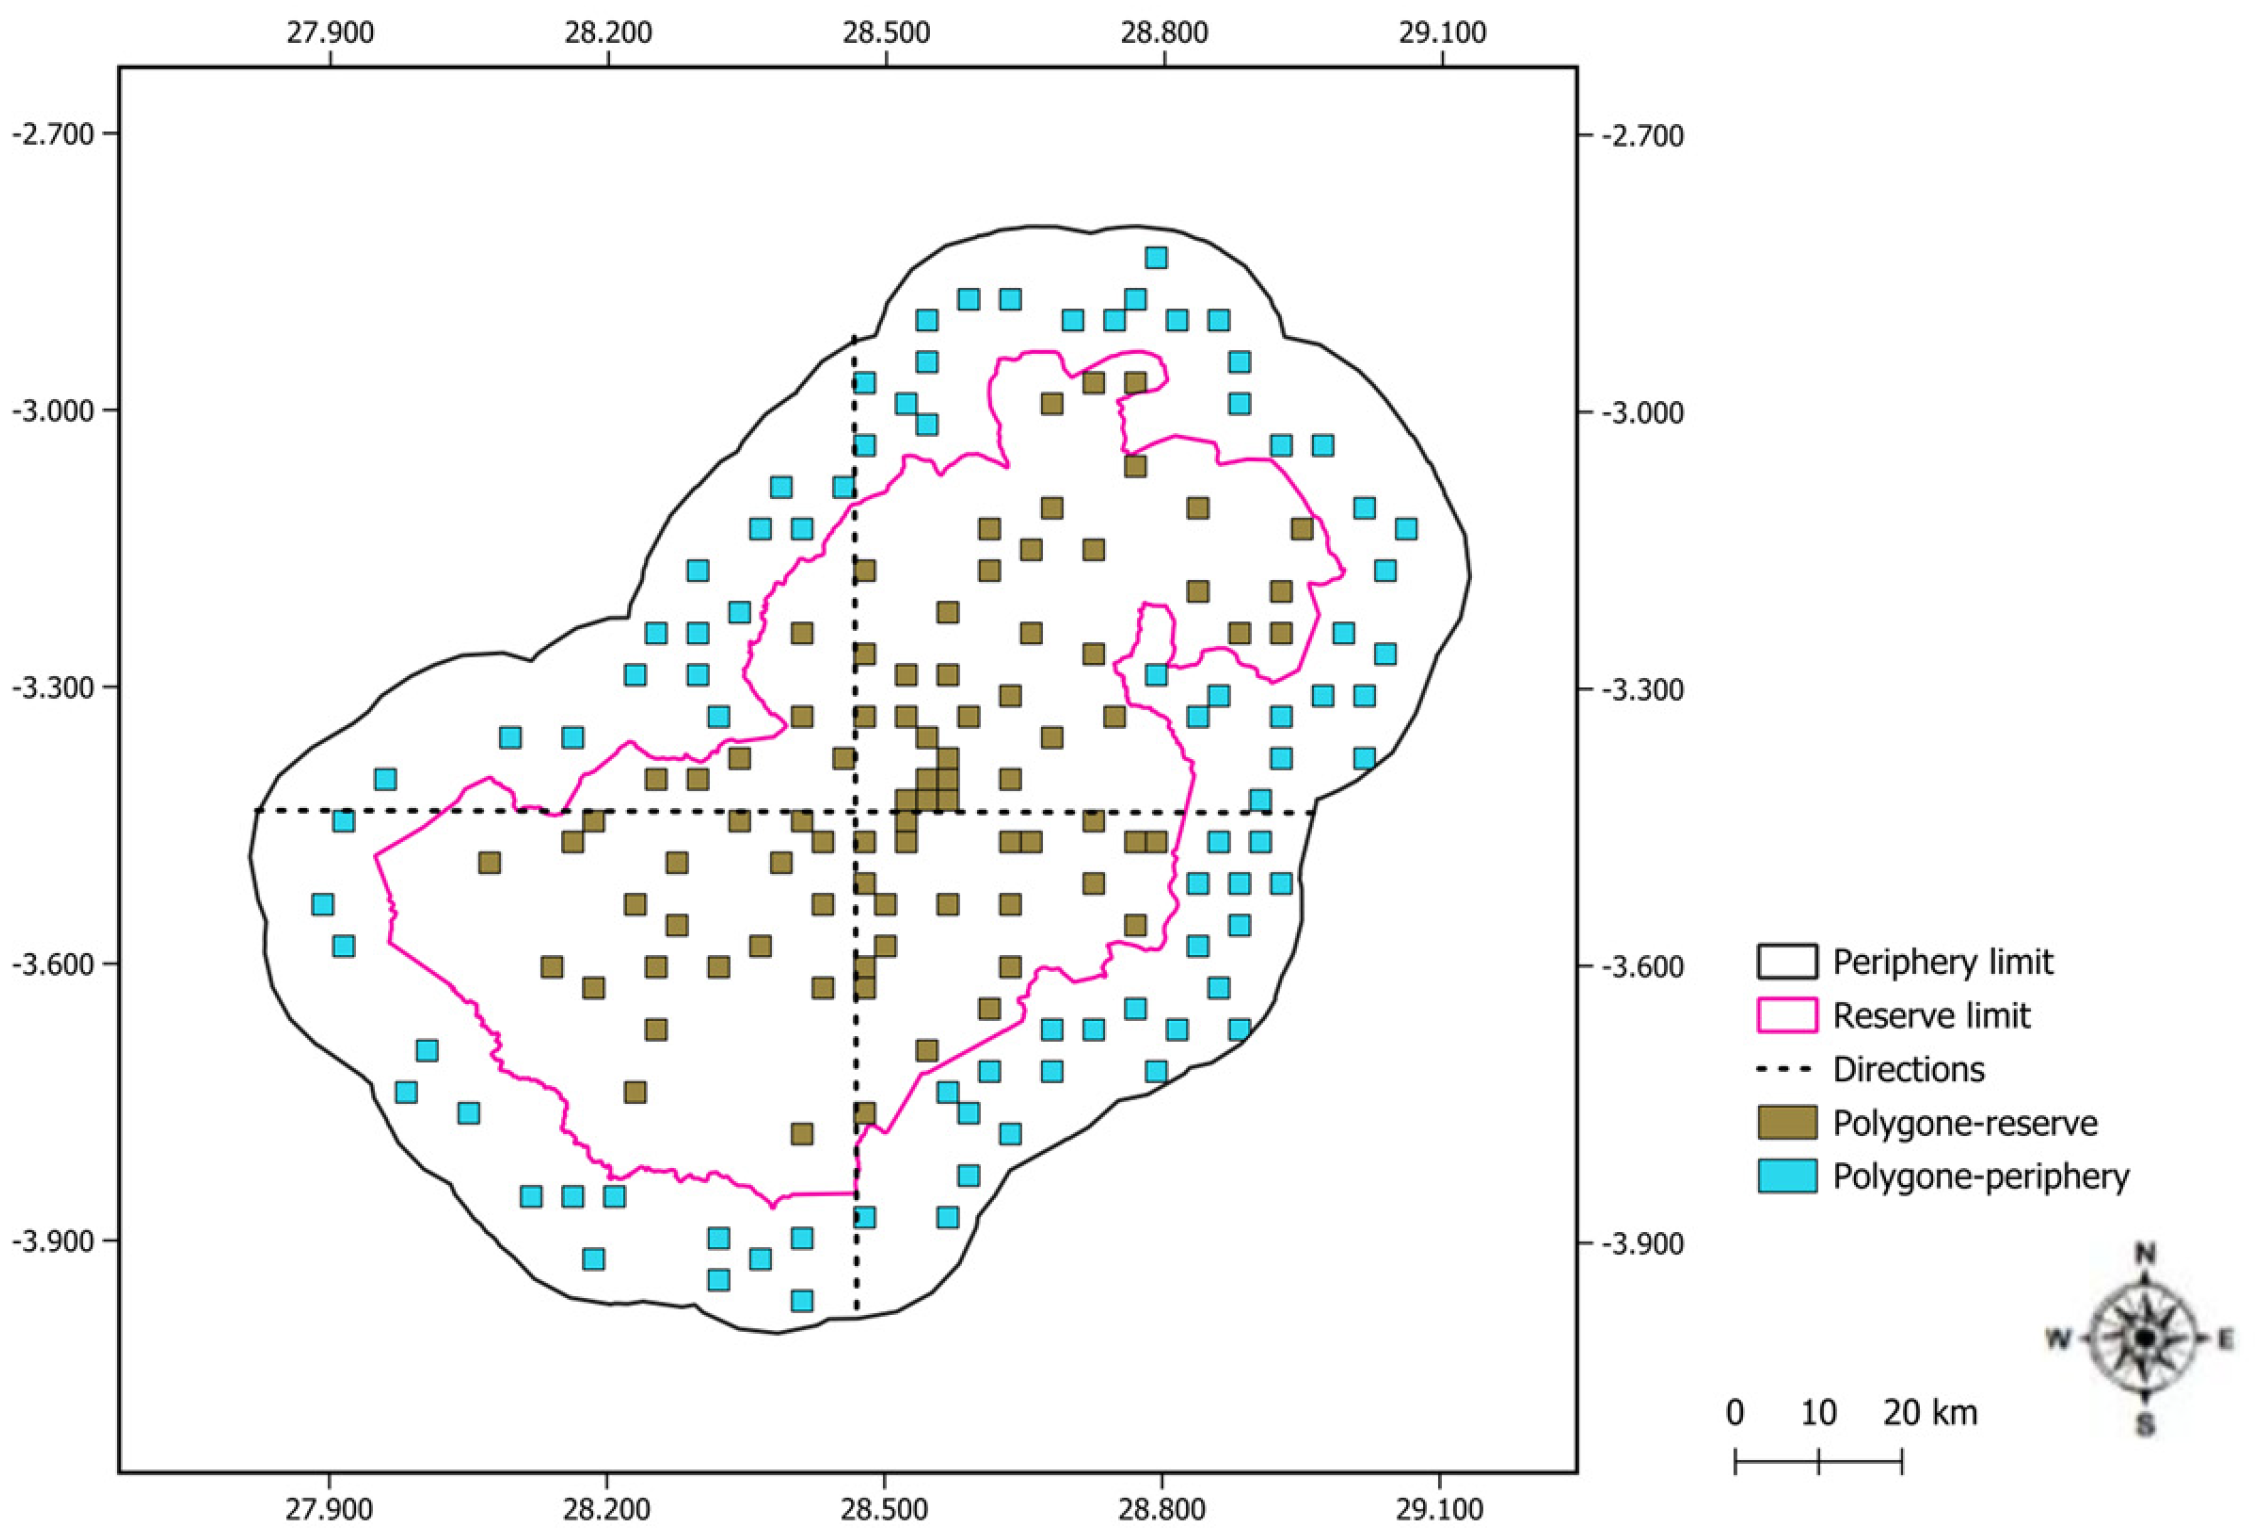
2.1. Study Area: Itombwe Nature Reserve and Its Peripheral Area

The reserve is situated between 2°40′ and 4°35′ south latitude and 27°55′ and 29°05′ east longitude [34]. It is in the South Kivu province of the Democratic Republic of the Congo (DRC), west of Lake Tanganyika (Figure 1). It encompasses a substantial portion of the territory, intersecting the administrative boundaries of Mwenga, Fizi, Uvira, and Shabunda. The Itombwe Nature Reserve is delineated into three distinct zones, the integral conservation zone, which encompasses 36.3% of the total area; the buffer zone, comprising 18.8%; and the multiple use zone, accounting for 44.9% [35].
According to Doumenge and Schilter, Plumptre et al., Greenbaum, and Chifundera [34,36,37], the flora of the Itombwe Nature Reserve is characterized by the convergence of multiple significant phytogeographical groups. The Itombwe Nature Reserve was established in 2006 through the Arrêté Ministériel N° 038/CAB/MIN/ECN-EF/2006 on October 11, 2006 [35]. to preserve the biological diversity of the entire region. Consequently, the reserve faces the challenge of integrating human settlements and fields belonging to the local population into a quadrilateral measuring 140 km × 120 km, or 16,800 km2. It was only in 2016 that its surface area was updated and set at 5732 km2 by the Décret Provincial N° 16/026/GP/SK on 20 June 2016. Consequently, the recent Development and Management Plan dates from 2018 [38].
The Itombwe Nature Reserve is a prominent African biodiversity site, particularly within the Albertine Rift region. It is part of remarkable high-altitude mountain forests, extending from 1500 to over 3000 m [39]. To the west, the flora is classified as part of the “Centre d’endémisme guinéo-congolais”, comprising plain rainforests. The plant formations present in the southern region are associated with the “Zambézien Regional Center of Endemism”. At the same time, those found at higher altitudes are characteristic of the “Afro-Montane Regional Center of Fragile Endemism”.
The Itombwe Massif is renowned for its rich avifauna, which includes several species endemic to the country [40,41]. Of the 43 species endemic to the Albertine Rift region, 35 are found in Itombwe. However, the conservation target species in this area are the chimpanzee (Pan troglodytes schweinfurthi or marungensis), the eastern lowland gorilla (Gorilla beringei graueri), and Prigogine’s owl (Phodilus prigoginei), which is endemic to Itombwe forest [42].
According to Doumenge and Schilter [36], the Itombwe Mountain region features a dense hydrographic network that is entirely part of the Congo River watershed. Several rivers, such as Elila, Ulindi, and Lwama, are direct tributaries of the Congo River, and Mutambala, in turn, is a tributary of Lake Tanganyika. The Itombwe Massif also supplies the Ruzizi Plain with numerous other rivers, including Luvimbi, Luvubu, Lubirizi, Sange, and Kiliba, which are tributaries of the Ruzizi River and flow into Lake Tanganyika. What further distinguishes the Itombwe Massif is the presence of a lake. Lake Lungwe, situated at an elevation of 2700 m, is encircled by expansive swampy regions that pose significant challenges to accessibility [38]. For this study, a 15 km buffer zone around the reserve is delineated and encompasses the administrative areas of Mwenga, Uvira, Fizi, and Shabunda, as defined in the Development and Management Plan [35].

2.1.1. Remote Sensing Data

To map and quantify land cover changes in the study area, a substantial amount of satellite data was used, including Landsat TM (Thematic Mapper) images for 1990 and 1995, ETM+ (Enhanced Thematic Mapper Plus) for 2001 and 2007, and OLI-TIRS 1 (Operational Land Imager and Thermal Infrared Sensor) for 2013 and 2019, and OLI-TIRS 2 for 2024.
The data were collected during the dry season, which corresponds to May, to minimize the risk of overestimating forest classes in the landscape under study and to maintain consistency in the spectral responses of the different land covers [43]. The selection of dates for this study was based on several criteria, including the periods during which conflicts began in the area. The Itombwe region has been a primary site of armed conflict since the 1990s, marked by the so-called “Congo Liberation War” and the ongoing presence of various militias. These events have led to the increased exploitation of natural resources and the destruction of ecosystems, thereby justifying the inclusion of these periods in analysis.
Secondly, the Itombwe Nature Reserve’s creation period is relevant. It was established on 11 October 2006 [35], thus establishing a pivotal reference point for evaluating the efficacy of protection measures over time and space. Thirdly, the availability of satellite images is a crucial factor. The irregular time step is attributable to the necessity of selecting images with minimal cloud cover, thereby ensuring the quality of observations.
It is imperative to acknowledge that the Itombwe Nature Reserve was established in 2006 [35]. After 2007, fieldwork was undertaken to delineate its definitive boundaries through consultation between ICCN managers and the local population [38]. In this context, analyses were conducted at two levels: at the reserve level and the periphery level (from 1990 to 2024). At the reserve level, particular attention was directed towards the date of its establishment to assess the impact of the conservation measures implemented by managers on the area encompassing the reserve. The principal objective is to ascertain whether the reserve has experienced a reduction in anthropogenic pressure compared to the pre-existing conditions.
The images used in this study were acquired, processed, and analyzed within the Google Earth Engine (GEE) platform. This platform boasts a substantial database of geospatial data derived from multiple institutes and satellites, which is accessible to all users and encompasses extensive geographical areas [43].

2.1.2. Image Pre-Processing in Google Earth Engine

For each study year, images with less than 10% cloud cover covering the entire study area were selected and assembled to generate a median composite image on the Google Earth Engine (GEE) platform [43,44]. This median composite, inspired by methodologies from [43,45], was then used for classification. Before alignment, a radiometric correction was applied using selected bands [46]. Finally, a false color composite was produced by combining the mid-infrared (MIR) and near-infrared (NIR) bands, which enhanced the distinction between the different land use classes.

2.1.3. Supervised Image Classification and Validation of Land Use Maps

The following subsection details class nomenclature and the supervised classification methodology. Five land cover classes were defined in the study area: forest, savannah, fields, built-up areas and bare soil, and water. Table 1 presents the land cover classes and their corresponding descriptions.
Sampling points were identified on each image using false color composites with high-resolution Landsat imagery accessed via Google Earth Engine to facilitate visual interpretation [46,47]. For each land cover class, we collected training and validation points: 37 for water, 185 for forest, 244 for savannah, 165 for Field-fallow mosaics, and 66 for built-up areas and bare soil. Approximately 70% of these points were randomly assigned for training, and 30% for validation. The points were distributed proportionally across the classes based on the preliminary analysis of high-resolution false color composites. This ensured that one set was dedicated to training, and another to model validation [43,46].
The classification process employed a supervised approach using the Random Forest (RF) model [48,49]. This algorithm constructs decision trees to classify each pixel into a specific land use category and has shown higher accuracy compared to other commonly used methods such as Support Vector Machine (SVM), k-Nearest Neighbor (k-NN), and Maximum Likelihood Classifier (MLC) [50,51,52,53]. The Random Forest algorithm was configured with 100 trees in implementation, and the maximum depth was determined through preliminary cross-validation. Out-of-bag (OOB) error estimation was used to assess model performance during training [54,55]. This configuration was chosen after testing alternative setups, as Random Forest consistently outperformed the other methods in this study.

2.1.4. Analysis of Spatial Patterns in the Itombwe Nature Reserve and Its Periphery

A stratified random sampling strategy was employed to assess the spatial patterns of land use within the Itombwe Nature Reserve and its periphery, with 83 observation plots (each measuring 2.5 km on a side, equivalent to 6.25 km2). These plots were selected to encompass all the cardinal and intercardinal directions (N, NE, E, SE, S, SW, W, and NW) around the reserve. This ensures that no single part of the reserve or its periphery is over or under-represented, allowing for the more complete spatial assessment of land cover patterns. A random sampling strategy was used to reduce subjectivity in plot placement. Randomization helps ensure that the plots accurately reflect the real variability in the landscape, rather than being clustered in specific, potentially biased locations. The number of plots was determined based on preliminary assessments, balancing statistical robustness and practical constraints (see Figure 2). The spatial distribution of plots aligns with this study’s primary objective of comparing landscape composition and configuration within the reserve and its periphery. By ensuring an even distribution across both the zones, comparison was made between the landscape metrics, the PLAND (Percentage of Landscape), which quantifies the proportion of each land cover class within each plot, and the LPI (Largest Patch Index), which measures the relative size of the largest contiguous patch, reflecting the degree of connectivity and the dominance of each land cover class [32]. Overall, the random and spatially distributed selection of plots provides a robust, unbiased basis for assessing and comparing land use dynamics across the study area (Figure 2).
Accordingly, the Percentage of Landscape occupied by each land use component (Equation (1)) was quantified to test the following hypotheses: First, forest coverage decreased, whereas the savannah and fields areas increased between 1990 and 2024 at the landscape level. Second, forest coverage decreased in peripheral regions, resulting from intensive human activities. Third, the savannah and field proportions are higher in the periphery compared to the reserve, reflecting increased logging and a greater demand for agricultural land. Additionally, the proportion covered by the largest patch (Equation (2)) was calculated to evaluate (i) the fragmentation of the largest forest patches from 1990 to 2024 throughout the landscape, (ii) the extent of their fragmentation in the periphery relative to the reserve, and (iii) the degree of aggregation of savannah and field in the periphery compared to the reserve.
P L A N D = j = 1 n a i j A × 100
PLAND = Percentage of Landscape
a i j = A r e a   m 2   o f   p a t c h   i j
A = total landscape area (m2)
L P I = m a x j = 1   n a i j A × 100
LPI = Largest Patch Index
Analysis was conducted on the composition (PLAND) and configuration (LPI) of the 83 plots, distributed evenly across the Itombwe reserve and its periphery. Exploratory analysis revealed strong asymmetry in the distributions of these variables. Therefore, logarithmic transformation to meet normality requirements was applied. However, given the unequal group sizes between the zones, non-parametric Kruskal–Wallis and Mann–Whitney U tests, which are particularly well suited to non-symmetrical distributions and variable sample sizes, were used. This methodological decision enabled the identification of significant variations in the PLAND and the LPI over time, thereby providing precise indications of the evolution of landscape dynamics within the reserve and its periphery. In summary, the combination of logarithmic preprocessing with the Kruskal–Wallis and Mann–Whitney U tests provided a solid basis for drawing reliable conclusions about the spatiotemporal dynamics of land cover in our study.

3. Results

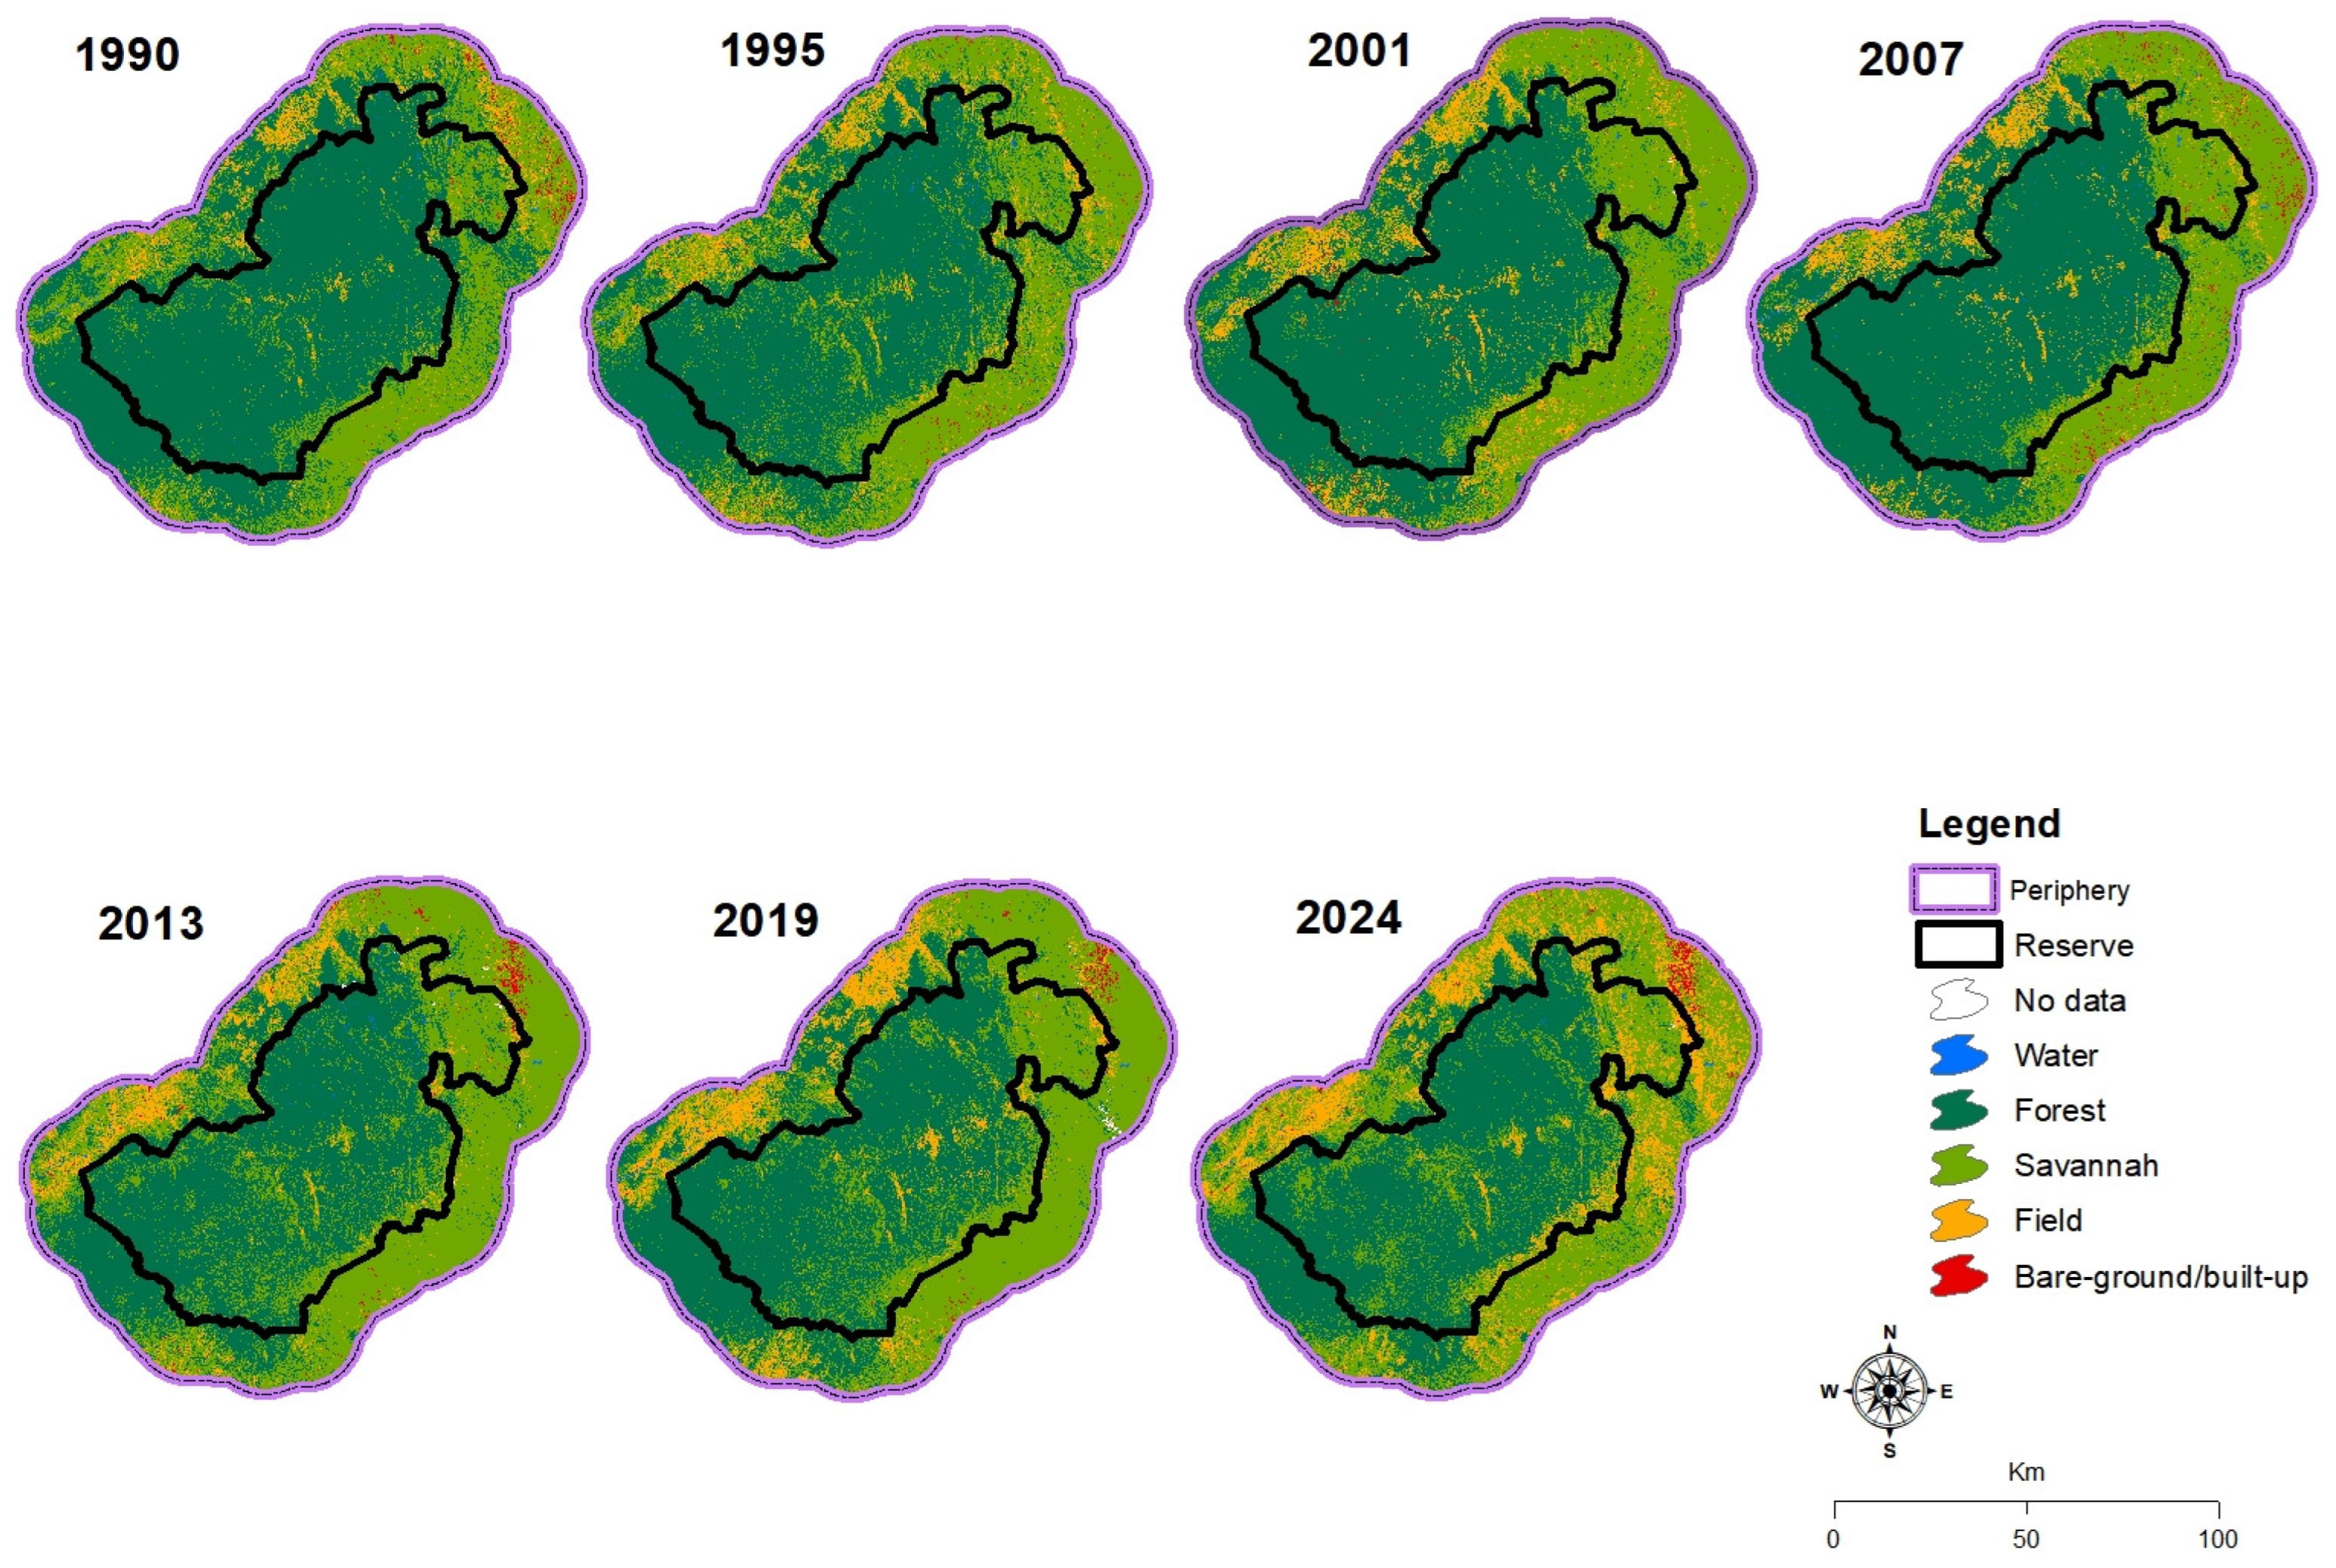
3.1. Validation of Supervised Classifications and Mapping of Land Cover

Classification validation was achieved using a confusion matrix in Google Earth Engine, whereby statistical comparison was conducted between the validation points and the classification outcomes [47]. The kappa coefficient and the aggregate user and producer accuracy indices were employed to evaluate the performance of the classification process. The confusion matrix of the Random Forest model was used to quantify overall accuracy [47]. The results of accuracy evaluation are presented in Table 2 below.
The Figure 3 below shows the study area, including the Itombwe Nature Reserve and its periphery. Five land cover classes were considered in the classification process: forest, savanna, fields, bare and built-up, and water. However, only the first three classes were taken into account for the calculation of landscape metrics (PLAND and LPI), as the other two represented negligible proportions of the total land cover. Figure 4 and Figure 5 highlight the landscape dynamics within the study area.

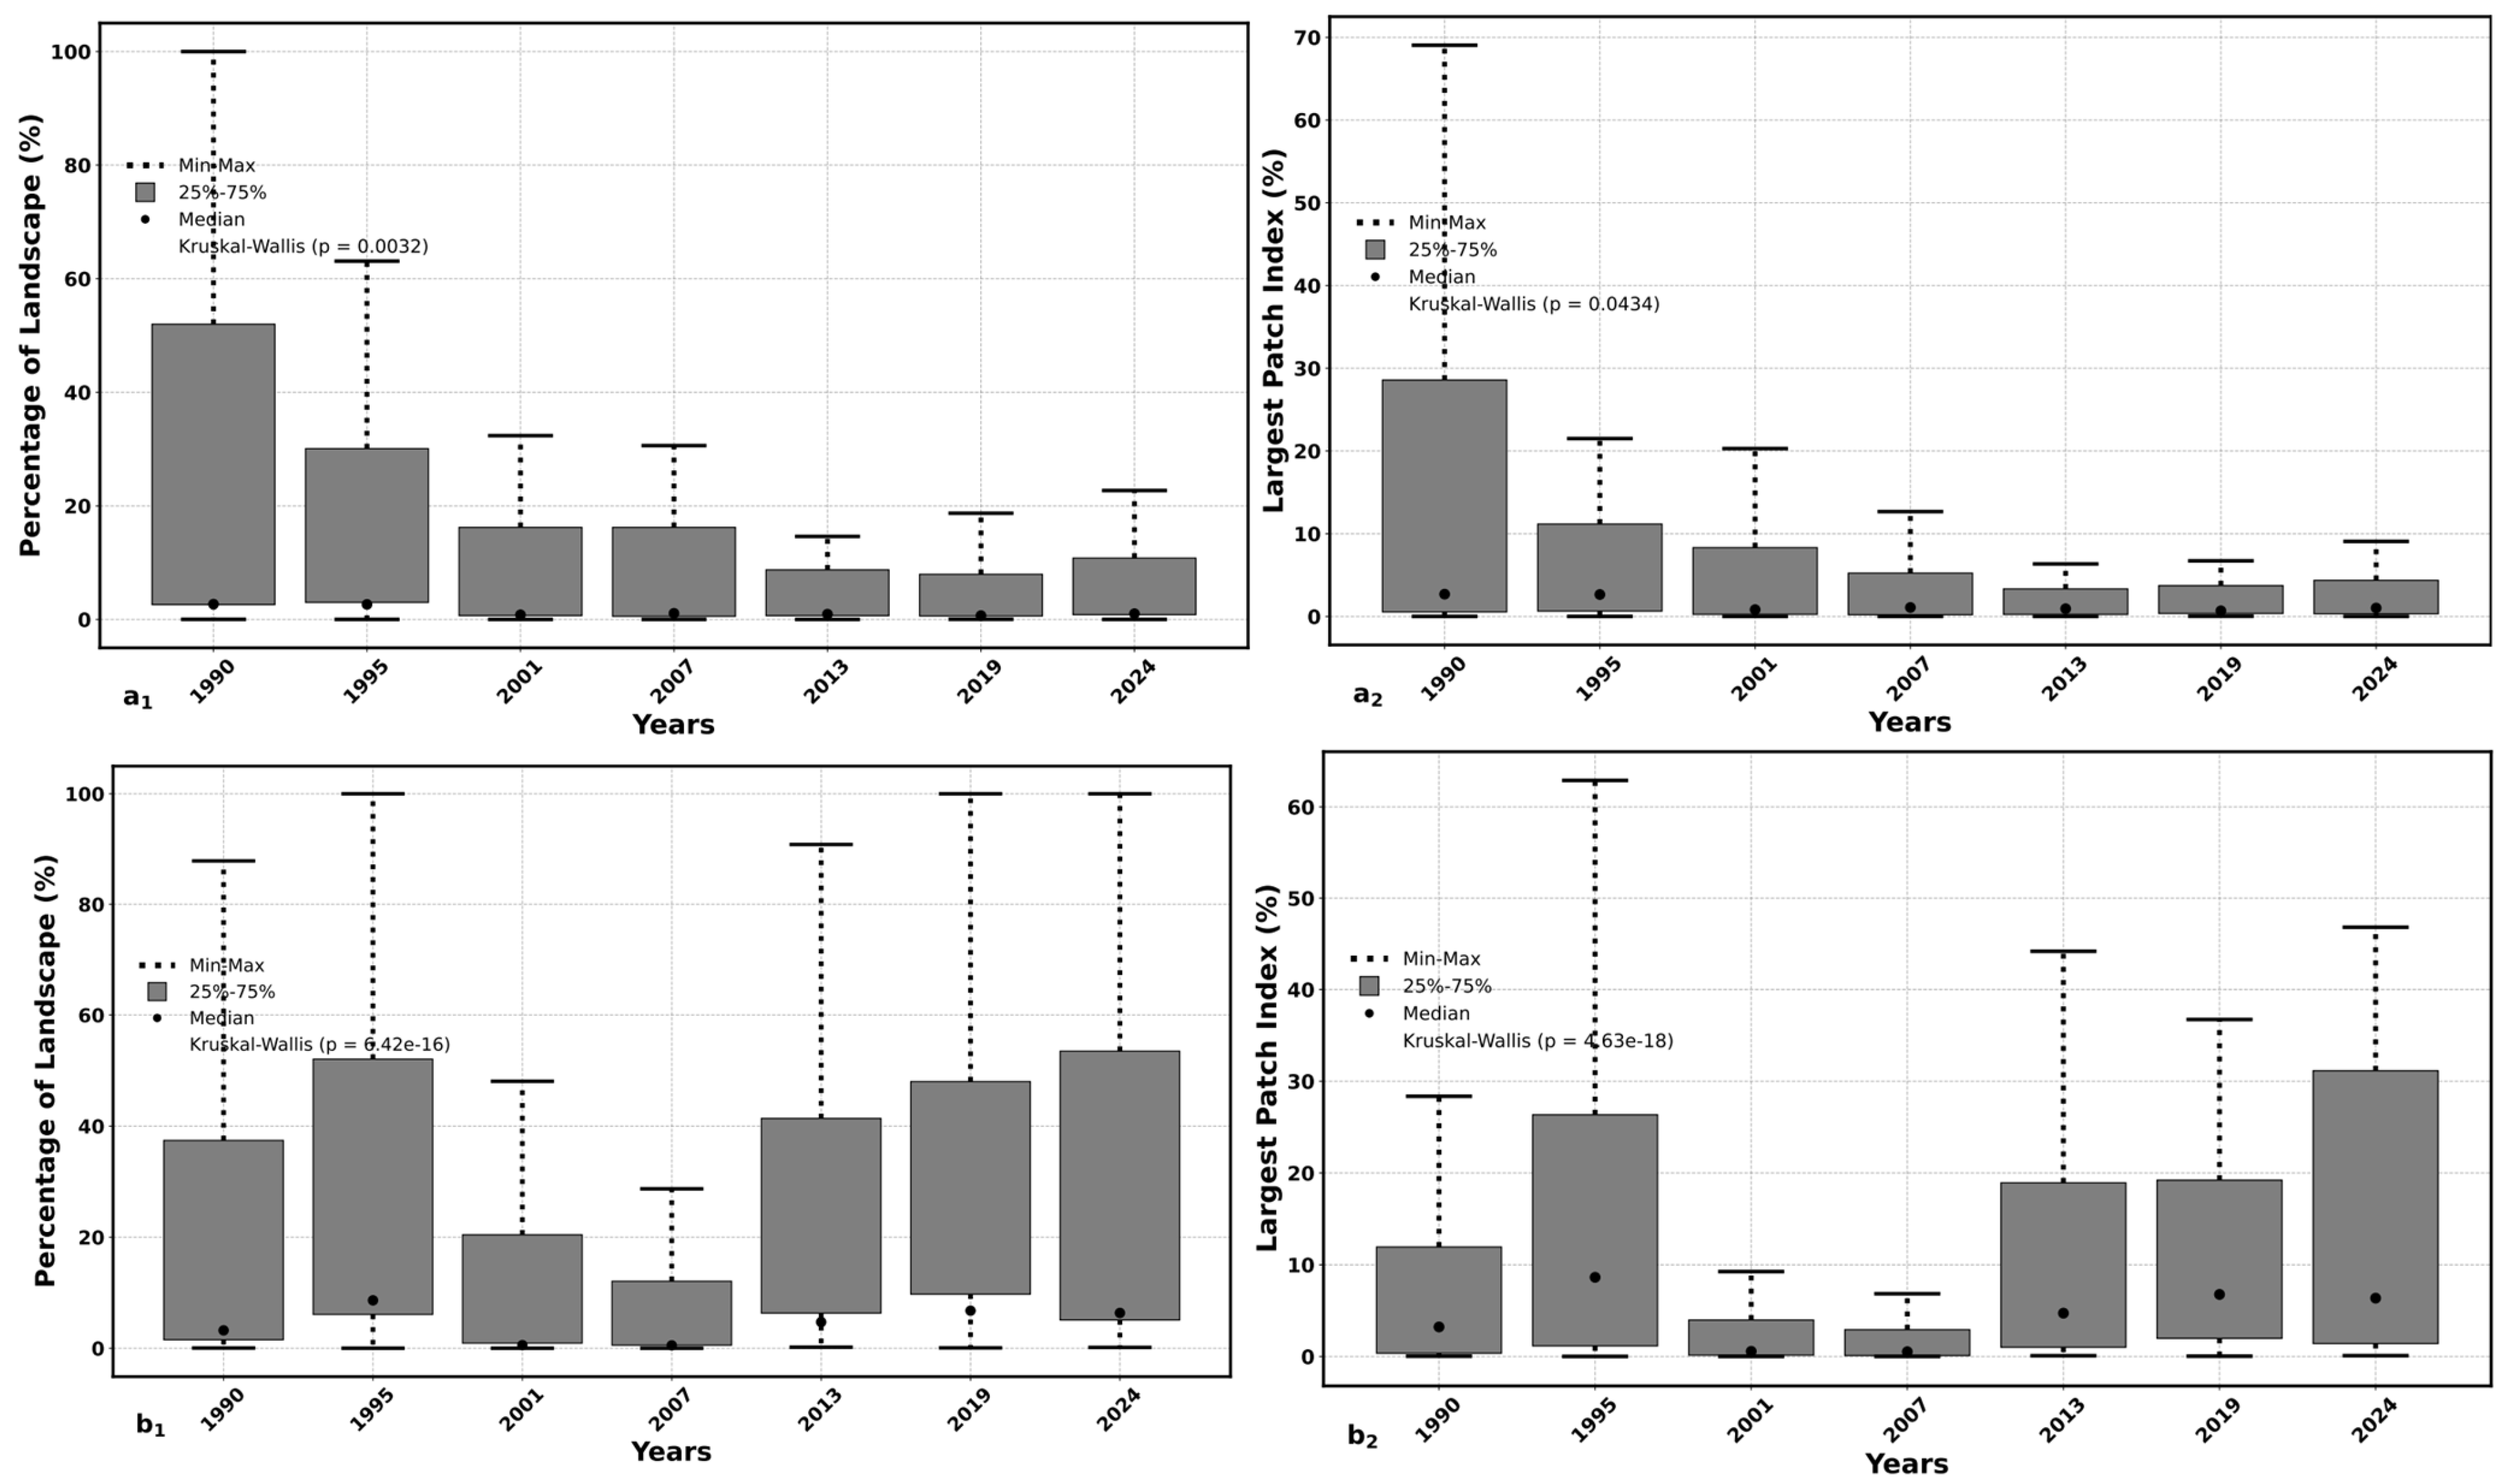
3.2. Annual Change at the Landscape Level of Itombwe Nature Reserve and Its Periphery from 1990 to 2014

At the landscape level, the diagrams reveal distinct land use alterations driven by human activities. In 1990, the PLAND for forests shows a high level of representation (median ~50%) and pronounced spatial heterogeneity. Between 1995 and 2001, there is a notable decline characterized by a pronounced drop in both the median and the variability. This loss may be linked to intensified human activities, such as agricultural encroachment, charcoal production, and war damage. From 2007 to 2024, forest cover stabilizes at a low level (10–20%), with moderate variability. The slight increase observed in 2024 remains marginal compared to the initial values. Conversely, in 1990, the LPI for forests reaches high values (up to 70%, median ~30%), reflecting the spatial dominance of this class in certain areas. Between 1995 and 2001, fragmentation intensifies, as evidenced by the decrease in the median (10–15%). From 2007 to 2024, the median stabilizes around 5% with reduced variability, indicating the advanced fragmentation of forest cover. These fluctuations indicate that the reserve’s forest lacks an intrinsic capacity for recovery without human intervention. It is only through the implementation of conservation measures stemming from human actions, such as agricultural expansion, charring, and war damage, that the reserve’s forest can be restored (Figure 4a1,a2).
Between 1990 and 2007, the PLAND for savannas shows a gradual decrease in both the median and variability, reaching ~5%, suggesting a continuous decline. From 2013 onward, the trend reverses, with a substantial increase in the median (from ~10 to 30%) and the maximum values reaching 100%, indicating spatial recovery in some areas. The increasing variability reflects rising spatial heterogeneity. In contrast, in 1990, the LPI for savannas exhibits a median of 10–15% and maximum values above 40%, indicating Moderate to high dominance depending on the site. In 1995, the median surpasses 20%, with the maximum values reaching 60%, reflecting spatial consolidation. This trend reverses between 2001 and 2007, with a sharp drop in the LPI (median < 5%), indicating increased fragmentation. From 2013 to 2024, the LPI remains low (5–10%), with a slight uptick, reflecting a still fragmented landscape. Given the documented fluctuations in the savannah, it is inevitable that the area will undergo conversion to a forest without human intervention, such as the promotion of agroforestry and silviculture. This assertion is substantiated by the observation that substantial transformations of savannahs tend to favor agricultural areas (Figure 4b1,b2).
In 1990, the PLAND for cropland shows a moderate median (5–10%) with noticeable variability. Between 1995 and 2007, it gradually increases (from ~10 to 15%) with greater dispersion, suggesting either slight expansion or enhanced spatial heterogeneity. From 2013 to 2019, the median rises (from ~15 to 25%) alongside substantial variability, indicating variable dominance across the sites. In 2024, the median reaches 35–40%, with a maximum of 100%, highlighting strong heterogeneity and near-exclusive occupation by this class in some sites. Furthermore, from 1990 to 2007, the LPI for cropland remains low (median < 5%), reflecting significant fragmentation. A slight increase is observed between 2013 and 2019 (median 5–10%), though no dominant patch emerges. In 2024, a significant shift occurs; the median exceeds 80%, with the peak values reaching 100%, indicating strong consolidation and near-complete landscape occupation by this class in certain areas (Figure 4c1,c2). In summary, the designated alterations in the forest, savannah, and agricultural components reveal a complex dynamic shaped by human activities. Statistical analyses (Kruskal–Wallis test, p  <  0.05) confirm that these temporal differences are significant.

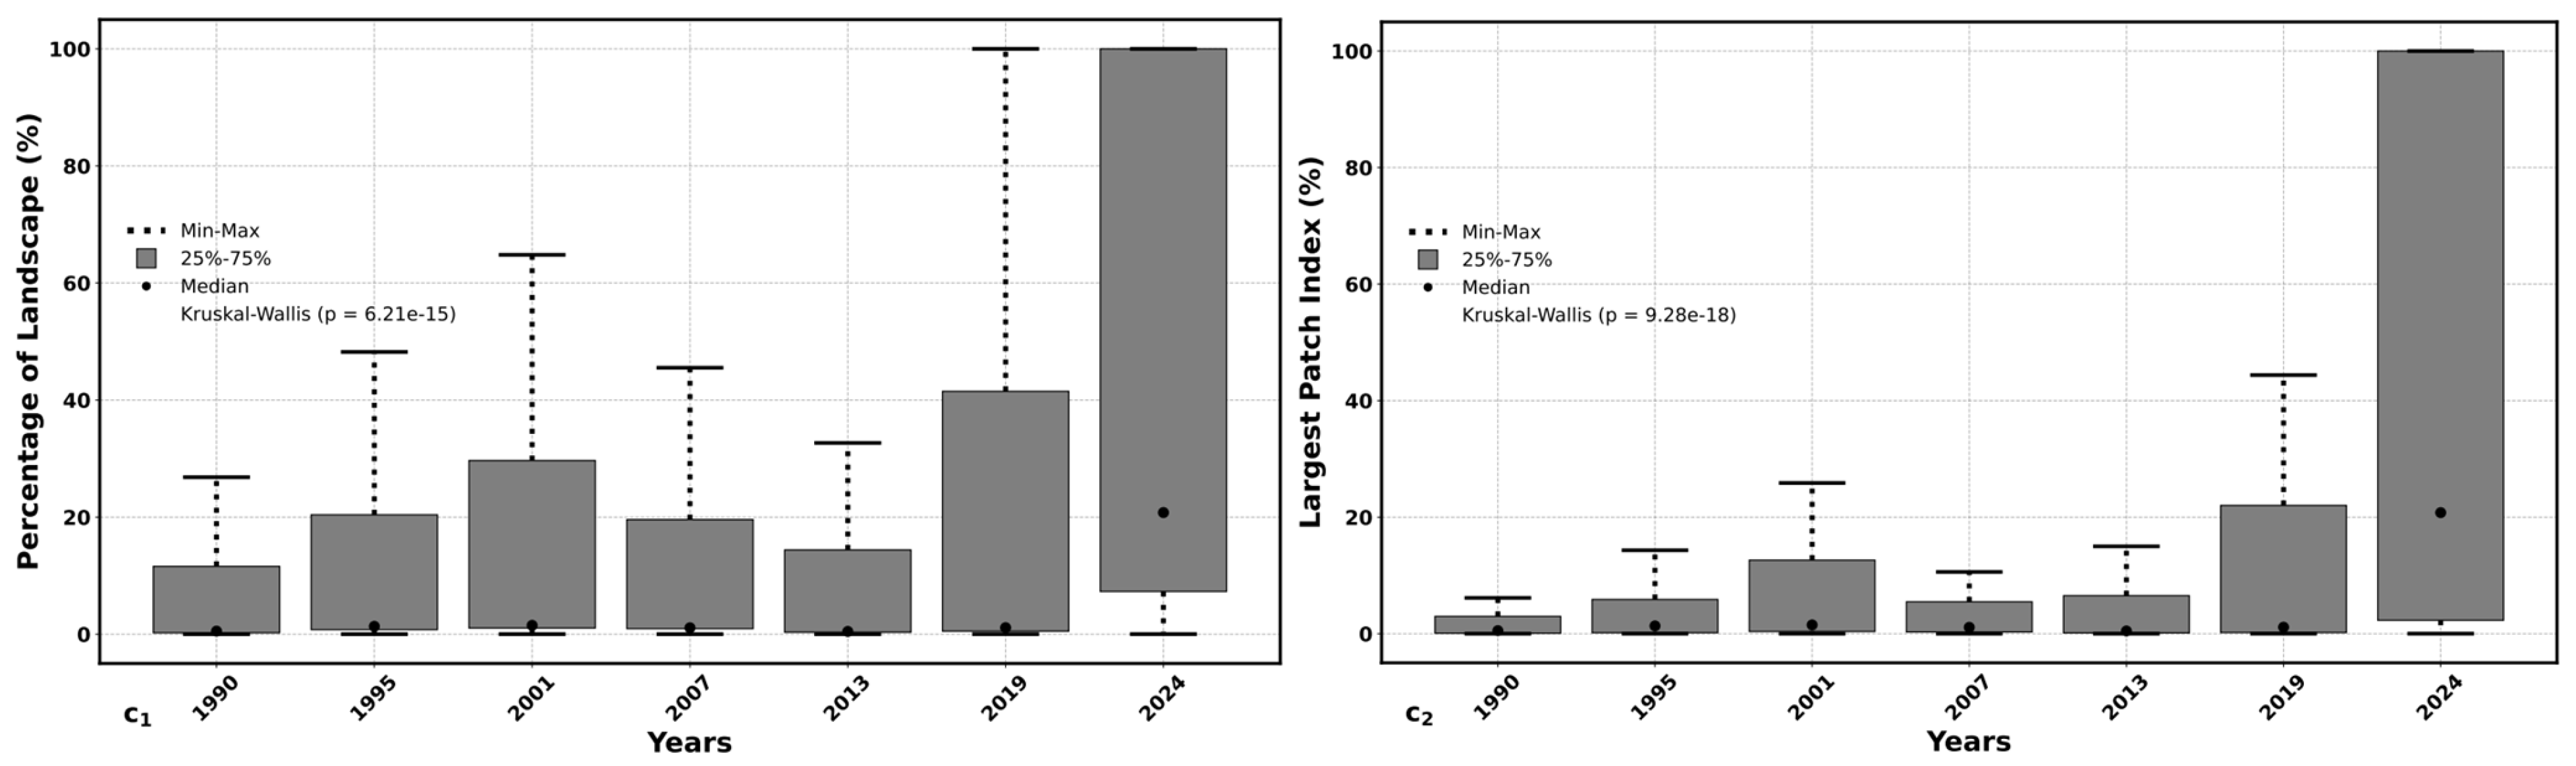
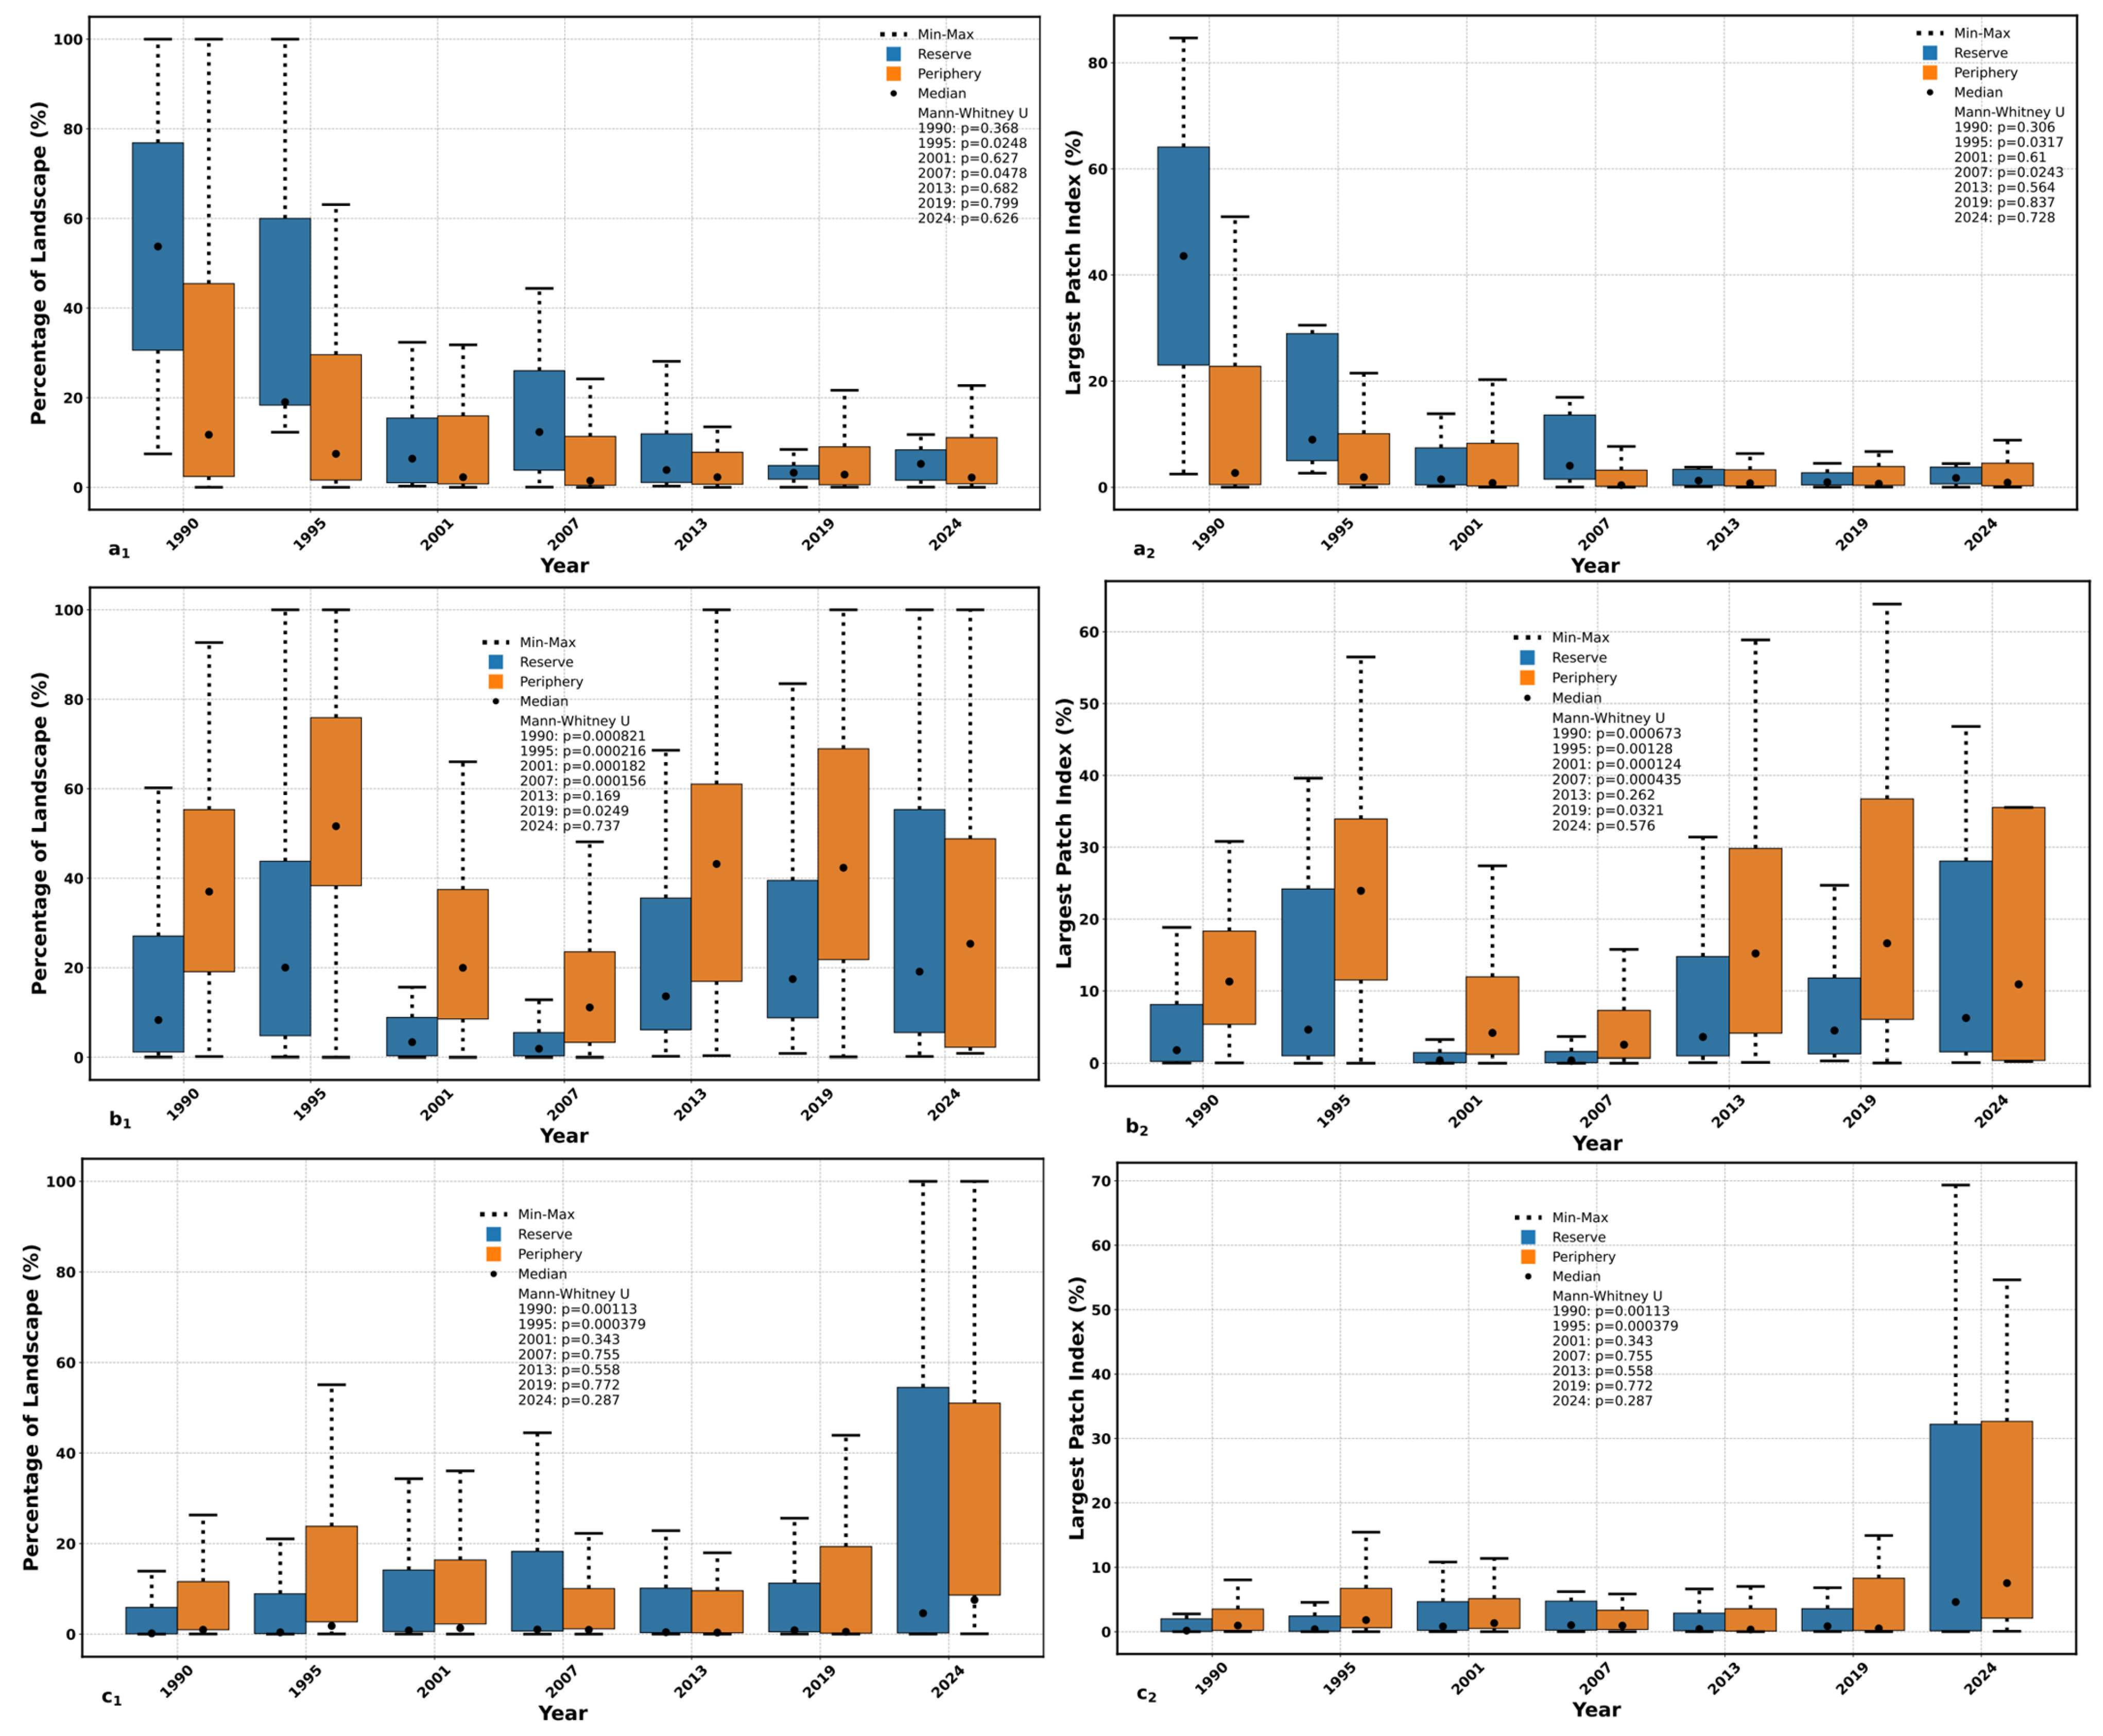
3.3. Annual Change in PLAND and LPI Between Reserve and Periphery

The analysis of the landscape metrics, the PLAND (proportion of landscape occupied) and the LPI (the relative size of the largest patch), highlights distinct dynamics between the reserve and periphery zones, depending on the landscape types (forest, savanna, and cropland) and the periods considered. In the forest landscape, the differences between the two zones are minor in 1990 and 2001 (p > 0.3), but significant disparities appear in 1995 and 2007 for both the indicators. In 1995, the reserve’s median PLAND was significantly lower than that of the periphery (p = 0.0248), as was its median LPI (p = 0.0317), while the periphery reached higher maximum values (100 % for PLAND and approximately 80 % for LPI). A similar pattern is observed in 2007 (p = 0.0478 for PLAND; p = 0.0243 for LPI). However, from 2013 onwards, the median and maximum values converge between the two zones, with no statistically significant differences, indicating a reduction in spatial contrasts (Figure 5a1,a2).
The differences between the reserve and the periphery are particularly pronounced in the savanna landscape from 1990 to 2007. The periphery consistently exhibits higher PLAND medians and maximum values, often reaching 100%, whereas the values in the reserve remain significantly lower (p < 0.001 throughout the period). A similar pattern is observed for the LPI, with higher median values in the periphery (~35–40%) compared to the reserve (~20–25%). The consistently low p-values (p < 0.00128) indicate a significantly stronger spatial dominance of large patches in the periphery (Figure 5b1,b2). Lastly, in the cropland landscape, similar disparities are found between 1990 and 1995; the PLAND medians in the periphery reach ~85–90%, versus ~35–40% in the reserve, and the LPI values are also higher (~70% vs. ~45%), with significant differences (p ranging from 0.00113 to 0.000379). From 2001 onward, the medians for both the indicators gradually converge (PLAND ≈ 55–70%, LPI ≈ 30–35%), and the differences between the zones are no longer statistically significant, suggesting the progressive homogenization of the landscape structure across the three land cover types (Figure 5c1,c2).

4. Discussion

4.1. Methodological Approaches

To understand the landscape dynamics, a combination of remote sensing, geographic information systems (GIS), landscape ecology, and field observations was employed. This study was structured into two distinct phases to better identify the land use trends over time and space; the first phase focused on the reserve itself, while the second examined its periphery (Figure 3).
The deforestation rates were assessed using recent tools, notably the Google Earth Engine [45]. This platform supports a wide variety of geospatial data, including Sentinel and early Landsat data, and offers complementary services accessible to all users, a particularly valuable feature for less-developed countries. Additionally, it provides advanced algorithms for analyzing large-scale geographic data within an interactive programming environment [45]. The supervised classification of the Landsat images based on the Random Forest algorithm yielded statistically acceptable accuracy values, with the validation indicators (including user and producer accuracy) further substantiating the reliability of the results [56,57,58].
This methodological approach enabled direct comparisons between the reserve and its periphery, facilitating the assessment of the effectiveness of management measures implemented by the reserve’s managers. Special attention was given to the dates coinciding with the reserve’s establishment to evaluate whether measures such as fencing have positively impacted forest resource conservation. The landscape changes were analyzed over 34 years using the 1990s, a decade marked by increased armed conflicts that severely impacted biodiversity, as a reference point.
The selection of landscape metrics was guided by their established reliability in quantifying human influence on landscape morphology [57,59]. Specifically, the PLAND (Percentage of Landscape) was used to quantify the proportion of each land cover class within each plot, and the LPI (Largest Patch Index) was used to measure the relative size of the largest contiguous patch, reflecting the degree of connectivity and the dominance of each class [32].
A total of 83 observation plots, each measuring 2.5 km on a side (6.25 km2), were selected to encompass all the cardinal and intercardinal directions (N, NE, E, SE, S, SW, W, and NW) around the reserve. This random, stratified sampling strategy minimized subjectivity in plot placement and ensured that no part of the reserve or its periphery was over- or under-represented, thereby accurately reflecting the landscape’s variability (Figure 2). The number of plots was determined based on preliminary assessments that balanced statistical robustness with practical considerations, aligning with this study’s primary goal of comparing landscape composition and configuration between the reserve and its periphery.
The thorough analysis of maps from 1990 to 2024 in both the zones enabled the testing of the hypothesis that the Itombwe Nature Reserve has experienced a substantial reduction in forest cover, alongside the expansion of savannah and agricultural areas, resulting in smaller, more fragmented forest patches. It was further posited that the reserve’s core retains larger, continuous forest patches compared to its periphery, where fragments are typically smaller and more scattered. By systematically comparing these two zones, critical insights have been contributed to the ongoing discourse on tropical forest conservation and sustainable land management, particularly regarding the cumulative impacts of agricultural encroachment, resource extraction, and socio-political instability.

4.2. Spatiotemporal Dynamics of the Itombwe Nature Reserve and Its Periphery Between 1990 and 2024

Diachronic analysis reveals that not all the land use classes have remained stable over time, a conclusion supported by the previous studies on the Itombwe Nature Reserve [25,26].
On the scale of the Itombwe Nature Reserve, despite the predominance of forests, there has been a notable regression, primarily in favor of savannahs. The regression of forest cover is significant from 2007 to 2024, with a peak between 2007 and 2013 and a period of stagnation between 2013 and 2024. The observed peak between 2007 and 2013, after the reserve’s establishment, suggests that the local population engaged in anarchic resource exploitation as a form of defiance against the reserve’s managers. This finding indicates that the designation of this forest as a reserve had not yet garnered the support of the local population, who regarded this decision as a form of expropriation. Overall, as highlighted by Habiyaremye et al. [18], the fencing of this area did not significantly reduce anthropogenic pressures on the reserve’s forest cover, underlining the persistence of illegal resource exploitation in the reserve. However, a discernible improvement was observed between 2013 and 2024, indicating relative stability in forest cover within the reserve. This suggests that the conservation measures are being strengthened, which is a positive development.
Conversely, the forest area exhibits a substantial decrease on the peripheral scale, with savannahs becoming the predominant class. The calculation of spatial structure indices reveals the spatial configuration of the class patches within the Itombwe Nature Reserve and its periphery. The initial process, referred to as savannization, manifested as the expansion in the total area of the savannah and the emergence of novel savannah patches within the landscape. The subsequent process refers to the degradation of the forest ecosystem [59].
The results on the annual changes in the PLAND and the LPI highlight the regression of forest in the study area (reserve and periphery) in favor of the progression of anthropogenic classes, predominantly savannahs, and to a lesser extent, fields. Muteya et al. [43] also concluded that forest regression had favored anthropogenic classes. In the study area, this forest regression was largely attributed to the exploitation of wood for charcoal production and timber by local communities, which corroborates the observation of Cabala et al. [60]. Furthermore, Bauters et al. [61] add that the excessive felling of trees in the forest has consequences for the functional composition of the forest. Additionally, the impact of subsistence agriculture practiced by the rural population in the study area is less significant compared to the high demand for wood [62,63].
Contrary to the findings of Buhendwa [26], which reported an average forest area of 83.99% for the Itombwe Nature Reserve between 1986 and 2020, this study demonstrates that between 1990 and 2024, the average area of the Itombwe Nature Reserve was 69.32%. This discrepancy can be attributed to the precision of the Random Forest classification algorithm employed in this study compared with the maximum likelihood method used in Buhendwa’s study because spatial analysis employing Random Forest classification provides superior accuracy in assessing land cover [50,51,52].
The PLAND and LPI indices showed a decreasing trend for forests over time, while they exhibited an increasing trend for savannahs, highlighting the ongoing process of anthropization across all the landscapes studied.
According to Ganza [25], anthropization persists in the Itombwe Nature Reserve landscape. It emphasizes the progressive degradation of primary forest in the Itombwe Nature Reserve, indicating an average loss of 14.93% of forest cover to secondary forests and savannahs between 1996 and 2019. These results corroborate those of other studies, including [4,64,65,66,67], which have shown the continuous regression of forest cover to other land use classes in different areas of the DRC.
Conversely, Plumptre [34] and Ganza [25] attribute this degradation to the practices of specific local ethnic groups in the Itombwe region, particularly the Nyindu and Shi peoples, who depend on the forest for medicinal plants, bushmeat, wild fruits, mushrooms, caterpillars, firewood and construction timber, slash-and-burn agriculture, and artisanal gold mining.
As previously mentioned by Muteya et al. [43], the intensification of human activities is the primary cause of variations in the forest landscape. Orékan [68] further asserts that the decline in forest formations, such as the conversion to fields, savannahs, and built-up areas, is frequently associated with population growth. Additionally, Kouta et al. [69] note that these variations are predominantly attributed to the increased demand for agricultural land and forest resources, particularly firewood, in contexts of high demographic pressure [70]. As is the case in other Central African countries, demographic expansion in the Democratic Republic of Congo (DRC) is often accompanied by political crises, armed conflicts, and migrations, which intensify shifting agriculture [71]. The wars of 1996 and 1998, led by the Alliance des Forces Démocratiques pour la Libération (AFDL), have been a major contributing factor to the destruction of protected areas in South Kivu [16]. For instance, within the Kahuzi-Biega National Park, there is documented evidence of the looting and destruction of fauna and flora.
In the study area, pressure on resources is occurring against the backdrop of a wave of armed conflicts that are set to continue, causing considerable damage to biodiversity. Furthermore, Habiyaremye et al. [18] emphasize that the alteration of the Itombwe Nature Reserve habitats is exacerbated by intensive and ongoing strategies to access raw materials through illicit channels, fueling devastating regional conflicts. It has been posited that mineral trafficking facilitates the engagement of armed groups operating within the region in criminal activities. The financial proceeds from such illicit activities, including the trafficking of coltan, cassiterite, gold, and other minerals, as well as the illegal trade of precious woods and animals, enable these groups to procure weapons, thereby significantly impeding efforts to conserve biodiversity. Furthermore, Shapiro et al. [72] add that the factors influencing forest disturbance in the DRC are often linked to localized armed conflicts, particularly in the east and center–west of the country, leading to significant forest degradation.
Moreover, the allure of illicit resource exploitation for forest populations in the Congo Basin is attributed to their precarious socioeconomic status, compelling individuals to clear forests for slash-and-burn agriculture and charcoal production [34,73].
Conversely, elevated levels of unemployment and pervasive poverty have been identified as the key factors contributing to the perpetuation of these traditional agricultural practices and the ongoing extraction of wood for energy purposes [74,75]. Deforestation will persist as long as the individuals entrusted with protecting these resources face persistent economic disadvantages [76,77,78,79]. Within the study area, the practice of artisanal logging for charcoal production to meet urban markets, particularly in Bukavu, has been identified as a significant contributor to deforestation [17].
In addition to the aforementioned activities, poaching and hunting represent further threats to the integrity of the natural ecosystems within the study area. These practices are particularly pervasive in the neighborhood of villages and gold-panners’ camps, resulting in the extermination or migration of substantial fauna. A notable observation is that in the highlands and eastern slopes of the Itombwe Mountains, where forest cover has nearly disappeared, hunters must traverse considerable distances to carry out a successful hunt [80].
The results of this study demonstrate that anthropogenic pressures escalated following fencing. Concurrently, the periphery experienced the substantial loss of forest cover during the observed period, likely attributable to heightened human activity following the reserve’s designation as off-limits. The depletion of forest resources within the reserve’s periphery could significantly impact its ecological integrity.
It is therefore imperative to reinforce conservation measures within the reserve and its periphery. As stated by Habiyaremye et al. [18], the Institut Congolais pour la Conservation de la Nature (ICCN) and its partners, including the WWF, have implemented various initiatives over the last two decades to alleviate the pressure on resources. These initiatives include the definition of forest conservation and management structures, with the long-term aim of protecting the biodiversity of the Itombwe Nature Reserve in collaboration with the local communities and the indigenous peoples. However, it appears that these efforts have not significantly reduced illegal activities within the reserve.
Contrary to the conclusions of the aforementioned authors, the relative stability of forest cover observed between 2013 and 2024 testifies to the success of conservation measures within the reserve. On the other hand, forest cover on the periphery decreased significantly during the period of reserve fencing.
The depletion of forest resources in the periphery will inevitably impact those within the reserve, as local communities will increasingly turn to the reserve to meet their subsistence needs for forest products.
In light of these considerations, Habiyaremye et al. [18] have proposed initiatives to develop infrastructure (e.g., hydroelectricity and micro-enterprises) to generate employment opportunities and enhance the quality of life for local communities. They further emphasize promoting activities such as ecotourism, which engages local communities, as a means of generating income that is significantly higher than that obtained from forestry activities, including tree felling and charcoal production. This could serve as a motivating factor to protect the reserve’s biodiversity. The success of these initiatives hinges on the pacification of the area.
To address the mounting demands of riparian communities for arable land, pasture, fuelwood, and NTFPs along the periphery, it is imperative to implement a series of measures, including the adoption and intensification of ecological agriculture and conservation techniques such as agroforestry, defined as any simultaneous or sequential association of trees, crops, and/or animals in the same production unit [81]. Acknowledging that agroforestry has yielded substantial outcomes in other regions is important. Djiongo et al. [82] revealed that farmers primarily use woody species in agroforestry systems for two primary purposes, fuelwood (66.5%) and food (63.7%), in the Sudano-Sahelian region surrounding protected areas. This practice contributes to enhancing farmers’ livelihoods by fostering an environment that is conducive to conserving both useful and endangered woody species. This approach has the potential to offer a diverse range of products and services that address the critical needs of local communities. Adopting these practices enables farmers to avoid using protected natural areas for their needs, thereby promoting sustainable resource management.

5. Conclusions

This study analyzed the spatiotemporal dynamics of the Itombwe Nature Reserve’s landscape and its periphery using remote sensing, geographic information systems (GISs), and landscape ecology. The changes between 1990 and 2024 were quantified using the PLAND and LPI indices. All the land use classes have undergone spatial transformation, both within the reserve and on its periphery.
The forest cover in the reserve declined from 78.4% in 1990 to approximately 60.2% in 2024, while on the periphery, it decreased from 37.5% in 1990 to around 21.4% in 2024. Concurrently, savannahs exhibit an increase from 17.7% to 29.5% within the reserve, while maintaining a strong prevalence on the periphery, with the figures rising from 53.9% in 1990 to 55.2% in 2024. Conversely, the presence of fields within the reserve has seen a notable increase, rising from 3.70% to 10.22%. On the periphery, this increase is even more pronounced, with a rise from 7.54% to 21.98%. Forest loss is primarily caused by anthropogenic disturbances. In the reserve, it is linked to logging and charcoal production, while in the periphery, it is due to logging and slash-and-burn agriculture.
Despite the loss of forest cover over the entire study period within the Itombwe Nature Reserve, forest cover remains dominant. This outcome suggests that the conservation measures implemented by the ICCN are effective. However, the ongoing rate of forest cover loss along the periphery indicates the potential for resource depletion within the reserve. This highlights the urgency for implementing appropriate conservation strategies within the periphery to avert this scenario. To conserve biodiversity, awareness must be raised, secondary forests should be established to meet the needs of local communities, agricultural practices must be improved with organic farming and agroforestry, and projects such as ecotourism must be promoted.
A series of measures must be considered to strengthen biodiversity conservation in the designated area. Among these measures are regulatory actions, which are of paramount importance. The existing laws and regulations must be reinforced and rigorously applied, with a particular emphasis on those governing land use planning, restrictions on resource exploitation, and the protection of wildlife and plant habitats. Additionally, public awareness must be raised among local communities, resource managers, and users. This can be achieved through trained volunteers, preferably members of environmental protection associations, who can convey the conservation objectives to the public. The following individuals and groups must be targeted for awareness-raising efforts:
-
Local authorities and communities, emphasizing the value of the ecosystems within and surrounding the reserve.
-
Peripheral landowners, emphasizing the importance of ensuring the conservation of their properties.
-
Loggers, emphasizing the impact of their practices on the reserve’s objectives.
-
Farmers and herders, emphasizing the impact of their activities on the region’s natural resources.
Consultation and memoranda of understanding: A concertation approach involving all stakeholders and establishing a memoranda of understanding have been shown to foster lasting relationships and collaborative management, thereby contributing to the conservation of natural resources.
Involving local communities in planning: Involving local communities in the development of the reserve, recognizing its socio-economic potential, has been demonstrated to encourage them to support conservation measures. Local volunteerism and participation in educational, recreational, or ecotourism activities can foster a sense of belonging and reinforce the reserve’s integration into its environment. Collectively, these measures can enhance reserve management and ensure the sustainable use of natural resources, while supporting local development.

Author Contributions

Conceptualization, C.B.C.; formal analysis, C.B.C., T.M.S., J.B.B. and N.C.C.; investigation, C.B.C.; methodology, C.B.C.; software, C.B.C.; supervision, H.T. and J.B.; validation, H.T. and J.B.; writing—original draft, C.B.C.; writing—review and editing, A.N., L.M.K., K.R.S., J.-P.M.M., J.-F.B., H.T. and J.B. All authors have read and agreed to the published version of the manuscript.

Funding

This research was funded by the Development Cooperation Instrument (DCI) N°41928 of the European Union, and the APC was funded by the ERAIFT-AGRINATURA consortium under the project “Capacity building for biodiversity practitioners, scientists, and policymakers for the sustainable management of protected areas and forest ecosystems in Africa”.

Data Availability Statement

The raw data supporting the conclusions of this article will be made available by the authors on request.

Acknowledgments

The authors would like to express their sincere gratitude to the European Union and the ERAIFT-AGRINATURA consortium for their financial support.

Conflicts of Interest

The authors declare no conflicts of interest.

References

  1. Aveling, C. Le Patrimoine Mondial dans le Bassin du Congo; Centre du Patrimoine Mondial de L’unesco: Paris, France, 2010; 64p. [Google Scholar]
  2. Barima, Y.S.S.; Barbier, N.; Bamba, I.; Traoré, D.; Lejoly, J.; Bogaert, J. Dynamique paysagère en milieu de transition forêt-savane ivoirienne. Bois For. Trop. 2009, 299, 15. [Google Scholar] [CrossRef]
  3. Lawson, S. L’exploitation illégale des forêts en République démocratique du Congo. Énerg. Environ. Ressour. 2014, 3, 34. [Google Scholar]
  4. Potapov, P.V.; Turubanova, S.A.; Hansen, M.C.; Adusei, B.; Broich, M.; Altstatt, A.; Mane, L.; Justice, C.O. Quantifying forest cover loss in the Democratic Republic of the Congo, 2000–2010, with Landsat ETM+ data. Remote Sens. Environ. 2012, 122, 106–116. [Google Scholar] [CrossRef]
  5. Karsenty, A. Géopolitique des forêts d’Afrique centrale. Hérodote 2020, 179, 108–129. [Google Scholar] [CrossRef]
  6. Ntoto, M.; Carine, V.; Maurice, M.L.; Roger, N.M.; Makaya, K.; Carine, K.B. Les enjeux socioéconomiques et écologiques de la production du charbon de bois dans la peripherie de la ville de boma en RDC Résumé: Socioeconomics and ecologicals issues of charcoal production in Boma’s outskirts (DRCongo). Int. J. Water Environ. Sci. Technol. 2021, 6, 42–54. [Google Scholar]
  7. Mayaux, P.; Gond, V.; Massart, M.; Pain-orcet, M.; Achard, F. Évolution du couvert forestier du bassin du Congo mesurée par télédétection spatiale Des projets d’ aménagement forestier Remote Sensing to Measure in the Congo Basin. Bois For. Trop. 2003, 277, 45–52. [Google Scholar]
  8. Butsic, V.; Baumann, M.; Shortland, A.; Walker, S.; Kuemmerle, T. Conservation and conflict in the Democratic Republic of Congo: The impacts of warfare, mining, and protected areas on deforestation. Biol. Conserv. 2015, 191, 266–273. [Google Scholar] [CrossRef]
  9. Salomon, W.; Sikuzani, Y.U.; Kouakou, A.T.M.; Barima, Y.S.S.; Theodat, J.M.; Bogaert, J. Mapping and quantification of the loss of forest cover in the national parks of the South of the Republic of Haiti from 1985 to 2018: Role of local agricultural activities. Int. J. Biol. Chem. Sci. 2021, 15, 477–496. [Google Scholar] [CrossRef]
  10. Malhi, Y.; Roberts, J.T.; Betts, R.A.; Killeen, T.J.; Li, W.; Nobre, C.A. Climate Change, Deforestation, and the Fate of the Amazon. Science 2008, 319, 169–172. [Google Scholar] [CrossRef]
  11. Thompson, I.D.; Okabe, K.; Tylianakis, J.M.; Kumar, P.; Brockerhoff, E.G.; Schellhorn, N.A.; Parrotta, J.A.; Nasi, R. Forest Biodiversity and the Delivery of Ecosystem Goods and Services: Translating Science into Policy. BioScience 2011, 61, 972–981. [Google Scholar] [CrossRef]
  12. Kipute, D.D.; Mampeta, S.W.; Kahindo, J.M.M.; Lelo, U.D.M.; Kankeu, R.S.; Sonwa, J.D.; Joiris, V.; Mate, J.-P. Complexity of Zoning Management in Biosphere Reserves: The Case of the Yangambi Biosphere Reserve in, D.R.C. Int. For. Rev. 2021, 23, 55–67. [Google Scholar] [CrossRef]
  13. Jayne, T.; Fox, L.; Fuglie, K.; Adelaja, A.; Anderson, P.; Ash, J.; Bertram, R.; Brooks, K.; Cohen, C.; Deaton, B.; et al. Agricultural Productivity Growth, Resilience, and Economic Transformation in Sub-Saharan Africa Implications for USAID Documents; USAID: Washington, DC, USA, 2021. [Google Scholar]
  14. Masolele, R.N.; Marcos, D.; De Sy, V.; Abu, I.O.; Verbesselt, J.; Reiche, J.; Herold, M. Mapping the diversity of land uses following deforestation across Africa. Sci. Rep. 2024, 14, 1681. [Google Scholar] [CrossRef]
  15. Ansoms, A.; Nyenyezi Bisoka, A.; Vandeginste, S. Conjonctures de l’Afrique Centrale 2018; L’Harmattan: Paris, France, 2018; pp. 117–231. [Google Scholar]
  16. Mudinga, E.M.; Ngendakumana, S.; Ansoms, A. Analyse critique du processus de cogestion du parc national de Kahuzi-Biega en République Démocratique du Congo. VertigO Rev. Électron. Sci. L’environ. 2013. [Google Scholar] [CrossRef]
  17. Rainforest Foundation Norway. Cartographie 3D: Un Outil de Planification et de Gestion Pour la Réserve D’itombwe-Livre Vert de la Modélisation Participative en Trois Dimensions. 2016. Available online: http://www.fpa2.com (accessed on 16 August 2016).
  18. Habiyaremye, F.; Mugoli, E.; Mubalama, L.; Masumbuko, C. Connaître leur état à l’aide d’un lexique des plantes dominantes. In Habitats de la Réserve Naturelle d’Itombwe; RBINS: Bruxelles, Belgium, 2024. [Google Scholar]
  19. Barima, Y.S.S.; Kouakou, A.T.M.; Bamba, I.; Sangne, Y.C.; Godron, M.; Andrieu, J.; Bogaert, J. Cocoa crops are degrading the forest reserves of the classified forest in Haut-Sassandra, Ivory Coast. Glob. Ecol. Conserv. 2016, 8, 85–98. [Google Scholar] [CrossRef]
  20. Kyale, K.J.; Wardell, D.A.; Mikwa, J.-F.; Masimo, J.K.; Maindo, M.N.A.; Oszwald, J.; Charles Doumeng, C. Dynamique de la déforestation dans la Réserve de biosphère de Yangambi (République démocratique du Congo): Variabilité spatiale et temporelle au cours des 30 dernières années. Bois For. Trop. 2019, 341, 15–28. [Google Scholar] [CrossRef]
  21. Cabral, A.I.R.; Vasconcelos, M.J.; Oom, D.; Sardinha, R. Spatial dynamics and quantification of deforestation in the central-plateau woodlands of Angola (1990–2009). Appl. Geogr. 2010, 31, 1185–1193. [Google Scholar] [CrossRef]
  22. Havyarimana, F.; Bamba, I.; Barima, Y.S.S.; Masharabu, T.; Nduwarugira, D.; Bigendako, M.-J.; De Cannière, C. La contribution des camps des déplacés à la dynamique paysagère au Sud et au Sud-Est du Burundi. Tropicultura 2018, 36, 243–257. [Google Scholar] [CrossRef]
  23. Busset, G. Evaluations des Impacts Environnementaux en Période de Conflits Armés: Cas de la Sierra Leone et du Soudan; Universitaires Europeennes: London, UK, 2009. [Google Scholar]
  24. Muteya, H.K.; Mukenza, M.M.; Mwenya, I.K.; Malaisse, F.; Nghonda, D.D.N.T.; Mukendi, N.K.; Bogaert, J. Protected area creation and its limited effect on deforestation: Insights from the Kiziba-Baluba hunting domain (DR Congo). Trees People 2024, 18, 100654. [Google Scholar] [CrossRef]
  25. Ganza, M. Analyse de la Dynamique du Couvert Forestier de la Réserve Naturelle D’itombwe en, R.D.Congo. Master’s Thesis, Aménagement et Gestion Intégrés des Forêts et Territoires Tropicaux, ERAIFT, Kinshasa, Democratic Republic of the Congo, 2019. [Google Scholar]
  26. Buhendwa, E. Identification des Facteurs de Dégradation Forestières et Déboisement dans le Paysage de la RNI Entre 1986 et 2020. Master’s Thesis, Aménagement et Gestion Intégrés des Forêts et Territoires Tropicaux, ERAIFT, Kinshasa, Democratic Republic of the Congo, 2021. [Google Scholar]
  27. Siaka, O. Problématique de Gestion du Parc National du W du Niger Face aux Pressions Anthropiques: Cas des îles de Karey Kopto, de Tondey et de Birigambou. Mémoire de fin d’étude CRESA, Faculté d’Agronomie, UAM, Niamey, Niger, 2004; 79p. [Google Scholar]
  28. Moussa, M.S.; Amadou, B.; et Waziri, M.M. Les Dynamiques Associatives Locales dans la Gestion des Ressources Naturelles des Aires Protégées dans un Contexte de Décentralisation: Expérience de la Commune Rurale de Falmey en Périphérie du Parc du «W» au Niger; Revue, T.S.E., Ed.; Université de Zinder: Zinder, Niger, 2013; pp. 107–127. [Google Scholar]
  29. Oszwald, J.; Gond, V.; Dolédec, S.; Lavelle, P. Identification d’indicateurs de changement d’occupation du sol pour le suivi des mosaïques paysagères. Bois For. Trop. 2011, 307, 7. [Google Scholar] [CrossRef]
  30. Tsewoue, M.R.; Tchamba, M.; Avana, M.L.; Tanougong, A.D. Dynamique spatio temporelle de l’occupation du sol dans le Moungo, Région du Littoral, Cameroun: Influence sur l’expansion des systèmes agroforestiers à base de bananiers. Int. J. Biol. Chem. Sci. 2020, 14, 486–500. [Google Scholar] [CrossRef]
  31. Useni, S.Y.; Khoji, M.H.; Bogaert, J. Miombo woodland, an ecosystem at risk of disappearance in the Lufira Biosphere Reserve (Upper Katanga, DR Congo)? A 39-year analysis based on Landsat images. Glob. Ecol. Conserv. 2020, 24, e01333. [Google Scholar] [CrossRef]
  32. Balandi, J.B.; To Hulu, J.-P.P.M.; Sambieni, K.R.; Sikuzani, Y.U.; Bastin, J.-F.; Musavandalo, C.M.; Nguba, T.B.; Jesuka, R.; Sodalo, C.; Pika, L.M.; et al. Anthropogenic Effects on Green Infrastructure Spatial Patterns in Kisangani City and Its Urban–Rural Gradient. Land 2024, 13, 1794. [Google Scholar] [CrossRef]
  33. MDE. Sixième Rapport National sur la Biodiversité d’Haïti. gef/CBD/6NR/UNDP. Ministère de L’Environnement. Direction de la Biodiversité. 2019. Available online: https://www.cbd.int/doc/nr/nr-06/ht-nr-06-fr.pdf (accessed on 6 May 2021).
  34. Plumptre, J.A.; Davenport, T.R.B.; Behangana, M.; Robert Kityo, R.; Eilu, G.; Ssegawa, P.; Ewango, C.; Meirte, D.; Kahindo, C.; Herremans, M.; et al. Biodiversity of Albertine Rift. Biol. Conserv. 2007, 134, 178–194. [Google Scholar] [CrossRef]
  35. ICCN/RNI. Plan d‘Aménagement et de Gestion de la Reserve Naturelle d‘Itombwe, 2018–2027; Elaboré par l‘ICCN Avec l‘appui financier et technique de WWF-RDC et ses partenaires; ICCN/RNI: Mwenga, Democratic Republic of Congo, 2018; 140p. [Google Scholar]
  36. Doumenge, C.; Schilter, C. Les Monts Itombwe; UICN: Kinshasa, Democratic Republic of the Congo, 1997. [Google Scholar]
  37. Greenbaum, E.; Chifundera, K. Conservation implications following the rediscovery of four frog species from the Itombwe Natural Reserve, eastern Democratic Republic of the Congo. Herpetol. Rev. 2012, 43, 253. [Google Scholar]
  38. Mubalama, L.; Atalia, G.; Mitamba, G.; Wilondja, B. Utiliser le SIG pour accéder aux informations sur le statut et la conservation des gros mammifères dans le paysage de Conservation du Massif d’Itombwe en République Démocratique du Congo. Nat. Faune 2008, 23, 43–50. [Google Scholar]
  39. Prigogine, A. Conservation of the avifauna of the forests of the Albertin Rift. In Conservation of Tropical Forest Birds; Diamond, A.W., Lovejoy, T.E., Eds.; ICBP Technical Publication No 4; International Council for Bird Preservation: Cambridge, UK, 1985; pp. 275–295. [Google Scholar]
  40. WWF for a Living Planet. Termes of Reference Project Number 40000357 Itombwe WWF NL. Kinshasa. 2015. Available online: https://wwfeu.awsassets.panda.org/downloads/consultant_conservation_program_itombwe__drc.pdf (accessed on 15 December 2015).
  41. Union Internationale Pour la Conservation de la Nature. Parcs et Réserves de la République Démocratique du Congo: Évaluation de L’efficacité de Gestion des Aires Protégées; UICN/PACO: Ouagadougou, Burkina Faso, 2010; 149p. [Google Scholar]
  42. Bahati, J.M. Rôle des Savoirs Traditionnels dans L’approche Participative en Gestion des Aires Protégées. Cas de la Réserve Naturelle d’Itombwe (Sud-Kivu, RDC). Master’s Thesis, Aménagement et Gestion intégrés des Forêts et Territoires Tropicaux, ERAIFT, Kinshasa, Democratic Republic of the Congo, 2012. [Google Scholar]
  43. Muteya, H.K.; Nghonda, D.D.N.T.; Kalenda, F.M.; Strammer, H.; Kankumbi, F.M.; Malaisse, F.; Bastin, J.F.; Sikuzani, Y.U.; Bogaert, J. Mapping and Quantification of Miombo Deforestation in the Lubumbashi Charcoal Production Basin (DR Congo): Spatial Extent and Changes between 1990 and 2022. Land 2023, 12, 1852. [Google Scholar] [CrossRef]
  44. Gorelick, N.; Hancher, M.; Dixon, M.; Ilyushchenko, S.; Thau, D.; Moore, R. Google Earth Engine: Planetary-scale geospatial analysis for everyone. Remote Sens. Environ. 2017, 202, 18–27. [Google Scholar] [CrossRef]
  45. Shelestov, A.; Lavreniuk, M.; Kussul, N.; Novikov, A.; Skakun, S. Exploring Google Earth Engine platform for big data processing: Classification of multi-temporal satellite imagery for crop mapping. Front. Earth Sci. 2017, 5, 232994. [Google Scholar] [CrossRef]
  46. Wang, J.; Duncan, D.; Shi, Z.; Zhang, B. WEB-based gene set analysis toolkit (WebGestalt): Update 2013. Nucleic Acids Res. 2013, 41, W77–W83. [Google Scholar] [CrossRef]
  47. Zhao, Q.; Yu, L.; Li, X.; Peng, D.; Zhang, Y.; Gong, P. Progress and trends in the application of Google Earth and Google Earth Engine. Remote Sens. 2021, 13, 3778. [Google Scholar] [CrossRef]
  48. Noi Phan, T.; Kuch, V.; Lehnert, L.W. Land cover classification using Google Earth Engine and Random Forest: The Role of Image Composition. Remote Sens. 2020, 12, 2411. [Google Scholar] [CrossRef]
  49. Kouassi, J.A.; Kablan, Y.A.; Bachmann, M.E.; Lemoine, S.R.; Nielsen, M.R.; Koné, I. Determinants of bushmeat supply sources in rural areas of Côte d’Ivoire. J. Nat. Conserv. 2023, 72, 126330. [Google Scholar] [CrossRef]
  50. Breiman, L. Random forests. Mach. Learn. 2001, 45, 5–32. [Google Scholar] [CrossRef]
  51. Xia, G.S.; Hu, J.; Hu, F.; Shi, B.; Bai, X.; Zhong, Y.; Zhang, L.; Lu, X. AID: A benchmark data set for performance evaluation of aerial scene classification. IEEE Trans. Geosci. Remote Sens. 2017, 55, 3965–3981. [Google Scholar] [CrossRef]
  52. Gislason, P.O.; Benediktsson, J.A.; Sveinsson, J.R. Random forests for land cover classification. Pattern Recognit. Lett 2006, 27, 294–300. [Google Scholar] [CrossRef]
  53. Hayes, G.P.; Herman, M.W.; Barnhart, W.D.; Furlong, K.P.; Riquelme, S.; Benz, H.M.; Bergman, E.; Barrientos, S.; Earle, P.S.; Samsonov, S. Continuing megathrust earthquake potential in Chile after the 2014 Iquique earthquake. Nature 2014, 512, 295–298. [Google Scholar] [CrossRef]
  54. Zeferino, L.B.; de Souza, L.F.T.; do Amaral, C.H.; Fernandes Filho, E.I.; de Oliveira, T.S. Does environmental data increase the accuracy of land use and land cover classification? Int. J. Appl. Earth Obs. Geoinf. 2020, 91, 102128. [Google Scholar] [CrossRef]
  55. Bogaert, J.; Zhou, L.; Tucker, C.J.; Myneni, R.B.; Ceulemans, R. Evidence for a persistent and extensive greening trend in Eurasia inferred from satellite vegetation index data. J. Geophys. Res. Atmos. 2002, 107, ACL-4. [Google Scholar] [CrossRef]
  56. Wu, J. Effects of changing scale on landscape pattern analysis: Scaling relations. Landsc. Ecol. 2004, 19, 125–138. [Google Scholar] [CrossRef]
  57. Foody, G.M. Ground reference data error and the mis-estimation of the Area of land cover change as a function of its abundance. Remote Sens. Lett 2013, 4, 783–792. [Google Scholar] [CrossRef]
  58. Olofsson, P.; Foody, G.M.; Herold, M.; Stehman, S.V.; Woodcock, C.E.; Wulder, M.A. Good Practices for Estimating Area and Assessing Accuracy of Land Change. Remote Sens. Environ. 2014, 148, 42–57. [Google Scholar] [CrossRef]
  59. Muteya, H.K.; Nghonda, D.-D.N.; Malaisse, F.; Waselin, S.; Sambiéni, K.R.; Kaleba, S.C.; Kankumbi, F.M.; Bastin, J.-F.; Bogaert, J.; Sikuzani, Y.U. Quantification and Simulation of Landscape Anthropization around the Mining Agglomerations of Southeastern Katanga (DR Congo) between 1979 and 2090. Land 2022, 11, 850. [Google Scholar] [CrossRef]
  60. Cabala, K.S.; Useni, S.Y.; Munyemba, K.F.; Bogaert, J. Activités anthropiques et dynamique spatiotemporelle de la forêt claire dans la Plaine de Lubumbashi. In Anthropisation des Paysages Katangais; Bogaert, J., Colinet, G., Mahy, G., Eds.; Les Presses Universitaires de Liège: Liège, Belgique, 2018; pp. 253–266. [Google Scholar]
  61. Bauters, M.; Drake, T.W.; Wagner, S.; Baumgartner, S.; Makelele, I.A.; Bodé, S.; Verheyen, K.; Verbeeck, H.; Ewango, C.; Cizungu, L.; et al. Fire-derived phosphorus fertilization of African tropical forests. Nat. Commun. 2021, 12, 5129. [Google Scholar] [CrossRef]
  62. Kaleba, S.C.; Sikuzani, Y.U.; Yamba, A.M.; Kankumbi, F.M.; Bogaert, J. Anthropogenic activities and dynamics of forest ecosystems in the territorial areas of Katangan copper belt (KCB) (DR Congo). Tropicultura 2022, 40, 1–27. [Google Scholar]
  63. Bamba, I. Anthropisation et Dynamique Spatio-Temporelle de Paysages Forestiers en République Démocratique du Congo. Ph.D. Thesis, Université Libre de Bruxelles, Bruxelles, Belgique, 2010; 186p. [Google Scholar]
  64. Molinario, G.; Hansen, M.C.; Potapov, P.V. Forest cover dynamics of shifting cultivation in the Democratic Republic of Congo: Remote sensing-based assessment for 2000–2010. Environ. Res. Lett. 2015, 10, 9. [Google Scholar] [CrossRef]
  65. Kalambay, B.M.; Rudant, J.P.; Lumbuenamo, R.; Beland, M.; Riera, B. Dynamique spatiale du domaine de chasse et réserve de Bombo Lumene entre 2000 et 2015 par imagerie satellitaire optique. Int. J. Innov. Appl. Stud. 2016, 18, 559–568. [Google Scholar]
  66. Kabuanga, J.M.; Adipalina Guguya, B.; Ngenda Okito, E.; Maestripieri, N.; Saqalli, M.; Rossi, V.; Iyongo Waya Mongo, L. Suivi de l’anthropisation du paysage dans la région forestière de Babagulu, République Démocratique du Congo. VertigO Rev. Électron. Sci. L’environ. 2020. Available online: http://journals.openedition.org/vertigo/28347 (accessed on 23 August 2023). [CrossRef]
  67. Kimvula, J.M.; Luzolo, J.T.T.; Muke, M.K.; Tango, E.K.; Ayingweu, C.L. Dynamique de l’occupation du sol à la station forestière de l’INÉRA Kiyaka, Kwilu, République Démocratique du Congo. VertigO Rev. Électron. Sci. L’environ. 2023. [Google Scholar] [CrossRef]
  68. Orékan, V. Implémentation du Modèle Local CLUE-s Aux Transformations Spatiales dans le Centre Bénin Aux Moyens de Données Socio-Économiques et de Télédétection. Ph.D. Thesis, Université de Bonn, Bonn, Germany, 2007. [Google Scholar]
  69. Kouta, S.; Imorou, I.T. Forest landscape dynamics in the cotton basin of North Benin. Int. J. For. Anim. Fish Res. 2019, 3, 195–202. [Google Scholar] [CrossRef]
  70. Zakari, S.; Imorou, I.T.; Thomas, O.A.B.; Djaouga, M.; Arouna, O. Application de la Télédétection et du Sig au Suivi des Formations Végétales de la Forêt Classée des Trois Rivières au Nord-Est du Bénin. Eur. Sci. J. ESJ 2018, 14, 450. [Google Scholar] [CrossRef]
  71. Tyukavina, A.; Hansen, M.C.; Potapov, P.; Parker, D.; Okpa, C.; Stehman, S.V.; Kommareddy, I.; Turubanova, S. Congo Basin forest loss dominated by increasing smallholder clearing. Sci. Adv. 2018, 4. [Google Scholar] [CrossRef] [PubMed]
  72. Shapiro, A.C.; Bernhard, K.P.; Zenobi, S.; Müller, D.; Aguilar-Amuchastegui, N.; d’Annunzio, R. Proximate causes of forest degradation in the Democratic Republic of the Congo vary in space and time. Front. Conserv. Sci. 2021, 2, 690562. [Google Scholar] [CrossRef]
  73. Akkermans, T.; Van Rompaey, A.; Van Lipzig, N.; Moonen, P.; Verbist, B. Quantifying successional land cover after clearing of tropical rainforest along forest frontiers in the Congo Basin. Phys. Geogr. 2023, 34, 417–440. [Google Scholar] [CrossRef]
  74. Sonter, L.J.; Moran, C.J.; Barrett, D.J.; Soares-Filho, B.S. Processes of land use change in mining regions. J. Clean. Prod. 2014, 84, 494–501. [Google Scholar] [CrossRef]
  75. Burgi, M.; Hersperger, A.M.; Schneeberger, N. Driving forces of landscape change—Current and new directions. Landsc. Ecol. 2004, 19, 857–868. [Google Scholar] [CrossRef]
  76. Mangion, I. Le Futur Mécanisme REDD Face Aux Moteurs de la Déforestation et de la Dégradation des Forêts au Brésil, en Indonésie et en, R.D.C. Master’s Thesis, Université Libre de Bruxelles. Institut de Gestion de l’Environnement et d’Aménagement du Territoire, Bruxelles, Belgium, 2010; 152p. [Google Scholar]
  77. Benoit, M. Quelles «Mesures» Pour Quantifier la Pauvreté? Marie-Françoise Durand; Christian Lequesne. Ceriscope Pauvreté, Centre de Recherches Internationales; Atelier de Cartographie de SCIENCES Po. 2012. Available online: https://sciencespo.hal.science/hal-03393525 (accessed on 21 October 2021).
  78. MECNT. Synthèse des Études sur les Causes de la Déforestation et de la Dégradation des Forêts en République Démocratique du Congo; Ministère de L’Environnement Conservation de la Nature et Tourisme: Kinshasa, Democratic Republic of the Congo, 2012; 40p. [Google Scholar]
  79. Brockhaus, M.; Di Gregorio, M.; Mardiah, S. Governing the design of national REDD+: An analysis of the power of agency. For. Policy Econ. 2014, 49, 23–33. [Google Scholar] [CrossRef]
  80. de Failly, D.; Bantu, J.-M. La forêt d’Itombwe: Enjeux socio-économiques et conservation de la nature en contexte congolais. ECADIM Étude Cas Dimens. Mult. 2010, 25. [Google Scholar]
  81. Atangana, A.; Khasa, D.; Chang, S.; Degrande, A.; Atangana, A.; Khasa, D.; Chang, S.; Degrande, A. Definitions and classification of agroforestry systems. In Tropical Agroforestry; Springer: Berlin/Heidelberg, Germany, 2014; pp. 35–47. [Google Scholar]
  82. Djiongo Boukeng, E.J.; Tiencheu Avana, M.L.; Zapfack, L.; Desrochers, A.; Maaku Dzo, I.G.; Kabelong Banoho, L.P.R.; Khasa, D. Contribution of buffer zone agroforestry systems to the conservation of tree diversity in protected areas in Sudano-Sahelian zone of Cameroon, Central Africa. Agrofor. Syst. 2019, 73, 4090. [Google Scholar]
Figure 1. Location of Itombwe Nature Reserve study area and its periphery.
Land 14 00907 g001
Figure 2. The sample plots in the reserve and its periphery randomly selected in the north, south, east, west, northeast, northwest, southeast, and southwest directions.
Land 14 00907 g002
Figure 3. The land use maps of the Itombwe Nature Reserve and its periphery spanning the period from 1990 to 2024.
Land 14 00907 g003
Figure 4. Annual changes at landscape level from 1990 to 2014. (a1) PLAND in Forest; (a2) LPI in Forest; (b1) PLAND in Savannah; (b2) LPI in Savannah; (c1) PLAND in Field; and (c2) LPI in Field.
Land 14 00907 g004aLand 14 00907 g004b
Figure 5. Annual changes in PLAND and LPI between reserve and periphery from 1990 to 2024. (a1) PLAND in Forest; (a2) LPI in Forest; (b1) PLAND in Savanna (b2) LPI in Savanna; (c1) PLAND in fFeld; (c2) LPI in field.
Land 14 00907 g005
Table 1. Description of land use classes.
Land Use ClassesDescription
ForestAll forests, including those designated as primary, secondary, and other plantations.
SavannahIncludes grassy and shrubby savannahs.
Fields Areas used for agricultural purposes, including fallow land.
Built-up and bare soilResidential areas, roads, mining areas, and other areas not covered by vegetation.
WaterConsists of rivers, lakes, ponds, and temporary water bodies.
Table 2. Evaluation of land cover accuracy based on supervised classification using Random Forest (UA: user accuracy; PA: producer accuracy).
WaterForestSavannahFieldsBuilt-Up and Bare GroundOverall AccuracyKappa
Année UAPAUAPAUAPAUAPAUAPA
199010.940.910.950.760.820.850.750.770.630.860.81
1995110.680.860.810.790.660.7210.660.800.72
2001110.9210.860.810.770.850.750.540.850.81
2007110.8510.800.730.830.930.840.680.850.80
20130.9010.830.830.800.730.750.750.8710.820.77
20190.9010.890.890.820.770.790.870.830.780.840.79
202410.750.780.910.720.660.840.9310.860.850.80
Disclaimer/Publisher’s Note: The statements, opinions and data contained in all publications are solely those of the individual author(s) and contributor(s) and not of MDPI and/or the editor(s). MDPI and/or the editor(s) disclaim responsibility for any injury to people or property resulting from any ideas, methods, instructions or products referred to in the content.

