Abstract
Amid the global urbanization process, addressing the spatial carrying capacity constraints of historic urban districts and enhancing sustainable tourism vitality has become a critical issue in urban renewal research. This study takes Suzhou Old City as a case study and innovatively constructs a dynamic spatiotemporal analytical framework to examine the relationship between tourism facility attractiveness and tourism vitality in historic districts. This study integrates multi-source spatiotemporal data and applies factor analysis, weighted kernel density estimation (KDE), spatial autocorrelation analysis, and multiscale geographically weighted regression (MGWR) to systematically investigate the spatial distribution patterns of tourism facilities and elucidate their multidimensional driving mechanisms on tourism vitality. The findings reveal a generally positive correlation between tourism attractiveness and tourism vitality. However, significant temporal and spatial variations exist, with different types of tourism facilities demonstrating distinct attractiveness patterns at different times of the day. These variations underscore the intrinsic link between visitor behavior and regional functionality as well as the structural contradictions within historic districts. This study not only advances theoretical insights into the spatial optimization of tourism facilities and tourism vitality enhancement but also provides scientific evidence and policy recommendations for improving facility distribution, revitalizing historic districts, and promoting sustainable urban development.
1. Introduction
Historic urban districts, as significant cultural heritage assets and repositories of collective urban memory, have increasingly assumed a central role in the global agenda for sustainable urban development [1,2]. As outlined in the Charter for Sustainable Tourism, integrating cultural heritage conservation with tourism development is considered a fundamental strategy for the sustainable revitalization of historic towns [3]. Under the guidance of the “culture-tourism integration” strategy, these districts, enriched with heritage resources and spatial narratives, are becoming key catalysts for urban economic transformation and tourism development [4]. Existing research underscores that tourism, through economic leverage effects and multi-industry linkages, generates significant multiplier effects that drive local economic growth [5]. However, challenges such as overdevelopment [6] and surging visitor numbers leading to overtourism [7,8] pose serious risks, including the degradation of cultural heritage authenticity and socio-spatial disparities [9]. In recent years, cities such as Barcelona [10], Venice [11], and Tokyo [12] have increasingly emphasized academic research on the multifaceted impacts of tourism on urban spaces, governance, and sustainable development. In this context, tourism vitality has become a crucial metric for evaluating the sustainability of tourism-driven transformations in historical urban districts, garnering increasing attention from scholars and policymakers alike [13].
The conceptual framework of tourism vitality consists of two interrelated dimensions. On the quantitative level, it is represented by an explicit indicator system that includes visitor flow, consumption intensity, and repeat visitation rates [14]. These measurable factors directly reflect the destination’s attractiveness and its market performance. On the qualitative level, tourism vitality is reflected in an implicit value network comprising cultural identity, community participation, and environmental carrying capacity [15,16]. Most scholars agree that the formation of tourism vitality follows a model based on three key driving factors: resources, facilities, and experiences. In this framework, tourism resource endowment serves as the foundational supply for destination development [17], infrastructure determines the efficiency of resource transformation [18], and the perceived quality of visitor experiences serves as a feedback regulation mechanism [19,20,21]. In this study, tourism vitality is conceptualized as the spatiotemporal concentration of tourist activities within the destination area. At present, various types of multi-source spatial data are widely used in the quantitative analysis of urban and tourism vitality. These include mobile signaling data [22,23], nighttime light data [24], Wi-Fi access point data [25], and heat maps [26].
The attractiveness of tourism facilities, as an endogenous driving force, exerts a decisive influence on stimulating regional tourism vitality. Tourism facilities act as a crucial bridge between tourists and destinations, serving as the primary channels through which visitors directly engage with and perceive tourism experiences. These facilities encompass a variety of services, including tourist attractions, shopping venues, dining establishments, entertainment services, and accommodation options [27,28,29]. A rational and well-planned spatial configuration of tourism service facilities can effectively enhance visitor satisfaction, thereby maximizing tourism vitality [30]. Traditional studies on the attractiveness of tourism facilities have primarily relied on field surveys, face-to-face interviews, and questionnaire-based methods. In recent years, however, the development of internet technologies has provided new perspectives for tourism research. With the widespread availability of online information, an increasing number of tourism activities have shifted from group tours, which depend on travel advertisements and agencies, to independent travel that is informed by tourism-related content on internet platforms. Travelers are increasingly inclined to use mobile applications and review-based platforms to adjust their travel preferences and decision-making behaviors [31]. Social media data now contain large quantities of points of interest (POI) information. These data reflect the human activities associated with physical locations and the interactions between spatial entities and geographic positions. POI data have been widely applied in studies of urban facility spatial patterns, evaluations of consumption vitality [32], and analyses of human activity factors [33]. They have also become an important data source and methodological tool for assessing the attractiveness of tourism facilities [34].
Although there has been a considerable accumulation of research on the attractiveness of tourism facilities and tourism vitality both domestically and internationally, several significant gaps remain. First, a unified standard for evaluating the attractiveness of tourism facilities has not yet been established. Existing studies exhibit considerable subjectivity in the selection of evaluation indicators, the assignment of weights, and data collection methods, making it difficult to comprehensively and accurately reflect actual conditions. Second, the spatiotemporal evolution mechanisms of tourism vitality in historic urban districts have not been fully explored. Most existing research is limited to static or cross-sectional analyses, lacking longitudinal tracking and multi-scale comparative studies. As a result, it remains difficult to capture the diffusion and spillover effects of tourism vitality across different time periods and spatial regions. The application of geospatial analysis methods offers new perspectives and data support for revealing these underlying mechanisms [35,36,37].
This study takes Suzhou Old City as a typical case to construct a spatiotemporal coupling analysis framework and a multi-dimensional evaluation system for the relationship between facility attractiveness and tourism vitality. By innovatively integrating the multiscale geographically weighted regression (MGWR) model with multi-source heterogeneous data, this research provides a comprehensive examination of the spatiotemporal mechanisms underlying the impact of tourism facilities on tourism vitality. The key contributions of this study are as follows: First, this study establishes a comprehensive evaluation system for tourism facility attractiveness and employs the MGWR model to explore its spatiotemporal relationship with tourism vitality. In comparison to the traditional GWR model, the MGWR model offers enhanced fitting accuracy and explanatory power when applied to research subjects with prominent spatial characteristics, such as tourism vitality, tourist distribution, and tourism attractiveness. It enables a more nuanced analysis of how different influencing factors vary in intensity and scope across diverse spatial regions, thus providing more precise and targeted decision-making support for spatial interventions and the optimal allocation of tourism resources. Second, this study integrates crowdsourced data, mobile positioning data, and high-precision spatial data to develop a dynamic spatiotemporal evaluation framework, overcoming the limitations of traditional static analyses. By capturing real-time variations in visitor behavior and facility utilization efficiency, this framework not only offers a novel methodological perspective for analyzing the formation mechanisms of regional tourism vitality but also provides more accurate data support for future research on its spatiotemporal evolution. Lastly, this study examines the reallocation of resources and the balance of interests among government, market, and society, exploring how optimized tourism facility layouts can enhance regional tourism vitality while ensuring the authenticity of cultural heritage is preserved. The findings offer systematic theoretical support and practical guidance for achieving a balanced approach to tourism development and heritage conservation in historical urban districts. Overall, this study not only deepens empirical understanding of the relationship between tourism vitality and attractiveness but also provides practical strategies for tourism planning, resource optimization, and sustainable urban regeneration in historical cities.
2. Overview of the Study Area and Research Methods
2.1. Overview of the Study Area
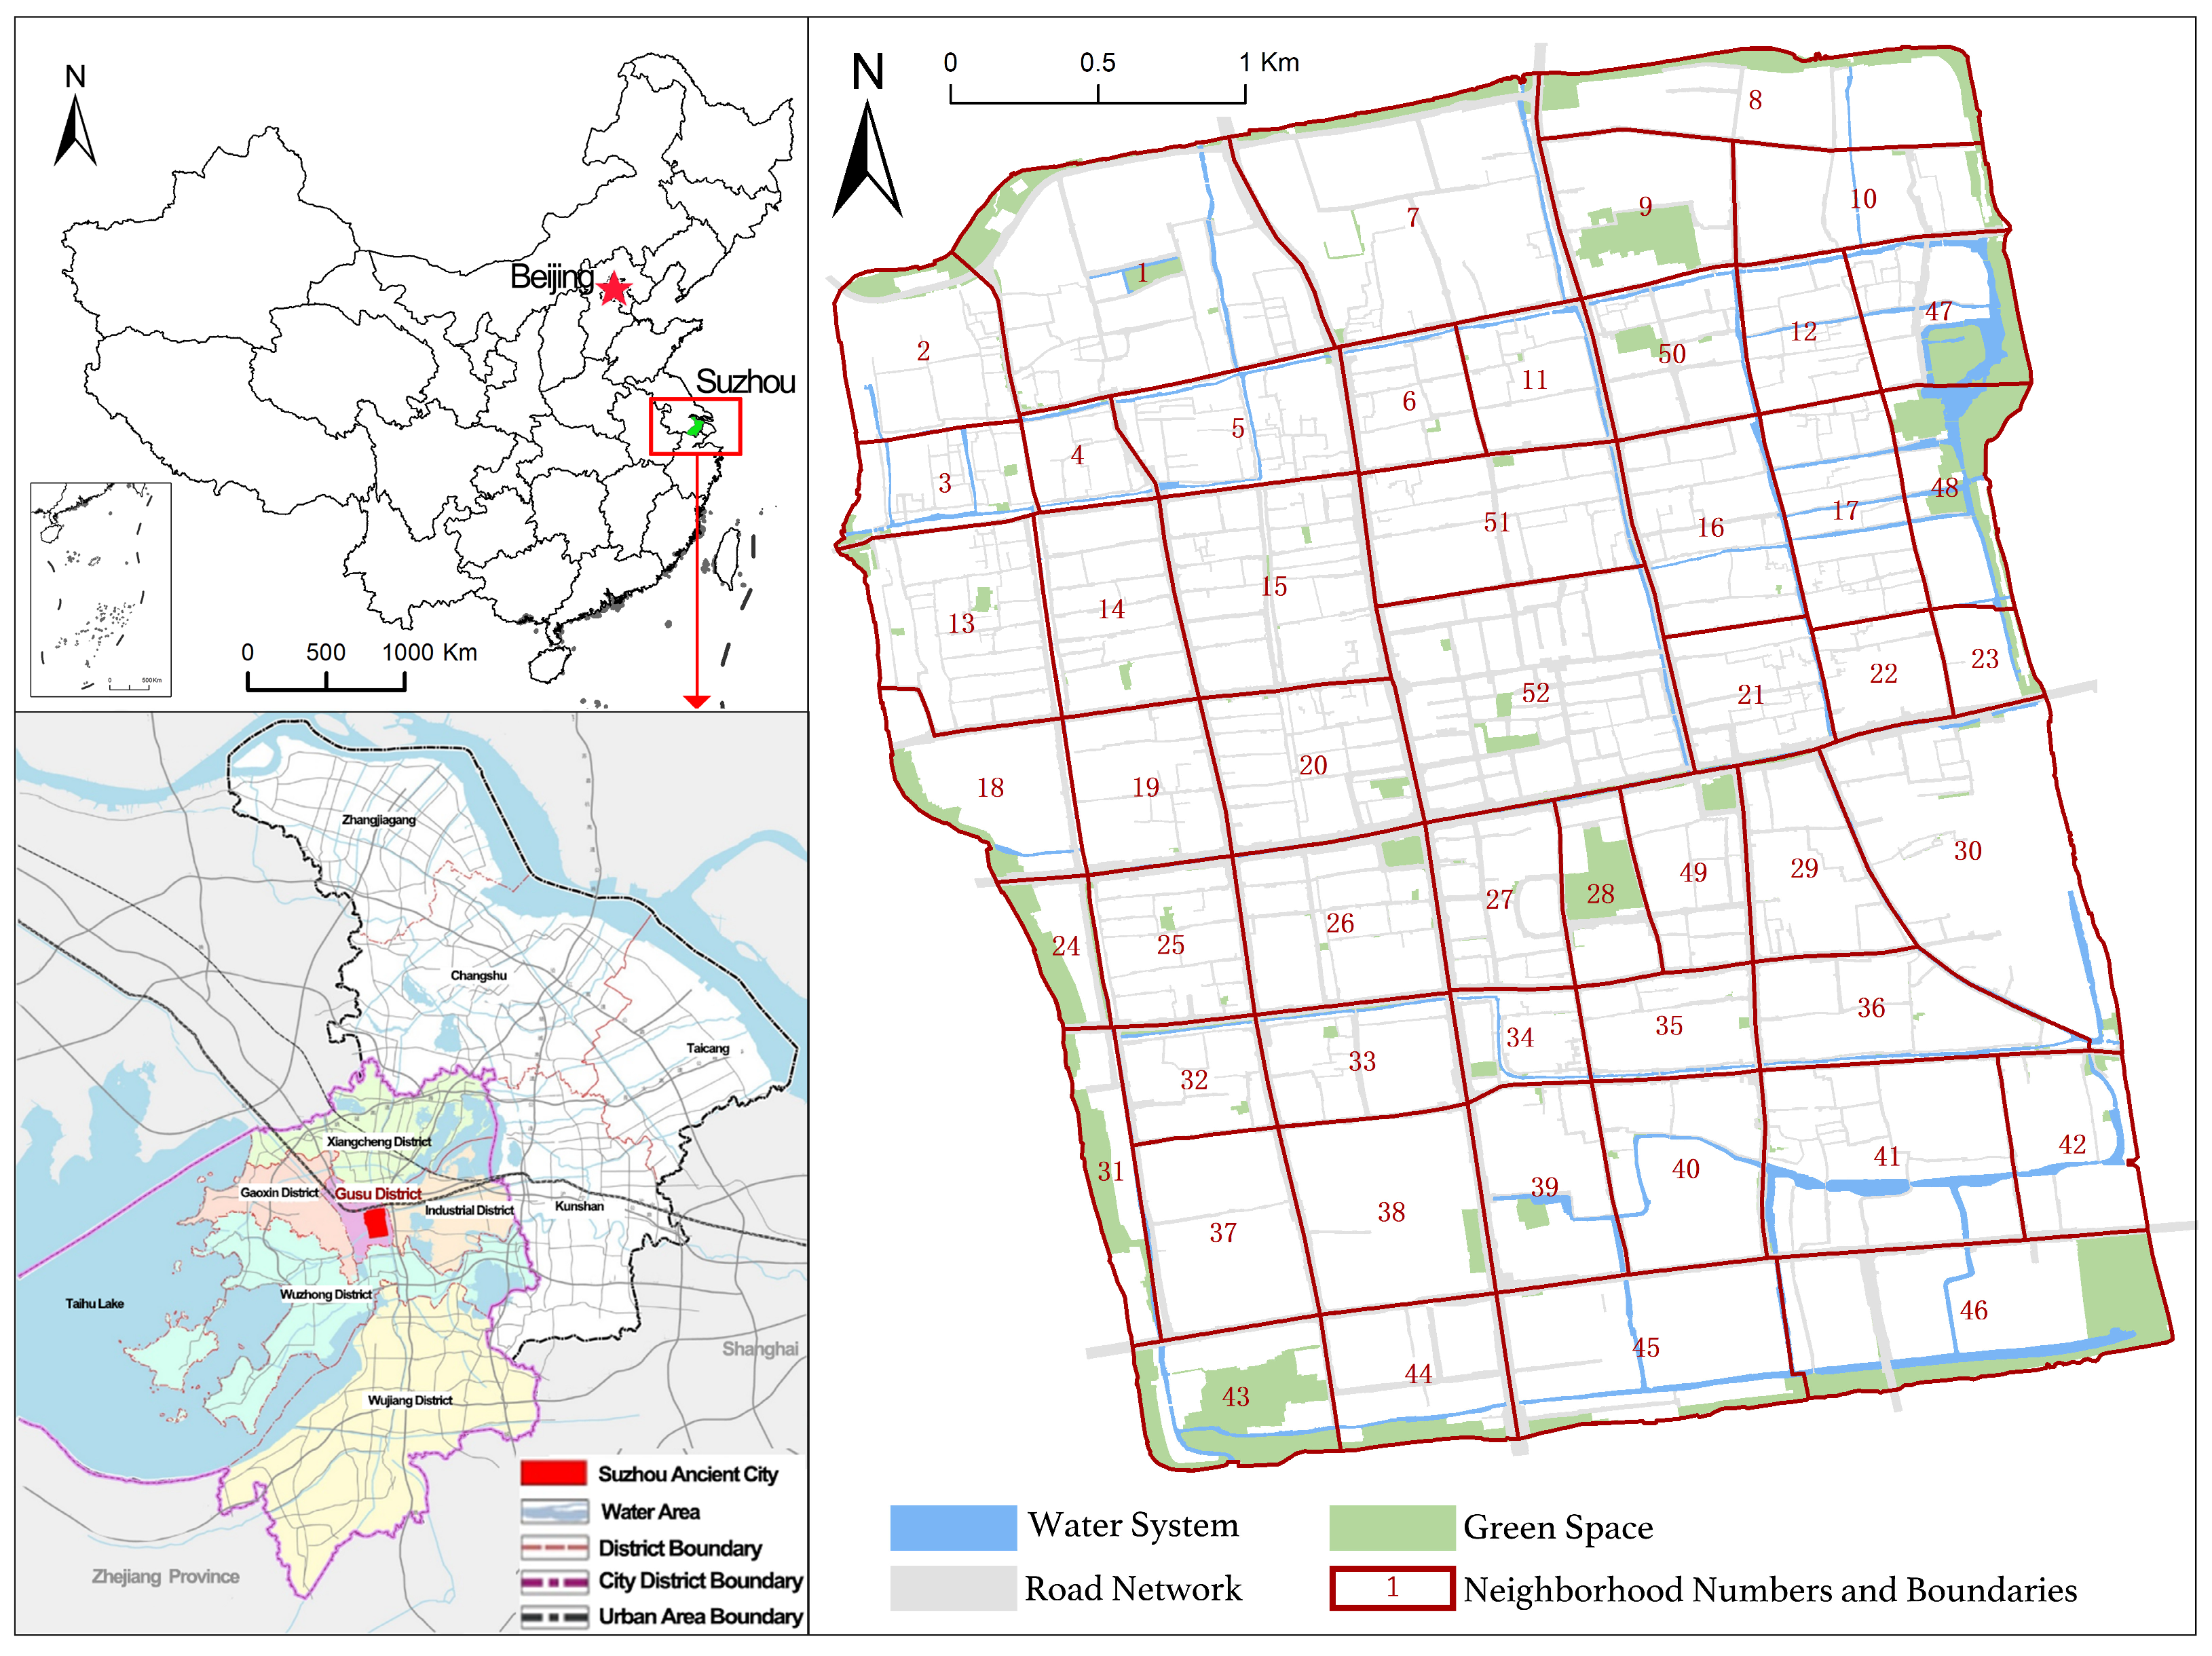
As illustrated in Figure 1, Suzhou is centrally located within the Yangtze River Delta and is one of the major metropolitan cities in East China. It is also among the first 24 cities in China to be designated as a National Historical and Cultural City. According to regulations for the conservation of historical and cultural cities, Suzhou Old City is officially designated as a protected heritage zone. It is situated within the historic city walls in Gusu District, covering an area of 14.2 km2. This area is rich in tourism resources, housing nearly 80% of the city’s historical landmarks, cultural heritage sites, and tourist attractions. The Old City’s distinctive water-town landscape, defined by classical canals and traditional water village settings, is further enriched by the designation of Suzhou’s classical gardens as a UNESCO World Heritage site, has reinforced its status as a globally renowned tourist destination. These unique attributes attract a large influx of visitors each year. During the eight-day Mid-Autumn Festival and National Day holiday in 2023, Suzhou welcomed over 17.81 million visitors, with A-level scenic spots within the Old City receiving 2.98 million visitors, accounting for 16.7% of Suzhou’s total tourism volume. As a result, tourism has become the most dynamic sector within Suzhou Old City’s tertiary industry.
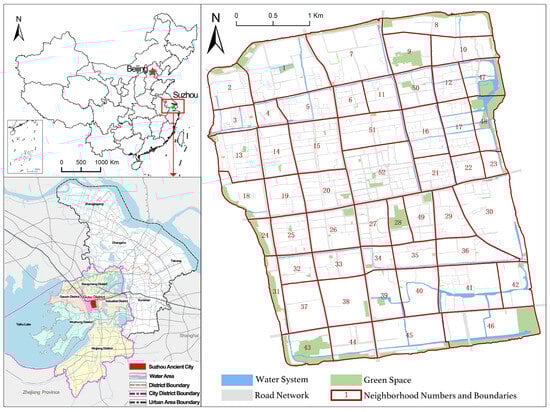
Figure 1.
The study area and the 52 research blocks.
The “double-grid” layout of Suzhou Old City, integrating parallel land and water routes, is a key feature of its traditional urban structure. The transportation system is stratified across different elevations, with streets above and canals below, allowing pedestrians, vehicles, and boats to move independently without interference. The interwoven network of rivers and streets forms a distinctive grid pattern, with 52 traditional neighborhoods following the “front street, back river” layout. This configuration preserves the historical urban texture of the Old City. For the purposes of this study, the Old City has been divided into 52 research areas based on its traditional neighborhoods, as illustrated in Figure 1, forming the foundation for further analysis.
2.2. Research Framework
This study introduces an analytical framework for quantifying tourism attraction using crowdsourced points of interest (POI) data and assessing its heterogeneous impact on tourism vitality. The framework follows a structured approach, beginning with the quantification of tourism attraction variables for the 52 neighborhoods of the Old City through an analysis of crowdsourced POI data. Next, the spatial and temporal patterns of tourism vitality across these neighborhoods are identified, and the Local Indicator of Spatial Association (LISA) is applied to examine the spatial autocorrelation between tourism attraction and tourism vitality, revealing their spatial dependencies. Finally, an MGWR model is employed to assess the global and local effects of tourism attraction generated by POIs on tourism vitality at the neighborhood level. This model captures variations across different time periods, providing insights into the spatiotemporal dynamics of each tourism attraction’s influence on tourism vitality.
2.3. Data Sources
The population vitality data in this study were obtained from statistical values derived from Baidu Maps Location SDK terminal positioning data. Two sets of 12 Baidu Huiyan population location samples, collected at two-hour intervals, were used for analysis. The datasets represent two contrasting periods: an off-peak weekday (Thursday, 12 September 2024) and a peak holiday (Friday, 4 October 2024). September 12, occurring on a regular weekday outside major holidays, reflects a period of relatively low tourist activity. In contrast, October 4 falls within China’s National Day Golden Week, a peak travel season characterized by a significant increase in domestic tourism and visitor flows.
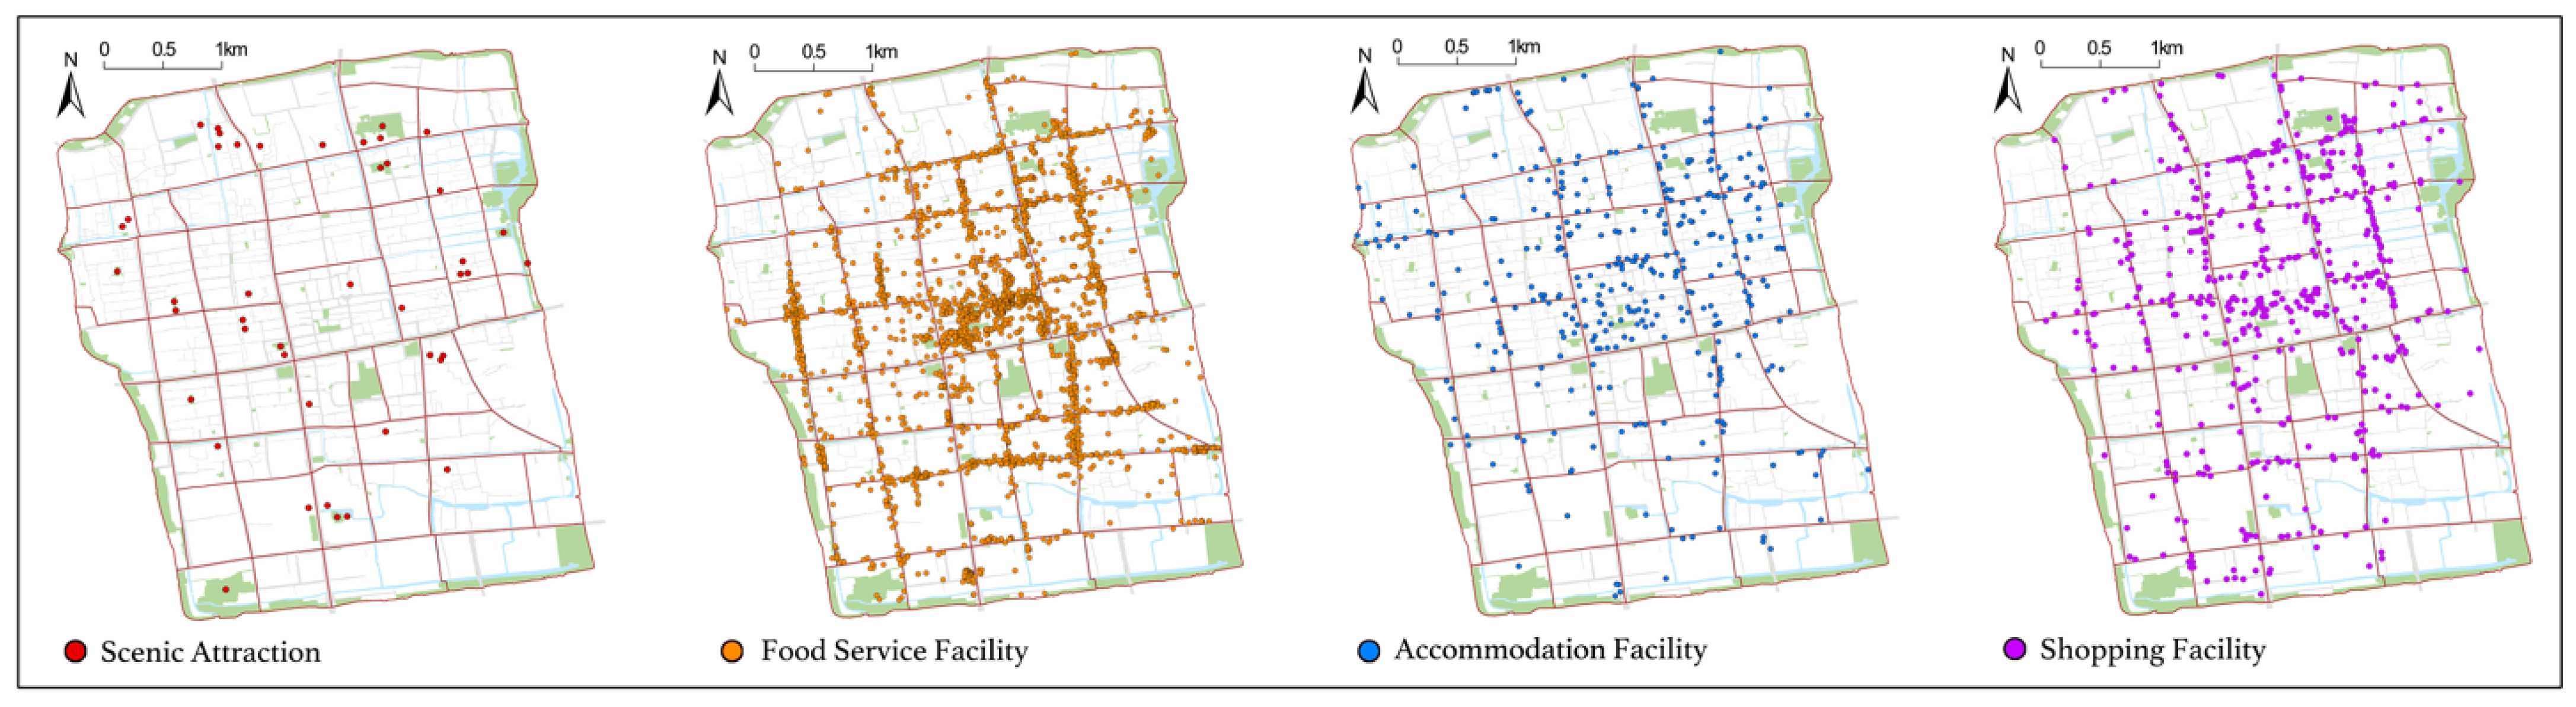
Table 1 presents the basic information on POIs. Based on the National Tourism and Related Industry Statistical Classification (2018) [38] and the Standard for Classification, Survey, and Evaluation of Tourism Resources (GB/T 18972-2017) [39], as well as the prevailing trends in Suzhou Old City’s tourism industry, the POIs are categorized into four main groups: scenic attractions, food services, accommodation services, and shopping services. The POI dataset for Suzhou Old City was collected in October 2022 from widely used platforms such as Dianping (https://www.dianping.com/ (accessed on 29 June 2024) and Ctrip (https://www.ctrip.com/ (accessed on 29 June 2024). The dataset includes 41 scenic attractions, 371 accommodation services, 2463 food services, and 565 shopping services. Figure 2 illustrates the spatial distribution of these tourism service facilities.

Table 1.
POI data information.

Figure 2.
Maps of tourism service facilities’ distribution in Suzhou Old City.
2.4. Data Sources and Variable Description
2.4.1. Dependent Variable
The dependent variable in this study is tourism vitality, measured within Suzhou Old City and quantified using spatial heat map data. Numerous previous studies have utilized big data sources to quantify vitality. For example, the Baidu Huiyan location-based population dataset collects geolocation data from smartphone users who engage with Baidu applications (e.g., Baidu Search, Maps, Weather). This dataset encompasses nearly all smartphone users in the area and, by calculating the density of clustered individuals within each region and deriving a composite “heat” value, effectively captures the spatial distribution, density, and dynamics of human activity [40].
However, the raw heat map data in the Old City include not only tourists but also local residents, vendors, and employees (i.e., non-tourist populations). Consequently, using the unadjusted population heat map as a direct proxy for tourism vitality would introduce bias. To isolate the contribution of tourists, this study subtracts the population heat intensity of an off-peak (low tourism) season from that of a peak tourism season, ensuring that the comparison is made at the same time point. The resulting difference in heat intensity primarily reflects the presence of tourists and is thus used as the measure of tourism vitality in this study.
2.4.2. Independent Variable
The independent variable in this study is defined as tourism attractiveness derived from POI data. Tourism destination attractiveness refers to the combination of the importance of certain perceived benefits by travelers and the destination’s ability to satisfy those benefits [41]. It represents the comprehensive appeal exerted on tourists through the synergistic effects of multiple factors, including tourism resources, geographical location, facilities, destination image, services, and management quality [42]. Tourism attractiveness is often anchored in core attractions, specifically represented by tourism POIs. POI data typically include key evaluation information such as visitor numbers, pricing, user reviews, and service quality as well as classification indicators like the tourism rating of attractions and their designation as historical protection sites. These combined factors contribute to the formation of descriptive POI tags. Such tags simplify a wide array of tourism-related information about a destination into what are referred to as “cognitive images”, which incorporate various positive or negative elements and ultimately influence tourists’ decision making regarding whether to visit a particular destination [43].
This study examines the role of tourism service facilities as tourism attractions in shaping destination attractiveness. To quantify tourism attractiveness, geographically tagged data on tourist attractions, accommodation facilities, dining services, and shopping amenities were collected. Additionally, crowdsourced data were integrated into the analysis. Through data processing and analysis, this study quantifies their influence on tourist attraction levels, providing an empirical basis for further evaluation.
2.5. Research Methods
2.5.1. Assessment of Tourism POI Attractiveness Using Review Data
- (1)
- Factor analysis
When analyzing POI data, discrepancies often arise between the surface-level attributes (e.g., number of reviews, price, area size) and the research objective, such as tourism attractiveness. While these attributes capture the basic characteristics of POIs, tourism attractiveness is a complex and multidimensional concept that extends beyond numerical metrics. Therefore, relying solely on these attributes to measure attractiveness may be both inaccurate and insufficient. To address this issue, this study applies factor analysis to identify latent factors underlying multiple surface-level attributes. This approach enables a more structured and comprehensive evaluation of tourism attractiveness, providing a robust quantitative foundation for further assessment.
The original dataset was first standardized to ensure comparability across variables, transforming the values into a distribution with a mean of 0 and a standard deviation of 1. To assess the suitability of the data for factor analysis, the Kaiser–Meyer–Olkin (KMO) measure and Bartlett’s Test of Sphericity were conducted. As shown in Table 2, all KMO values exceed the threshold of 0.6, and the p-values from Bartlett’s test are 0.00, indicating that the dataset meets the necessary statistical conditions. These results suggest strong correlations among the observed variables, validating the appropriateness of applying factor analysis.
Table 2.
KMO values for different categories of tourism services.
The analysis begins with standardizing the raw data to eliminate dimensional differences among variables. Next, a correlation matrix is computed, followed by factor extraction, typically performed using Principal Component Analysis (PCA) to identify key factors that account for variance in the data. To improve interpretability, factor rotation is applied, ensuring that each extracted factor is strongly associated with only a limited set of variables. Table 3 presents the factor loadings and the variance explained by each factor. After factor extraction, factor scores for each POI are calculated. A weighted sum based on the factor contribution rates is then used to derive a comprehensive attractiveness index, reflecting the overall attractiveness of each POI.
Table 3.
Factor loadings and the variance explained.
Specifically, the factor score is computed using the following formula:
where represents the score of the th common factor for a given POI, denotes the number of factor indicators associated with each POI, refers to the coefficient of the th factor indicator dimension for the th common factor, and represents the value of the th factor indicator dimension for the given POI.
- (2)
- Weighted kernel density estimation
Kernel density estimation (KDE) is a statistical method used to analyze the overall distribution characteristics of sample data by assessing their inherent patterns. It is widely applied to measure local density variations, identify hotspot areas, and explore spatial clustering within datasets. In the context of urban tourism, KDE effectively captures the spatial distribution characteristics of tourism-related attractions. However, standard KDE does not account for differences in the attractiveness of individual POI facilities. In contrast, weighted kernel density estimation (WKDE) assigns varying weights to each data point, allowing for a more accurate representation of the true data distribution. This approach is particularly beneficial for handling samples of differing importance, reliability, or representativeness while also addressing data imbalance, noise, and outliers.
Accordingly, this study employs the WKDE method to quantify the overall attractiveness of Suzhou’s Old City to tourists. The calculation formula is as follows:
where represents the location of data point ; is the bandwidth parameter, which determines the smoothness of the kernel function; is the weight assigned to data point , reflecting its relative importance in density estimation, with this study utilizing the comprehensive attractiveness index as the weight; and denotes the kernel function.
2.5.2. Local Spatial Autocorrelation Between Tourism Attractiveness and Tourism Vitality
The bivariate Moran’s I is used to analyze spatial autocorrelation in a multivariable environment. This index captures the spatial relationship between the value of one variable at location (denoted as ) and the average value of another variable in its neighboring locations. The statistic is computed by taking the product of and the spatial lag of , expressed as . The formula for bivariate local spatial autocorrelation is as follows:
where and are standardized values of the two variables, ensuring a mean of zero and variance of one to eliminate the influence of measurement scales in bivariate spatial autocorrelation analysis. represents the spatial weight between locations and .
LISA analysis is a statistical method used to evaluate the local spatial correlation of geographic data. It identifies and quantifies spatial similarities and differences among geographic units, revealing localized spatial patterns. LISA analyzes each unit in relation to its neighboring units, classifying spatial patterns into four main types: High-High (HH), which represents clusters of high values where high-value units are surrounded by other high-value units, indicating positive spatial autocorrelation; Low-Low (LL), which refers to clusters of low values where low-value units are surrounded by other low-value units, also indicating positive spatial autocorrelation; High-Low (HL), which describes outliers where a high-value unit is surrounded by low-value units, representing negative spatial autocorrelation; and Low-High (LH), which also describes outliers where a low-value unit is surrounded by high-value units, similarly indicating negative spatial autocorrelation.
2.5.3. Using MGWR to Examine the Heterogeneous Effects of Tourism Attraction Derived from Tourism Service Facility POIs on Tourism Vitality
The MGWR model is an advanced extension of the traditional geographically weighted regression (GWR) framework [44]. It offers enhanced precision in analyzing how different spatial hierarchies and functional elements within complex urban systems influence specific urban phenomena, making it particularly effective for uncovering spatial heterogeneity in urban contexts [45]. Unlike conventional GWR, which applies a uniform spatial scale across all explanatory variables, MGWR allows each variable to operate at its own optimal spatial bandwidth. By assigning distinct spatial scales to different variables, MGWR facilitates the identification of localized spatial patterns and relationships that might be overlooked in models using a single scale. This capacity enables more nuanced insights into how various types of tourism facilities affect tourism vitality across spatial contexts [46]. The basic form of the MGWR model is as follows:
where represents the dependent variable (tourism vitality) at location , denotes the th explanatory variable (different attractiveness factors) at location , are the coordinates of location , represents the regression coefficient of the th explanatory variable at location , and is the error term.
The MGWR model parameters are estimated through an iterative process. It begins with an initial bandwidth assignment for each explanatory variable, followed by local weighted regression to compute regression coefficients. Subsequently, bandwidths are iteratively adjusted to optimize model fit until convergence is reached. This method effectively captures the spatially varying influences of different variables across multiple spatial scales, providing a more nuanced understanding of geographic heterogeneity.
3. Results
3.1. Spatial Representation of Tourism Attractiveness
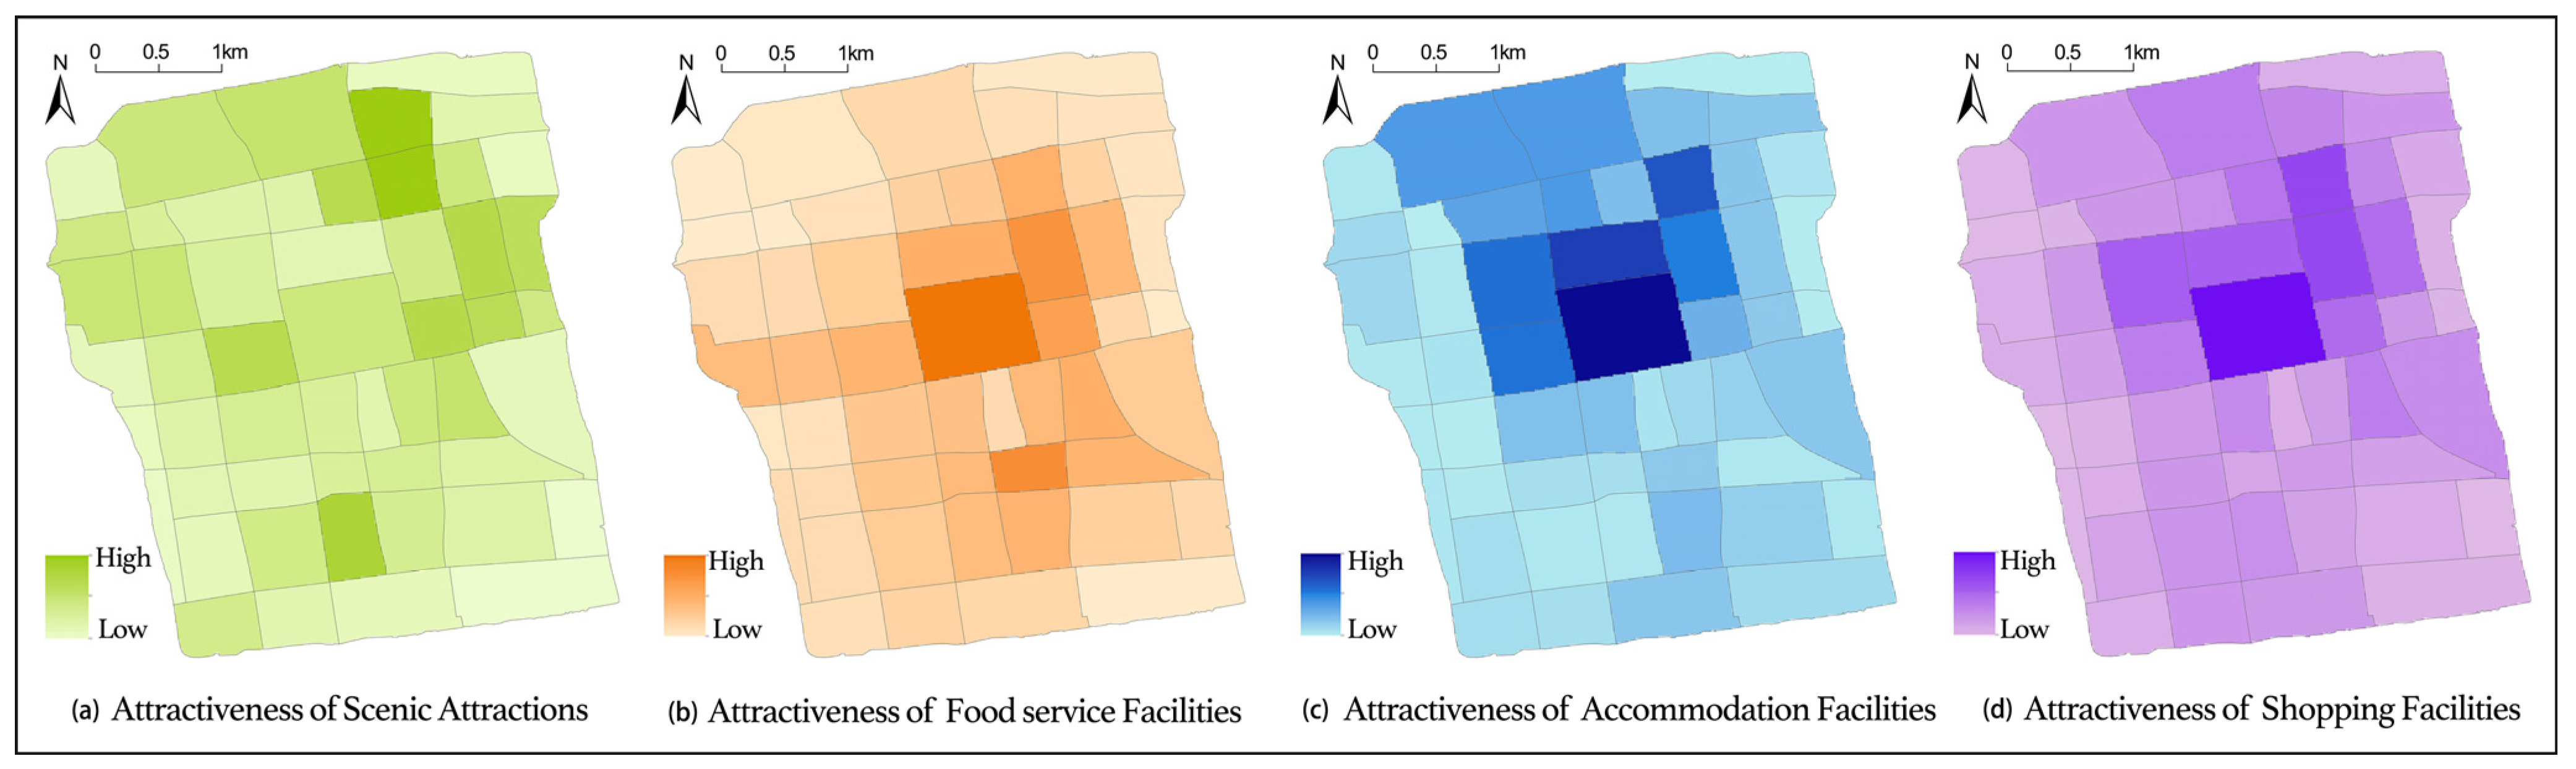
Figure 3 illustrates the spatial distribution of tourism attractiveness in Suzhou Old City based on crowdsourced data on scenic attractions, food services, accommodation, and shopping services.
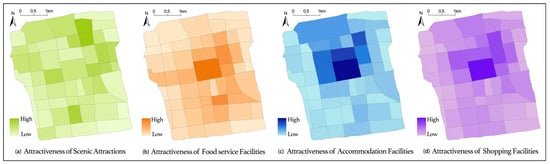
Figure 3.
Spatial representation of the attractiveness of tourism service facilities.
The spatial pattern of scenic attraction-based tourism attractiveness, as shown in Figure 3a, exhibits a clear clustering effect, primarily concentrated in the northeastern part of Suzhou Old City. The Humble Administrator’s Garden cluster, which includes Humble Administrator’s Garden, Suzhou Museum, Suzhou Garden Museum, Suzhou Jade Carving Museum, Lion Grove Garden, and Suzhou Folk Museum, stands out as the most attractive area. In the southern part of Suzhou Old City, scenic attraction-based tourism attractiveness is mainly concentrated in the southwestern corner, particularly around the Canglang Pavilion and Panmen cluster. Overall, northern scenic attractions demonstrate higher attractiveness than those in the south, while the central and southeastern parts of Suzhou Old City form a low-attractiveness zone for scenic attractions.
The spatial pattern of food service attractiveness, as depicted in Figure 3b, also shows a strong clustering effect. It is centered around Guanqian Street, radiating outward. Guanqian Street exhibits the highest attractiveness for food services, followed by Pingjiang Historic and Cultural Block, Lindun Road, Shiquan Street, and the northern section of Xueshi Street, which also show relatively high attractiveness.
The spatial distribution of accommodation attractiveness, as shown in Figure 3c, indicates that areas north of Ganjiang Road have significantly stronger attractiveness than those in the south. The Guanqian Street area stands out as the most attractive for accommodation, followed by the train station area, the Humble Administrator’s Garden cluster, and the southern part of the North Pagoda area.
The spatial pattern of shopping attractiveness, as illustrated in Figure 3d, forms a distinct cluster in the northern part of Ganjiang Road, east of Renmin Road, south of Dongxibei Street, and west of the eastern section of the city moat. The highest shopping attractiveness is observed in Guanqian Street and the Humble Administrator’s Garden cluster, while the Pingjiang Historic and Cultural Block, which connects these two areas, exhibits moderate attractiveness. In contrast, the southern part of Suzhou Old City, particularly along Shuyuan Lane, Shiquan Street, and the South Gate area, demonstrates relatively low shopping attractiveness.
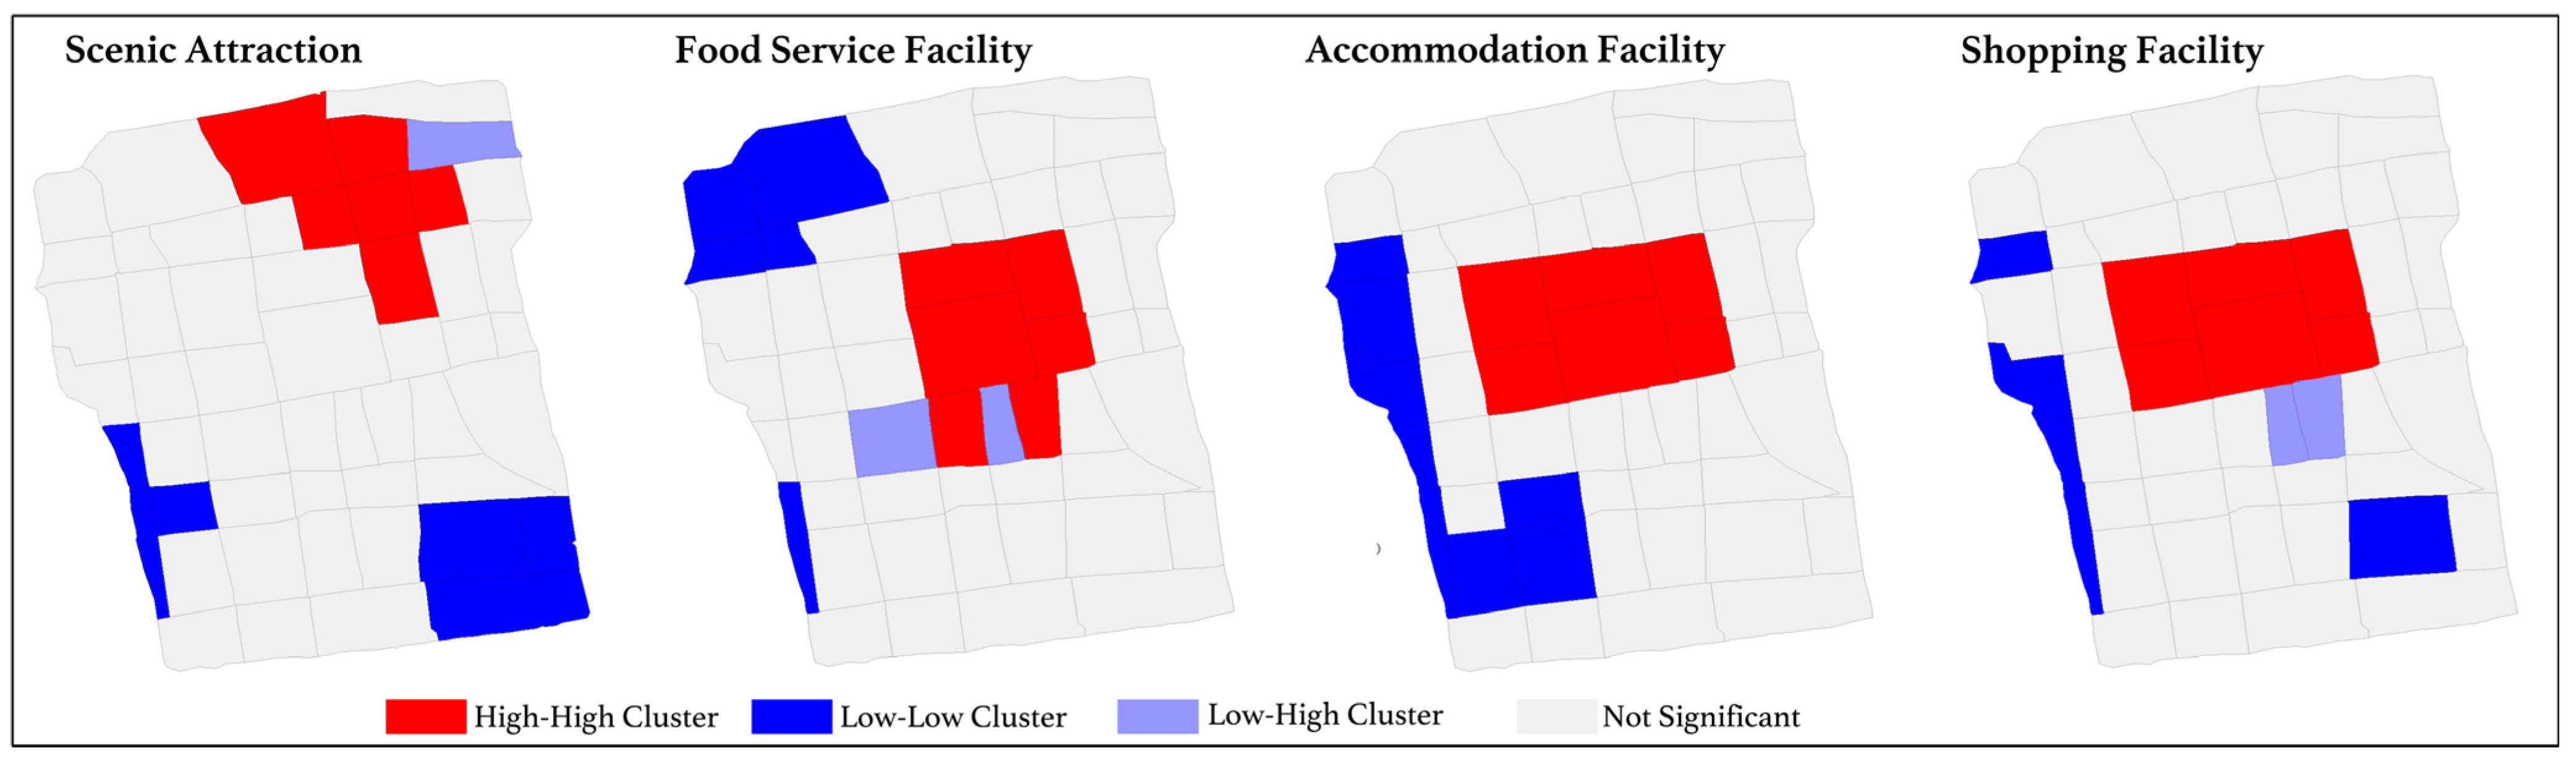
The spatial distribution of POI attractiveness for food services, shopping, and accommodation in Suzhou Old City follows a “high centrality, low periphery” pattern, while the overall tourism structure exhibits a “one primary center with multiple secondary hubs” arrangement. Using LISA and a geographic distance matrix, clusters and outliers of tourism service attractiveness are identified, as shown in Figure 4. The results indicate that Guanqian Street and Pingjiang Road serve as the core attraction zones for food, shopping, and accommodation, forming high-density visitor clusters. Additionally, for tourism service facilities, the northeastern area enclosed by Humble Administrator’s Garden, Lion Grove Garden, and Suzhou Museum stands out as a major attraction hub, also characterized by high visitor density. In contrast, residential areas surrounding Suzhou Old City predominantly exhibit low-attractiveness zones, indicating a weaker presence of tourism service appeal.
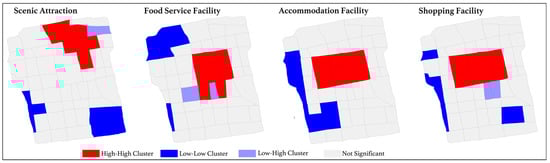
Figure 4.
LISA of tourism service attractiveness (High-High indicates that a high-value area is surrounded by other high-value areas, Low-Low indicates that a low-value area is surrounded by other low-value areas, and Low-High indicates that a low-value area is surrounded by high-value areas).
3.2. Spatiotemporal Patterns of Tourism Vitality
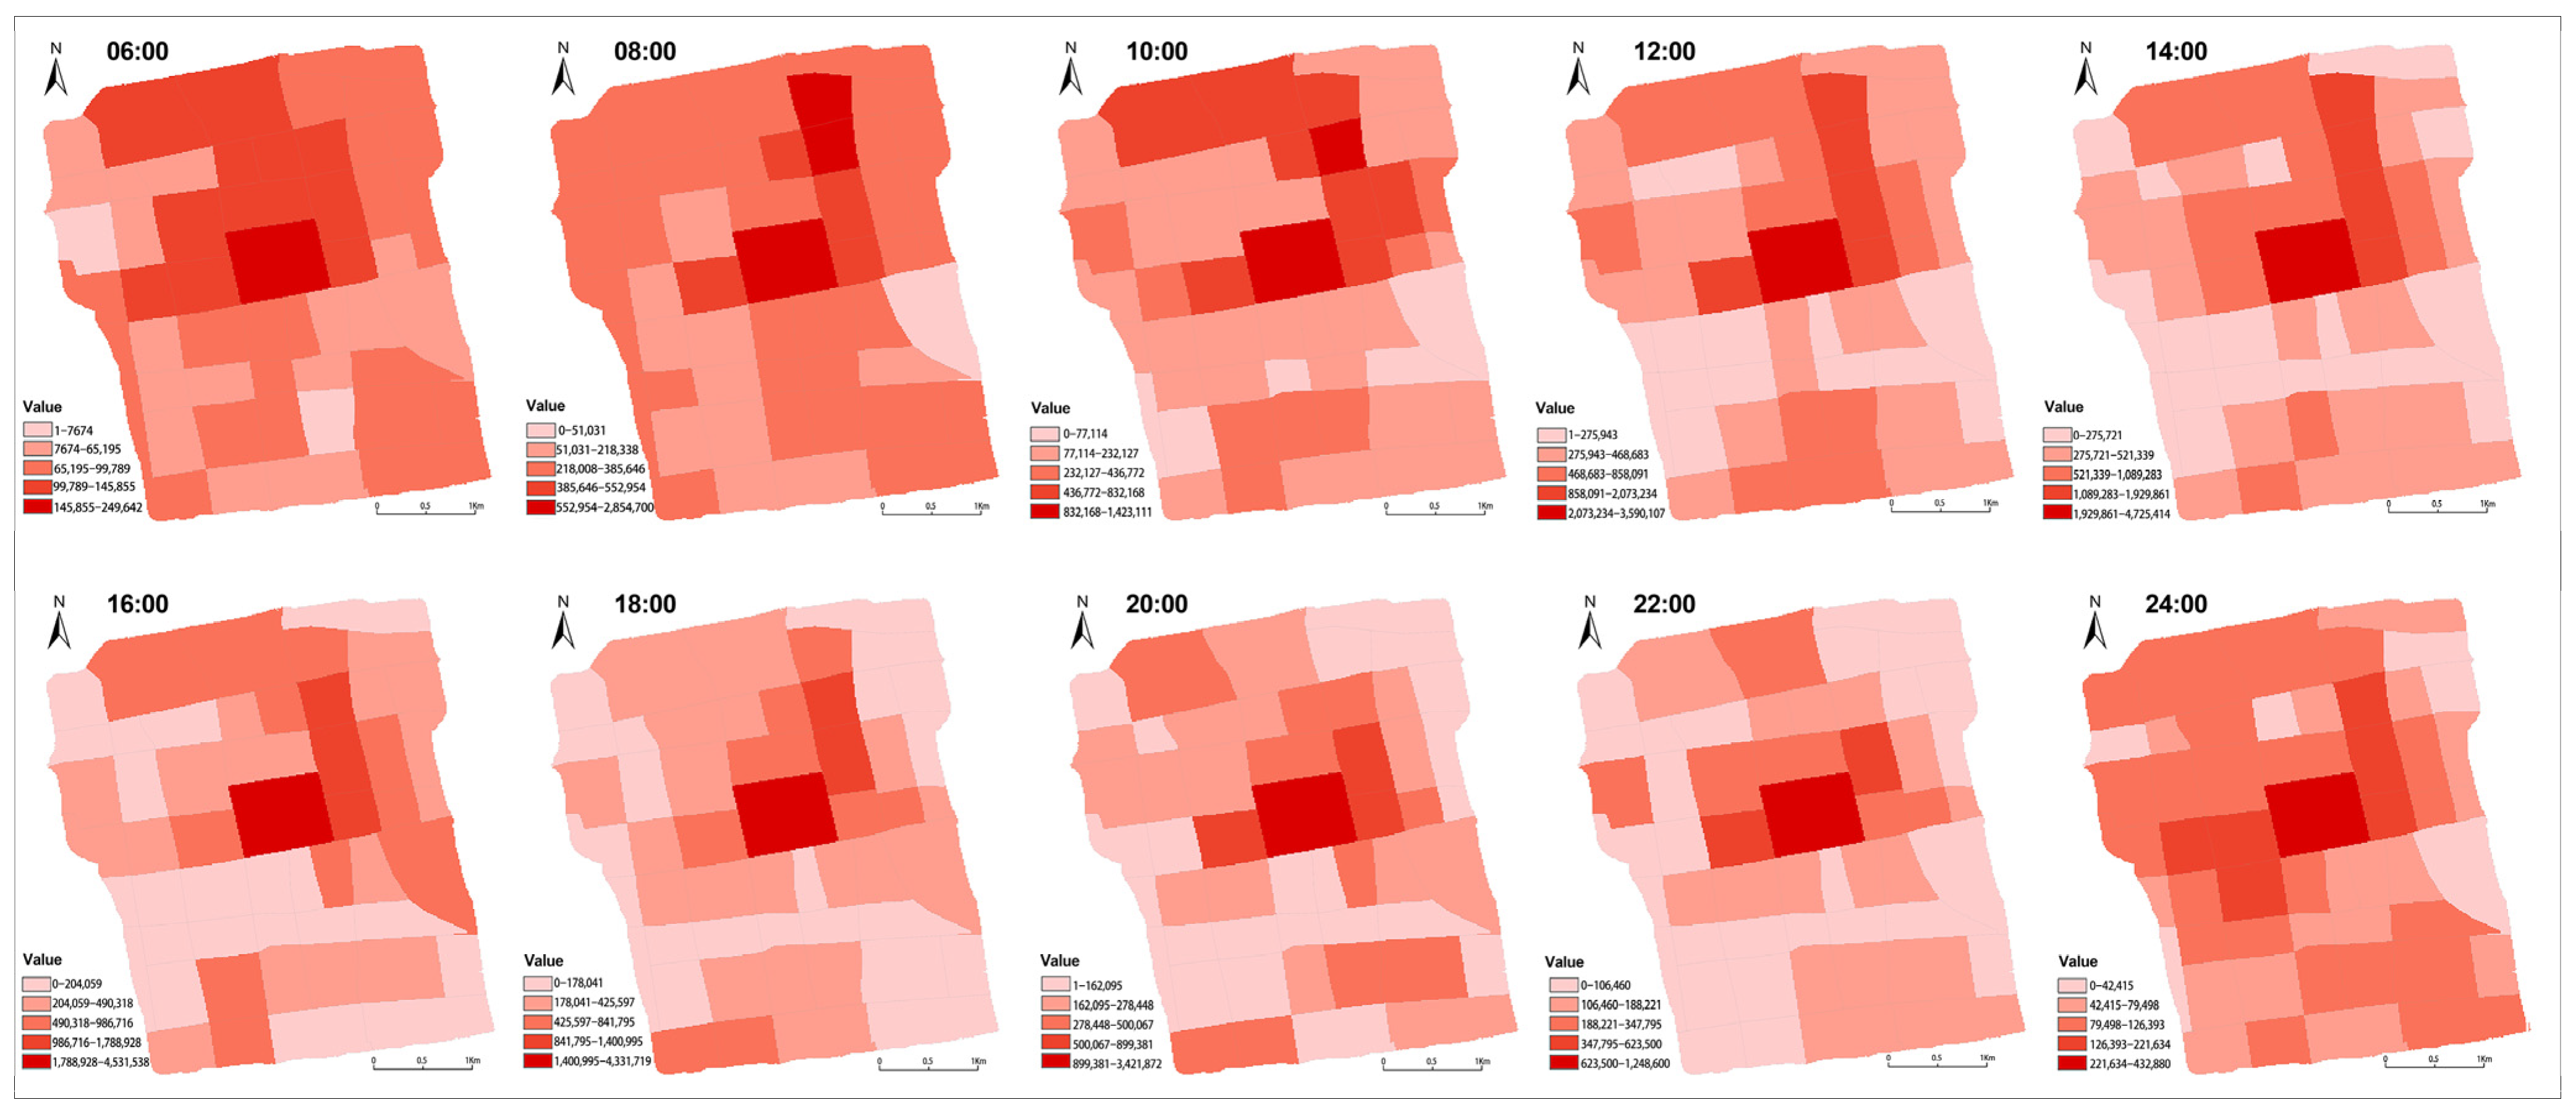
Figure 5 illustrates the spatial distribution of tourism vitality in Suzhou Old City from 6:00 AM to 12:00 AM, with data collected at two-hour intervals, resulting in ten time segments. The selected time period is primarily because 6:00 AM to 12:00 AM encompasses the main behavioral cycle of tourists, from morning departures to evening activities, which allows for a more comprehensive reflection of the spatiotemporal distribution characteristics of visitors. Additionally, excluding the period from midnight to 6:00 AM helps eliminate the influence of static residential behaviors and data noise, thereby enhancing the representativeness and analytical accuracy of the data.

Figure 5.
Spatial distribution of tourism vitality.
The tourism vitality of Suzhou Old City follows a bimodal daily fluctuation pattern, with a primary peak at noon and a secondary peak at night. Overall, tourism vitality radiates outward from the core area, gradually weakening towards the periphery. The northern part of the Old City exhibits significantly higher vitality than the southern part, with a clear vitality segregation zone between the two. While the extent and intensity of high-vitality areas fluctuate over time, the general spatial pattern remains stable.
During the early morning hours (12:00 AM–6:00 AM), tourism vitality remains at its lowest, with the entire Old City in a state of low activity except for nightlife districts and bar streets, where minor activity persists. As morning arrives (8:00 AM), vitality gradually increases, primarily concentrated in core scenic areas and nearby commercial zones, reflecting the early influx of tourists for morning sightseeing. By noon (12:00 PM), tourism vitality reaches its first peak of the day, with high-vitality zones (indicated in dark red) expanding significantly. Tourists are primarily concentrated in key attractions such as Humble Administrator’s Garden and Lion Grove Garden, while dining establishments and surrounding commercial areas also experience peak activity levels. In the afternoon (2:00 PM–4:00 PM), vitality slightly declines but remains at a high level. The core area maintains strong activity, while secondary zones start to experience spillover effects, reflecting a gradual spatial diffusion of tourism activity into peripheral regions. As evening approaches (6:00 PM–8:00 PM), the second peak of tourism vitality emerges, driven by a transition from daytime sightseeing to nighttime consumption and leisure activities. Night markets, specialty dining streets, and cultural performance venues witness a significant surge in activity, with some core areas regaining heat, highlighting the strong influence of the nighttime economy in sustaining urban tourism vitality. By late night (10:00 PM), as tourists gradually leave the Old City or conclude their activities, vitality rapidly declines, with only a few nightlife-driven areas maintaining low levels of activity. This spatiotemporal pattern underscores the dual influence of daytime tourism and the nighttime economy in shaping the vibrancy of Suzhou Old City.
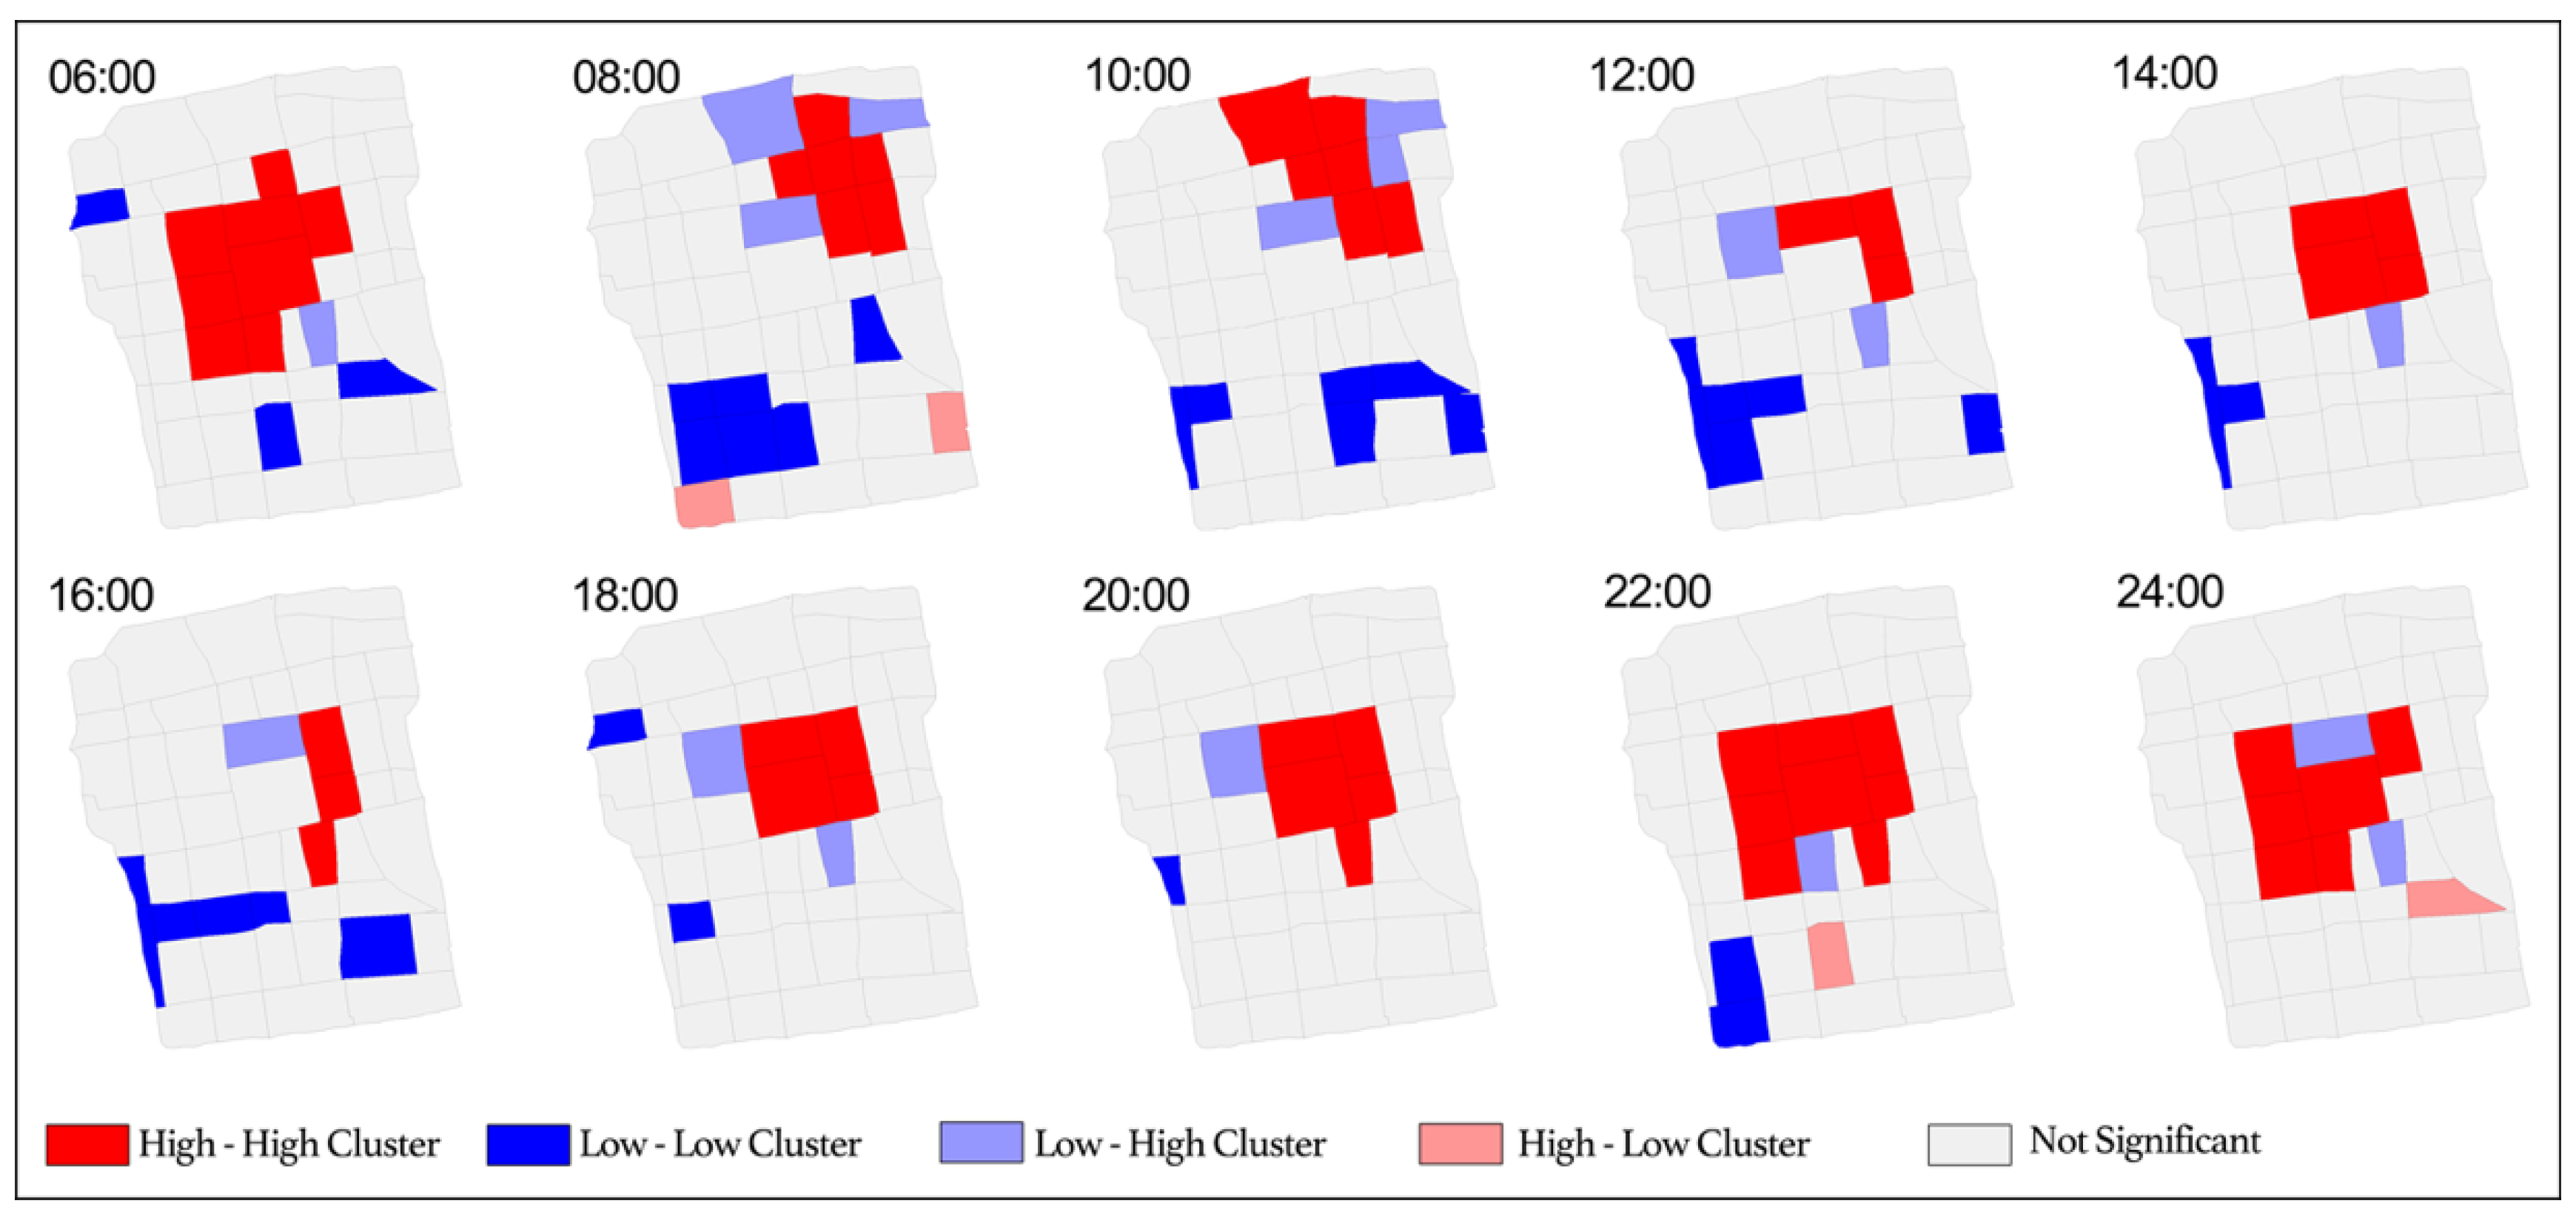
Figure 6 presents the LISA analysis of tourism vitality from 6:00 AM to 12:00 AM, clearly illustrating the spatiotemporal evolution of high and low tourism vitality clusters. In the morning, High-High (HH) clusters of tourism vitality are primarily concentrated in the northeastern part of the Old City, where tourist attractions exhibit strong attractiveness, particularly around major scenic sites. As the afternoon and evening progress, the HH clusters gradually shift towards the central part of the Old City, reflecting the increasing influence of commercial and leisure activities. In contrast, Low-Low (LL) clusters are consistently distributed in the southern part of the Old City, indicating relatively low tourism vitality in these areas throughout the day.
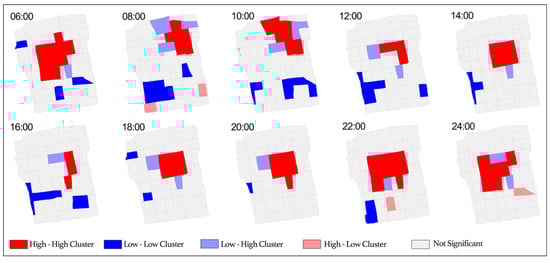
Figure 6.
LISA of tourism vitality (High-High indicates that a high-value area is surrounded by other high-value areas, Low-Low indicates that a low-value area is surrounded by other low-value areas, High-Low indicates that a high-value area is surrounded by low-value areas, and Low-High indicates that a low-value area is surrounded by high-value areas).
3.3. Spatial Autocorrelation Between Tourism Attractiveness and Tourism Vitality
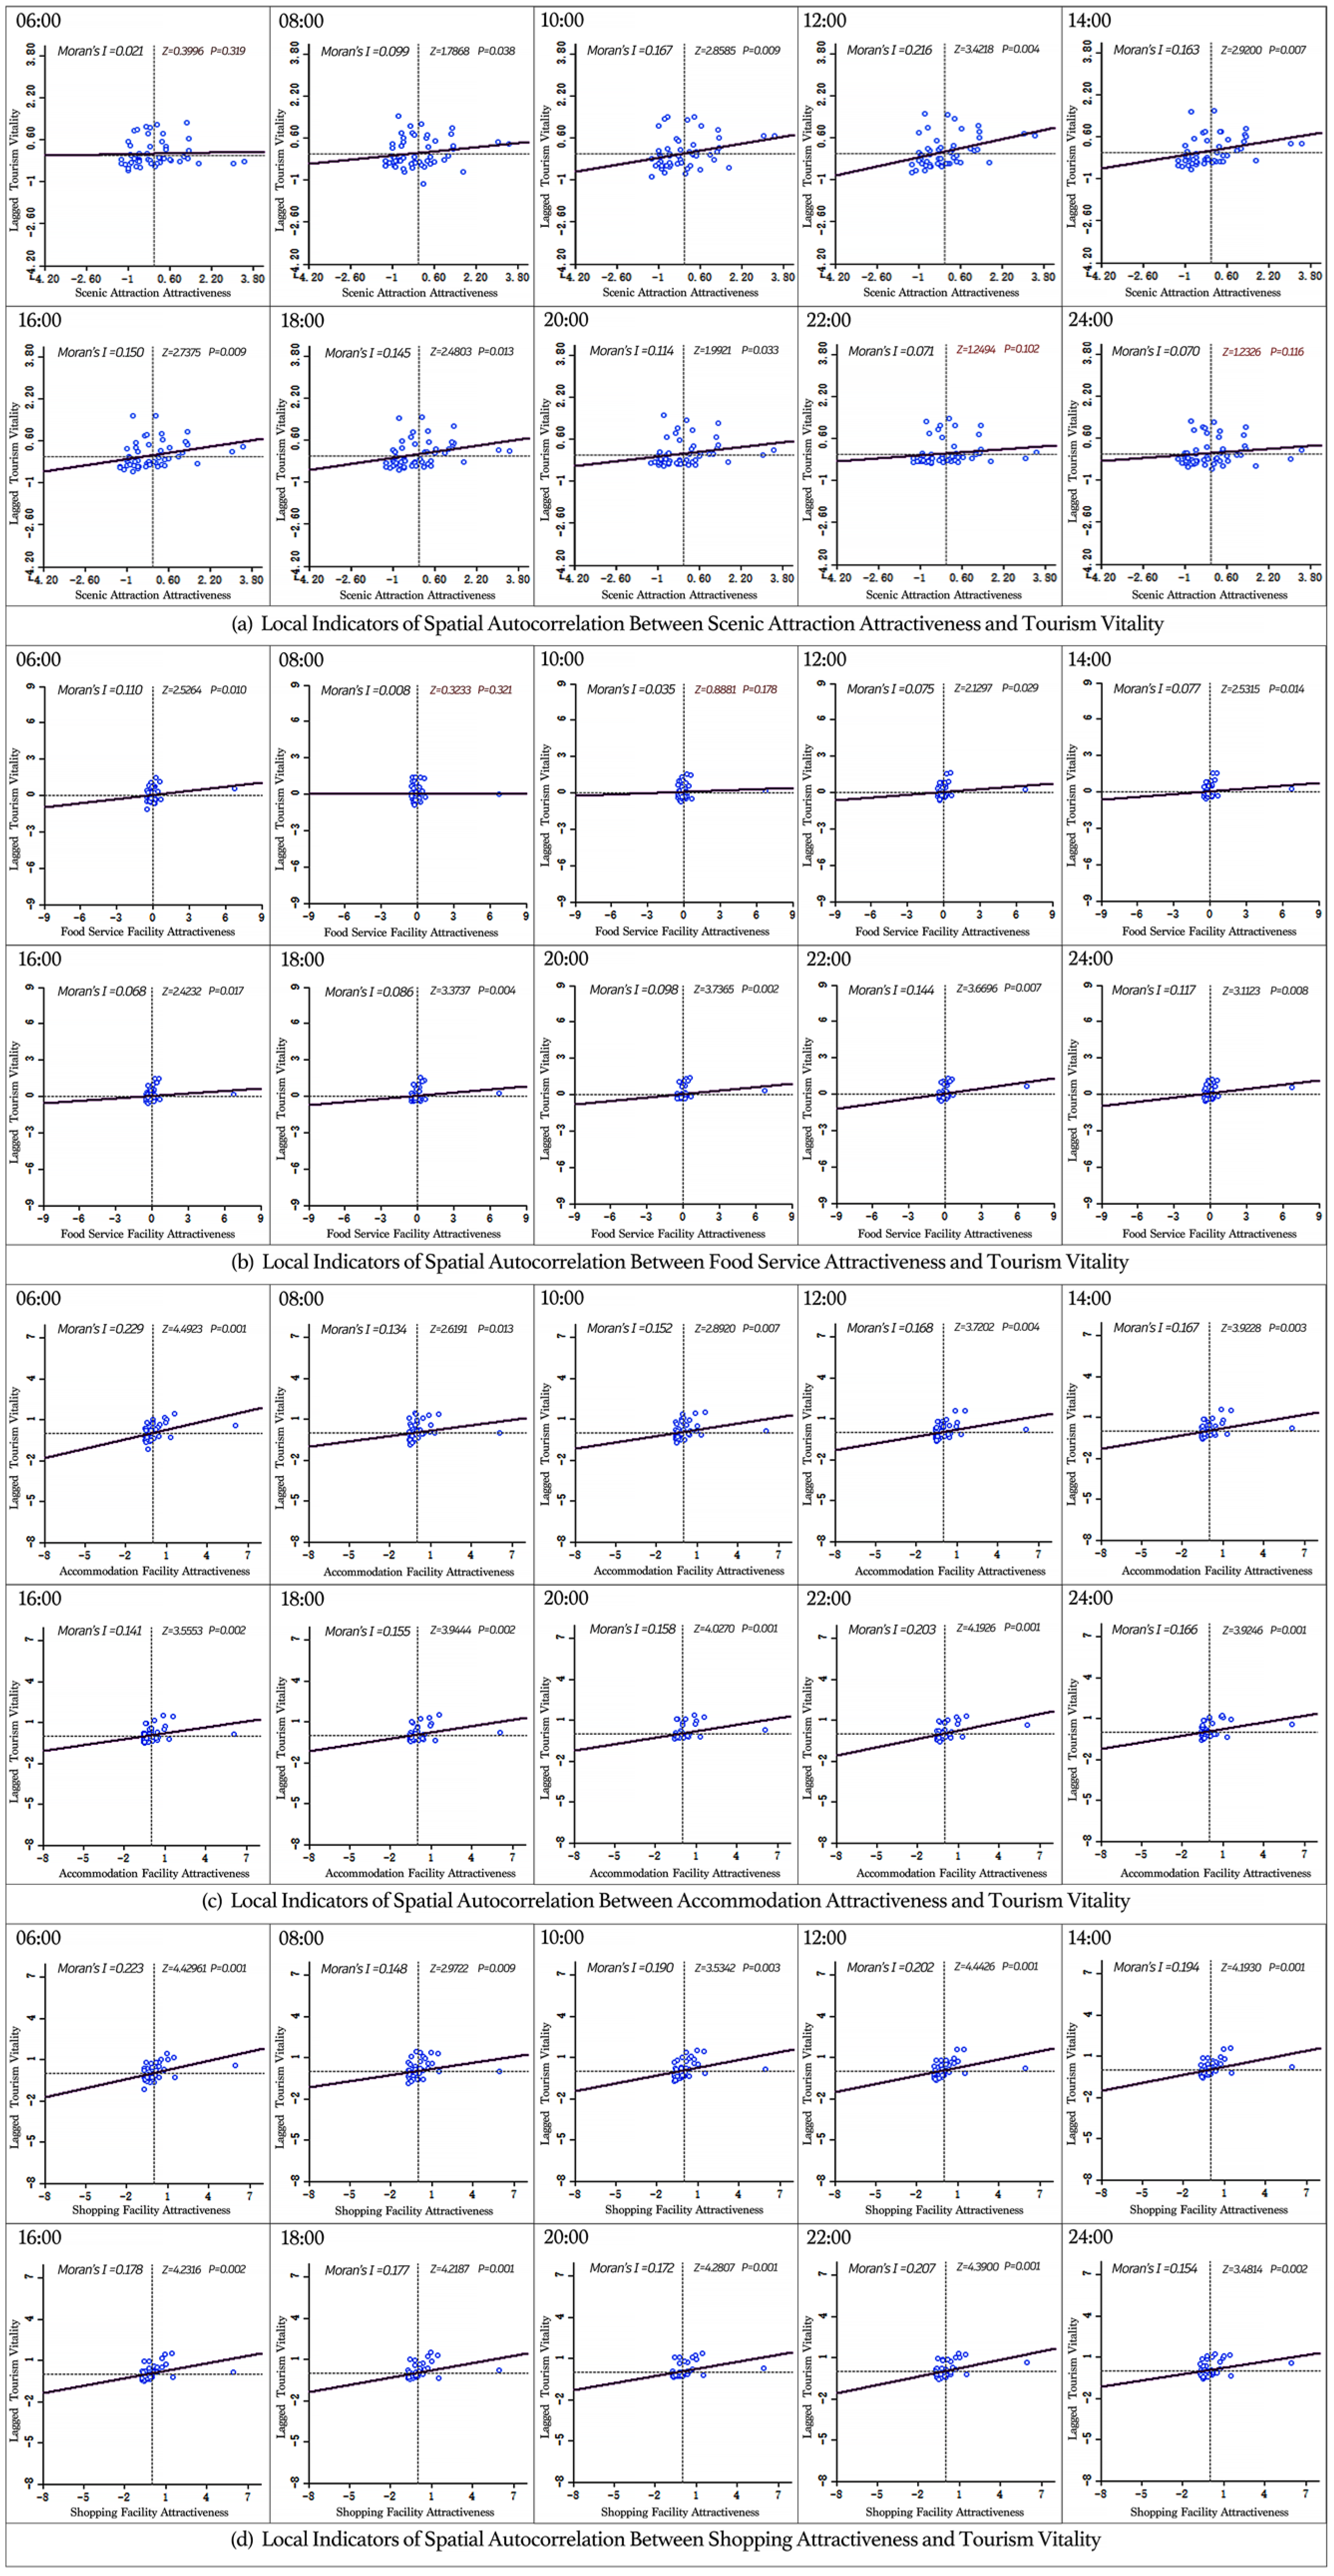
Figure 7 portrays the local indicators of spatial autocorrelation between tourism-related facility attractiveness and tourism vitality in Suzhou’s Old City at two-hour intervals from 6:00 AM to 12:00 AM. At a 1% significance level, the z-score of tourism facility attractiveness and tourism vitality is either greater than 1.68 or less than −1.68 for most time periods, with p-values below 0.05. This suggests a statistically significant spatial autocorrelation between tourism facility attractiveness and tourism vitality during most hours of the day. Overall, a positive spatial autocorrelation exists between the attractiveness of tourist attractions, food, accommodation, and shopping facilities and tourism vitality in Suzhou Old City.
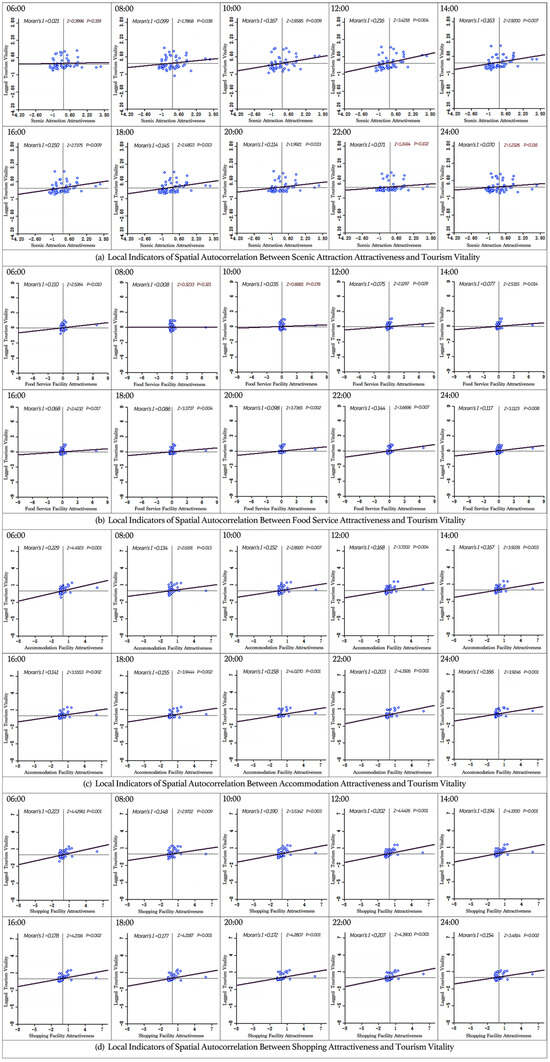
Figure 7.
Bivariate Moran’s I scatter plot of the attractiveness of tourism facilities and tourism vitality (the first quadrant in the upper right represents High-High (HH); the second quadrant in the upper left represents Low-High (LH); the third quadrant in the lower left represents Low-Low (LL); and the fourth quadrant in the lower right represents High-Low (HL)).
For scenic attractions, the z-score remains above 1.65 at most time points, indicating a positive spatial correlation between attraction attractiveness and tourism vitality. However, at 8:00 PM, 10:00 PM, and 12:00 AM, the z-scores drop to 1.2494, 1.2326, and 0.3996, respectively, suggesting no significant spatial autocorrelation during these hours. This phenomenon may be attributed to the fact that most tourist attractions close after 8:00 PM, leading to a shift in visitor activity and purpose. For food service facilities, at the 1% significance level, the z-scores at 8:00 AM and 10:00 AM are 0.3233 and 0.8881, respectively, indicating no spatial autocorrelation during these early hours. This is likely because most food establishments have not yet opened at these times. However, for the remaining time periods, the z-score exceeds 1.68, with p-values below 0.05, confirming a statistically significant positive spatial autocorrelation between dining facility attractiveness and tourism vitality for most of the day. For shopping and accommodation facilities, a positive spatial autocorrelation with tourism vitality is observed throughout the entire day, highlighting the significant role of retail stores, convenience stores, and hotels in sustaining tourism vitality in the Old City.
3.4. Heterogeneous Impact of Tourism Facility Attractiveness on Tourism Vitality
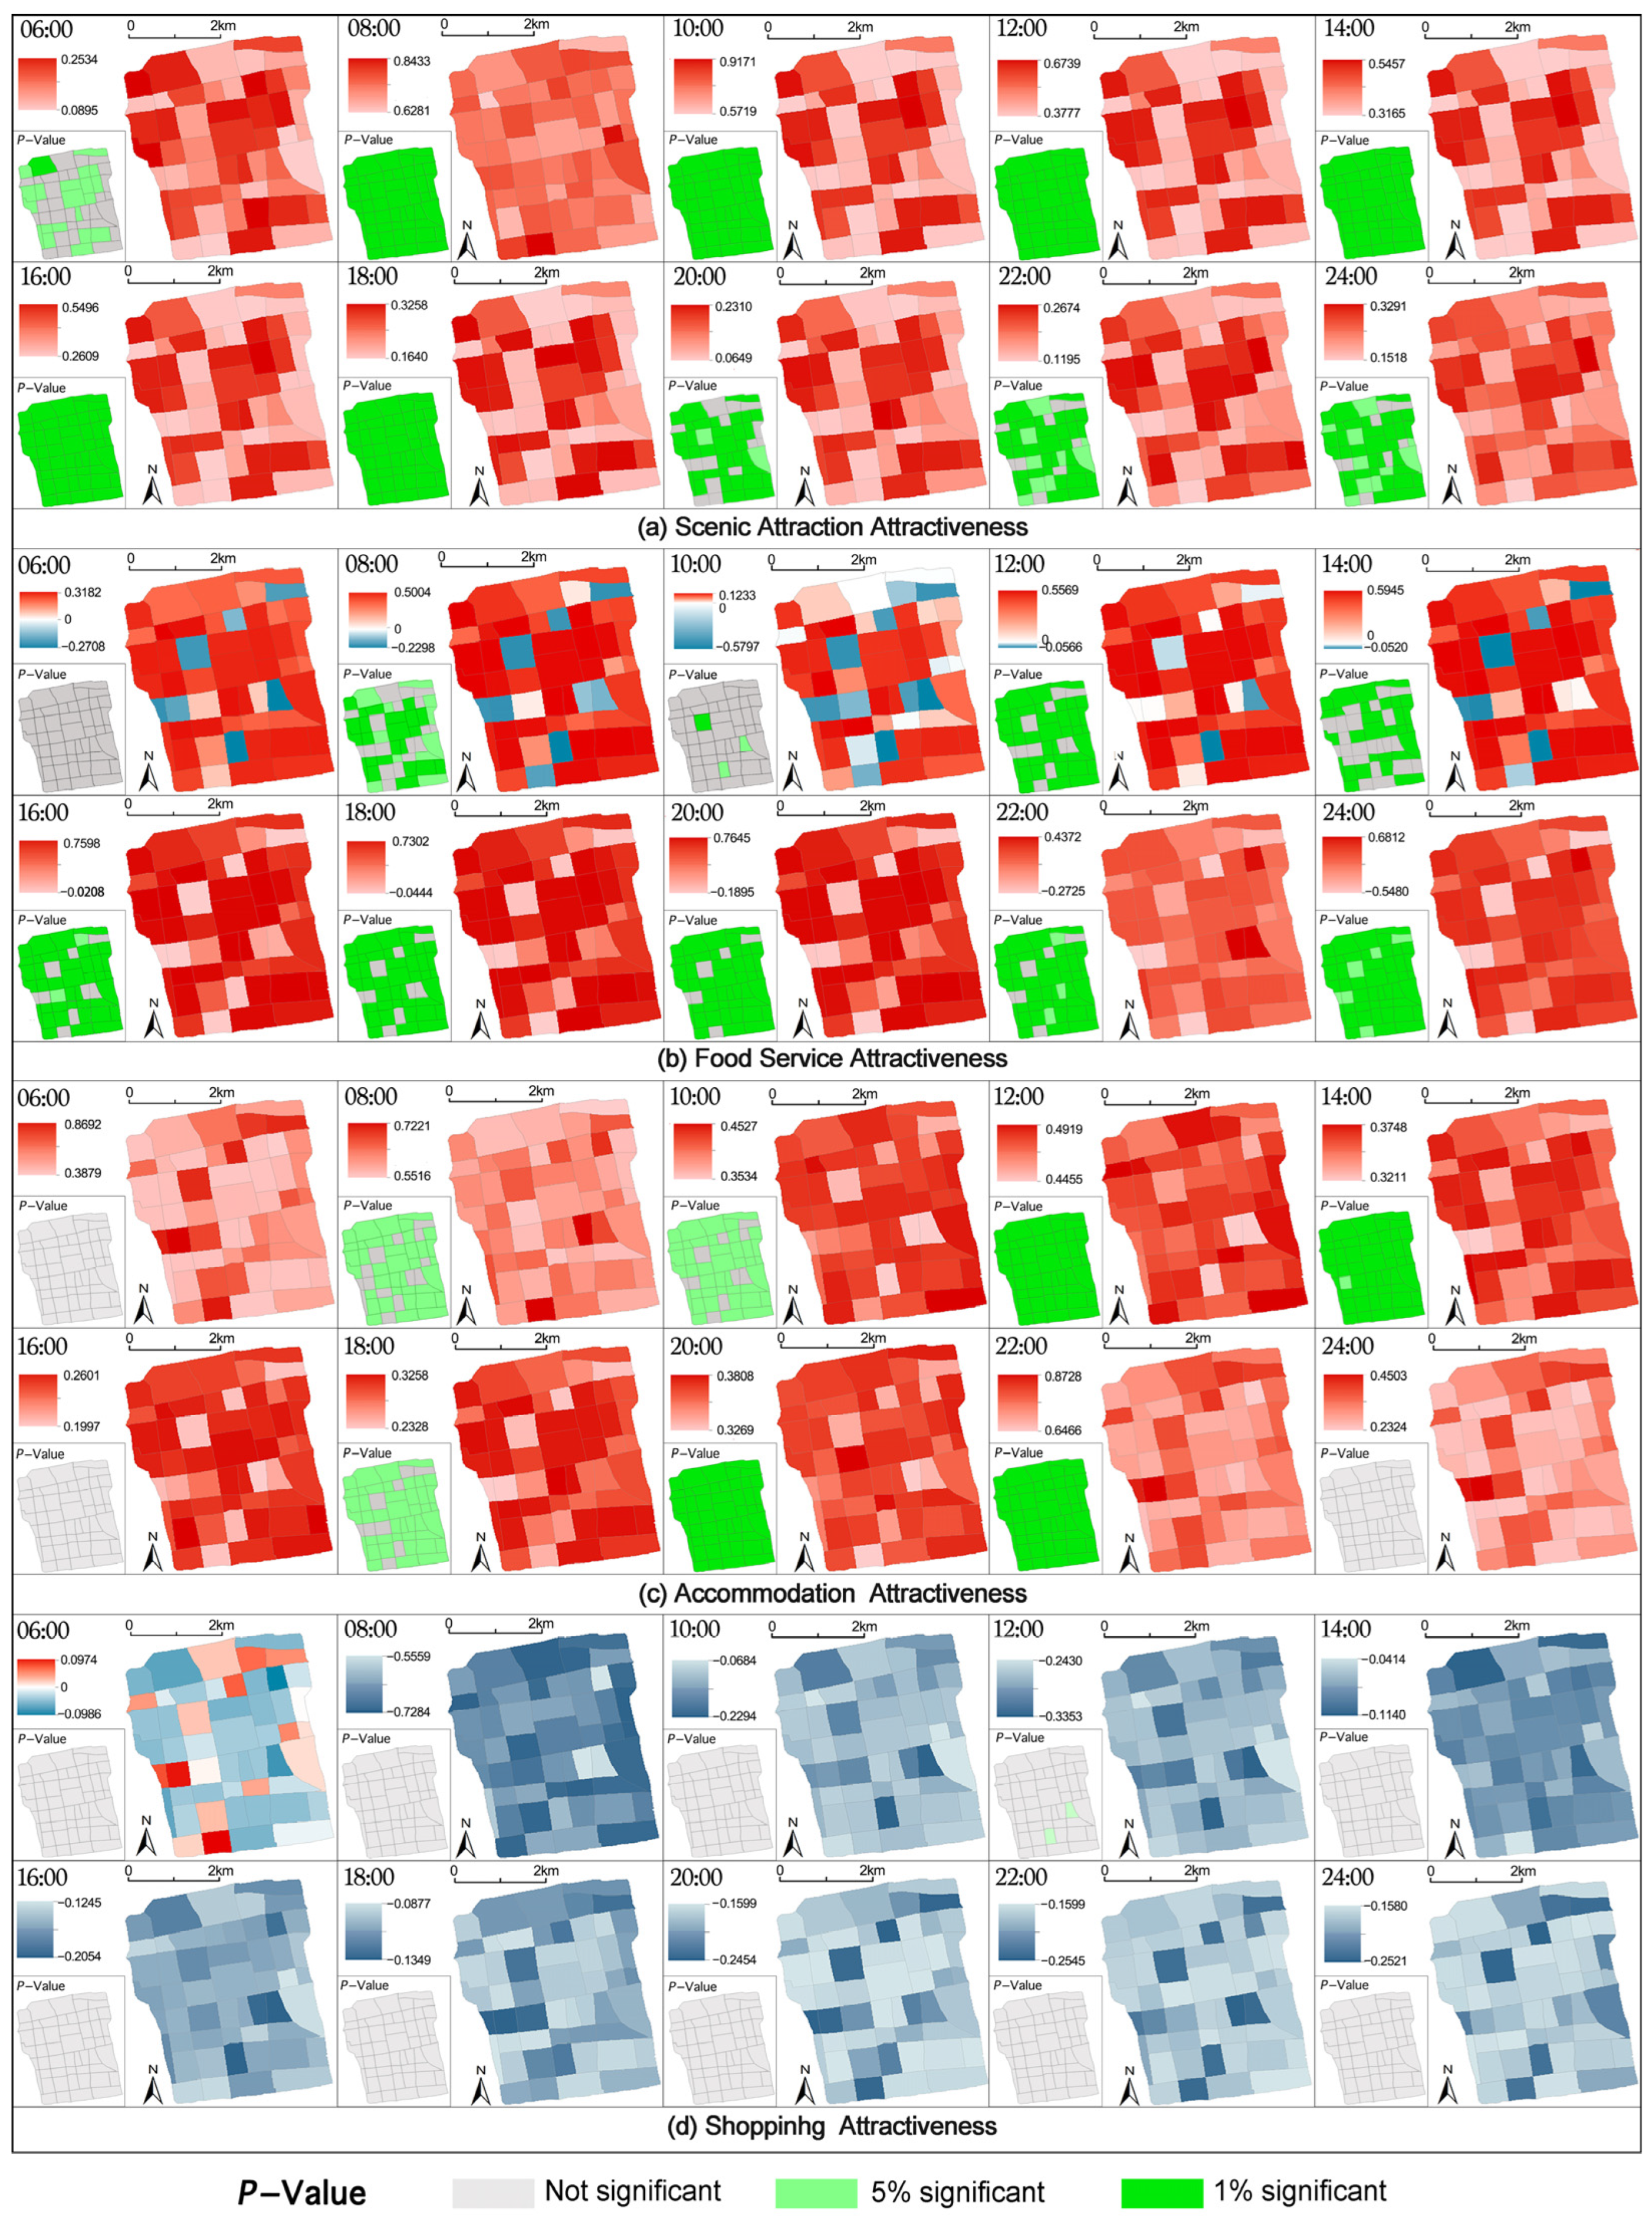
The MGWR model was further introduced to investigate the spatial differentiation of influencing factors across different regions. The results of the MGWR model calculation reveal the influence of tourism facility attractiveness indicators on urban vitality and their spatial differentiation, as shown in Figure 8. The analysis based on MGWR results highlights significant temporal and spatial heterogeneity in the influence of tourism facilities on urban tourism vitality across different time periods. The model’s adaptive bandwidth ranges from 44 to 50, reflecting that scenic attractions and food services exhibit localized clustering effects in the early morning and evening hours, with a bandwidth of 44, while accommodation and shopping demonstrate broader spatial diffusion, with a bandwidth of 50. Scenic attractions have a consistently positive impact on urban tourism vitality throughout the day. Temporally, scenic attractiveness peaks between 08:00 AM and 12:00 PM, with a mean value of 0.728 and a maximum of 0.917. High-value areas are concentrated in the central and northeastern parts of the old town. During evening hours, from 8:00 PM to 12:00 AM, the coefficients decline significantly, with mean values around 0.2, forming a typical “anchor scenic spot”-driven pattern. Food service attractiveness exhibits high spatial heterogeneity in the early morning, with coefficients ranging from –0.271 to 0.318 at 06:00 AM and less than 15% of grids showing significance. It gradually transitions to spatial homogeneity at night, with mean values rising to 0.631 to 0.643 after 08:00 PM and over 85% of grids showing significance, reflecting the visitor-dominated characteristics of the night market economy. Accommodation attractiveness follows a three-stage pattern: an inactive phase in the early morning where most coefficients are not significant; a support phase at noon, with a mean value of 0.48 at 12:00 PM, representing the most stable impact; and a coordination phase at night, with a mean value of 0.741 at 10:00 PM. High-value areas are concentrated in Guanqian Street and Pingjiang Road, highlighting the synergistic mechanism between nighttime consumption and accommodation. In contrast, shopping attractiveness consistently shows a negative impact across all time periods, with low significance. This suggests that shopping facilities do not significantly contribute to the positive impact on urban tourism vitality, and their overall effect is weak.

Figure 8.
Estimated coefficients of all variables and the performance of MGWR across the 52 study areas (red indicates positive estimated coefficients, blue indicates negative coefficients, and the p-values represent the significance levels of the regression coefficients).
For the scenic attraction attractiveness variable, the attractiveness of scenic attractions generally exhibits a statistically significant positive correlation with tourism vitality. Specifically, in the early morning (6:00 AM), scenic attraction attractiveness consistently correlates positively with tourism vitality, although in some areas, the significance level is either weak or only reaches 10%. During the daytime (8:00 AM to 6:00 PM), the impact of scenic attraction attractiveness on tourism vitality is most pronounced, with a global p-value below 0.01. Notably, blocks with higher scenic attraction attractiveness scores exhibit significantly higher regression coefficients than those with lower scores, underscoring the strong driving effect of scenic attractions on visitor activity. In this period, tourist attractions serve as the primary draw for visitors, and areas with high scenic attraction scores correspond to significantly higher tourism vitality. In the nighttime (8:00 PM to 12:00 AM), as attractions close, their direct influence on tourism vitality diminishes. The estimated values of scenic attraction attractiveness in Suzhou Old City show a notable decline in significance, likely due to a shift in visitor activity from sightseeing to dining, night markets, and other forms of leisure. This temporal variation highlights the close relationship between the impact of scenic attractions on tourism vitality and the rhythm of visitor activities.
Between 6:00 AM and 2:00 PM, the spatial regression relationship between food service attractiveness and tourism vitality exhibits significant spatial heterogeneity. Specifically, during non-peak meal periods in the morning, except for 8:00 AM (the breakfast peak), the overall demand for food services remains low. Local statistical tests indicate that the correlation between food service attractiveness and tourism vitality is generally nonsignificant, suggesting that food services have a limited impact on tourism vitality during this period. Meanwhile, during breakfast and lunch hours, the demand for food services varies significantly across different areas. While local residents contribute to higher consumption levels, tourists tend to favor food services located in core commercial districts or near popular attractions. This spatially uneven demand distribution further amplifies regional differences in spatial effects during this time period. By contrast, between 4:00 PM and midnight, dinner, late-night snacks, and entertainment activities become the primary consumption behaviors, aligning closely with peak tourism vitality. During this period, regional food demand becomes more concentrated and balanced, leading to a statistically significant positive relationship between food service attractiveness and tourism vitality, with minimal spatial variation. These findings suggest that in the morning, the impact of food service attractiveness on tourism vitality is more dependent on geographic location and regional consumption patterns, whereas in the evening and nighttime, heightened demand and a more active market environment strengthen its positive effect, which is also more evenly distributed across different areas.
In Suzhou Old City, the impact of accommodation facilities on tourism vitality exhibits a clear temporal dependency across different time periods. During the early morning hours, as most tourists remain in their accommodations, the influence of lodging facilities on tourism vitality is minimal and statistically nonsignificant. In the morning (8:00–10:00 AM), as some visitors begin to check out and start their day, certain core areas experience a positive effect, though the overall impact remains limited. Between 12:00 and 2:00 PM, a period corresponding to lunchtime and brief afternoon breaks, tourists begin leaving their accommodations to visit scenic attractions and commercial centers. At this stage, accommodation facilities play a crucial role in supporting tourist mobility and providing convenience services, such as luggage storage, travel information, and short-term resting spaces. This positive effect becomes statistically significant (p < 0.01), indicating that during midday and afternoon rest periods, accommodation facilities provide consistent support for tourist flow and regional vitality. In the afternoon (4:00 PM), as tourists shift their focus toward scenic attractions and dining establishments, the influence of accommodation facilities weakens, with statistical analysis showing a marginal or nonsignificant effect. From the evening to late night (6:00–10:00 PM), with the rise of the night-time economy and leisure activities, tourism vitality intensifies in night markets, commercial streets, and key tourism hotspots. Accommodation facilities not only serve a critical role in facilitating tourist returns but also create synergistic effects with the dining and entertainment sectors, resulting in a statistically significant positive impact during this period.
The distribution of local regression coefficients and p-values for shopping facility attractiveness and tourism vitality reveals that most grid units exhibit negative coefficients across all time periods, with p-values generally high, failing to pass statistical significance tests. This suggests that, overall, shopping facilities in Suzhou Old City do not exert a significant positive influence on tourism vitality; in some cases, they even show a negative correlation in specific periods or areas. Considering the tourism characteristics of Suzhou Old City, its core appeal primarily stems from historical and cultural heritage as well as traditional landscapes. Tourist spending is predominantly focused on cultural experiences, dining, and nighttime entertainment, while shopping facilities primarily serve local residents and struggle to integrate organically with the distinct cultural atmosphere of the Old City. Moreover, excessive commercialization may dilute the cultural charm of the historic district, reducing visitor retention time and satisfaction, thereby limiting its contribution to tourism vitality or even generating negative effects. From a statistical perspective, only a few grid units exhibit low-significance positive correlations in certain periods (e.g., midday), but this is insufficient to reverse the overall pattern of weak or negative correlations between shopping facilities and tourism vitality. These findings further confirm the structural limitations of shopping facilities in enhancing tourism vitality within Suzhou Old City and highlight the misalignment between their functions and tourist demand.
4. Discussion
4.1. Discussion on the Relationship Between Tourism Service Facilities and Tourism Vitality
Scenic attractions dominate daytime vitality due to their primary role in sightseeing, while food services significantly enhance nighttime vitality by catering to tourists’ consumption needs. Accommodation facilities contribute to a full-time distribution of tourism vitality by offering diverse services that increase visitor retention. As a supplementary commercial sector, shopping facilities primarily interact with scenic attractions, food services, and accommodation facilities, enriching the tourist experience and further extending visitor stay duration.
In Suzhou Old City, the top five scenic attractions include Humble Administrator’s Garden, Panmen Scenic Area, Suzhou Museum, Suzhou Garden Museum, and Keyuan Garden, with all except Panmen Scenic Area concentrated in the northern part of the Old City. The case of the Panmen Scenic Area, which exhibits high tourism attractiveness yet low tourism vitality, highlights that a destination’s attractiveness does not inherently guarantee it will be prioritized in tourists’ travel decisions. Instead, factors such as geographical location and transportation accessibility may play a critical role in shaping tourist preferences and behavior [47]. Due to their close proximity, Humble Administrator’s Garden, Suzhou Museum, and Suzhou Garden Museum form a high-density tourist attraction cluster in the northeastern corner of the Old City, exhibiting a strong agglomeration effect particularly between 8:00 AM and 12:00 PM. This pattern aligns with the “scenic attraction agglomeration effect” theory [48,49], which suggests that spatial clustering of attractions enhances visitors’ preferences and willingness to visit, thereby significantly increasing regional tourism vitality. It also highlights the disparity in attractiveness between primary tourist attractions and ordinary tourist sites [50]. Beyond this concentration effect, the tourism system of Suzhou Old City is constrained by both spatial and temporal factors. Spatially, Ganjiang West Road acts as a north–south divide, limiting accessibility to high-value scenic sites in the southern part. As a result, these attractions are often overlooked by short-stay tourists due to transportation constraints [51]. Temporally, the spatiotemporal autocorrelation results reveal a marked decline in the z-values of scenic attractions during nighttime. This pattern is largely attributable to the constraints of a limited 10-h operational window (8:00 AM–6:00 PM), dictated by both daylight availability and attraction operating hours [52], which imposes significant time-budget pressure on tourists. The compounded effects of spatial segmentation and temporal compression not only diminish the completeness of the visitor experience but also lead to an imbalance in resource utilization between northern and southern scenic areas. This creates a paradox where high-quality tourism resources remain underutilized [53], while tourists experience decision-making anxiety. Ultimately, these systemic spatiotemporal constraints emerge as a key bottleneck hindering the high-quality development of Suzhou Old City’s tourism sector.
The spatiotemporal differentiation of food services in Suzhou Old City is highly pronounced. Guanqian Street, as the core commercial area, leverages its prime location to become a high-vitality daytime dining hub. In contrast, food establishments near scenic attractions experience a paradox of high foot traffic yet low attractiveness. Their vitality relies on visitor spillover from attractions. Following the decline in tourism vitality at scenic attractions during nighttime, food establishments in these areas struggle to maintain sustained appeal due to a lack of distinctive branding [54]. During off-peak daytime meal hours, MGWR hotspot analysis indicates a strong spatial correlation between areas of high food service vitality and those characterized by vibrant tourism activity. This suggests that food consumption in these zones remains heavily reliant on the inflow of tourists from nearby attractions, with their functional role largely constrained to that of auxiliary services rather than independent drivers of vitality. However, after 6:00 PM, the spatiotemporal autocorrelation results exhibit an upward trend in z-values, suggesting a transition in tourist behavior from sightseeing-oriented activities to gastronomic experiences. Extended operating hours and specialized business formats create a strong pull on visitor traffic and play a crucial role in overcoming the spatial dependence trap [55]. This contrast indicates that food services in Suzhou Old City must transition from passively receiving crowds to actively generating value [56]. By prioritizing differentiated brand development and immersive experience innovation, the local dining sector can evolve from a traffic-driven economy to an experience-driven economy.
From a spatial perspective, accommodation facilities serve as a key driver of the tourism economy through the nighttime extension effect. In core areas such as Guanqian Street, the combination of convenient transportation and integrated services has fostered a high-density accommodation cluster. This not only extends visitor stay duration but also reinforces the “consumption-rest cycle”, which drives additional growth in the night-time economy [57]. In contrast, secondary areas such as the train station and the Humble Administrator’s Garden exhibit notable accommodation attractiveness. However, their limited spatial reach and insufficient supporting services lead to a distance decay effect, reducing their economic spillover impact and making it difficult to achieve synergy with the core area.
As a supplementary sector within Suzhou Old City’s tourism economy, shopping exerts a relatively weak direct impact on overall tourism vitality. This phenomenon reflects both the city’s fundamental identity as a historical and cultural sightseeing destination [58] and the functional and spatial limitations of its shopping facilities. From a functional perspective, existing shopping establishments primarily cater to basic consumer demand, with high product homogeneity. They have neither leveraged the city’s rich cultural heritage, such as traditional handicrafts and local intangible cultural heritage, nor introduced innovative experiential retail models, such as cultural-themed consumption spaces. From a spatial perspective, while the core area has developed a concentrated shopping district, the spatial distribution of shopping facilities remains disconnected from historical and cultural resources. The lack of well-designed visitor pathways linking shopping zones with key attractions fails to create synergy [59], instead intensifying homogeneous competition among businesses. This disconnect underscores a fundamental misalignment between the shopping sector and the core essence of Suzhou Old City’s tourism economy, where cultural appeal has not been effectively transformed into a driver of consumer demand.
4.2. Planning Insights for Enhancing Tourism Vitality
Enhancing the overall tourism vitality of Suzhou Old City requires a comprehensive and integrated strategy that focuses on optimizing attraction connectivity, strengthening the nighttime economy, improving accommodation infrastructure, and transforming shopping facilities. By establishing a multi-dimensional, all-day tourism framework, the city can shift from passively accommodating visitor flows to actively generating value through spatial synergy, service innovation, and cultural integration.
As the core competitive assets of Suzhou Old City, attractions play a pivotal role in shaping tourism vitality. Strengthening their clustering effect necessitates a well-coordinated inter-attraction transit system that enhances connectivity and mitigates spatiotemporal constraints. Improving key transport nodes, such as Ganjiang West Road, can facilitate seamless visitor movement, thereby increasing the overall efficiency of the tourism network. To alleviate time-related anxiety in tourists’ travel choices, extending the operating hours of high-attractiveness attractions could be considered. For instance, the Suzhou Museum’s operating hours could be extended during peak tourist seasons and night tours could be offered at popular gardens like the Humble Administrator’s Garden. For attractions like the Panmen Scenic Area, characterized by high attractiveness but low vitality, strategies such as reducing ticket prices and offering joint ticket packages with high-vitality attractions could effectively increase visitor traffic. To further optimize visitor experiences, the integration of smart navigation systems and online reservation platforms can enable dynamic crowd management, reducing congestion while improving accessibility and service efficiency.
Beyond improving accessibility, enhancing the nighttime economy is a crucial mechanism for prolonging visitor stays and increasing tourism revenue [60,61]. It is recommended to promote the development of nighttime cultural activities, such as cultural performances, light shows, and creative markets, in historical and cultural tourism districts like Pingjiang Road and Shiquan Road, as well as in key commercial areas. By extending operating hours for dining services and organizing themed night markets, the nighttime consumer market can be effectively stimulated. A more immersive approach to night tourism should incorporate historical storytelling, interactive cultural experiences, and scenic nighttime sightseeing, cultivating a distinct nighttime tourism brand that enhances Suzhou Old City’s overall appeal.
Accommodation facilities play a key role in sustaining round-the-clock tourism activity. The high clustering effect of lodging facilities near Guanqian Street makes this area a strategic focal point for improving accommodation quality and diversity. Expanding boutique hotels and culturally themed guesthouses can cater to the growing demand for authentic and experience-driven stays, reinforcing Suzhou’s cultural identity. Meanwhile, areas such as the railway station and the Humble Administrator’s Garden cluster should introduce higher-quality, multifunctional lodging options to better accommodate tourists. The adoption of smart hotel management systems can further enhance service efficiency, ensuring seamless and round-the-clock accommodation experiences, thereby strengthening the city’s 24-h tourism appeal.
In addition to optimizing infrastructure, redefining the role of shopping facilities is critical for revitalizing the tourism economy. Currently, retail establishments primarily serve basic consumer needs, exerting only a limited pull on visitor engagement. It is recommended to leverage cultural and creative transformation as a catalyst for developing themed markets, integrating local intangible cultural heritage techniques such as clay sculpture, woodblock prints, and Kunqu opera, to create distinctive and branded shopping experiences. By deeply integrating retail with dining, cultural performances, and nighttime tourism, shopping districts can be reimagined as multifunctional experiential spaces, encouraging longer visitor stays and increased spending. This shift from standardized retail to experience-driven commerce not only enhances economic sustainability but also strengthens Suzhou Old City’s cultural identity and overall tourism appeal.
5. Limitations and Future Prospects
This study adopts urban blocks as the fundamental research unit. However, variations in the spatial scale of the selected 52 blocks may introduce inconsistencies in precision and applicability. Future research should refine the delineation of research units by integrating spatial equilibrium and functional attributes to develop a more granular analytical framework, enabling a comprehensive representation of intraregional spatial characteristics. Moreover, the Baidu Huiyan data mainly come from user behavior on Baidu Maps and related applications, which may not fully represent tourists who do not use Baidu applications, especially those using other map platforms. Additionally, since the dataset is primarily based on smartphone users, it overlooks tourist groups that do not use smartphones, which may impact the representativeness and comprehensiveness of the results. To address this limitation, future studies could incorporate questionnaires, in-depth interviews, and volunteered geographic information (VGI) to capture tourists’ subjective perceptions and behavioral preferences. This multi-dimensional analytical approach, integrating both objective data and subjective insights, would allow for a more holistic examination of how the tourism environment influences urban vitality across multiple dimensions. Expanding the scope of case study cities and data sources is also essential for future research. The integration of high-resolution remote sensing imagery and advanced information and communication technology (ICT) platforms can enhance data accuracy and validation. From a temporal perspective, employing more refined temporal aggregation and segmentation methods can help uncover spatiotemporal heterogeneity in the impact of urban morphology on tourism vitality. Additionally, further analysis of the complex relationships between tourism vitality and attraction factors across multiple spatial scales is necessary. Exploring the spatial heterogeneity and impact mechanisms at national, regional, and urban levels will provide systematic theoretical support and practical guidance for optimizing tourism spatial structures, enhancing resource utilization efficiency, and promoting sustainable tourism development.
Author Contributions
Conceptualization, M.Z.; methodology, M.Z.; software, M.Z.; validation, M.Z.; formal analysis, M.Z.; investigation, M.Z.; resources, M.Z.; data curation, M.Z.; writing—original draft preparation, M.Z.; writing—review and editing, M.Z.; visualization, M.Z.; supervision, J.Y.; project administration, J.Y.; funding acquisition, J.Y. All authors have read and agreed to the published version of the manuscript.
Funding
This research was funded by the National Natural Science Foundation of China: Research on the methods of comprehensive evaluation of old city capacity and optimization decision-making of multi-objective and multi-scenario (52278049).
Data Availability Statement
The data that support the findings of this study are available on request from the corresponding author.
Conflicts of Interest
The authors declare no conflicts of interest. The funders had no role in the design of this study; in the collection, analyses, or interpretation of data; in the writing of this manuscript; or in the decision to publish the results.
References
- Van Oers, R.; Pereira Roders, A. Historic cities as model of sustainability. J. Cult. Herit. Manag. Sustain. Dev. 2012, 2, 4–14. [Google Scholar] [CrossRef]
- Yang, J. Conservation of Historic and Cultural Cities Based on Urban Development Mechanisms. Urban Dev. Stud. 2009, 16, 139–142. (In Chinese) [Google Scholar]
- World Tourism Organization (UNWTO) (Ed.) Charter for Sustainable Tourism. In UNWTO Declarations; UNWTO: Madrid, Spain, 1995; Volume 5, pp. 1–12. [Google Scholar] [CrossRef]
- Richards, G. Cultural tourism: A review of recent research and trends. J. Hosp. Tour. Manag. 2018, 36, 12–21. [Google Scholar] [CrossRef]
- Cai, J. Strategic thinking on the development of tourism in Haixi region in the era of high-speed rail. Dev. Stud. 2012, 29, 90–98. (In Chinese) [Google Scholar]
- Richard, B. The Tourism Area Life Cycle; Channel View Publications: Bristol, UK, 2006; Volume 1. [Google Scholar]
- Bertocchi, D.; Camatti, N. Tourism in Venice: Mapping overtourism and exploring solutions. In A Research Agenda for Urban Tourism; Edward Elgar Publishing: Cheltenham, UK, 2022; pp. 107–125. [Google Scholar]
- Dodds, R.; Butler, R. The phenomena of overtourism: A review. Int. J. Tour. Cities 2019, 5, 519–528. [Google Scholar] [CrossRef]
- García-Hernández, M.; De La Calle-Vaquero, M.; Yubero, C. Cultural Heritage and Urban Tourism: Historic City Centres under Pressure. Sustainability 2017, 9, 1346. [Google Scholar] [CrossRef]
- Yang, L.; Durarte, C.M. Identifying tourist-functional relations of urban places through Foursquare from Barcelona. GeoJournal 2021, 86, 1–18. [Google Scholar] [CrossRef]
- Genc, K.; Tûrkay, O.; Ulema, E. Tourism gentrification: Barcelona and Venice. Tur. Soc. 2022, 31, 125–140. [Google Scholar]
- Roman, M.; Bury, K. The Tourist Attractiveness of Tokyo in the Opinion of Surveyed Tourists. Tour. Hosp. 2022, 3, 184–209. [Google Scholar] [CrossRef]
- Wang, F.; Li, J.; Yu, F.; He, H.; Zhen, F. Space, function, and vitality in historic areas: The tourismification process and spatial order of Shichahai in Beijing. Int. J. Tour. Res. 2018, 20, 335–344. [Google Scholar] [CrossRef]
- Wang, Z.; Wu, Q.; Wu, J.; Sun, J.; Zhao, J.; Xu, Z. A Study on Market Threshold of Planning Projects Based on The Philosophy of Post-Modern Tourism Consumption Culture—A Case Study of Tourism Project of Scenic Spot. Hum. Geogr. 2010, 25, 93–97. [Google Scholar]
- Dulce, C.; Muntele, I.; Istrate, M. How Do Cultural Vitality and Socio-economic Factors Influence Urban Tourism? Evidence from Romanian Cities. In Cultural Sustainable Tourism; Vujicic, M.D., Kasim, A., Kostopoulou, S., Chica Olmo, J., Aslam, M., Eds.; Springer International Publishing: Cham, Switzerland, 2022; pp. 205–218. [Google Scholar]
- Lupchian, M.-M.; Saghin, D. The cultural vitality of cities-a premise of tourism development? GEOREVIEW Sci. Ann. Stefan Cel Mare Univ. Suceava. Geogr. Ser. 2020, 30, 1–9. [Google Scholar] [CrossRef]
- Su, M.M.; Wall, G. Chinese research on world heritage tourism. Asia Pac. J. Tour. Res. 2011, 16, 75–88. [Google Scholar] [CrossRef]
- Chen, Y.-C.; Yao, H.-L.; Weng, S.-D.; Tai, Y.-F. An analysis of the optimal facility location of tourism industry in plain region by utilizing GIS. SAGE Open 2022, 12, 21582440221095020. [Google Scholar] [CrossRef]
- Otto, J.E.; Ritchie, J.B. The service experience in tourism. Tour. Manag. 1996, 17, 165–174. [Google Scholar] [CrossRef]
- Crouch, G.I.; Ritchie, J.B. Tourism, competitiveness, and societal prosperity. J. Bus. Res. 1999, 44, 137–152. [Google Scholar] [CrossRef]
- Hall, C.M.; Page, S.J. The Geography of Tourism and Recreation: Environment, Place and Space; Routledge: London, UK, 2014. [Google Scholar]
- Wang, Y.; You, Y.; Huang, J.; Yue, X.; Sun, G. Differences in urban daytime and night block vitality based on mobile phone signaling data: A case study of Kunming’s urban district. Open Geosci. 2024, 16, 20220596. [Google Scholar] [CrossRef]
- Sulis, P.; Manley, E.; Zhong, C.; Batty, M. Using mobility data as proxy for measuring urban vitality. J. Spat. Inf. Sci. 2018, 16, 137–162. [Google Scholar] [CrossRef]
- Zhang, Y.; Shang, K.; Shi, Z.; Wang, H.; Li, X. Spatial pattern of the vitality of Chinese characteristic towns: A perspective from nighttime lights. Land 2022, 11, 85. [Google Scholar] [CrossRef]
- Kim, Y.-L. Seoul’s Wi-Fi hotspots: Wi-Fi access points as an indicator of urban vitality. Comput. Environ. Urban Syst. 2018, 72, 13–24. [Google Scholar] [CrossRef]
- Jia, C.; Du, Y.; Wang, S.; Bai, T.; Fei, T. Measuring the vibrancy of urban neighborhoods using mobile phone data with an improved PageRank algorithm. Trans. GIS 2019, 23, 241–258. [Google Scholar] [CrossRef]
- Li, W.; Chen, T.; Ma, X. Spatial hotspots’ characteristics and mechanisms of the urban tourism and leisure industry in Xi’an City. Sci. Geogr. Sin. 2020, 40, 437–446. [Google Scholar]
- Zhao, M.; Liu, J. Study on Spatial Structure Characteristics of the Tourism and Leisure Industry. Sustainability 2021, 13, 13117. [Google Scholar] [CrossRef]
- Bitaraf, A.; Saeedeh Zarabadi, Z.S.; Zabihi, H. Assessing the Criteria of Vitality in Historical Places with Emphasis on the Approach of Heritage Tourism Development Case Study: Historical Buildings of District 12 of Tehran. Urban Tour. 2022, 8, 103–115. [Google Scholar]
- Xu, Y.; Rollo, J.; Jones, D.S.; Esteban, Y.; Tong, H.; Mu, Q. Towards sustainable heritage tourism: A space syntax-based analysis method to improve tourists’ spatial cognition in Chinese historic districts. Buildings 2020, 10, 29. [Google Scholar] [CrossRef]
- Liu, J.; Yu, Y.; Chen, P.; Chen, B.Y.; Chen, L.; Chen, R. Facilitating urban tourism governance with crowdsourced big data: A framework based on Shenzhen and Jiangmen, China. Int. J. Appl. Earth Obs. Geoinf. 2023, 124, 103509. [Google Scholar] [CrossRef]
- Marine-Roig, E. Measuring online destination image, satisfaction, and loyalty: Evidence from Barcelona districts. Tour. Hosp. 2021, 2, 62–78. [Google Scholar] [CrossRef]
- Xue, B.; Li, J.; Xiao, X.; Xie, X.; Lu, C.; Ren, W.; Jiang, L. A review of human-land relationship research based on point of interest (POI) big data: Theory, methods and applications. Geogr. Geo-Inf. Sci. 2019, 35, 51–60. [Google Scholar]
- Giglio, S.; Bertacchini, F.; Bilotta, E.; Pantano, P. Using social media to identify tourism attractiveness in six Italian cities. Tour. Manag. 2019, 72, 306–312. [Google Scholar] [CrossRef]
- Kourtit, K.; Nijkamp, P.; Östh, J.; Türk, U. A Digital ‘Smiley’ Analysis of the Appreciation for Tourist Amenities by Visitors to London. Appl. Res. Qual. Life 2025, 12, 1–24. [Google Scholar] [CrossRef]
- He, S.; Zhang, Z.; Yu, S.; Xia, C.; Tung, C.-L. Investigating the effects of urban morphology on vitality of community life circles using machine learning and geospatial approaches. Appl. Geogr. 2024, 167, 103287. [Google Scholar] [CrossRef]
- Li, T.; Li, Z.; Cong, Z.; Mao, Y.; Zhang, P. Spatial Heterogeneity of Urban Vitality in Changsha Based on Multiple Methods. Mod. Urban Res. 2024, 39, 25–32. (In Chinese) [Google Scholar]
- National Bureau of Statistics of China. National Tourism and Related Industry Statistical Classification; National Bureau of Statistics of China: Beijing, China, 2018. (In Chinese)
- GB/T 18972-2017; Classification, Investigation and Evaluation of Tourism Resources. General Administration of Quality Supervision, Inspection and Quarantine of the People’s Republic of China, Standardization Administration of China: Beijing, China, 2017. (In Chinese)
- Li, J.; Li, M.; Long, Y.; Dang, A. China Polycentric Cities Based on Baidu Heatmap. Shanghai Urban Plan. Rev. 2016, 3, 30–36. [Google Scholar]
- Buhalis, D. Marketing the competitive destination of the future. Tour. Manag. 2000, 21, 97–116. [Google Scholar] [CrossRef]
- Zhu, Y.; Wu, Q. Study on vitality theory of tourist destination. Geogr. Geo-Inf. Sci. 2008, 24, 100–104. [Google Scholar]
- Walmsley, D.J.; Lewis, G.J. People and Environment: Behavioural Approaches in Human Geography; Routledge: London, UK, 2014. [Google Scholar]
- Fotheringham, A.S.; Yang, W.; Kang, W. Multiscale geographically weighted regression (MGWR). Ann. Assoc. Am. Geogr. 2017, 107, 1247–1265. [Google Scholar] [CrossRef]
- Chen, H.; Hu, L.; Liu, Z.; Chen, B. Spatial heterogeneity and interaction effect of urban blue and green spaces on housing prices. Int. J. Strat. Prop. Manag. 2024, 28, 302–319. [Google Scholar] [CrossRef]
- Qin, L.; Zong, W.; Peng, K.; Zhang, R. Assessing Spatial Heterogeneity in Urban Park Vitality for a Sustainable Built Environment: A Case Study of Changsha. Land 2024, 13, 480. [Google Scholar] [CrossRef]
- Wang, G.; Meng, Y. The clustering characteristics and driving mechanisms of tourist preference for 5a scenic spots from the dynamic spatio-temporal perspective: A case of jiangsu in eastern coastal area of China. Sustainability 2023, 15, 1626. [Google Scholar] [CrossRef]
- Yan, G.; Gennian, S. Spatial correlation and heterogeneity analysis of A-class scenic spots in China. Econ. Geogr. 2022, 42, 194–204. [Google Scholar]
- Lin, C.-H.; Morais, D.B. The spatial clustering effect of destination distribution on cognitive distance estimates and its impact on tourists’ destination choices. J. Travel Tour. Mark. 2008, 25, 382–397. [Google Scholar] [CrossRef]
- Zhou, N.; Liang, Y.; Hang, Q. Dynamic spatial pattern and characteristics on tourism commercialization in the old town of Tongli. J. Nanjing Norm. Univ. Nat. Sci. Ed. 2013, 36, 155–159. [Google Scholar]
- Karagöz, D.; Aktaş, S.; Kantar, Y. Spatial analysis of the relationship between tourist attractions and tourist flows in Turkey. Eur. J. Tour. Res. 2022, 31, 3102. [Google Scholar] [CrossRef]
- Lu, G.; Huang, X.; Lv, S.; Wang, X. Multi-constraint and multi-objective trip recommendation based on internet information. Comput. Eng. Sci. 2016, 38, 163–170. [Google Scholar]
- He, H.; Shen, L.; Wong, S.W.; Cheng, G.; Shu, T. A ‘load-carrier’ perspective approach for assessing tourism resource carrying capacity. Tour. Manag. 2023, 94, 104651. [Google Scholar] [CrossRef]
- Richards, G. Evolving research perspectives on food and gastronomic experiences in tourism. Int. J. Contemp. Hosp. Manag. 2021, 33, 1037–1058. [Google Scholar] [CrossRef]
- Soltani, M.; Nejad, N.S.; Azad, F.T.; Taheri, B.; Gannon, M.J. Food consumption experiences: A framework for understanding food tourists’ behavioral intentions. Int. J. Contemp. Hosp. Manag. 2021, 33, 75–100. [Google Scholar] [CrossRef]
- Lin, B.; Wang, S.; Fu, X.; Yi, X. Beyond local food consumption: The impact of local food consumption experience on cultural competence, eudaimonia and behavioral intention. Int. J. Contemp. Hosp. Manag. 2023, 35, 137–158. [Google Scholar] [CrossRef]
- Valenzuela-Ortiz, A.; Chica-Olmo, J.; Castaneda, J.-A. Location factors and agglomeration economies in the hotel industry: The case of Spain. Eur. J. Manag. Bus. Econ. 2025, 34, 1–22. [Google Scholar] [CrossRef]
- Yoo, C.-K.; Yoon, D.; Park, E. Tourist motivation: An integral approach to destination choices. Tour. Rev. 2018, 73, 169–185. [Google Scholar] [CrossRef]
- Kemperman, A.D.; Borgers, A.W.; Timmermans, H.J. Tourist shopping behavior in a historic downtown area. Tour. Manag. 2009, 30, 208–218. [Google Scholar] [CrossRef]
- Zhang, B.; Luo, M.; Du, Q.; Yi, Z.; Dong, L.; Yu, Y.; Feng, J.; Lin, J. Spatial distribution and suitability evaluation of nighttime tourism in Kunming utilizing multi-source data. Heliyon 2023, 9, e16826. [Google Scholar] [CrossRef] [PubMed]
- Eldridge, A.; Smith, A. Tourism and the night: Towards a broader understanding of nocturnal city destinations. J. Policy Res. Tour. Leis. Events 2019, 11, 371–379. [Google Scholar] [CrossRef]
Disclaimer/Publisher’s Note: The statements, opinions and data contained in all publications are solely those of the individual author(s) and contributor(s) and not of MDPI and/or the editor(s). MDPI and/or the editor(s) disclaim responsibility for any injury to people or property resulting from any ideas, methods, instructions or products referred to in the content. |
© 2025 by the authors. Licensee MDPI, Basel, Switzerland. This article is an open access article distributed under the terms and conditions of the Creative Commons Attribution (CC BY) license (https://creativecommons.org/licenses/by/4.0/).