Article

Research on an Ecological Sensitivity Evaluation of Mountain-Type National Parks Under Multi-Modal Optimization: A Case Study of Shennongjia, China

1
Wuhan Planning and Design Institute (Wuhan Transportation Development Strategy Institute), Wuhan 430010, China
2
Wuhan Institute of Landscape Architectural Design, Wuhan 430022, China
3
Department of Urban Planning, School of Urban Design, Wuhan University, Wuhan 430072, China
*
Author to whom correspondence should be addressed.
Land 2025, 14(5), 923; https://doi.org/10.3390/land14050923
Submission received: 24 February 2025 / Revised: 3 April 2025 / Accepted: 16 April 2025 / Published: 23 April 2025

Abstract

:
As ecologically sensitive zones within natural ecosystems, national parks demand more precise evaluation models for ecological sensitivity assessment. This study takes Shennongjia Forestry District, a pioneer among China’s first-batch national parks, as an study object to optimize the ecological sensitivity evaluation framework. In this study, we developed an integrated methodology incorporating high-precision ASTER GDEM elevation data, Landsat8 TM vegetation density inversion, SWAT-based flash flood simulation, and SVM-LSM landslide prediction while introducing dynamic protection elements including species migration corridors and human activity risks. The results demonstrate that the refined data structure enhances terrain coupling accuracy by transitioning from “Vegetation Type—Runoff Coefficient” to “Vegetation Density—Runoff Coefficient” conversions, with the optimized model exhibiting superior sensitivity in spatial element identification. This approach provides scientifically grounded technical support for balancing ecological conservation and visitor management in protected areas.

1. Introduction

The concept of national parks has evolved from protecting single animal/plant species or scenic views to safeguarding entire interconnected ecosystems. In 2016, the U.S. National Park Service (NPS) formulated detailed scientific management plans for each national park to ensure the effective preservation of natural resources [1]. In 2020, China entered into partnership with the International Union for Conservation of Nature (IUCN) in advancing the construction and management of national parks (IUCN, 2020) [2]. Then, in 2019, China proposed to construct a system of protected areas centered on national parks by prioritizing the protection of the most important areas within the national natural ecosystem, which feature the most unique landscapes, richest natural heritage, and most concentrated biodiversity. Involving a more efficient identification and evaluation of the objects and contents that deserve protection [3], these measures promote the scientific and comprehensive ecological protection of national parks.
Ecological sensitivity evaluation represents a key focus of research on ecological protection [4,5]. As technology advances, especially computers and geographic information systems (GISs), there is a shift in ecological sensitivity evaluation from single-factor to multi-factor assessments. As a result, more elements are introduced, such as water conservation, biodiversity evaluation, and soil conservation, which provides more comprehensive scientific guidance on preserving sensitive ecological areas [6,7,8]. Additionally, a variety of contents are incorporated into ecological protection evaluations, such as carbon sequestration and glacier protection [9,10].
However, three critical limitations persist in existing methodologies: (1) inadequate model adaptability across diverse ecosystems and geographical scales [11], (2) the insufficient integration of dynamic protection elements (e.g., species migration corridors, human activity risks) with static sensitivity metrics [12], and (3) the lack of standardized protocols for multi-source data fusion [13]. While scholars have acknowledged accuracy limitations in conventional models and datasets, current solutions remain fragmented—focusing predominantly on parameter optimization rather than systemic framework development. This methodological fragmentation hinders the operationalization of evaluation outcomes for adaptive management strategies, particularly in protected areas requiring dynamic monitoring capacities [14].
Specifically, allowing for the value assessment requirements for soil conservation and water conservation in national parks, it is imperative to enhance the accuracy of annual average rainfall and surface runoff data (including surface cover and vegetation classification) as the key data [15,16,17]. Three persistent methodological gaps undermine current practices: (1) The precision paradox—while city/county-level studies propose 20–30 m resolution standards [18], statistical yearbook data remain predominantly at the >1:100,000 scale due to meteorological station placement constraints, particularly inadequate in remote parks with complex terrain demanding hydrological precision. (2) Standardization void—no operational guidance exists for upgrading substandard datasets, exacerbated by sparse sampling density (avg. <0.3 meteorological stations/100 km2 in mountain parks), far below the required precision, which is especially true in those remote and sparsely populated national parks where detailed rainfall data are particularly needed due to complex terrain and climate [18,19,20]. (3) Functional disconnect—surface runoff analyses rely on generic vegetation categories (e.g., “forested land”), neglecting the surface cover data, which contain ecophysiological parameters that are critical for rainwater interception (e.g., coniferous vs. broadleaf forest differentiation) [20,21,22,23]. As a matter of fact, general information about surface cover data is used more extensively, which allows for a relatively simplistic surface runoff data analysis.
In terms of ecological sensitivity evaluation models, the current recognized ecological sensitivity assessment models include InVEST for ecosystem service quantification, DPSIR frameworks for human–environment interaction analysis, and AHP-based fuzzy evaluation for multi-criteria decision making. While InVEST excels in spatial explicitness and policy scenario simulations, its reliance on high-resolution input data limits its applications in data-scarce regions [24,25]. The DPSIR model effectively links socio-economic drivers with ecological impacts but struggles with quantitative dynamic feedbacks [26,27]. Machine learning approaches (e.g., Random Forest) demonstrate superior predictive accuracy in complex systems yet suffer from interpretability challenges [28,29]. Meanwhile, most research relies on single models to assess and optimize the ecological environment. However, some models are subjected to significant limitations and are incapable of meeting the needs of multiple ecological protection aspects in various specific environments such as mountainous areas and national parks [30,31]. For example, in biodiversity protection evaluations, which are highly valued in national parks, most models are limited to predicting species distribution (source habitats), and there is a lack of analysis on species migration corridors. Consequently, the conflict zones between wildlife movement paths and human activities are overlooked [32,33]. Regarding soil conservation evaluations, which are commonly required in national parks, the modified Universal Soil Loss Equation (RUSLE) is applied in most studies to identify vulnerable areas. However, the RUSLE, which is only suitable for slope-based models, is unfit to estimate runoff, gully erosion, or deposition and related disasters, which renders it ineffective in mountainous areas where soil erosion hazards are severe [34,35,36]. Therefore, hybrid methodologies integrating geostatistical techniques (e.g., EBK regression–Kriging) with process-based models are emerging as robust solutions for multi-scale assessments. Recent advances prioritize coupled model architectures to balance precision and generalizability, particularly in protected areas requiring adaptive management protocols.
In summary, existing ecological sensitivity assessments face critical limitations in data quality and model adaptability for complex mountain–forest ecosystems. Challenges include insufficient data resolution, fragmented coverage, and oversimplified classifications that inadequately represent heterogeneous environments, coupled with an overreliance on single-model frameworks requiring unrealistic data granularity. This study addresses these gaps through an integrated approach combining ecological refinement with hybrid modeling, systematically incorporating dynamic conservation elements (e.g., species corridors, human activity risks) into sensitivity metrics. By establishing standardized protocols for multi-source data fusion and scenario-adaptive validation, the proposed framework enhances ecological assessment precision and operational utility in data-scarce protected areas. This study emphasizes innovations in assessment frameworks and data refinement techniques, rather than asserting the factual occurrence of disaster-induced disturbances in the Shennongjia Forestry District. Consequently, the research focus will center on vulnerability analysis within the ecological sensitivity evaluation paradigm.

2. Materials and Methods

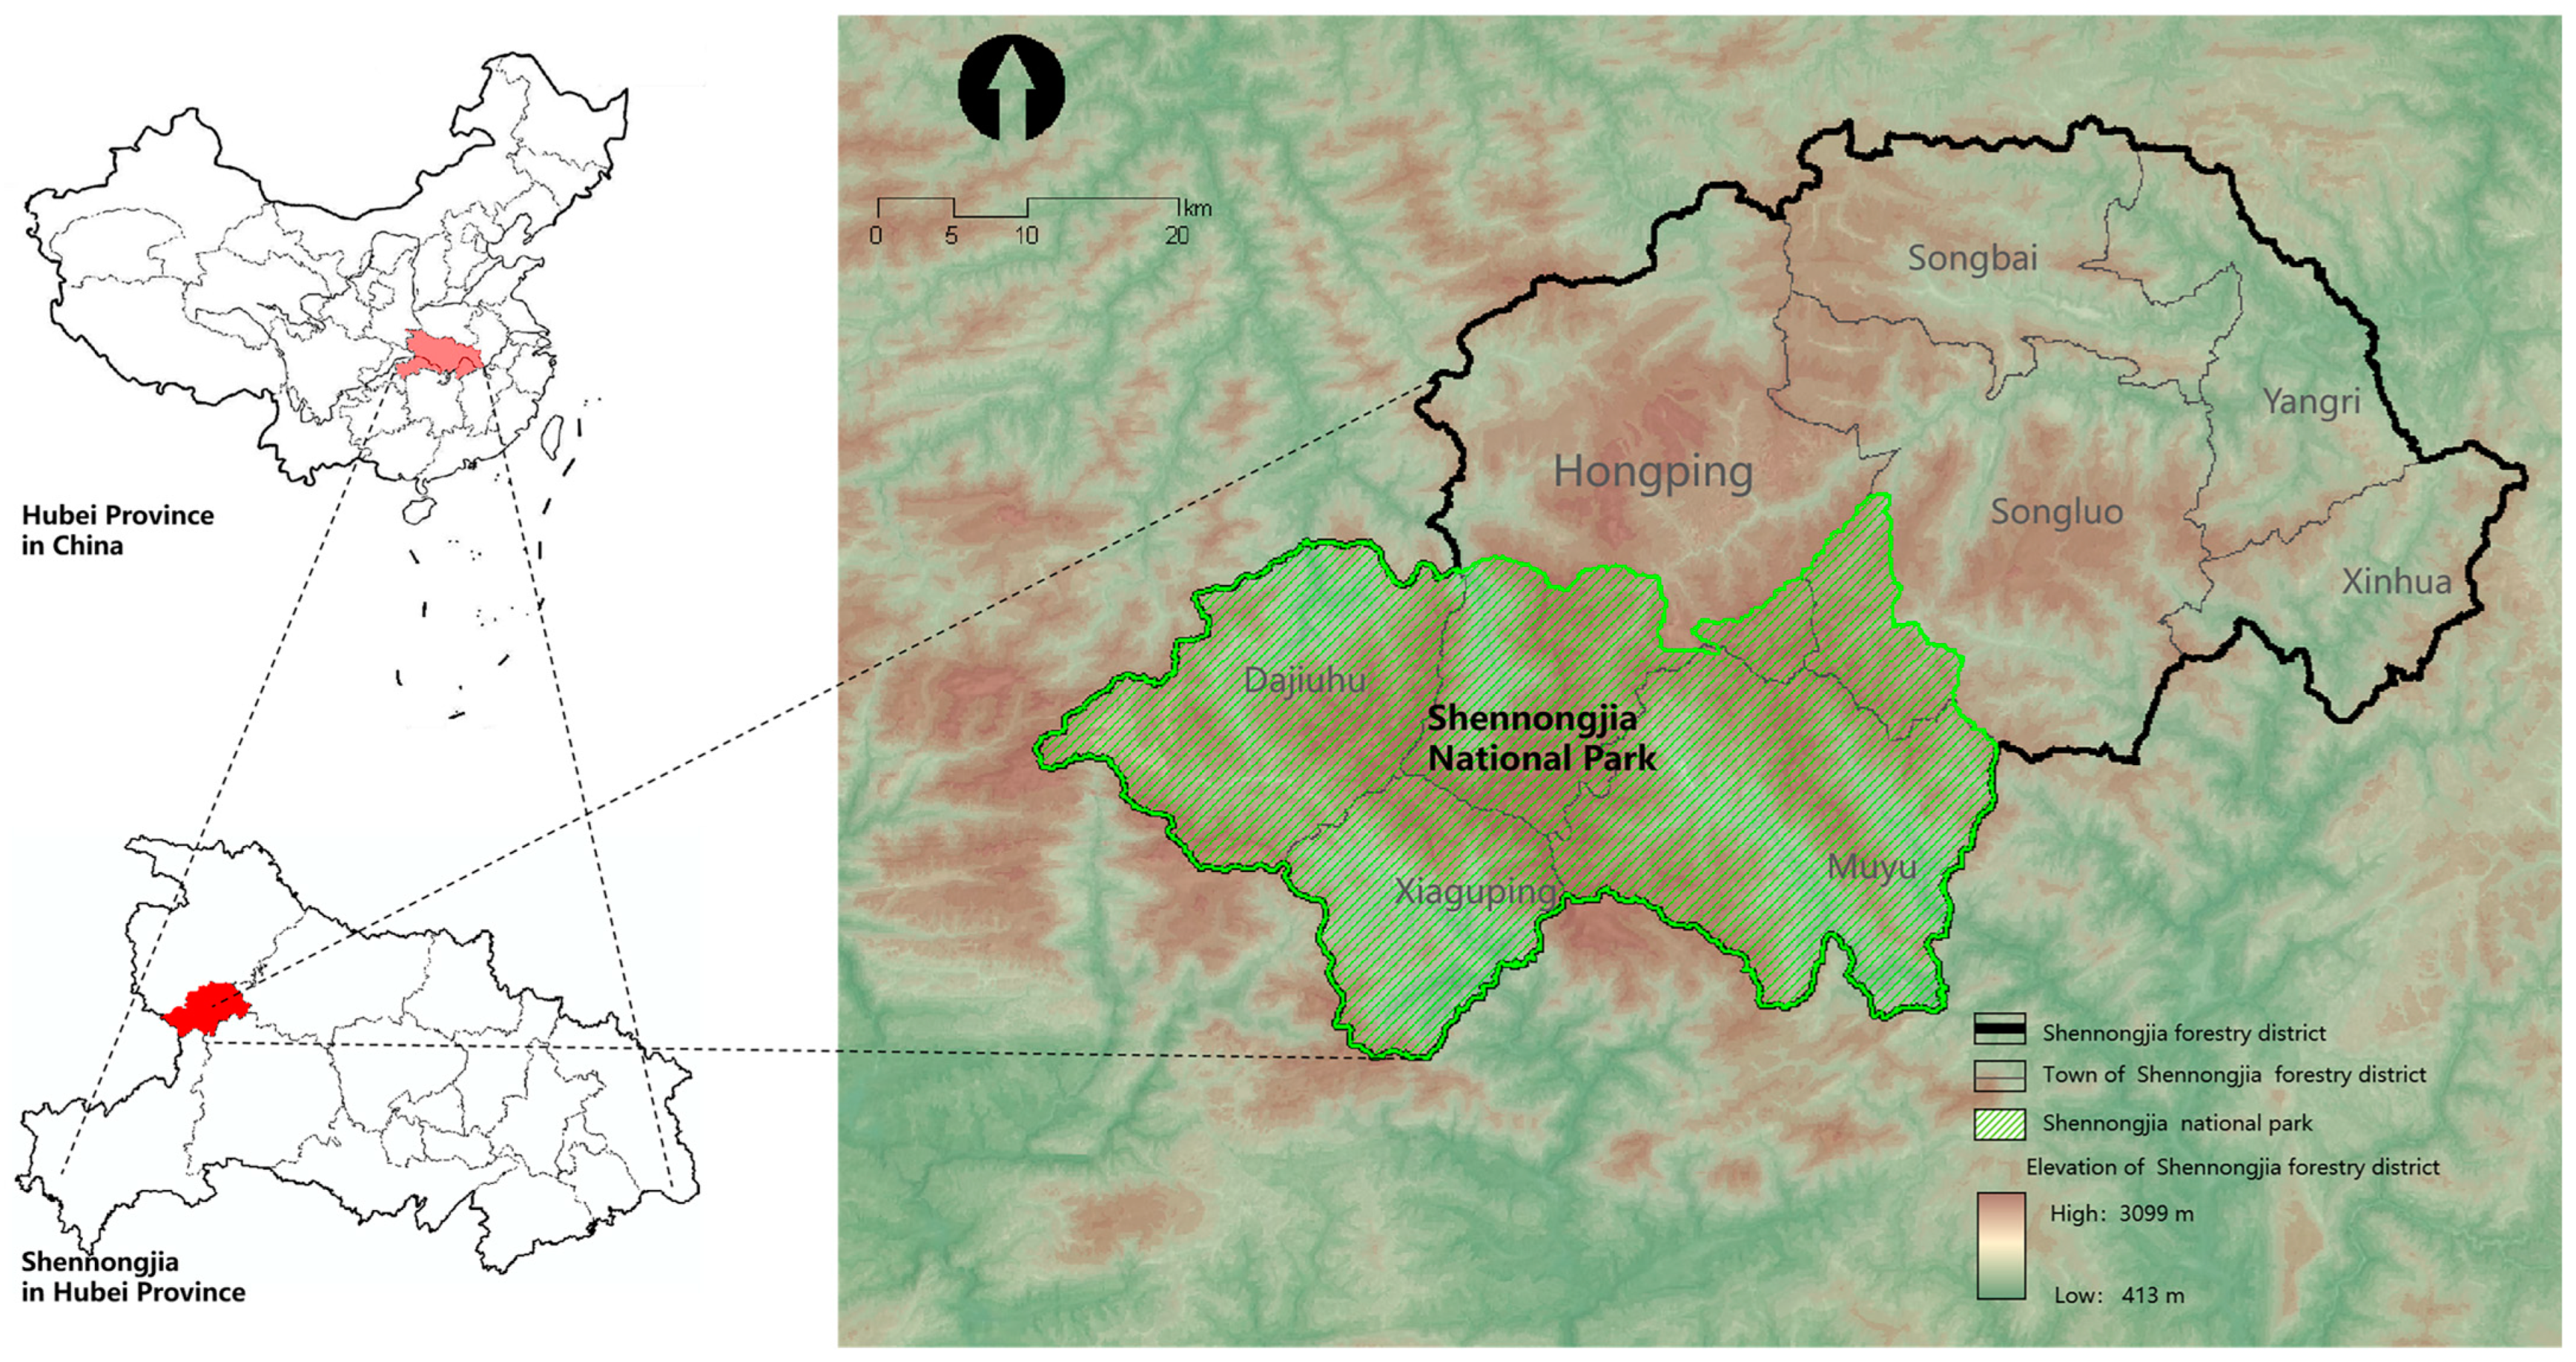
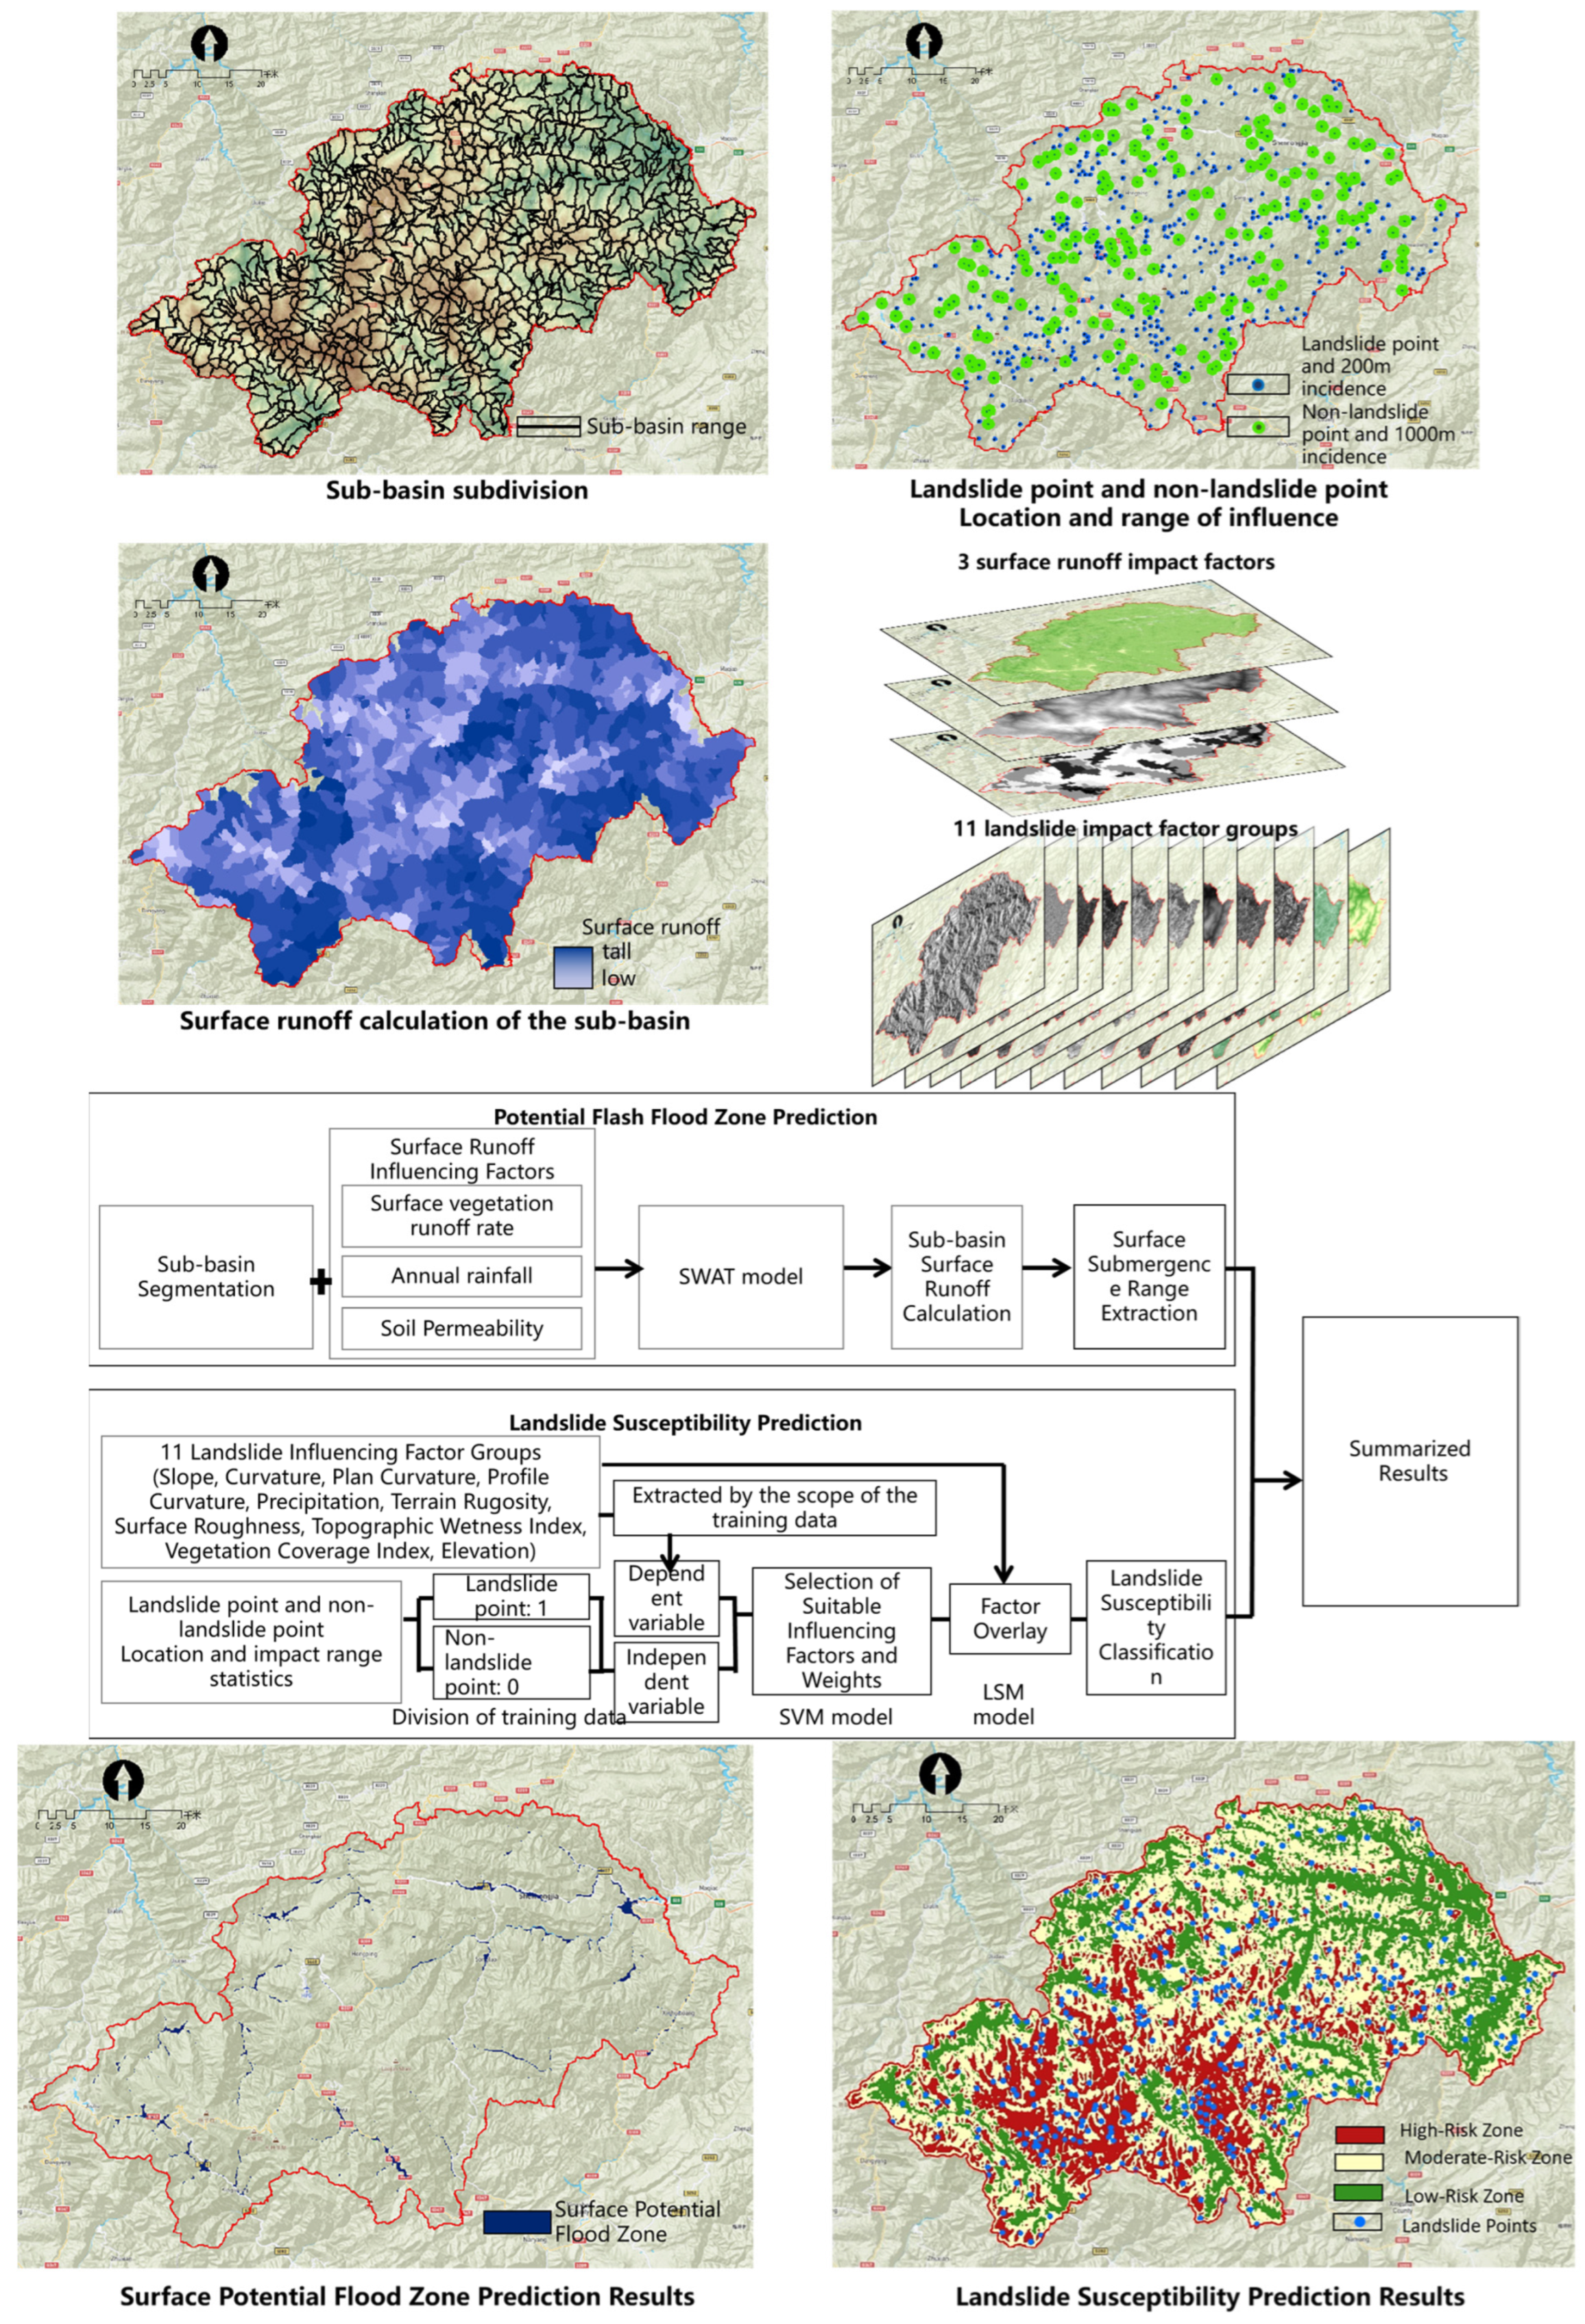
2.1. Study Area and Research Framwork

In 2021, China announced the first batch of 10 national park pilots, more than half of which are characterized by mountainous terrains and forest landscapes, each with rich and diverse ecological environments, characteristic of their settings. Shennongjia National Park is a typical representative among them. Therefore, Shennongjia National Park will be used in this study as a case to conduct research on the ecological sensitivity evaluation of “mountain-type” parks, with the aim of developing the optimized evaluation techniques that can be applied to more similar areas. This is conducive to creating more refined optimization schemes for the ecological environment of mountain-type national parks. Research demonstrates that portions of critical habitats for key protected species in Shennongjia lie beyond the national park boundaries, necessitating ecological considerations to expand the study’s scope. In alignment with local conservation management practices, the entire Shennongjia forestry district encompassing the national park has been included in the research framework [37].
Located in the northwest of Hubei Province, Shennongjia Forestry District covers an area of 3253 square kilometers. Situated in its southwestern part, the national park accounts for about 36% of the total area of the forestry district. It represents the only administrative division in China named “forestry district” (see Figure 1), hosting a globally representative biodiversity system. Included in the “World Network of Biosphere Reserves”, it is regarded as the “Water Tower of Central China”, playing a crucial role in water conservation and soil preservation. In this sense, it is imperative to conduct targeted ecological sensitivity evaluations on water conservation, biodiversity, and soil preservation. The International Union for the Conservation of Nature (IUCN) report identifies Shennongjia as “the most intact subtropical forest ecosystem at its latitude in the Northern Hemisphere”, hosting exceptionally rich biodiversity through its “unique transitional zone between subtropical and warm-temperate flora” [38].
Through the integration of current research experiences and innovation, this paper aims to construct a more scientific and comprehensive evaluation technology system, producing more precise and effective results for mountain national parks (see Figure 2).

2.2. Research Data

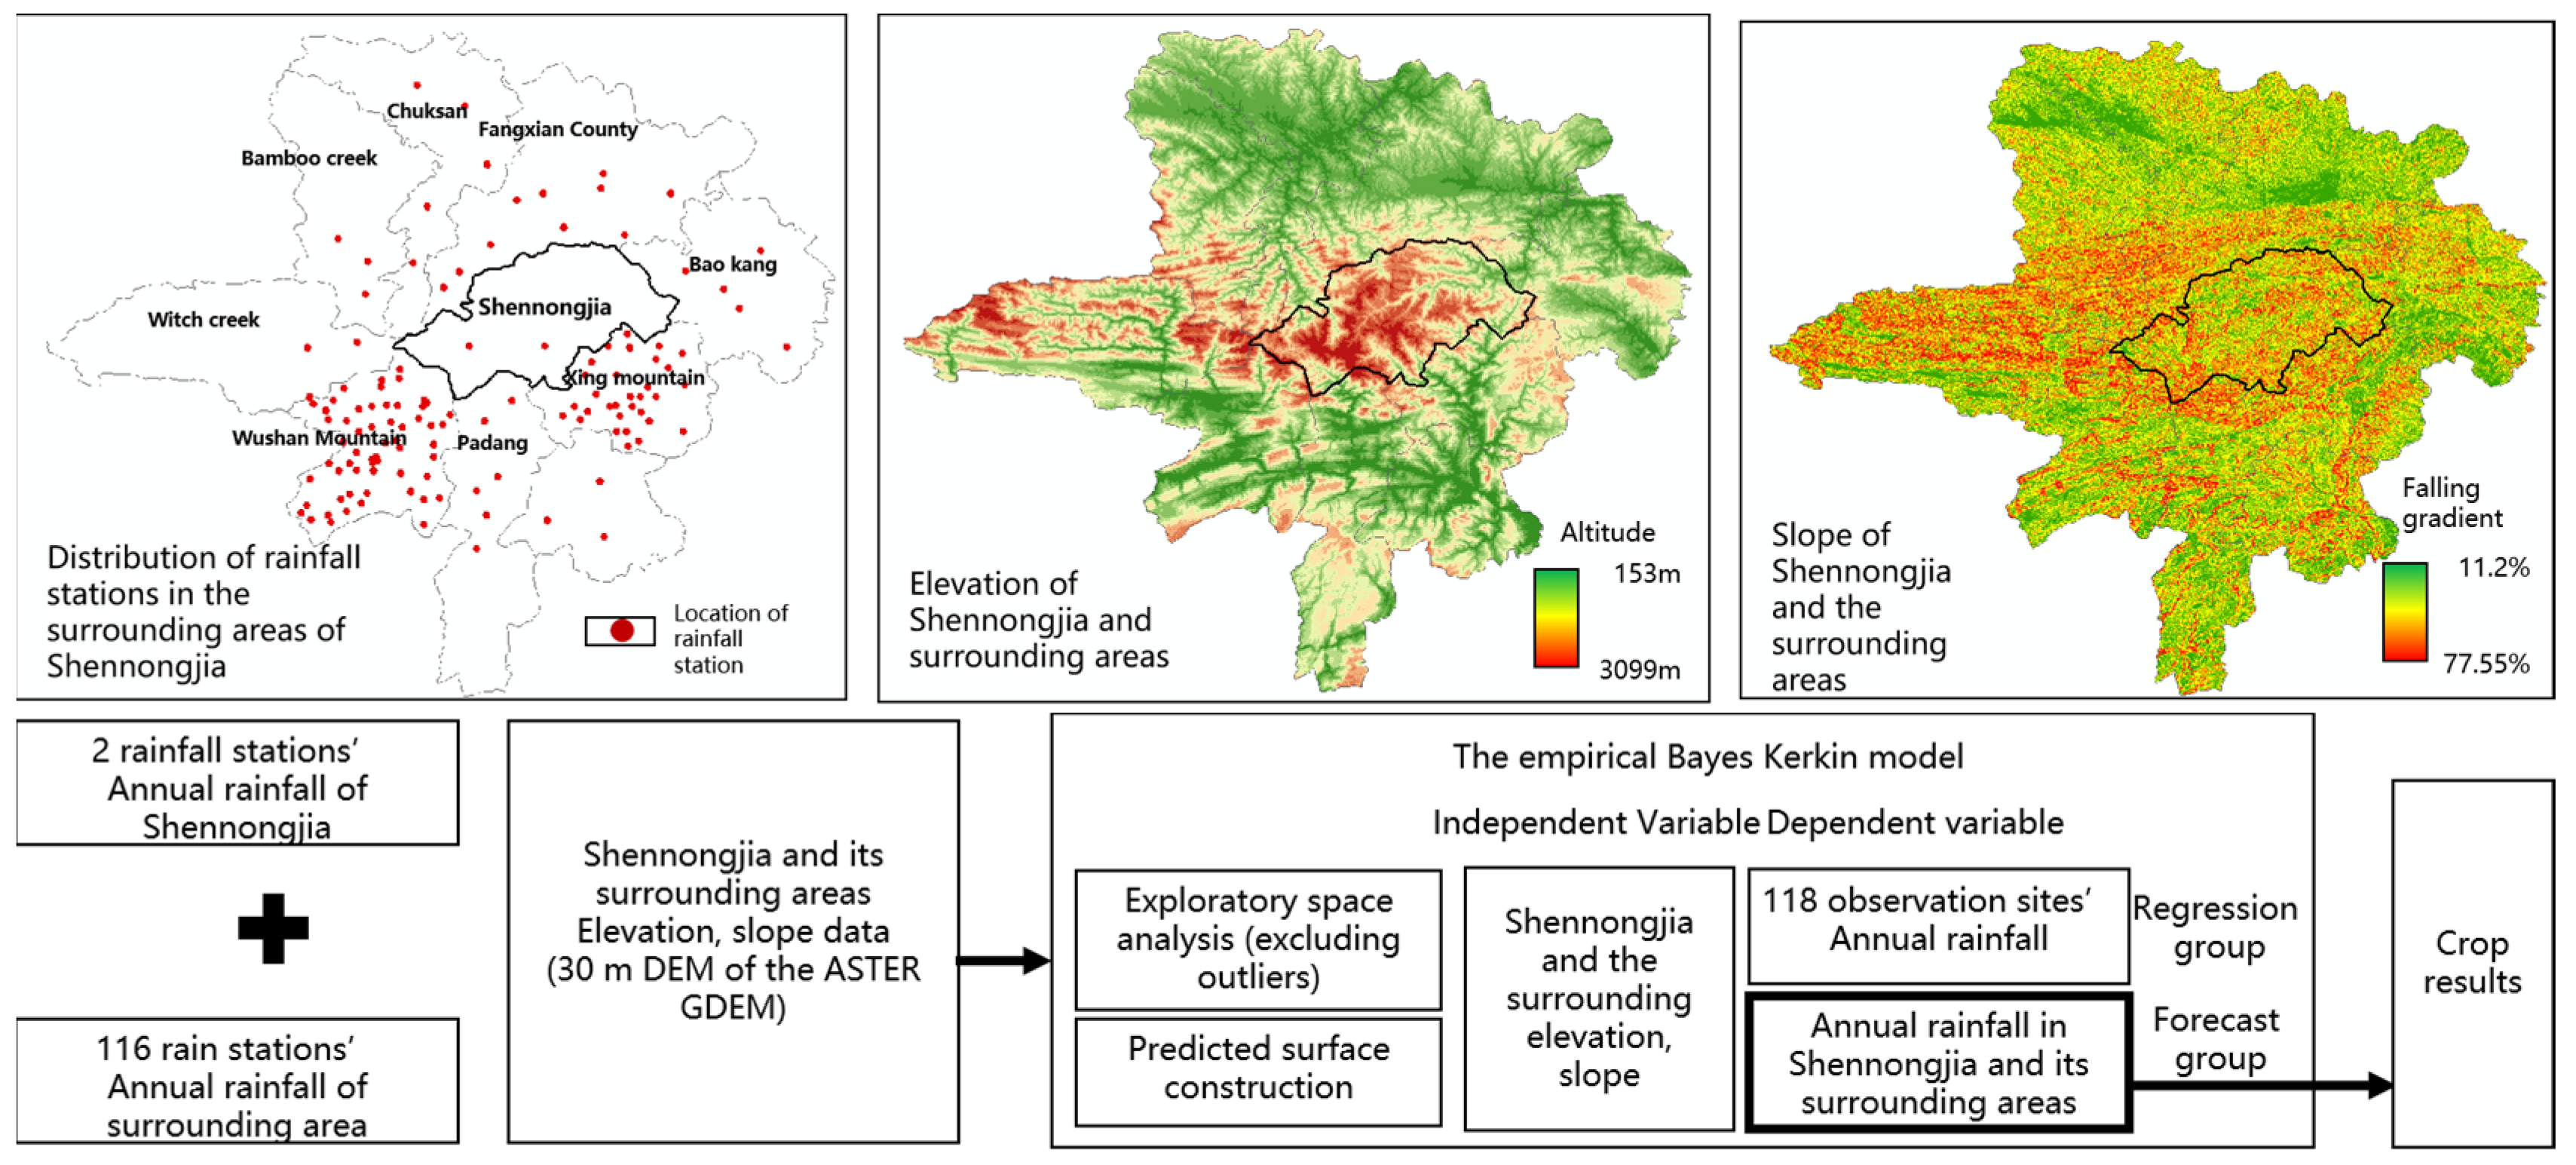
2.2.1. Rainfall Data Optimization

In general, traditional spatial rainfall data are generated through the spatial interpolation of station data, such as the Kriging method [39,40]. However, there are only two meteorological stations in Shennongjia Forestry District, as a result of which data density is insufficient for high-precision interpolation. To address the insufficiency of sampling points, it is proposed in this paper that the quality of the predicted data can be enhanced by combining Kriging with regression models to form an EBK Regression Prediction (Esri) and incorporating high-precision known spatial independent variables, given a close spatial relationship between local rainfall and the terrain. As documented in ESRI’s ArcGIS10.8 Pro software documentation and relevant research papers, this approach integrates Empirical Bayesian Kriging (EBK) with known explanatory variable rasters to influence interpolated data values. By combining Kriging with regression analysis, the method produces more accurate predictions than those achieved using either regression analysis or Kriging alone [41,42,43].
As suggested by scholars, the tertiary uplift terrain of western Hubei, where Shennongjia is located, causes intense water vapor lifting and increases rainfall by blocking the low vortex mountain-climbing air flows from the southwest Sichuan direction [44], which illustrates the correlation between rainfall and local terrain around Shennongjia and its neighboring areas. Additionally, scholars collected data from 58 local rainfall stations and 30 m elevation data from ASTER GDEM in Wushan County to the south of Shennongjia Forestry District making EBK regression predictions to obtain more precise local rainfall data [45,46]. For this reason, meteorological station data are comprehensively collected in this paper from around Shennongjia Forestry District, including 58 township weather stations in Wushan County, 31 in Xingshan County, and scattered sites in Baokang, Fang County, Zhushan, Zhuxi, and Wuxi. Additionally, 30 m DEM data are used to obtain more accurate rainfall data (see Figure 3).

2.2.2. Surface Runoff Coefficient Optimization

The evaluation results are of low accuracy as traditional surface runoff coefficients are limited due to missing surface vegetation data (hence the use of surface cover data) [47,48]. Therefore, multiple studies are integrated in this paper to construct a process of “Vegetation Density—Surface Vegetation Runoff Coefficient” analysis, with data granularity improved by using local and surrounding sampling point data and regression models (see Figure 4).
The procedures are detailed as follows:
  • Forest vegetation density is inverted using the remote sensing Kirchhoff Transform formula. Specifically, the sampling point data include 25 existing local sampling points collected by scholars, 20 additional sampling points supplemented by the author through street view photos on Baidu Maps and the well-known domestic outdoor sports website “2bulu” (https://www.2bulu.com/) (accessed on 3 April 2023), and a variety of factors such as the ratio vegetation index, moisture, brightness, and greenness generated from Landsat8 TM’s 30 m data, which are treated as independent variables for the regression and prediction groups.
  • Forest density is converted to surface runoff coefficient via a multivariate regression model, where the independent variables include multiple measured results of forest vegetation runoff from the surrounding areas with similar climate and terrain conditions (Chongqing) [49,50].

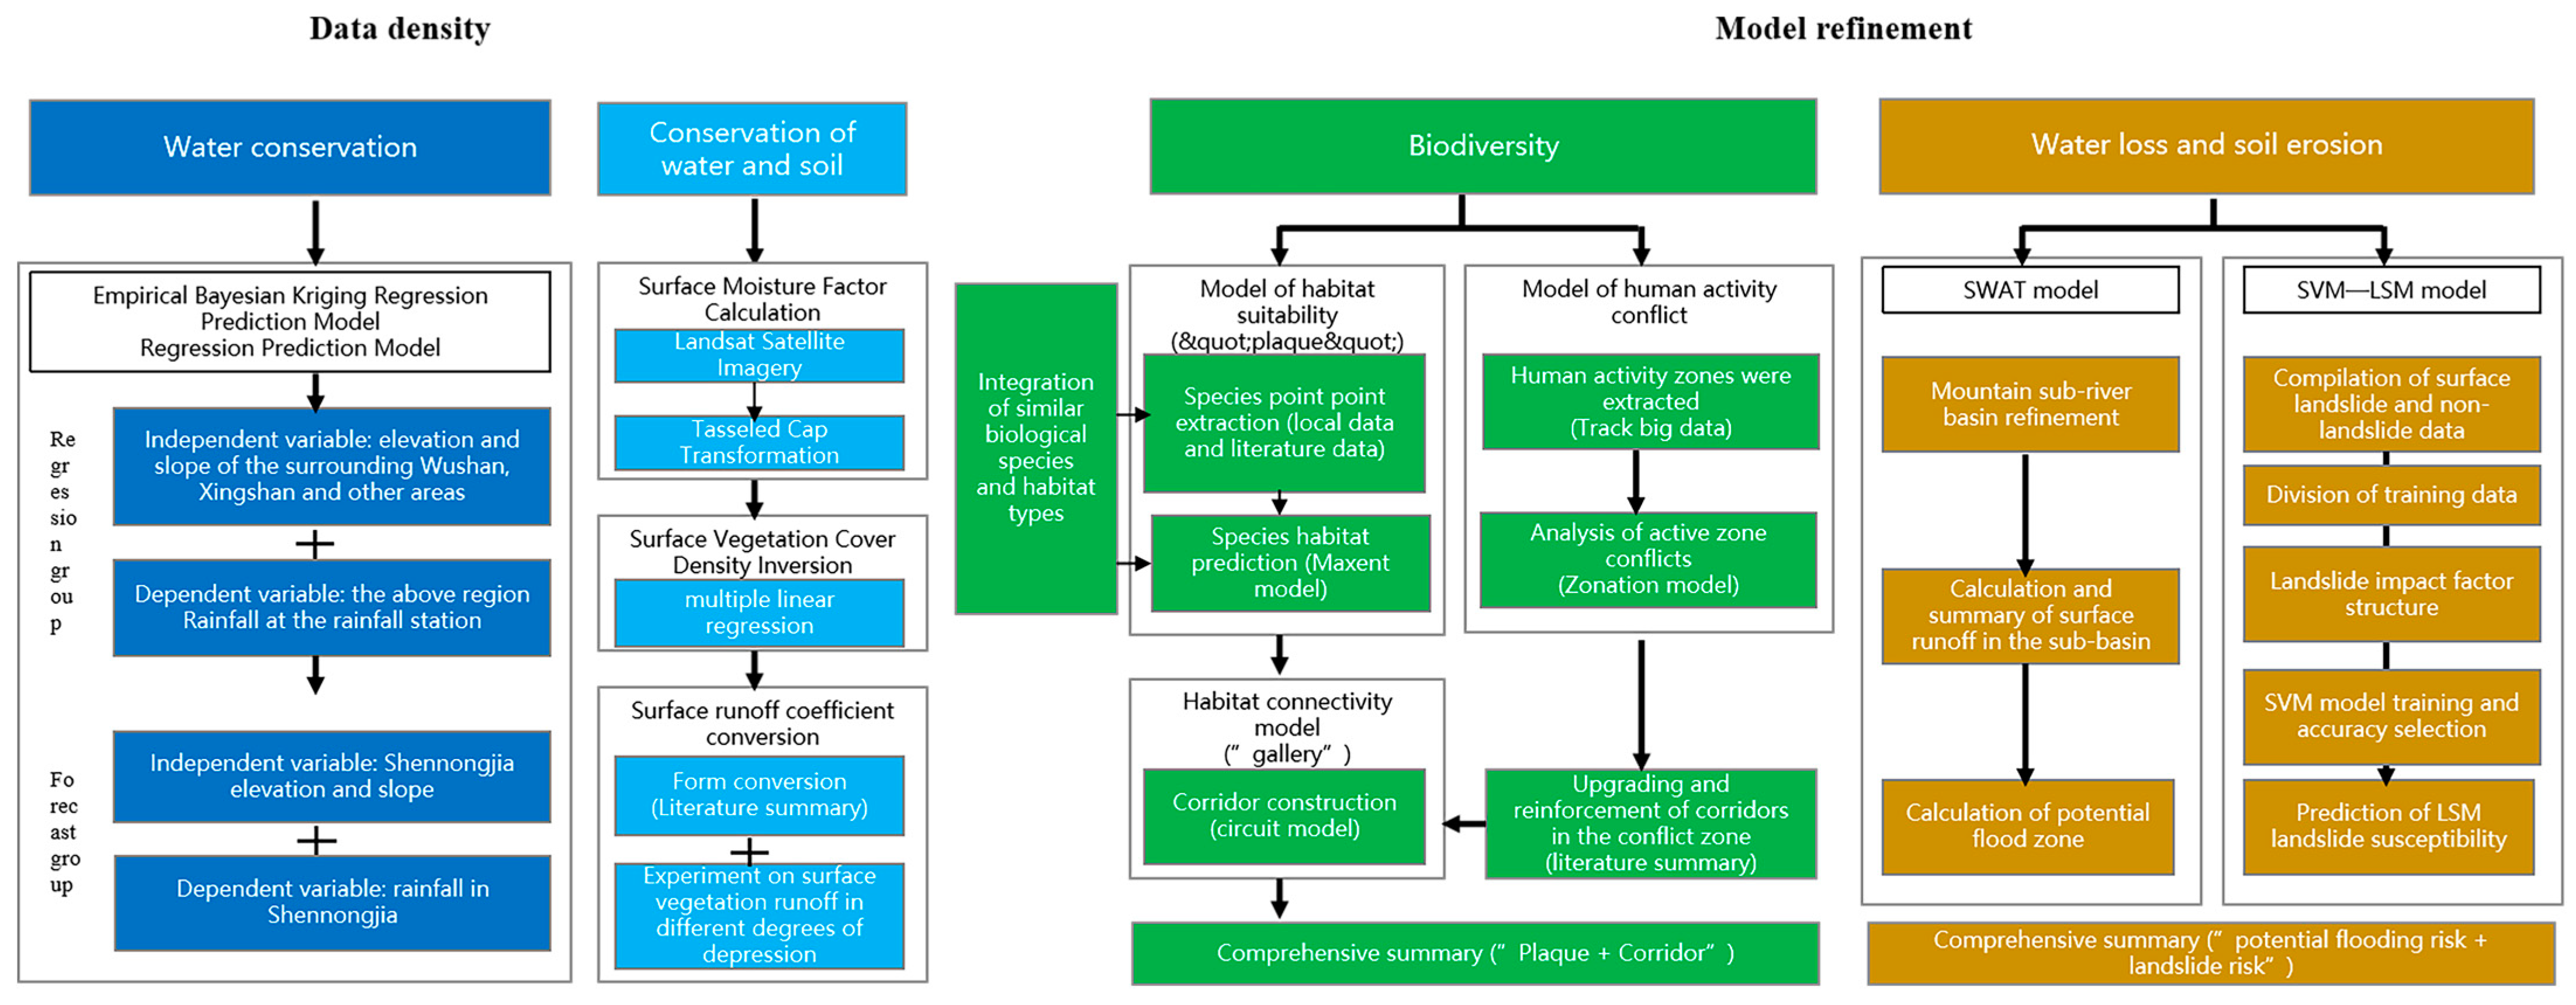
2.3. Evaluation Model

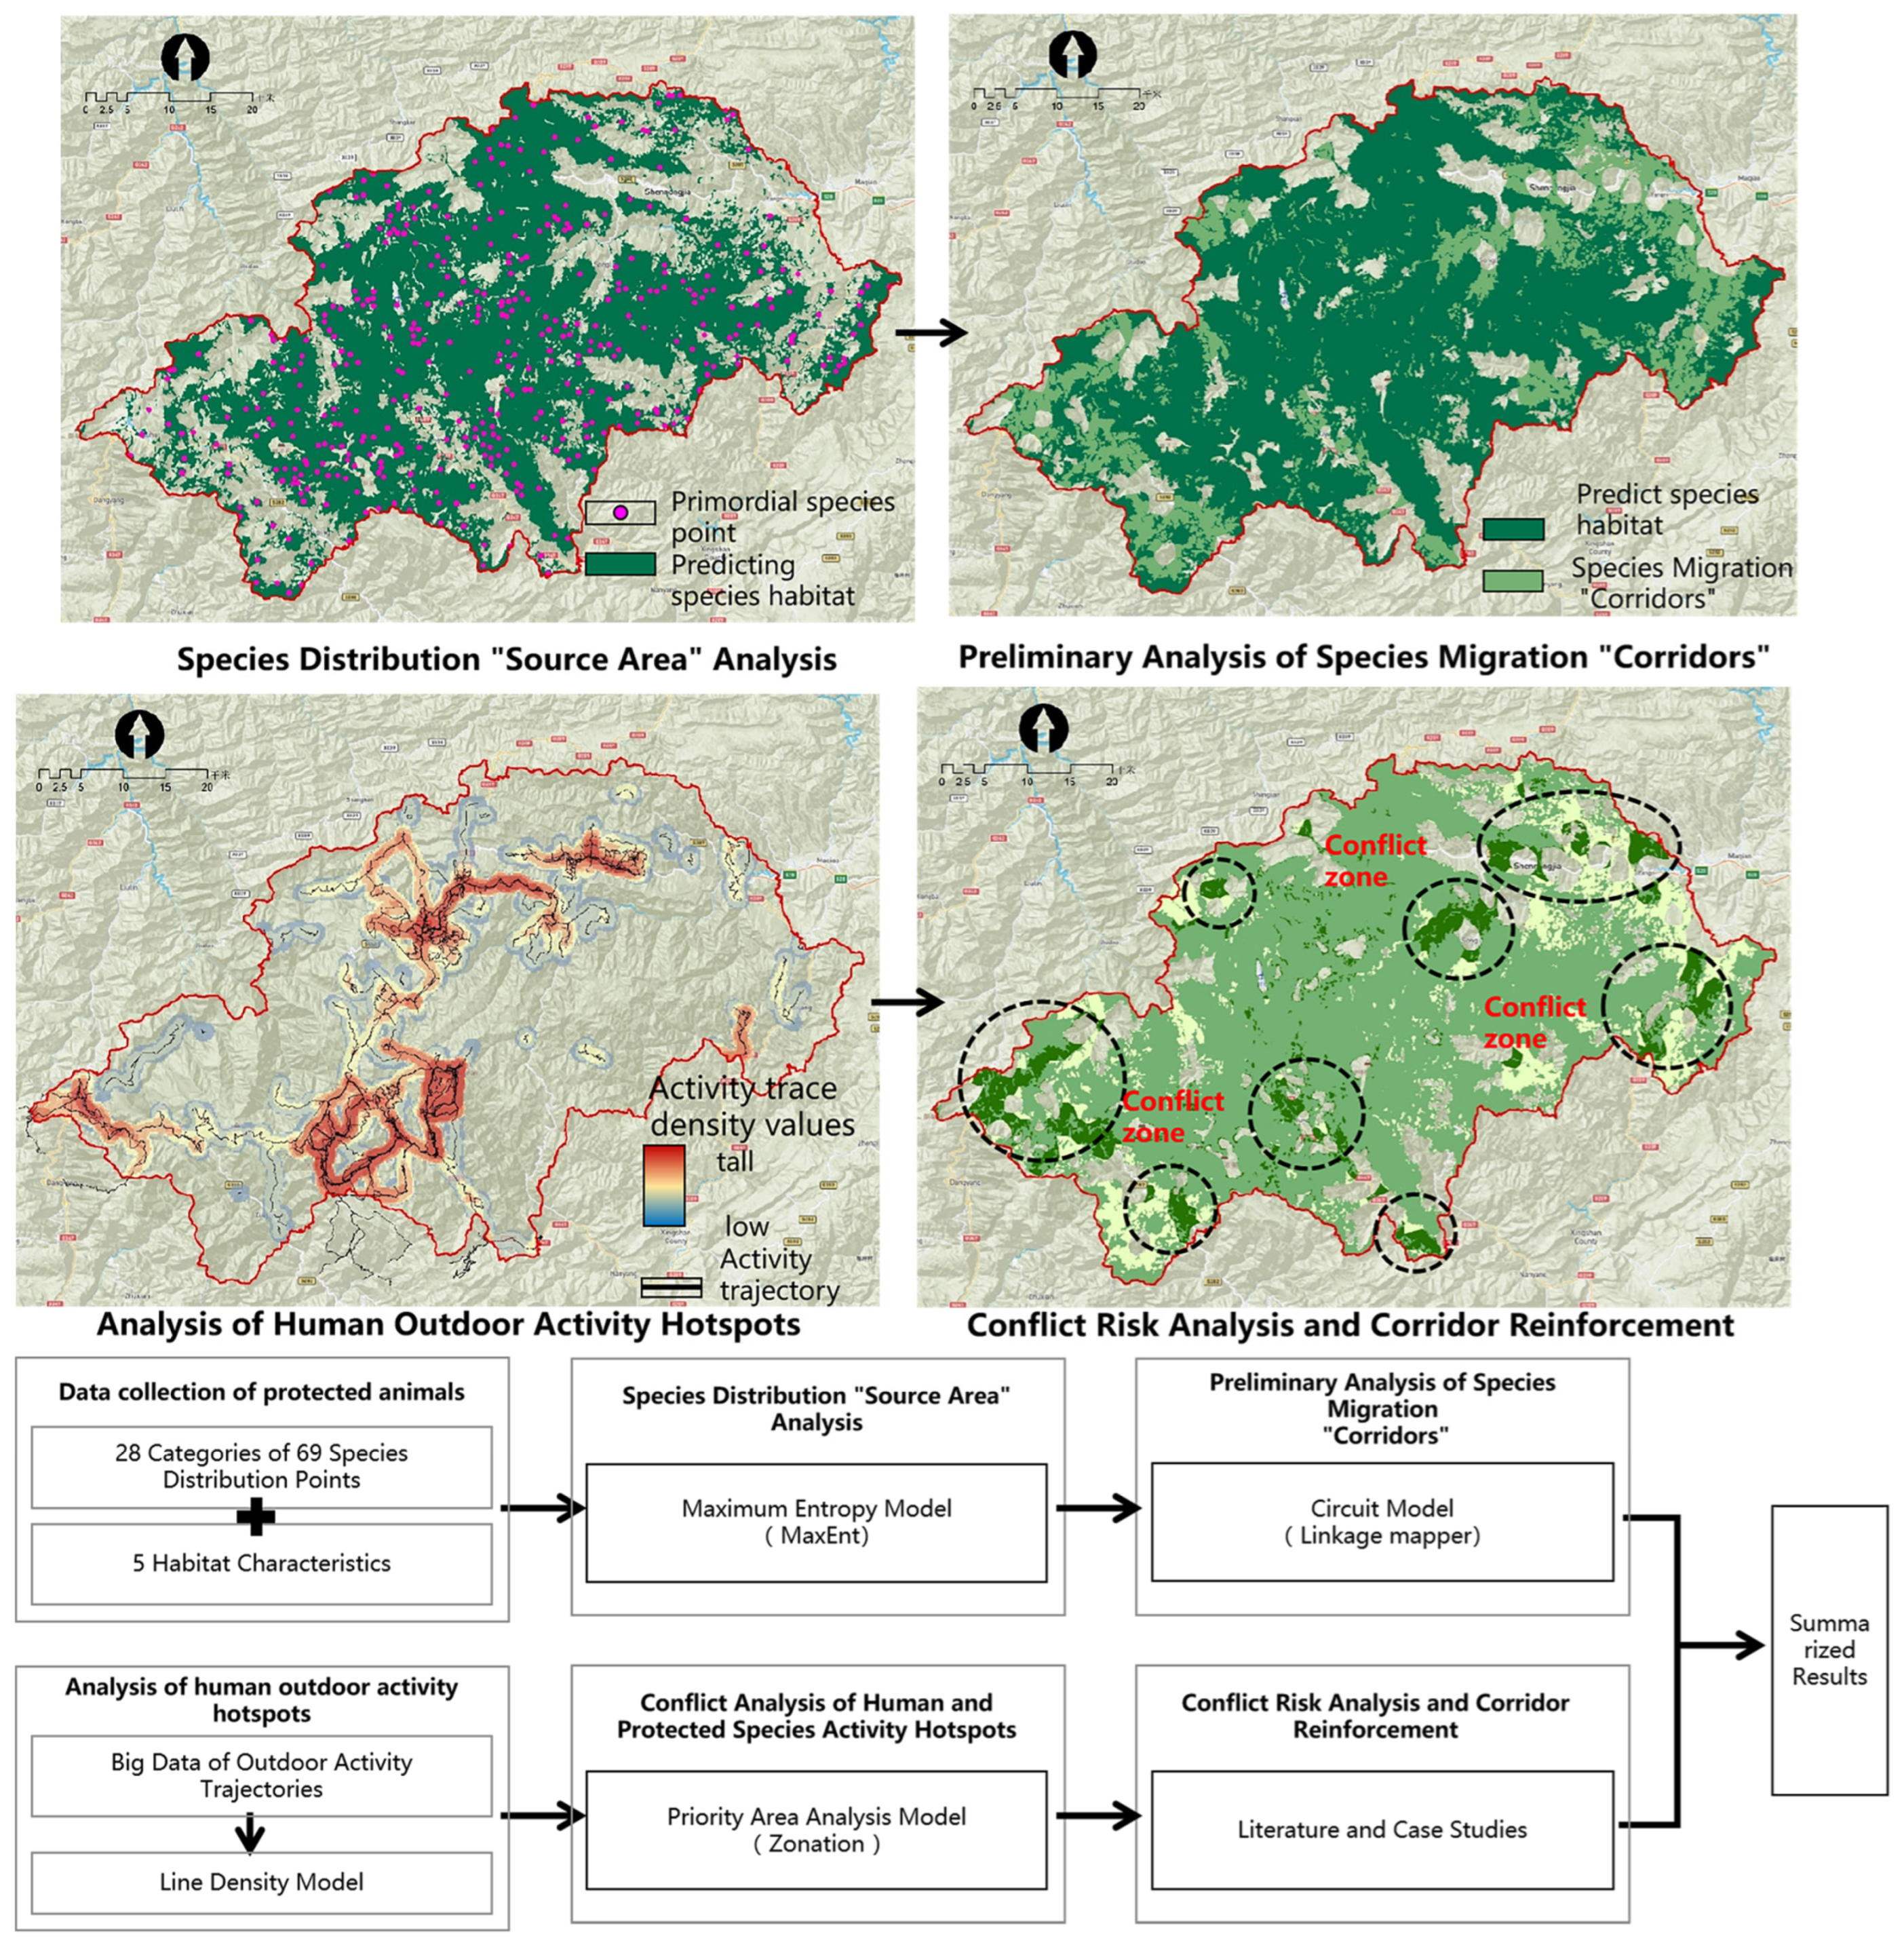
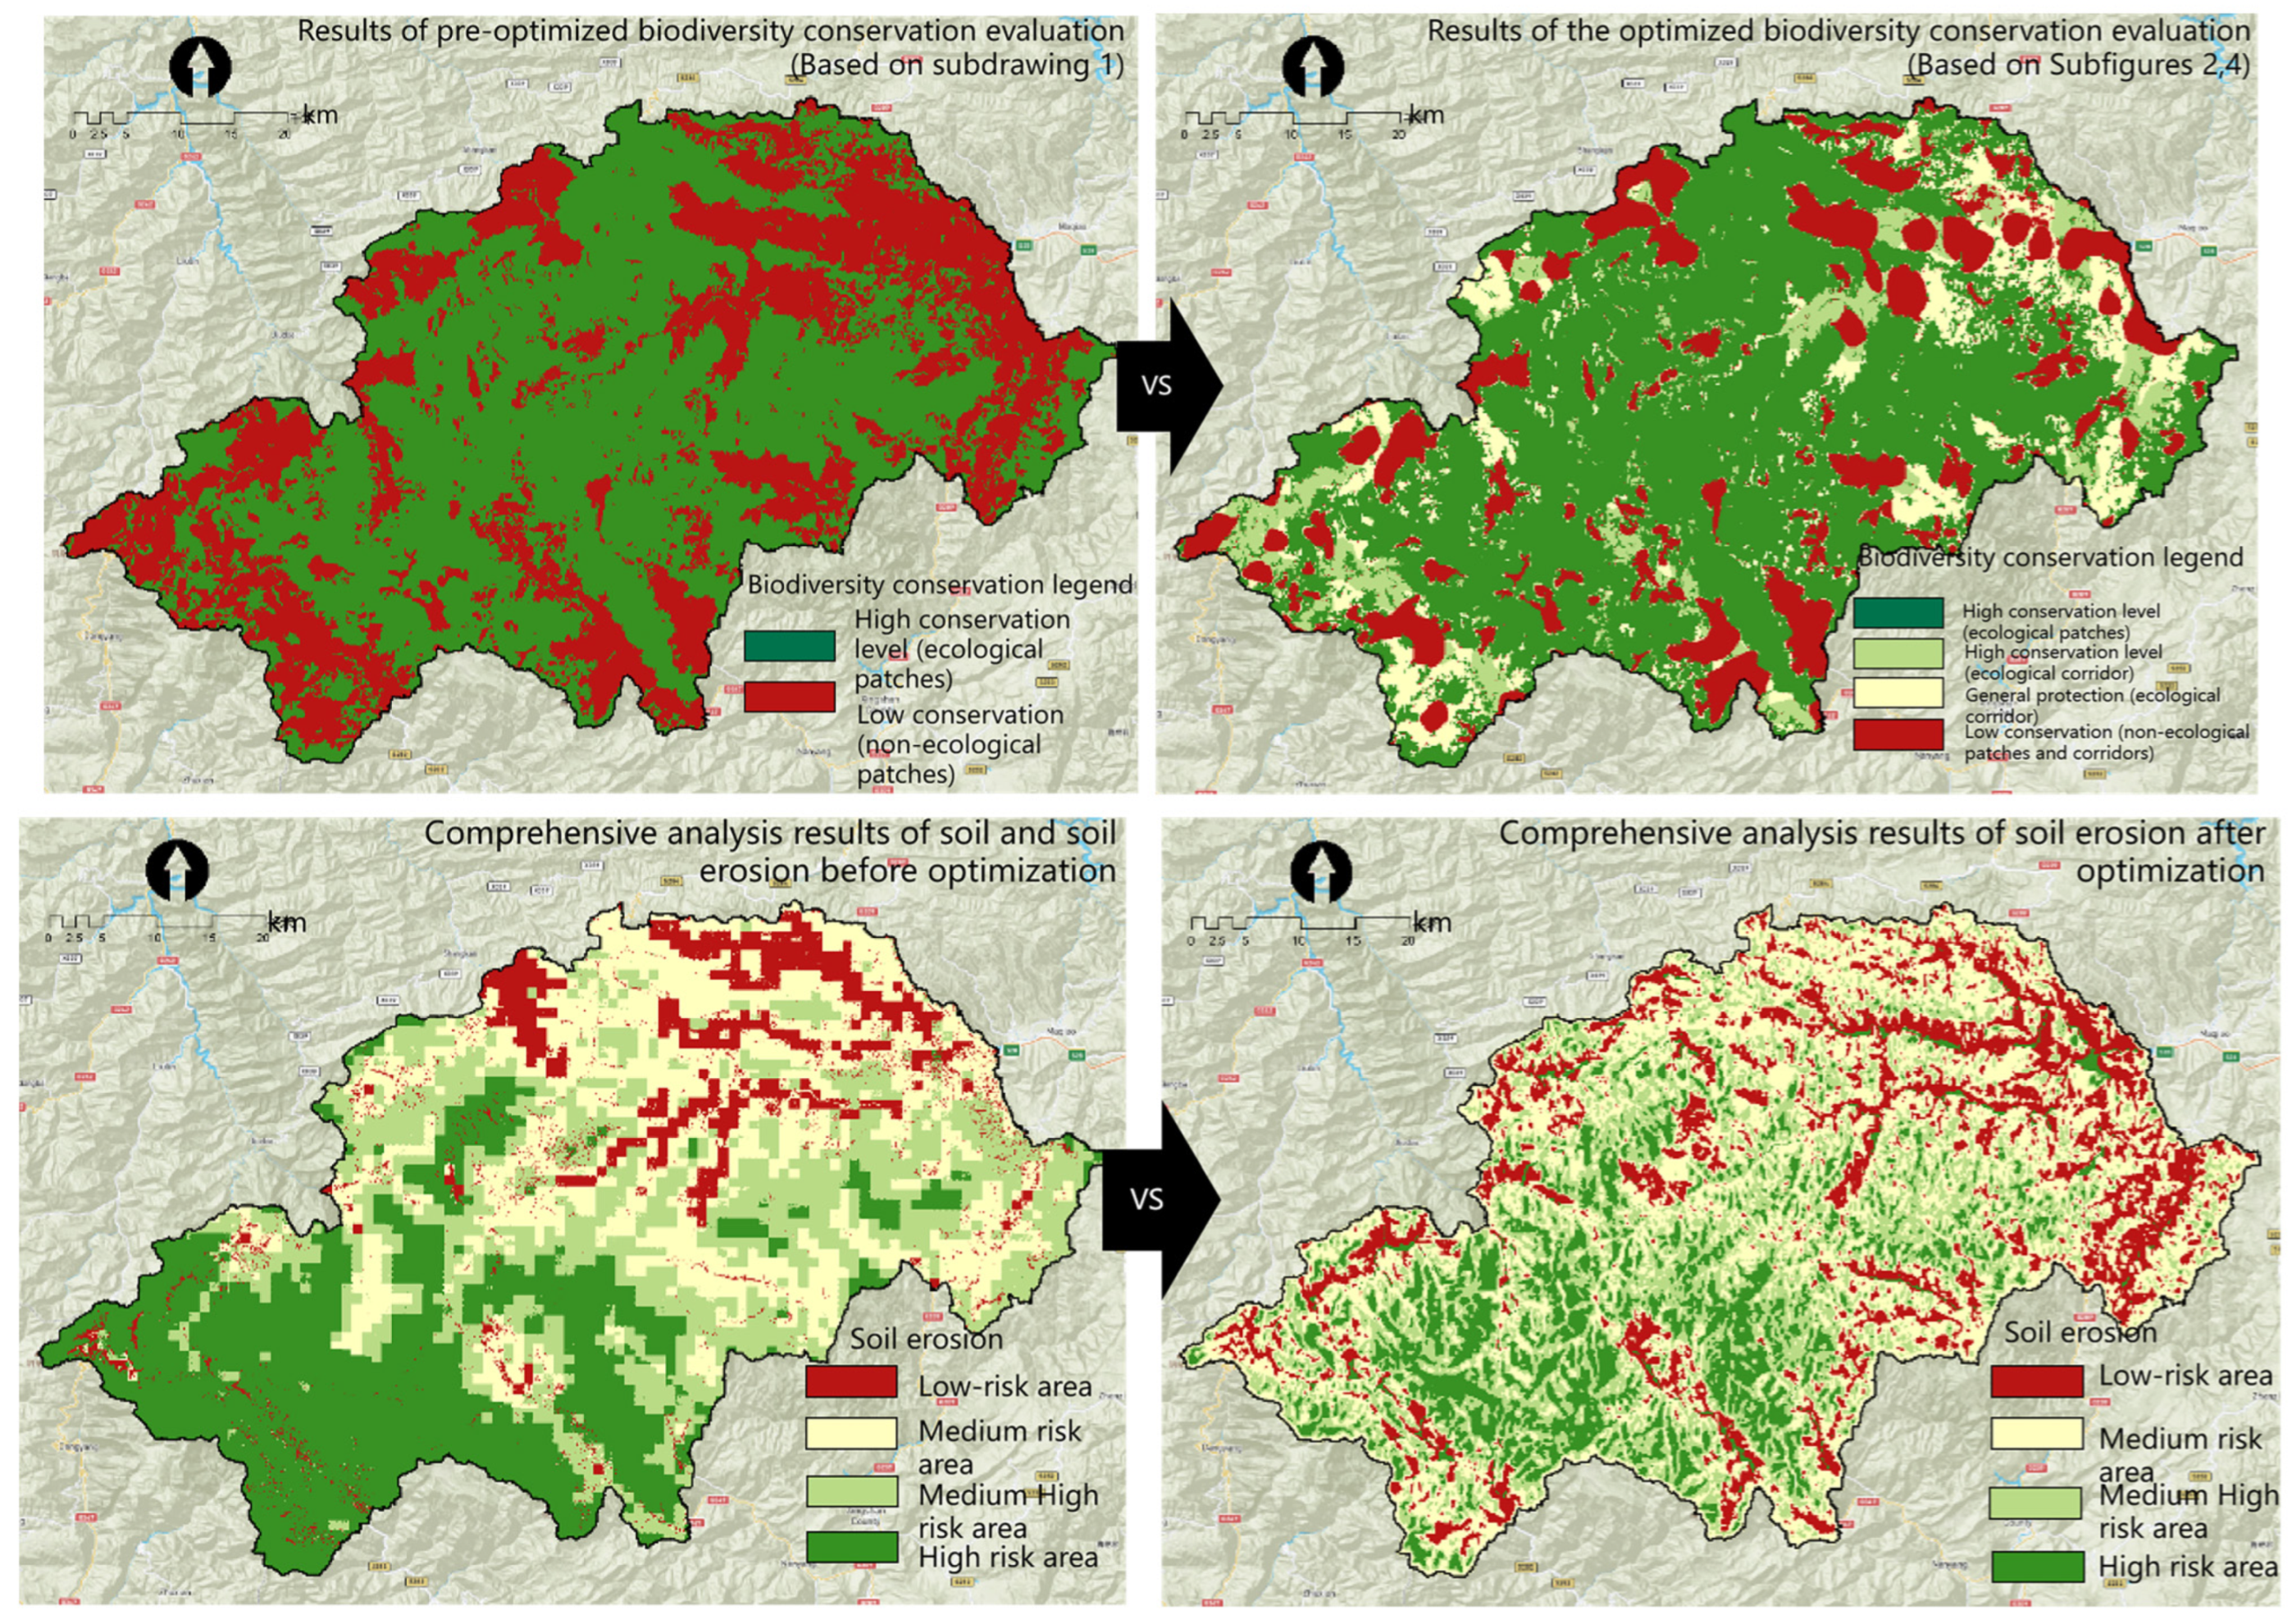
2.3.1. Biodiversity Protection Evaluation Model

Regarding biodiversity protection evaluations, many rare animals are prioritized due to their extensive activity and migration ranges, which render them susceptible to unintentional encroachment or disturbance [51,52]. However, the existing models ignore migration corridors and human activity disturbances since they are often limited to analyzing species distribution only. In this paper, the biodiversity evaluation model is optimized for Shennongjia Forestry District by integrating assessments of species distribution, migration corridors, and human activity disturbances (Figure 5).
Firstly, the maximum entropy model (MaxEnt) is used in this paper to conduct a more comprehensive and detailed assessment of how 69 rare protected species are distributed within the Shennongjia ecological zone. Distinct from traditional research, which focuses narrowly on a few representative species, this study focuses on improving the accuracy of predicting species distribution through an in-depth analysis on the ecological habits, environmental needs, and spatial distribution characteristics of different species, with a variety of influencing factors taken into consideration.
Under the maximum entropy model, it is assumed that the most reasonable probability distribution is the one with the maximum entropy in the absence of any other validating information. In this paper, known environmental condition data are used to determine the optimal probability distribution of species distribution in line with the principle of maximum entropy [53,54]. By maximizing entropy, the model is applicable to obtain the most objective and unbiased distribution estimates as it avoids unnecessary assumptions about species distribution while satisfying known constraints. This method maintains the highest uncertainty in predicting species distribution under limited information and ensures the robust capture of the complex relationships between environmental variables and species distribution.
Given the widespread utilization of the maximum entropy model in such assessment studies, its equations are not elaborated in this paper to maintain conciseness and focus on methodological application.
For the challenges in collecting sufficient occurrence data for all 69 protected animal species in Shennongjia National Park, this study adopted a taxonomic grouping strategy based on shared ecological requirements within the same orders and families. Species were systematically categorized into 24 families, with at least one representative species selected per family (totaling 28 species after merging taxonomically similar groups lacking sufficient data). This framework enabled the compilation of 370 georeferenced occurrence points from local surveys and the literature [55], coupled with five critical habitat variables: suitable terrain, vegetation, climate, water proximity, and human activity disturbance (detailed in Appendix A).
Inputting these parameters into MaxEnt generated spatially explicit predictions of optimal habitat suitability across the Shennongjia ecoregion. Model evaluation demonstrated robust performance, with mean AUC values of 0.902 (training) and 0.836 (validation), indicating strong discriminatory capacity between suitable and unsuitable habitats. Environmental variable contribution analysis revealed the following hierarchy: suitable vegetation (33.4%), terrain (27.6%), climate (17.7%), human disturbance (12.2%), and water proximity (9.1%). Vegetation metrics, particularly canopy density validated through Kirchhoff Transform inversion, emerged as the dominant predictor. This finding underscores the critical role of vegetation structure—specifically canopy cover dynamics—in shaping habitat selection patterns for focal species.
Secondly, the connectivity corridors linking “source” habitats are constructed in this paper by integrating the circuit model (incorporated into the Linkage Mapper tool on the ArcGIS platform), the minimum cumulative resistance (MCR) model, and graph theory. Thus, the analytical precision of species migration corridors is enhanced [56,57]. Different to the traditional methods of constructing ecological corridors, the circuit model not only takes into consideration the impact of landscape heterogeneity on species migration but also provides a more accurate corridor structure by simulating actual ecological resistance and connectivity.
The core idea of the circuit model is to view the ecological landscape as a circuit, where different geographical units (such as habitats, forests, rivers, etc.) act as resistance elements, and the paths of species migration are similar to the flow of electrical current, with the current flowing along the path of least resistance [58]. Mathematically, it is expressed as follows:
P ( x ) = 1 R ( x )
where P(x) represents the migration potential of a species at location x, and R(x) denotes the “ecological resistance” at that location. In this model, the R(x) value is a measure of the ecological suitability of the geographic unit. A higher resistance value indicates greater difficulty in migration for species. Conversely, it is easier for species to migrate. The flow of the current (species migration paths) conforms to the principle of minimum cumulative resistance, meaning that species will choose the path with the least resistance from several possible paths for migration.
To simulate this process more specifically, the shortest path algorithm from graph theory is further applied by the model to determine the optimal migration paths for species. With the landscape grid converted into a graph structure, the circuit model can be adopted to calculate not only the optimal path from the “source” to the “destination” for species, but also the impact of different landscape elements on species migration flow, such as forests, grasslands, water bodies, etc.
The ecological migration resistance mentioned in this paper is obtained from the aforementioned five habitat data based on their contribution rates. For instance, suitable forest types and warm, moist climatic conditions are usually associated with lower migration resistance, while the areas significantly affected by a variety of human activities, such as urbanization and agricultural lands, are associated with higher resistance values. Specifically, the formula used to calculate ecological resistance values is expressed as follows:
R ( x ) = i = 1 n ω i f i ( x )
where R(x) represents the total ecological resistance at location x, fi(x) indicates the value of the ith environmental variable (such as land use type, vegetation type, etc.) at that location, and ωi denotes the weight of that environmental variable, signifying the relative contribution of different factors to the species migration resistance.
These resistance values are inputted into the circuit model for the construction of different species migration paths and ecological corridors. When the model is applied, the Linkage Mapper tool is used to simulate the flow of species as a current in the landscape for the calculation of suitable ecological corridor areas. Effectively connecting the “source” and “destination”, these areas minimize ecological resistance during species migration.
Finally, a line density model is used to identify human activity hotspots through over 1000 pedestrian outdoor activity tracks obtained from the “2bulu” website within the Shennongjia ecological area. They are overlaid with the species migration corridor network to determine the potential human activity conflict areas. Then, the Zonation5 software is applied to categorize these conflict areas by invasion risk, revealing that the top 50% of high-risk areas cover 70% of low-resistance areas in the potential conflict zones. Through the combination of potential distribution probability maps and sampling point distributions, the top 60% of areas are identified as the zones where “reinforcement” is required. According to the different requirements on biological migration corridor width, these areas are then expanded to varying widths of 200–1200 m [59], which leads to comprehensive results of the biodiversity protection evaluation.

2.3.2. Soil Conservation Evaluation Model

In terms of soil conservation evaluation, the RUSLE model is not applicable to mountainous terrains. Thus, this paper adopts the risk levels of soil conservation as determined by predicting the natural disasters triggered by short-duration heavy rainfall, such as flash floods and landslides.
Firstly, flash flood prediction is made in this paper by introducing the hydrological component of the SWAT model, and the SCS (Soil Conservation Service) curve number method is used to calculate surface runoff under storm conditions. Also, the precision of the CN (Curve Number) parameter is optimized to enhance the accuracy of model prediction, which allows the identification and simulation of potential flood areas in the Shennongjia ecological zone during storm conditions [60,61]. According to research comparing 1:2000 scale topographic maps and field surveys, a 300 threshold effectively identifies dry gullies in the Shennongjia area and delineates Hydrologic Response Units (HRUs). Therefore, ASTER GDEM elevation data are used to divide the four major watersheds in Shennongjia into approximately 1500 sub-watersheds. Then, surface flood volume prediction is made using the water balance equation (Equation (5)) in the SWAT model, where runoff occurs when surface precipitation exceeds loss amounts. The critical Qsurf uses the SCS Curve Equation (Equation (6)), and the CN value is required to calculate key parameters Ia and S (Equations (7) and (8)), such as the surface runoff curve number data optimized in this study. After the surface runoff volume is calculated, the drainage amount of the local channel is subtracted by allowing for an estimation of flood volume in each sub-watershed. Finally, the potential flood area is back-calculated for each sub-watershed by comparing the flood volume with the water capacity measured at different local elevations (Figure 6).
S W t = S W o + i = 1 t ( R d a y Q s u r f E a W s e e p Q g w )
In Formula (5), SWt represents the final soil moisture content transferred, SWo represents the soil moisture content in the early stage, t is the length of time, Rday is the precipitation on the i-th day, Qsurf is the surface runoff on the i-th day, Ea is the evaporation on the i-th day, Wseep is the infiltration and measured flow at the bottom of the soil profile on the i-th day, and Qgw is the groundwater content on the i-th day.
Q = ( P I a ) 2 P I a + S    ( P Ia )
In Formula (6), Q represents actual runoff, P represents total rainfall, Ia represents initial rainfall loss, and S represents maximum potential infiltration before the rainfall in the region.
S = 25400 C N 254
I a = λ ( 25400 C N 254 )
Secondly, landslide-prone areas are predicted, as landslides are the complex geological disasters triggered by sustained rainfall causing water to infiltrate soil layers and rock masses, ultimately leading to slip layer movement. In this paper, landslide susceptibility risk levels are mapped using the support vector machine–landslide susceptibility assessment model (SVM–LSM) within the ArcGIS tool, with sampling point data provided and factor selected [62,63,64]. The SVM–LSM model is particularly applicable to deal with multifactorial, nonlinear, and high-dimensional spatial data.
In this paper, 10 years’ worth of historical landslide information is collected from the Shennongjia area, with 405 risk areas identified where landslides occurred in previous years and the residential areas exceeding 4 square kilometers marked as 200 non-risk zones. Generated as the dependent variable dataset (risk areas as 1 and non-risk areas as 0), a 30 × 30 m grid point dataset is inputted into the SVM model for training. The SVM model searches for the optimal hyperplane to maximally separate the positive and negative samples (i.e., landslide risk points and non-risk points). Thus, the accuracy of the underlying classification is maintained. Subsequently, the relevant influencing factors and SVM model parameters are filtered using ROC (Receiver Operating Characteristic) curves and AUC (Area Under the Curve) values. When the model is trained, AUC values are analyzed to determine the most effective 11 influencing factors and optimal SVM classification parameters. Ultimately, the weight parameters of each factor are determined through these filtering processes, enabling the SVM-LSM model to identify landslide risk areas more precisely.
Mathematically, the SVM-LSM model is expressed as follows:
f ( x ) = ω T + b
where f(x) is the decision function, representing the model’s output; x is the input data (including slope aspect, slope gradient, terrain curvature, soil type, precipitation, vegetation density, etc.); ω is the weight vector, determining the direction of the hyperplane; and b is the bias term, determining the position of the hyperplane.
According to the results of model training, the AUC value for the vegetation density factor performs as well as the basic terrain factors (such as slope gradient, slope aspect, and curvature), geological factors (such as soil type and rock type), and climatic factors (such as precipitation and temperature).
The final evaluation of soil conservation is an overlay of assessments for potential flood-prone areas and landslide-prone areas.
Lastly, the water yield module of the commonly used InVEST model is used to evaluate the ecological sensitivity of water conservation [65,66].

3. Results

In this paper, the optimized evaluation results are found to be more scientific and reliable by interpreting, comparing, and validating the data and evaluation model results before and after optimization.

3.1. Data Densification Results

As indicated by comparing the annual average rainfall data before and after optimization (Figure 7), the latter are more precise, fitting better with the terrain. In line with the division standards for low-mountain (500–1000 m), mid-mountain (1000–2000 m), and subalpine (>2000 m) rainfall zones, the statistics of the corresponding elevation rainfall data in both figures (see Table 1) reveal that the optimized data vary more significantly in rainfall between different zones, with the average value changing to a greater extent, and data distribution is more concentrated (a smaller range of variation) and the data are more consistent with the actual rainfall conditions in Shennongjia.
As revealed by comparing the surface runoff coefficient data based on original land cover with the optimized data, the latter feature more varied spatial layers, which aligns more with local terrain and natural environmental characteristics. With forest density converted to surface runoff coefficients according to Niwat Ruangpanit’s table, the optimized data are tested for average values by intervals (Table 2). The absolute difference ratio indicates a good overall fit between the two, particularly in the intervals with vegetation density above 0.7, confirming the reliability of the optimized data.

3.2. Model Improvement Results

As revealed by comparing the biodiversity protection model evaluation results, optimized in this paper, with the forest above-ground biomass data estimated by Yang Qiuli for the 30 m spatial resolution in China [68], the “source” prediction results obtained in this paper cover 65.5% of the local land area (approximately 1998 km2), encompassing 82.28% of the biomass estimated by the former (including the highest 30% of unit biomass areas), which illustrates the validity of this research (see Figure 8). The thresholds used to reclassify the multiple zones were derived from a peer-reviewed study [69].
According to the spatial verification of the SVM-LSM prediction made in the landslide analysis conducted for the soil conservation evaluation, over 85% of historical landslide disaster points are concentrated within high-risk areas, which suggests consistence between the evaluation results and local actual conditions.

3.3. Comprehensive Improvement Results

As clearly indicated by comparing the ecological sensitivity evaluation results before and after optimization (Figure 9), there are noticeable large “mosaic” blocks in the original evaluation images, which are difficult to couple with local terrain and features. In contrast, the optimized images exhibit higher data granularity and smoother transitions, which are more conducive to subsequent planning efforts. According to the analytical results, the original biodiversity protection and soil conservation evaluation models are incapable of identifying some ecologically sensitive spatial elements, which results in an excessively large number of low-protection spaces (red patches). This is not in alignment with the needs of national parks for more detailed and precise protection. The optimized models are effective at significantly improving these issues.

4. Discussion

In this paper, the ecological sensitivity evaluation of mountain-type national parks is conducted to propose an optimized evaluation scheme through data densification and model improvement. With the Shennongjia Forestry District as a case study, a detailed empirical analysis is conducted to provide a more scientific guidance on ecological protection and management.
According to the optimized evaluation results, there are extensive biodiversity conservation patches above 1000 m in elevation in the Shennongjia Forestry District from the perspective of biodiversity. A considerable proportion (about 40%) of them are distributed within the Shennongjia National Park, serving as habitats for numerous rare flora and fauna [70,71]. Therefore, it is crucial to further increase ecological management efforts in the national park and other high-altitude areas within the forestry district and improve protection mechanisms to maintain the health and stability of its ecosystem. Biodiversity conservation patches are relatively fragmented in the low mountain valley areas to the northeast and southwest, where human and agricultural activities are performed frequently [72,73]. A recommendation is that the species migration corridors identified in this paper can be constructed in these areas to enhance their interconnections, which not only reduces the risk of biodiversity loss but also enhances ecosystem stability [74,75].
In terms of soil conservation, the southwestern part of the Shennongjia Forestry District is the area with the highest risk of landslides, which is attributed to its complex geological structure and high rainfall [76,77]. In contrast, the landslide risks are relatively lower in the downstream valleys of the northeast, including Songbai, Yangri, and Xinhua. As emphasized in some research, the risk of flash floods must be considered due to the terrain and rainfall impacts despite the lower landslide risks of these valleys [78,79].
Upon the comprehensive overlay of ecological sensitivity evaluation results for the Shennongjia Forestry District, it can be found out that the areas with high, relatively high, and medium ecological sensitivity account for 25.09%, 44.51%, and 19.42% of the area, respectively, which means 89.01% in total. This demonstrates a high ecological protection value in most of the land in the Shennongjia area. The areas with high protection deserve strict protection, with any form of development activity prohibited. The areas of medium protection should be developed under limited conditions with strict environmental monitoring. The areas with low protection can be planned for urban and tourism development, but the basic principles of ecological protection must be adhered to. What is essential for the sustainable development of the local ecology and economy is to integrate ecological protection and economic development in the Shennongjia area in a harmonious way [12,80].
In the low-protection areas available for development, Songbai Town as the administrative center of the Shennongjia area is relatively large in scale but has limited space for expansion. Therefore, it is recommended that Yangri Town should be prioritized for future urban development. This development strategy can meet the needs of local economic development while offering protection for the ecological environment [81]. Additionally, it is noteworthy that Muyu Town and Jiuhu Township, located in the southern part of the Shennongjia Forestry District, are both popular tourist destinations that have been evaluated as having high or medium ecological protection. Thus, it is necessary to restrict the pace of development in these areas as appropriate. In actual development and construction, it is also necessary to protect the multispecies environment from irreversible damage by carefully selecting development sites through the combination of various ecological sensitivity assessments [82,83].

5. Conclusions

With its vast territory and complex natural conditions, China’s national parks are of much significance ecologically, exhibiting diversity in ecological conditions. Therefore, a significant precondition for the effective and high-quality protection of national park ecosystems is to explore more scientific, comprehensive, and precise ecological sensitivity evaluation data and models.
In this paper, Shennongjia Forestry District is taken as a case study to explore the national parks featuring mountainous terrain and forest landscapes. As revealed by optimizing both the data and models in the ecological sensitivity evaluation scheme, there is a significant improvement in the objectivity and precision of the final evaluation results. This provides a valuable reference for the evaluations of ecological sensitivity for other natural environments with similar characteristics.
In terms of data, the granularity of annual rainfall and surface runoff data is enhanced in this paper by introducing additional sampling points, optimizing data sources (such as using 30 m data types like ASTER GDEM and Landsat TM), incorporating regression models (including spatial Empirical Bayesian Kriging and non-spatial multivariate linear regression), and adjusting the corresponding processing procedures. Through these improvements, more refined data support is provided for subsequent model evaluations. In terms of models, species migration corridors are evaluated using the Linkage Mapper model and human conflict risks are evaluated using such models as Zonation. Moreover, more accurate and comprehensive evaluation results are obtained through a shift from focusing on soil conservation effects (the RUSLE) to simulating and predicting soil loss risks (using the SWAT model for flash floods and the SVM-LSM model for landslides).
The optimized evaluation framework provides a decision support tool for spatially adaptive management in mountain protected areas. By integrating multi-dimensional sensitivity zoning (e.g., biodiversity corridors, landslide risk gradients) with administrative boundaries, it enables dynamic zoning adjustments that balance conservation priorities with regional development needs. For instance, the identification of critical connectivity corridors between fragmented habitats could inform the design of transboundary ecological networks, extending protection beyond formal park boundaries. In low-sensitivity zones designated for limited development, the methodology supports site-specific tourism infrastructure planning—such as elevated walkways or seasonal access restrictions—to minimize habitat disruption while fostering eco-tourism.
Through the above research, this paper aims to provide technical support for the refinement of ecological sensitivity evaluation systems for mountain-type national parks and other critical ecological regions, which would promote the scientific management and utilization of ecological resources in the Shennongjia area. However, there remains room for further research. As mentioned earlier in the water conservation evaluation, an integrated three-dimensional hydrological model of both surface and sub-surface environments can be constructed if more detailed geological data are obtainable. Thus, the interactions between hydrological processes and ecosystems can be better elucidated. So, there are indeed implementation barriers that we may encounter while assessing this, including the following: Data Accessibility: High-resolution terrain and microclimate data required for model calibration are often restricted or inconsistently available across jurisdictions, particularly in transboundary mountain regions. Stakeholder Conflicts: Tourism developers and local communities may resist strict zoning in medium-sensitivity areas due to perceived economic constraints, necessitating complex negotiation. Climate Uncertainty: Increasing rainfall variability under climate change may alter landslide and flood risk patterns, requiring continuous model recalibration beyond initial implementation and cross-sectoral collaboration. The approach we provide transcends conventional static zoning by enabling adaptive governance, yet its effectiveness hinges on resolving multiscale data-policy discontinuities and securing cross-sectoral collaboration.

Supplementary Materials

The following supporting information can be downloaded at: https://www.mdpi.com/article/10.3390/land14050923/s1, Table S1: The 370 location points.

Author Contributions

Conceptualization, X.Z. and H.H.; methodology, X.Z. and J.Z.; software, X.Z.; validation, D.Z. and S.D.; formal analysis, X.Z. and J.Z.; investigation, D.Z. and H.H.; data curation, X.Z. and J.Z.; writing—original draft preparation, X.Z. and D.Z.; writing—review and editing, D.Z. and J.Z.; visualization, X.Z. and D.Z.; supervision, J.Z.; All authors have read and agreed to the published version of the manuscript.

Funding

This research was funded by the 2022 National Natural Science Foundation of China General Project: Spatiotemporal Evolution Mechanisms and Management Strategies of Ecosystem Services in the Yangtze River Basin from a Heterogeneity Perspective, grant number: 72174158; and by Hubei Provincial Department of Natural Resources: Adaptability of Territorial Space Development in Mountain-type National Park Areas, grant number: ZRZY2023KJ32.

Data Availability Statement

The original contributions presented in this study are included in the article/Supplementary Materials. Further inquiries can be directed to the corresponding author.

Conflicts of Interest

The authors declare no conflicts of interest.

Appendix A

Table A1. List of relevant species distribution and habitat information data information.
Family Name and Protected Species NamesSpecies Distribution DataHabitat Characteristics Summary
Cercopithecidae
(snub-nosed monkey *, Macaca mulatta *)
Local data available (Dalongtan, Qianjiaping, and Jinhouling), non-local data availableSuitable Terrain: Elevations of 1760–2600 m; slope aspects in order of sun-facing, semi-sun-facing;
Suitable Vegetation: Sequences of evergreen broadleaf forest, mixed conifer–broadleaf forest, deciduous broadleaf forest, evergreen conifer forest, conifer forest, with canopy density of 30–50%;
Distance from Water Sources: 500–2000 m;
Human Activity Disturbance: Agricultural land distance >1000 m, human settlements, main roads >2000 m.
Felidae
(South China Tiger, Leopard *, Clouded Leopard *, Asiatic Golden Cat)
Non-local data availableSuitable Terrain: Elevations of 1600–3000 m; slope <35°;
Suitable Ground Surface: Broadleaf forest, mixed conifer–broadleaf forest, deciduous broadleaf forest, with canopy density of 40–57%;
Suitable Climate: Annual average precipitation of 500–750 mm, annual average temperature of 3–4 °C;
Distance from Water Sources: 500–2000 m;
Human Activity Disturbance: Human settlements, main roads >1000 m.
Viverridae (Viverra zibetha, Small Indian Civet)Lack of relevant information, classified according to habitat habits similar to the Felidae family
Ursidae Family
(Asian Black Bear *)
Non-local data availableSuitable Terrain: Elevations of 2000–3250 m;
Suitable Ground Surface: Sequentially conifer forest, broadleaf forest, canopy density of 56–65%;
Distance from Water Sources: 500–2000 m.
Suitable Climate: Annual average precipitation of 500–750 mm, annual average temperature of 3–4 °C;
Human Activity Disturbance: Human settlements, main roads >1000 m;
Mustelidae Family
(Sable **, Yellow-Throated Marten, Otter *)
Non-local data availableSuitable Terrain: Elevations of 800–1300 m, slope <15°, aspect sun-facing;
Suitable Ground Surface: Sequentially conifer forest, mixed conifer–broadleaf forest, canopy density of 40–80%;
Distance from Water Sources: 0–500 m;
Human Activity Disturbance: Human settlements, main roads >1500 m.
Moschidae and Cervidae Families
(Sika Deer *, Forest Musk Deer *)
Local data available (Shennong Peak, Dalongtan, Wangyoutai), non-local data availableSuitable Terrain: Elevations sequentially at 800–1500 m, 2200–3800 m; slopes sequentially >45°, 10–45°; aspect southeast sun-facing;
Suitable Ground Surface: Edge of broadleaf forest and mixed conifer–broadleaf shrubbery, vegetation canopy density of 30–60%;
Distance from Water Sources: <1000 m;
Human Activity Disturbance: Distance from human settlements, main roads >2000 m.
Bovidae Family
(Serow *, Grey Goral *)
Non-local data availableSuitable Terrain: Elevations of 1600–3700 m;
Suitable Ground Surface: Sequentially evergreen broadleaf forest, mixed conifer–broadleaf forest, conifer forest; vegetation canopy density >60%;
Distance from Water Sources: <1000 m.
Canidae Family
(Jackal, Gray Wolf **)
Non-local data availableSuitable Terrain: Elevations sequentially at 900–1000 m, 600–800 m;
Suitable Ground Surface: Sequentially evergreen broadleaf forest, mixed conifer–broadleaf forest, conifer forest; vegetation canopy density >60%;
Distance from Water Sources: sequentially <2000 m, 2000–4000 m;
Human Activity Disturbance: Distance from human settlements 2000–4000 m, main roads 500–1000 m.
Pangolin Family
(Pangolin *)
Non-local data availableSuitable Terrain: Elevations <400 m; slope of 30–60°; aspect sun-facing, semi-shaded;
Suitable Ground Surface: Sequentially mixed conifer–broadleaf forest, shrubbery, evergreen broadleaf forest, conifer forest; vegetation canopy density of 31–70%;
Suitable Climate: Annual precipitation >1500 mm;
Distance from Water Sources: <500 m;
Human Activity Disturbance: Distance from human settlements, main roads >1000 m.
Stork Family (White Stork *)Non-local data availableSuitable Ground Surface: Sequentially marsh, marsh surrounding paddy fields, paddy fields, rivers, and lakes.
Ardeidae Family
(Hainan Pond Heron **, Hainan Tiger Heron, Great White Egret *)
Non-local data availableSuitable Terrain: Elevations of 110–200 m, slope of 20–30°, southeast to southwest aspect;
Suitable Ground Surface: Sequentially marsh, rivers, lakes;
Suitable Climate: Temperature range of 0–25 °C, maximum monthly precipitation of 130 mm, minimum seasonal precipitation of 4 mm;
Distance from Water Sources: <400 m;
Human Activity Disturbance: Distance from human settlements 100–900 m, main roads >200 m.
Anatidae Family (Mandarin Duck)Lack of relevant information, classified according to habitat habits similar to the Ardeidae family
Falconidae Family
(Red Falcon *, Black-Crowned Falcon * and other 7 species)
Non-local data availableSuitable Terrain: Cliffs, bare rock with a slope >50°;
Suitable Ground Surface: Sequentially farmland, clearings among forests (vegetation canopy density >60%), shrubbery, mudflats;
Human Activity Disturbance: Distance from human settlements, main roads >7000 m.
Accipitridae Family
(Golden Eagle, Crested Honey Buzzard, Kite, Vulture, Steppe Eagle, and 25 other species)
Lack of relevant information, classified according to habitat habits similar to the Falconidae family
Strigidae Family
(Scops Owl, Eagle Owl, Pygmy Owl, and 13 other species)
Lack of relevant information, classified according to habitat habits similar to the Falconidae family
Phasianidae Family
(Red-Bellied Tragopan *, Blue Peafowl **, SpoonBill, White-Crowned Long-tailed Pheasant *, Red-bellied Tragopan *)
Non-local data availableSuitable Terrain: Elevations of 800–1600 m; slope <30°;
Suitable Ground Surface: Sequentially deciduous broadleaf forest, conifer forest, mixed conifer–broadleaf forest, farmland; vegetation canopy density >60%;
Distance from Water Sources: <1000 m.
Scolopacidae Family (Lesser Sandpiper *)Non-local data availableSuitable Ground Surface: Water bodies, marshes, mudflats.
Columbidae Family (Green-Winged Pigeon, Wedge-Tailed Green Pigeon)Lack of the relevant information, classified according to habitat habits similar to the Phasianidae family
Pittidae Family (Blue-Winged Pitta)Lack of the relevant information, classified according to habitat habits similar to the Phasianidae family
Cuculidae Family (Brown-Winged Cuckoo *, Lesser Cuckoo)Non-local data availableSuitable Ground Surface: At the edge of mixed evergreen-deciduous broadleaf shrubbery, broadleaf forest, mixed conifer–broadleaf forest, riverbank forests, small-scale farmlands.
Cryptobranchidae Family (Giant Salamander *)Non-local data availableSuitable Ground Surface: River mouths with slopes >35° and vegetation canopy density >50% on both banks.
Dicroglossinae Family (Hoplobatrachus chinensis *)Non-local data availableSuitable Terrain: Slope <20°;
Suitable Ground Surface: Paddy fields, grasslands;
Distance from Water Sources: >200 m from large water bodies, <100 m from small water bodies;
Human Activity Disturbance: 100 m from farmland, 100–200 m from roads, >200 m from residential areas.
Papilionidae Family (Luehdorfia chinensis *, Two-tailed Swallowtail, Three-Tailed Swallowtail, Luehdorfia chinensis)Non-local data availableSuitable Ground Surface: High-altitude shrubbery.
Carabidae Family (Carabus lafossei, Prosodes dilaticollis Motsch **)Non-local data availableSuitable Ground Surface: Shrubs, grasslands;
Suitable Climate: The minimum temperature of −10–25 °C in the coldest month, driest season average temperature of 0–10 °C, annual average temperature of 10–20 °C, annual precipitation of 0–1000 mm, isothermal temperature of 16–32 °C.
Note: * denotes the species under national first- and second-level protection, representative of their habitat and for which data and studies can be collected. Note: ** denotes the “substitute” representative species within the same family, which are selected due to a lack of data and literature for first- and second-level protected species and which inhabit similar environments where data can be collected. Apart from the annual average precipitation, the data such as annual average temperature, the precipitation of the wettest month, the precipitation of the driest season, and the lowest temperature of the coldest month are all sourced from the WorldClim global climate data website.

References

  1. Schägner, J.P.; Brander, L.; Maes, J.; Paracchini, M.L.; Hartje, V. Mapping recreational visits and values of European National Parks by combining statistical modelling and unit value transfer. J. Nat. Conserv. 2016, 31, 71–84. [Google Scholar] [CrossRef]
  2. IUCN. IUCN Global Standard for Nature-Based Solutions; International Union for Conservation of Nature: Gland, Switzerland, 2020. [Google Scholar]
  3. Zhao, Y.; Huang, X.; Zhao, Y.; Liu, X.; Zhou, R. The application of landscape character classification for spatial zoning management in mountainous protected areas—A case study of Laoshan national park, China. Heliyon 2023, 9, e13996. [Google Scholar] [CrossRef]
  4. Tian, S.; Zhang, Y.; Xu, Y.; Wang, Q.; Yuan, X.; Ma, Q.; Chen, L.; Ma, H.; Xu, Y.; Yang, S.; et al. Urban ecological security assessment and path regulation for ecological protection—A case study of Shenzhen, China. Ecol. Indic. 2022, 145, 109717. [Google Scholar] [CrossRef]
  5. Yang, D.; Song, W. Ecological function regionalization of the core area of the Beijing-Hangzhou Grand Canal based on the leading ecological function perspective. Ecol. Indic. 2022, 142, 109247. [Google Scholar] [CrossRef]
  6. Lv, C.; Li, S.; Ling, M.; Niu, Z.; Yan, D. Assessment of water conservation and water intensification level based on AHP-fuzzy comprehensive evaluation model. Desalin. Water Treat. 2024, 319, 100567. [Google Scholar] [CrossRef]
  7. Ellis-Soto, D.; Chapman, M.; Koltz, A.M. Addressing data disparities is critical for biodiversity assessments. Trends Ecol. Evol. 2024, 39, 1066–1069. [Google Scholar] [CrossRef]
  8. Masha, M.; Bojago, E. Evaluating soil erosion and determinants of farmers’ adoption of soil and water conservation measures in the Offa district, southern Ethiopia. J. Agric. Food Res. 2023, 14, 100866. [Google Scholar] [CrossRef]
  9. Xu, Y.; Huang, W.-T.; Yao, Y.-F.; Xu, M.; Zou, B.; Feng, Y.-X. Carbon sequestration in vulnerable ecological regions of China: Limitations and opportunities. J. Clean. Prod. 2024, 475, 143702. [Google Scholar] [CrossRef]
  10. Cook, D.; Malinauskaite, L.; Davíðsdóttir, B.; Ögmundardóttir, H. Co-production processes underpinning the ecosystem services of glaciers and adaptive management in the era of climate change. Ecosyst. Serv. 2021, 50, 101342. [Google Scholar] [CrossRef]
  11. Belle, S.; Huser, B.; Johnson, R.K. Cumulative effects of climate change and land use on the ecological status of Scandinavian lakes show contrasted interactions in different ecoregions: The role of pre-disturbance conditions in assessing ecological status. Ecol. Indic. 2024, 169, 112879. [Google Scholar] [CrossRef]
  12. Liu, J.; Hull, V.; Batistella, M.; DeFries, R.; Dietz, T.; Fu, F.; Hertel, T.W.; Izaurralde, R.C.; Lambin, E.F.; Li, S.; et al. Framing Sustainability in a Telecoupled World. Ecol. Soc. 2013, 18(2), 344–365. [Google Scholar] [CrossRef]
  13. Lou, Y.; Bian, J.; Sun, X.; Wang, F.; Xu, L.; Sun, G. Optimization of ammonia nitrogen benchmarks and ecological risk assessment in monsoon freezing lakes based on species sensitivity distribution with Lake Chagan in northeastern China as an example. Ecol. Indic. 2024, 166, 112346. [Google Scholar] [CrossRef]
  14. Nematollahi, S.; Fakheran, S.; Jafari, A.; Pourmanafi, S.; Kienast, F. Applying a systematic conservation planning tool and ecological risk index for spatial prioritization and optimization of protected area networks in Iran. J. Nat. Conserv. 2022, 66, 126144. [Google Scholar] [CrossRef]
  15. Boughton, W. Calibrations of a daily rainfall-runoff model with poor quality data. Environ. Model. Softw. 2006, 21, 1114–1128. [Google Scholar] [CrossRef]
  16. Mabuda, M.O.; Shoko, C.; Dube, T.; Mazvimavi, D. An analysis of the effects of changes in land use and land cover on runoff in the Luvuvhu catchment, South Africa. Remote Sens. Appl. Soc. Environ. 2024, 33, 101144. [Google Scholar] [CrossRef]
  17. Ahmad, T.; Pandey, A.C.; Kumar, A.; Tirkey, A. Understanding the role of surface runoff in potential flood inundation in the Kashmir valley, Western Himalayas. Phys. Chem. Earth Parts A/B/C 2023, 131, 103423. [Google Scholar] [CrossRef]
  18. Kang, X.; Du, M.; Zhao, L.; Liu, Q.; Liao, Z.; Su, H.; Xiang, T.; Gou, C.; Liu, N. Integrity-centered framework for determining protected areas boundary: An application in the China’s national park. Ecol. Inform. 2024, 84, 102885. [Google Scholar] [CrossRef]
  19. Bacar, F.F.; Faque, H.B. Forest holds high rodent diversity than other habitats under a rapidly changing and fragmenting landscape in Quirimbas National Park, Mozambique. Ecol. Front. 2024, 44, 175–194. [Google Scholar] [CrossRef]
  20. Naidoo, L.; Cho, M.A.; Mathieu, R.; Asner, G. Classification of savanna tree species, in the Greater Kruger National Park region, by integrating hyperspectral and LiDAR data in a Random Forest data mining environment. ISPRS J. Photogramm. Remote Sens. 2012, 69, 167–179. [Google Scholar] [CrossRef]
  21. Wang, Y.; Zhang, X.; Gong, L.; Wang, W.; She, D.; Liu, J. On the relationship between surface runoff and impervious area in the urban RPA (Receiving Pervious Area)-DIA (Disconnected Impervious Area) system: A simple equation expressing the sensitivity of runoff to changes in imperviousness. J. Hydrol. 2024, 631, 130836. [Google Scholar] [CrossRef]
  22. Assouline, S.; Sela, S.; Dorman, M.; Svoray, T.; Selker, J. A simple analytical method to estimate runoff generation and accumulation. J. Hydrol. 2024, 644, 132053. [Google Scholar] [CrossRef]
  23. Turunen, M.; Gurarslan, G.; Šimůnek, J.; Koivusalo, H. What is the worth of drain discharge and surface runoff data in hydrological simulations? J. Hydrol. 2020, 587, 125030. [Google Scholar] [CrossRef]
  24. Wang, F.; Chen, W.; Niu, L. An Improved InVEST Ecological Service Evaluation Model Based on BP Neural Network Optimization. Nat. Environ. Pollut. Technol. 2020, 19, 991–1000. [Google Scholar] [CrossRef]
  25. Zuo, Y.; Gao, J.; He, K. Interactions among ecosystem service key factors in vulnerable areas and their response to landscape patterns under the National Grain to Green Program. Land Degrad. Dev. 2024, 35, 898–915. [Google Scholar] [CrossRef]
  26. Jiao, D.; Yan, L. Appraisal of urban land ecological security and analysis of influencing factors: A case study of Hefei city, China. Environ. Sci. Pollut. Res. 2022, 29, 90803–90819. [Google Scholar] [CrossRef]
  27. Malekmohammadi, B.; Jahanishakib, F. Vulnerability assessment of wetland landscape ecosystem services using driver-pressure-state-impact-response (DPSIR) model. Ecol. Indic. 2017, 82, 293–303. [Google Scholar] [CrossRef]
  28. Zhang, Z.; Wang, C.; Lv, B. Comparative analysis of ecological sensitivity assessment using the coefficient of variation method and machine learning. Environ. Monit. Assess. 2024, 196, 1000. [Google Scholar] [CrossRef]
  29. Shamuxi, A.; Han, B.; Jin, X.; Wusimanjiang, P.; Abudukerimu, A.; Chen, Q.; Zhou, H.; Gong, M. Spatial pattern and driving mechanisms of dryland landscape ecological risk: Insights from an integrated geographic detector and machine learning model. Ecol. Indic. 2025, 172, 113305. [Google Scholar] [CrossRef]
  30. Tong, Z.; Zhang, Z.; Lu, Y.; Liu, Y.; An, R.; Luo, X.; Liu, S.; Zhang, B. Optimization of ecological network function and structure by coupling spatial operators and biomimetic intelligent algorithm. J. Clean. Prod. 2024, 465, 142794. [Google Scholar] [CrossRef]
  31. Drechsler, M.; Wätzold, F.; Grimm, V. The hitchhiker’s guide to generic ecological-economic modelling of land-use-based biodiversity conservation policies. Ecol. Model. 2022, 465, 109861. [Google Scholar] [CrossRef]
  32. Dong, X.; Wang, F.; Fu, M. Research progress and prospects for constructing ecological security pattern based on ecological network. Ecol. Indic. 2024, 168, 112800. [Google Scholar] [CrossRef]
  33. Lincoln, P.B.; Engel, S.; Pennycuick, C.J.; Meager, J.J.; Williamson, I.; Loneragan, N.R.; Alerstam, T.; Hedenstrom, A.; Alerstam, T.; Green, M. Society for Experimental Biology Annual Main Meeting: 31st March–4th April 2002, Southhampton, UK, Abstracts. Comp. Biochem. Physiol. Part A Mol. Integr. Physiol. 2003, 134, S1–S237. [Google Scholar] [CrossRef]
  34. Wang, T.; Hou, J.; Li, J.; Li, P.; Tong, Y.; Zhang, N.; Cheng, S.; Li, J.; Li, Z. A novel two-dimensional numerical model developed for slope soil erosion. CATENA 2023, 232, 107387. [Google Scholar] [CrossRef]
  35. Guo, Y.; Peng, C.; Zhu, Q.; Wang, M.; Wang, H.; Peng, S.; He, H. Modelling the impacts of climate and land use changes on soil water erosion: Model applications, limitations and future challenges. J. Environ. Manag. 2019, 250, 109403. [Google Scholar] [CrossRef]
  36. Mirzaee, S.; Pajouhesh, M.; Imaizumi, F.; Abdollahi, K.; Gomez, C. Gully erosion development during an extreme flood event using UAV photogrammetry in an arid area, Iran. CATENA 2024, 246, 108347. [Google Scholar] [CrossRef]
  37. Zhe, J. A Study on Habitat Suitability Changes of the Golden Snub-Nosed Monkey (Rhinopithecus roxellana) in Shennongjia Forestry District, Hubei Province. Master’s Thesis, Beijing Forestry University, Beijing, China, 2016. [Google Scholar]
  38. Liu, Y.; Wang, S.; Peng, H.; Li, Z. Evaluation of forest ecosystem service value in Shennongjia Nature Reserve. Chin. J. Appl. Ecol. 2014, 25, 1431–1438. [Google Scholar]
  39. Lima, C.H.R.; Kwon, H.-H.; Kim, Y.-T. A Bayesian Kriging model applied for spatial downscaling of daily rainfall from GCMs. J. Hydrol. 2021, 597, 126095. [Google Scholar] [CrossRef]
  40. Kim, D.H. High-spatial-resolution streamflow estimation at ungauged river sites or gauged sites with missing data using the National Hydrography Dataset (NHD) and U.S. Geological Survey (USGS) streamflow data. J. Hydrol. 2018, 565, 819–834. [Google Scholar] [CrossRef]
  41. Islam, K.I. Predicting areal extent of groundwater contamination through geostatistical methods exploration in a data-limited rural basin. Groundw. Sustain. Dev. 2023, 23, 101043. [Google Scholar] [CrossRef]
  42. Gribov, A.; Krivoruchko, K. Empirical Bayesian kriging implementation and usage. Sci. Total Environ. 2020, 722, 137290. [Google Scholar] [CrossRef]
  43. Pilz, J.; Spöck, G. Why do we need and how should we implement Bayesian kriging methods. Stoch. Environ. Res. Risk Assess. 2007, 22, 621–632. [Google Scholar] [CrossRef]
  44. Sun, Q. Preliminary analysis of annual precipitation distribution with elevation in Hubei Province. Hydrology 1987, 26–29. [Google Scholar] [CrossRef]
  45. Geospatial Data Cloud. ASTER GDEM 30M Resolution Digital Elevation Data [DB/OL]. Available online: https://www.gscloud.cn/sources/accessdata/310?pid=302 (accessed on 3 April 2023).
  46. Zhang, L.; Yu, Q.; Lu, X. Fine simulation and application research on precipitation from April to October in Wushan County. Green Technol. 2020, 22, 13–16+22. [Google Scholar] [CrossRef]
  47. Ali, S.; Tariq, A.; Kayumba, P.M.; Zeng, F.; Ahmed, Z.; Azmat, M.; Mind’je, R.; Zhang, T. Local surface warming assessment in response to vegetation shifts over arid lands of Central Asia (2001–2020). Sci. Total Environ. 2024, 929, 172628. [Google Scholar] [CrossRef]
  48. Hailegeorgis, T.T.; Alfredsen, K. High spatial–temporal resolution and integrated surface and subsurface precipitation-runoff modelling for a small stormwater catchment. J. Hydrol. 2018, 557, 613–630. [Google Scholar] [CrossRef]
  49. Liu, C. The Influence of Typical Forest Structure Characteristics on Slope Hydrological Processes in Jinyun Mountain, Chongqing. Ph.D. Thesis, Beijing Forestry University, Beijing, China, 2019. [Google Scholar] [CrossRef]
  50. Ge, D. Study on the Soil and Water Conservation Function of Forest Plant Communities in Simianshan, Chongqing. Ph.D. Thesis, Beijing Forestry University, Beijing, China, 2011. [Google Scholar]
  51. Tomiolo, S.; Ward, D. Species migrations and range shifts: A synthesis of causes and consequences. Perspectives in Plant Ecology. Evol. Syst. 2018, 33, 62–77. [Google Scholar] [CrossRef]
  52. Iyer, A.; Benitez-Paez, F.; Brum-Bastos, V.; Beggan, C.D.; Demšar, U.; Long, J.A. Spatial-temporal interpolation of satellite geomagnetic data to study long-distance animal migration. Ecol. Inform. 2022, 72, 101888. [Google Scholar] [CrossRef]
  53. Zhao, R.; Wang, S.; Chen, S. Predicting the potential habitat suitability of Saussurea species in China under future climate scenarios using the optimized Maximum Entropy (MaxEnt) model. J. Clean. Prod. 2024, 474, 143552. [Google Scholar] [CrossRef]
  54. Cunze, S.; Tackenberg, O. Decomposition of the maximum entropy niche function—A step beyond modelling species distribution. Environ. Model. Softw. 2015, 72, 250–260. [Google Scholar] [CrossRef]
  55. Juan, W.; Zhihong, W.; Jianguo, Z.; Na, C.; Si, L.; Zhan, Y. Remote sensing monitoring of human activities and evaluation of their impact intensity in national nature reserves in Henan Province. Nat. Resour. Remote Sens. 2022, 34, 235–242. [Google Scholar]
  56. Liu, S.; Hou, X.; Yin, Y.; Cheng, F.; Zhang, Y. Dong Shikui Progress in Landscape Ecological Network Research. Chin. J. Ecol. 2017, 37, 3947–3956. [Google Scholar]
  57. Zhang, P.; Hu, Y.; Quan, Y.; Xu, Q.; Liu, D.; Tian, S.; Chen, N. Identifying ecological corridors for wetland waterbirds in Northeast China. Ecol. Indic. 2022, 145, 109620. [Google Scholar] [CrossRef]
  58. Huang, L.; Chen, Z.; Yang, Z.; Chen, M.; Chen, X.; Zhai, T.; Qiu, T. Integrating “quality-risk-demand” framework and circuit theory to identify spatial range and priority area of ecological security pattern in a rapidly urbanizing landscape. Ecol. Inform. 2024, 82, 102673. [Google Scholar] [CrossRef]
  59. Zhou, X.; Zheng, D.; Tu, S.; Yan, H. Research on the Technical System of Ecological Protection Analysis from the Perspective of Watershed. Planner 2022, 38, 22–27. [Google Scholar] [CrossRef]
  60. Xu, Z.; Ma, J.; Zheng, H.; Wang, L.; Ying, L.; Li, R.; Yang, Y. Quantification of the flood mitigation ecosystem service by coupling hydrological and hydrodynamic models. Ecosyst. Serv. 2024, 68, 101640. [Google Scholar] [CrossRef]
  61. Taye, G.; Vanmaercke, M.; van Wesemael, B.; Tesfaye, S.; Teka, D.; Nyssen, J.; Deckers, J.; Poesen, J. Estimating the runoff response from hillslopes treated with soil and water conservation structures in the semi-arid Ethiopian highlands: Is the curve number method applicable? Sci. Afr. 2023, 20, e01620. [Google Scholar] [CrossRef]
  62. Wang, Y.; Kang, L.; Wang, J. Landslide risk assessment combining kernel extreme learning machine and information value modeling-A case study of Jiaxian Country of loess plateau, China. Heliyon 2024, 10, e37352. [Google Scholar] [CrossRef] [PubMed]
  63. Prathom, K.; Sujitapan, C. Performance of logistic regression and support vector machine conjunction with the GIS and RS in the landslide susceptibility assessment: Case study in Nakhon Si Thammarat, southern Thailand. J. King Saud Univ.-Sci. 2024, 36, 103306. [Google Scholar] [CrossRef]
  64. Hammad Khaliq, A.; Basharat, M.; Talha Riaz, M.; Tayyib Riaz, M.; Wani, S.; Al-Ansari, N.; Ba Le, L.; Thi Thuy Linh, N. Spatiotemporal landslide susceptibility mapping using machine learning models: A case study from district Hattian Bala, NW Himalaya, Pakistan. Ain Shams Eng. J. 2023, 14, 101907. [Google Scholar] [CrossRef]
  65. Mukhopadhyay, A.; Hati, J.P.; Acharyya, R.; Pal, I.; Tuladhar, N.; Habel, M. Global trends in using the InVEST model suite and related research: A systematic review. Ecohydrol. Hydrobiol. 2024; in press. [Google Scholar] [CrossRef]
  66. Wang, Y.; Song, C.; Cheng, C.; Wang, H.; Wang, X.; Gao, P. Modelling and evaluating the economy-resource-ecological environment system of a third-polar city using system dynamics and ranked weights-based coupling coordination degree model. Cities 2023, 133, 104151. [Google Scholar] [CrossRef]
  67. Su, Z.A.; Zhou, T.; Zhang, X.B.; Wang, X.Y.; Wang, J.J.; Zhou, M.H.; Zhang, J.H.; He, Z.Y.; Zhang, R.C. A Preliminary Study of the Impacts of Shelter Forest on Soil Erosion in Cultivated Land: Evidence from Integrated 137Cs and 210Pbex Measurements. Soil Tillage Res. 2021, 206, 104843. [Google Scholar] [CrossRef]
  68. Yang, Q.; Niu, C.; Liu, X.; Feng, Y.; Ma, Q.; Wang, X.; Tang, H.; Guo, Q. Mapping High-Resolution Forest Aboveground Biomass of China Using Multisource Remote Sensing Data. GIScience Remote Sens. 2023, 60, 2203303. [Google Scholar] [CrossRef]
  69. Huang, W.; Ding, M.; Li, Z.; Zhuang, J.; Yang, J.; Li, X.; Meng, L.; Zhang, H.; Dong, Y. An Efficient User-Friendly Integration Tool for Landslide Susceptibility Mapping Based on Support Vector Machines: SVM-LSM Toolbox. Remote Sens. 2022, 14, 3408. [Google Scholar] [CrossRef]
  70. Xu, J.; Melick, D.R. Rethinking the effectiveness of public protected areas in southwestern China. Conserv. Biol. 2007, 21, 318–328. [Google Scholar] [CrossRef] [PubMed]
  71. Chen, W.; Gu, T.; Xiang, J.; Luo, T.; Zeng, J. Assessing the conservation effectiveness of national nature reserves in China. Appl. Geogr. 2023, 161, 103125. [Google Scholar] [CrossRef]
  72. Yang, M.; Wang, Z.; Zhang, Z.; Chen, P.; Zhao, D.; Cheng, E.; Wang, C.; Yan, Y. Pathways for ecological restoration of territorial space based on ecosystem integrity: A case study of approach to protecting and restoring mountains, rivers, forests, farmlands, lakes, and grasslands in Beijing, China. Ecol. Front. 2024, 44, 1214–1223. [Google Scholar] [CrossRef]
  73. Ou, X.; Zheng, X.; Liu, Y.; Lyu, Y.; Ai, X.; Gu, X. Unveiling mid-century conservation priorities: Co-occurrence of biodiversity, climate change exposure, and carbon storage in the Middle and Lower Yangtze River Basin, China. Glob. Ecol. Conserv. 2024, 55, e03245. [Google Scholar] [CrossRef]
  74. Paal, T.; Zobel, K.; Liira, J. Standardized response signatures of functional traits pinpoint limiting ecological filters during the migration of forest plant species into wooded corridors. Ecol. Indic. 2020, 108, 105688. [Google Scholar] [CrossRef]
  75. Liu, Y.; Wang, J.; Wu, Z.; Li, S.; Dai, W. Identification of biodiversity priority conservation areas in China by integrating genetic, species and ecosystem diversity. Biol. Conserv. 2024, 300, 110854. [Google Scholar] [CrossRef]
  76. Zhang, B.; Li, L. Evaluation of ecosystem service value and vulnerability analysis of China national nature reserves: A case study of Shennongjia Forest Region. Ecol. Indic. 2023, 149, 110188. [Google Scholar] [CrossRef]
  77. Zhao, J.; Ji, G.; Tian, Y.; Chen, Y.; Wang, Z. Environmental vulnerability assessment for mainland China based on entropy method. Ecol. Indic. 2018, 91, 410–422. [Google Scholar] [CrossRef]
  78. Zhang, J.; Guan, Q.; Shan, Y.; Wang, Q.; Mi, J.; Pan, L. Ecological Security Prediction and Land Use Conflict Identification in Fragile Mountain Cities: A Case Study of Longnan, China. J. Clean. Prod. 2025, 497, 145146. [Google Scholar] [CrossRef]
  79. Tang, X. Risk assessment of landslides in Shennongjia forest area based on information model. J. Water Resour. Constr. Eng. 2018, 16, 115–119+169. [Google Scholar]
  80. Chen, D.; Yu, H.; Zhong, L.; Liu, D. Evaluation of Coordinated Development of Regional Ecology Economy Society Coupling under the Background of National Park Construction: A Case Study of Shennongjia Forest Area. Resour. Sci. 2023, 45, 417–427. [Google Scholar]
  81. Seto, K.C.; Güneralp, B.; Hutyra, L.R. Global Forecasts of Urban Expansion to 2030 and Direct Impacts on Biodiversity and Carbon Pools. In Proceedings of the AGU Fall Meeting Abstracts, AGUFM, San Francisco, CA, USA, 1 December 2012. [Google Scholar] [CrossRef]
  82. Buckley, R. Impacts positive and negative: Links between ecotourism and environment. Environ. Impacts Ecotourism 2004, 1, 5–14. [Google Scholar] [CrossRef]
  83. Wu, X.; Zhang, Y. Coupling analysis of ecological environment evaluation and urbanization using projection pursuit model in Xi’an, China. Ecol. Indic. 2023, 156, 111078. [Google Scholar] [CrossRef]
Figure 1. The location of the study area.
Land 14 00923 g001
Figure 2. Research structure diagram.
Land 14 00923 g002
Figure 3. Schematic diagram of rainfall data optimization techniques for Shennongjia Forestry District.
Land 14 00923 g003
Figure 4. Schematic diagram of surface runoff coefficient data optimization techniques for Shennongjia.
Land 14 00923 g004
Figure 5. Schematic of biodiversity evaluation model optimization for Shennongjia Forestry District.
Land 14 00923 g005
Figure 6. Schematic of soil conservation evaluation model optimization for Shennongjia Forestry District.
Land 14 00923 g006
Figure 7. Comparison of Shennongjia Forestry District Rainfall and surface vegetation runoff data before and after optimization.
Land 14 00923 g007
Figure 8. Results of the Optimized biodiversity protection and soil conservation importance evaluation for Shennongjia Forestry District.
Land 14 00923 g008
Figure 9. Comparison of ecological sensitivity evaluation results before and after optimization.
Land 14 00923 g009
Table 1. Comparison of annual average rainfall data before and after optimization.
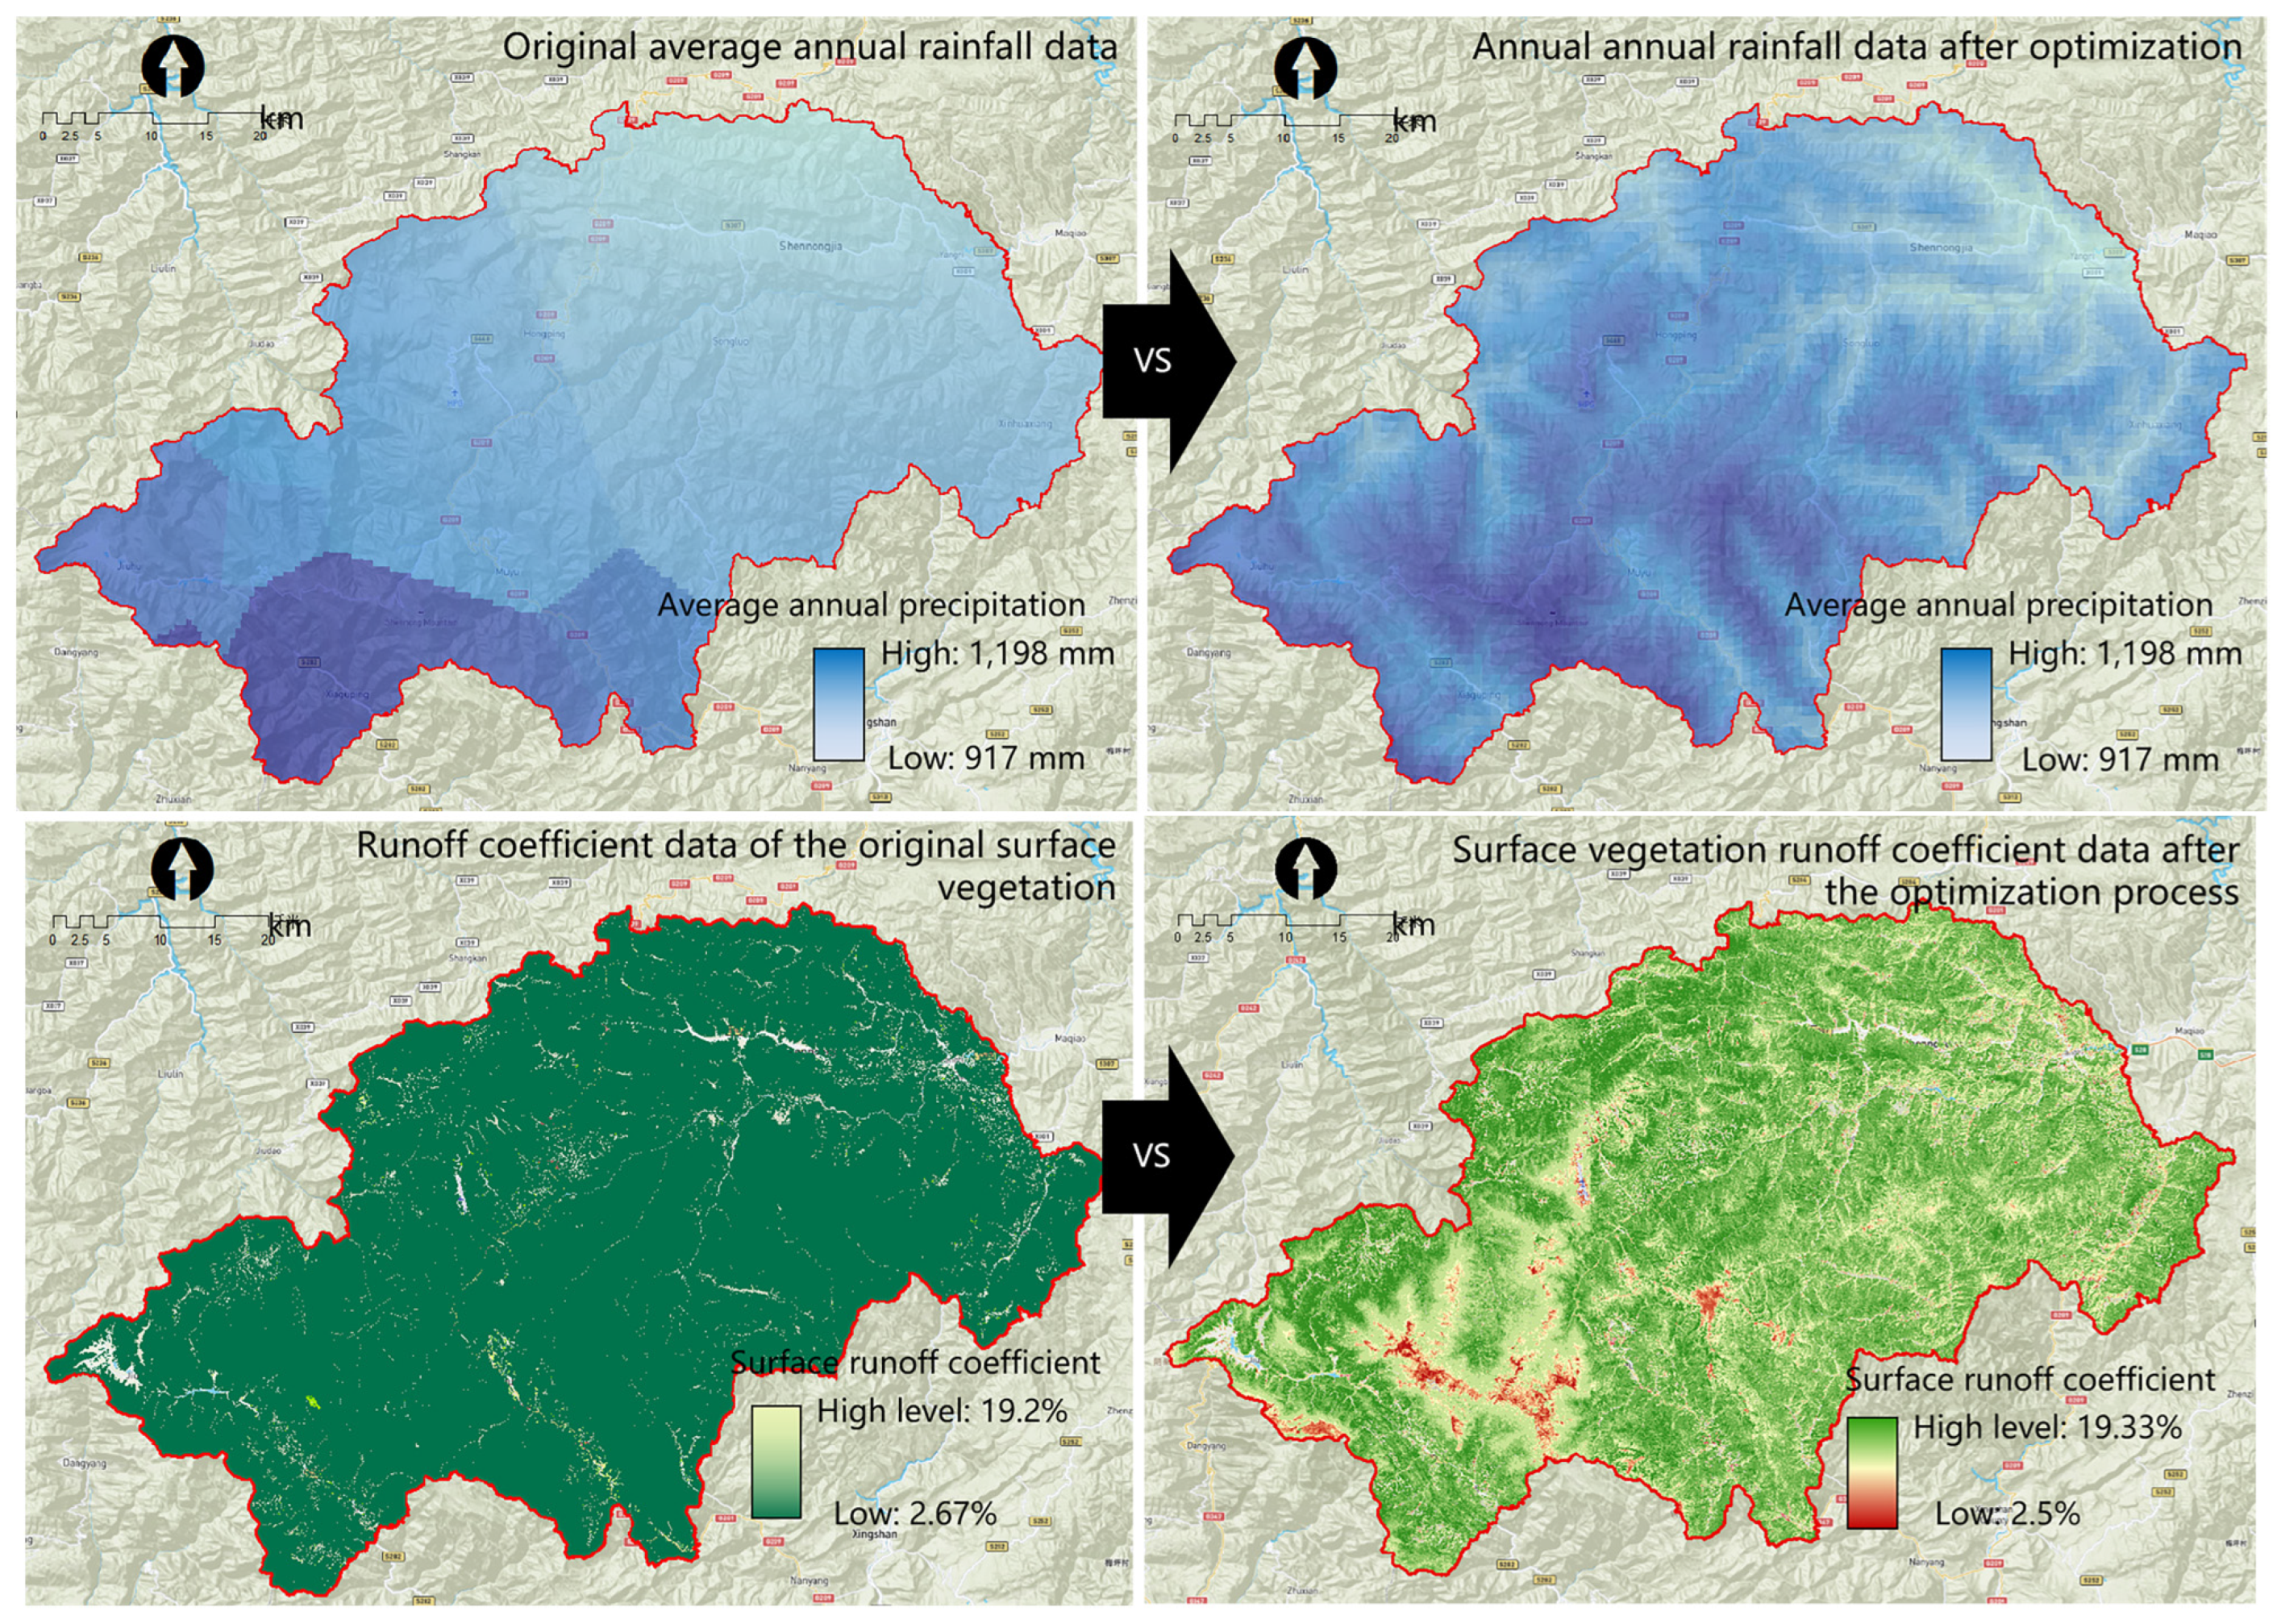
Shennongjia Climate Zone Names and Elevation RangesOriginal ResultOptimized Result
Average Rainfall Within the IntervalRange Value of Rainfall Within the IntervalAverage Rainfall Within the IntervalRange Value of Rainfall Within the Interval
Low-mountain climate zone (500–1000 m)918 mm220.50 mm699 mm64.83 mm
Mid-mountain climate zone (1000–2000 m)1091 mm264.26 mm1017 mm62.46 mm
Subalpine climate zone (>2000 m)1463 mm193.51 mm1888 mm59.15 mm
Table 2. Verification of optimized surface runoff coefficient data.
Vegetation Density IntervalsResearch by Niwat Ruangpanit [67]Optimized Data StudyAbsolute Difference Ratio
Corresponding Surface Runoff Coefficient StandardsSurface Runoff Coefficient Statistical Average
20–30%19.33%22.14%14.5%
40–50%15.16%16.03%5.7%
50–60%11.35%13.12%15.6%
60–70%7.36%7.86%6.8%
70–80%4.88%5.13%5.1%
80–90%2.22%2.15%3.2%
Disclaimer/Publisher’s Note: The statements, opinions and data contained in all publications are solely those of the individual author(s) and contributor(s) and not of MDPI and/or the editor(s). MDPI and/or the editor(s) disclaim responsibility for any injury to people or property resulting from any ideas, methods, instructions or products referred to in the content.

