Abstract
Excavators are one of the most frequently used pieces of equipment in large-scale construction projects. They are closely related to the construction speed and total cost of the entire project. Therefore, it is very important to effectively monitor their operating status and detect abnormal conditions. Previous research work was mainly based on expert systems and traditional statistical models to detect excavator anomalies. However, these methods are not particularly suitable for modern sophisticated excavators. In this paper, we take the first step and explore the use of machine learning methods to automatically detect excavator anomalies by mining its working condition data collected from multiple sensors. The excavators we studied are from Sany Group, the largest construction machinery manufacturer in China. We have collected 40 days working condition data of 107 excavators from Sany. In addition, we worked with six excavator operators and engineers for more than a month to clean the original data and mark the anomalous samples. Based on the processed data, we have designed three anomaly detection schemes based on machine learning methods, using support vector machine (SVM), back propagation (BP) neural network and decision tree algorithms, respectively. Based on the real excavator data, we have carried out a comprehensive evaluation. The results show that the anomaly detection accuracy is as high as 99.88%, which is obviously superior to the previous methods based on expert systems and traditional statistical models.
1. Introduction
Excavators are one of the most heavily used pieces of equipment in large construction projects, which are typically sold for more than hundreds of thousands of dollars per machine [1]. Since excavators greatly affect the construction speed and the total cost of the whole project, it is necessary to carefully monitor their running status and detect anomalies as early as possible. In an environment where neglecting potential hazards could result in irreversible damage to the whole excavator and even threaten the safety of the operator, anomaly detection is a key tool to improve the reliability and usability of the excavator and ensure the operator’s safety.
Prior works try to automatically detect excavator anomalies based on two types of methods, expert systems [2,3,4] and traditional statistic models [5,6,7], respectively. However, these methods are not suitable for modern excavators which are exceptionally complex, leaving the anomaly detection in practice still relying on using simple thresholds for certain working condition metrics. Specifically, expert systems require extensive expert knowledge to predefine rules, which is almost impractical for modern complex excavators that contains hundreds of key components and up to hundreds of sensors monitoring various metrics. Moreover, as the volume of excavator working condition data increases, it is hard to extract regular patterns from mass of data based on traditional statistic models.
The recent advancement of neural network and machine learning (ML) have been successfully applied to various application scenarios [8,9,10,11,12,13,14]. However, none has used them in anomaly detection for excavators. Therefore, in this paper, we take the first step to explore using modern machine learning methods to automatically detect excavator anomalies by mining its working condition data collected from multiple sensors.
Our study is based on the excavators of Sany Group [15], the largest construction machinery manufacturer in China. We have collected 40 days of working condition data of 107 excavators from Sany, in total containing 3 million pieces of data entries uploaded from 26 sensors on each excavator. A typical challenge of applying machine learning methods in the traditional industry scenario is the poor data quality, which we have also encountered. As such, we have closely worked together with six excavator operators and engineers for more than one month to clean the original data and label anomalies in them.
Based on the processed data, we have devised and applied three machine learning based anomaly detection methods, using classic support vector machine (SVM) [16], back propagation (BP) neural network [17] and decision tree [18] algorithms, respectively. Comprehensive evaluation on real data from 107 excavators show that the anomaly detection accuracy of our methods is up to 99.88%, which greatly outperforms prior works based on expert systems and traditional statistic models.
To the best of our knowledge, this is the first work that applies modern ML methods (e.g., SVM, BP network, decision tree) on anomaly detection for large and complex excavators. Although currently only several simple classic ML algorithms have been adopted in this paper, the evaluation shows promising performance results and great potential to use ML algorithms in detecting anomalies for excavators.
The rest of paper is organized as follows. In Section 2, we review the related works. Then, we describe the excavator under our study and how we collect, clean and label the data in Section 3 and Section 4. Section 5 presents our excavator anomaly detection algorithms. Experiment results are shown and analyzed in Section 6. Finally, conclusions are drawn in Section 7.
2. Related Work
Since previously most traditional manufacturers have kept their excavators’ working condition data as confidential, there are not many publicly-available works proposing anomaly detection methods for excavators. Among them, two categorizations can be drawn:
- Expert systems [2,3,4]. To detect excavator anomalies, the authors in [2] discussed an expert system framework for failure detection and predictive maintenance (FDPM) of a mine excavator. FDPM includes an expert system engine and a mathematical knowledge base for fault detection and the corresponding repairing under various conditions. However, the authors in [2] only proposed a framework without implementation, so the effectiveness has not been validated. The authors in [3,4] combined the fault tree analysis with simple rule-based expert system, and designed an expert system with complex reasoning and interpretation functions. However, the construction of the fault tree and the latter analysis highly rely on the professional domain knowledge in a specific environment, which may not be easily adopted to general excavators.
- Traditional statistic models [5,6,7]. These methods mainly use traditional probability and statistics algorithms for anomaly detection. For instance, the authors in [5,6] rely on principal component analysis (PCA) and auto-regressive with extra output (ARX) to extract features that reflect anomalies, and fuzzy c-means (FCM) and radial basis function (RBF) to cluster anomalies and norms, respectively. However, these methods are shown to be not effective when applying to complex and large-volume multi-sensor data. Moreover, the authors in [5,6] only carried out experiments using simulated dataset but no real data verification. The authors in [7] proposed a framework for excavator fault diagnosis based on multi-agent system (MAS). However, only the overall design has been presented and their system has not been implemented and verified.
In summary, compared with the above approaches, the solution we propose does not require extensive professional domain knowledge and can handle a large volume of complex multi-sensor data well. Moreover, our solution has been tested and verified using real excavator data.
3. Data Sources
This section is devoted to showing the excavator description and data collection.
3.1. Excavator Description
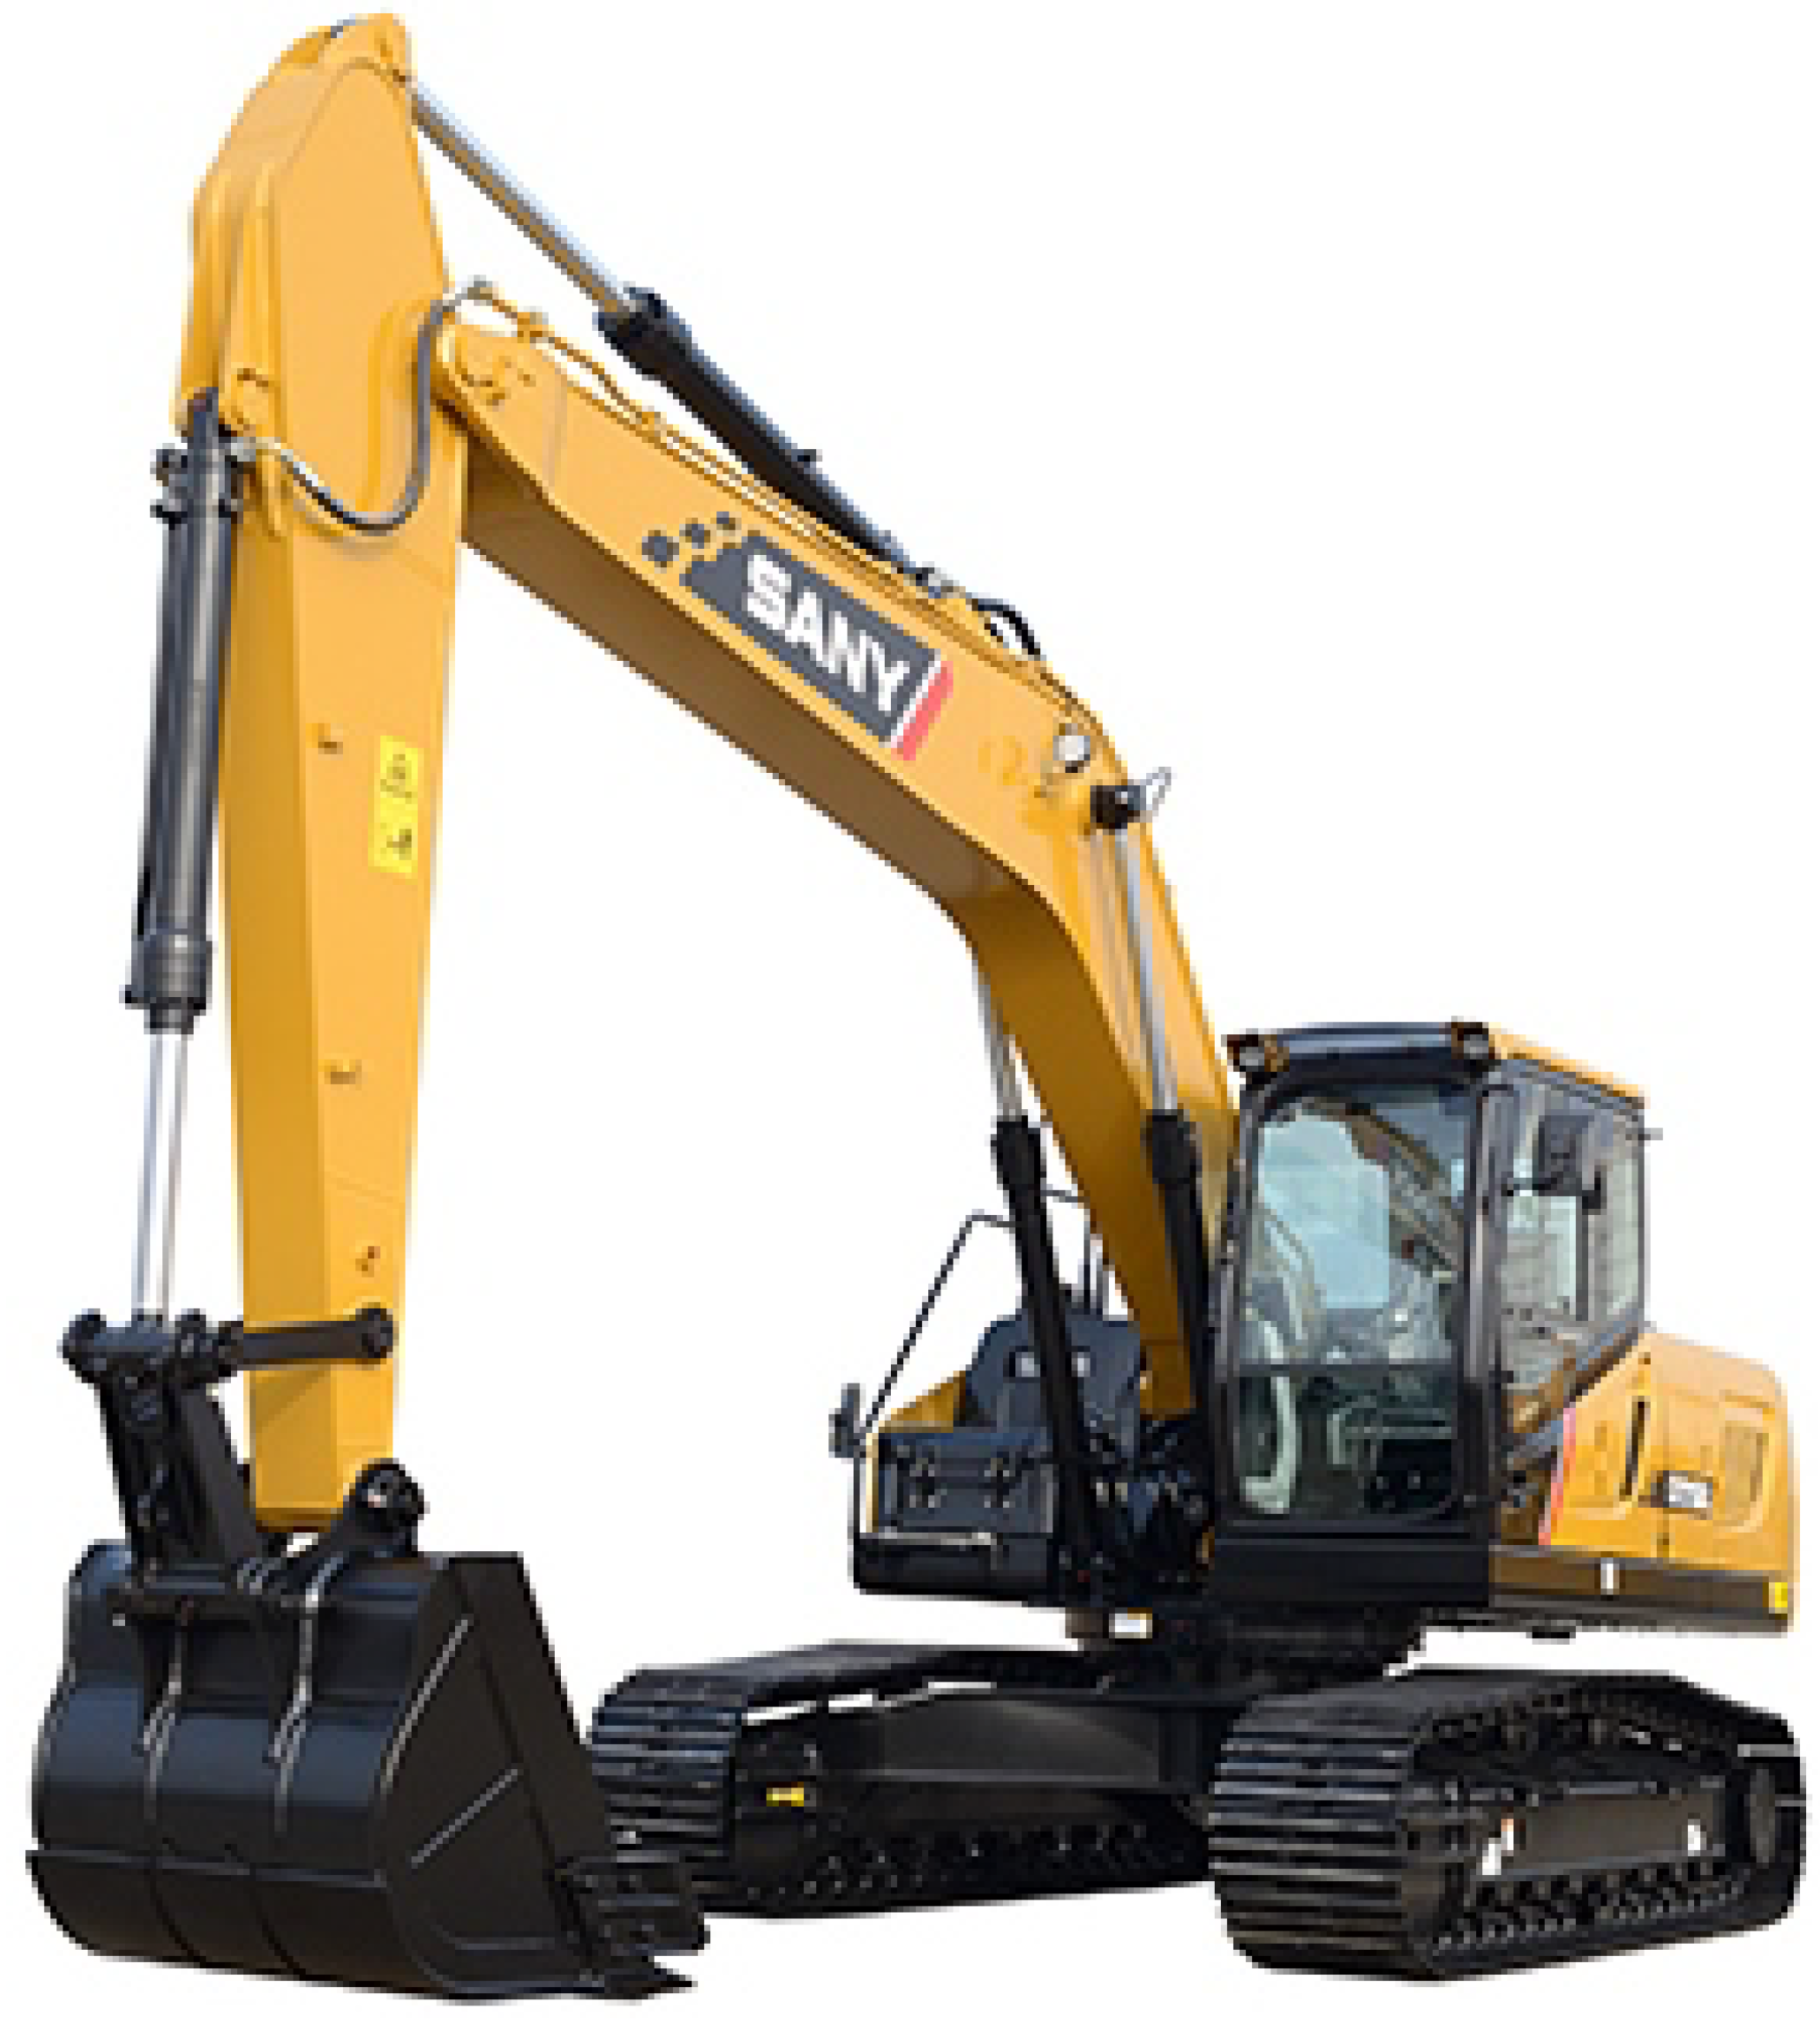
As shown in Figure 1, the excavator used in our study is Sany Group’s SY215C medium-sized hydraulic excavator (weight 22,000 kg, bucket capacity 0.93 m, climbing ability 35 degrees, walking speed 5.4 km/h) [1]. The excavator is mainly composed of an engine, hydraulic system, working device, walking device and electrical control system. The walking device is to enable the walking, which includes a track, a walking engine, and a braking system. The working device is for excavating, which includes booms, arms, buckets, and hydraulic pumps, etc.
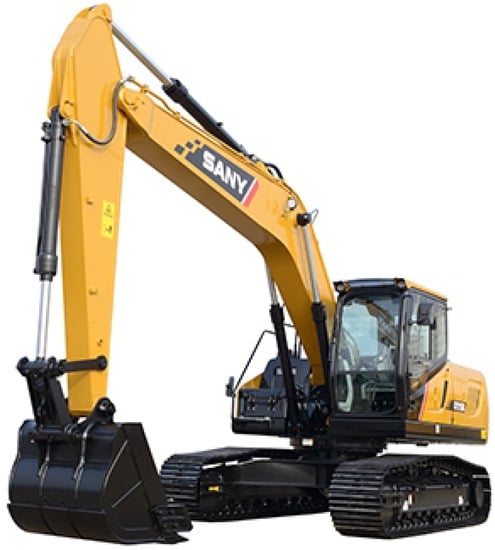
Figure 1.
SY215C medium-sized hydraulic excavator.
3.2. Data Collection
The excavator is equipped with 26 sensors on various components (engine, fuel tank, pump, etc.) monitoring the real-time working condition. The sensors sample the working condition every 10 s and upload the data to the excavator’s controller area network (CAN), which then transmits the data to our central data server. Note that each excavator’s data are only collected and uploaded during its running time but not in its shutdown time.
Sensors with different functions will collect corresponding working condition indicators. For example, the speed sensor will collect the engine speed and no-load engine speed, while the water temperature sensor will collect the cooling water temperature, and the pressure sensor will collect the pump 1 main pressure, pump 2 main pressure and oil pressure.
During the period from 10 November 2018 to 20 December 2018, we have collected 107 excavators’ working data for 40 days. The whole dataset contains approximately 3 million records. Each record contains 68 working condition metrics sampled by the sensors, including engine speed, hydraulic oil temperature, cooling water temperature, and so on. Table 1 summarizes our dataset. In addition, Table 2 and Table 3 list 68 characteristic indexes of excavators.

Table 1.
Dataset description.
Table 2.
Sixty-eight characteristic indexes of excavators.
Table 3.
Sixty-eight characteristic indexes of excavators.
4. Data Preprocessing
In this section, how to clean data and label anomalies is described.
4.1. Cleaning Data
A few working condition samples are missed in our original dataset because of the temporary failures in the sensors and the data collection system. Since typical ML methods can not deal with incomplete datasets, we fill in those missing values according to the following rules: (1) Some working condition metrics are rather stable in a short time period, e.g., the previous sample value of a missing point equals to its next sample. Therefore, we can simply fill in the missing point with the value of its neighboring samples. (2) Some working condition metrics vary significantly, so we take the mean value of the previous sample and the next sample as the value of those missing points.
We note that the above methods may not precisely restore those missing values. However, since the missing points only contribute to one ten thousandth of the whole dataset, we believe this imprecision will not affect our final algorithm results (also verified by our experiments in Section 6).
4.2. Labeling Anomalies
Our original data source does not contain anomaly labels. Therefore, we have closely worked together with six excavator operators and engineers for more than one month to label anomalies in our collected dataset. Specifically, multiple excavator operators helped us to manually record each excavator’s maintenance condition during these 40 days. Each maintenance record consists of the maintenance time, whether there is an anomaly/fault, the anomaly/fault description, the rough time when the anomaly/fault occurs, and the working environment, etc. We define the time period from the occurrence of the anomaly to the end of the maintenance as an abnormal period, and label the working condition data samples during this period as abnormal, i.e., the negative samples. According to the labeled result, the ratio of positive and negative samples in the dataset is about 12:1.
5. Methodology
We now present our anomaly detection algorithms. Specifically, we first merge the original sampled time-series into discrete samples, and then use association analysis techniques to select features. Finally, we adopt three machine learning algorithms (i.e., SVM, BP neural network, decision tree) to detect excavator anomalies from working condition data.
5.1. Merging Time-Series into Discrete Samples
The sensor uploads data every 10 s, which we originally thought to be time series. However, the sensor only collects data when the excavator is working. Since the working time of each excavator is uncertain and discontinuous, and the interval time is also uncertain (e.g., work for an hour and rest for one day), the collected data does not meet the conditions of time series data. As such, to adapt to current ML algorithms, we merged the original sampled time-series into fewer discrete samples.
We observed that the sampled data are quite intermittent, and there is little or no change in each sampled metric value within one excavator working period. Therefore, we merge the samples within each working period into one sample. Specifically, we define that a working period ends if there is no sampled data for more than 2 min. (otherwise should upload sampled data for every 10 s). Then, we take the average value of the original sampled metrics as the value of the merged sample within this time period, and label it as abnormal if there is at least one maintenance record indicating it as abnormal within this time period. The dataset has 56,480 samples after merging.
5.2. Feature Selection
There are 68 sampled metrics forming 68 features in the original dataset. The importance of each metric is different, we need to choose important metrics as much as possible. Hence, we only select part of the features for learning the excavator anomalies. Specifically, we leverage association analysis to select features, which is an effective method to reveal relationships between different features and tend to find an optimal and minimal combination of features. The feature selection technique based on association analysis consists of two steps.
5.2.1. Association Rule Mining Based on an a Priori Algorithm
Association rules can be used to discover hidden relationships in the industrial data feature set. and are two subsets in the feature space F. For feature candidates and , the association rule have two indicators, namely support and confidence. Support indicates the frequency at which the feature subset occurring in the rule and is calculated by Equation (1).
where, defines the number of transactions contained in a certain item set. N represents the total number of item set. Confidence denotes the strength of the rule and is calculated by Equation (2):
5.2.2. Using Association Rules to Select Features
The lift calculation of association rule is as shown in Equation (3). If the lift is greater than 1, the feature candidate is positively correlated with the feature candidate . In addition, if the lift is less than 1, it means that the feature candidate and the feature candidate are negatively correlated. In the same set, all association rules should be calculated. If the corresponding lift is less than 1, the candidate is added to the feature subset, if the lift is greater than 1, the candidate is removed from the feature. Finally, the optimal feature subset with the smallest dimension is selected by iteration:
As described in Table 4, we use association analysis techniques to select 16 features from 68 attributes in the excavator working condition dataset to form the best feature combination.
Table 4.
Sixteen features selected using association analysis.
In order to verify whether the feature set selected using the association analysis is the optimal combination, we conducted a field study. We went to the excavator repair service center of Sany Heavy Industry in Changsha City, Hunan Province, and conducted in-depth discussions with excavator maintenance technicians of the repair service center, and verified the features selected by the association analysis one by one, to confirm whether it is directly related to the failure of excavator. Fortunately, 16 features we chose are directly related to the failure of the excavator. Excavator maintenance technicians also refer to these characteristics when repairing the excavator. It proves that the feature set we chose is indeed the optimal combination.
5.3. Anomaly Detection Algorithms for Excavators
BP neural network, SVM, and decision tree have proven to be effective by recent ML-based anomaly detection works for other application scenario [19,20,21,22,23,24]. Hence, we leverage these three classic algorithms in our design, and devise the following three algorithms for excavator anomaly detection.
5.3.1. BP Neural Network-Based Anomaly Detection
At present, multi-level feedforward neural networks have been successfully applied in many aspects. The training of this network is based on the steepest descent method, which is BP algorithm. BP algorithm is one of the most successful and widely used methods in the field of anomaly detection.
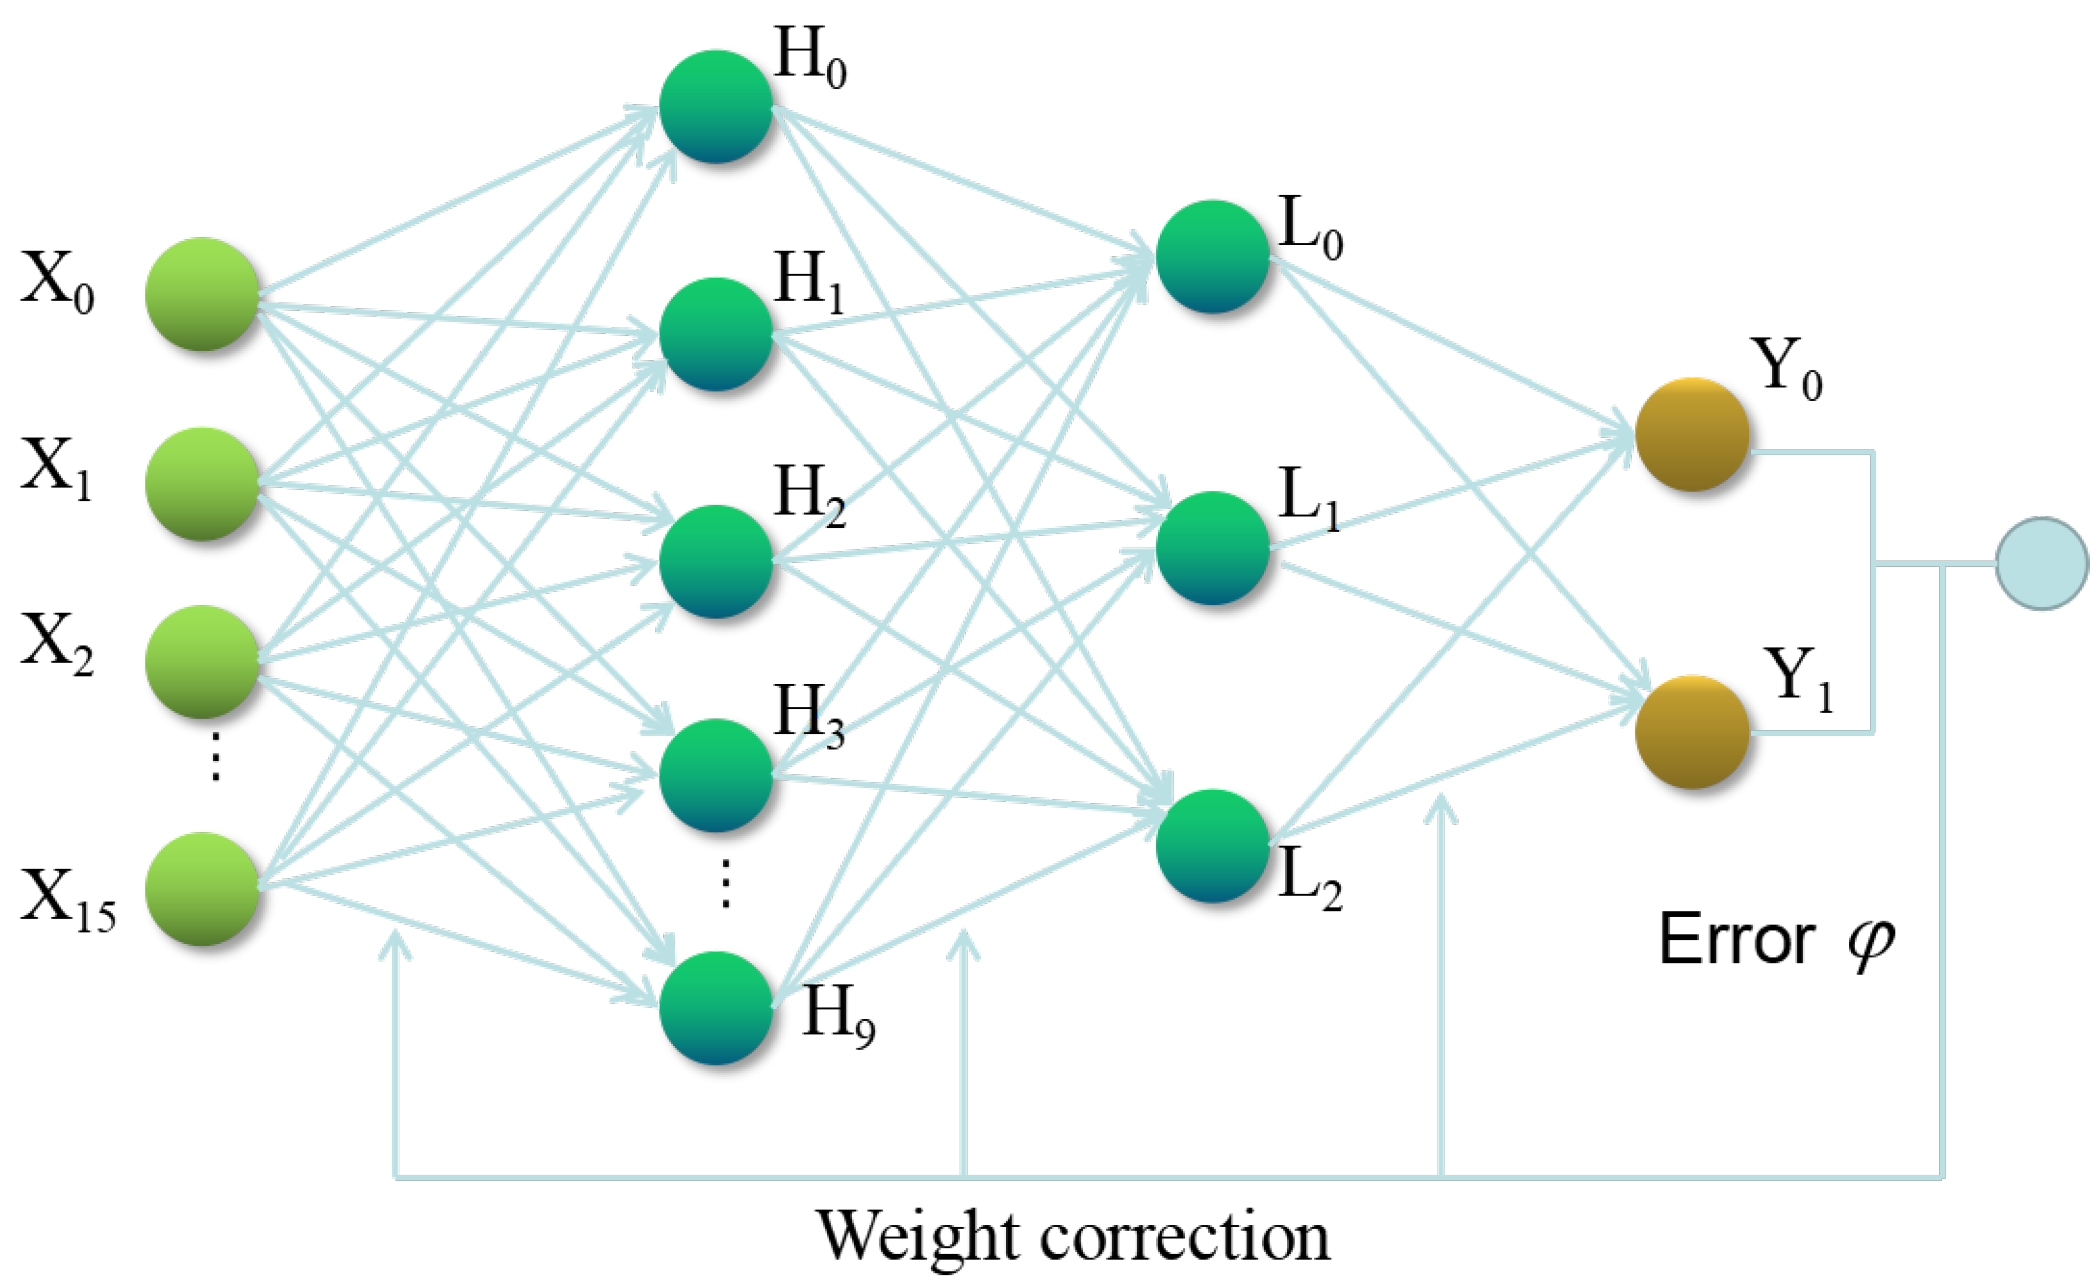
In this paper, BP neural network is trained by using the working condition data of the excavator to construct a anomaly detection model. The BP neural network includes an input layer, hidden layers, and an output layer. The hidden layer has two layers, the first layer has 10 neurons, and the second layer has three neurons. The number of input variables is 16, and the number of expected output variables is 2. Figure 2 shows its topology.

Figure 2.
The topology of theBP neural network.
The BP neural network was trained and tested using different data sets, and the ratio of training and test sets was continually adjusted. Experimental details and results are described in detail in Section 6. The optimal values of the main parameters of the BP neural network in the scenario of this paper are shown in Table 5.
Table 5.
Main parameters of the BP neural network.
5.3.2. SVM-Based Anomaly Detection
SVM was first proposed by Vapnik et al. in [25], and has now become a very popular method for dealing with classification problems. Support vector machine is based on the principle of Structural Risk Minimization (SRM) in statistical learning theory, and has good generalization performance [26]. Minimizing structural risk means maximizing profits between different categories. Thus, SVM is not only a useful statistical theory, but also a way to deal with engineering problems [27]. The idea of SVM is to divide training samples into two classes using a linearly separated hyperplane.
In this study, excavator anomaly detection is formulated as a two-class classification problem, wherein SVM classifier is applied to determine if the state of the excavator is abnormal. We adopt a supervised learning approach for the classifier. That is, we train the classifier with marked data. Data sets are divided into training and test sets in different proportions and used to train and test SVM classifiers. Experimental details and results are described in detail in Section 6. The optimal values of the main parameters of SVM in the scenario of this paper are shown in Table 6.
Table 6.
Main parameters of SVM.
5.3.3. Decision Tree-Based Anomaly Detection
The ID3 algorithm is an algorithm implementation of decision tree proposed by Ross Quinlan, which is based on information theory and takes information entropy and information gain as the measurement standard to realize data induction and classification. The algorithm tends to select attributes with a large number of different values, resulting in many small and pure subsets [28], which can effectively avoid the defects of measurement bias. Accordingly, this paper selects ID3 for intelligent detection of excavator anomaly.
The decision tree algorithm has been applied to the problem of excavator anomaly detection. Input to the algorithm is a set of features selected in Section 5.2, the output is the category, which is normal or abnormal. Similar to the previous two algorithms, data sets are divided into training and test sets in different proportions and used to train and test decision tree. Experimental details and results are described in detail in Section 6. The optimal values of the main parameters of SVM in the scenario of this paper are shown in Table 7.
Table 7.
Main parameters of the decision tree.
6. Experimental Analysis
This section is devoted to showing evaluation metrics and comprehensive evaluation of the performance of three machine learning algorithms.
6.1. Evaluation Metrics
In order to effectively evaluate three anomaly detection schemes, we selected five commonly used evaluation indicators, namely accuracy, specificity, sensitivity, F-measure and AUC (Area Under ROC Curve). The accuracy is the sum of the proportion of classes that are correctly classified in the total. It is given by Equation (4):
where ,, and are true negative, true positive, false negative and false positive, respectively. The specificity reflects the ability of a classifier to identify negative examples. In addition, the sensitivity reflects the ability of a classifier to recognize positive examples. They are given by Equations (5) and (6), respectively:
F-measure is the harmonic mean of recall and precision. It is given by Equation (7). In addition, the last evaluation indicator is AUC. The larger its value, the better the classification effect of the classifier:
6.2. Comprehensive Evaluation
We have devised and applied three machine learning based anomaly detection methods, using SVM, BP neural network and decision tree algorithms, respectively. In addition, we completed the comprehensive evaluation. We adjusted the ratio of the test set to training set to find the best ratio. At the same time, the detection performance of the three machine learning algorithms is evaluated.
We set the dataset to five subsets. The first sub-data set contains data on the working condition of 20 excavators. The second sub-dataset adds working condition data for 20 excavators based on the first sub-dataset, i.e., the second sub-dataset contains data on the working condition of 40 excavators. By analogy, the third sub-data set contains the working condition data of 60 excavators, and the fourth sub-data set contains the working condition data of 80 excavators. Since there are a total of 107 excavator working conditions data, the fifth sub data set contains the working condition data of 107 excavators.
The three approaches were trained and tested by five sub-datasets, and the ratio of training set to test set was adjusted. The results are shown in Table 8, Table 9, Table 10, Table 11 and Table 12. For example, Table 8 shows the values of the evaluation indicators obtained by training and testing the three schemes using datasets 1–5 when the ratio of test set to training set is fixed at 7:3.
Table 8.
The ratio of the test dataset to the training dataset is 7:3.
Table 9.
The ratio of the test dataset to the training dataset is 6:4.
Table 10.
The ratio of the test dataset to the training dataset is 5:5.
Table 11.
The ratio of the test dataset to the training dataset is 4:6.
Table 12.
The ratio of the test dataset to the training dataset is 3:7.
6.2.1. Exploring the Optimal Ratio of Test Set to Training Set
In terms of the ratio of test set to training set, five ratios are set. The ratio of test set to training set is set as 7:3, 6:4, 5:5, 4:6 and 3:7, respectively. The proportion of test set to training set was adjusted. The results are shown in Table 8, Table 9, Table 10, Table 11 and Table 12. For example, Table 12 show the values of the evaluation indicators obtained by training and testing the three schemes using datasets 1–5 when the ratio of test set to training set is fixed at 3:7. Table 11 shows the experimental results with a ratio of 4:6 between the test set and the training set. In addition, Table 8, Table 9 and Table 10 show the experimental results with a ratio of 7:3, 6:4 and 5:5 between the test set and the training set, respectively.
The ratio of test set to training set also has a large impact on the performance of the detection solution. As shown in Figure 3, the dataset 5 is used to train and test the three anomaly detection schemes, and the ratio of test set to training set is changed. From the experimental results, it can be seen that, when the ratio of test set to training set is 3:7, the performance of the three approaches is optimal. Accordingly, we have come to the conclusion that the optimal ratio of test set to training set is 3:7.
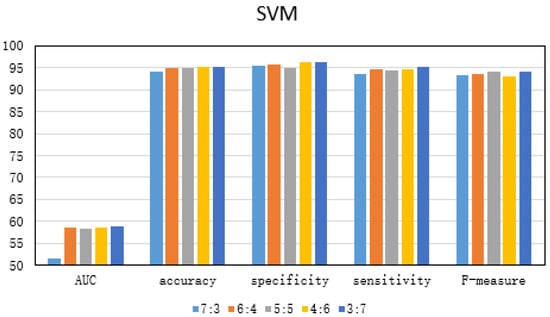
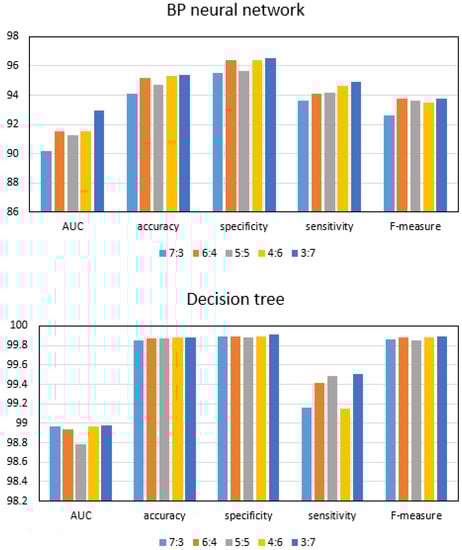
Figure 3.
Experimental comparison of different proportions of test sets to training sets.
6.2.2. Performance Evaluation of Three Anomaly Detection Methods
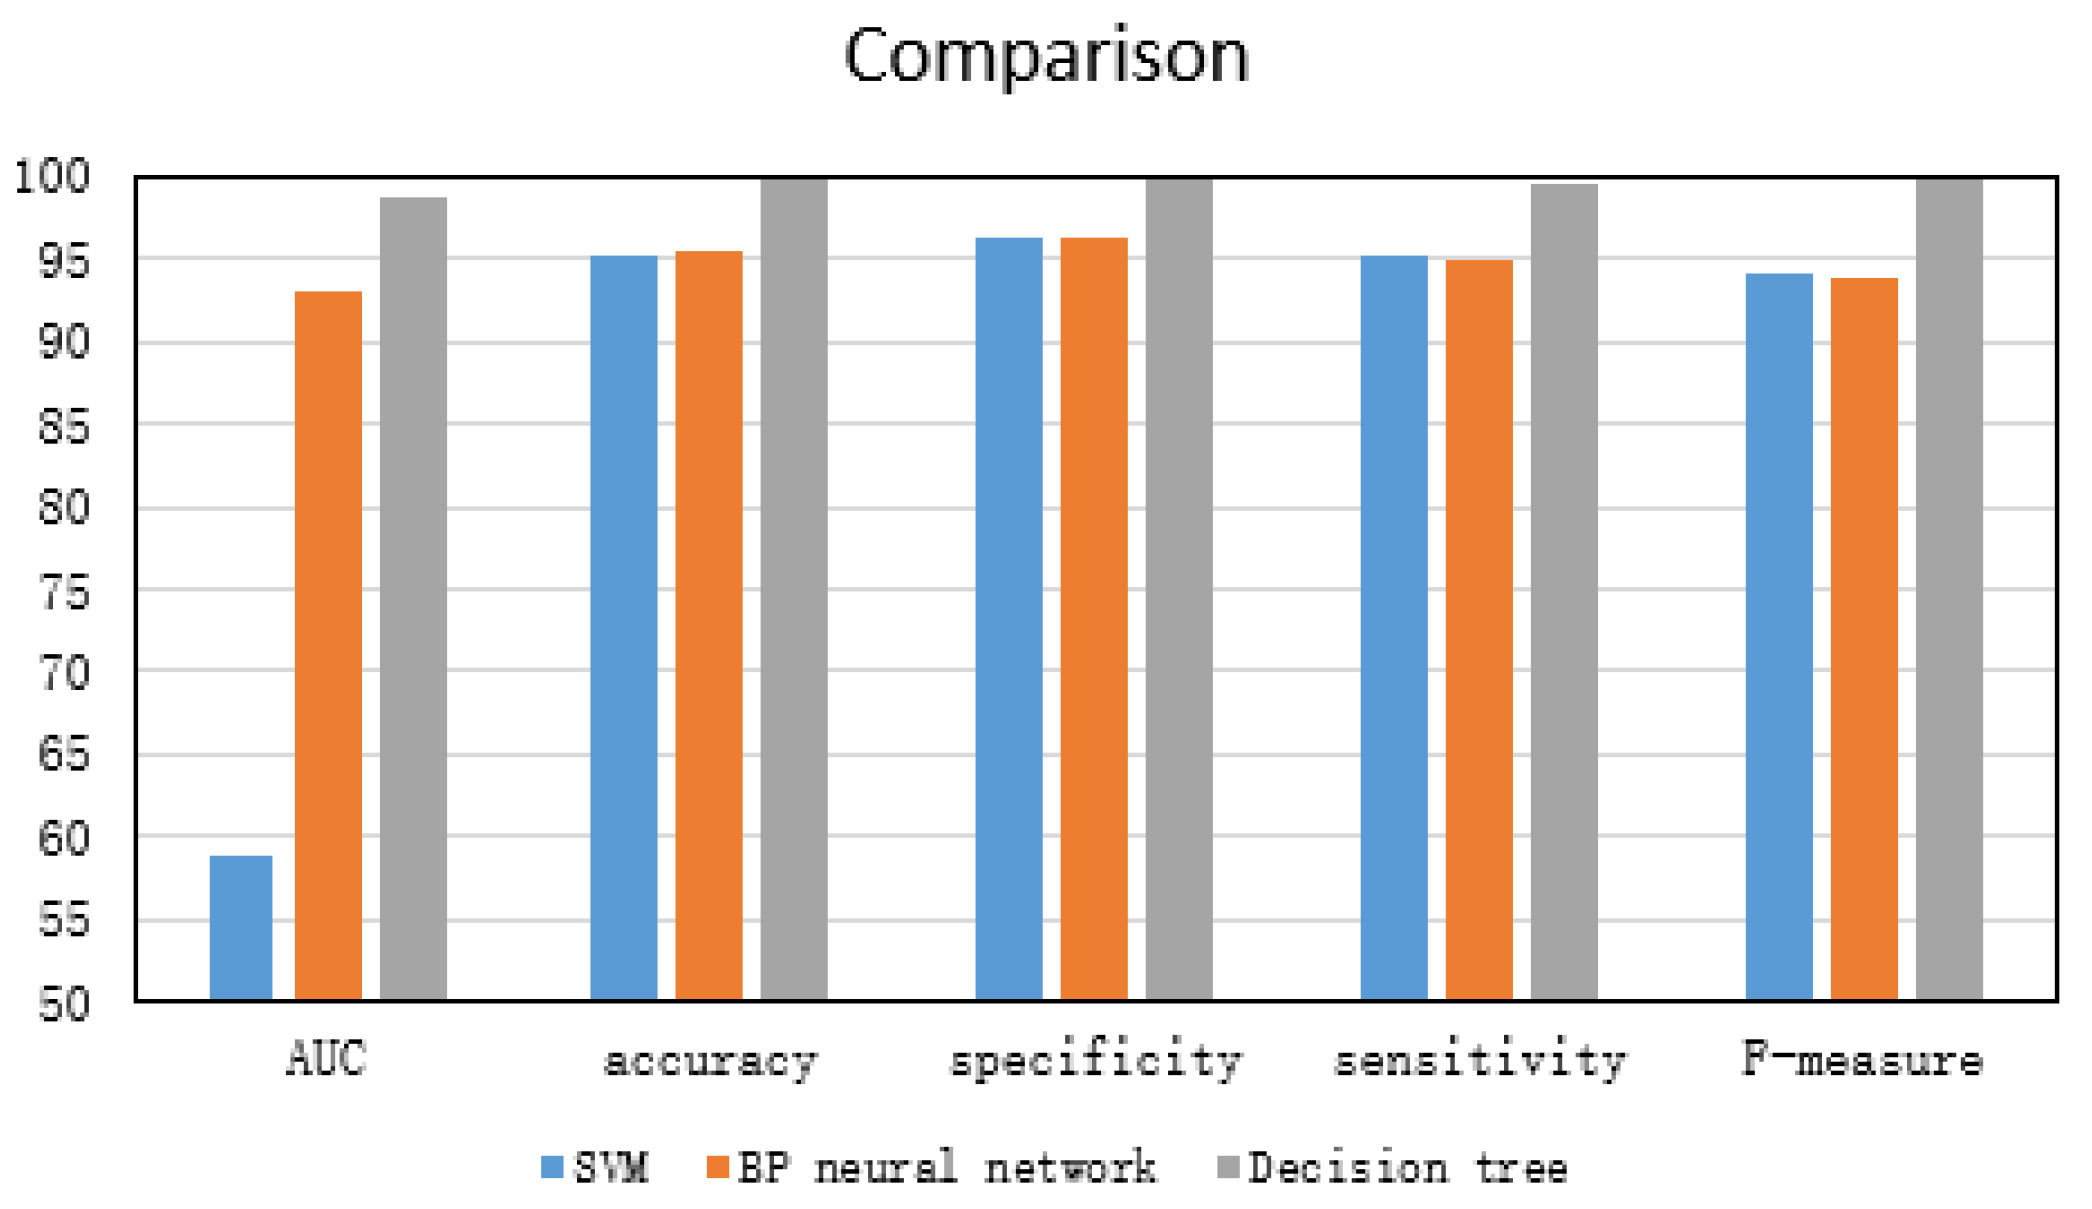
Dataset 5 was used to train and test three anomaly detection approaches, and the ratio between test set and training set was fixed at 3:7. The experimental results are shown in Figure 4. It can be seen from experimental results that the performance of three anomaly detection approaches is very excellent, and their detection accuracy is higher than 0.95. Of course, in comparison, each evaluation index of the detection scheme based on the decision tree is better than the other two schemes. Accordingly, two conclusions can be drawn, one is that the feature combination we choose is optimal; the other is that the detection performance of the decision tree is better than the other two methods.

Figure 4.
Performance comparison of three anomaly detection schemes.
7. Conclusions
In this paper, we take the first step to explore modern machine learning methods to automatically detect excavator anomalies by mining its working condition data collected from multiple sensors. In the face of poor quality data, we have performed a series of pre-processing tasks, including data cleaning, anomaly marking, and discretization. In addition, we have selected 16 features using correlation analysis techniques. Based on the processed data, we have designed and applied three machine learning-based anomaly detection methods, using SVM, BP neural network and decision tree algorithms, respectively. Comprehensive evaluation on real data from 107 excavators show that the best anomaly detection accuracy reaches 99.88%. It shows that the machine learning method has great potential in the field of excavator anomaly detection.
Applying machine learning to the field of excavator anomaly detection has played a very important role in the intelligentization of excavators. In the future, we have three research priorities. The first one is to improve the quality of data collection, improve the collection equipment and collection rules. The second important point is to classify the abnormality of the excavator, specifically to the component, that is, to be able to detect which component has an abnormality. The third focus is to explore more machine learning methods and apply them to the field of excavator anomaly detection.
Author Contributions
The idea of the whole thesis was put forward by Q.Z. She also wrote the paper. G.C. helped in writing and reviewing the paper. W.J., K.L. (Kenli Li) and K.L. (Keqin Li) analyzed the existing work, and Z.L. provided the experimental data set.
Funding
This work is supported by the Fundamental Research Funds for the Central Universities (Grant No. 531107051136), and the National Natural Science Foundation of China(Grant No. 6187060280).
Conflicts of Interest
The authors declare no conflict of interest.
Abbreviations
The following abbreviations are used in this manuscript:
| SVM | Support vector machine |
| BP | Back propagation |
| ML | Machine learning |
| FDPM | Failure detection and predictive maintenance |
| PCA | Principal component analysis |
| ARX | Auto-regressive with extra output |
| FCM | Fuzzy c-means |
| RBF | Radial basis function |
| MAS | Multi-agent system |
| CAN | Controller area network |
| SRM | Structural risk minimization |
| SVs | Support vectors |
| AUC | Area under ROC curve |
References
- SY215C Medium Hydraulic Excavator. Available online: http://product.sanygroup.com/zw-sy215c-10.html (accessed on 6 May 2019).
- Kumar, P.; Srivastava, R. An expert system for predictive maintenance of mining excavators and its various forms in open cast mining. In Proceedings of the 2012 1st International Conference on Recent Advances in Information Technology (RAIT), Dhanbad, India, 15–17 March 2012; pp. 658–661. [Google Scholar] [CrossRef]
- Yin, J.; Mei, L. Fault Diagnosis of Excavator Hydraulic System Based on Expert System. Lect. Notes Electr. Eng. 2011, 122, 87–92. [Google Scholar]
- Li, G.; Zhang, Q. Hydraulic fault diagnosis expert system of excavator based on fault tree. Adv. Mater. Res. 2011, 228, 439–446. [Google Scholar] [CrossRef]
- He, X.; He, Q. Application of PCA method and FCM clustering to the fault diagnosis of excavator’s hydraulic system. IEEE Int. Conf. Autom. Lofistics 2007, 1635–1639. [Google Scholar] [CrossRef]
- He, X. Fault Diagnosis of Excavator’s Hydraulic System Based on ARX Model. In Proceedings of the International Conference on Mechanical Design, Manufacture and Automation Engineering, Phuket, Thailand, 11–12 June 2014. [Google Scholar]
- Tang, X.Y.; Cui, Y.J.; Zhou, M.; Li, J.X. Study on MAS-Based Fault Diagnosis System for GJW111 Excavator. Adv. Mater. Res. 2012, 497, 1946–1949. [Google Scholar] [CrossRef]
- Lu, Y.; Chen, G.; Li, B.; Tan, K.; Xiong, Y.; Cheng, P.; Zhang, J.; Chen, E.; Moscibroda, T. Multi-Path Transport for RDMA in Datacenters. In Proceedings of the 15th USENIX Symposium on Networked Systems Design and Implementation (NSDI 18), Renton, WA, USA, 9–11 April 2018; USENIX Association: Renton, WA, USA, 2018; pp. 357–371. [Google Scholar]
- Chen, G.; Lu, Y.; Meng, Y.; Li, B.; Tan, K.; Pei, D.; Cheng, P.; Luo, L.L.; Xiong, Y.; Wang, X.; et al. Fast and Cautious: Leveraging Multi-path Diversity for Transport Loss Recovery in Data Centers. In Proceedings of the 2016 USENIX Annual Technical Conference (USENIX ATC 16), Denver, CO, USA, 20–21 June 2016; USENIX Association: Denver, CO, USA, 2016; pp. 29–42. [Google Scholar]
- Lu, Y.; Chen, G.; Luo, L.; Tan, K.; Xiong, Y.; Wang, X.; Chen, E. One more queue is enough: Minimizing flow completion time with explicit priority notification. In Proceedings of the IEEE INFOCOM 2017—IEEE Conference on Computer Communications, Atlanta, GA, USA, 1–4 May 2017; pp. 1–9. [Google Scholar] [CrossRef]
- Chen, J.; Li, K.; Tang, Z.; Bilal, K.; Yu, S.; Weng, C.; Li, K. A Parallel Random Forest Algorithm for Big Data in a Spark Cloud Computing Environment. IEEE Trans. Parallel Distrib. Syst. 2017, 28, 919–933. [Google Scholar] [CrossRef]
- Chen, J.; Li, K.; Deng, Q.; Li, K.; Yu, P.S. Distributed Deep Learning Model for Intelligent Video Surveillance Systems with Edge Computing. IEEE Trans. Ind. Inf. 2019. [Google Scholar] [CrossRef]
- Duan, M.; Li, K.; Liao, X.; Li, K. A Parallel Multiclassification Algorithm for Big Data Using an Extreme Learning Machine. IEEE Trans. Neural Netw. Learn. Syst. 2018, 29, 2337–2351. [Google Scholar] [CrossRef]
- D’Angelo, G.; Palmieri, F.; Rampone, S. Detecting unfair recommendations in trust-based pervasive environments. Inf. Sci. 2019, 486, 31–51. [Google Scholar] [CrossRef]
- Sanygroup. Available online: http://www.sanygroup.com/ (accessed on 6 May 2019).
- Vapnik, V.; Lerner, A. Recognition of Patterns with help of Generalized Portraits. Avtomat. I Telemekh 1963, 24, 774–780. [Google Scholar]
- Rumelhart, D.; Hinton, G.; Williams, R. Learning representations by back-propagating errors. Nature 1986, 323, 533–536. [Google Scholar] [CrossRef]
- Rokach, L.; Maimon, O. Data Mining with Decision Trees: Theory and Applications; World Scientific: Singapore, 2008. [Google Scholar]
- Chiba, Z.; Abghour, N.; Moussaid, K.; Omri, A.; Rida, M. A Hybrid Optimization Framework Based on Genetic Algorithm and Simulated Annealing Algorithm to Enhance Performance of Anomaly Network Intrusion Detection System Based on BP Neural Network. In Proceedings of the 2018 International Symposium on Advanced Electrical and Communication Technologies (ISAECT), Kenitra, Morocco, 21–23 November 2018; pp. 1–6. [Google Scholar] [CrossRef]
- Shan, Y.; Yijuan, L.; Fangjing, G. The Application of BP Neural Network Algorithm in Optical Fiber Fault Diagnosis. In Proceedings of the 2015 14th International Symposium on Distributed Computing and Applications for Business Engineering and Science (DCABES), Guiyang, China, 18–24 August 2015; pp. 509–512. [Google Scholar] [CrossRef]
- Lei, Y. Network Anomaly Traffic Detection Algorithm Based on SVM. In Proceedings of the 2017 International Conference on Robots & Intelligent System (ICRIS), Huai’an, China, 15–16 October 2017; pp. 217–220. [Google Scholar] [CrossRef]
- Zhang, M.; Xu, B.; Gong, J. An Anomaly Detection Model Based on One-Class SVM to Detect Network Intrusions. In Proceedings of the 2015 11th International Conference on Mobile Ad-hoc and Sensor Networks (MSN), Shenzhen, China, 16–18 December 2015; pp. 102–107. [Google Scholar] [CrossRef]
- Chaaya, G.; Maalouf, H. Anomaly detection on a real-time server using decision trees step by step procedure. In Proceedings of the 2017 8th International Conference on Information Technology (ICIT), Amman, Jordan, 17–18 May 2017; pp. 127–133. [Google Scholar] [CrossRef]
- Feng, Z.; Hongsheng, S. A decision tree approach for power transformer insulation fault diagnosis. In Proceedings of the 2008 7th World Congress on Intelligent Control and Automation, Chongqing, China, 25–27 June 2008; pp. 6882–6886. [Google Scholar] [CrossRef]
- Cherkasskey, V. The nature of statistical learning theory. IEEE Trans. Neural Netw. 1997, 8, 1564. [Google Scholar] [CrossRef] [PubMed]
- Vapnik, V.; Vapnik, V. Statistical Learning Theory; Wiley: New York, NY, USA, 1998. [Google Scholar]
- Vapnik, V.; Vapnik, V. An overview of statistical learning theory. IEEE Trans. Neural Netw. 1999, 10, 988–999. [Google Scholar] [CrossRef] [PubMed]
- Chen, X.; Xu, L.; Liu, X.; Wang, X. Application of Decision-tree Algorithm in Equipment Fault Detection. Ordnance Ind. Autom. 2015, 10, 81–84. [Google Scholar]


© 2019 by the authors. Licensee MDPI, Basel, Switzerland. This article is an open access article distributed under the terms and conditions of the Creative Commons Attribution (CC BY) license (http://creativecommons.org/licenses/by/4.0/).