Abstract
This paper presents new correlations for estimating the surrounding rock pressure of symmetrically shaped tunnels based on a symmetrical numerical model. Surrounding rock pressure is defined as the load acting on the support structure due to the deformation of the surrounding rock after tunnel excavation. Surrounding rock pressure is directly related to the selection of the lining structure and the determination of support parameters. The main challenge in designing and proceeding with the construction process is choosing a calculation method for the surrounding rock pressure for super-large sections, and this has been the focus of research among the tunnel research community. The excavation area of Liantang tunnel of Shenzhen Eastern Transit Expressway (China) is over 400 m2, making it the largest highway tunnel in the world so far. Based on this project, this paper analyses the applicability of various traditional methods of calculating the surrounding rock pressure for super-large section tunnels. In addition, based on the Tunneling Quality Index (Q), the factor of span is introduced into the method of calculating the surrounding rock pressure using the numerical simulation results of super-large symmetrical tunnels with different values of Q and different spans. Additionally, calculated correlations that could quickly estimate the surrounding rock pressure of tunnels are obtained. The comparison of surrounding rock pressures between the estimated and monitoring results of Liantang tunnel and more than 30 projects around the world effectively proves the rationality and universal applicability of the proposed correlations. This method could provide engineers and designers with a quick way to predict the surrounding rock pressure of deep super-large section underground structures during their design and construction stage.
1. Introduction
With the rapid development of the economy, logistics and automobile industry, the traffic flow and comfort standards of highway traffic are significantly improving. Traditional two-lane and three-lane highway tunnels struggle to meet the needs of modern traffic development.
According to the standard recommended by Japan Tunnel Association [1], the tunnel sections can be defined in accordance with Table 1, which means the standard two-lane tunnel section is less than 100 m2 and the super-large section tunnel is over 140 m2. According to some statistics, up till now, there are 51 highway tunnels with a maximum area of more than 200 m2 excavated by drilling and blasting methods in China and abroad. The construction situation of some super-large section tunnels is shown in Table 2.

Table 1.
Classification standard of tunnel sections.
Table 2.
Construction situation of super-large section tunnels.
Due to the peculiar nature of super-large section structural design and irregular design shape, the mechanical characteristics of surrounding rock are difficult to predict. Furthermore, due to the large section and low flat ratio of tunnels, the self-bearing capacity of surrounding rock cannot be fully utilized, and safety accidents such as block falls and collapses can occur during construction. Therefore, super-large sections are very complex in terms of structural design and technological challenges for its construction. There are still many key technical problems to be solved in this field. Among them, the mode of action and the calculation method of surrounding rock pressure for super-large sections are the key to solving other technical problems and have been researched a lot by the academic and engineering communities in recent years, using numerical simulations, theoretical analysis, on-site monitoring and other ways.
Yan et al. [2] analyzed and discussed the influence of stress path on surrounding rock pressure of super-large section tunnels by introducing a process load influence coefficient and combining it with numerical results. Liu et al. [3] discussed the vertical distribution characteristics of surrounding rock pressure of large-span highway tunnel in combination with the experimental values of surrounding rock pressure of Longtoushan large-span tunnel in Guangzhou (China). The authors also considered the effect of double-sided tunnel construction method on the release of vertical surrounding rock pressure. Based on the summarized types and main influencing factors of tunnel surrounding rock pressure, Li et al. [4] studied the distribution characteristics of tunnel surrounding rock pressure and its relationship with surrounding rock grade and tunnel burial depth through statistical analysis of surrounding rock pressure of 91 monitoring sections of 44 tunnels. The authors also studied the basic law of rock pressure time-history and put forward three stages including rapid growth, slowly growth, settle out. Based on the monitoring and measurement of surrounding rock and supporting structure during the construction of a large-span and high-sidewall underground cavern, Zhao et al. [5] analyzed the applicability of various numerical techniques to the calculation of surrounding rock pressure of the underground cavern, and summarized some suitable numerical methods for surrounding rock pressure of large-span and high-sidewall deep-buried cavern in hard stratum. Jiang et al. [6] discussed the applicability and unification of various pressure correlations relying on large-span tunnels. Jiang [7], Wang [8], Jiang [9] have conducted a lot of research on the surrounding rock pressure and the stability of large-scale underground hydropower stations using numerical simulations and on-site monitoring. Chee-nan [10] investigated the development of ground arching using stress redistribution during tunneling and established a three-dimensional numerical model of the tunnel to gain more insight into the adjustment of tunneling stress. They also proposed a method to determine the area of pressure arch above the tunnel and concluded that the stress adjustment above the tunnel roof during the tunneling process increases significantly for the lateral earth pressure coefficient (K > 1.5). Regarding the distance from the inflection point of tangential stress above the arch top to the arch top as an indirect index, which is used to evaluate the stability of surrounding rock in tunnel excavations, Kong [11] analyzed the influence of Geological Strength Index (GSI from 20 to 80), the overburden depth (H from 40 m to 420 m), in-situ stress ratio (k0 from 0.8 to 3) and excavation roof rise-to-span ratio on the surrounding rock pressure. Based on the block theory, Prasad et al. [12] proposed a calculation method for surrounding rock pressure. Scussel et al. [13] proposed a new approach to obtain tunnel support pressure for polyaxial state of stress. The proposed method incorporates the intermediate principal stress in the analysis and has a wide applicability to many available software. These research results provide abundant references for calculating the surrounding rock pressure of large section tunnels. However, due to the complexity of geological conditions and construction processes, studies focusing on the surrounding rock pressure of super-large section highway tunnels with excavation area exceeding 400 m2 are scarce in literature.
Based on the Liantang tunnel (China) large-span project of the Shenzhen Eastern Transit Expressway, this paper analyses the applicability of various traditional surrounding rock pressure calculation methods in super-large section tunnels. By comparing and analyzing the numerical simulation results of super-large section tunnels under different values of Q and spans, the span term is introduced into the method of calculating surrounding rock pressure based on Q system; Based upon this strategy, a method that can quickly estimate the surrounding rock pressure of tunnels is proposed. A comparison of surrounding rock pressures between estimated and monitored values of more than 30 projects around the world effectively proves the rationality and universal applicability of the correlations. This method can not only provide calculation basis for engineering designers and on-site staff, but can also serve as a theoretical reference for researchers in this field.
2. Project Overview
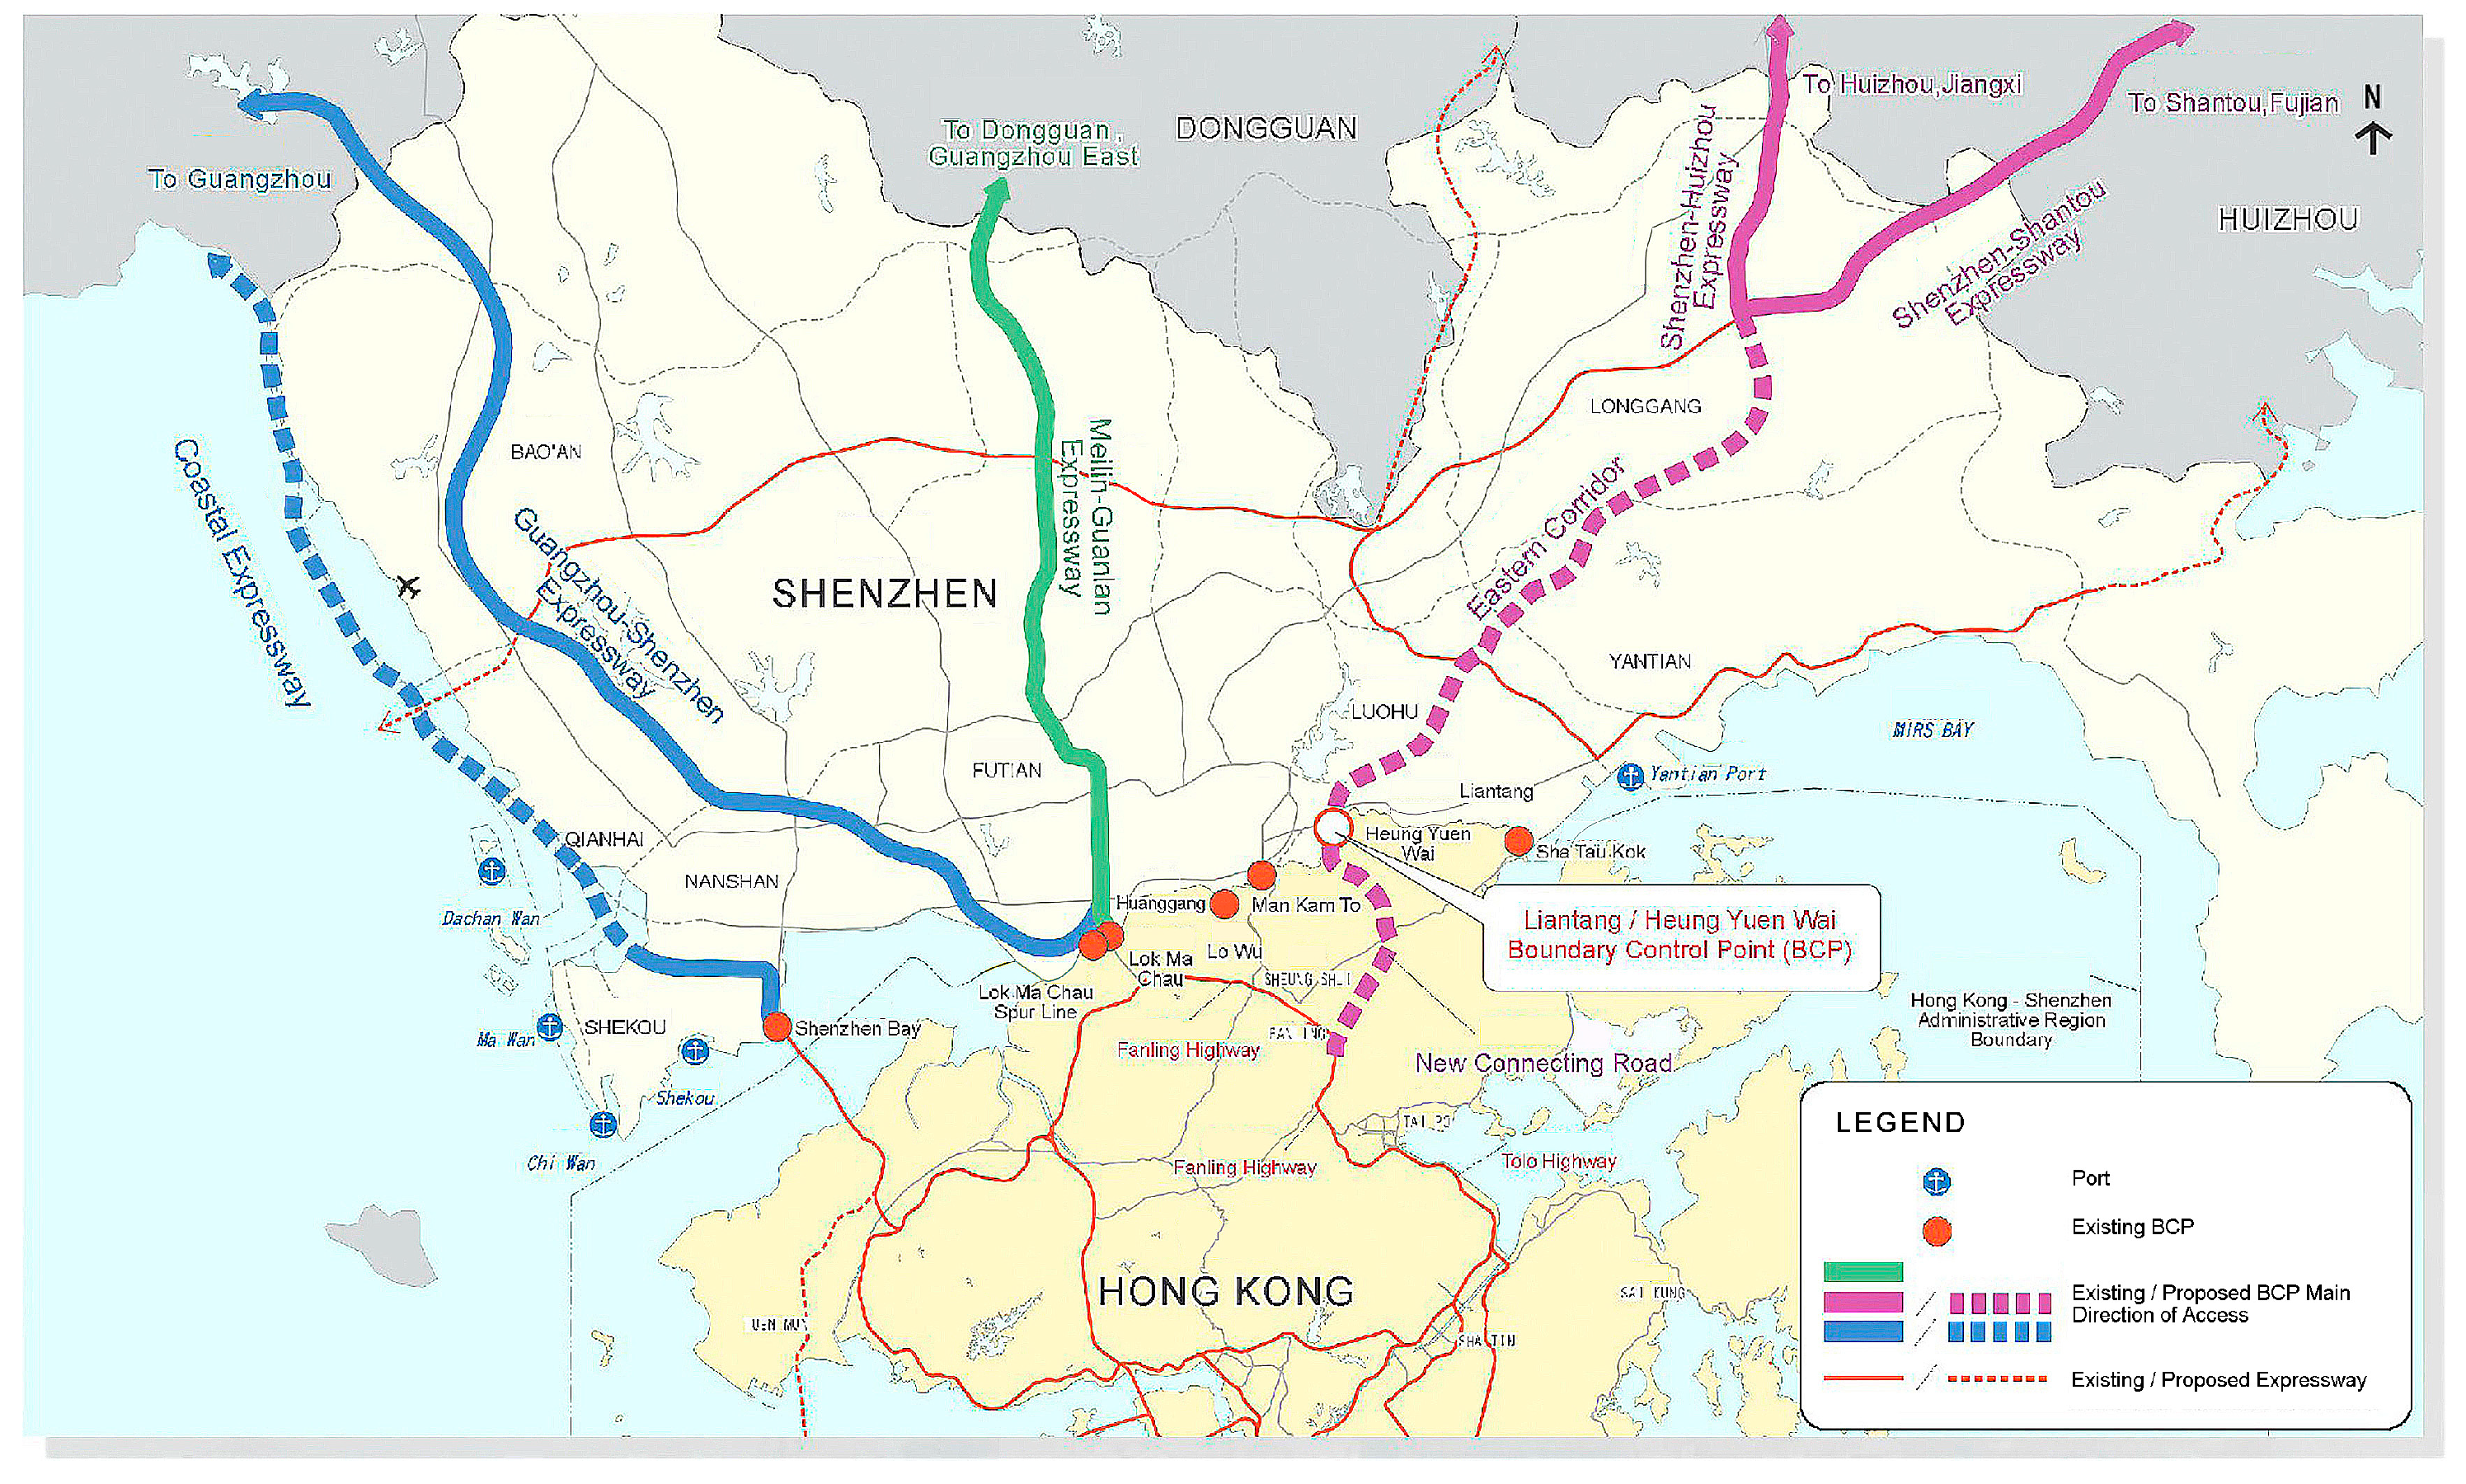
The Shenzhen Eastern Transit Expressway is a key project in Guangdong Province, and consists of a road starting from Luosha road, that connects to the Highway Network of Hong Kong through ports and ends at Huishan Expressway (Figure 1). The project is designed to be a two-way 8-lane road with a total length of 32.5 km and an investment of 5.792 billion yuan. The longest tunnel in the whole line is the Liantang tunnel, with a total length of 1435 m. The Liantang tunnel passes through low mountains and hills with relatively complete topography. The strata mainly consists of Carboniferous metamorphic sandstone and Jurassic rhyolite with well-developed rock fissures and weakened development in the depth direction.
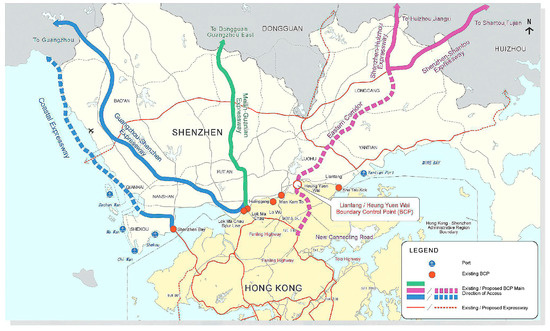
Figure 1.
Route planning of Shenzhen Eastern Transit Expressway.
At present, China mainly adopts the Basic Quality Index of Rock Mass ([BQ]) in the “Code for Engineering Rock Mass Quality Classification” [14], while rest of the countries have adopted the Q system. The [BQ] classification system considers that the classification of surrounding rock should be determined by two factors: rock hardness and rock integrity. The corresponding correlation is given by Equation (1):
where Rc—Uniaxial compressive strength of rocks; Kν—Integrity index of the rock mass. The Tunneling Quality Index (Q) system [15] was proposed by the Norwegian scholar Barton to estimate the surrounding rock pressure that can reflect the influence of multiple factors. The corresponding correlation is given by Equation (2):
where RQD—Rock quality index; Jn—Joint group coefficient; Jr—Joint roughness coefficient; Ja—Joint alteration value; Jw—Water cut reduction coefficient of joints; SRF—Initial stress reduction coefficient. The surrounding rock classification is based on the [BQ] value or the Q value. Table 3 [16] shows the simplified relationship between the two systems.
Table 3.
Relationship between the [BQ] system and the Q system.
In accordance with the principle that the friction angle of the equivalent of rock mass is equivalent to the deformation modulus, Xu [17] used the correlations of Rock Mass Rating (RMR) system and Q system proposed by Bieniawski [18], and proposed that the improved correlation for conversion between the [BQ] and the Q system (see Equation (3)):
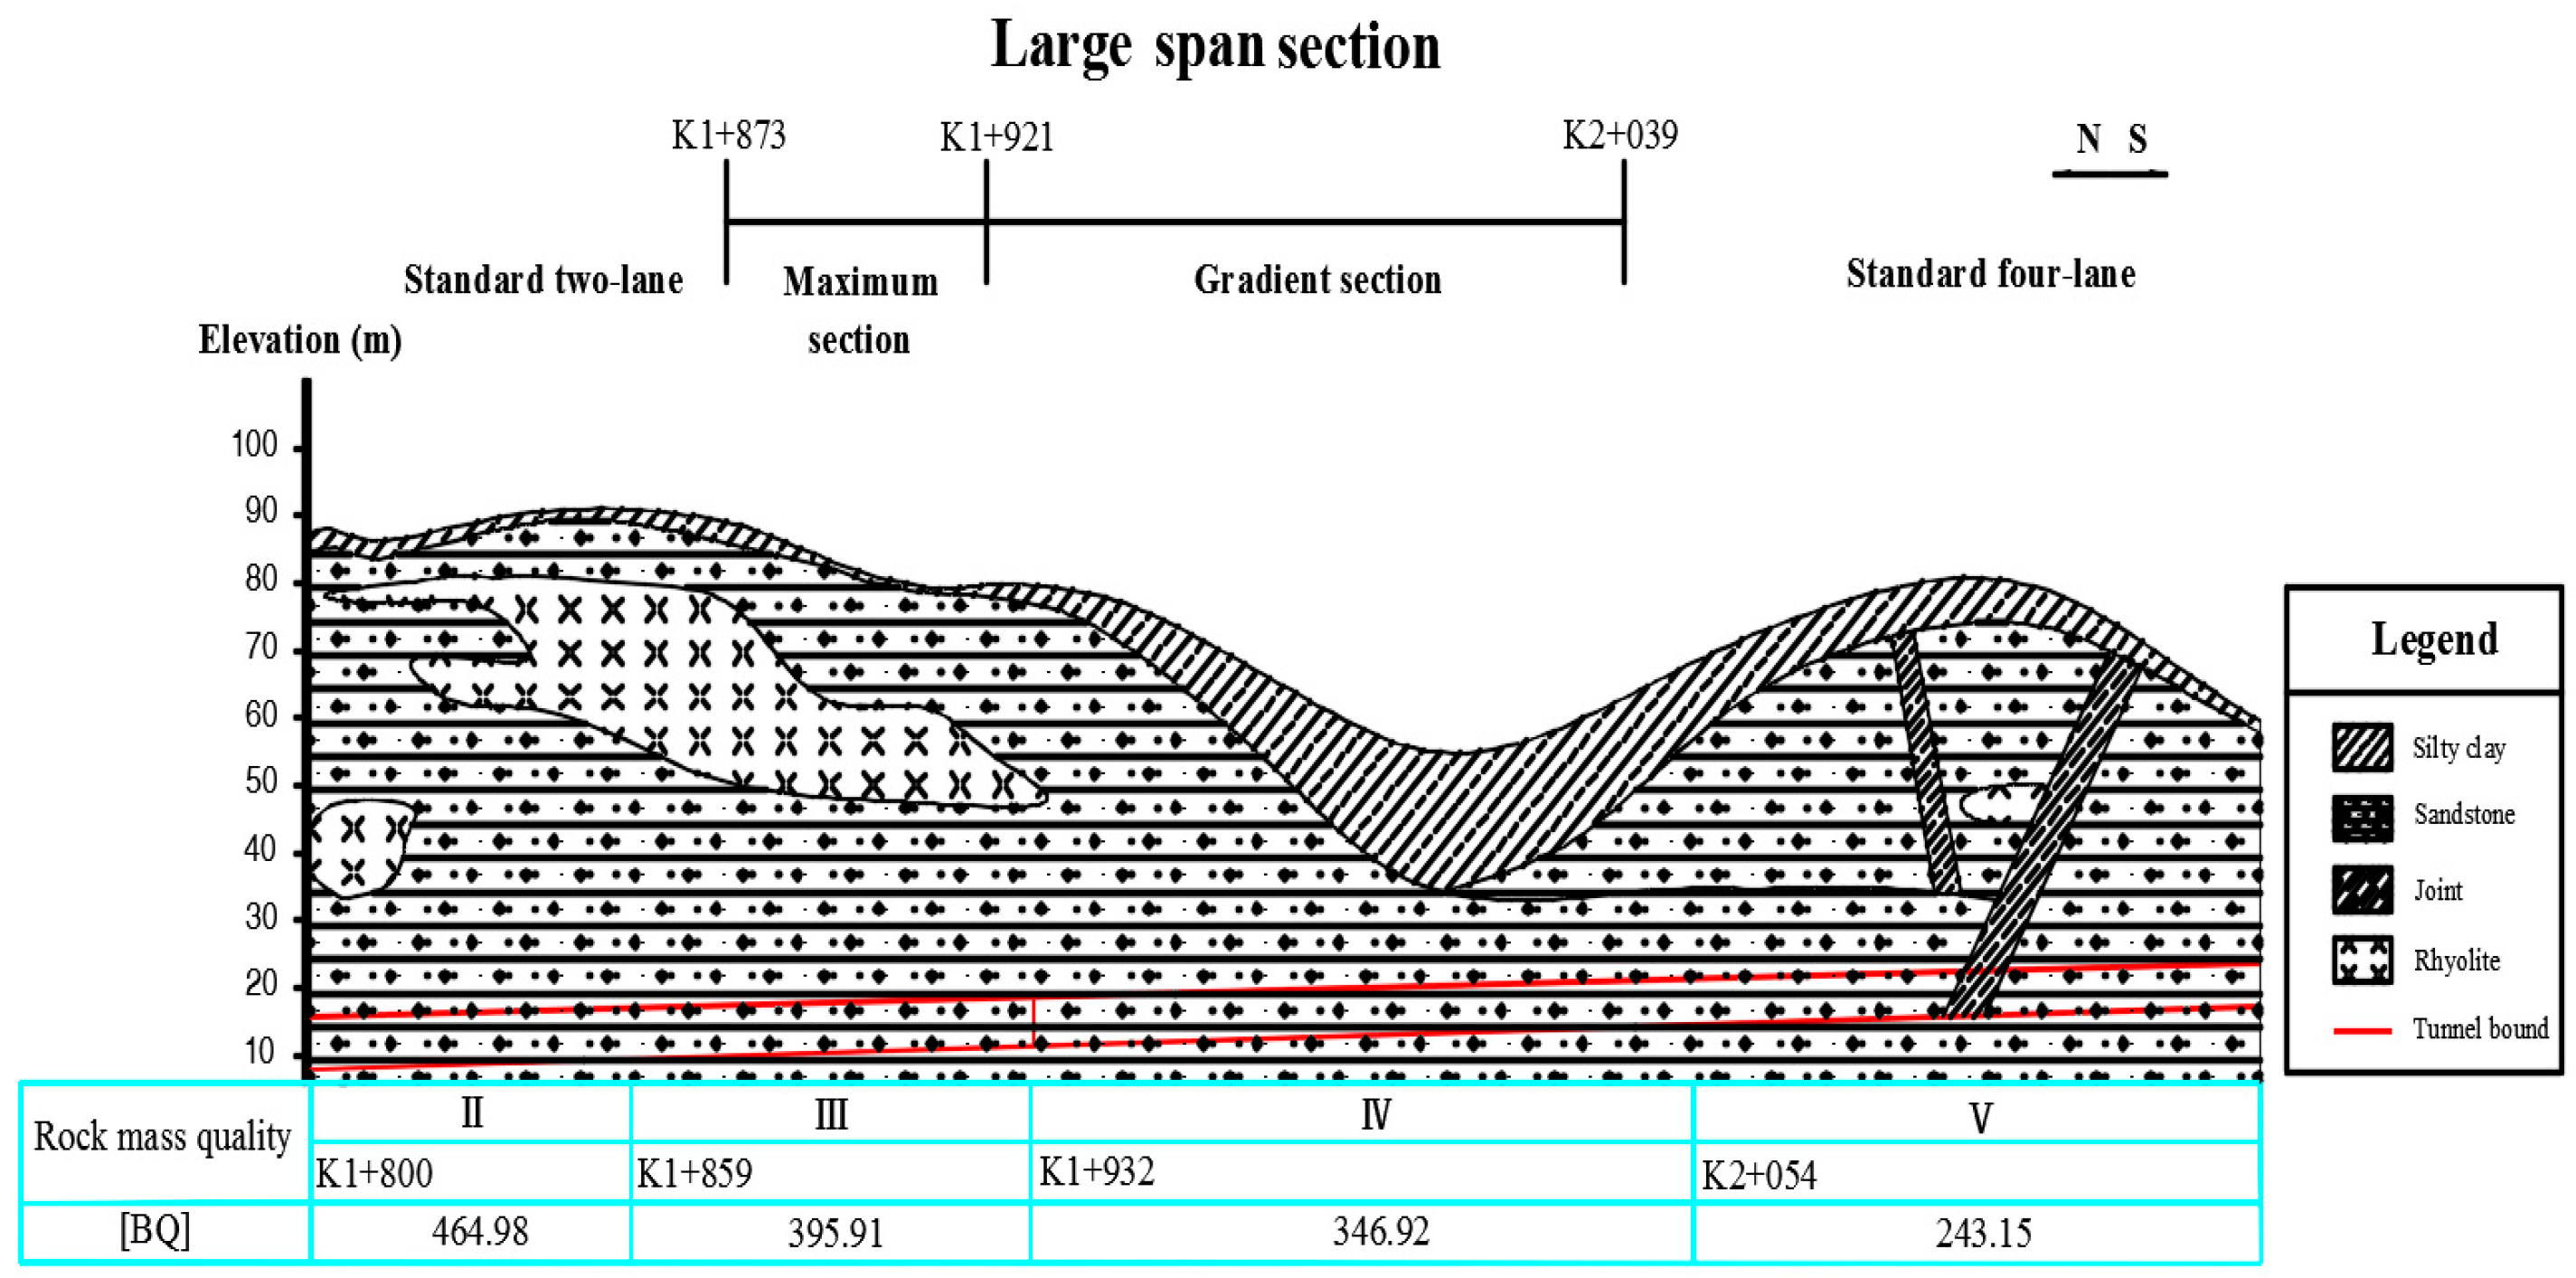
The tunnel consists of medium and slightly-weathered rocks, and the surrounding rock level is Class II–V, which have satisfactory stability. The entrance and exit mainly consist of strong-weathered rock with the V level of surrounding rock, which has a poor stability of excavation with high risk to collapse. Figure 2 shows some parts of the geological sections.
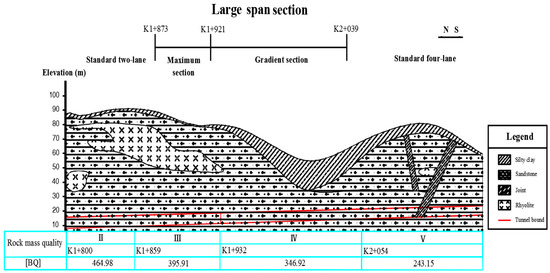
Figure 2.
Geologic section of Liantang tunnel.
Table 4 shows results of Liantang tunnel with [BQ] indicators converted to the values of corresponding Q system.
Table 4.
Index conversion for Liantang tunnel.
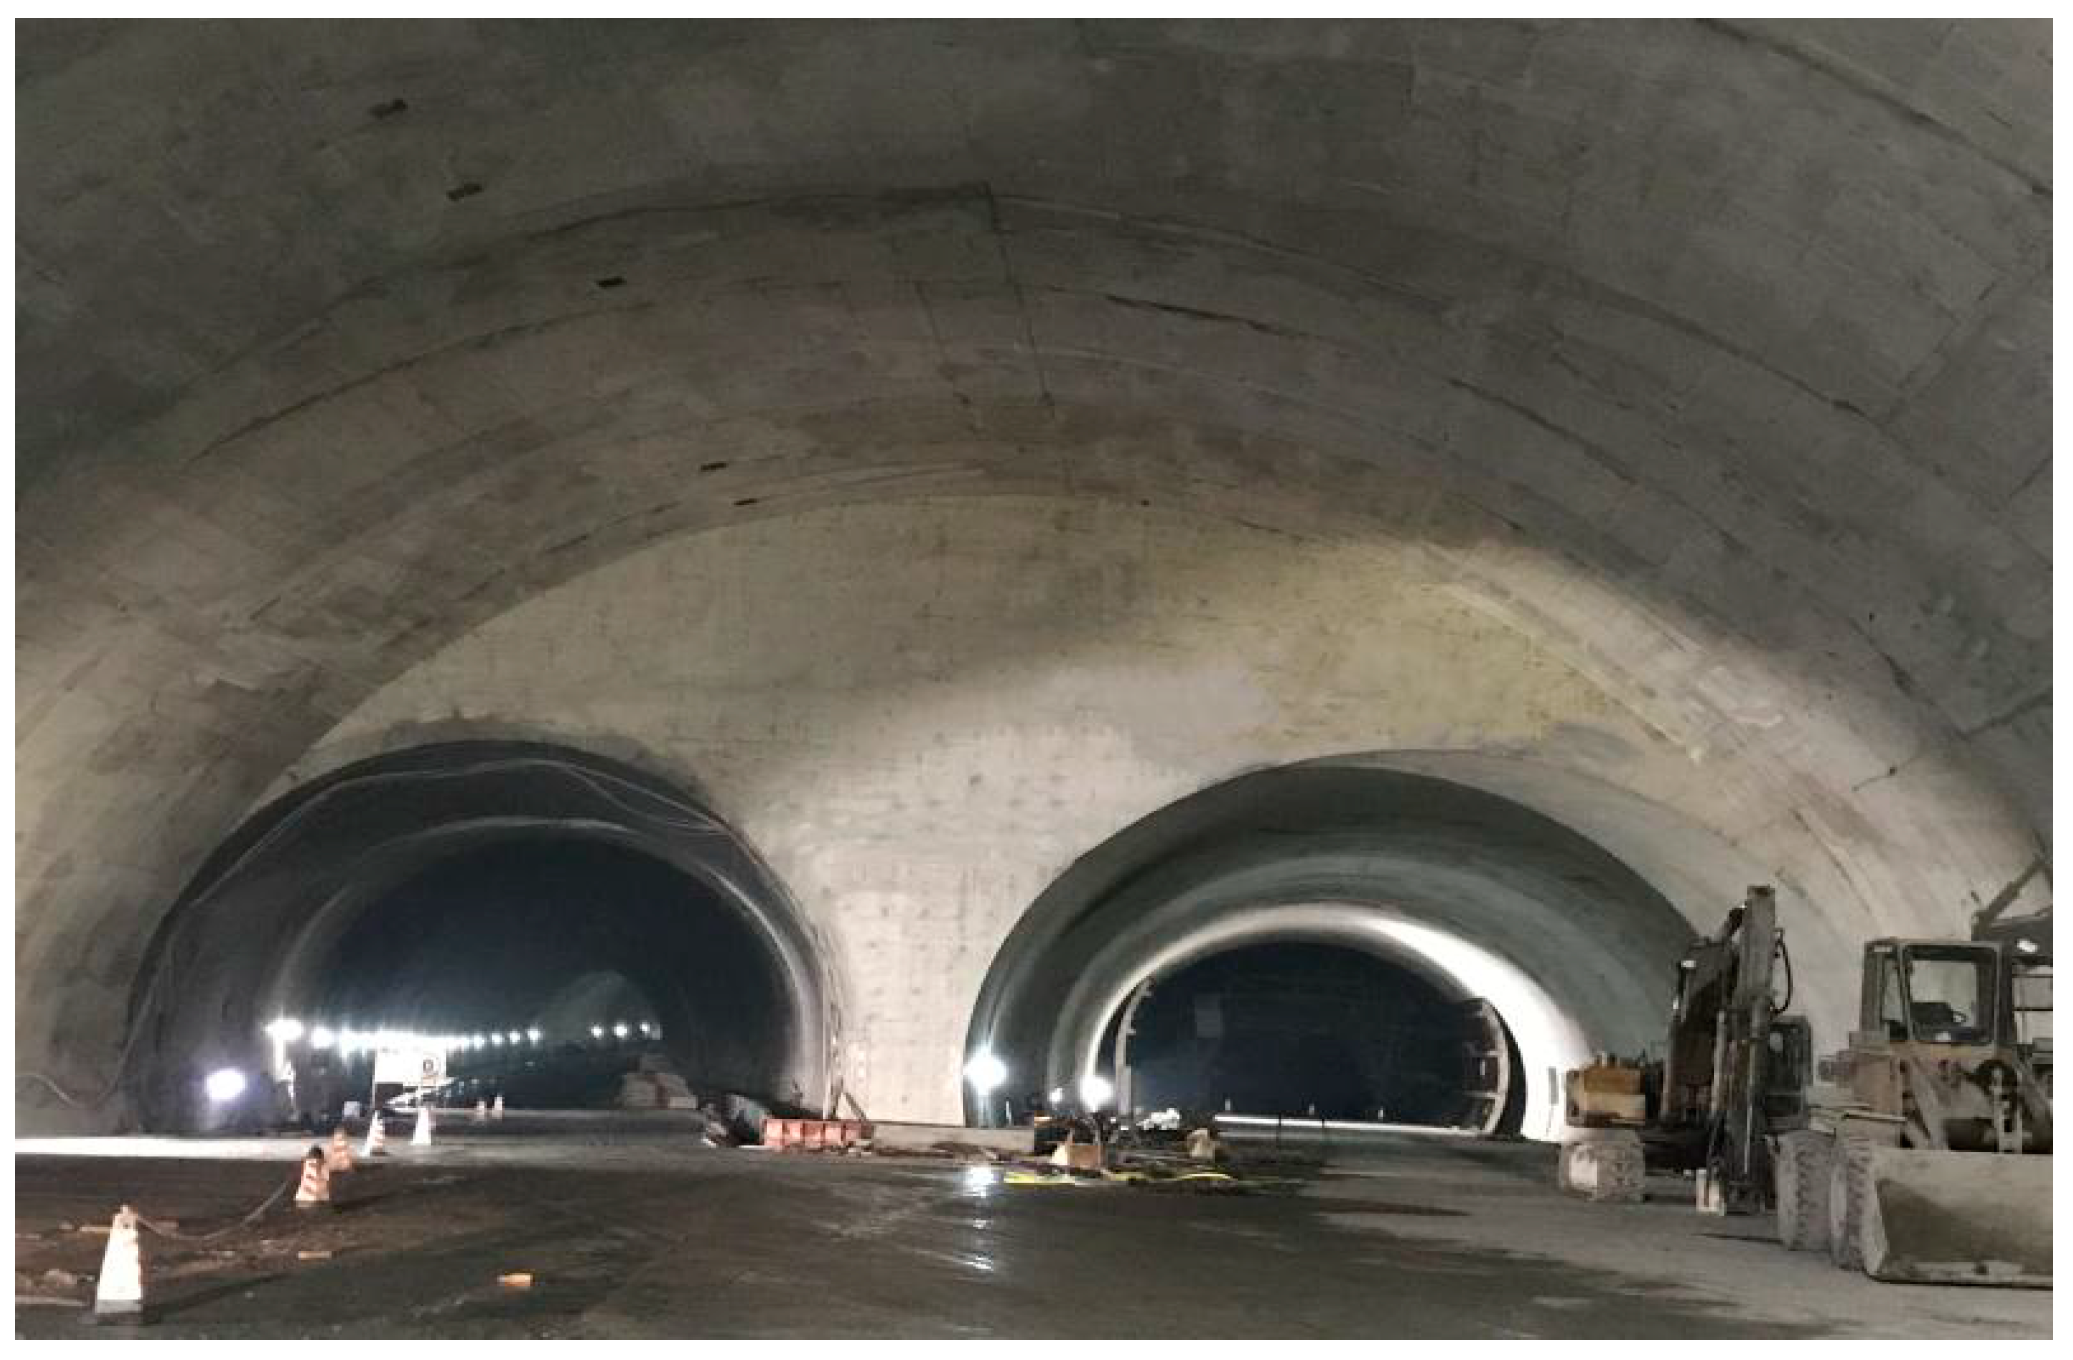
Large-span section of Liantang tunnel is located at the intersection of main line section and the municipal section at the entrance of tunnel. The section is at a depth of 70 m, while the maximum profile is 27.45 m × 16 m (width × height). Furthermore, the excavation section of unlined tunnel is 30.01 m ×18.4 m (width × height). The excavation volume is 428.5 m3/m. It is the largest highway tunnel in the world (Figure 3). Since this excavation span is very rare and there are only a few analogous projects, reasonable calculation of the surrounding rock pressure of the super-large section deep-buried underground structure becomes the key to the structural design and safe construction of the Liantang tunnel (China).
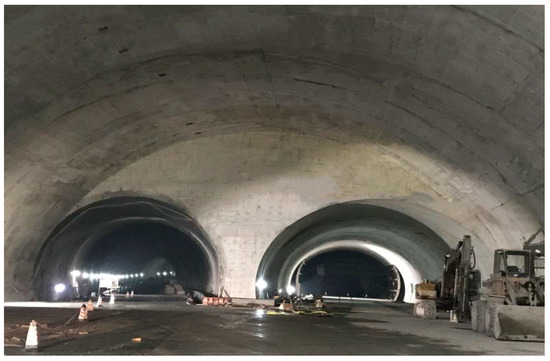
Figure 3.
Maximum section of the Liantang Tunnel.
3. Applicability Analysis of Various Traditional Methods of Calculating the Surrounding Rock Pressure for Super-Large Section Tunnel
At present, the most commonly used calculation methods for surrounding rock pressure are as follows:
- 1)
- Traditional theories: including Protodyakonov’s theory, Terzaghi theory, and the Caquot correlation.
- 2)
- Industry recommended standards: Code for Design of Railway Tunnel (TB10003-2016), Guidelines for Design of Highway Tunnel (JTG D70-2010) and Specification for design of hydraulic tunnel (DLT_5195-2004).
- 3)
- Surrounding rock pressure correlations based on rock mass classification system: including correlations based on the Q system proposed by Grimstad and Barton [15] and by Bhasin and Grimstad [19]. Geol [20] proposed a correlation based on rock mass number N, while Unal [21] proposed a correlation based on RMR classification system.
3.1. Comparison of the Common-Applied Calculation Methods for Surrounding Rock Pressure
The geometric size of each block in rock mass is very small compared to the whole stratum. Protodyakonov’s theory [22] assumes that the rock mass around the cavern can be regarded as a large bulk mass with no cohesion. Terzaghi theory [23] assumes that the rock mass is granular with a certain amount of cohesion. According to the statistical results for the loosening range of surrounding rock as reflected by the collapse data of 1046 tunnels presented in the Code for Design of Railway Tunnel of China [14], an empirical correlation for estimating the surrounding rock’s loosening pressure is obtained. The Caquot correlation [24] is based on a circular-sized cavern with the assumption that the plastic zone is separated from the elastic zone and that the surrounding rock pressure is the gravity of rock mass in the plastic zone. Grimstad and Barton [15] used statistical data for the surrounding rock pressure of hundreds of tunnels and put forward a correlation for surrounding rock pressure based on the Q system. Bhasin and Grimstad [19] improved the correlations proposed by the former. Geol put forward the concept of rock mass number N and proposed the correlation of surrounding rock pressure. Unal proposed a correlation for calculating the surrounding rock pressure based on the RMR and different spans. These correlations are summarized in Table 5.
Table 5.
Different correlations for calculating surrounding rock pressure.
Notation:
- γ—Rock mass bulk density; h1 = d1/f; d1 = 0.5d + htan(45°–0.5ϕ); d—Tunnel span; h—Tunnel height; ϕ—Internal friction; f—Rigidity coefficient.
- c—Cohesion; λ—Lateral pressure coefficient. The other parameters are the same as above.
- h* = h{0.45×2s−1×[1+i(B−5)]}; S—Surrounding rock grade; B—Tunnel span; i—Surrounding rock pressure change rate. The other parameters are the same as above.
- k1 and k2, calculation coefficients; r—Approximate radius. The other parameters are the same as above.
- ; RQD—Rock quality index; Jn—Joint group coefficient; Jr—Joint roughness coefficient; Ja—Joint alteration value; Jw—Water cut reduction coefficient of joints; SRF—Initial stress reduction coefficient. P1 is the same as P2 when Jn = 9, P1 is greater than P2 when Jn < 9 and P1 is less than P2 when Jn > 9.
- . α is a correction factor, usually 0.5~2.0. The other parameters are the same as above.
- The parameters are the same as in Correlation 5
- RMR76 is the hierarchical value of the RMR system.
3.2. Analysis of Different Surrounding Rock Pressure Calculation Methods for the Large-Span Section of the Liantang Tunnel
According to the core obtained by drilling the large span central mileage K1 + 895, the surrounding rock of the large-span section consists of slightly weathered blue-grey sandstone with developed joints and fissures. Furthermore, the rock mass is fragmented, showing a fragmented mosaic structure. The parameters required for calculating the surrounding rock pressure using different correlations can be obtained through the results of laboratory experiments and the geological survey reports. Table 6 shows these calculation parameters.
Table 6.
Calculation parameters.
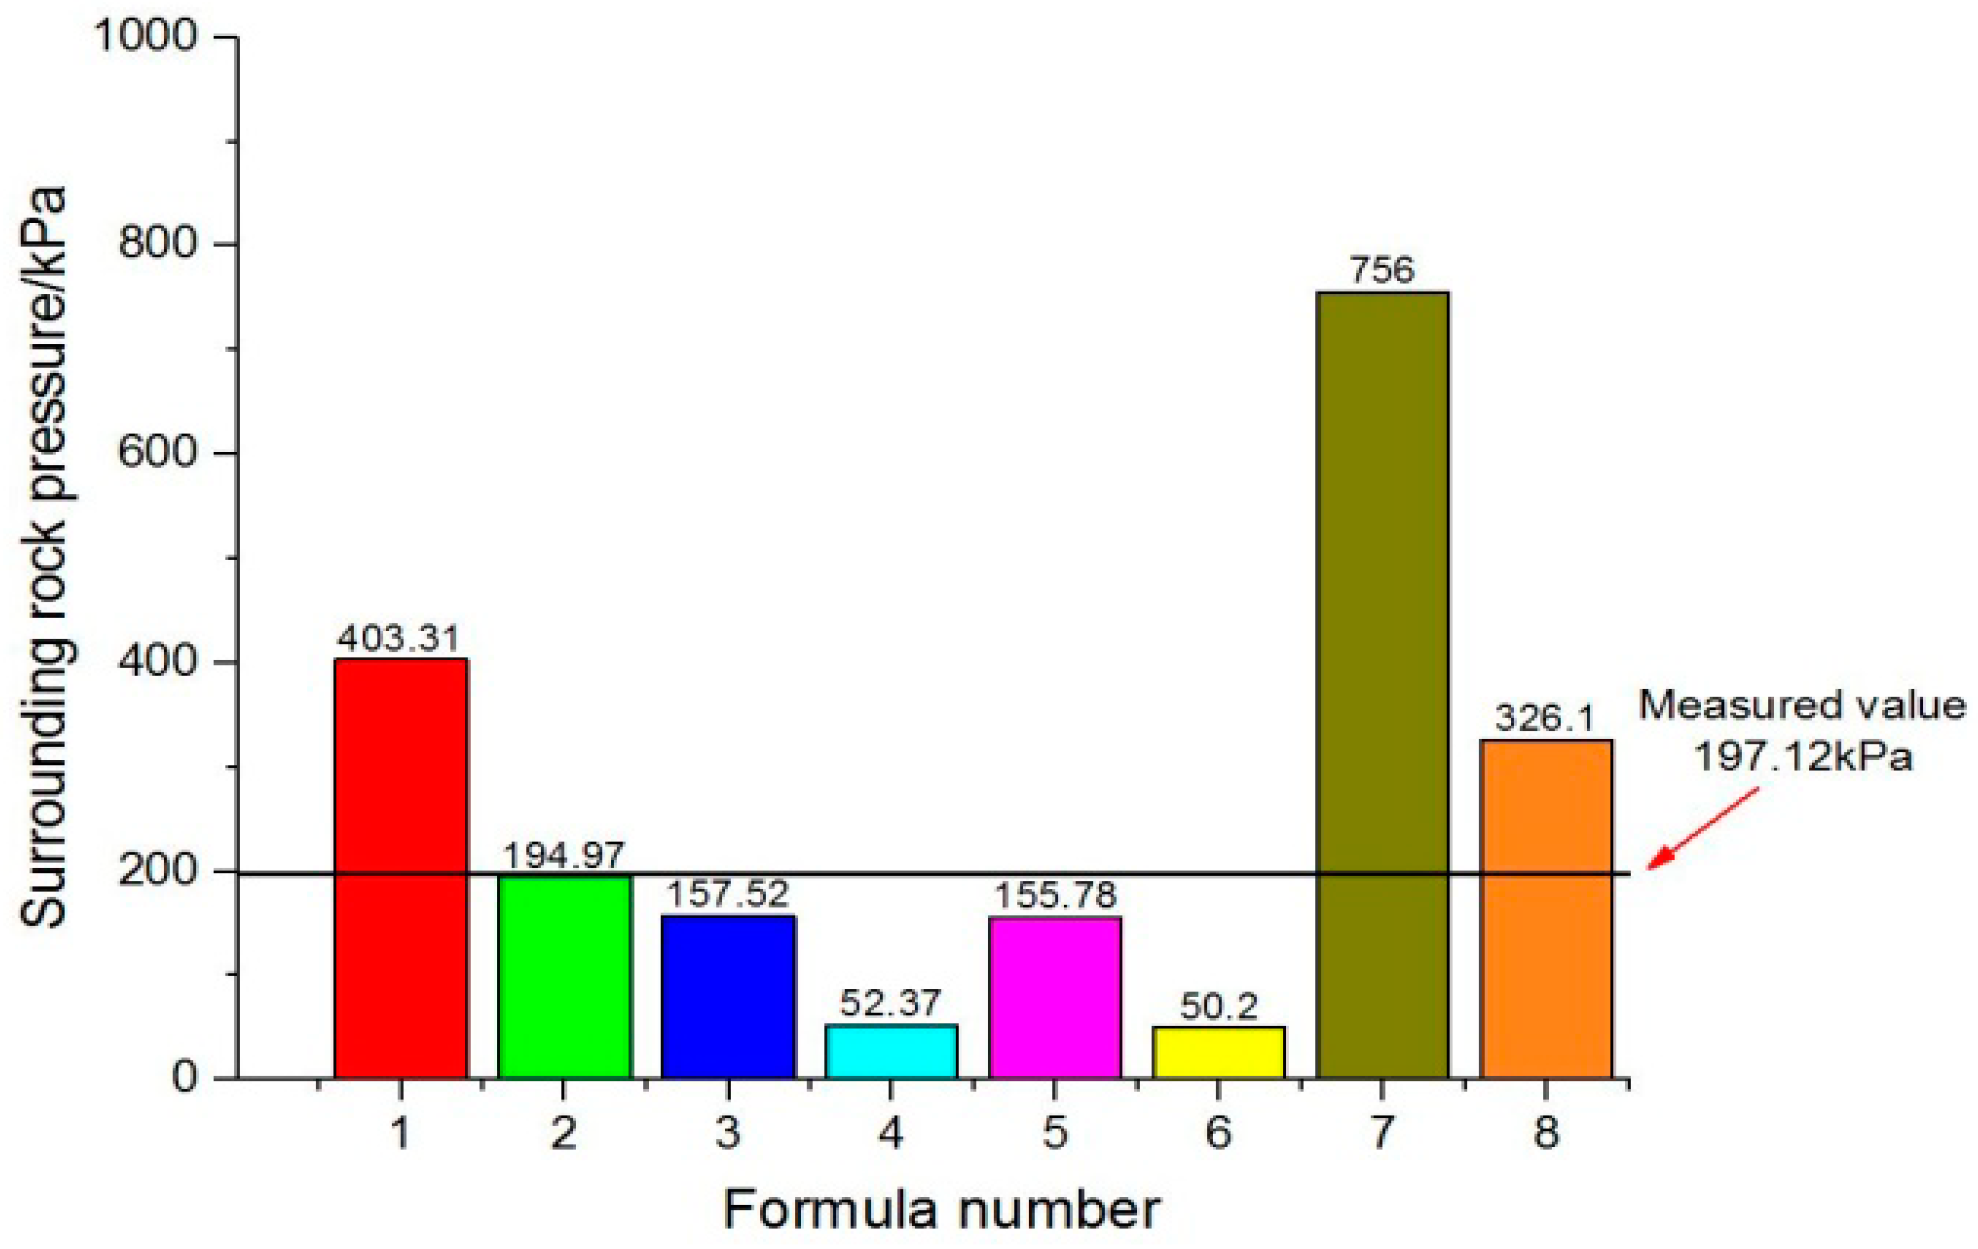
Table 7 shows the calculation results of the surrounding rock pressure of the large-span section of Liantang tunnel based on the parameters provided in Table 6. Figure 4 shows the comparison between the calculated results and measured values.
Table 7.
Calculation results.

Figure 4.
Comparisons between the measured values and the calculated values using different correlations.
3.3. Influence of Span on the Calculation Methods of Surrounding Rock Pressure
In order to better analyze the effect of span term on different surrounding rock pressure correlations, the geological conditions of Liantang tunnel were used and height-to-span ratio was kept the same as that of single arch and large span (0.6).
As can be seen from Figure 5, the pressure curves of surrounding rock turn to diverge from dense overlap with the increase in span. This indicates that, when the span exceeds a certain value, some of the correlations are no longer applicable. The curves of Correlations 1, 2, 3, 4, 7 and 8 increase in a linear way. The curve from Correlation 6 increases nonlinearly, however the rate of increase decreases gradually. The curve from Correlation 5 does not change with the increase in span, which was due to the introduction of N parameter. Braton believes that the pressure of surrounding rock is only related to the quality of surrounding rock, and not to the span.
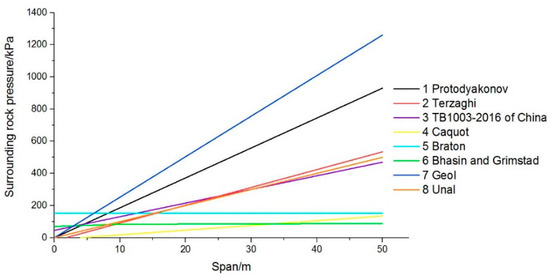
Figure 5.
Results of the surrounding rock pressure under different spans.
4. Study on Surrounding Rock Pressure under Different Spans and Different Q Values
According to the comparison of different correlations for calculating the pressure of surrounding rock, there are two main factors affecting the pressure of surrounding rock. One is the geological condition, while the other is the span of excavation structure. Based on these two factors, a single-arch deep-buried large-span structural model with different Q values and spans is established to simulate the variation of surrounding rock pressure.
4.1. Numerical Model
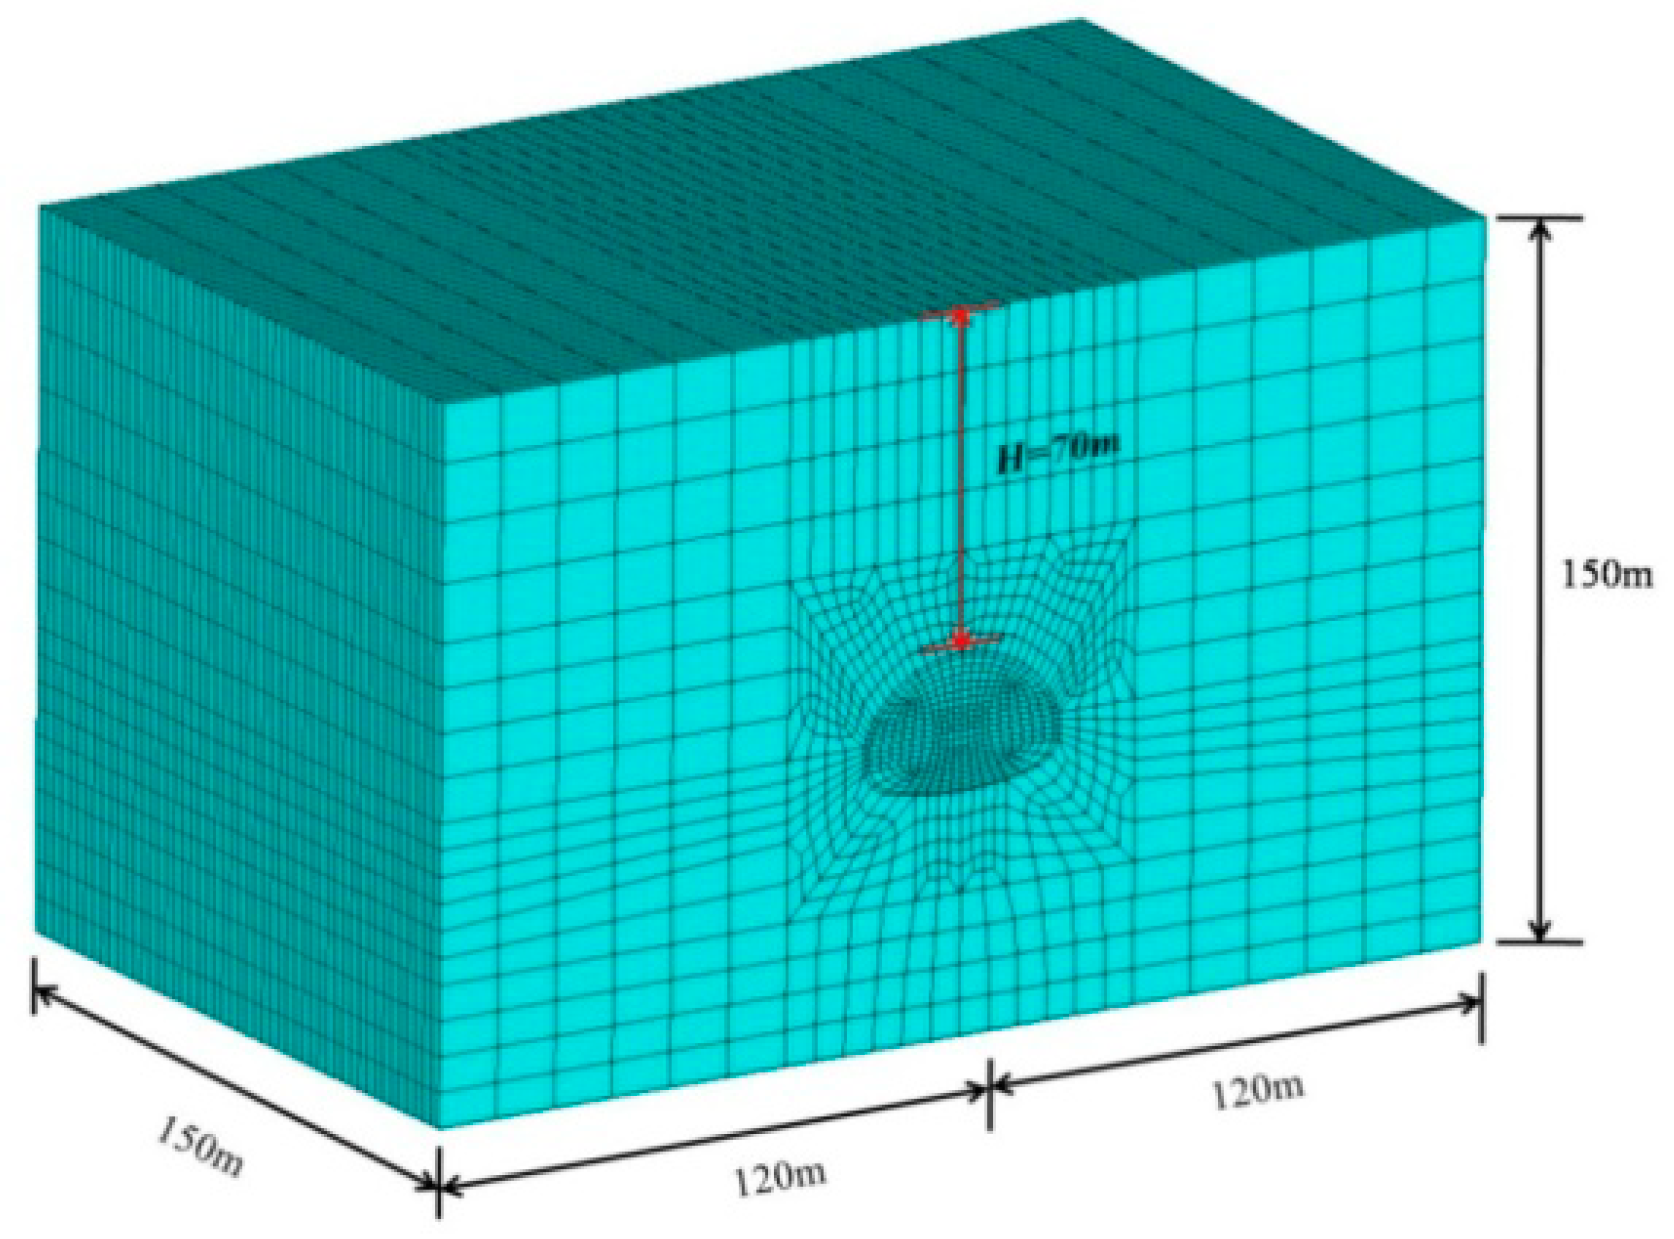
According to geological exploration reports, in the tunnel crossing area, located in a low mountain foothill area, the tectonic stress is not obvious, and the in-situ stress is mainly gravity stress. The three-dimensional finite element model of Liantang tunnel’s large-span section was established using the ANSYS software. The model in Figure 6 is symmetrical in structure.

Figure 6.
Three-dimensional numerical model.
The boundary conditions of the model are that the left and right boundaries are constrained horizontally in corresponding directions, the lower boundary is constrained vertically, and the upper one a free surface boundary. The overburden depth H is the vertical distance from the ground to the top of tunnel. The solid elements are used to simulate the surrounding rock and the lining. The total number of elements used for the mesh is 109,400. Some simplifications and assumptions are made as follows: (1) the surrounding rock mass is considered as a homogeneous and elastic-plastic continuum following the Mohr-Coulomb failure criterion and the associated flow rule; (2) the initial in-situ stress is uniformly distributed within the computational domain.
4.2. Selection of Parameters and Calculation Conditions
Based on the geological longitudinal section of the Liantang tunnel and the classification table of the Q system, the Q values are set to be 0.86, 2.02, 5.92 and 19.97 to represent four different geological conditions. Higher the Q value, better are the geological conditions. Other calculation parameters corresponding to different Q values are obtained through geological exploration reports and field tests. Table 8 shows the specific results.
Table 8.
Calculation parameters for the rock mass.
The span ranges from 5 to 45 m, with a total of nine spans. This means that a numerical model is established for each span plus 5 m. The models adopt the single-arch and large-span form of Liantang tunnel with a depth of 70 m and a height-to-span ratio of 0.6. The excavation methods are selected based on the geological conditions and the size of excavation section. The detailed selection method is presented in Table 9 and model diagrams of the excavation method are shown in Figure 7.
Table 9.
The selection of the excavation method.
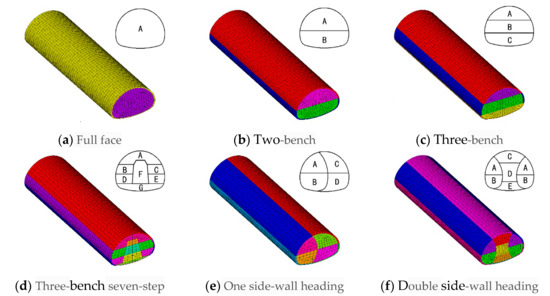
Figure 7.
Numerical models for the excavation methods.
4.3. Analysis of the Calculated Results
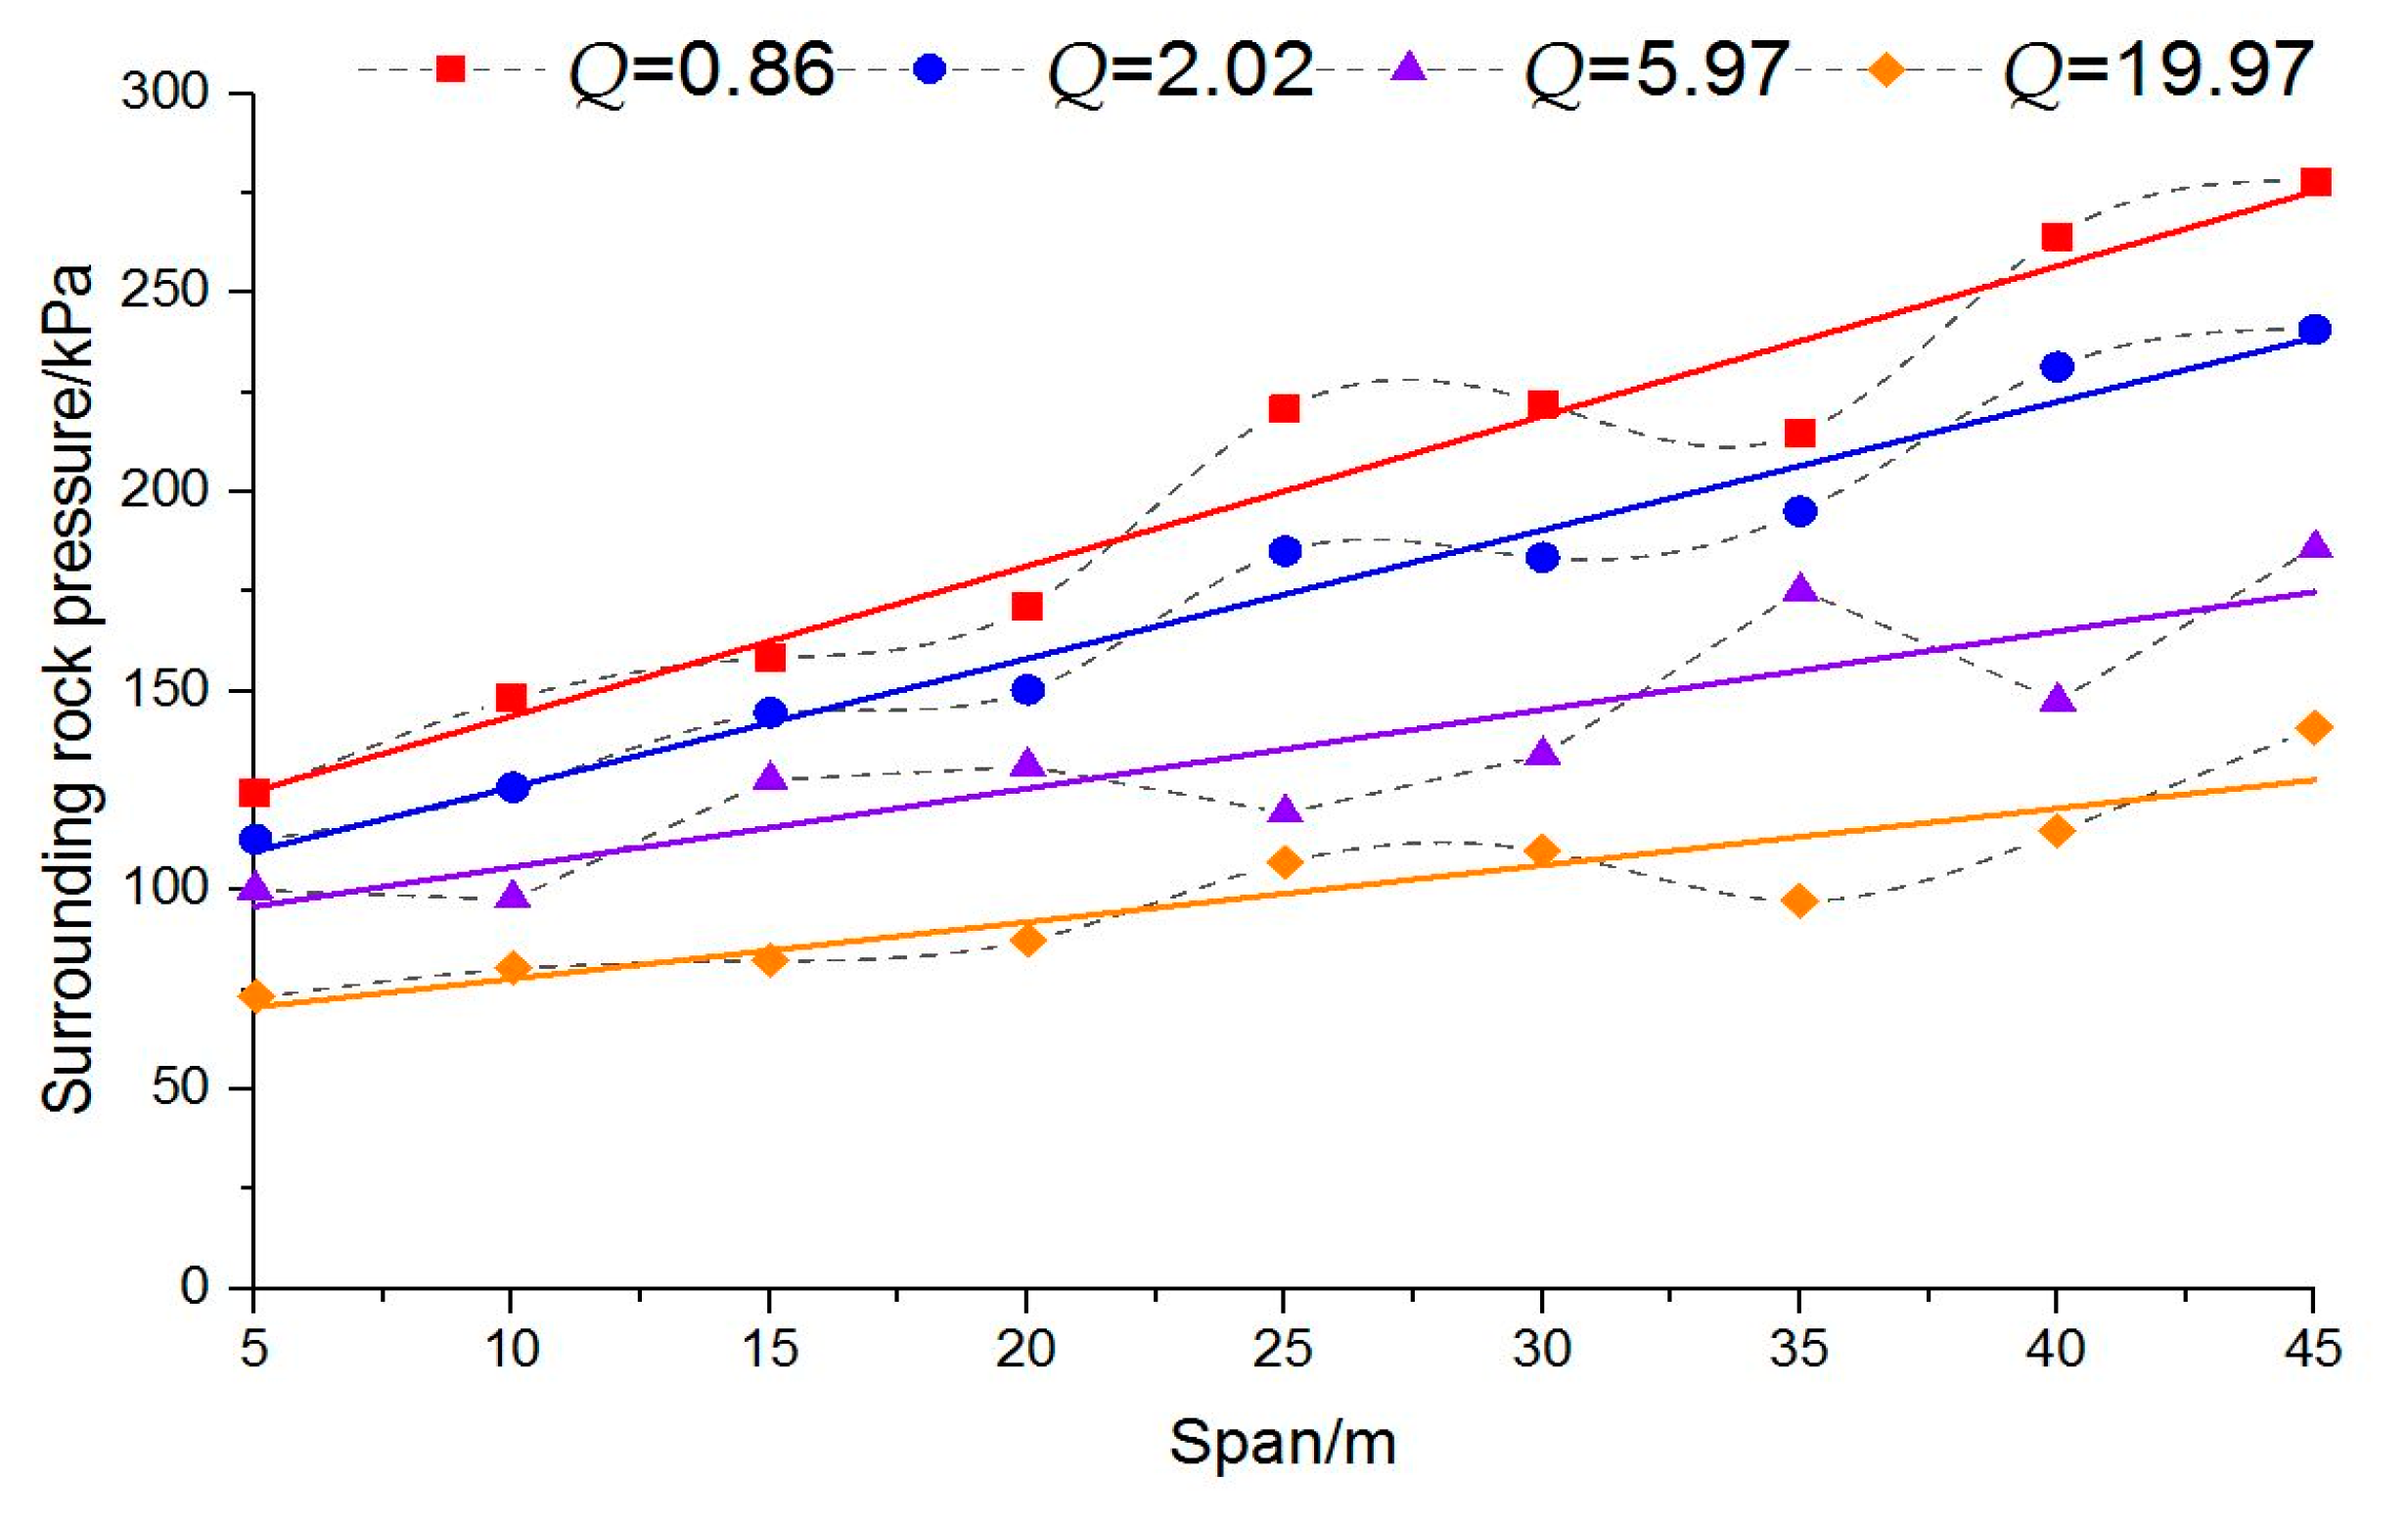
After the excavation process of each model is completed, the surrounding rock pressure at the vault of the section at the longitudinal depth of 10 m is selected as the research object. The results are shown in Figure 8.

Figure 8.
Relationship between the surrounding rock pressure and the span under different Q values.
The results presented in Table 10 show that the changes in surrounding rock pressure hold the following characteristics:
Table 10.
Fitted equations and the correlation coefficients.
- 1)
- Under the same span, the surrounding rock pressure decreases with the increase in Q value.
- 2)
- Under the same Q value, the pressure increases with the increase in tunnel span. However, as the Q value increases, the increase in pressure gradually decreases.
The distribution of surrounding rock pressure varies with span for the same Q value. Furthermore, the corresponding correlation is presented in Table 10.
5. Estimation of the Surrounding Rock Pressure Based on Q System and Span
Figure 5 shows that when the tunnel span is larger than the conventional tunnel diameter, there is a big difference between the calculated results of Protodyakonov’s theory, Terzaghi theory, Code for Design of Railway Tunnel of China and Unal and the actual situation. When the buried depth of cavern exceeds a certain range, the calculated results of the surrounding rock pressure correlation, proposed by Bhasin, will not be reasonable. When the radius of cavern becomes smaller, the calculated results of the Caquot correlation will produce tensile stress, which does not accord with engineering practice. The results of Barton’s correlation are always within the proper limits though it does not change with the change in span. Therefore, on the basis of the correlation, the estimation correlation of surrounding rock pressure of large-span deep-buried underground structure based on Q system would be obtained by combining the numerical analysis and introducing the span-correction method.
5.1. Establishment of the Estimation Correlation
(1) The correlation for surrounding rock pressure based on Q system
The correlations for calculating the surrounding rock pressure based on Q system consist of empirical correlations proposed by Barton on the basis of statistical analysis of different engineering practices:
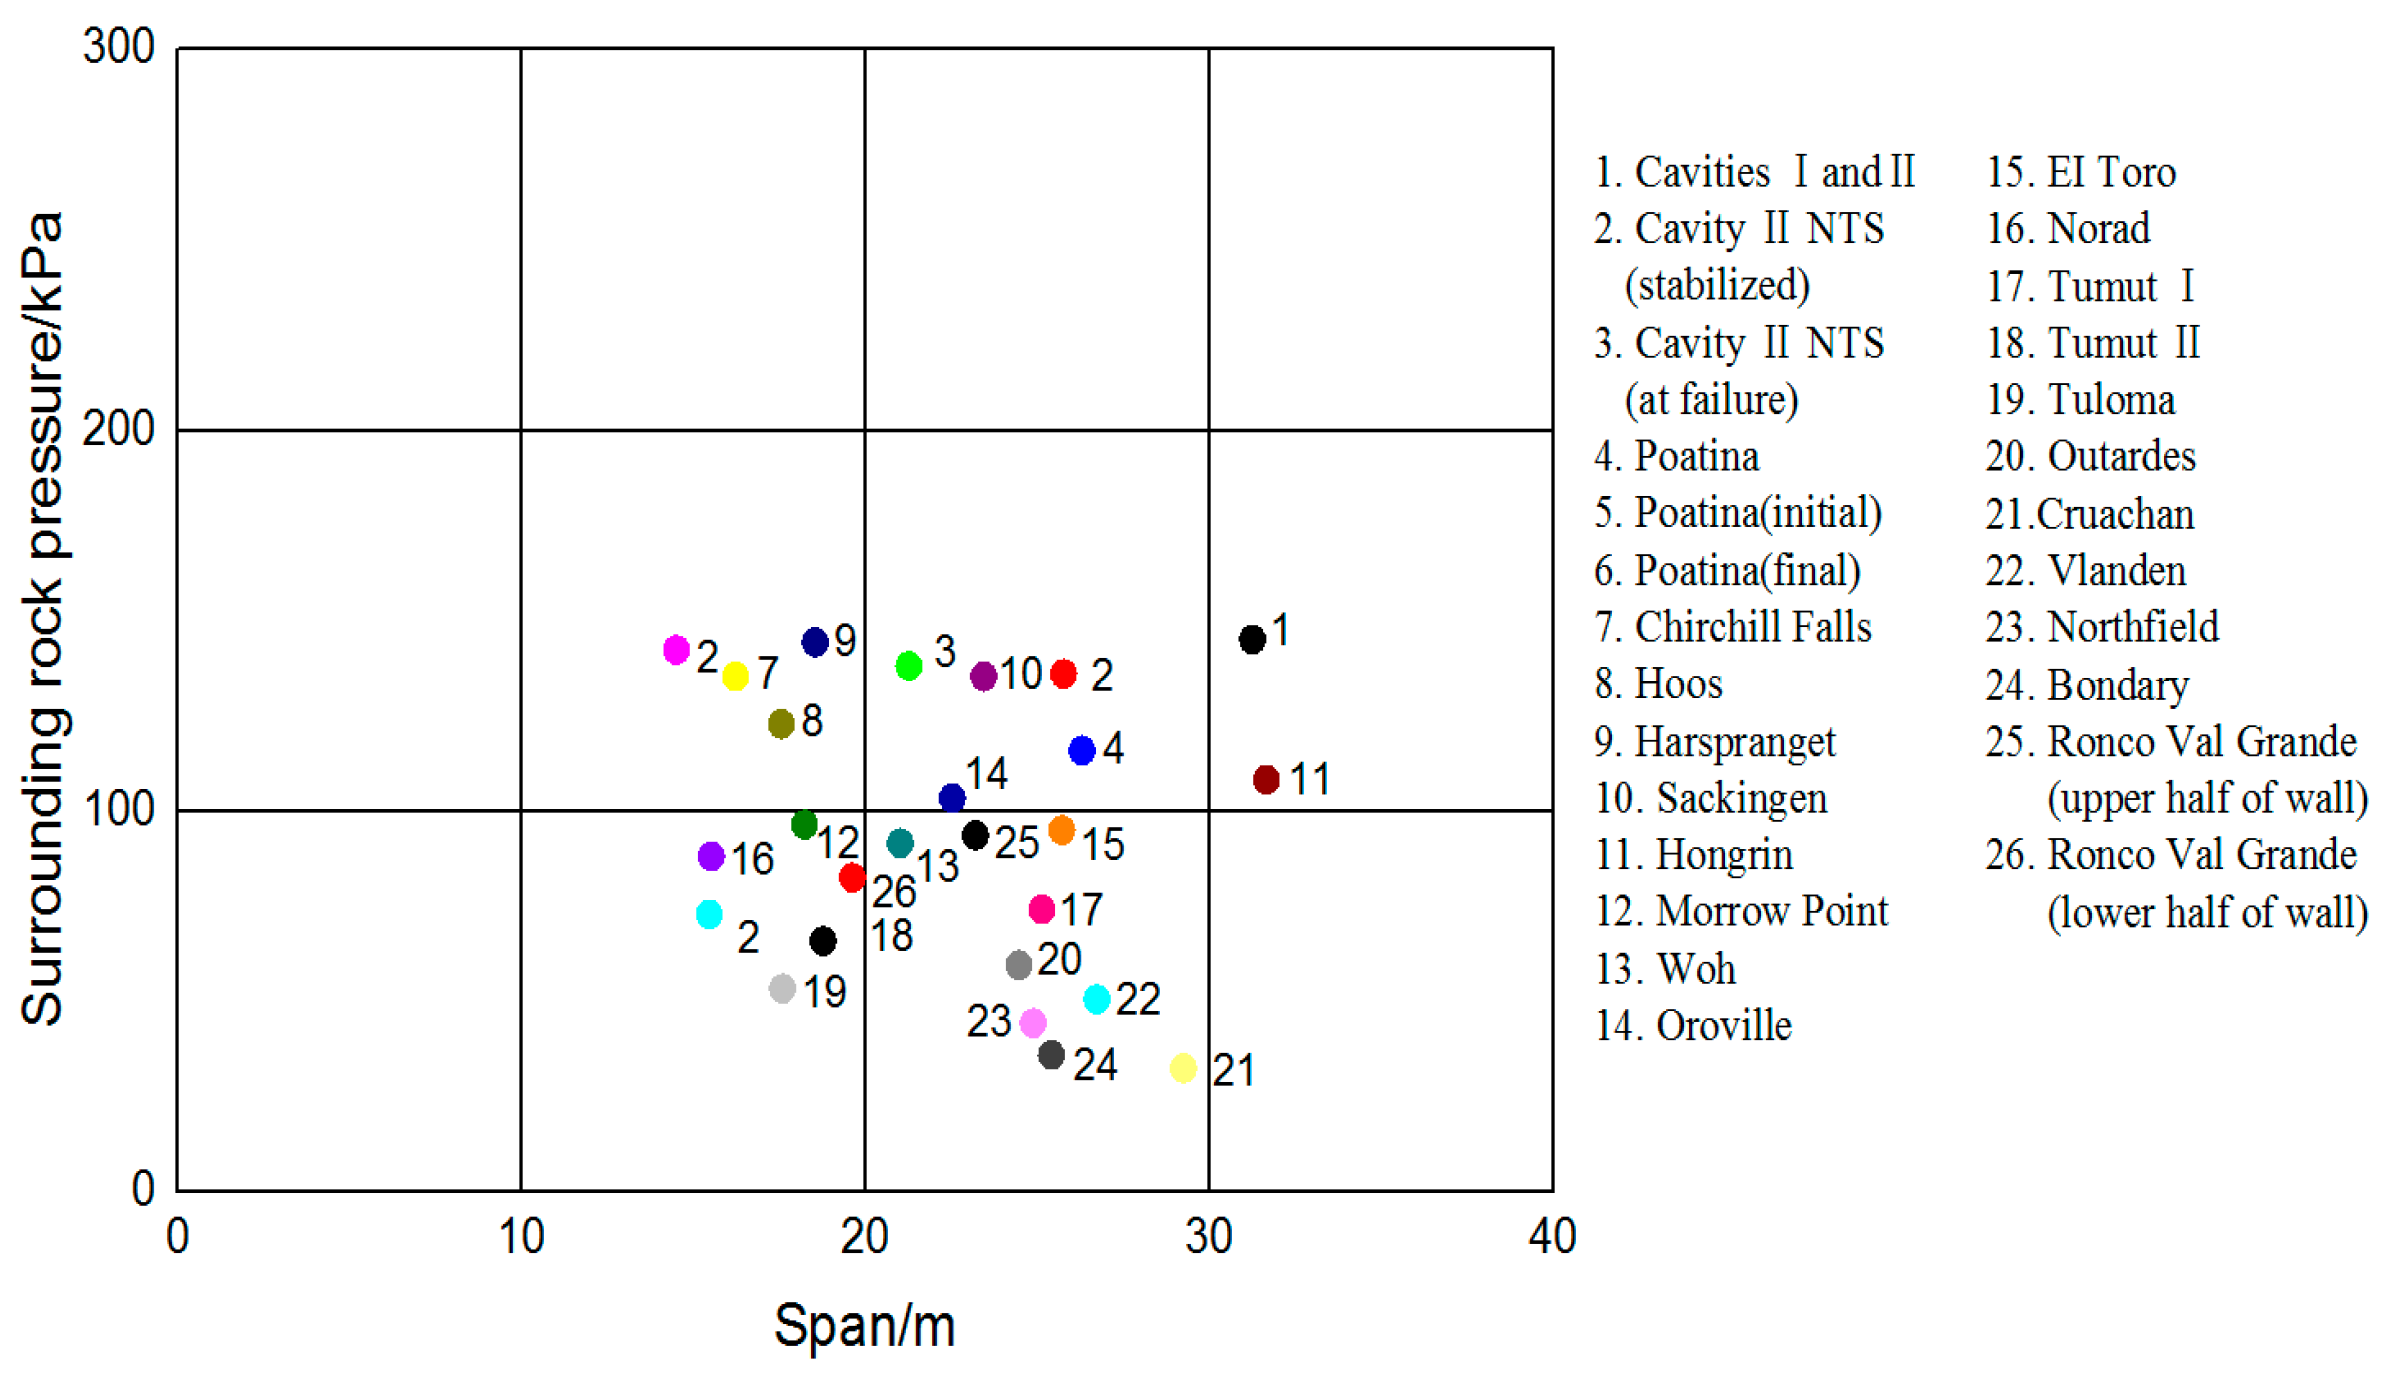
The units of the correlation is kPa and each parameter is shown in Notation 4. Screening the engineering cases selected by Barton [15], the statistical results of surrounding rock pressure of underground structures with span greater than 10 m are shown in Figure 9.
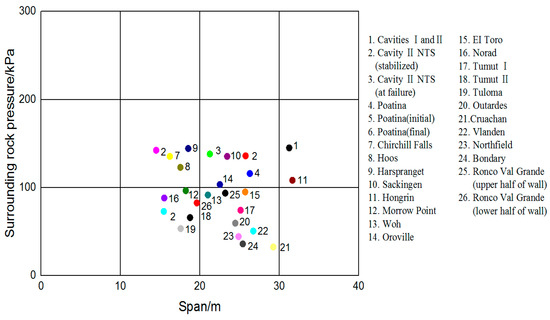
Figure 9.
Statistics of the relationship between the surrounding rock pressure and span.
It can be seen from Figure 9 that the span corresponding to the statistical surrounding rock pressure is concentrated in a certain region. The statistical analysis for the item of span is conducted to determine this region more accurately.
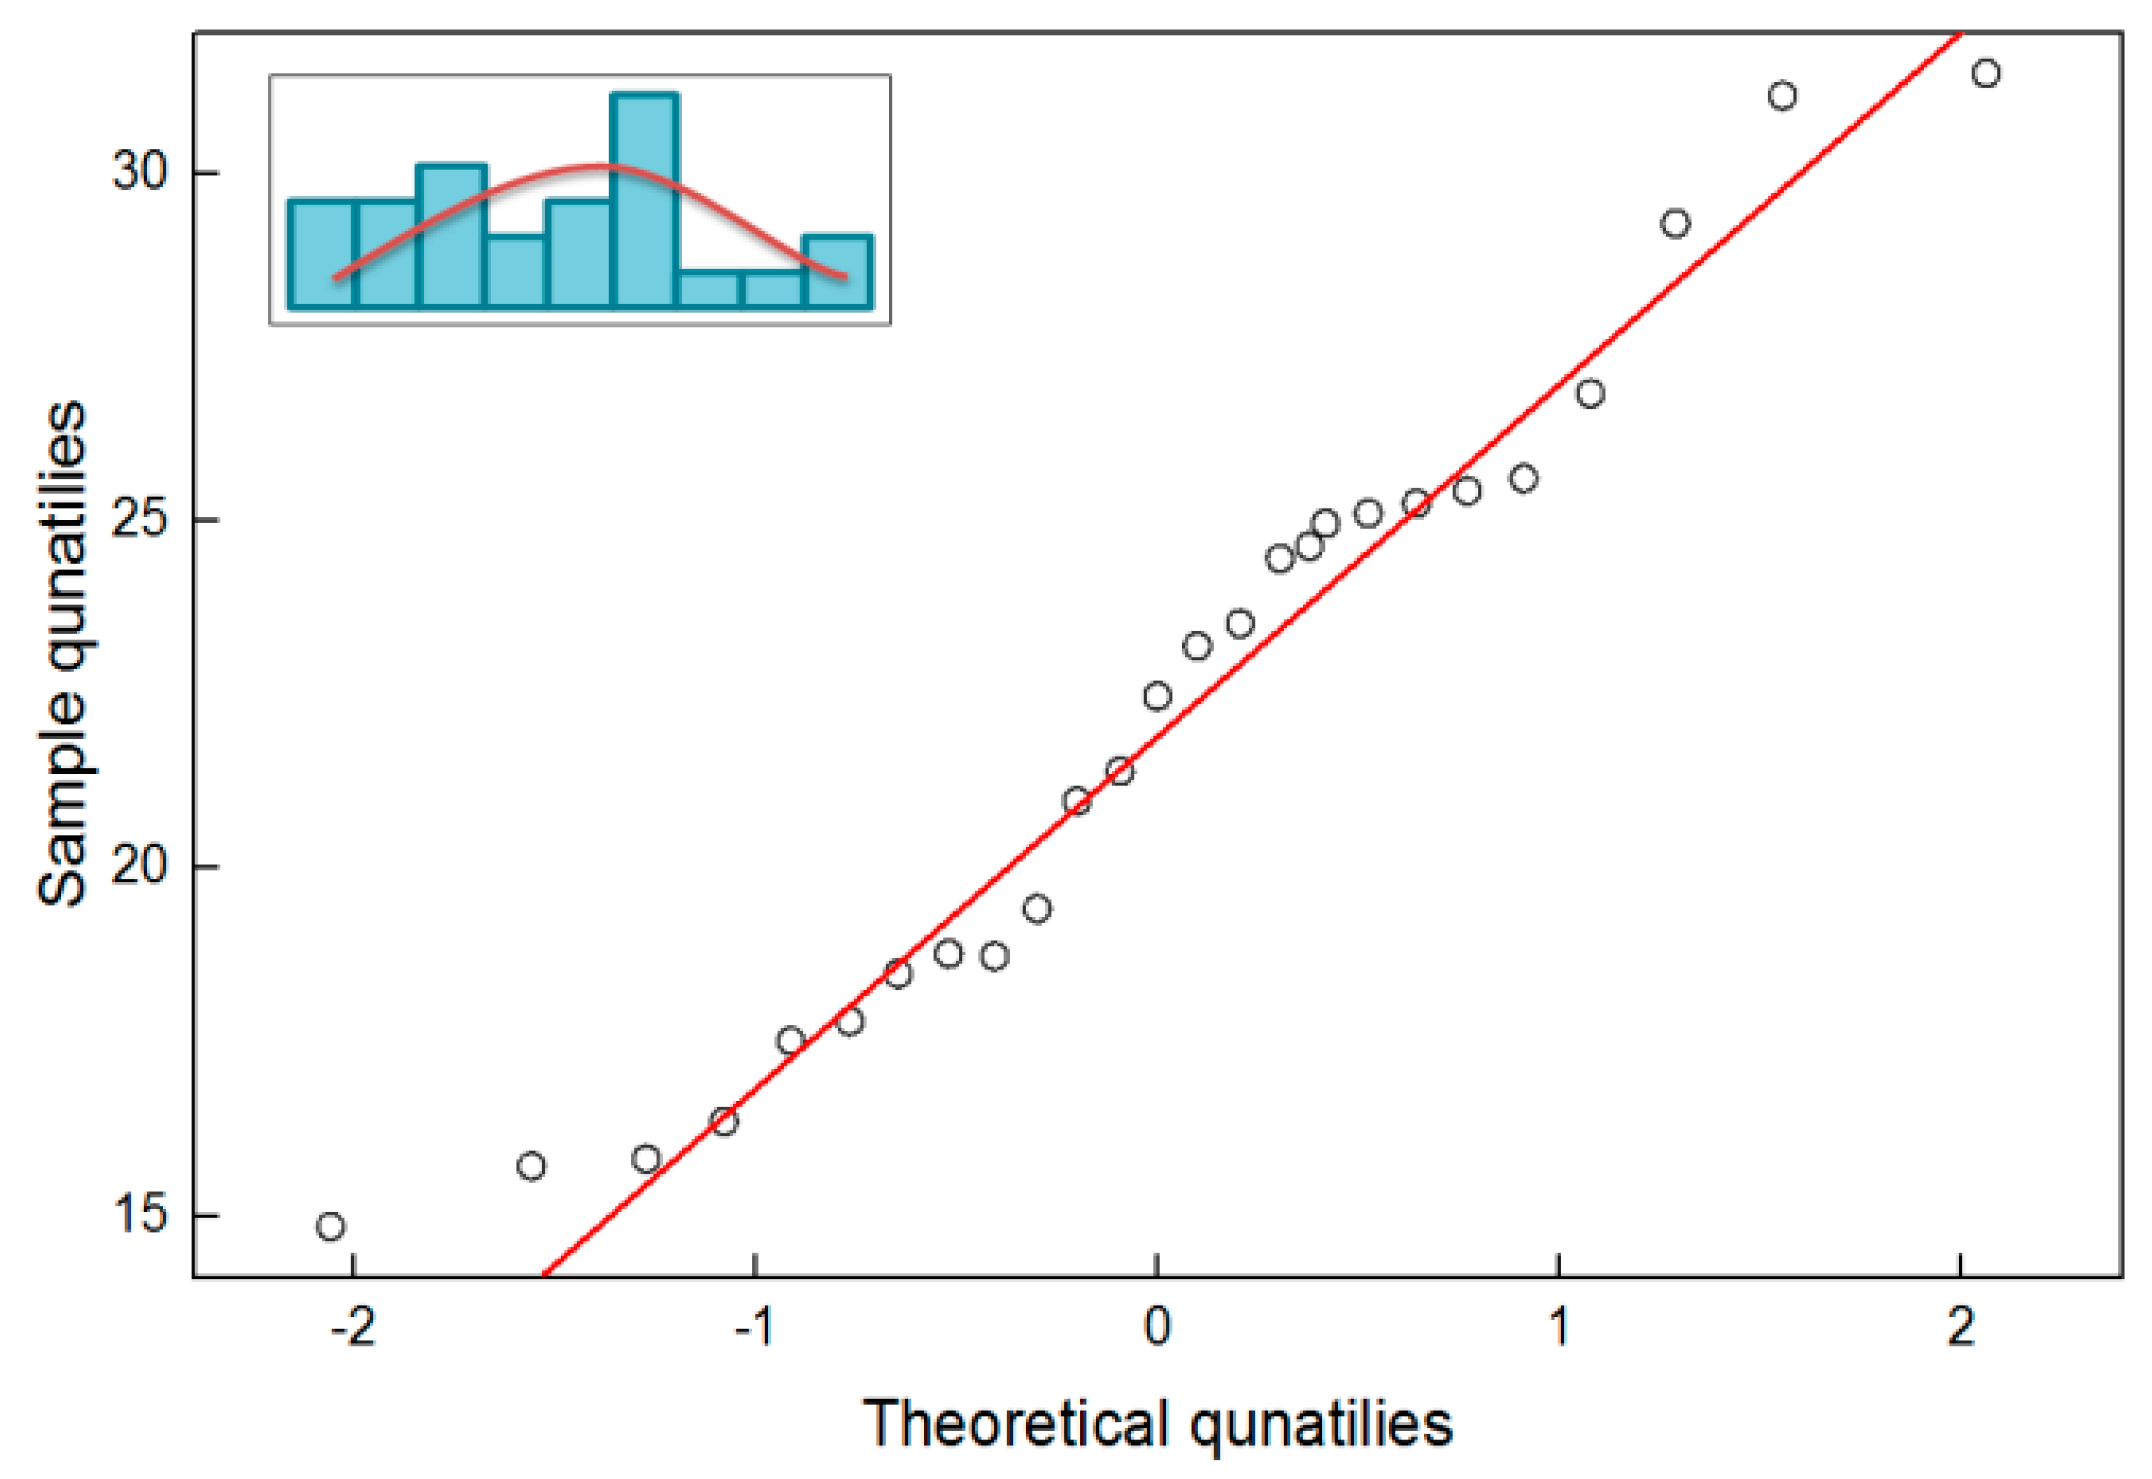
Data for the distribution of span is in accordance with the normal distribution having a mean value of 22.20 and a variance of 4.79 through the Q-Q test of residuals (the main function of the Q-Q test of residuals is to judge whether the sample is approximate to normal distribution. The normal distribution hypothesis of the sample would be acceptable, if each point of the graph is close to the reference line.). Therefore, Correlations (4) and (5) can be considered to produce the corresponding surrounding rock pressure with a span of 22 m. The corresponding results are shown in Figure 10.
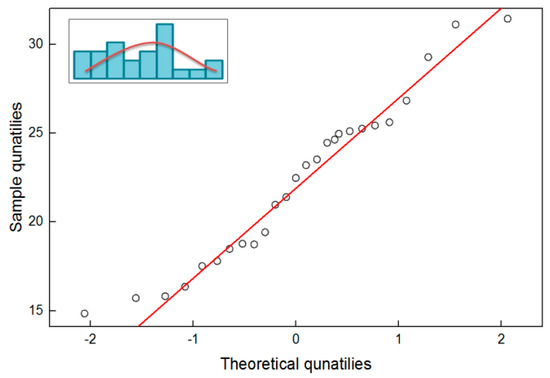
Figure 10.
Q-Q figure test.
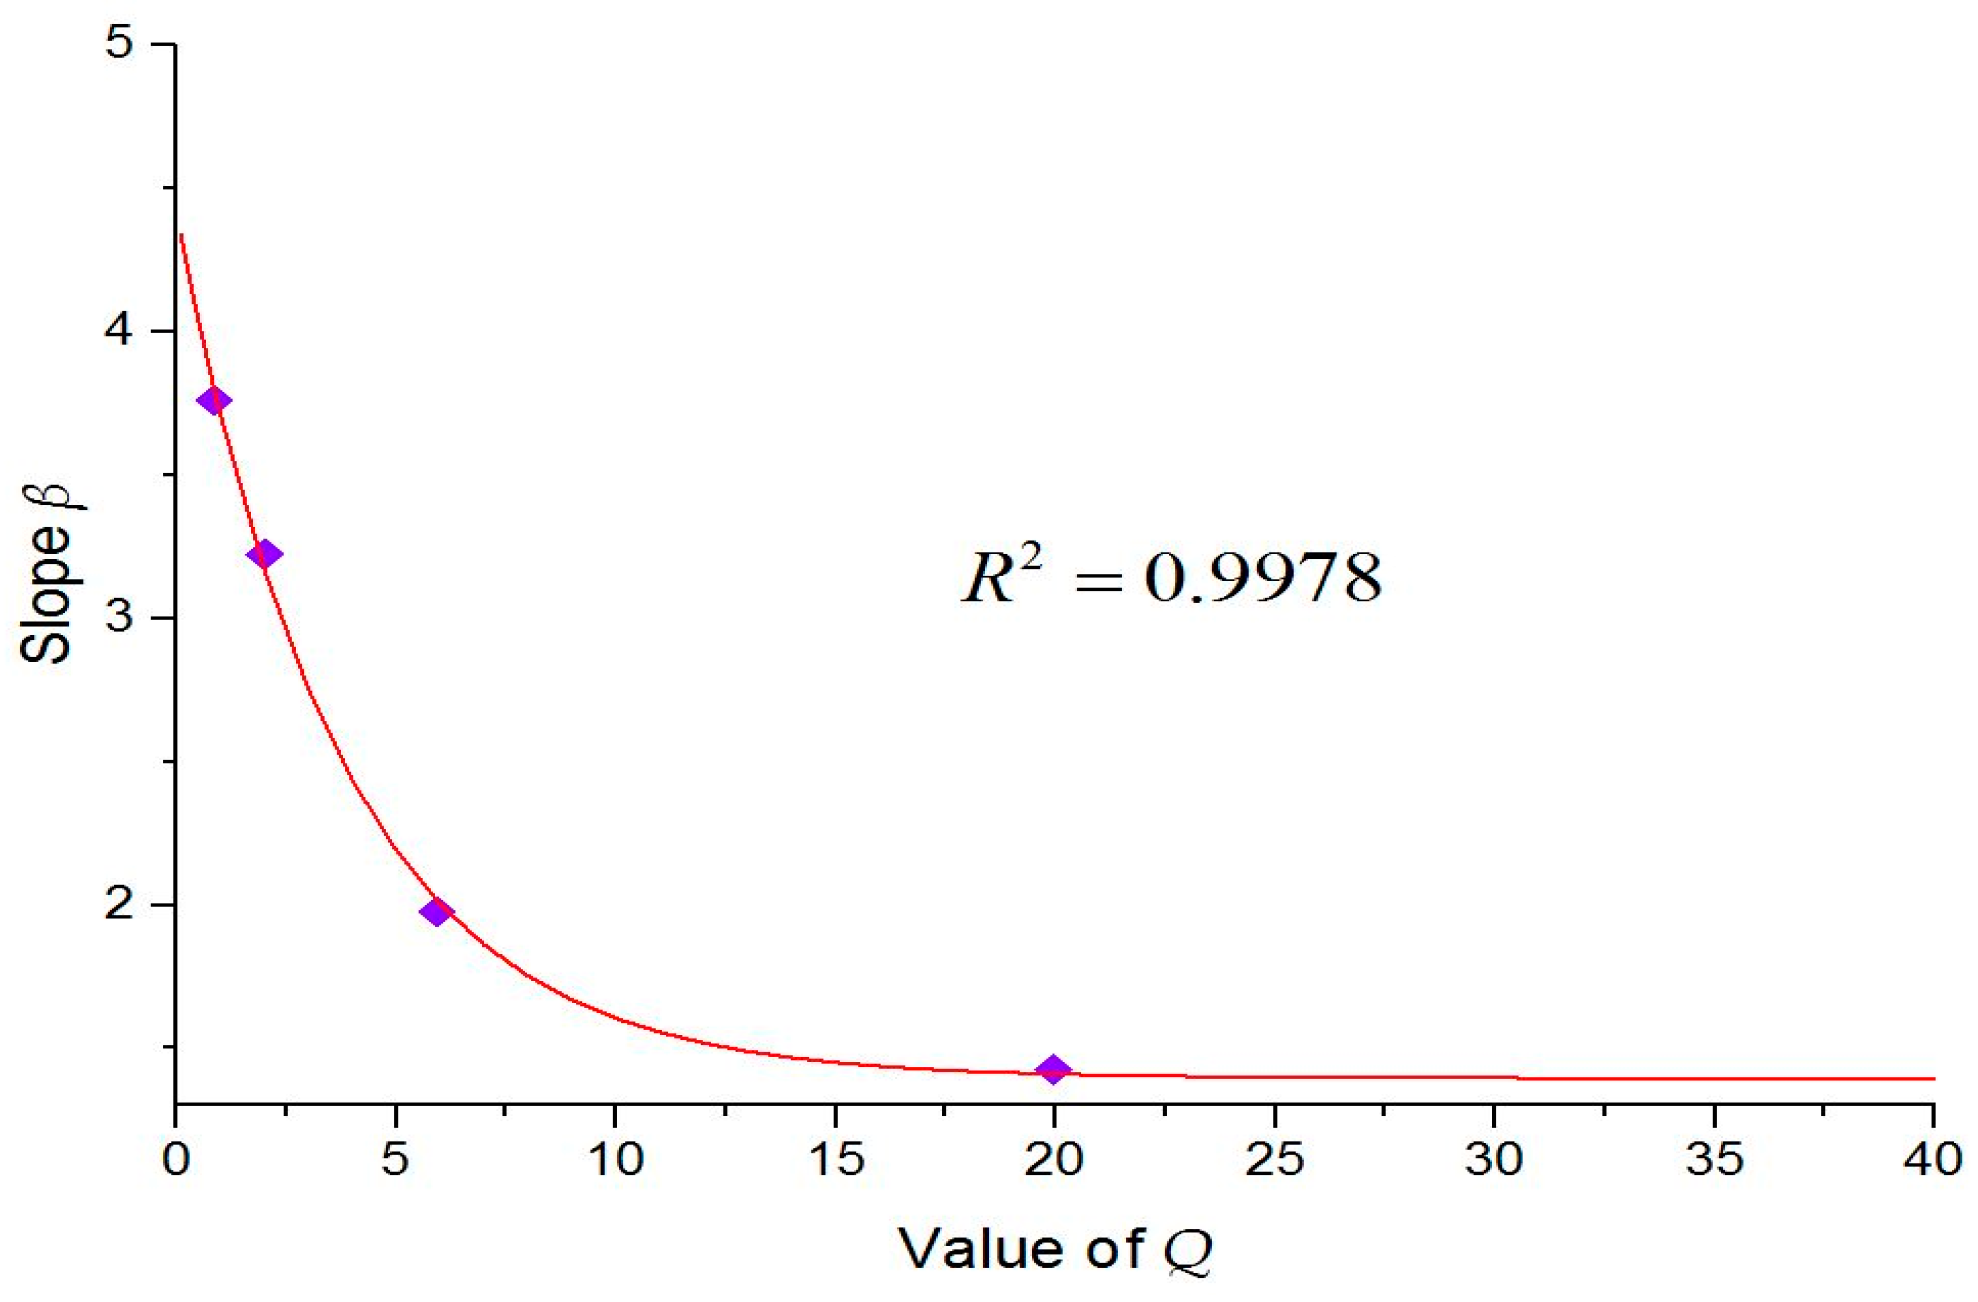
(2) Relationship between the Q value and the fitting linear correlation
The slope β corresponds to different Q values and is plotted in the coordinate system, as shown in Figure 11. The fitting correlation and the correlation coefficient are represented by Equation (6).

Figure 11.
Relationship between the Q value and the slope.
(3) Derivation process of the correlation estimation
The results show that the surrounding rock pressure values have a certain linear relationship with span under different Q values. The corresponding pressure values are given by Correlations (4) and (5) for the relationship between the Q value and the slope. Assuming that the intercept of the linear correlation between Q values and span d is given by B, the following correlations are established:
With the assumption that d = 22, B could be obtained by substituting Correlations (4)–(6) into (7):
Equations (8) and (9) are introduced into Equation (7) to obtain Equations (10) and (11):
When a parameter α is introduced, Equation (12) is obtained:
The units of α are kN/m3. Therefore, the estimation correlation for surrounding rock pressure based on Q value and span d is obtained as follows (see Equations (13) and (14)):
The units of Proof1 and Proof2 in Equations (11) and (12) are kPa, while those of d are m. Jn—Joint group coefficient; Jr—Joint roughness coefficient. Proof1 = Proof2 when Jn = 9; Proof1 > Proof2 when J < 9; Proof1 < Proof2 when Jn > 9.
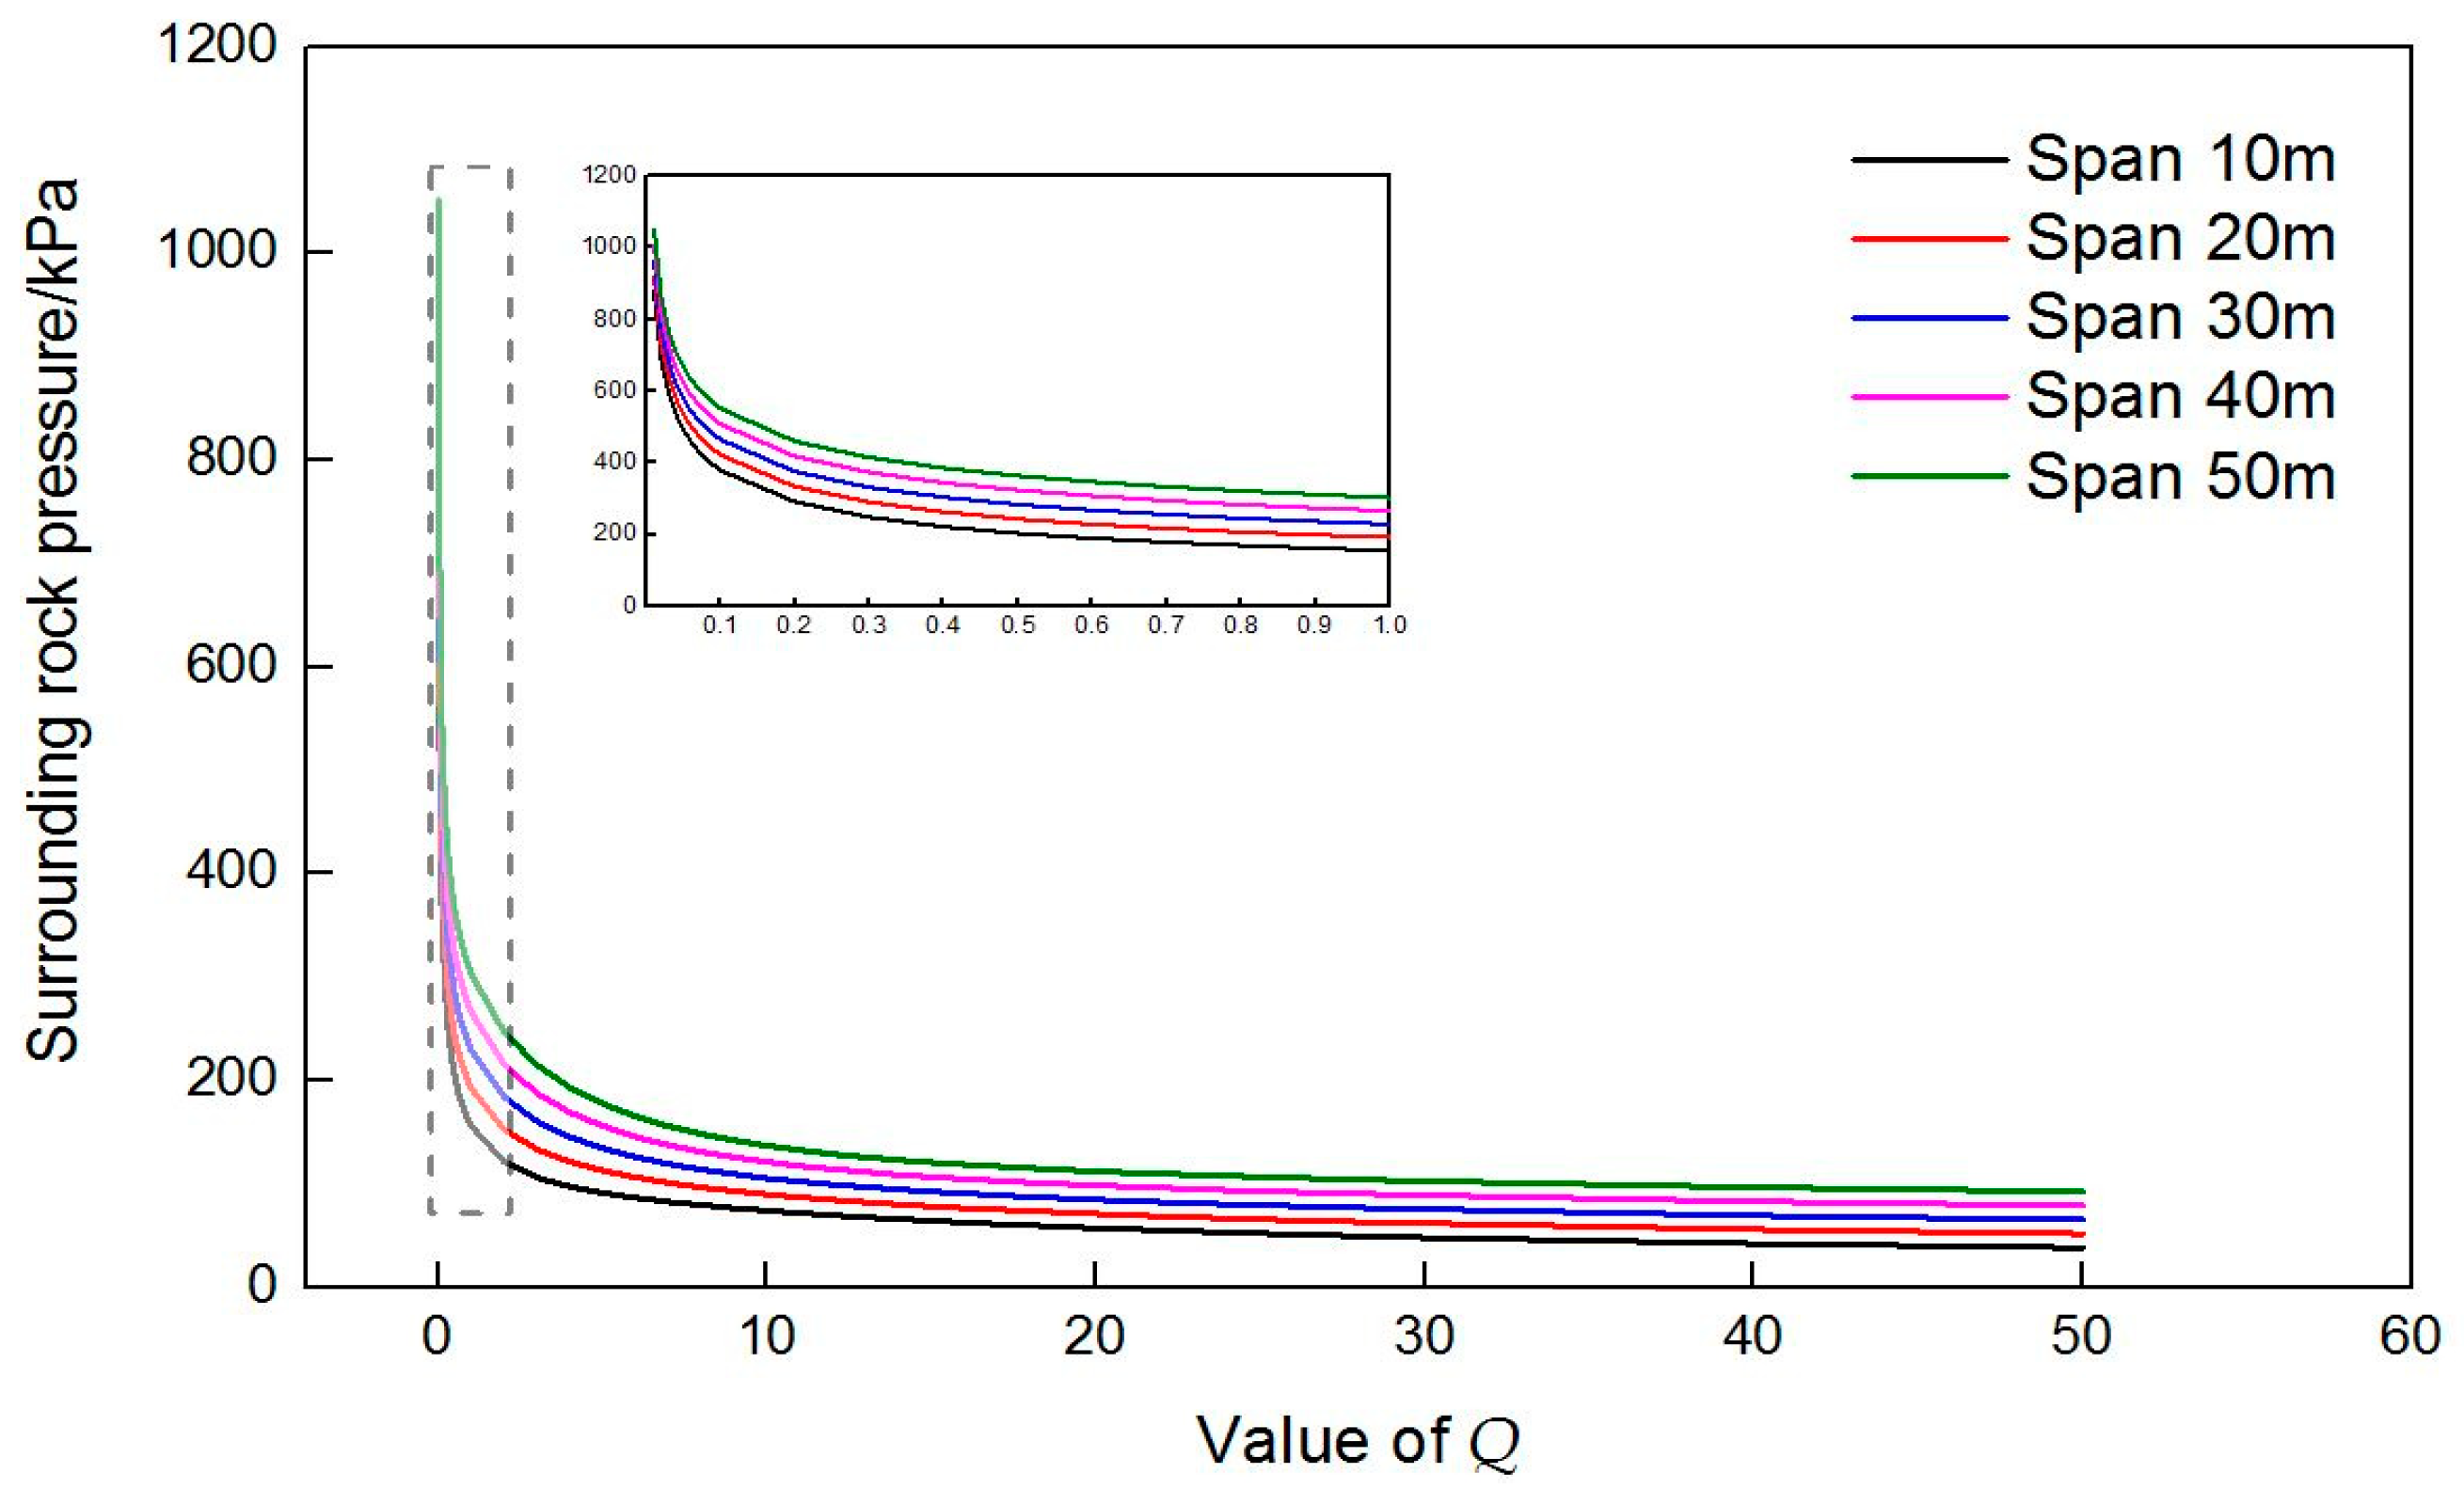
Assuming Jn = 9 and Jr = 1, the relationship between the surrounding rock pressure and Q values under different spans is calculated, and the corresponding results are shown in Figure 12.
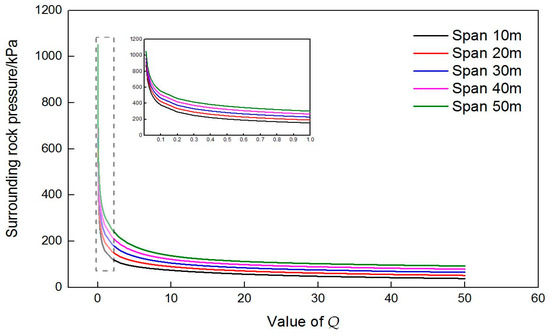
Figure 12.
Relationship between the surrounding rock pressure and Q values.
- 1)
- Under the same span, with the increase in Q value, the quality of surrounding rock increases. Furthermore, the surrounding rock pressure of the vault gradually decreases and tends to stabilize.
- 2)
- Under the same Q value, as the span increases, the surrounding rock pressure of the vault gradually becomes larger.
- 3)
- According to the local graph, when Q value is between 0 and 1, the slope of surrounding rock pressure curve increases rapidly with the decrease in Q value for the same span. This means a worse quality of surrounding rock results in a greater increase in the surrounding rock pressure.
- 4)
- As shown in the local graph, smaller the Q value, worse is the quality of surrounding rock, and more obvious is the influence of span on the surrounding rock pressure.
(4) Applicable conditions
- 1)
- The relationship between the slope β and Q value is based on the calculation model of lateral pressure coefficient λ = 2 and height-to-span ratio of 0.6. Therefore, the correlations are applicable to caverns, whose product of the lateral pressure coefficient and height-to-span ratio is close to 1.
- 2)
- The correlations are derived on the basis of Q system, so they are similar to the correlation based on Q system. They represent the calculation of surrounding rock pressure under deep burial conditions.
- 3)
- The surrounding rock pressure of underground structure with a span greater than 10 m is analyzed statistically in the process of deriving the correlation. Therefore, the calculation correlations for the surrounding rock pressure are more suitable for underground structures with large span.
5.2. Comparison between the Results of Correlations and the Measured Values
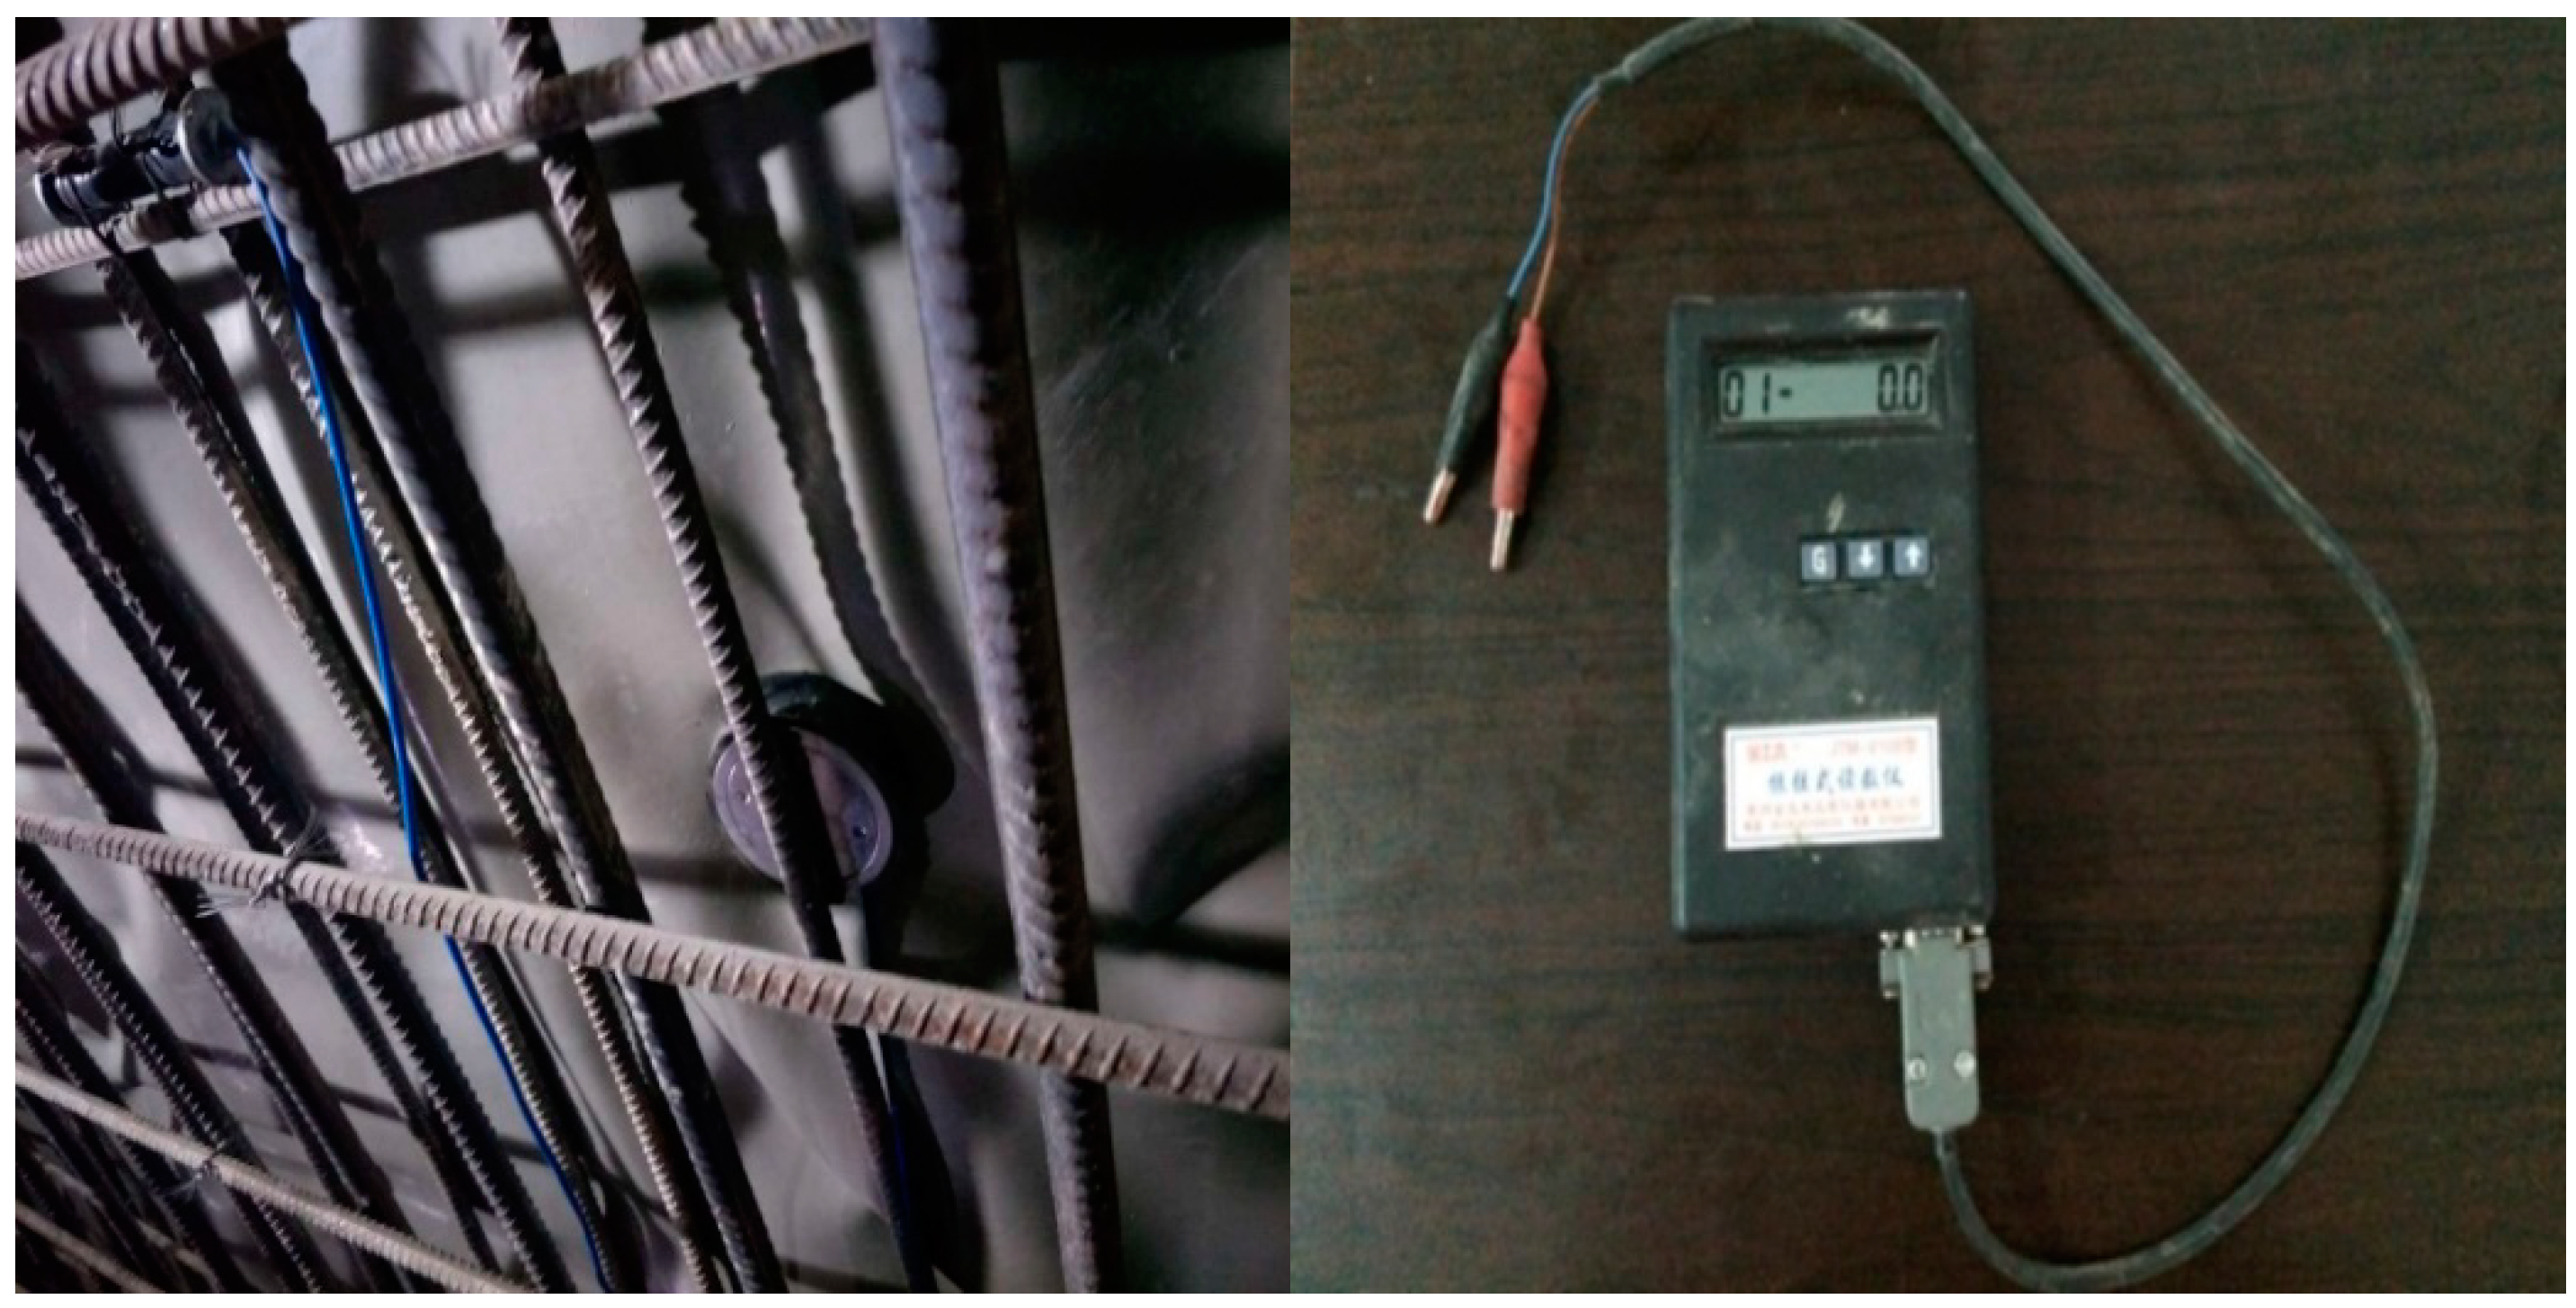
In order to better understand the variation of surrounding rock pressure during the construction of super-large section tunnel and verify the applicability of the estimation correlations, the contact pressure between the surrounding rock and the initial support of Liantang tunnel is monitored in-situ. The monitoring section mileage is K1 + 890, and the surrounding rock grade is III. The monitoring instruments are shown in Figure 13.
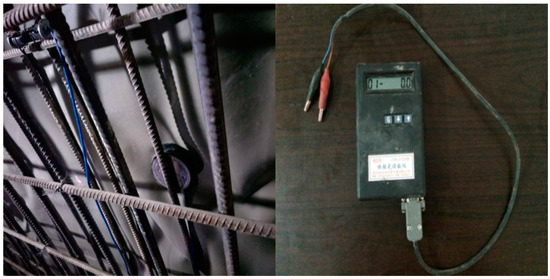
Figure 13.
Vibrating-wire earth pressure gauge and the vibrating-wire reading instrument.
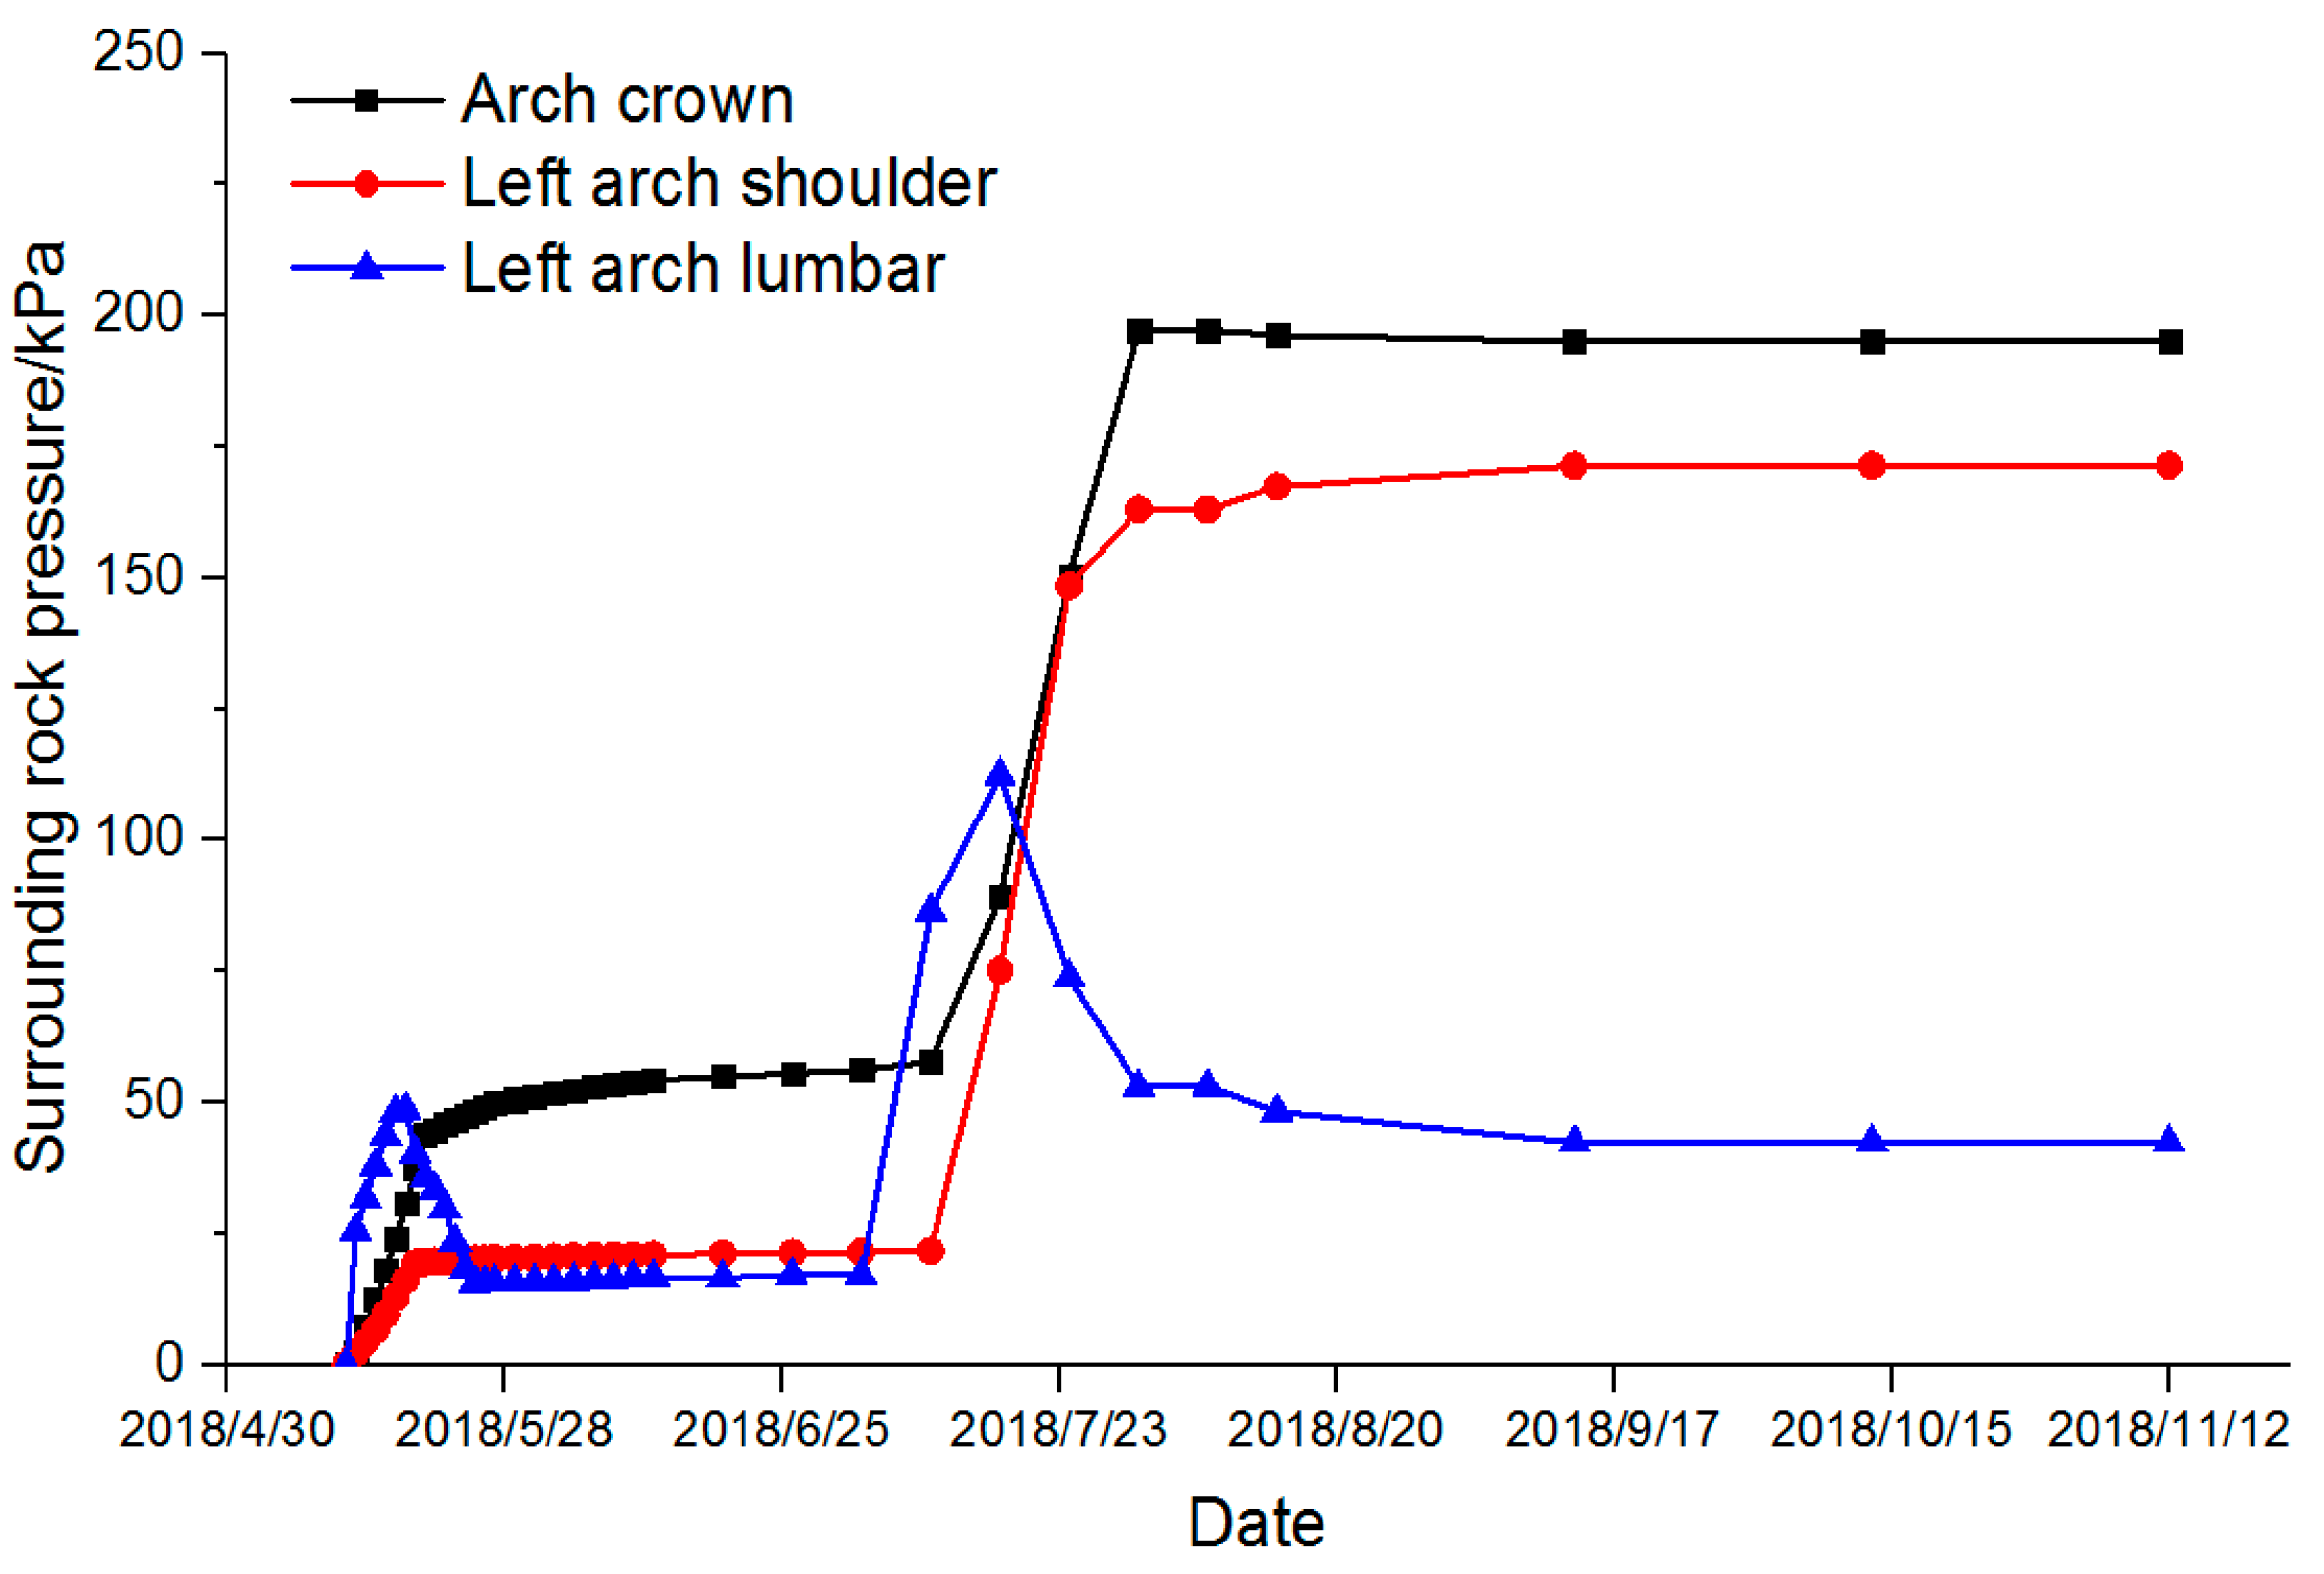
Up until 24 November 2018, the variation of surrounding rock pressure in Section K1 + 890 is shown in Figure 14. The pressure stability value of the vault surrounding rock at Section K1 + 890 is 197.12 kPa.
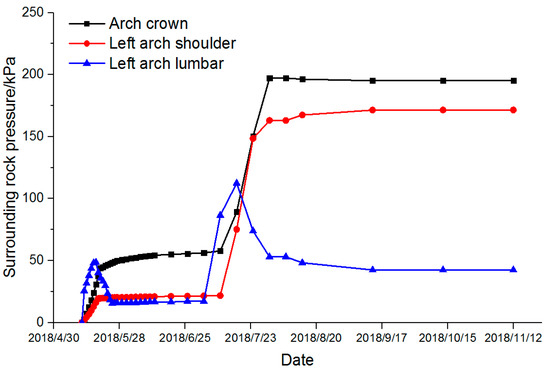
Figure 14.
Changes in the surrounding rock pressure for K1 + 890 Section.
In addition, data for 34 engineering cases around the world were collected through literature and engineering data [20,25,26,27,28,29]. The detailed engineering conditions and the measured values for the surrounding rock pressure are presented in Table 11.
Table 11.
Engineering examples.
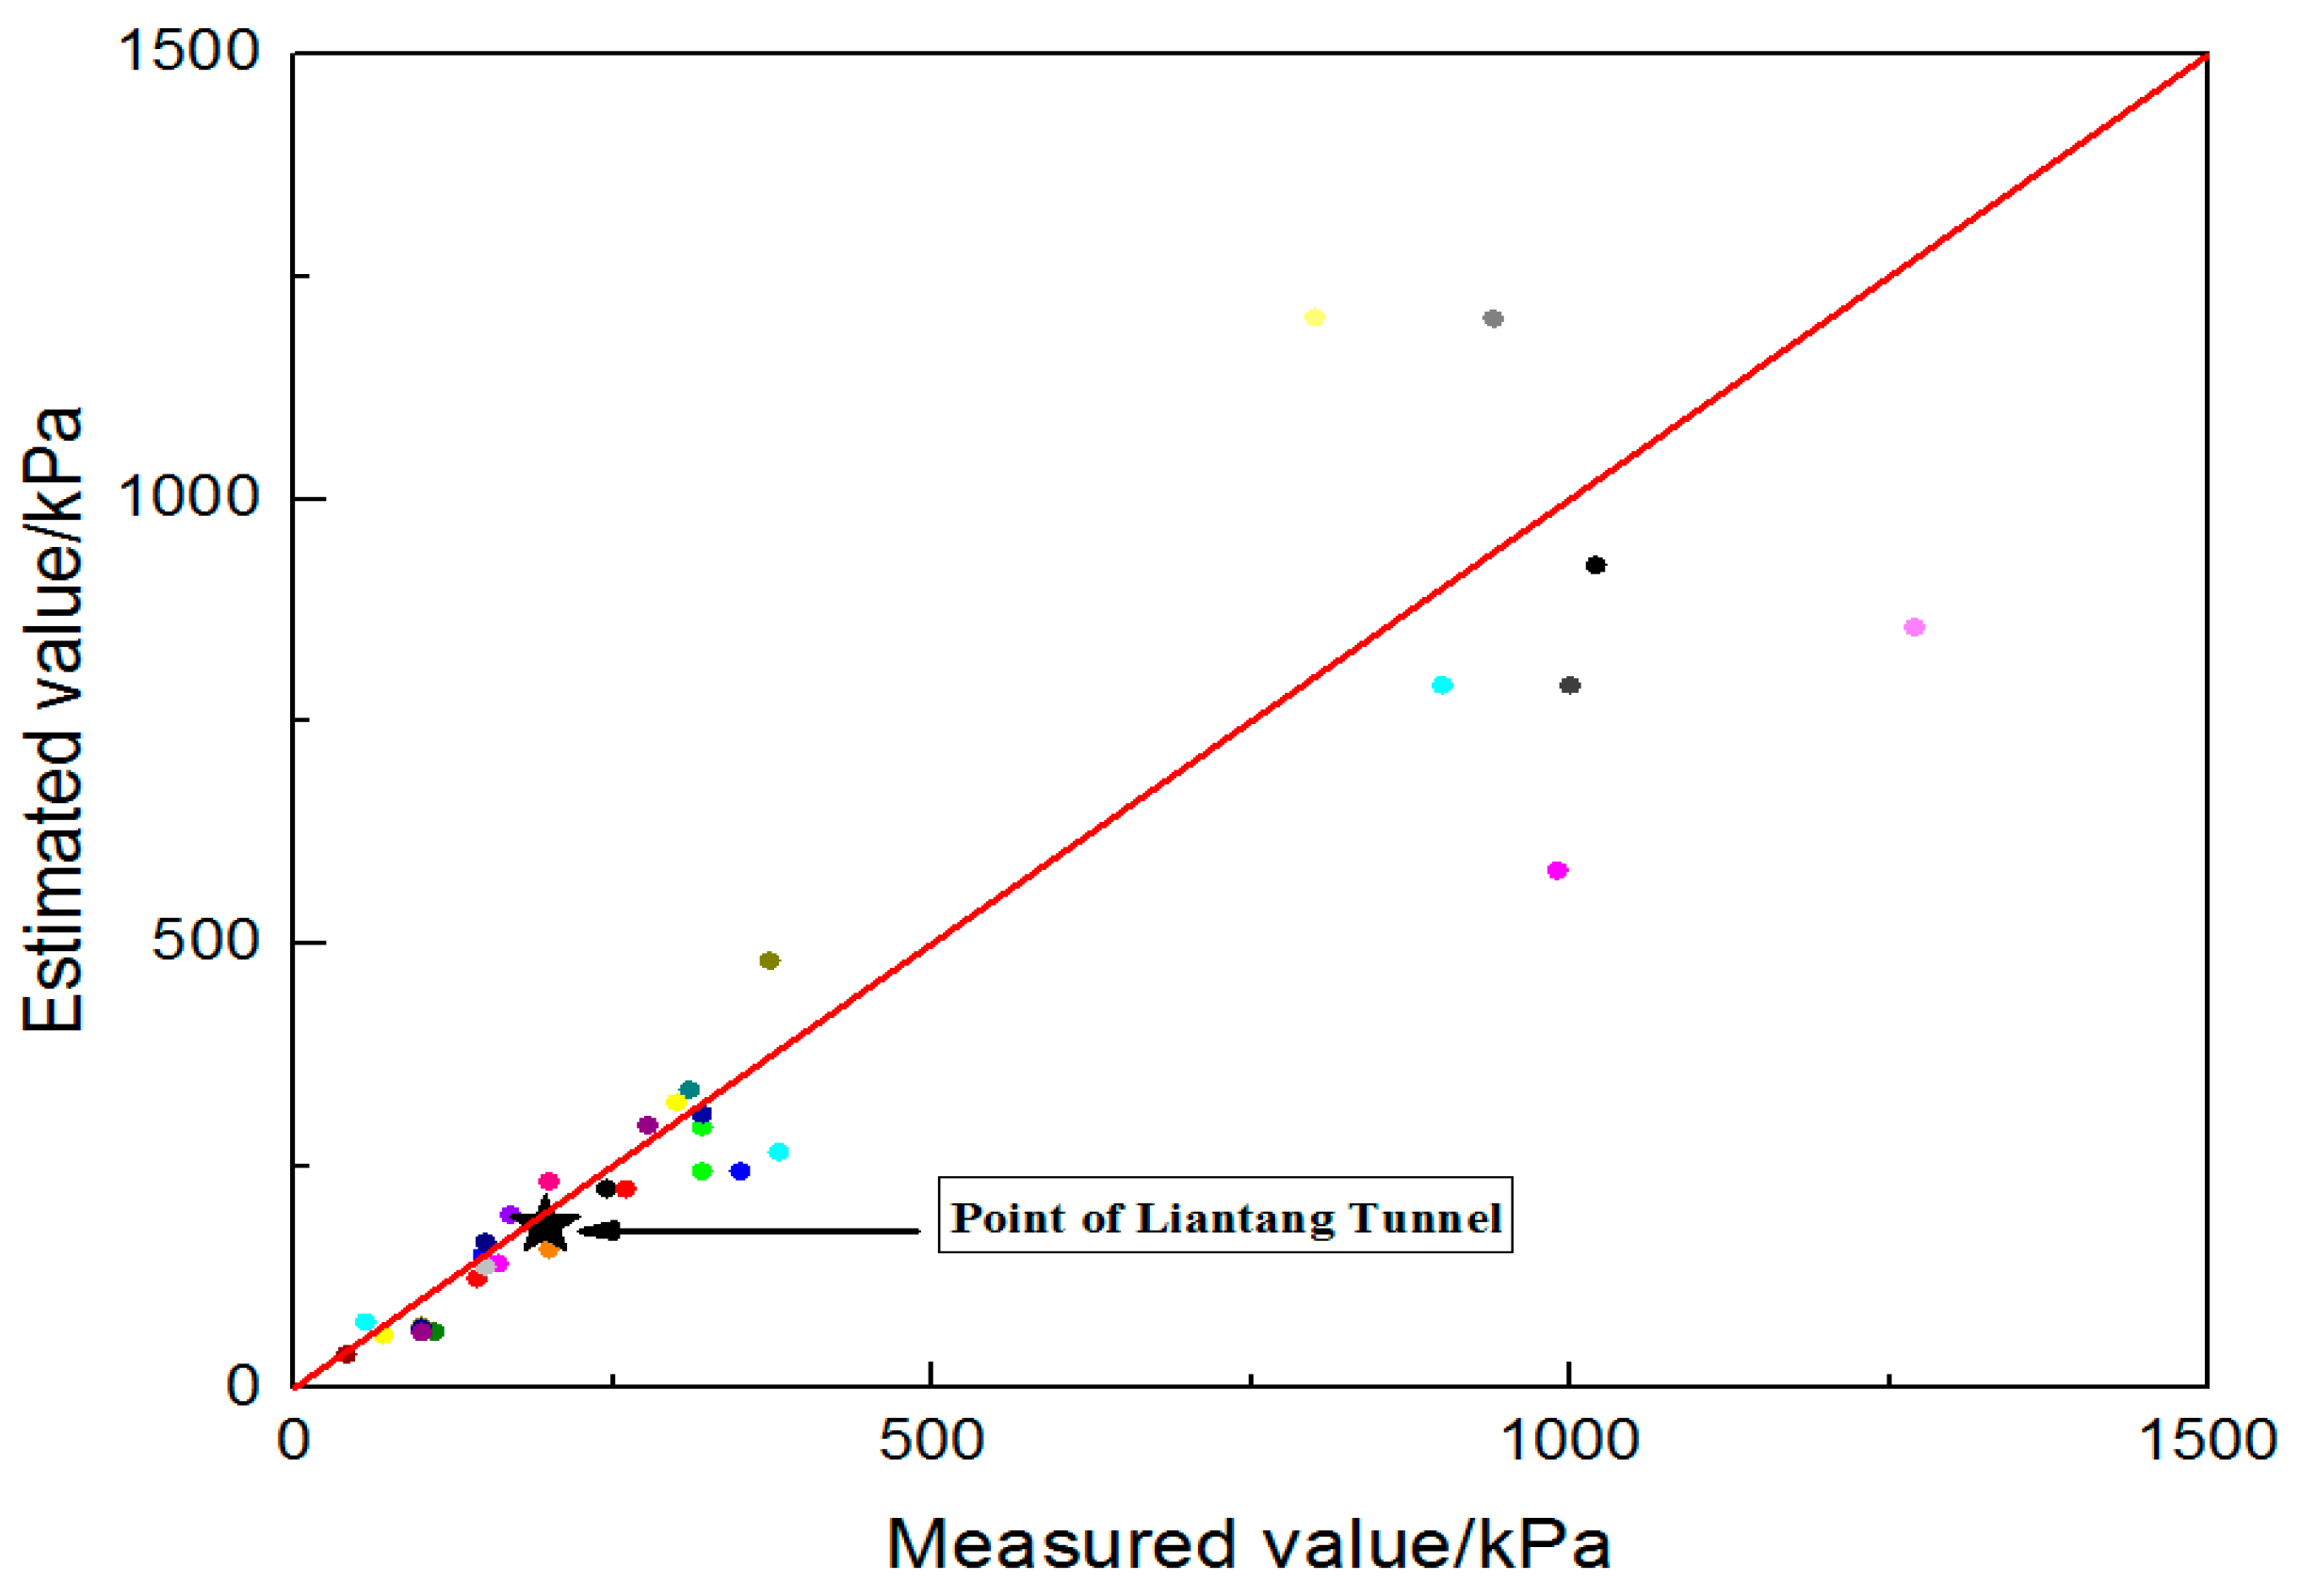
Figure 15 is a comparison chart between the measured and calculated surrounding rock pressures. The diagonal is represented as the isoline. It can be seen that the contrast values are basically distributed near the isoline, which shows that the estimation correlations have good applicability. The correlations can be used to rapidly estimate the surrounding rock pressure of deep-buried tunnels with conventional span or super-large section similar to Liantang tunnel.

Figure 15.
Comparison between the measured and calculated values of surrounding rock pressure.
5.3. Discussion
According to Figure 15, the contrast values are basically distributed near the isoline, which indicates that the correlations meet the needs of engineering stability analysis. The correlations are derived on the basis of Q system and statistical results of surrounding rock pressure for underground structures with a span greater than 10 m. Therefore, the correlations are applicable to large span underground structures under deep burial conditions. Further improvement is required for the correlations since the influence of construction methods on surrounding rock pressure in the process of derivation has not been focused on efficiently. In addition, the calculation of the side pressure will be the focus of the follow-up work.
6. Conclusions
(1) Based on the Liantang tunnel’s large-span project, the surrounding rock pressure of the single-arch super-large section tunnel is calculated using different correlations for the surrounding rock pressure. Additionally, the applicability and the characteristics of these traditional correlations are analyzed.
(2) The excavation simulation is carried out by using a single arch deep buried large-span structural model with different Q values and different spans to study the variation in surrounding rock pressure. The corresponding variation pattern is obtained, which shows that the surrounding rock pressure decreases with the increase in Q value for the same span. Furthermore, the surrounding rock pressure increases with the increase in tunnel span for the same Q value. However, the increase in surrounding rock pressure gradually decreases with the increase in Q value. With the increase in Q value, the rate of increase of surrounding rock pressure gradually decreases.
(3) New correlations for estimating the surrounding rock pressure are proposed after improving the correlation based on Q system and introducing the span term. The correlations are validated by the data collected from Liantang tunnel large-span and the surrounding rock pressure from more than 30 projects around the world. The validation results show that the correlations can provide a reference for the stability analysis of the surrounding rock of deep-buried super-large section structures.
Author Contributions
Conceptualization, H.G. and P.H.; Data curation, Z.C.; Funding acquisition, H.P; Investigation, X.L.; Methodology, H.G.; Project administration, H.G.; Software, H.G.; Supervision, P.H.; Validation, H.G.; Writing—original draft, H.G.; Writing—review & editing, H.G.
Funding
This research was funded by National Key R&D Program of China grant number 2017YFC0805401 and Horizontal Research Project of Beijing Jiaotong University grant number C18L01030.
Conflicts of Interest
The authors declare that there are no conflicts of interest regarding the publication of this paper.
References
- Guan, B.S. Key Points of Tunnel Engineering Design; China Communication Press: Beijing, China, 2004; Volume 1, pp. 230–303. [Google Scholar]
- Yan, Z.X.; Fang, Y.G.; Liu, T.J. Effect of stress path on surrounding rock pressure of super large-section tunnel. Chin. J. Rock Mech. Eng. 2009, 28, 2228–2234. [Google Scholar]
- Liu, X.Z.; Luo, R.L. Analysis of large-span highway tunnel surrounding rock vertical pressure attributes. J. Tongji Univ. (Nat. Sci.) 2010, 38, 1471–1475. [Google Scholar]
- Li, P.F.; Zhao, Y.; Zhang, D.L. Study of distribution laws of tunnel surrounding rock pressure based on field measured data statistics. Chin. J. Rock Mech. Eng. 2013, 32, 1392–1399. [Google Scholar]
- Zhao, L.J.; He, S.H. Analysis of rock pressure for large span and high side-wall underground cavern. Chin. J. Undergr. Space Eng. 2005, 1, 863–866. [Google Scholar]
- Jiang, D.Y.; Liu, C.; Li, G.Y. Correlation and analysis of calculation valucs of vertical pressure of wall rocks of large-span tunnel. China Min. Mag. 2005, 14, 63–66. [Google Scholar]
- Jiang, Y.Z.; Xu, W.Y.; Wang, R.H. Numerical analysis of the long-term stability of large-scale underground cavern of hydropower station. Rock Soil Mech. 2008, 29 (Suppl. S1), 52–58. [Google Scholar]
- Wang, K.Z.; Li, Z.K.; Bao, Z.J. Study on site monitoring and stability of layered surrounding rocks of underground powerhouses of hydropower station. Chin. J. Rock Mech. Eng. 2007, 26, 2148–2152. [Google Scholar]
- Jiang, Q.; Feng, X.T.; Xiang, T.B. Discussion on method for calculating general safety factor of underground caverns based on strength reduction theory. Rock Soil Mech. 2009, 30, 2483–2488. [Google Scholar]
- Chen, C.N.; Huang, W.Y.; Tseng, C.T. Stress redistribution and ground arch development during tunneling. Tunn. Undergr. Space Technol. Inc. Trenchless Technol. Res. 2011, 26, 228–235. [Google Scholar] [CrossRef]
- Kong, X.X.; Liu, Q.S.; Zhang, Q.B. A method to estimate the pressure arch formation above underground excavation in rock mass. Tunn. Undergr. Space Technol. 2018, 71, 382–390. [Google Scholar] [CrossRef]
- Prasad, V.V.R.; Dwivedi, R.D.; Swarup, A. Determination of support pressure for tunnels and caverns using block theory. Tunn. Undergr. Space Technol. 2013, 37, 55–61. [Google Scholar] [CrossRef]
- Scussel, D.; Chandra, S. A new approach to obtain tunnel support pressure for polyaxial state of stress. Tunn. Undergr. Space Technol. 2013, 36, 80–88. [Google Scholar] [CrossRef]
- The Professional Standards Compilation Group of People’s Republic of China. TB10003-2016 Code for Design of Railway Tunnel; China Communications Press: Beijing, China, 2016. [Google Scholar]
- Barton, N.R.; Lien, R.; Lunde, J. Engineering Classification of Rock Masses for the Design of Tunnel Support. Rock Mech. Rock Eng. 1974, 6, 189–236. [Google Scholar] [CrossRef]
- Zhang, D.L.; Fang, Q.; Hou, Y.J.; Li, P.F.; Wong, L.N.Y. Protection of buildings against damages as a result of adjacent large-span tunneling in shallowly buried soft ground. J. Geotech. Geoenviron. Eng. 2016, 139, 903–913. [Google Scholar] [CrossRef]
- Xu, H.F.; Chen, F.; Wang, B. Relationship between RMR and BQ for rock mass classification and estimation of its mechanical parameters. Chin. J. Geotech. Eng. 2014, 36, 195–198. [Google Scholar]
- Bieniawski, Z.T. Determining rock mass deformability: Experience from case histories. Int. J. Rock Mech. Min. Sci. Geomech. Abstr. 1978, 15, 237–247. [Google Scholar] [CrossRef]
- Bhasin, R.; Grimstad, E. The Use of Stress-Strengh Relationship in the Assessment of Tunnel Stability. Proc. Recent Adv. Tunn. Technol. 1996, 11, 93–98. [Google Scholar]
- Dwivedi, R.D.; Goel, R.K. Estimation of support pressure during tunnelling through squeezing grounds. Eng. Geol. 2014, 168, 9–22. [Google Scholar] [CrossRef]
- Bieniawski, Z.T. Engineering Rock Mass Classifications; John Wiley & Sons: Hoboken, NJ, USA, 1989; pp. 60–64. [Google Scholar]
- Protodyakonov, M.M. Rock Pressure on Mine Support (Theory of Mine Support); Tipografiya Gubernskogo Zemstva: Yekaterinoslav, Russia, 1907; pp. 23–45. [Google Scholar]
- Terzaghi, K.T. Theoretical Soil Mechanics; John Wiley & Sons: Hoboken, NJ, USA, 1965. [Google Scholar]
- Kim, H.J. Estimation for Tunnel Lining Loads; University of Alberta: Edmonton, AB, Canada, 1997; pp. 1–15. [Google Scholar]
- Dong, Y.S. Study of the stability of tunnel early supporting under different lateral pressures ratios. Railw. Stand. Des. 2010, 6, 87–90. [Google Scholar]
- Chen, J.X.; Yang, Z.; Yuan, X.K. Construction monitoring and measuring in segments of large embedded depth in Qinling Zhongnanshan super-long highway tunne. J. Archit. Civ. Eng. 2006, 23, 71–75. [Google Scholar]
- Huang, H.W.; Xu, L. Study on deformation and internal force of surrounding rocks and initial support in Dafengyakou rock road tunnel. Chin. J. Rock Mech. Eng. 2004, 23, 441–452. [Google Scholar]
- Chen, M.C. Force measurement and analysis of tunnel primary support structure. West-China Explor. Eng. 1999, 11, 50–52. [Google Scholar]
- Zhao, W.Z.; Hou, Z.; Wang, B.X. Safety evaluation of lining structure for Huangyanzi tunnel based on on-site pressure monitoring of surrounding rockmass. J. Water Resour. Archit. Eng. 2014, 13, 24–27. [Google Scholar]


© 2019 by the authors. Licensee MDPI, Basel, Switzerland. This article is an open access article distributed under the terms and conditions of the Creative Commons Attribution (CC BY) license (http://creativecommons.org/licenses/by/4.0/).