Abstract
In response to the problem that weights in product planning and design are difficult to accurately reflect the real needs of users, a design method for hexagonal shaft straightening machines based on quality function configuration and evidence theory is proposed. First, based on the method of quality function deployment and evidence theory, the demand indicator and its importance are determined by market research and the Kano model. Second, to solve the conflict problem in the process of expert opinion aggregation, combined with evidence theory, taking expert knowledge as evidence, the possible value space of causal strength among nodes constitutes the recognition framework, which is used to synthesize the knowledge of multiple experts. The indicator correlation degree is reflected by using a correlation weight matrix, and effective solutions to the relevant theoretical problems and algorithms, such as those for competitive indicator evaluation, weight calculation and planning target value cases, are proposed. Finally, according to the analysis results for the various structural elements of the house of quality, a hexagonal shaft straightening machine function for master planning house of quality was constructed, and propose a design and build the main experimental platform. The relevant test results show that the technical specifications of the hexagonal shaft straightening machine basically meet the requirements of the overall planning target values, verifying the effectiveness and feasibility of the proposed method.
1. Introduction
With the increasing market competition and the changing needs of users, the design of products is facing new challenges, and enterprises pay increasing attention to meeting the diversified and personalized needs of users. However, the design of the current product planning scheme lacks the overall coordination and overall planning for the real needs of users and cannot fully reflect the needs preferences of users [,] in the decision-making process. Quality function deployment (QFD) is a systematic and structured product planning method that takes the user’s needs as the breakthrough point and adopts a certain standardized way to transform the user’s needs into design elements in different stages of product design []. At present, QFD is widely used in manufacturing, service, construction machinery, strategic planning, higher education, and other fields and has achieved remarkable benefits.
However, domestic and foreign scholars have found that in the process of using the QFD method alone, product evaluation was greatly affected by subjective factors, and the weight could not accurately reflect the real needs of users. Therefore, scholars combined QFD with other models to compensate for the lack of unilateral use of the method. Haber et al. [] used Kano model to expand the quality function configuration method of product service system, and transformed the relevant demand indicators into the receiver state parameters in the product service system to better define the product characteristics and service characteristics, and then combined with fuzzy analytic hierarchy process to evaluate the state parameters and their importance. Efe et al. [] used the quality function deployment method based on intuitionistic fuzzy number to evaluate the correlation degree among customer requirements, design requirements and between customer requirements and design requirements, and applied the method to the failure mode analysis process related to occupational accidents in shipbuilding industry, calculated the weight of occurrence, severity and detection between occupational accidents and failure modes. Combined with VIKOR (VIsekriterijumska optimizacija i KOm-promisno Resenje) method, the risk assessment of occupational accidents in shipbuilding industry is carried out by the method of risk assessment. Fatma et al. [] applied the spherical fuzzy sets theory to production design and proposed a spherical fuzzy QFD (SF-QFD) algorithm under impreciness and fuzzy conditions, and studied the importance of customer requirements (CR), weight calculation and improvement of design demand (DR). The judgment opinions of multi-customers/experts are fused by spherical fuzzy aggregation operator, and applied SF-TOPSIS method to evaluate the customer demand and design demand competitively. Finally, SF-QFD method is applied to the technical design evaluation of linear triangular robot. Haber et al. [] proposed that the quality function deployment for product service systems (QFD for PSSs) method was augmented by means of the Kano model to filter the needs of customers and transform the attractive needs into receiver state parameters (RSPs), as the cornerstone of QFD for PSS. Then, to properly assess these parameters and their inherent uncertainty, the fuzzy analytical hierarchy process (FAHP) method was also integrated into the procedure. Efe et al. [] used QFD based on intuitionistic fuzzy numbers to handle the correlation among design requirements (DRs), correlation among customer requirements (CRs), relationship between CRs and DRs for each criterion occurrence, severity, and detection. Intuitionistic fuzzy numbers ensure an advantage to present more accurate and easier judgments of experts. Fatma et al. [] proposed spherical fuzzy QFD (SF-QFD) under imprecision and vagueness involving linguistic evaluations rather than exact numerical values. The importance ratings and global weights of customer requirements (CRs) and improvement directions of design requirements (DRs) are successfully represented by using spherical fuzzy sets. Dionicio et al. [] proposed an integrated model of fuzzy Kano, analytic hierarchy process (AHP), decision-making trial, and evaluation laboratory (Dematel) and QFD, which transformed customer requirements into product characteristics and systematically determined the priority by considering the interdependence and fuzziness between design schemes to realize intelligent product design. Mahmoud et al. [] used the triangular fuzzy number (TFN) in the integrated model of QFD and the fuzzy analytic network process (FANP) to express the importance of user requirements and engineering features and solved fuzzy decision-making problems in different fields such as product development and ergonomic design. Although the above methods can avoid the influence of the subjective ratings of experts in the decision-making process to a certain extent, there are also inconsistencies in the quantitative scales of importance and relevance ratings, and the correlation matrix cannot directly reflect the evaluation results of opinions of experts among different technical indicators. It is difficult for the above methods to make use of the competition and complementarity of the knowledge or experience of different experts, which leads to the lack of reinforcement of common factors, which makes it difficult for the synthetic results to reflect the objective reality and may even produce errors. How to synthesize the knowledge of multiple experts is worthy of further study.
The evidence theory of intelligent technology provides a scientific tool for the synthesis of multi expert knowledge, mapping multiple values to obtain the upper and lower bounds of probability, and according to the accumulation of evidence, evidence theory continuously narrows the hypothesis set to gradually approach the true value to obtain scientific decision-making results. Evidence theory is an uncertain reasoning and decision-making theory based on an identification framework. In the process of dealing with cognitive uncertainty, evidence theory can reasonably describe and deal with various pieces of incomplete information, unreliable information and even conflicting information []. Cui Qiang et al. [] used the entropy weight method and AHP to calculate indicator weight, applied evidence theory to fuse the indicator state membership degree into a cloud model, and constructed a hierarchical evaluation model of the transformer state. Zhang Lizhi et al. [] combined a deep convolution neural network (CNN) with evidence theory, calculated the basic weight distribution and decision fusion for the output results of the model, and improved the accuracy of gearbox composite fault diagnosis. Roy and Datta [] constructed a seawater intrusion prediction model through a weighted average set and calculated the algorithm weight of the model by using evidence theory. When dealing with conflicting evidence, Cheng et al. [] used the conflict coefficient of consistency evaluation to determine the weight of evidence and combined the conflict coefficient of consistency evaluation with neighborhood quantum particle swarm optimization (NQPSO) to build an intelligent fault diagnosis model to improve the accuracy of fault identification of wind turbine gearboxes. The use of evidence theory to integrate expert opinions and describe the uncertainty factors in the analysis process can effectively improve the accuracy of expert opinion assessment in the degree of correlation and reduce the components of conflict. Sarabi-Jamab et al. [] proposed a modification to a set of the most discriminative dissimilarity measures (smDDM) as the minimum set of dissimilarity with the maximal power of discrimination in evidence theory to handle all types of uncertainty in fuzzy evidence theory. The generalized smDDM (FsmDDM) together with the one previously introduced as fuzzy measures make up a set of measures that is comprehensive enough to collectively address all aspects of information conveyed by the fuzzy bodies of evidence. Behrouz et al. [] describe the analysis of uncertainty by means of both probability and evidence theories. Monte Carlo simulation is used along with the two theories to propagate the uncertainty. Sarabi-Jamab et al. [] put forward a modification to a set of the most discriminative dissimilarity measures (smDDM), combined with the generalized smDDM (FsmDDM), a set of comprehensive measurement dimensions is constructed. The method can deal with all three types of uncertainty: fuzziness, non-specificity, and conflict, and in practical application, the effectiveness of the proposed method is proved by quantifying the differences between fuzzy bodies of evidence. Behrouz et al. [] proposed the principles of parametric uncertainty analysis by Monte Carlo simulation method based on the probability and evidence theories and described the difference between the epistemic and aleatory uncertainties. The advantages of evidence theory in dealing with epistemic uncertainties are proved by some flood-control-related problems.
Based on QFD and evidence theory, this paper designs the function of a hexagonal shaft straightening machine. First, from the perspective of user demand, through the market research of hexagonal shaft enterprises, to combine with the Kano model [,] to determine the demand indicator and its importance; second, use expert opinions to quantify the degree of correlation between demand indicators and technical indicators, and use evidence theory to integrate the consistency evaluation of expert opinions to build a correlation weight matrix. Then, in combination with market development and demand changes, perform a competitive evaluation of the indicators, calculation of weight, and planning target value. Finally, the house of quality for the overall planning of a hexagonal shaft straightening machine function is constructed, and the design scheme is put forward and verified by experiments according to the analysis results of the house of quality.
2. The Methods of QFD and Evidence Theory
2.1. QFD Theory
QFD is a method of quality assurance and improvement. By fully exploiting user needs and transforming these user needs into quality and technical characteristics at different stages of product design, the basic idea of user orientation is fully reflected in the quality analysis and evaluation process to achieve benefits such as cost reduction and quality improvement [,].
The basic principle of QFD is to quantify the relationship between customer demand and product technical characteristics in the form of a House of Quality (HOQ) diagram. As a core tool, a house of quality is composed of the following main parts: The left wall is the demand indicator and importance of demand indicators, which is used as the input matrix for the house of quality. Ceiling is the technical indicator matrix after the transformation of the demand indicator, reflecting the overall mapping between them. Roof is the autocorrelation matrix of technical indicators, which reflects the mutual influence between technical indicators. Room is the correlation weight matrix of the demand indicator and technical indicator, which is used to express the degree of correlation between them. The right wall is the competitive evaluation matrix of the demand indicator and the demand indicator weight matrix, which reflects the advantages and disadvantages of existing products in the market; basement is composed of the competitive evaluation matrix of technical indicators, technical indicator weight and technical indicator target value, and the output results reflected by them can be used as the basis for scheme design and decision-making. According to the design tasks of each stage of the overall planning of the hexagonal shaft straightening machine, the connection attribute of the demand indicator and the technical indicator is expressed in the form of HOQ. Figure 1 shows the structure diagram of the house of quality.
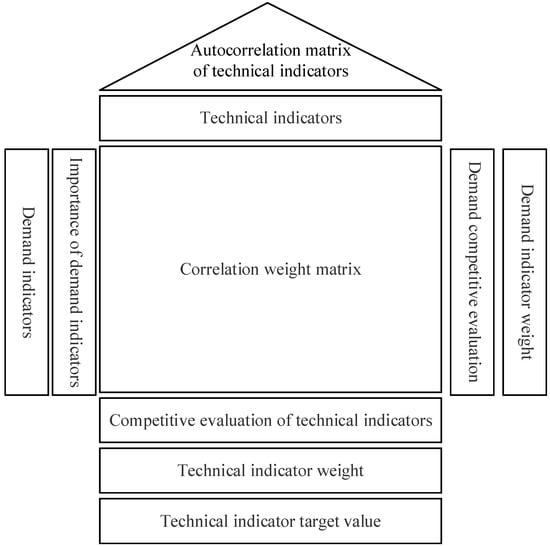
Figure 1.
Structure diagram of product planning house of quality.
2.2. Evidence Theory and Its Synthesis Rules
Evidence theory was first proposed by Dempster in 1967 and further developed into a mathematical model by Shafer, also known as D-S theory [,]. Its theoretical basis includes basic concepts such as the recognition framework, basic credibility distribution function, trust function, and truth-like function.
- (1)
- Frame of discernment
Let the set of all the results that the variable x can produce be Θ. If Θ is a nonempty set, and each element in Θ is independent of all others, then Θ is the recognition framework, and it is assumed to be composed of a finite number of basic elements.
- (2)
- Basic probability assignment
Definition 1: Let Θ be the recognition frame and 2Θ be the power set of Θ. For any subset A belonging to 2Θ, the set function satisfies
Then, M is called the basic credibility distribution function defined on 2Θ. M(A) is called the basic credible number of A, which reflects the degree to which proposition An occurs, and set An of all is called the focal element.
- (3)
- Belief function
Definition 2: If for any , a function exists and satisfies the function is called a trust function.
- (4)
- Plausibility function
Definition 3: If for any , a function exists and satisfies
the function is called the likelihood function,
- (5)
- D-S evidence theory synthesis formula
Definition 4: for any , and let , be the basic credibility allocation on recognition frame , their focal elements are , , , , , , , meet
then
where is the conflict coefficient, which is used to measure the degree of conflict between various evidence. The larger is, the greater the degree of conflict between evidence. The coefficient is the regularization factor.
3. Construction of House of Quality for Hexagonal Shaft Straightening Machine
The design of a hexagonal shaft straightening machine based on QFD and evidence theory includes four main steps: demand indicator identification, relation matrix construction, indicator competitive evaluation and weight calculation, and the proposed design scheme. The process is shown in Figure 2.
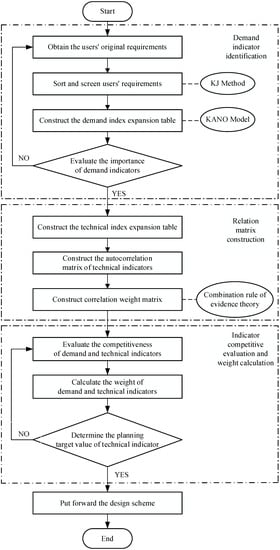
Figure 2.
Design process of hexagonal shaft straightening machine.
3.1. Demand Indicator Identification
According to the current technology development and market demand, questionnaire surveys, on-site investigations, and in-depth interviews were carried out for hexagonal shaft enterprises. First, after obtaining the demand indicator, the user’s original demand was sorted and screened by an affinity graph (KJ method), and the demand level was divided. Second, a Kano questionnaire survey was carried out from two aspects, the hexagonal shaft straightening effect and straightening machine performance, to study the influence of user demand on user satisfaction. Finally, the types of user needs were analyzed and summarized, and the feasible demand indicators and their importance were determined. The design requirement identification method of the straightening machine is shown in Figure 3.
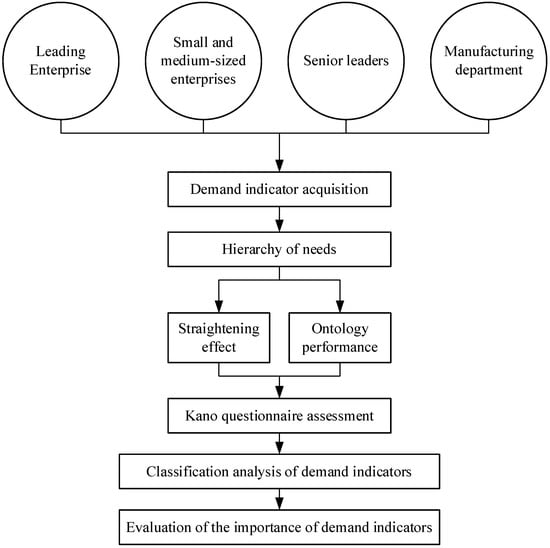
Figure 3.
Identification of design requirements of straightening machine.
The Kano model is used to design Kano questionnaire on the effect of hexagonal shaft straightening and the performance of straightening machine body, so as to solve the problem of accurate and sufficient transmission of user requirements. Kano model is a useful tool for classifying and prioritizing user requirements. Based on the analysis of the impact of user requirements on user satisfaction, it reflects the nonlinear relationship between product performance and user satisfaction. When designing the Kano questionnaire, the user needs are divided into basic needs (M), expected needs (O), attractive needs (A), irrelevant needs (I), opposite needs (R), and questionable results (Q), and the positive and negative answers of users to a certain demand are analyzed, as shown in Table 1, Kano evaluation results []. Second, according to the results of expert evaluation and full communication with users, the importance of demand is evaluated by 1~9 points. The higher the score is, the higher the design value of the demand indicator. Construct the demand indicator and its importance expansion table, as shown in Table 2.

Table 1.
Kano evaluation table.
Table 2.
Expansion table of the demand indicator and importance degree.
3.2. Construction of Relational Matrix
According to the performance characteristics of the straightening machine in use, the demand indicators in Table 2 are converted into specific product technical indicators. A number of experts sorted out and summarized the technical indicators that had an impact on the demand indicators by using the brainstorming method, affinity diagram (KJ method), and tree diagram, as shown in Table 3. Second, the degree of autocorrelation of technical indicators was studied. The correlation between technical characteristics can be divided into strong positive correlation, positive correlation, negative correlation, strong negative correlation, and no correlation. For any two technical indicators, it is necessary to clarify whether the implementation of one item promotes, hinders, or has no influence on the implementation of the other item, deeply analyze the repeated, uncoordinated, or even mutually exclusive engineering technologies in the straighter design, and adjust the scheme in a timely manner []. In order to distinguish the degree of quantification in the correlation weight matrix, “⚫,” “◯,” “△,” and “▲” are used here to indicate strong positive, positive, negative, and strong negative correlations respectively, and blanks are used to indicate no correlation, as shown in Table 4.
Table 3.
Design technical indicators of straightening machines.
Table 4.
Autocorrelation matrix of technical indicators.
In the process of building the correlation weight matrix, expert opinions are used to quantify the degree of correlation between the demand indicator and the technical indicator. In the synthesis of multiple expert opinions, Lefevree et al. [] pointed out that when expert opinions are highly inconsistent, counterintuitive conclusions will be generated by using the synthesis rule. Lu Zhengcai, Qin Zheng et al. [] studied the result of opinion aggregation when the number of experts increases from 2 to 6, and the research results show that the synthesis rule is effective when expert opinions are relatively consistent. Therefore, experts in the manufacturing industry should be selected for the collection of expert opinions, and the consistency of expert opinions should be calculated after the collection of opinions. The evaluation indicator of consistency proposed by existing studies includes mainly the distance between evidence, similarity and credibility of evidence, similarity coefficient and support degree, conflict coefficient, etc. Conflict coefficient is used in this paper. The setting of the number of experts also needs to be considered when collecting opinions, but at present, there are very few studies on the accurate quantitative relationship between the setting of the number of experts and the consistency evaluation indicator. In theory, different thresholds can be set for consistency evaluation indicators according to the number of experts. When the number of experts is small, the consistency requirement is high. Consistency can be lower when there are more experts. In combination with the research results of Lu Zhengcai, Qin Zheng et al., this case takes four experts as an example and uses evidence theory to synthesize the knowledge of multiple experts as follows:
- (1)
- Define the recognition framework: four experts evaluate the degree of correlation, and all possible values are strong correlation, relatively strong correlation, medium correlation, weak correlation, and irrelevant. The value range was [0, 1] in a quantitative way, named: {irrelevant, weak correlation, medium correlation, strong correlation, strong correlation}→{0, 0.25, 0.50, 0.75, 1}.
- (2)
- Based on the original composition rules, let the conflict coefficient be:
Then,
Take the “straightening result reaches the standard” and “straightening effect” as examples. The results of membership calculations of four experts of “straightening result reaching the standard” and “straightening effect” are shown in Table 5. According to the degree of membership of Expert 1 and Expert 2 in “strong correlation (0.75)” and “strong correlation (1)”, the conflict coefficient can be calculated, and the results are shown in Table 6. In the same way, the synthesis results of Expert 1 and Expert 2 and Expert 3 are shown in Table 7, and the synthesis results of the four experts are shown in Table 8.
Table 5.
Calculation results of the membership strength relationship between “straightening result reaching the standard” and “straightening effect.”
Table 6.
Weight synthesis results.
Table 7.
Weight synthesis results.
Table 8.
Weight synthesis results.
The final composite weight is . This weight is used to express the degree of correlation between “the straightening result reaches the standard” and “the straightening effect.” According to the same method, the degree of correlation of all demand indicators and technical indicators is synthesized to form the correlation weight matrix of the house of quality.
3.3. Competitive Evaluation and Weight Calculation Method
Through market research to understand the user cluster demand information and market development, from the perspective of users in the straightening machine to meet user demand for evaluation, evaluation of the competitiveness of the relevant indicators is performed. The information collected is sorted out and summarized by using the tree graph, the competitive evaluation matrix is established, and the corresponding weight of the indicator is calculated.
According to the demand indicator, the demand competitiveness of the same type of products is evaluated. According to the adaptability of the straightening machine design to various demand indicators, the satisfaction of users and the current research technology level, the numbers 1~5 are used to indicate the current level of demand indicators and the corresponding planning quality target value, with 1 being the worst and 5 being the best. According to the demand importance in Table 2, the product characteristic values are 1.0, 1.2, and 1.5, which, respectively indicate that there are no obvious product characteristic points, average product characteristic points and outstanding product characteristic points.
Assume that represents the existing level of the straightening machine meeting the th demand indicator, represents the planned quality target value of the th demand indicator, and represents the level improvement rate. Let and represent the absolute weight and relative weight of the th demand indicator, respectively; and represent the absolute weight and relative weight of the th technical indicator; represents the importance of the ith demand indicator; represents the product characteristic value of the ith demand indicator; and represents the correlation weight coefficient between the th demand indicator and the th technical indicator. Thus, the weight of the demand indicator can be calculated according to the following formula, and the results are shown in Table 9.
Table 9.
Competitive evaluation matrix of demand indicators.
In view of the technical indicator, technical competitiveness evaluation is carried out in the same type of product, the main competitive items are fully understood, and the straightening machine technical improvement direction is determined. According to the competitive evaluation of technical indicators by experts, Numbers 1–5 are used to indicate that the technical competitiveness is from weak to strong, and the competitive evaluation matrix of technical indicators is shown in Table 10.
Table 10.
Competitive evaluation matrix of technical indicators.
3.4. Design of House of Quality
In the overall planning process of a straightening machine, it is necessary to set a specific planning target value for each technical indicator according to the development of market demand and the existing technical level to intuitively reflect the output results in the process of demand transformation. Through market research, we can fully understand the changes in user demands and combine the simulation analysis in the actual straightening process to determine the planning target value of each technical indicator. According to the above structural element analysis and related calculation results, the overall planning house of quality of the hexagonal shaft straightening machine is built, as shown in Figure 4. We further analyze the quality of houses and come to the following conclusions:
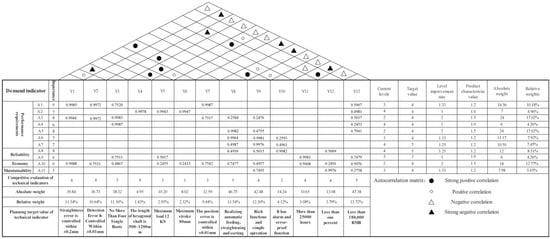
Figure 4.
Schematic diagram of house quality in overall planning of hexagonal shaft straightening machi.
- (1)
- According to the user competitiveness evaluation of the right wall of the quality house, users pay more attention to the requirements of straightening results, speed, automation and cost, and the relative weight accounts for more than 50%. Moreover, the level improvement rate and product characteristic value of these demand indicators are relatively high, which is consistent with the survey of demand importance. Combined with the current research technology level, it is difficult to meet the goals of fast straightening efficiency, up to standard results, automation and low cost. Therefore, this product needs to strengthen its market competitiveness on relevant demand indicators, focus on the market, and pay attention to the problem of meeting multiple demand indicators.
- (2)
- Through the competitive evaluation and analysis of technical indicators, the scores of technical indicators “automation” and “cost” are higher, which is consistent with the high proportion of relative weights of demand indicators “high degree of automation” and “low cost”. Second, from the autocorrelation matrix, the cost is almost related to all the demand indicators of the straightening machine, and this technical characteristic should be considered emphatically in the design process of the straightening machine. From the weight of technical indicators, “automation” and “cost” also have a relatively high weight proportion, and the high proportion of straightening results, detection accuracy and straightening times reflects the importance of hexagonal shaft straightening effect and efficiency. For technical indicators with low scores for this product, measures should be taken to improve and enhance the market competitiveness.
- (3)
- From the correlation weight matrix, there are many correlations between the “straightening result reaches standard,” “fast straightening speed,” and “low cost” and the technical indicators, which are consistent with the above analysis results. The research results show that the fusion of expert opinion consistency evaluation results is accurate and effective, which also shows that the demand indicator has a higher share in the market competitiveness analysis, and the straightening of shaft parts tends to develop in the direction of effect, efficiency and high cost performance of straightening equipment.
4. Trial Results and Discussion
4.1. Design Implementation
To meet the demand indicator in the design process, it is necessary to design the control system of the straightening machine and propose the design scheme of the hexagonal shaft straightening machine based on the results of indicator competitive evaluation and analysis.
- (1)
- Detection accuracy
Good detection accuracy is the premise to ensure that the straightening results reach the standard. When detecting the straightness of the hexagonal shaft, the displacement sensors related to the detection function are analyzed and compared, the capacitive transducer controlled by hubs is selected for detection test analysis, and the influence of sampling points and motor speed on the error of the detection results is studied to ensure the detection accuracy and stability.
- (2)
- Pressing accuracy
The loading capacity, pressing stroke and safety, reliability and life cycle of the loading elements of the loading system should be fully considered. After analyzing the integrated loading element, the electric cylinder is selected to build the loading system, the hexagonal shaft press-down straightening test is designed, and mathematical models of the press-down amount, rebound amount and initial deflection are established.
- (3)
- Automation, man-machine interaction
Through the cooperative action of controller PLC, air cylinder and motor, the process of automatic feeding, inspection, straightening, blanking and sorting, and transportation between stations of hexagonal shaft can be realized. The control system is built by using industrial computers, PLCs and industrial displays, and data processing, storage and instruction issuance are realized through interprocess communication. At the same time, a reasonable parameter-setting interface, a straightening state-monitoring interface and a user operation interface are designed to display the deflection value, fitting curve, and overall axis distribution of each measuring point in the detection stage.
The abovementioned design scheme aims only at technical indicators with high relative weights. The system design also includes the selection of components such as electric cylinders and pressure sensors, the calculation of related parameters and the design of control systems, which will not be further analyzed in this paper. However, for technical indicators with low relative weights such as “safety,” it is still necessary to fully consider monitoring every station and every link and design necessary protection measures. The workbench of the hexagonal shaft straightening machine is built as shown in Figure 5 and Figure 6.
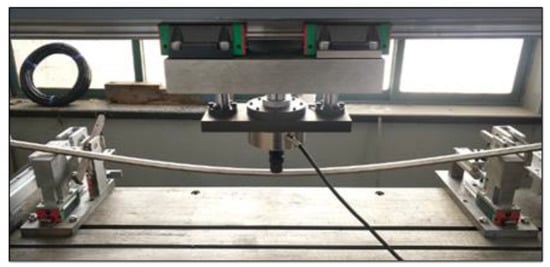
Figure 5.
Bending test.
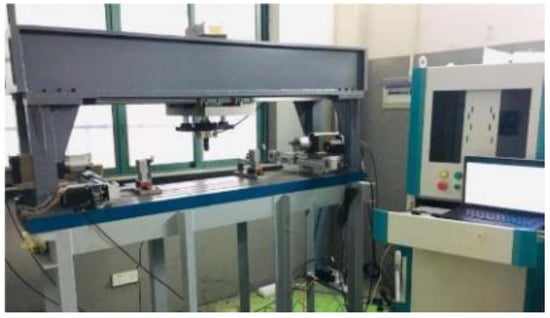
Figure 6.
Main worktable of hexagonal shaft straightening machine.
4.2. Discussion of the Results
Designing the test scheme for straightness detection. Ten hexagonal shafts with a length of 500 mm are obtained from the production site, and number them from 1 to 10, each hexagonal shaft was tested ten times, and the straightness error of each hexagonal shaft was calculated on average. Second, using the CMM (Coordinate measuring machine) to measure the straightness error of No.1~No.10 shafts for ten times and then take the average values, and take it as the reference standard. Calculating the deviation of two measurements, the final results are shown in Table 11. We can see from the data in the table, the deviation values are generally distributed within ±0.01 mm, and the average deviation of ten axes is −0.01 mm < −0.00014 mm < 0.01 mm, which meets the requirement of “detection accuracy” in the overall planning.
Table 11.
Deviation of test results.
Designing test scheme for hexagonal axis alignment. Getting ten hexagonal axes of known straightness, length is 1200 mm. First, the straightness test was carried out on ten hexagonal axes. Each axis was repeated ten times to take the average value and record the results. Second, the use of the existing straightening machine equipment to an alignment of each axis, the alignment of each axis straightness tests averaged ten repetitions, determine whether each axis straightness meet “straightening effect” in the general plans for the target demand and so on, until the six-party axis straightness satisfies the requirement of overall planning target. At the same time, the actual straightening times of each axis were recorded. The relevant test results are shown in Table 12. From the table, we can see the straightness detection value of the first measurement and the final straightness value after straightening. As Table 12 shows, the actual straightening times basically reached the technical characteristic planning goal of “no more than four times per root,” the average number of calibrations is about four, and the actual straightening time averaged two minutes in the test, meeting the demand indicator of “fast straightening speed.” In the straightening test, the actual straightening times are larger than the theoretical straightening times, which indicates that the straightening machine system has a certain error influence. In terms of straightening effect, the straightness error of ten hexagonal shafts after straightening is less than 0.2 mm, the average straightness error after straightening is 0.122 mm less than 0.2 mm, which meets the demand indicator of a “straightening result up to standard.”
Table 12.
Straightening test results.
In the test process, it can be automatically detected and straightened hexagonal shaft straightness. The operator can monitor the data processing, the deflection offset value at each sampling point, the overall shaft curve, and the shaft center distribution in real time via the industrial display during the inspection and straightening process. When necessary, parameters can be adjusted through the parameter setting interface. In summary, they meet the needs of automation and human-machine interaction. Other technical indicators that actually meet the requirements are shown in the Table 13.
Table 13.
Comparison table of technical indicators.
5. Conclusions
To address the shortcomings of the current product planning and design, such as product evaluation being influenced by subjective factors, weights not accurately reflecting the real needs of users and not intuitively representing the results of expert opinions between different indicators, this paper proposes a general planning scheme for hexagonal shaft straightening machines based on QFD and evidence theory, ensuring the scientific rationality of the product planning scheme design and further improving the user experience in the use of hexagonal shaft straightening equipment.
The combination of QFD and Kano models to obtain requirement indicators ensures the accuracy and validity of user requirement acquisition and importance evaluation, improves product design efficiency and lays the foundation for subsequent transformation into product technical characteristics. Moreover, when studying the correlation between demand indicators and technical indicators, the degree of correlation is quantified through expert opinion, and the consistency evaluation criteria of conflict coefficient is introduced, and expert opinion is fused using evidence theory to improve the accuracy of expert opinion assessment. The relevant experimental results show that the straightness of the hexagonal axis after straightening is less than or equal to 0.2 mm, which meets the requirement of “straightening result meets the standard”; the actual number of straightening is basically in line with the planning target of “no more than 4 times for a single root,” which meets the requirement of “fast straightening.” During the test, the straightening machine can automatically detect and straighten the hexagonal shaft. The operator can monitor the data calculation, deflection offset of each measurement point, the amount of straightening pressure, the amount of rebound and other parameters in the process of detection and straightening through the industrial display in real time, and modify the parameter settings when necessary. The rest of the technical indicators generally meet the requirements of the planning target values.
This paper does not analyze all the requirements and technical indicators one by one. For the indicators with lower competitive scores and smaller relative weights, further research can be carried out to improve the improvement scheme and enhance market competitiveness; when integrating expert opinions, the synthesis method for handling high conflict evidence can be optimized and improved; and the fact that the actual number of straightening times is greater than the theoretical number of straightening times indicates that there is a certain amount of error in the current straightening machine system, and a suitable error compensation model can be established to eliminate or reduce the impact of the relevant errors, which is also one of the directions of subsequent work.
Author Contributions
Data curation, Y.H.; formal analysis, J.Z.; investigation, Y.H.; methodology, J.Z. and Z.Y.; software, Y.H.; supervision, Z.Y.; writing—original draft, J.Z. All authors have read and agreed to the published version of the manuscript.
Funding
This project is supported by Basic public welfare research project of Zhejiang province (Grant No. LGG18E050008), the National Natural Science Foundation of China (Grant No. 51675481).
Institutional Review Board Statement
Not applicable.
Informed Consent Statement
Not applicable.
Data Availability Statement
The data presented in this study are available on request from corresponding author.
Conflicts of Interest
The authors declare no conflict of interest.
References
- Wang, X.H.; Yang, J.Y.; Song, H.Y.; Xu, H. The Process Research and Analysis of House of Quality in Conceptual Design of Railway Vehicle. Comput. Integr. Manuf. Syst. 2020, 37, 113–117. [Google Scholar]
- Gotzamani, K.; Georgiou, A.; Andronikidi, A.; Kamvysi, K.; Ton, V. Introducing multivariate Markov modeling within QFD to anticipate future customer preferences in product design. Int. J. Qual. Reliab. Manag. 2018, 35, 762–778. [Google Scholar] [CrossRef]
- Sivasamy, K.; Arumugam, C.; Devadasan, S.R.; Murugesh, R.; Venkatachalam, S.; Thilak, V. Prevention of water leakage in the shallow well jet pump through the application of total quality function deployment technique. Int. J. Bus. Innov. Res. 2018, 15, 381–402. [Google Scholar] [CrossRef]
- Haber, N.; Fargnoli, M.; Sakao, T. Integrating QFD for product-service systems with the Kano model and fuzzy AHP. Total Qual. Manag. Bus. Excell. 2020, 31, 929–954. [Google Scholar] [CrossRef]
- Efe, B. Analysis of operational safety risks in shipbuilding using failure mode and effect analysis approach. Ocean Eng. 2019, 187, 106214.1–106214.9. [Google Scholar] [CrossRef]
- Gündoğdu, F.K.; Kahraman, C. A novel spherical fuzzy QFD method and its application to the linear delta robot technology development. Eng. Appl. Artif. Intell. 2020, 87, 103348. [Google Scholar] [CrossRef]
- Neira-Rodado, D.; Ortíz-Barrios, M.; Hoz-Escorcia, S.; Paggetti, C.; Fratea, N. Smart Product Design Process through the Implementation of a Fuzzy Kano-AHP-DEMATEL-QFD Approach. Appl. Sci. 2020, 10, 1792. [Google Scholar] [CrossRef]
- Mistarihi, M.Z.; Okour, R.A.; Mumani, A.A. An integration of a QFD model with Fuzzy-ANP approach for determining the importance weights for engineering characteristics of the proposed wheelchair design. Appl. Soft Comput. J. 2020, 90, 106136. [Google Scholar] [CrossRef]
- Liu, X.; Gong, M.; Zhou, Z.H.; Li, B.T.; Dong, J.Y. An Efficient Mechanical Structure Reliability Analysis Method based on Evidence Theory. China Mech. Eng. 2020, 31, 2031–2037. [Google Scholar]
- Cui, Q.; Li, Y.L.; Li, Z.H. Transformer State Assessment Based on Evidence Synthesis and Cloud Model. Electrotech. Electr. 2019, 12–16, 51. [Google Scholar]
- Zhang, L.Z.; Jing, L.Y.; Xu, W.X.; Tan, J.W. A Composite Fault Diagnosis Method of Gearbox Combining with Convolution Neural Network and D-S Evidence Theory. Mech. Sci. Technol. Aerosp. Eng. 2019, 38, 1582–1588. [Google Scholar]
- Roy, D.K.; Datta, B. Saltwater intrusion prediction in coastal aquifers utilizing a weighted-average heterogeneous ensemble of prediction models based on Dempster-Shafer theory of evidence. Hydrol. Sci. J. 2020, 65, 1555–1567. [Google Scholar] [CrossRef]
- Cheng, J.T.; Xiong, Y.; Ai, L. Fault Diagnosis of Wind Turbine Gearbox Based on Neighborhood QPSO and Improved D-S Evidence Theory. Recent Pat. Comput. Sci. 2020, 13, 248–255. [Google Scholar] [CrossRef]
- Sarabi-Jamab, A.; Araabi, B.N. An information-based approach to handle various types of uncertainty in fuzzy bodies of evidence. PLoS ONE 2020, 15, e0227495. [Google Scholar] [CrossRef] [PubMed]
- Behrouz, M.; Alimohammadi, S. Uncertainty Analysis of Flood Control Measures Including Epistemic and Aleatory Uncertainties: Probability Theory and Evidence Theory. J. Hydrol. Eng. 2018, 23, 04018033.1–04018033.15. [Google Scholar] [CrossRef]
- Violante, M.G.; Vezzetti, E. Kano qualitative vs. Quantitative approaches: An assessment framework for products attributes analysis. Comput. Ind. 2017, 86, 15–25. [Google Scholar] [CrossRef]
- Dewi, D.; Rahaju, D. An Integrated QFD and Kano’s Model to Determine the Optimal Target Specification. In Proceedings of the International Conference on Industrial Engineering IEEE, Jeju, Korea, 23–26 May 2016; pp. 1–5. [Google Scholar]
- Xiong, W. Quality Function Deployment Theory and Method; Science Press: Beijing, China, 2016. [Google Scholar]
- Elleuch, H.; Dafaoui, E.; Mhamedi, A.E.; Chabchoub, H. A Quality Function Deployment approach for Production Resilience improvement in Supply Chain: Case of Agrifood Industry. IFAC Pap. 2016, 49, 125–130. [Google Scholar] [CrossRef]
- Shafer, G. A Mathematical Theory of Evidence; Princeton University Press: Princeton, NJ, USA, 1976. [Google Scholar]
- Aminravan, F.; Sadiq, R.; Hoorfar, M.; Rodriguez, M.J.; Francisque, A.; Najjaran, H. Evidential Reasoning Using Extended Fuzzy Dempster-Shafer Theory for Handling Various Facets of Information Deficiency. Int. J. Intell. Syst. 2011, 26, 731–758. [Google Scholar] [CrossRef]
- Wang, X.Y.; Fan, D.W.; Li, J. Application of KANO Model in Smart Pots Design. Mach. Des. Manuf. 2017, 36, 46–48. [Google Scholar]
- Zhou, J.; Yu, Z.H.; Hou, Z. Fuzzy cognitive maps and evidence theory based research on quality control decision-making mode. Syst. Eng. Theory Pract. 2016, 36, 1288–1296. [Google Scholar]
Publisher’s Note: MDPI stays neutral with regard to jurisdictional claims in published maps and institutional affiliations. |
© 2021 by the authors. Licensee MDPI, Basel, Switzerland. This article is an open access article distributed under the terms and conditions of the Creative Commons Attribution (CC BY) license (https://creativecommons.org/licenses/by/4.0/).