Article

Universal Approach for DEM Parameters Calibration of Bulk Materials

1
Department of Mineral Processing, Automation of Technological Processes and Production, St. Petersburg Mining University, 199106 St. Petersburg, Russia
2
ESSS Rocky DEM, Florianopolis 88032-700, Brazil
*
Author to whom correspondence should be addressed.
Symmetry 2021, 13(6), 1088; https://doi.org/10.3390/sym13061088
Submission received: 14 May 2021 / Revised: 14 June 2021 / Accepted: 16 June 2021 / Published: 18 June 2021

Abstract

:
DEM parameters calibration is the most important step in preparing a DEM model. At the same time, the lack of a universal approach to DEM parameters calibration complicates this process. The paper presents the author’s approach to creating a universal calibration approach based on the physical meaning of the friction coefficients and conducting symmetrical experiments at full scale and in a simulation, as well as the implementation of the approach in the form of a physical test rig. Several experiments were carried out to determine the DEM parameters of six material–boundary pairs. The resulting parameters were adjusted using a refinement experiment. The results confirmed the adequacy of the developed approach, as well as its applicability in various conditions. The limitations of both the approach itself and its specific implementation in the form of a test rig were identified.

1. Introduction

The discrete element method is the most popular approach for computer modeling of bulk materials’ behavior. The corresponding software that implements DEM in the user graphic interface is a highly effective tool for optimizing mining equipment. Lately, DEM has often been used in conjunction with CFD and other methods, which opens up the possibility of calculating complex multiphase processes [1,2,3,4,5].
A number of input parameters in DEM software directly represent material properties (shape and size of particles, density, etc.). Friction coefficients (Table 1) have a direct physical representation; however, in DEM software these parameters are integrated into DEM codes of contact models and may affect the behavior of bulk materials in different ways, that is, they are code dependent [6,7]. Since the values of the friction coefficients (DEM parameters) significantly affect the behavior of bulk materials, in order to build an adequate model, they have to be calibrated [8,9,10].
Many researchers offer their approaches and solutions for the DEM parameters calibration. The whole set of existing calibration methods can be divided into two groups: the bulk calibration approach (BCA) and the direct measuring approach (DMA) [11]. A collaborative approach is also often used. In BCA, a laboratory experiment is performed first (for example, measuring the angle of repose and flow time from the funnel). For the material under study, the density, Young’s modulus, Poisson’s ratio, and particle-size distribution are measured in advance. The shape of the particles can be simplified (e.g., to a sphere) and the size increased to speed up the calculation. In this case, specific simplifications depend on the conditions for the further use of the obtained DEM parameters’ value for modeling technological processes. Then, in the DEM software, the simulation parameters are set, and laboratory experiments are repeated in the model with varying DEM parameters. The parameters can be obtained both iteratively or using various optimization algorithms. The target is the minimum difference between the measured material properties (e.g., angle of repose) in the laboratory experiment and the simulation [12,13,14,15]. In the case of DMA, each parameter is measured separately using known techniques. Most often, BCA and DMA are combined to achieve the most adequate bulk material behavior in the model [16,17,18,19,20].
The main problems for creating a universal DEM parameters calibration approach are:
  • Code dependence (depending on DEM software and contact model).
  • A possibility for several sets of DEM parameters to provide similar bulk responses in the simulation.
  • The need to significantly simplify the model (including the shape and size of particles) to speed up the calculation. Thus, the use of calibrated values of DEM parameters is limited, as well as their dependence on a specific application (technological process).
  • Imperfection and inaccuracy of modern measuring tools (including visual estimation of the bulk material responses using machine vision).
Nevertheless, a number of researchers have proposed approaches that can be called universal with a number of limitations [21,22,23]. Many studies are aimed at reducing the number of simulations required to achieve the desired result using optimization algorithms or at obtaining a unique set of calibrated DEM parameters either by introducing special criteria or by estimating all the possible factors that affect the bulk responses [24,25]. In this case, BCA is applied, which indicates a possible loss of the physical meaning of the obtained DEM parameters. The question also arises whether the obtained set of parameters is unique, that is, the bulk responses values are achieved only with this set of DEM parameters values.
The article describes the developed author’s approach and a test rig for the bulk materials’ DEM parameters calibration. The approach is based on the transfer of the friction coefficients’ physical meaning into the measurement of bulk materials macro parameters using a high-speed camera and the calibration of the obtained DEM parameters set based on a refinement experiment.

2. Materials and Methods

The developed approach is a result of the research conducted by the authors since 2017. Approaches to using the BCA method directly using the design of the experiment were considered [26]. One way or another, this approach did not solve the main problems given in the introduction. In the course of the research, the relationship between the physical meaning of the friction coefficients and DEM parameters was confirmed.
The physical meaning of these coefficients is as follows:
  • For static friction (SF), this is the slope (tangent of the repose angle) at which the particle begins to slide over the surface (Figure 1a):
S F = tg ( )
where —angle of shelf incline.
  • For dynamic friction, the value is determined by the sliding time on a surface with a certain angle of repose (Figure 1a):
D F = tg ( ) ( 2 S g t 2 cos ( ) )
where —angle of shelf incline, S —distance of particle slide movement, t —time of sliding, g —gravity acceleration.
  • For the coefficient of restitution, the value is determined by the angles and velocities of rupture and reflection (Figure 1b):
C o R = cos ( β r e f l e c t i o n ) V r e f l e c t i o n cos ( β r u p t u r e ) V r u p t u r e
The dynamic friction coefficient can be determined by the sliding time of the material along the inclined shelf. The coefficient of restitution can be determined by conducting experiments on the collision of particles with a vertical shelf [27,28,29]. Based on the physical meaning of the static friction coefficient, it can be determined by the angle of inclination of the shelf. A series of numerical experiments were carried out. In the first version, similar to [30], a box (without bottom) with particles was placed on a shelf, after which the shelf was slowly raised and the angle at which the box began to slide on the shelf was fixed. The second version involved the use of a counterweight for a box with particles standing on a horizontal plane. The counterweight force was slowly increased, and the force at which the box began to slide along the plane was recorded. However, the experiments carried out in the simulations did not show a correlation between SFPP, SFPB, and the angle of inclination of the shelf, as well as the force of the counterweight.
The approach was designed in such a way as to neutralize the main problems described in the introduction. For this, when developing, the authors started from the physical meaning of the coefficients, but transferring the meaning from a single particle to a portion of the investigated bulk material. It is possible to preserve the physical meaning of the calibrated DEM parameters, as well as reduce the number of possible parameter sets or even get a unique set. However, the approach has to include the determination of bulk material responses similar to the BCA method because of the problems with determining SF according to the physical meaning. This makes it possible to keep the methodology flexible and applicable to various DEM software and contact models.
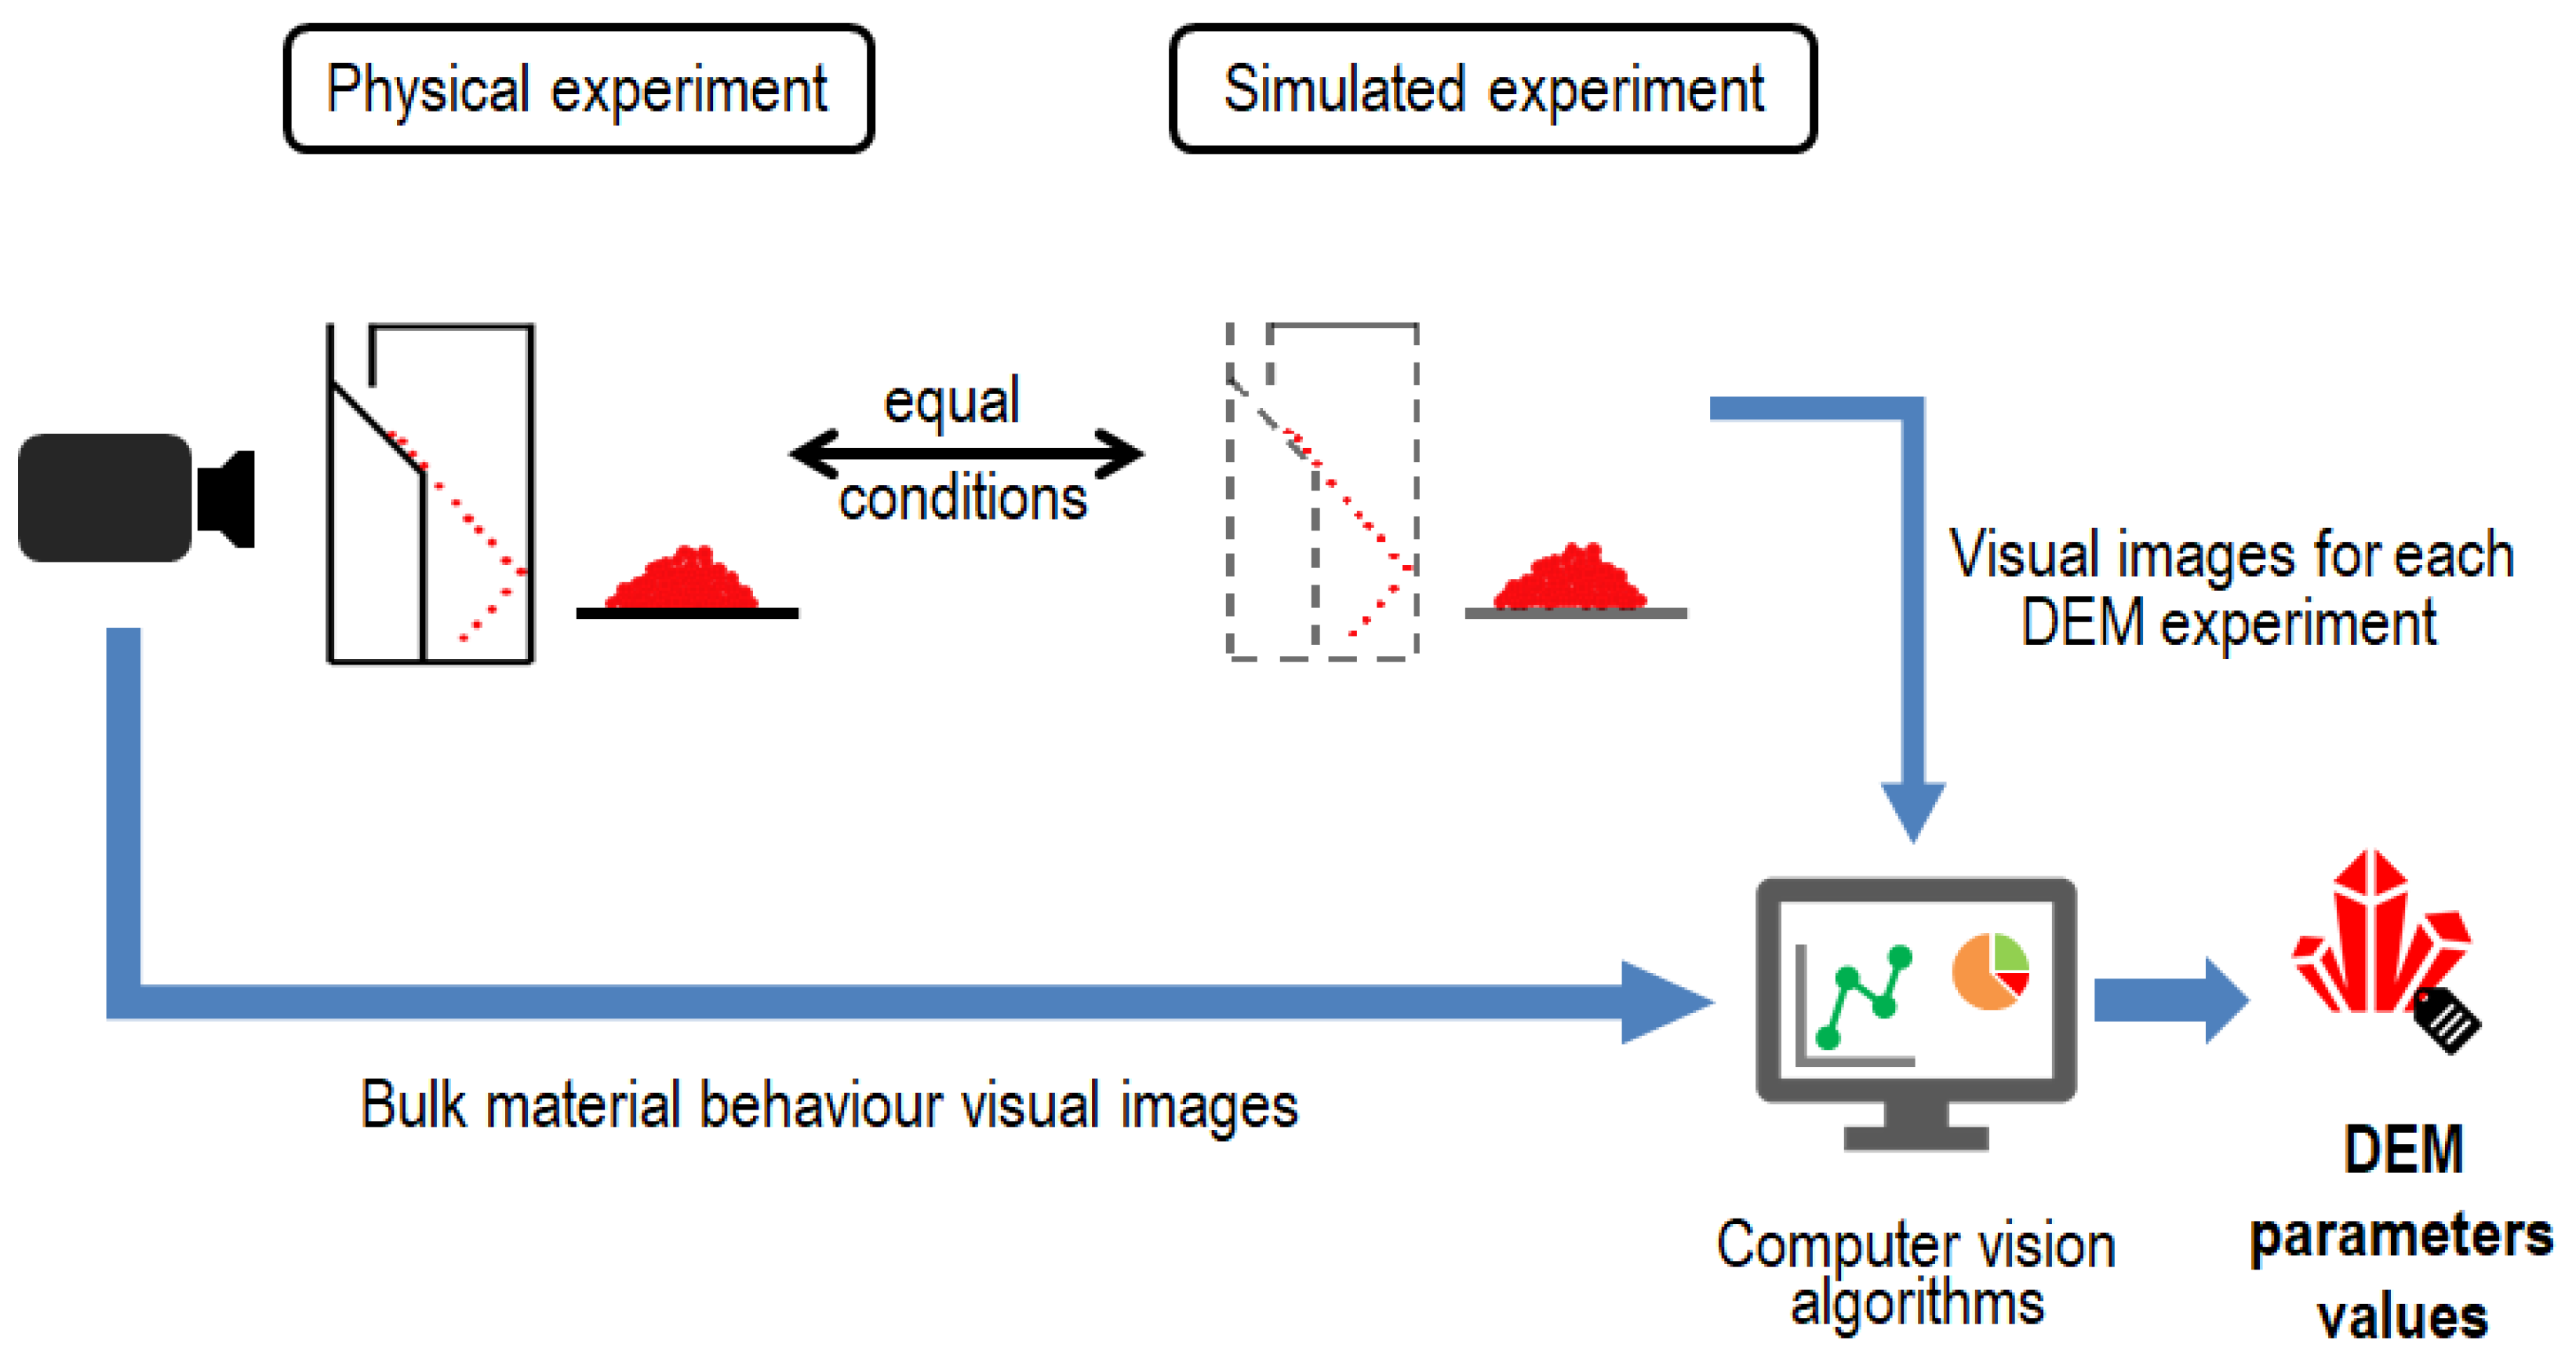
The developed approach scheme is shown in Figure 2. For the investigated bulk material Young’s modulus, Poisson’s ratio, and particle size distribution are determined using well-known techniques [31,32,33,34,35]. A certain amount of material (portion) is poured into the developed test rig, and then its rheological properties are studied. The flow of the portion is recorded with a pre-installed high-speed camera. After that, the recording from the camera is sent to the computing device. A video processing algorithm developed using machine vision is used; values and parameters characterizing the rheology of the material are recorded. For DF coefficients, these parameters are flow times along the inclined shelves (Equation (1)); for CoR, these are angles and velocities of rupture and reflection (Equation (2)) [36]. Then, the experiments are repeated in the DEM software within the same conditions, but a series of numerical experiments are carried out, where the DEM parameters vary in a given range. For each experiment, an animation is recorded and then processed using similar machine vision algorithms. The experiments in the simulation are symmetrical to the full-scale experiments. A functional relationship is built between the parameters obtained from the simulations and DEM parameters. The obtained function depends on the particle size distribution and particle shape of the material, as well as on the applied contact model and its specific implementation in the DEM software. This means that the input data must be determined in advance. As a result, the obtained dependence is substituted with the values from a full-scale experiment, which makes it possible to obtain specific values of DEM parameters. In this case, the obtained values require clarification; therefore, the repose angle and the flow time are additionally measured. Then, in DEM software, DEM parameters are iteratively varied in a narrow range, which results in fairly accurate results of DEM parameters values.
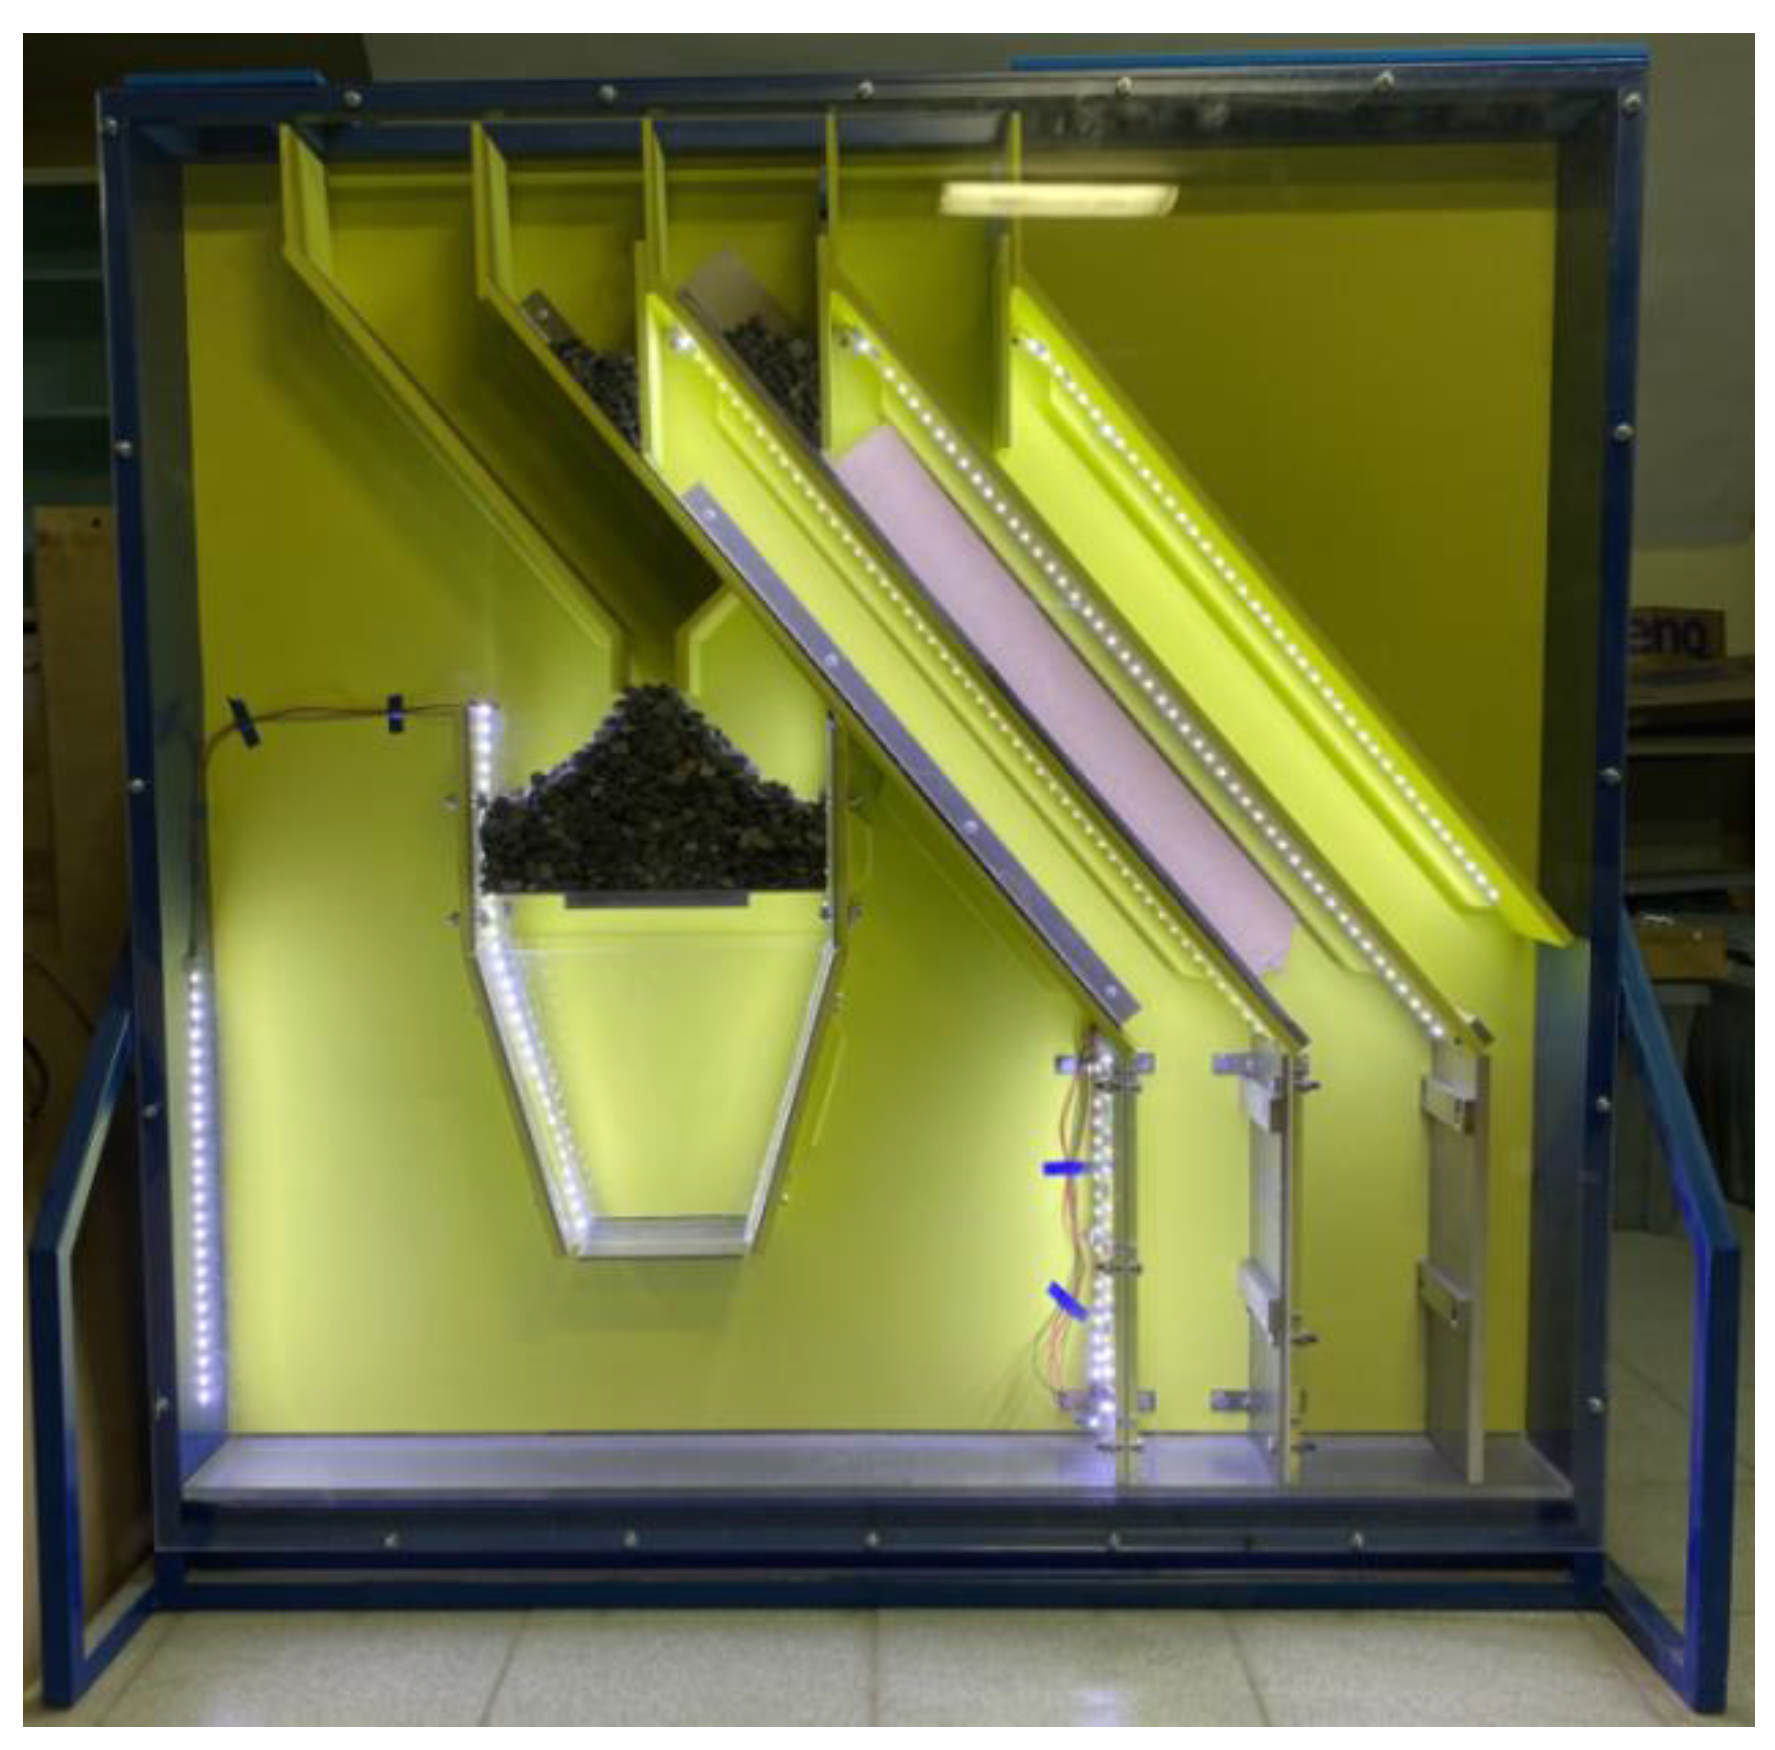
The test rig at the current stage of research is shown in Figure 3. The test rig has the shape of a rectangular parallelepiped measuring 1 × 1.5 × 0.13 m with inclined shelves located inside, vertical partitions 1–2, bins for loading bulk material, and a funnel-shaped device for testing the angle of rupture and repose, as well as a system of dampers for controlling the flow of materials.
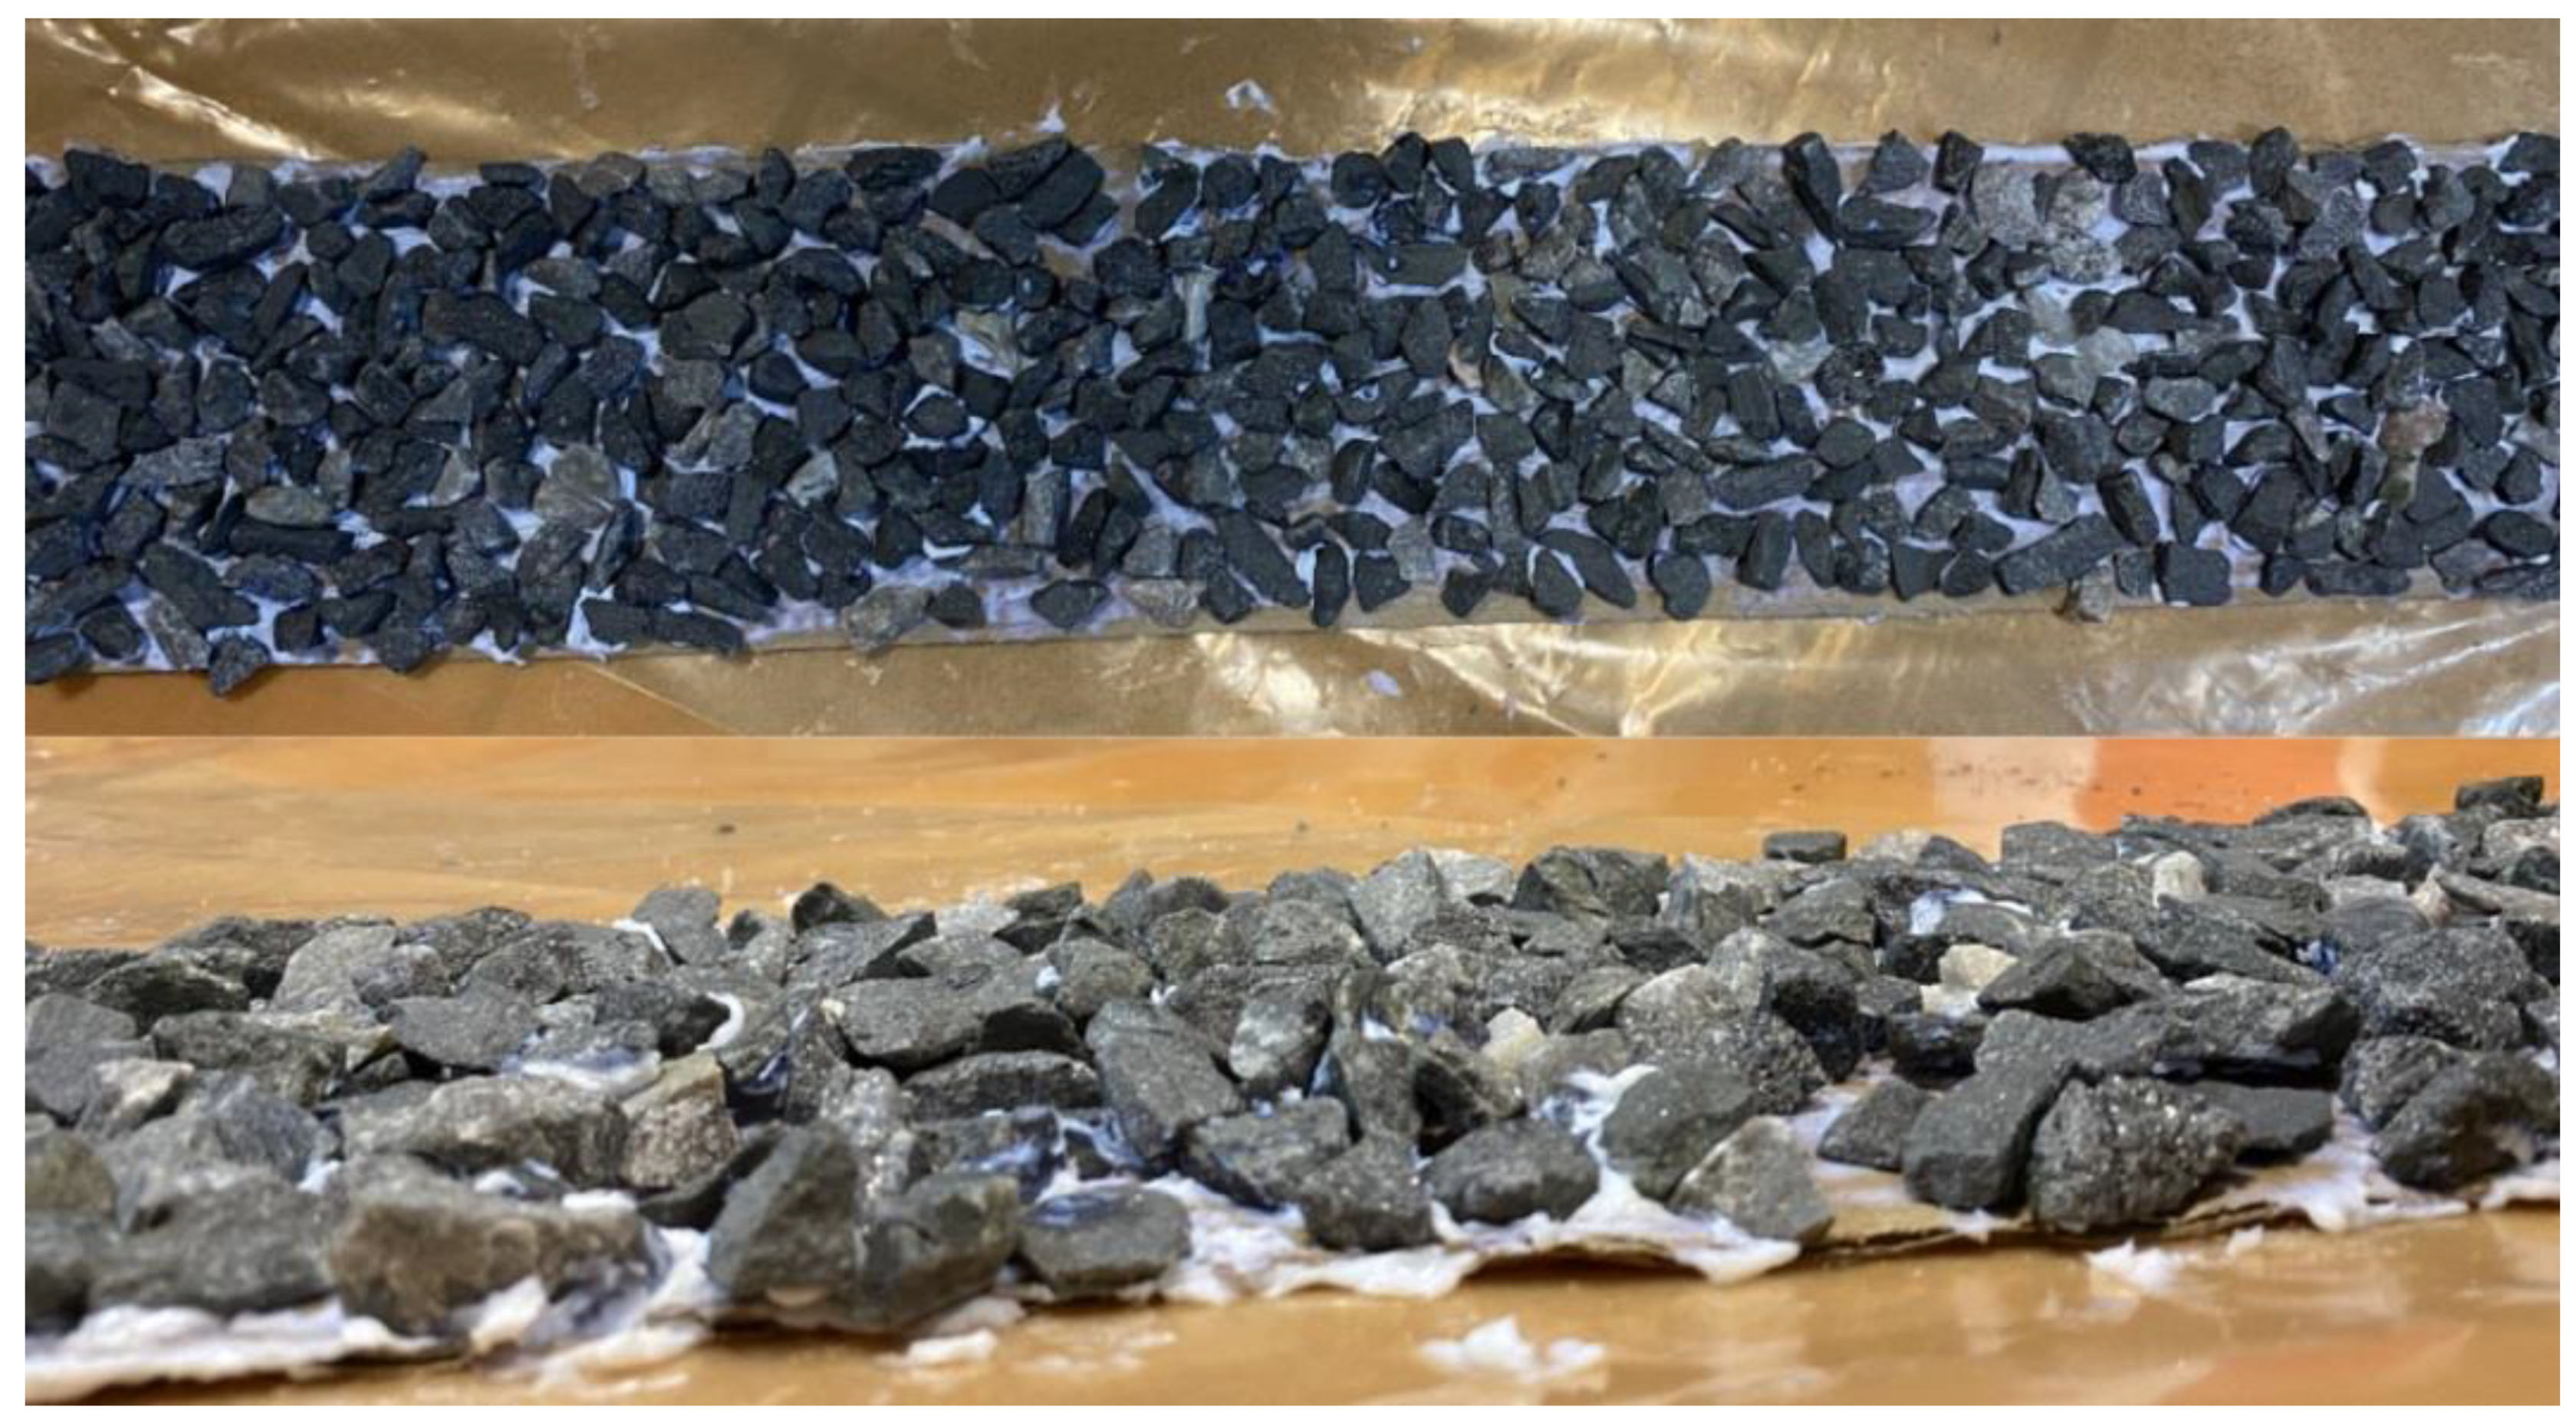
The flow of the material portion in the test rig occurs under the gravity force and is regulated by mechanical extraction of the partitions 1–2. Determination of CoRPP and DFPP requires the preparation of shelf 3 with a uniformly poured bulk material under study. The bulk material is poured into an adhesive (for example, epoxy resin, liquid nails, ceramic glue). Particles of bulk material are mechanically embedded in the adhesive. After a while, the substance solidifies and, as a result, a shelf is formed of particles of the bulk material under study. The control of the uniformity of the formation of the shelf is carried out visually. Figure 4 shows an analogue of the shelf used in the simulations.
After the completion of the preliminary preparation of the test rig, the material portions are divided into weighed portions for each type of testing. At the beginning of the experiment, portions of the investigated bulk material of the same mass are poured into the upper hoppers. The weight of the samples is determined using a laboratory balance and is about 700 g with an error of no more than 0.5 g. After mechanical removal (of the dampers 2), the bulk material begins to slide along shelves 3 and 4, which is fixed by the algorithm as the beginning of the experiment. Shelves are angled at 40 degrees with a sliding path of 800 mm. This makes it possible to visually distinguish bulk materials with different dynamic coefficients of friction. At the end of the flow of material from each shelf, the algorithm separately fixes the moment in time and calculates the flow time. The experiment is repeated several times. The results are converted to DFPP and DFPB, respectively.
The full-scale experiment continues, but the shelf with particles 3 and 4 moves to position 5, as a result of which the flow from the shelf ends with the collision of particles with walls 5 and 6. CoRPP and CoRPB parameters are determined using equation:
C o R = k cos ( β r e f l ) V r e f l cos ( β r u p t ) V r u p t
where β r e f l , β r u p t angles of reflection and rupture of bulk material flow, V r e f l , V r u p t the speed of reflection and rupture at the point of impact, k—coefficient that depends on the specifics of the experiment and is taken into account at the stage of refinement of the initially obtained values (by default k = 1) [34].
As a refinement experiment for the investigated bulk material, the angles of repose and rupture are determined using device 7. Bulk material is poured into the upper part. After that, partition 8 is pulled out and the angle of rupture is fixed. Then, partition 9 is pulled out, and the material is poured onto the lower shelf of the test rig. As a result, the repose angle and time of flow from the funnel are recorded.
The computer vision system is implemented using LabVIEW software tools. The image from the camera is taken in perspective. Using the reference points on the test rig, the image is projected onto a vertical plane. The original image (Figure 5a) then goes through several stages. It is first filtered and binarized using image thresholding (Figure 5b), then reconstructed using morphological image processing (Figure 5c). Further, depending on the task, there is a search for geometric primitives, or the hit of particles in the region of interest (ROI) is recorded. For example, when determining the angle of the repose (Figure 5d), the boundaries of the object are determined, after which a geometric primitive is built—a triangle. The resulting left and right angles of the triangle are averaged. To determine the flow time, the first entry of particles into the ROI is recorded next to shelves 3 and 4. It is recommended to use a camera with a speed of at least 100 frames per second.

3. Results

As an example of the work of the developed approach, a series of experiments were carried out. For this, three different types of metal steels with different degrees of surface roughness were used as the boundary material. Iron ore and waste rock were used as bulk materials in the experiments. The task was to obtain DEM parameters for two bulk materials and three steels (six boundary–material pairs). Physical implementation of the developed test rig is shown in Figure 6.

3.1. Experiment Setup

Before the start of the experiments, according to the developed methodology, shelves with particles fixed with glue were prepared for ore and waste rock (Figure 7).
In addition, a DEM model was prepared for simulations in Rocky DEM software. The parameters of bulk materials and model are presented in Table 2.
For simplicity, the particles are represented in the model as a 10-sided polyhedron (Figure 8).

3.2. Determining DFPB and DFPP

The first step is to determine the dynamic coefficient of friction. For this, for each boundary–material pair, experiments were carried out to determine the time of sliding on an inclined shelf. Each experiment was performed three times. The measurement results are presented in the Table 3.
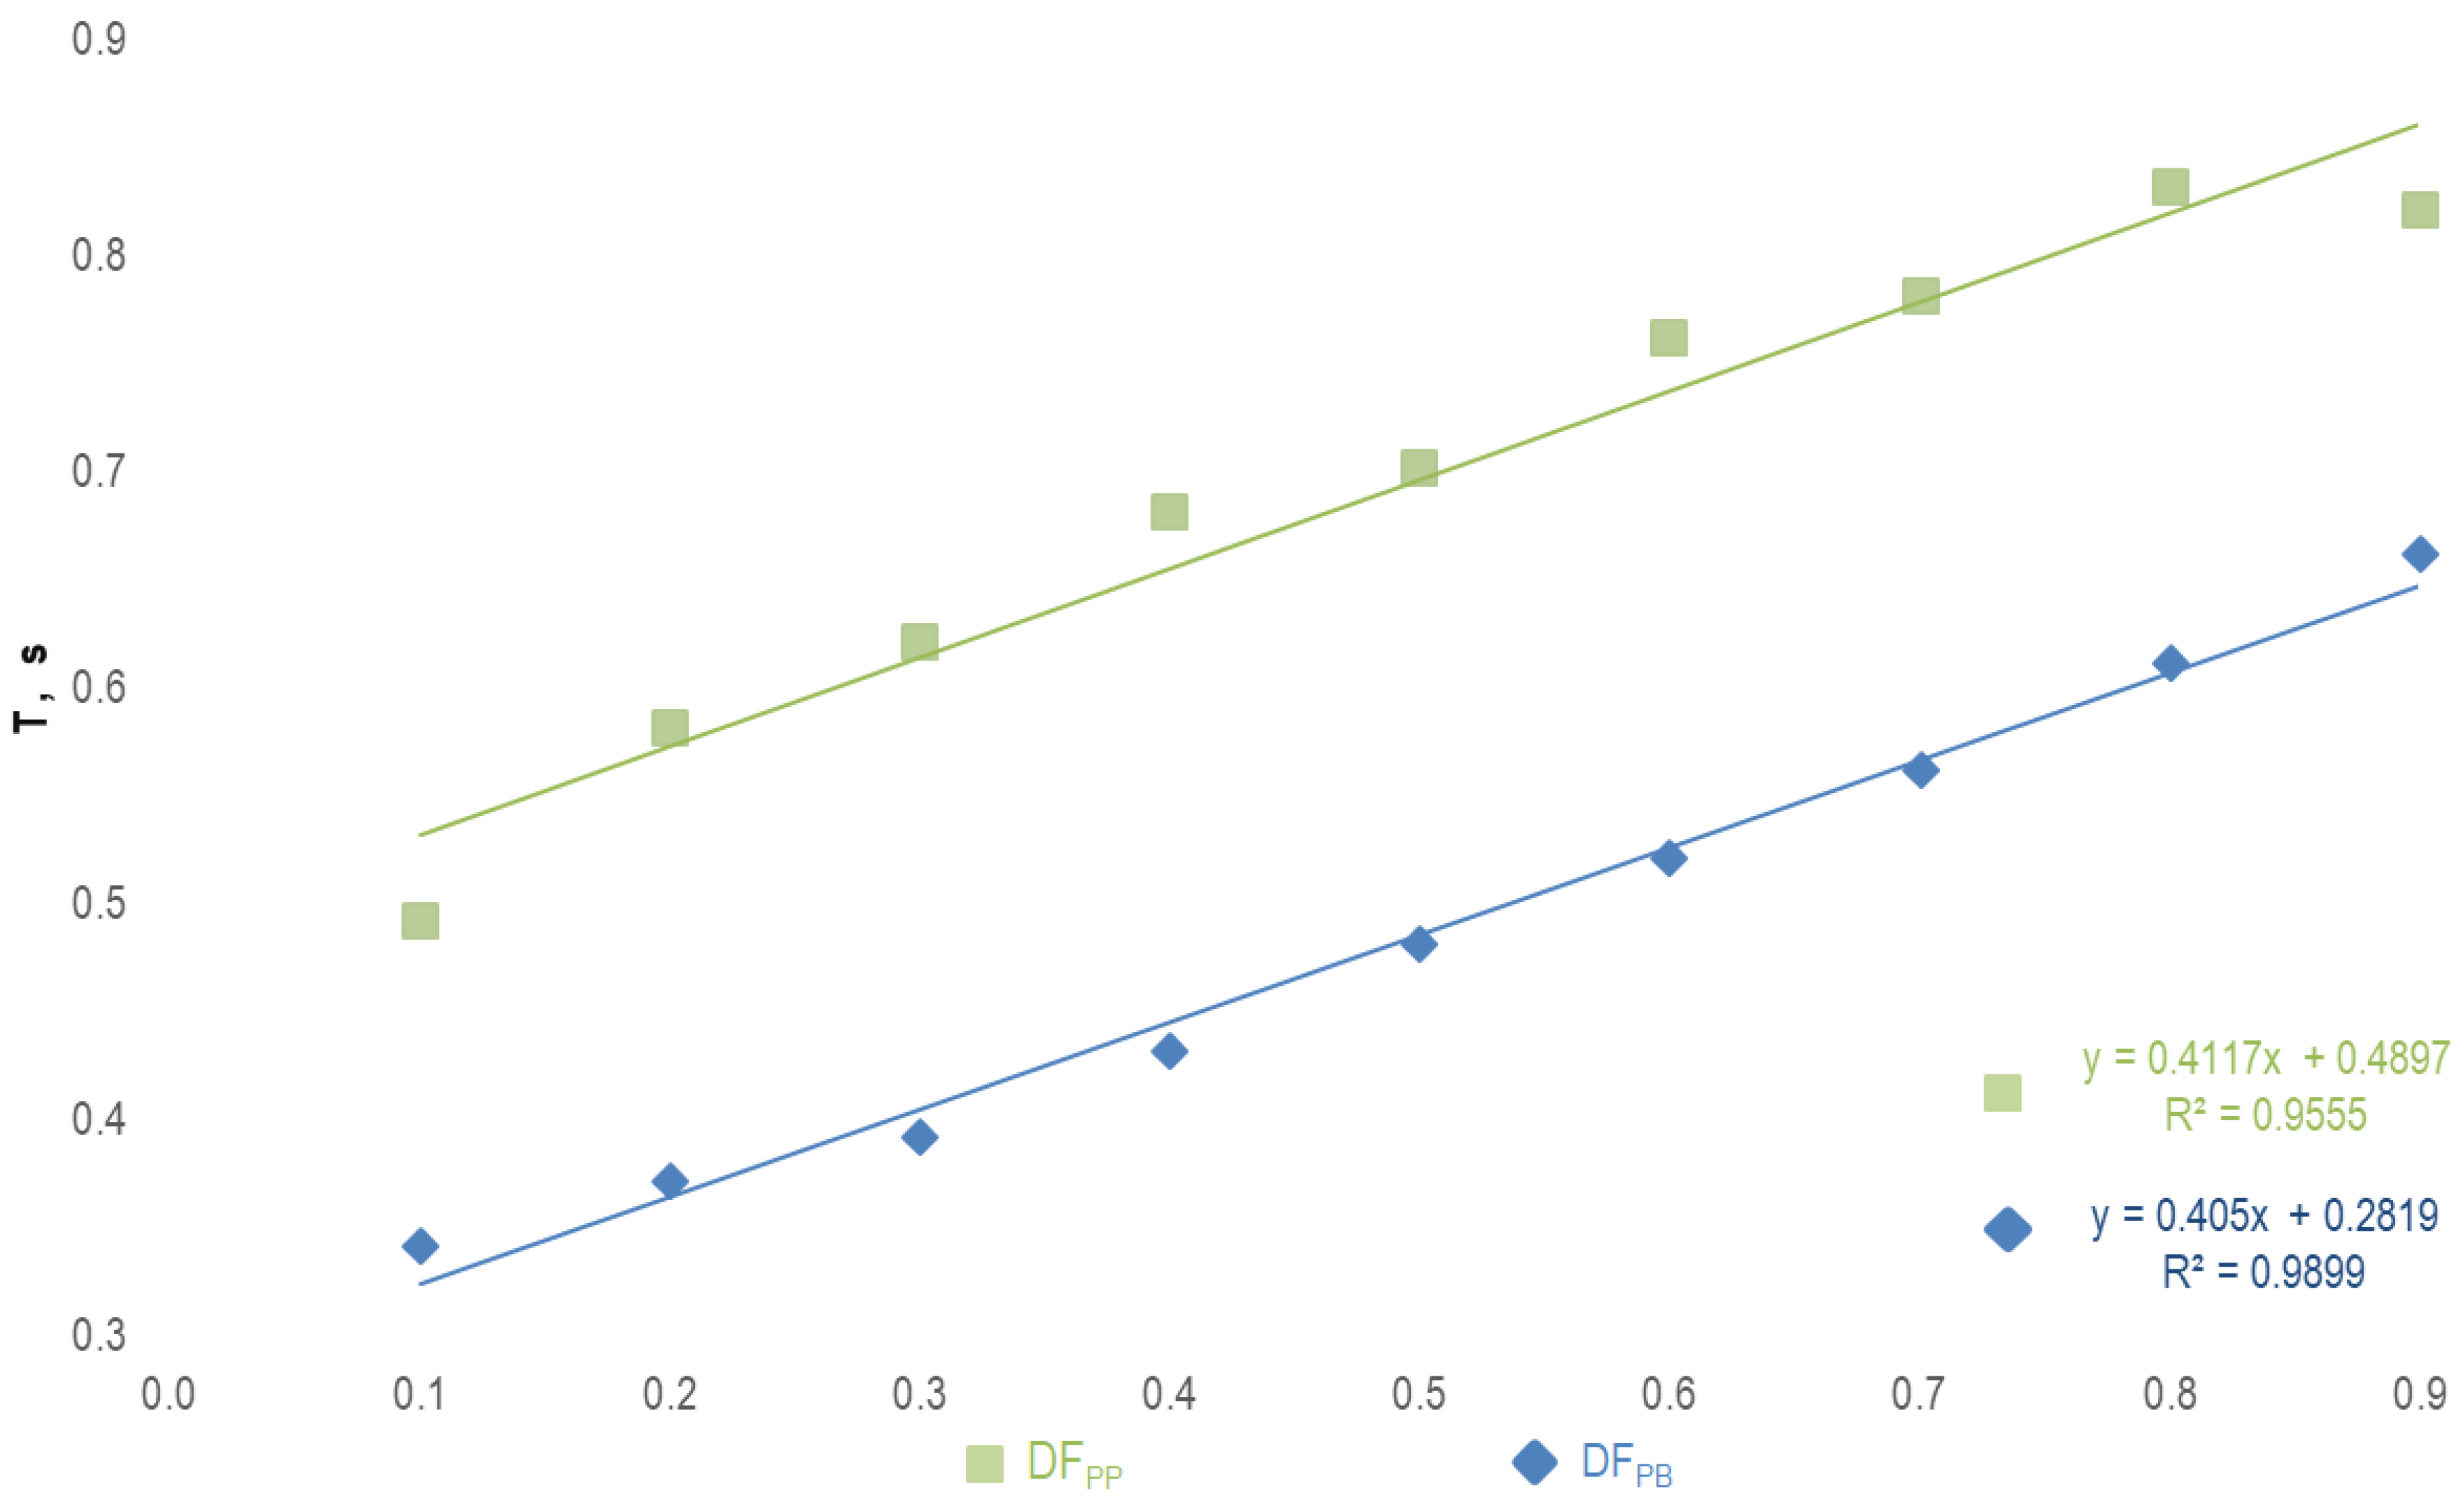
Next, a series of simulations were carried out in Rocky DEM. The DFPB and DFPP coefficients varied from 0.1 to 0.9 with a step of 0.1. The flow time was recorded for each experiment. According to the data, functional dependence was built (Figure 9).
From the obtained dependences, the DF coefficients were evaluated, presented in Table 4. Figure 10 shows an example of a visual comparison of a full-scale experiment with an ore–steel 1 pair and simulation with a DFPB value of 0.3. Visually, it is noticeable that the flow time is almost identical. Moreover, according to the obtained dependence, the value of the coefficient for this pair is 0.29.

3.3. Determining CoRPB and CoRPP

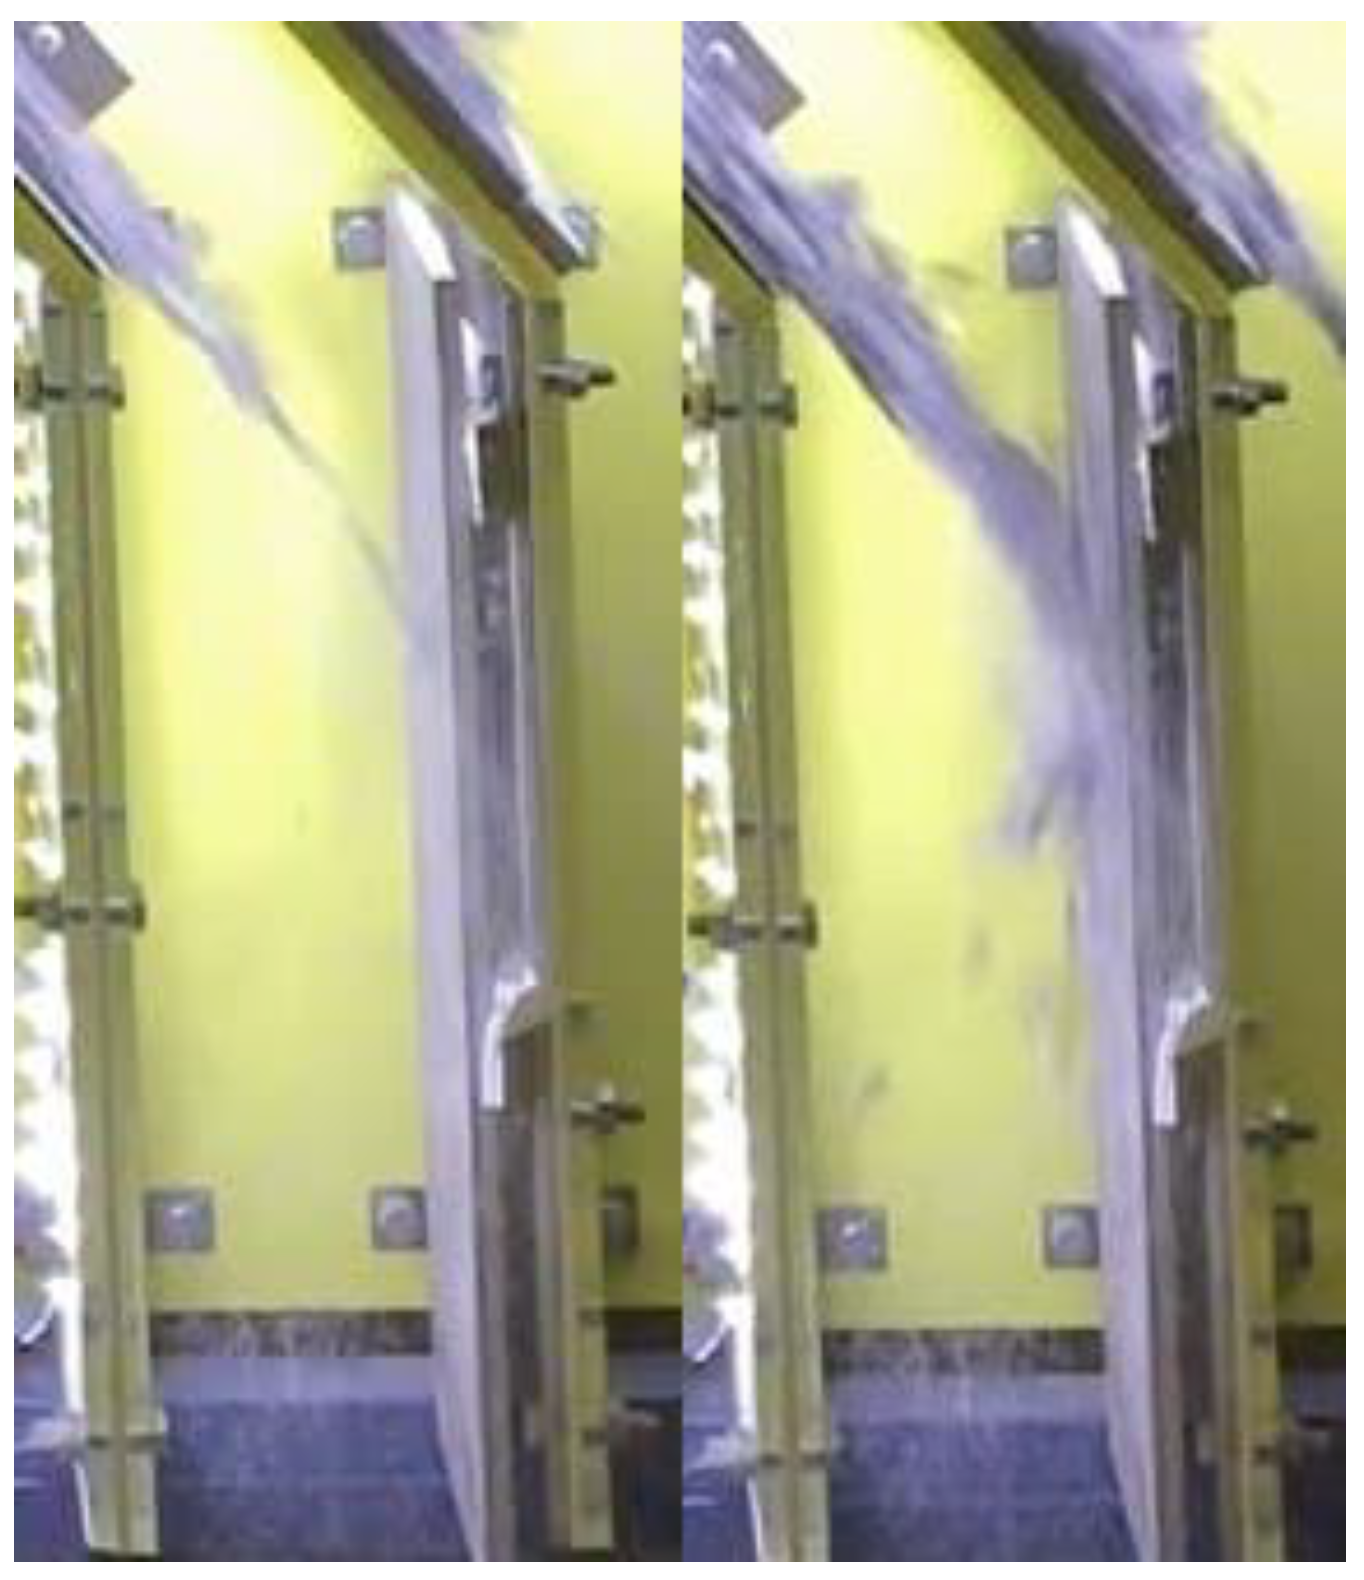
After the DF coefficients have been obtained for all pairs, it is possible to proceed with the CoR coefficient determination. For this, the shelves (steel) are mounted vertically. The angles of rupture and reflection, as well as the velocities before and after the collision of particles with the shelves, were determined by software algorithms of the computer vision system and recalculated into the values of the CoRPP and CoRPB coefficients according to Equation (4). Simultaneously, numerical experiments were carried out with varying CoR coefficients in the range from 0.1 to 0.9. Similarly, the values obtained by Equation (4) made it possible to refine the values of the coefficients obtained in full-scale experiments (coefficient k in formula 4). Figure 11 shows an example of a collision in a full-scale experiment.
Based on the results, four coefficients were obtained for all pairs. The results are presented in Table 4.

3.4. Determining SFPB and SFPP. Refinement of Results

The SFPB and SFPP coefficients are selected iteratively during the simulations of material flow from the funnel and the formation of rupture and repose angles using the bisection method. This takes into account the fact that SF < DF in most of the use cases. In addition, an error is included in the values of the coefficients in Table 4. Full-scale experiments were carried out to determine bulk responses for ore and waste rock. After that, a series of numerical experiments was launched, in which DFPB and DFPP were varied in the range of obtained value ± 0.05, SFPB in [0.1; DFPB], and SFPP in [0.1; DFPP]. The specified maximum tolerance was no more than four degrees or 10% of the obtained value in a full-scale experiment. The obtained values of the repose angles in full-scale experiments and in the model after calibration are presented in Table 5.
Based on the results of the refinement experiment, the values of the DEM parameters were recalculated. The calibrated values are presented in Table 6.
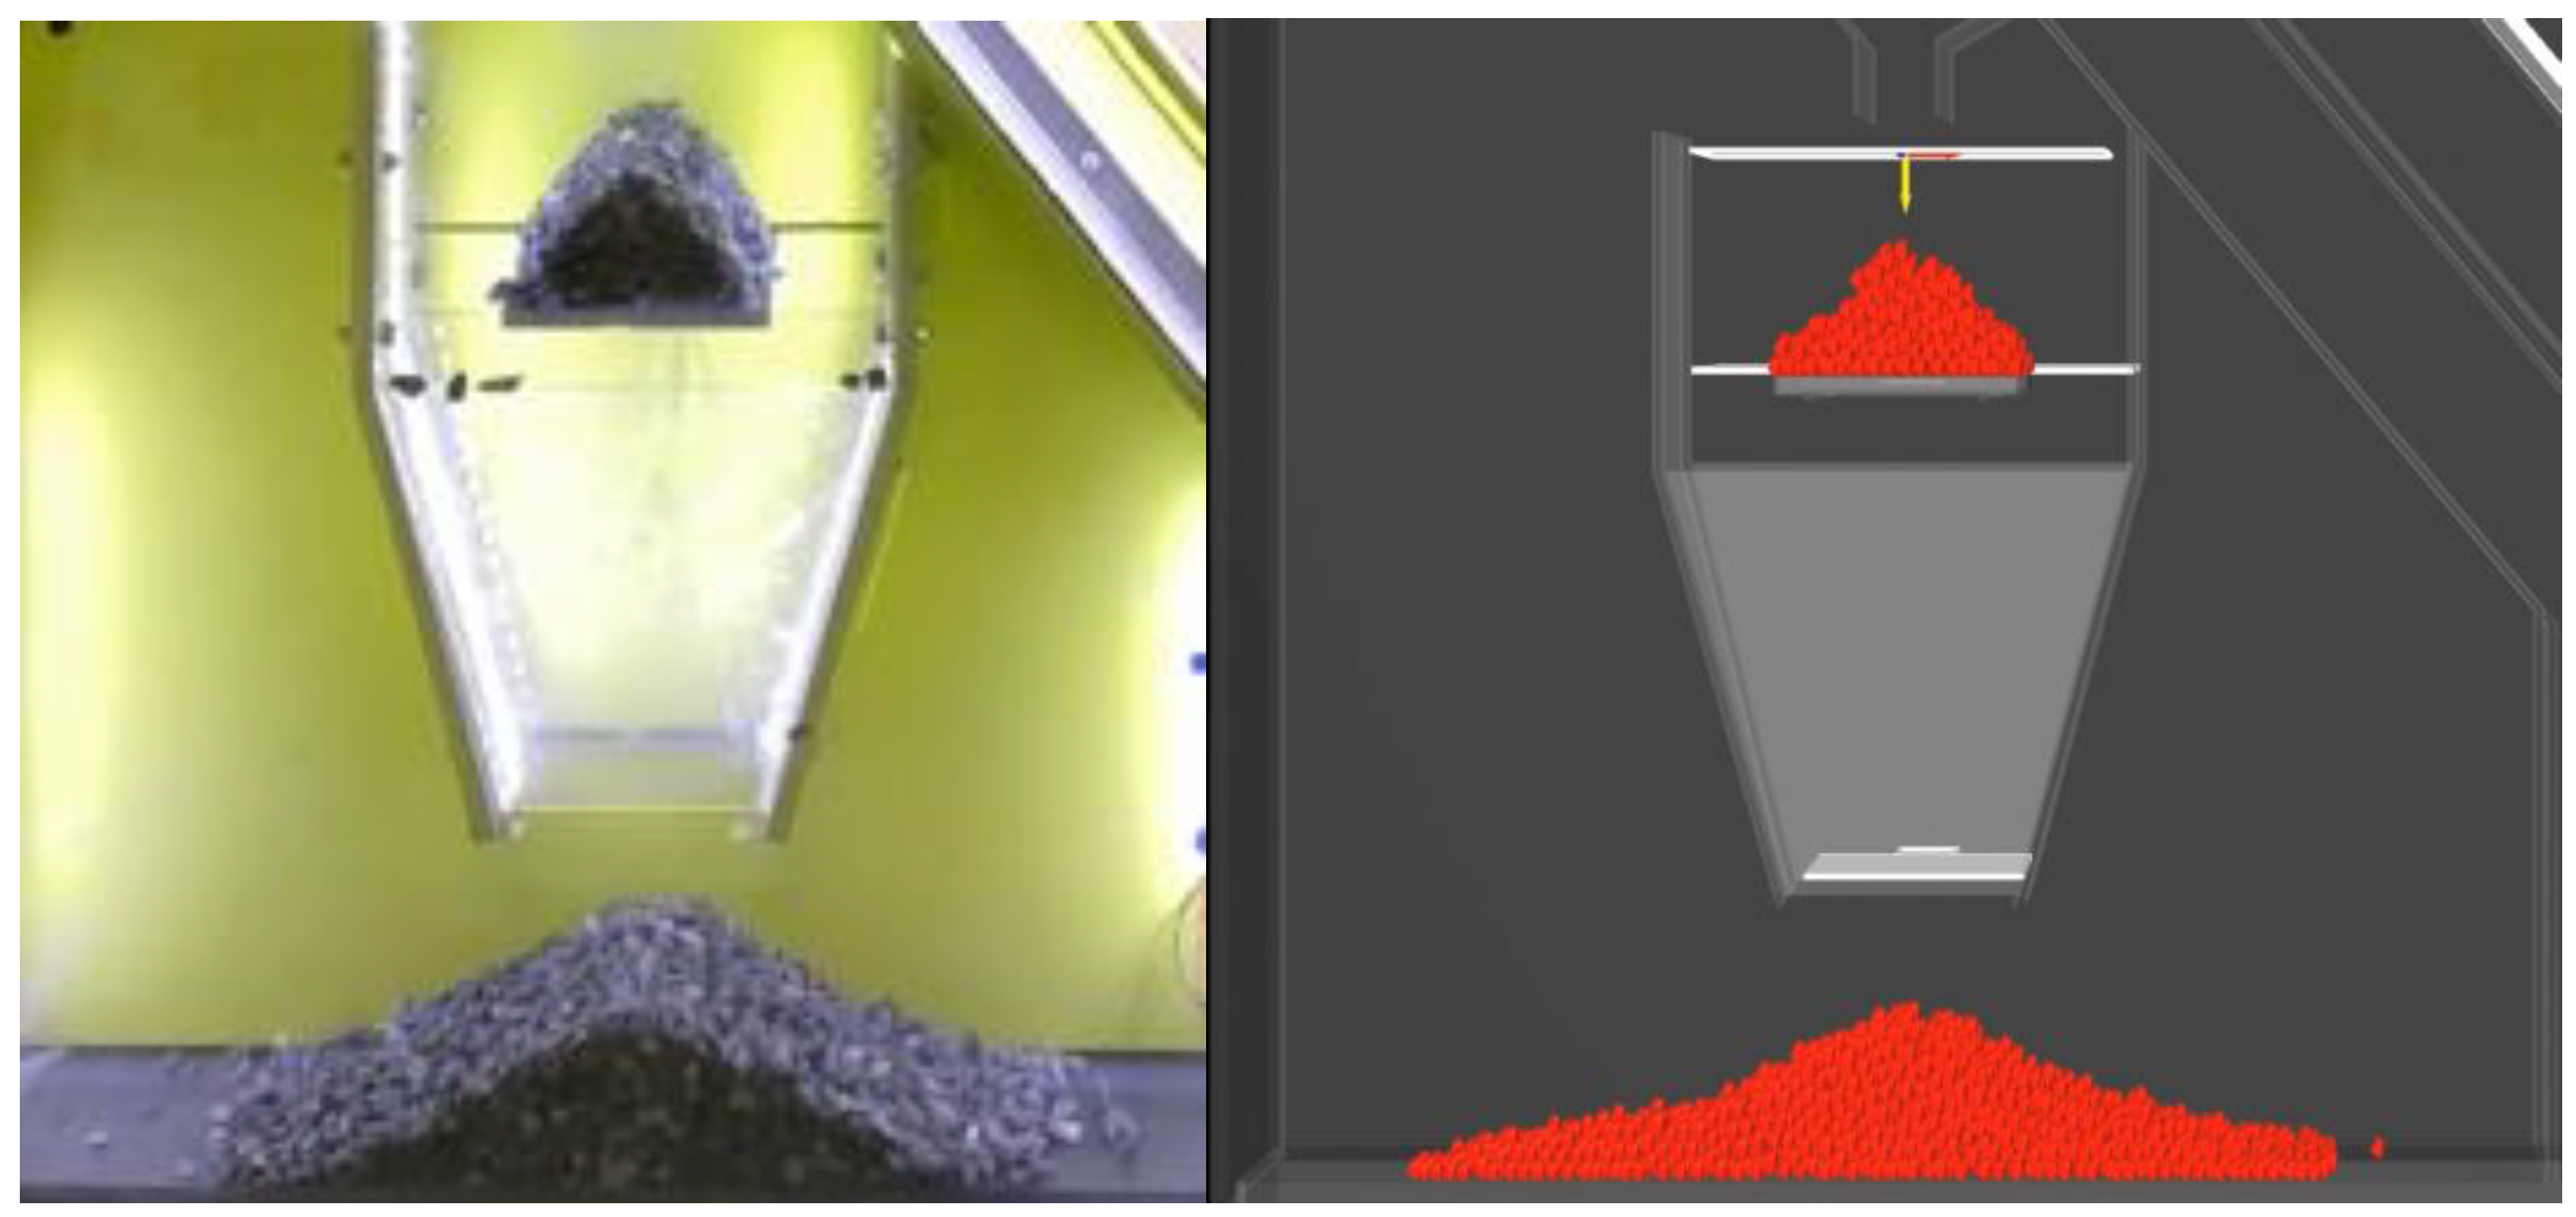
An example of an original image obtained from a video camera in a full-scale experiment, and the result obtained in a calibrated model, are presented in Figure 12.

4. Discussion

The developed approach was combined. Four coefficients (DFPB, DFPP, CoRPB, and CoRPP) were determined by methods based on their physical meanings. However, then, the SF coefficients were determined using a refinement test with the determination of the macro parameters of the bulk material, where the values of other coefficients vary within a narrow range. This made it possible to obtain a unique combination of DEM parameters that do not lose their physical meaning and adequately reproduce the behavior of bulk material in the DEM model.
The obtained results shown in Table 4 make it possible to judge that with different surface roughness, DFPB parameters obtained using the developed approach have regular differences. Thus, steel 1 and steel 2 have almost the same roughness (steel 2 is slightly larger), and steel 3 has a much higher roughness. At the same time, DFPB for steel 3–ore and steel 3–waste rock pairs is higher than for other pairs. The DF coefficients obtained after the refinement experiment (Table 5) did not change compared to the initial ones (Table 4). This was due to the fact that the regression algorithm in the refinement experiment achieved the desired result immediately after the selection of the SF parameters. With a higher required accuracy, the DF coefficients could change in the range of obtained value ± 0.05. In general, possible differences in the values of the parameters before and after the refinement experiment are associated with the inaccuracy of the motion measurement using a video camera, as well as the image processing algorithms.
Although the approach was developed for the study of absolutely any bulk materials, the specific implementation of the approach in the form of a physical test rig has a number of limitations. These limitations arise due to the specific design features and the capabilities and accuracy of the measuring devices. First, the test rig is designed for particles no larger than 15 mm. In the opposite case, material sticking can form in narrow places of the test rig, as well as possible errors in the representation of macro parameters (for example, the angle of rupture in the refinement tests). At the same time, materials with particles more than 15 mm can be crushed to the required size, and experiments can be carried out on a test rig. For this, it is necessary that the shape of the particles in the initial and final forms is the same. That is, for particles with specific shapes (ball, cube, etc.), this option is not suitable. It is also recommended to examine materials with particles of at least 1 mm in size. On the one hand, particles can seep through the slits in the structure; on the other hand, a low-resolution video camera may not detect their movement (in particular, this concerns image processing algorithms). Secondly, the image processing algorithms require refinement in order to improve the accuracy of the unambiguousness of the results obtained. It is planned to consider other algorithms for determining the repose angle of bulk material and improve the accuracy of determining the flow time.
In general, the calculation time for all simulations was about 4 h on 10 cores of the average processor in the Rocky DEM. With several GPUs, calculations can be significantly sped up. This means that the calibration of DEM parameters could be a relatively quick and easy process.

5. Conclusions

This paper describes the author’s approach to determining and calibrating the DEM parameters of a wide range of bulk materials. Features of the approach are identification of each DEM parameter accordingly to its physical meaning and conducting symmetrical experiments in full-scale and simulation. The approach itself can be applied to any bulk material. The test rig developed as an implementation of the methodology includes several sections, where each section is responsible for determining a specific DEM parameter. The use of a refinement test for the rupture and repose angles ensures that the material with the obtained unique set of DEM parameters adequately reproduces the material rheology in the DEM model. The presence of restrictions on the size and shape of particles impose specific features of the test rig design, as well as cameras for recording material movement. However, the test rig has wide applicability in various industries, from mining and metallurgy to pharmaceutical.
It is planned to further develop the project and conduct additional tests of other particle–material pairs in order to identify weaknesses in the test rig design and the approach as a whole. Other possible implementations of the approach will also be considered. The introduction and use of the approach and the test rig in the modeling of specific technological processes will increase the adequacy of the behavior of the material in the DEM models and simplify the solution of engineering problems using the discrete elements method software.

Author Contributions

Formal analysis, R.S.; Project administration, A.B.; Software, V.P.; Supervision, A.P. All authors have read and agreed to the published version of the manuscript.

Funding

This research received no external funding.

Institutional Review Board Statement

Not applicable.

Informed Consent Statement

Not applicable.

Acknowledgments

We would like to thank CADFEM CIS and personally Andrey Feoktistov for informational support, ideas, and assistance in work on this project.

Conflicts of Interest

The authors declare no conflict of interest.

References

  1. Sizyakov, V.M.; Vlasov, A.A.; Bazhin, V.Y. Strategic tasks of Russian metallurgical complex. Tsvetnye Met. 2016, 32–38. [Google Scholar] [CrossRef]
  2. Gospodarikov, A.P.; Vykhodtsev, Y.N.; Zatsepin, M.A. Mathematical modeling of seismic explosion waves impact on rock mass with a working. J. Min. Inst. 2017, 226, 405–411. [Google Scholar]
  3. Koteleva, N.; Frenkel, I. Digital Processing of Seismic Data from Open-Pit Mining Blasts. Appl. Sci. 2021, 11, 383. [Google Scholar] [CrossRef]
  4. Iakovleva, E.; Belova, M.; Soares, A. Allocation of potentially environmentally hazardous sections on pipelines. Geosciences 2021, 11, 1–11. [Google Scholar]
  5. Klyuev, R.; Bosikov, I.; Gavrina, O.; Madaeva, M.; Sokolov, A. Improving the energy efficiency of technological equipment at mining enterprises. Adv. Intell. Syst. Comput. 2021, 1258, 262–271. [Google Scholar]
  6. Kalala, J.T.; Breetzke, M.; Moys, M.H. Study of the influence of liner wear on the load behaviour of an industrial dry tumbling mill using the Discrete Element Method (DEM). Int. J. Miner. Process. 2008, 86, 33–39. [Google Scholar] [CrossRef]
  7. Wu, C.Y. DEM simulations of die filling during pharmaceutical tabletting. Particuology 2008, 6, 412–418. [Google Scholar] [CrossRef]
  8. Ye, F.; Wheeler, C.; Chen, B.; Hu, J.; Chen, K.; Chen, W. Calibration and verification of DEM parameters for dynamic particle flow conditions using a backpropagation neural network. Adv. Powder Technol. 2019, 30, 292–301. [Google Scholar] [CrossRef]
  9. Zhukovskiy, Y.L.; Suslikov, P.K.; Arapova, E.G.; Alieva, L.Z. Digital platform as a means of process optimization of integrating electric vehicles into electric power networks. J. Phys. Conf. Ser. 2020, 1661, 012162. [Google Scholar] [CrossRef]
  10. Yan, Z.; Wilkinson, S.K.; Stitt, E.H.; Marigo, M. Discrete element modelling (DEM) input parameters: Understanding their impact on model predictions using statistical analysis. Comput. Part. Mech. 2015, 2, 283–299. [Google Scholar] [CrossRef] [Green Version]
  11. Coetzee, C.J. Calibration of the discrete element method and the effect of particle shape. Powder Technol. 2016, 297, 50–70. [Google Scholar] [CrossRef]
  12. Westbrink, F.; Elbel, A.; Schwung, A.; Ding, S. Optimization of DEM Parameters using Multi-Objective Reinforcement Learning. Powder Technol. 2021, 309, 602–616. [Google Scholar] [CrossRef]
  13. Gröger, T.; André, K. On the numerical calibration of discrete element models for the simulation of bulk solids. Comput. Aided Chem. Eng. 2006, 21, 533–538. [Google Scholar]
  14. Do, H.Q.; Aragón, A.M.; Schott, D.L. A calibration framework for discrete element model parameters using genetic algorithms. Adv. Powder Technol. 2018, 29, 1393–1403. [Google Scholar] [CrossRef]
  15. Asaf, Z.; Rubinstein, D.; Shmulevich, I. Determination of discrete element model parameters required for soil tillage. Soil Tillage Res. 2007, 92, 227–242. [Google Scholar] [CrossRef]
  16. Zhao, S.; Zhou, X.; Liu, W. Discrete element simulations of direct shear tests with particle angularity effect. Granul. Matter 2015, 17, 793–806. [Google Scholar] [CrossRef]
  17. Turkia, S.; Wilke, D.; Pizette, P.; Govender, N.; Abriak, N. Benefits of virtual calibration for discrete element parameter estimation from bulk experiments. Granul. Matter 2019, 21, 110. [Google Scholar] [CrossRef]
  18. Frankowski, P.; Morgeneyer, M. Calibration and validation of DEM rolling and sliding friction coefficients in angle of repose and shear measurements. AIP Conf. Proc. 2013, 1542, 851–854. [Google Scholar]
  19. Zhou, H.; Hu, Z.; Chen, J.; Lv, X.; Xie, N. Calibration of DEM models for irregular particles based on experimental design method and bulk experiments. Powder Technol. 2018, 332, 210–223. [Google Scholar] [CrossRef]
  20. Ghodki, B.M.; Patel, M.; Namdeo, R.; Carpenter, G. Calibration of discrete element model parameters: Soybeans. Comput. Part. Mech. 2019, 6, 3–10. [Google Scholar] [CrossRef]
  21. Rackl, M.; Hanley, K.J. A methodical calibration procedure for discrete element models. Powder Technol. 2017, 307, 73–83. [Google Scholar] [CrossRef] [Green Version]
  22. Al-Hashemi, H.M.B.; Al-Amoudi, O.S.B. A review on the angle of repose of granular materials. Powder Technol. 2018, 330, 397–417. [Google Scholar] [CrossRef]
  23. Malone, K.F.; Xu, B.H. Determination of contact parameters for discrete element method simulations of granular systems. Particuology 2008, 6, 521–528. [Google Scholar] [CrossRef]
  24. El-Kassem, B.; Salloum, N.; Brinz, T.; Heider, Y.; Markert, B. A multivariate regression parametric study on DEM input parameters of free-flowing and cohesive powders with experimental data-based validation. Comput. Part. Mech. 2020, 8, 87–111. [Google Scholar] [CrossRef] [Green Version]
  25. Roessler, T.; Richter, C.; Katterfeld, A.; Will, F. Development of a standard calibration procedure for the DEM parameters of cohesionless bulk materials—Part I: Solving the problem of ambiguous parameter combinations. Powder Technol. 2019, 343, 803–812. [Google Scholar] [CrossRef]
  26. Boikov, A.V.; Savelev, R.V.; Payor, V.A. DEM Calibration Approach: Design of experiment. J. Phys. Conf. Ser. 2018, 1015, 032017. [Google Scholar] [CrossRef]
  27. Wang, L. Experimental determination of parameter effects on the coefficient of restitution of differently shaped maize in three-dimensions. Powder Technol. 2015, 284, 187–194. [Google Scholar] [CrossRef]
  28. Hlosta, J.; Žurovec, D.; Rozbroj, J.; Ramírez-Gómez, Á.; Nečas, J.; Zegzulka, J. Experimental determination of particle–particle restitution coefficient via double pendulum method. Chem. Eng. Res. Des. 2018, 135, 222–233. [Google Scholar] [CrossRef]
  29. Imre, B.; Räbsamen, S.; Springman, S.M. A coefficient of restitution of rock materials. Comput. Geosci. 2008, 34, 339–350. [Google Scholar] [CrossRef]
  30. Google Patents. Available online: https://patents.google.com/patent/RU168916U1/ru (accessed on 15 April 2021).
  31. Beloglazov, I.I.; Petrov, P.A.; Bazhin, V.Y. The concept of digital twins for tech operator training simulator design for mining and processing industry. Eurasian Min. 2020, 2020, 50–54. [Google Scholar] [CrossRef]
  32. Grigorev, M.B.; Tananykhin, D.S.; Poroshin, M.A. Sand management approach for a field with high viscosity oil. J. Appl. Eng. Sci. 2020, 18, 64–69. [Google Scholar] [CrossRef] [Green Version]
  33. Morenov, V.; Leusheva, E. Influence of the solid phase’s fractional composition on the filtration characteristics of the drilling mud. Int. J. Eng. Trans. B Appl. 2019, 32, 794–798. [Google Scholar]
  34. Beloglazov, I.I.; Stepanyan, A.S.; Feoktistov, A.Y.; Yusupov, G.A. Disintegration process modeling for a jaw crusher with complex jaws swing. Obogashchenie Rud 2018, 2, 3–8. [Google Scholar] [CrossRef]
  35. Koteleva, N.; Buslaev, G.; Valnev, V.; Kunshin, A. Augmented reality system and maintenance of oil pumps. Int. J. Eng. Trans. B Appl. 2020, 33, 1620–1628. [Google Scholar]
  36. Vasilyeva, N.V.; Erokhina, O.O. Post-impact recovery coefficient calibration in DEM modeling of granular materials. Obogashchenie Rud 2020, 2020, 42–48. [Google Scholar] [CrossRef]
Figure 1. Coefficients measurement schemes; (a) measurement scheme for DF and SF; (b) measurement scheme for CoR.
Symmetry 13 01088 g001
Figure 2. Scheme of the proposed DEM parameters calibration approach.
Symmetry 13 01088 g002
Figure 3. Design of the test rig (model). 1,2—vertical partitions, 3—shelf for DFPP, 4—shelf for DFPB, 5, 6—collision walls, 7—discharge hopper, 8—upper partition (for angle of rupture), 9—lower partition (for angle of repose).
Symmetry 13 01088 g003
Figure 4. Shelf with particles used in the simulations.
Symmetry 13 01088 g004
Figure 5. Image processing algorithm example for angle of repose; (a)–original image; (b)–binarized image; (c)–morphological processing applied; (d)–final result.
Symmetry 13 01088 g005
Figure 6. General view of the test rig physical implementation.
Symmetry 13 01088 g006
Figure 7. Shelf with ore particles in a full-scale experiment.
Symmetry 13 01088 g007
Figure 8. Particles shape used in the simulations.
Symmetry 13 01088 g008
Figure 9. Dependence between flow time (T, s) and DF parameters in simulations.
Symmetry 13 01088 g009
Figure 10. Comparison of simulation and full-scale experiment particles sliding at the same time.
Symmetry 13 01088 g010
Figure 11. Collision in a full-scale experiment. Original image.
Symmetry 13 01088 g011
Figure 12. An example of a full-scale experiment and a simulation. Refinement experiment. Original images.
Symmetry 13 01088 g012
Table 1. DEM parameters of bulk materials.
Particle–Particle, PPParticle–Boundary, PB
Dynamic Friction (DF)DFPPDFPB
Static Friction (SF)SFPPSFPB
Coefficient of Restitution (CoR)CoRPPCoRPB
Table 2. DEM parameters of bulk materials.
ParameterOreWaste RockBoundary (Steel)
Poisson’s ratio0.30.3
Young modulus, kPa1062.95 × 106
Density, kg/m3312027007700
Shape10-sided polyhedron-
Particle size, mm distribution100% 9.5—12.5-
Contact modelNonlinear Hertz–Mindlin
Gravity acceleration, m/s29.81
Table 3. Results of full-scale experiments to determine dynamic friction based on the flow time.
OreFlow Time, s
Material/ExperimentIIIIIIAverage
Steel 10.450.470.490.47
Steel 20.470.450.460.46
Steel 30.560.470.430.49
Particle–particle0.540.60.570.57
Waste RockFlow Time, s
Material/ExperimentIIIIIIAverage
Steel 10.450.430.420.43
Steel 20.460.480.470.47
Steel 30.470.470.500.48
Particle–particle0.590.560.520.56
Table 4. Summary values of calculated friction coefficients.
OreSteel 1Steel 2Steel 3
DFPB-0.460.440.51
DFPP0.20---
CoRPB-0.290.310.35
CoRPP0.35---
Waste RockSteel 1Steel 2Steel 3
DFPB-0.370.460.49
DFPP0.16---
CoRPB-0.270.280.31
CoRPP0.19---
Table 5. Obtained values of the repose and rupture angles.
Angle of ReposeAngle of Rupture
SimulationExperimentSimulationExperiment
Ore30284441
Waste Rock34354238
Table 6. Calibrated DEM parameters.
OreSteel 1Steel 2Steel 3
SFPB-0.330.320.35
SFPP0.26---
DFPB-0.460.440.51
DFPP0.20---
CoRPB-0.290.310.35
CoRPP0.35---
Waste RockSteel 1Steel 2Steel 3
SFPB-0.310.320.33
SFPP0.32---
DFPB-0.370.460.49
DFPP0.16---
CoRPB-0.270.280.31
CoRPP0.19---
Publisher’s Note: MDPI stays neutral with regard to jurisdictional claims in published maps and institutional affiliations.