Abstract
HIV-2 protease (PR2) is a homodimer targeted by drugs in the treatment of HIV-2 infections. This dimer is often considered symmetric. However, exploration of crystallographic structures showed that the two chains of PR2 exhibit different conformations. This study presents the first analysis of the structural asymmetry of PR2 induced by its intrinsic flexibility. We followed the structural asymmetry of PR2 throughout a molecular dynamics (MD) simulation of 1 microsecond. To do so, we quantified the global and local structural asymmetries of 1001 structures extracted from the MD simulation using the root mean square deviation (RMSD) between the two chains in each structure. We then analyzed the links between global and local asymmetry and PR2 flexibility. Our results showed that the global asymmetry of PR2 evolves over time and that it is not explained by the asymmetry of only one region of PR2. We noted that the most flexible regions of PR2 are the most asymmetric regions, revealing that the structural asymmetry of a region is induced by its intrinsic flexibility. Using multivariate analysis methods, we identified six asymmetric profiles varying from structures exhibiting weak asymmetry to structures with extreme asymmetry in at least eight different regions. The analysis of transitions between the different profiles in the MD simulation showed that two consecutive structures often exhibit similar asymmetric profiles, revealing small deformations. To conclude, this study provides insights which help to better understand PR2’s structure, dynamics, and deformations.
1. Introduction
Protease (PR) is an important target for the treatment of HIV-1 and HIV-2 infections because of its central role in the maturation of the virus [1]. Indeed, it carries out the proteolytic cleavage of different peptide precursors, which allows the production of both structural and functional proteins that are necessary and indispensable for the formation of new viruses. Currently, nine protease inhibitors (PIs) are recommended by the FDA (Food and Drug Administration) to fight HIV-1 and HIV-2 infections. All these drugs have been developed against HIV-1, and only three are effective against HIV-2 (DRV, lopinavir, and saquinavir) [2]. It is therefore important to better characterize the structural features of HIV-2 PR (PR2), as this protein has not been as thoroughly studied as HIV-1 protease (PR1).
PR2 is a homodimer with 99 residues per chains. Each monomer consists of nine -strands and one -helix that assemble via non-covalent bonds. The three-dimensional (3D) structure of PR2 is classically partitioned into 13 structural and functional regions defined by Sadiq and Fabritiis [3] (Figure 1). The catalytic-site region, which contains the active site of PR, is bordered by two loops (one on each monomer) named the wall region. Along with the N-terminal (nter) and C-terminal (cter) regions, the catalytic-site region constitutes the interface between the two chains. The two flap regions consist of two -strands forming an antiparallel -sheet. In the monomer, the flap region is bordered by the elbow and cantilever regions. The elbow region is a loop accessible to the solvent and is the most variable regions of PR2 [4]. The cantilever and fulcrum regions are -sheets containing two strands each. The last structural region is the -helix. The other four regions, named r1, r2, r3, and r4, correspond to loops connecting the structural or functional regions.

Figure 1.
The 3D structure of PR2 colored according to the 13 regions: the nter region (1–4) is colored in forest green, the r1 region (5–9) in blue, the fulcrum region (10–23) in green, the catalytic-site region (24–30) in purple, the r2 region (31–36) in marine blue, the elbow region (37–42) in magenta, the flap region (43–58) in cyan, the cantilever region (59–75) in yellow, the r3 region (76–79) in gray, the wall region (80–83) in orange, the r4 region (84–86) in dark yellow, the -helix region (87–95) in red, and the cter region in pink (96–99).
The binding site of PR2 is at the interface between the two monomers and is contains the catalytic site, and flap and wall regions. The floor of the binding site exhibits a well-defined conformation that establishes many conserved interactions with different PIs [4]. This conservation seems to be maintained by some residues in the -helix, flap, and r4 regions [4]. The left side and the binding-site entrance establish specific interactions with different classes of PIs. These regions, which deform in response to PI binding, seem important for the PI recognition and specificity [4]. When PR is not complexed with a ligand, the flap regions are in a semi-open conformation, defined by a minimal distance between the two flap regions [5]. After ligand binding, the binding site closes via the flap regions, resulting in a complete closure of the binding site. In this state, residue 50 (isoleucine) of the flap regions establish hydrophobic interactions with the ligand, allowing its proper orientation in the catalytic site [5,6,7,8]. This flap deformation, upon ligand binding, is also accompanied by conformational changes in the binding pocket residues and cooperative movements along PR2, resulting in deformations in the -helix region, the flap end, and the beginning of the fulcrum [4].
PR2 was thought to be a homodimer with a C2 axis of symmetry [1]. However, study of PR2 crystallographic structures has shown that this protein has an asymmetric structure; i.e., its two monomers have different global and local conformations [4,9,10,11,12,13,14,15]. This global structural asymmetry has been quantified by RMSD (root mean square deviation) values between the two chains of 0.35 Å to 1.02 Å depending on the crystallographic structure studied [9,10,11,12,14]. In a previous study, we quantified the local asymmetry of PR2 using the set of 19 crystallographic structures. To do so, we compared the conformation of each residue in the two chains of the 19 crystallographic structures using a structural alphabet approach [13]. We showed that, on average, 31% of PR2’s positions are asymmetric; i.e., they have different conformations in the two dimer chains. Localization and characterization of asymmetric positions in the different structures showed that this asymmetry in the crystallographic structures results from different factors: the crystal packing [9,10,12,14], dimerization [13], ligand binding [9,10,13], and intrinsic flexibility of the protein. According to this result, the structural asymmetry of PR2 seems to be involved in different mechanisms, such as the structural deformation of dimers, specifically that related to ligand recognition, as suggested for other targets [16,17,18]. More recently, we have compared the structural asymmetry in wild-type and resistant mutant PR2 structures to explore the impacts of resistance mutations on its structure [15]. Our results have highlighted three possible resistance mechanisms of PR2: resistance mutations could (i) modify PR2’s interface and its stability, (ii) directly alter the inhibitor binding, and (iii) modify the conformation of the PI binding pocket. All these results have revealed that the exploration of protein structural asymmetry is an efficient approach to capturing the structural variability of the target. However, all these studies have been based only in the analysis of crystallographic structures and have ignored PR2’s flexibility.
The aim of this new study was therefore to investigate the link between the flexibility of PR2 and its structural asymmetry by performing a molecular dynamics (MD) simulation. To do so, we studied the global and local asymmetries of PR2 throughout a one microsecond (s) MD simulation using the RMSD parameter. We then used multivariate analyses to explore the structural asymmetry of the 13 structural and functional regions to highlight the different PR2 asymmetric profiles. This work is the first study of the structural asymmetry of PR2 considering its intrinsic flexibility. Our results led to a characterization of the structural asymmetry induced by PR2’s flexibility and highlights flexible regions. This study provides new insights into PR2’s structure and flexibility. In addition, this analysis confirms that the exploration of a protein’s structural asymmetry is an efficient way to analyze its flexibility.
2. Results
2.1. MD Simulation
An MD simulation of one s using the 3EBZ (PDB code) structure was employed to explore the structural asymmetry of PR2 induced by its intrinsic flexibility. From this simulation, 1001 structures were extracted from a constant frame of 1 nanosecond (ns). Figure 2A and Figure S1 present the evolution of RMSD between structures and the energy profiles throughout the simulation. The average RMSD being below 2 Å confirms the stability of the PR2.

Figure 2.
(A) Evolution of the backbone RMSD throughout the simulation. The backbone RMSD was computed between structures and the first MD structure. (B) MDS map computed on the 1001 MD structures (blue points) and the 19 crystallographic structures (red points). This maps represents the conformational space sampled by MD structures.
To explore the conformational landscape sampled by MD structures, we computed the backbone RMSD computed among all MD structures and the 19 crystallographic structures. We noted that the structural variability of the structure is moderate with RMSD values ranging from 0.11 to 2.39 Åãnd an average backbone RMSD of 0.99 ± 0.16 Å. Based on these RMSD values, we computed a multidimensional scaling (MDS) of the 1020 structures. As expected, the MD structures sampled a larger space than the crystallographic structures. However, the unbound crystallographic structure (PDB code: 1HSI) presents a particular conformation relative to other structures. Indeed, this structure is the only crystallographic structure in the semi-open form. This could reveal that the simulation did not allow us to obtain the semi-open conformation. Figure S2 presents the hierarchical classification of the MD and crystallographic structures according to their backbone RMSD. We noted that the semi-open structure (PDB code 1HSI) was not isolated in a singleton in this classification. This suggests that the simulation allowed us to capture a conformation close to the semi-open conformation. The particularities of 1HSI structures could be explained by specific conformations induced by crystal packing.
2.2. Quantification of PR2’s Global Structural Asymmetry
First, the structural asymmetry of the 1001 MD structures was quantified using , which measures the structural deviation between the two chains of a dimer. The higher the value is, the more the two monomers have different conformations and the more the structure is asymmetric. Figure 3A presents the distribution of the global asymmetry in the 1001 MD structures. Over the MD simulation, the between the two monomers varied from 0.76 Å to 2.06 Å, with an average of 1.24 ± 0.2 Å. Among the 1001 structures, 11% are weakly asymmetric (having a value smaller than 1 Å), 78% are moderately asymmetric (having values ranging from 1 Å to 1.5 Å), and 11% are strongly asymmetric (having a value larger than 1.5 Å). Figure 3B presents the evolution of the global asymmetry over time. We noted that the structural asymmetry of PR2 is a property that evolves over time but no link between PR2’s structural asymmetry and time was observed. The strongly asymmetric dimers sample all the simulation. However, we noted that the first two parts of the simulation (“beginning” and “middle 1” parts) exhibit smaller average than the last two parts (“middle 2” and “end”; Kruskal Wallis test p-value = ). The weakly asymmetric structures are overrepresented in the beginning of the simulation and underrepresented in the “medium 2” and ”end” sections of the simulation ( test p-value = ). Figure 3C locates structural asymmetry of the two largest asymmetric (structures 507 and 988) and the least asymmetric (structure 88) dimers. Structure 88 exhibits weak asymmetry in the flap, elbow, and cantilever regions. The two largest asymmetric structures have different asymmetric regions. The largest deviations between the two chains of structure 507 are in the flap and elbow regions. The flap region is also strongly asymmetric in structure 988, which is not the case for the elbow region. Structure 988 also has a large asymmetry in the cantilever, -helix, and nter regions. Thus, the structural asymmetry of PR2 is not explained by only one region. These results show that the deformations induced by intrinsic flexibility yield different conformations of the two PR2 chains and thus structural asymmetry.

Figure 3.
Characterization of the global asymmetry of MD structures. (A) Distribution of the global asymmetry in the 1001 structures. (B) Evolution of the global asymmetry over time, i.e., in the 1001 MD structures ranked according to their extraction times. (C) Illustration of the structural asymmetry in three MD structures: the first two structures correspond to the two most asymmetric structures, and the last structure is the structure with the least asymmetry. PR2 is displayed in ribbons and colored according to the two chains: chain A is dark and chain B is light.
2.3. The Link between PR2’s Global Structural Asymmetry and Conformation
To characterize the global structural asymmetry of PR2, we mined values with different structural parameters. First, we crossed the values of each MD structure with its compactness quantified by its radius of gyration. Throughout the simulation, the compactness of PR2 changed little resulting in an average radius of gyration of Å. Figure S3 that presents the evolution of the radius of gyration of MD structures showed that chain A is less compact than chain B (higher radius of gyration). This result highlights an asymmetry between the two chains in terms of compactness. However, the structural asymmetry of PR2 (quantified by the ) is no link with its asymmetry revealed by the radius of gyration (Pearson’s correlation coefficient = 0.17) or with the differences in radius of gyration between the two chains (Pearson’s correlation coefficient = 0.01).
In a second step, we explored the structural asymmetry of PR2 by considering secondary structures. The secondary structures of MD structure residues were assigned using DSSP (version 2.2.1) software [19] using eight states (-helix (4–12), isolated -bridge residue, strand, 3–10 helix, -helix, turn, bend, and none). We noted that the global asymmetry is not linked to the composition of the eight secondary structure states; see Table S1. In addition, by comparing the secondary structures of residues in the two chains of an MD structure, we highlighted a structural asymmetry of PR2 in terms of secondary structure. This asymmetry results in residues exhibiting different secondary structure states in the two chains of an MD structure. However, we noted that this structural asymmetry in terms of secondary structures is weakly correlated with the global structural asymmetry (Pearson’s correlation coefficient = 0.22).
In our previous studies, we have shown that the structural asymmetry of PR2 could be induced by ligand binding, its PR2 dimerization, and its intrinsic flexibility [13,14,15]. To characterize the global structural asymmetry of each structure, we mined values with three PR2 parameters: (i) the distance between the I50 (isoleucine 50) residues in the two flap regions (noted ) often used to discretize the different PR2 forms (semi-open and closed forms [5,20]), (ii) the volume of its PI binding site [13], and (iii) the size of its interface [21]. No link between values and the three studied parameters were observed: Pearson’s correlation coefficients (r) between and the three parameters are close to 0: ; ; and . For example, structures 627 and 433 are weakly asymmetric structures ( Å) but they have different distances, pocket sizes, and interface sizes (Figure 4). Structure 627 has a smaller pocket size but a larger interface than structure 433 (Figure 4). In contrast, structures 627 and 868 have the same value and an interface of the same size. However, structure 868 is much more asymmetric than structure 627. Structure 212 also exhibits a large asymmetry ( Å), but differently located relative to structure 868 (Figure 4). Indeed, the structural asymmetry in structure 868 is throughout the entire structure, whereas the structural asymmetry of 212 is mainly in the flap region (Figure 3 and Figure 4). These two structures, presenting the same global asymmetry, also differ in interface size (i.e., 212’s interface is smaller than that of structure 868) and in their form. These results show that the intrinsic flexibility of PR2 induces structural asymmetry, which is not dependent on its form, its binding-pocket geometry, or its interface.

Figure 4.
Illustration of the structural asymmetry in four structures extracted from the simulation. PR2 is displayed in ribbons and colored according to the two chains: chains A and B are in dark and light colors, respectively.
2.4. Quantification of PR2’s Local Structural Asymmetry
To provide better quantification of PR2’s asymmetry in the MD simulation, we computed the for the 13 PR2 regions in the 1001 structures, noted as . The allowed us to measure the structural deformation of a region between the two chains of the dimer. We first explored the link between the global asymmetry of the structure and its local asymmetry quantified for each region. To do so, we computed the Pearson’s coefficient between the of the structure and the of each region; see Figure 5A. Pearson’s correlation coefficients vary from 0.32 to 0.59 Å, meaning that the structural asymmetry of one region does not explain the global structural asymmetry of the structure. Figure 5A shows that the structural asymmetry of the r3 region is least linked to the global asymmetry of all regions. In contrast, the fulcrum, cantilever, and flap regions are the regions whose asymmetries are the most correlated with the global asymmetry. These regions are not those exhibiting the largest local asymmetries, but they correspond to the longest regions with more than 10 residues per region. These results indicate that the global asymmetry of PR2 is explained by a combination of local asymmetries and not by only one region.
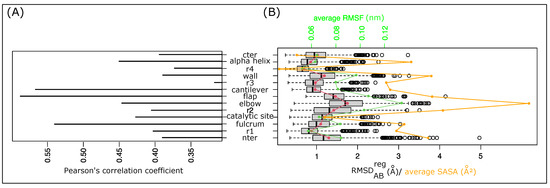
Figure 5.
Analysis of the local asymmetry of PR2 throughout the simulation. (A) Pearson’s correlation coefficient between values of the 13 regions computed in the 1001 MD structures. (B) Distribution of the local asymmetry of the 13 regions throughout the simulation quantified using values. Red dots and curve highlight the average value of each region. The green dots and line indicate the average RMSF of the regions. Orange dots highlight the average SASA of regions.
Figure 5B presents the distribution of the for each region throughout the simulation. It shows that the 13 regions exhibit different asymmetry. The r4 region is the least asymmetric region, with an average of 1.3 ± 0.57 Å. In contrast, the elbow region corresponds to the region exhibiting the largest structural asymmetry with an average of 1.75 ± 0.6 Å. Table S2 shows that the most asymmetric regions in terms of are not those with the largest asymmetry in terms of secondary structures. The r2 region exhibits two asymmetries: the elbow and flap regions are strongly asymmetric in terms of but moderately asymmetric in terms of secondary structures. In contrast, Figure 5B highlights a strong link between the structural asymmetry of any one region and its flexibility (Pearson’s correlation coefficient = 0.92) and accessibility (Pearson’s correlation coefficient = 0.75). The most asymmetric regions are regions with the largest average root mean square fluctuations (RMSFs) and largest average solvent accessible surface areas (SASAs). This means that the most asymmetric regions are the most flexible and accessible regions. In contrast, the less asymmetric regions are the buried and rigid regions. This result reveals that the structural asymmetry of a region is linked to its flexibility, which means the more a region can deform, the more asymmetric it will be. Although the two chains have the same sequence, they do not deform in the same way and they adopt different conformations.
2.5. Characterization of Local Asymmetry
To study the link between the asymmetry of the 13 regions, Pearson’s correlation coefficients between regions in terms of were computed; see Figure 6A. Even if these coefficients are weak (correlation coefficients vary from to ), six pairs have a correlation coefficient higher than 0.4. Three of these pairs correspond to consecutive regions in the structure: the nter and r1 regions with r = 0.41, the r4 and -helix regions with r = 0.43, and the -helix and cter region with r = 0.48; see Figure 1. The three other region pairs (nter–cter, -helix–catalytic site, and fulcrum–cantilever) are not successive regions, but they correspond to regions that interact (Figure 1).
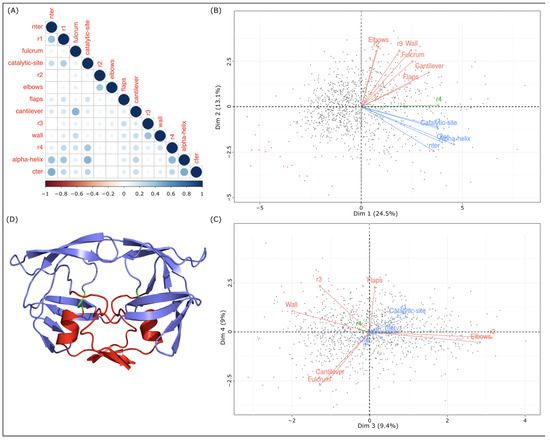
Figure 6.
Links between 13 regions in terms of local asymmetry. (A) Pearson’s correlation coefficients between the 13 regions based on their values computed with the 1001 MD structures. (B,C) Projections of the 13 regions onto the first two PCA planes computed using the 1001 values of the 13 regions. Gray points correspond to MD structures and magenta points correspond to crystallographic structures. (D) Representation of the 3D structure of the 3EBZ dimer. The protein is colored according to the three regions classes identified in the first PCA plane: the nter, cter, r1, -helix, and catalytic-site regions in red; the r4 region in green; other regions in marine blue.
To continue the analysis of the links between regions, principal component analysis (PCA) of the 1001 structures was computed based on the of the 13 regions. Figure 6B,C presents the projections of the 13 regions into the first and second PCA planes. The first component, which captures 38% of data variability, is strongly explained by the nter, r1, catalytic site, cantilever, r4, -helix, and cter regions. The second component is explained by the nter, fulcrum, r2, elbow, r3, wall, -helix, and cter regions. In the first plane, three groups of regions are highlighted. Group 1 is composed of only one region (the r4 region). Group 2 has the nter, r1, catalytic site, -helix, and cter regions. These regions are the most correlated in terms of local asymmetry. Group 3 groups the fulcrum, r2, elbow, flap, cantilever, r3, and wall regions (Figure 6). The third and fourth dimensions, capturing 9% of the data variability, allowed us to separate regions of group 3; see Figure 6. In the second PCA plane, the fulcrum and cantilever regions are grouped together and separated from the r2, elbow, flap, r3, and wall regions. Figure 6D presents the 3D structure of PR2 colored according to the three region groups. We noted that the regions of groups 2 and 3 are well separated in the 3D structure. The regions of group 2 constitute the bottom of PR2. The regions of group 3 correspond to the top and the side of PR2. Region r4 corresponds to the link between the groups 2 and 3. These results suggest that PR2 could be composed of two parts: the bottom part composed of the nter, r1, catalytic site, -helix, and cter regions; and the top part that could be divided into several regions. These two parts, linked by the r4 region, present different dynamic behaviors, resulting in different local deformations.
2.6. Identification and Characterization of Asymmetric Profiles
To identify the different local asymmetric profiles observed throughout the MD simulation, a hierarchical classification of the 1001 structures was computed using the values, see Figure 7. This classification groups structures according to their similarity in terms of local asymmetry. The 1001 structures were rapidly split into two clusters of 529 (cluster A) and 472 (cluster B) structures. In terms of local asymmetry, these two groups were differentiated by all regions, except for the r2 and elbows regions. Structures with high asymmetry are overrepresented in cluster B, resulting in the fact that this cluster has the largest average ( Å; Student’s test p-value = ). In contrast, cluster A is, on average, the least asymmetric (average Å) and contains more weakly asymmetric structures.
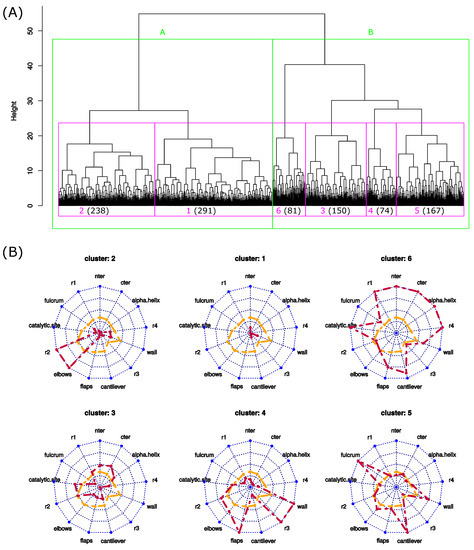
Figure 7.
Identification of the different asymmetric profiles of PR2 throughout the MD simulation. (A) Hierarchical classification of the 1001 structures based on the values. (B) Asymmetric profiles of the 6 clusters. Orange lines are the average profiles computed using all structures, and red lines are the average profiles computed using structures of the studied cluster.
To pursue the analysis of the structure classification, the dendrogram was cut into six clusters. The sizes of clusters varied from 74 (cluster 4) to 291 (cluster 1). To analyze the relevance of these six structure clusters, we projected the 19 crystallographic structures into the dendrogram according to their local structural asymmetries (Figure S4). Except the structure 3ECG, which belongs to cluster 1, all crystallographic structures were grouped into a new cluster. This new cluster is similar to cluster 1, which is composed of the weakly asymmetric structures. These results reveal that the crystallographic structures exhibit different local asymmetry levels relative to the MD structures. In fact, the crystallographic structures exhibit less structural asymmetry (average of 0.65 ± 0.21 Å) than the MD structures (average = 1.24 ± 0.2 Å). These results are also highlighted by Figure 6B,C, which shows that the crystallographic structures exhibit different asymmetry profiles.
We now describe in more detail the different clusters. First, we observed that clusters grouped structures extracted from different parts of the MD simulation, excepted cluster six, which contains few structures from the beginning of the simulation (Figure 8). We then mined structure clusters in terms of global and local asymmetries. To do so, we compared the distributions of the three structure types (weakly, moderately, and strongly asymmetric) in the six clusters (Figure 8) and analyzed their local asymmetric profiles (Figure 7). We showed that the three structure types do not equitably sample the six clusters ( p-value = ). Weakly asymmetric structures are overrepresented in cluster 1, and clusters 5 and 6 are composed of moderately and strongly asymmetric structures; see Figure 8. In terms of local asymmetry, structures of cluster 1 exhibit weak local asymmetries (Figure 7). For example, structure 627, extracted from cluster 1, exhibits a weak asymmetry ( 0.84 Å) mainly located in the -helix and catalytic-site region (Figure 4). Figure 7 shows that cluster 3 groups structures with moderate asymmetry in the nter, cter, and -helix regions. In contrast, the four other clusters group structures with large asymmetries in at least two regions. Cluster 6 is very specific because its structures exhibit strong asymmetry in most regions, as illustrated for structure 868 (Figure 4). The structures of cluster 5 are asymmetric in the fulcrum, cantilever, and wall regions. The elbow and r2 regions are asymmetric in the cluster 2 structures. The flap, r3, and wall regions are asymmetric in the cluster 4 structures.
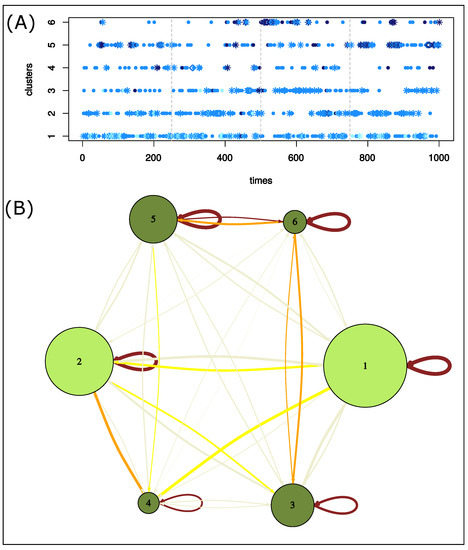
Figure 8.
Characterization of structure clusters. (A) Evolution of clusters over time. Structures were colored according to their global asymmetry: weakly asymmetric structures are in cyan, moderately asymmetric structures in marine blue, and strongly asymmetric structures in dark blue. The form of dots indicates successive structures of the same cluster: diamond points locate the longest pattern of structures of the same cluster. Stars locate successive structures of the same cluster. (B) Network summarizing the transition of structure clusters over the time. Nodes are clusters and are colored according to the structure clusters A and B extracted from the structure classification. The network links two structure clusters if two of their structures are consecutive in the simulation. Edges are colored according to the differences between the observed and expected counts.
We then studied the transitions of structures clusters throughout the simulation. To do so, we built a network that links two clusters if they were consecutive in the simulation; see Figure 8B. First, all transitions (121 = ) were observed during the simulation. Figure 8B shows that one structure was often followed by a structure from the same cluster in the simulation. This was the case for more than 35% of all transitions. In particular, 41% of cluster 1 structures are followed by a structure from the same cluster. For example, we identified a pattern of eight consecutive structures from cluster 1 beginning at 82 ns of simulation time (Figure 8A). Figure 8 also highlights overrepresented transitions between structures from different clusters: , , , . These transitions concern two clusters close in the classification. In the simulation, a structure was thus mainly followed by a structure with a similar asymmetric profile. This means that the deformation observed during 1 ns was small. However, some transitions between structures exhibiting different asymmetric profiles occurred. For example, the structure at 533 ns (cluster 6) has strong asymmetry ( = 1.29 Å) mainly located in the -helix, nter, and catalytic-site regions. In the simulation, this structure was followed by a cluster-2 structure that exhibits a similar value of (1.18 Å) but had asymmetry mostly in the elbow and flap regions (Figure 9). Therefore, in this time frame (1 ns), structural deformations occurred in the elbow, flap, -helix, nter, and catalytic-site regions. Thus, the variations in the asymmetry across several structures reveals structural deformations.
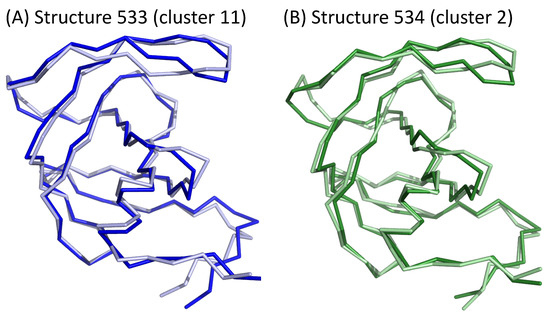
Figure 9.
Asymmetry of two consecutive structures extracted from different clusters. PR2 are colored according to the two chains: chains A and B are colored in dark and light colors, respectively.
3. Discussion and Conclusions
Several studies of PR2 crystallographic structures showed that it is an asymmetric protein [9,10,11,12,14]. As these analyses have been based on crystallographic structures, they have ignored the dynamics of PR2 in the detection of structural asymmetry. To overcome this issue, we previously explored the structural asymmetry in a set of 19 crystallographic structures complexed with different ligands [13]. Using this set of diverse PR2 complexes allowed us to capture structural asymmetry and deformations induced by ligand binding and natural flexibility (though we only glimpsed the latter). In this new study, we focused on the exploration of PR2’s structural asymmetry induced by intrinsic flexibility. To do so, we followed this property during one MD simulation of 1 s. We quantified the global structural asymmetry of 1001 structures extracted from the MD simulation by computing the backbone between the two chains of a dimer (). This criterion was previously used to detect the structural asymmetry of PR2 and other targets [9,10,11,12,22,23,24,25,26,27]. The quantification of in the MD structure set showed that PR2 exhibited strong structural asymmetry ranging from 0.76 to 2.06 Å throughout the simulation. Thus, its structural asymmetry is a property that evolves over time. As expected, the asymmetries of PR2’s structures extracted from the simulation were greater than those of crystallographic structures. This is explained by the fact that the 19 crystallographic structure set considered only the structural deformations induced by ligand binding and very little intrinsic flexibility. Inversely, the set of structures extracted from the simulation accounts for the intrinsic flexibility but not deformation induced by ligand binding.
The characterization of global asymmetry showed that this property is related neither to the compactness of the protein, nor to its binding site volume, nor to its form (open, semi-open, or closed), nor to its interface size. The study of the compactness of the two chains (quantified by the radius of gyration) and of the secondary structure of residues throughout revealed new types of asymmetry of PR2: the two chains of PR2 do not exhibit the same compactness degree, and some of their residues adopt different secondary structures. However, these two types of asymmetries are not or weakly linked to the global asymmetry measured by . These differences could be explained by the fact that these parameters consider different atom types. is based on only backbone atoms, whereas the radius of gyration uses all atoms. The structural asymmetry in terms of secondary structures focuses on the residue level and not on the entire chains.
To quantify and localize in more detail the structural asymmetry of PR2 over time, we measured the local asymmetry of MD structures. To do so, we computed the of the 13 structural and functional regions between their two chains (). This criterion has been previously used to compare the local conformations of PR1 and PR2 [28]. Our results showed that the global asymmetry of PR2 is not explained by deformations of only one region, but it is linked to the deformation of several regions. The least asymmetric regions are the r4, -helix, r3, and cantilever regions; and the most asymmetric regions are the nter, r2, elbow, and flap regions. We also highlighted that the structural asymmetry of a region is strongly linked to its flexibility. The more flexible the region is, the more asymmetric it will be; i.e., more conformational changes between the two chains will occur. These results agree with those obtained for the crystallographic structures. These previous studies highlighted that the cter, elbow, and flap regions are most asymmetric and variable [4,9,10,11,12,13,28]. These results confirm that the detection of structural asymmetry in a protein target is an effective way to locate its flexible regions. The large structural asymmetries of the nter, r2, elbow, and flap regions result from their intrinsic flexibility, indicating that they can deform without adopting the same conformation in both chains, even if they have the same sequence. Based on the classification of the 1001 MD structures according to their local asymmetry, we identified six different asymmetric profiles. Thus, throughout the MD simulation, the intrinsic flexibility induced deformation of various regions, which led to different asymmetric profiles, ranging from structures weakly asymmetric to structures with strong asymmetry. The analysis of the profile succession throughout the MD simulation showed that a structure is mainly followed by a structure with a similar asymmetric profile. This means that the structural changes observed between two structures in a simulation are often weak. However, some transitions between structures exhibiting different asymmetric profiles could occur, revealing large structural changes during the simulation.
The exploration of the relationships between the 13 regions according to their structural asymmetries showed that PR2 could be divided into two parts linked by the r4 region. The first part is composed of seven regions (the fulcrum, r2, elbow, flap, cantilever, r3, and wall regions) and corresponds to the top and side regions of PR2. The second part, corresponding to the bottom of PR2, is composed of the nter, r1, catalytic site, -helix, and cter regions that exhibit the most correlated local asymmetry. This means that these five regions, close in the 3D space, present similar asymmetry properties and are linked together. This result is reinforced by the hydrogen-bonding network observed between residues of the nter, r1, catalytic site, -helix, and cter regions [4]. These results suggest that the nter, r1, -helix, and cter regions could be important to maintain the conformation of the catalytic site. It would be interesting to analyze the correlated movements of these regions during MD simulations to better understand the roles of these regions and their relationships.
To conclude, this study is the first exploration and characterization of PR2’s structural asymmetry induced by its intrinsic flexibility. More precisely, we followed the global and local structural asymmetries of the wild-type PR2 throughout a 1 s MD simulation. The structural asymmetry of the 1001 structures extracted from this MD simulation (frame time of 1 ns) was quantified by comparing the conformations of the two chains in each structure using backbone atom RMSD. Our results provide a characterization of the global asymmetry and highlight different asymmetric profiles. They also provide new information on PR2’s structure and dynamics. However, our results were constrained by the conformational landscape sampled by the MD simulation. To enhance this sample, one solution could be to use various crystallographic structures as starting structures in MD simulations, particularly the unbound structure (PDB code 1HSI). Another method allowing one to improve on the conformational sample could be the use of metadynamics simulations. In addition, it would be also interesting to explore the structural asymmetry of PR2 during an MD simulation of a PR2 structure complexed with a PI. This analysis could provide information on structural asymmetry involved in the PI recognition, an asymmetry that we did not consider in this study. Another limitation of our study is that we only focused on the structural asymmetry of PR2’s backbone. It would be interesting to explore the structural asymmetry of side-chain atoms to provide more information on structural changes induced by PR2’s flexibility. Studying structural asymmetry at the atom level could allow us to focus on binding site exploration. This could provide information on the flexibility which is important for ligand binding and catalytic activity.
4. Material and Methods
4.1. Molecular Dynamics Protocol
We started with the crystallographic structure of PR2 complexed with DRV (PDB CODE: 3EBZ) [29]. The 3EBZ structure was chosen as the starting structure in the simulation because it has a good resolution (1.20 Å). In addition, this structure is the only available structure in complex with one of the three FDA-recommended drugs (DRV, lopinavir, and saquinavir) for the treatment of HIV-2 infection. First, DRV and imidazole molecules were removed from the structure, along with the water molecules. Then, the oxygen atom (OD1) of Asp 25 (aspartic acid) of chain B was protonated with PROPKA software (version 3) [30]. Using this structure, an MD simulation was carried out with Gromacs software (version 2018.3) [31]. The use and automation were facilitated by Gromacs_py Python library [32]. The computations were run on the laboratory GPU cluster. The Amber ff99SB-ILDN [33] force field parameters were used for the protein, and the system was solvated with a dodecahedron water box (TIP3P) with the protein being distant on each side by 10 Å. To neutralize the system, chloride and sodium ions were added. The system was minimized before and after the solvatation by the steepest-descent algorithm with 5000 steps each time. The minimization was computed with a harmonic stress of 100 kcal·molÅ. The equilibration in three steps from Gromacs_py was kept as the default. The first constrained the positions of heavy atoms, the second constrained the positions of the -carbons, and the last added a weak constraint to the -carbons. These three steps took 1, 5, and 10 ns, respectively. The integration step was of 1 femtosecond (fs) for the first step and 2 fs for the two last steps. Before this three-step equilibration, a 0.1 ns equilibration step with a constraint on the heavy atoms with an integration step of 0.1 fs was run. At the end, a 1 s simulation was run. This MD simulation was constraint-free. The covalent bonds of hydrogen atoms were constrained with the LINCS algorithm (linear constraint solver). The long range electrostatic interactions and Van der Waals interactions were computed by the PME method (Particule Mesh Ewald) with a 10 Å cutoff. The temperature was kept at 310 K by the v-rescale thermostat and the pressure controlled by the Parrinello–Rahman algorithm. A snapshot (conformation) of the structure was saved every 1 ns, resulting in a set of 1001 structures. The 1001 structures have IDs ranging from 0 to 1000 and correspond to their extraction times. The structure with the ID 198 was extracted at the 198th ns of the MD simulation. To correct the rotation of PR2 during the simulation and the translation in the water box, structures were all aligned with the same structure (788) using TM-align program [34].
4.2. Exploration of the Conformational Lanscape Sampled in the Simulation
To quantify the structural variability of MD structures, we compared the conformations of MD structures and the 19 crystallographic structures. To do so, we computed the backbone RMSD between all MD and crystallographic structures. This resulted in a RMSD matrix of 1020 rows and 1020 columns. From this RMSD matrix, we computed a MDS. The MDS algorithm starts with the RMSD matrix and places structures in a low-dimensional space, where the distances (RMSD) between structures are preserved as much as possible [35]. The MDS was computed using the cmdscale() function of the MASS package in R [36]. We then plotted the MDS map: the projections of structures onto the first two MDS components. The obtained MDS map presents the conformational space sampled the MD and crystallographic structures. From the RMSD matrix, we also computed a hierarchical classification of the MD and crystallographic structures. This classification was computed using Ward method aggregation with hclust() function in R.
4.3. Structural Asymmetry Quantification
In this study, we explored the global and local asymmetries of the 1001 MD structures extracted from the simulation. To do so, the two chains of each MD structure were superimposed using the align command of PyMOL software (version 1.7.2.1) [37].
4.3.1. Global Asymmetry
The global asymmetry of a structure was quantified using the , which measures the RMSD between the two superimposed chains based on their backbone atoms. The more a structure presents a strong , the more it is asymmetric, i.e., the more the conformations of these two chains are different.
4.3.2. Local Asymmetry
To quantify the local asymmetry of PR2, each MD structure was split into 13 structural and functional regions; see Figure 1 [3,28]. Nine regions correspond to structural and functional regions defined by [3]: the nter (1–4), fulcrum (10–23), catalytic (24–30), elbow (37–42), flap (43–58), cantilever (59–75), wall (80–83), -helix (87–95), and cter (96–99) regions. The four other regions, named r1 (5–9), r2 (31–36), r3 (75–79), and r4 (84–86), correspond to regions linking previous regions.
We then measured the structural asymmetry of each region in every structure using the . For a region in a structure, the measures the backbone RMSD between the region in the two superimposed chains in the structure. The more a region presents a strong , the more it is asymmetric, i.e., the more the conformations of this region in the two chains are different.
4.4. PR2 Characterization
4.4.1. Determination of Structural Compactness
The compactness of each MD structure was determined by computing its radius of gyration, as in [38,39]. We computed the radius of gyration of every structure, and of their chains A and B, separately.
4.4.2. Computation of the Distance between Each Structure’s Two Flaps
The distance between the two flaps of a structure, noted , corresponds to the Euclidean distance between the two - carbons of residues 50 in the two chains. The parameter is often used to differentiate the PR1 and PR2 forms (open, semi-open, and closed) [5,8,20]. This distance was computed for the 1001 MD structures.
4.4.3. Computation of the Interface Size
The interface of each MD structure was extracted using the freely accessible PPIC program [21,40]. This program is a parameter-free software that extracts atoms involved in the interface from the 3D structure of a complex. The interface of each chain is defined as the non-redundant set of all nearest neighbor atoms in one molecule of the atoms. To do so, the program uses a simpler method of the Voronoï tessellation method [41]. Once the interface was extracted from each structure, the size of each interface was determined by computing the number of residues that it contains.
4.4.4. Computation of the Binding Pocket Volume
The inhibitor binding pocket was extracted from each MD structure using the “common-ligand” approach, as in [21,42]. The advantage of this approach is that it considers the diversity of ligands capable of binding site as well as their flexibility [42] during the pocket estimation. This approach first defines the “common-ligand,” which corresponds to the set of co-crystallized ligands extracted from the superimposed crystallized PR structures [42]. Then the “common-ligand” is placed in a given structure. The pocket of this structure is then defined as all atoms within 4.5 Å of the “common-ligand”.
Once the inhibitor binding pocket was extracted from each structure, we computed its volume using RADI (version 4.0.2) software [42,43,44]. This computation was based on the smallest convex envelope that included all pocket atoms [43].
4.4.5. Determination of the Composition of Secondary Structures
We explored the link between structural asymmetry and the composition in the secondary structures of PR2 throughout the simulation by quantifying several parameters. First of all, the secondary structures of the MD structure residues were assigned using DSSP (version 2.2.1) software [19] and 8 states (-helix (4–12), isolated -bridge residue, strand, 3–10 helix, -helix, turn, bend, and none). Using this description, we determined the composition in terms of secondary structure of each MD structure, i.e., its number of residues in each state. In a second step, we compared the secondary structure of each residue in the two chains of all MD structures. This led to counting how many residues have different secondary structures in the two chains of a structure. This parameter quantified a new asymmetry in terms of secondary structure. Finally, we also studied the link between the local asymmetry and the asymmetry in terms of secondary structure. To do so, for each region of an MD structure, we determined how many residues exhibit different secondary structures in their two chains.
4.4.6. Computation of Region Accessibility
The accessibility of each region in each structure was computed using NACCESS software (version 2.1.1) [45]. NACCESS software was used to compute the SASA of each atom in MD structures. For each structure, we then computed the average SASA for each region based on the SASA of backbone atoms.
4.4.7. Computation of Region Flexibility
The flexibility of each region was quantified using RMSFs of backbone atoms. The RMSF was used to quantify the average deviation of an atom throughout the simulation relative to the first structure. For a region, we computed its average RMSF. The average RMSF of each region was compared to the average of the region computed using the 1001 structures.
4.5. Exploration of Structural Asymmetry over Simulation Using Multivariate Methods
To analyze the local structural asymmetry of PR2 throughout the MD simulation, we used two multivariate methods. First, we computed a PCA based on the local asymmetric profile of the 1001 MD structures. This PCA was performed using the values of the 13 regions for the 1001 structures using the FactoMineR package in R [46]. The PCA standardized the data—i.e., the 1001 MD structures—into a subspace made of orthogonal linear combinations of the local asymmetry of the 13 regions (), so-called principal components. The data could then be explored in a smaller dimensional space spanning the most informative view, according to the data variability.
In a second step, we computed a hierarchical classification of the 1001 MD structures according to their local asymmetric profiles. To do so, the Euclidean distances between structures were computed based on their 13 scaled values. From these distances, a hierarchical classification of 1001 MD structures was computed using Ward method aggregation. To analyze the classification, the dendrogram was cut into six clusters. We compared the average asymmetric profiles of the six clusters using radar plots.
In order to explore the relevance of the six structure clusters, we projected the 19 crystallographic structures onto the obtained dendrogram. To do so, we computed the of each crystallographic structures. Then, these values were scaled using the mean and standard deviation of of each region in the 1001 MD structures. Then Euclidean distances between the 1001 MD structures and the 19 crystallographic structures were computed based on the scale values, resulting in a distance matrix of 1020 rows and columns. Using this distance matrix, we computed a hierarchical classification of the 1020 structures using Ward aggregation method.
Supplementary Materials
The following supporting information can be downloaded at: https://www.mdpi.com/article/10.3390/sym14020362/s1, Figure S1: Evolution of the system energy over the simulation; Figure S2: Hierarchical classification of MD and crystallographic structures based on their main-chain RMSD; Figure S3: Evolution of the PR2 compactness over the simulation; Figure S4: Classification of the 1020 structures (1001 DM structures + 19 X-ray structures) according to their local structural asymmetry; Table S1: Link between the global asymmetry and the composition in secondary structures; Table S2: Exploration of the asymmetry in terms of secondary structures in the 13 PR2 regions.
Author Contributions
L.R. conceived of and designed the experiments; L.R. supervised the project; P.L. designed and ran the molecular dynamics simulation; L.R., L.B. and A.B. performed the experiments; A.B., L.B. and L.R. developed scripts dedicated to analyses; A.B. and L.R. analyzed the data; L.R. wrote the paper. All authors reviewed the manuscript. All authors have read and agreed to the submitted version of the manuscript.
Funding
P.L. is supported by a fellowship from the Ministère de l’Education Nationale de la Recherche et de Technologie (MENRT).
Institutional Review Board Statement
Not applicable.
Informed Consent Statement
Not applicable.
Data Availability Statement
The datasets generated during the current study are available from the authors on reasonable request.
Acknowledgments
The authors gratefully acknowledge the financial support of the Université de Paris, the CNRS institute and the INSERM institute. We are grateful to D. Flatters for helpful discussions. The authors would like to thank Laurence Legall for the administrative supports. The authors also thank the referees for their careful reading and helpful comments.
Conflicts of Interest
The authors declare no conflict of interest.
Abbreviations
The following abbreviations are used in this manuscript:
| DRV | Darunavir |
| FDA | Food and Drug Administration |
| HIV-1 | Human immunodeficiency virus of type 1 |
| HIV-2 | Human immunodeficiency virus of type 2 |
| fs | femtosecond |
| ns | nanosecond |
| MD | Molecular dynamics |
| MDS | MultiDimensional Scaling |
| PR | Protease |
| PR2 | HIV-2 Protease |
| PI | Protease inhibitor |
| RMSD | Protease inhibitor |
| RMSD | Root Mean Square Deviation |
| RMSF | Root Mean Square Fluctuation |
| SASA | Solvent Accessible Surface Area |
| s | microsecond |
| 3D | Three-dimensional |
References
- Menéndez-Arias, L.; Alvarez, M. Antiretroviral therapy and drug resistance in human immunodeficiency virus type 2 infection. Antivir. Res. 2014, 102, 70–86. [Google Scholar] [CrossRef] [PubMed]
- Brower, E.; Bacha, U.M.; Kawasaki, Y.; Freire, E. Inhibition of HIV-2 protease by HIV-1 protease inhibitors in clinical use. Chem. Biol. Drug Des. 2008, 71, 298–305. [Google Scholar] [CrossRef] [PubMed]
- Sadiq, S.K.; de Fabritiis, G. Explicit solvent dynamics and energetics of HIV-1 protease flap opening and closing. Proteins Struct. Funct. Bioinform. 2010, 78, 2873–2885. [Google Scholar] [CrossRef] [PubMed]
- Triki, D.; Fartek, S.; Visseaux, B.; Descamps, D.; Camproux, A.; Regad, L. Characterizing the structural variability of HIV-2 protease upon the binding of diverse ligands using a structural alphabet approach. J. Biomol. Struct. Dyn. 2019, 37, 4658–4670. [Google Scholar] [CrossRef]
- Hornak, V.; Okur, A.; Rizo, R.; Simmerling, C. HIV-1 protease flaps spontaneously open and reclose in molecular dynamics simulations. Proc. Natl. Acad. Sci. USA 2006, 103, 915–920. [Google Scholar] [CrossRef]
- Gustchina, A.; Weber, I. Comparative analysis of the sequences and structures of HIV-1 and HIV-2 proteases. Proteins Struct. Funct. Bioinform. 1991, 10, 325–339. [Google Scholar] [CrossRef]
- Boggetto, N.; Reboud-Ravaux, M. HIV protease: Structure and development of inhibitors. Virology 2001, 5, 9–18. [Google Scholar]
- Toth, G.; Borics, A. Closing of the flaps of HIV-1 protease induced by substrate binding: A model of a flap closing mechanism in retroviral aspartic proteases. Biochemistry 2006, 45, 6606–6614. [Google Scholar] [CrossRef]
- Tong, L.; Pav, S.; Pargellis, C.; Dô, F.; Lamarre, D.; Anderson, P. Crystal structure of human immunodeficiency virus (HIV) type 2 protease in complex with a reduced amide inhibitor and comparison with HIV-1 protease structures. Proc. Natl. Acad. Sci. USA 1993, 90, 8387–8391. [Google Scholar] [CrossRef]
- Mulichak, A.M.; Hui, J.; Tomasselli, A.; Heinrikson, R.; Curry, K.; Tomich, C.; Thaisrivongs, S.; Sawyer, T.; Watenpaugh, K. The crystallographic structure of the protease from human immunodeficiency virus type 2 with two synthetic peptidic transition state analog inhibitors. J. Biol. Chem. 1993, 268, 13103–13109. [Google Scholar] [CrossRef]
- Tong, L.; Pav, S.; Mui, S.; Lamarre, D.; Yoakim, C.; Beaulieu, P.; Anderson, P. Crystal structures of HIV-2 protease in complex with inhibitors containing the hydroxyethylamine dipeptide isostere. Structure 1995, 3, 33–40. [Google Scholar] [CrossRef]
- Priestle, J.; Fassler, A.; Rösel, J.; Tintelnot-Blomley, M.; Strop, P.; Grütter, M. Comparative analysis of the X-ray structures of HIV-1 and HIV-2 proteases in complex with CGP 53820, a novel pseudosymmetric inhibitor. Structure 1995, 3, 381–389. [Google Scholar] [CrossRef]
- Triki, D.; Cano Contreras, M.; Flatters, D.; Visseaux, B.; Descamps, D.; Camproux, A.; Regad, L. Analysis of the HIV-2 protease’s adaptation to various ligands: Characterization of backbone asymmetry using a structural alphabet. Sci. Rep. 2018, 8, 710. [Google Scholar] [CrossRef]
- Ollitrault, G.; Fartek, S.; Descamps, D.; Camproux, A.; Visseaux, B.; Regad, L. Characterization of HIV-2 protease structure by studying its asymmetry at the different levels of protein description. Symmetry 2019, 10, 644. [Google Scholar] [CrossRef]
- Laville, P.; Fartek, S.; Cerisier, N.; Flatters, D.; Petitjean, M.; Regad, L. Impacts of drug resistance mutations on the structural asymmetry of the HIV-2 protease. BMC Mol. Cell Biol. 2020, 51, 46. [Google Scholar] [CrossRef]
- Prabu-jeyabalan, M.; Nalivaika, E.; King, N.; Schiffer, C. Viability of a drug-resistant human immunodeficiency virus type 1 protease variant: Structural insights for better antiviral therapy. Society 2003, 77, 1306–1315. [Google Scholar] [CrossRef]
- Goodsell, D.; Olson, A.J. Structural symmetry and protein function. Annu. Rev. Biophys. Biomol. Struct. 2000, 29, 105. [Google Scholar] [CrossRef]
- Brown, J.H. Breaking symmetry in protein dimers: Designs and functions. Protein Sci. 2006, 15, 1–13. [Google Scholar] [CrossRef]
- Kabsch, W.; Sander, C. Dictionary of protein secondary structure: Pattern recognition of hydrogen-bonded and geometrical features. Biopolymers 1983, 22, 2577–2637. [Google Scholar] [CrossRef]
- Chen, J.; Liang, Z.; Wang, W.; Yi, C.; Zhang, S.; Zhang, Q. Revealing origin of decrease in potency of darunavir and amprenavir against HIV-2 relative to HIV-1 protease by molecular dynamics simulations. Sci. Rep. 2014, 4, 6872. [Google Scholar] [CrossRef]
- Laville, P.; Petitjean, M.; Regad, L. Structural Impacts of Drug-Resistance Mutations Appearing in HIV-2 Protease. Molecules 2021, 26, 611. [Google Scholar] [CrossRef]
- Xiao, B.; Singh, S.; Nanduri, B.; Awasthi, Y.; Zimniak, P.; Ji, X. Crystal structure of a murine glutathione S-transferase in complex with a glutathione conjugate of 4-hydroxynon, 2-enal in one subunit and glutathione in the other: Evidence of signaling across the dimer interface. Biochemistry 1999, 38, 11887–11894. [Google Scholar] [CrossRef]
- Cha, H.; Kopetzki, E.; Hubert, R.; Lanzendorfer, M.; Brandsteller, H. Structural basis of the adaptive molecular recognition by MMP9. J. Mol. Biol. 2002, 320, 1065–1079. [Google Scholar] [CrossRef]
- Jin, L.; Stec, B.; Lipscomb, W.N.; Kantrowitz, E.R. Insights into the mechanisms of catalysis and heterotropic regulation of Escherichia coli aspartate transcarbamoylase based upon a structure of the enzyme complexed with the bisubstrate analogue N-phosphonacetyl-L-aspartate at 2.1 Å. Proteins Struct. Funct. Genet. 1999, 37, 729–742. [Google Scholar] [CrossRef]
- Renatus, M.; Stennicke, H.R.; Scott, F.L.; Liddington, R.C.; Salvesen, G.S. Dimer formation drives the activation of the cell death protease caspase 9. Proc. Natl. Acad. Sci. USA 2001, 98, 14250–14255. [Google Scholar] [CrossRef]
- Pednekar, D.; Durani, S. Protein homomers in point-group assembly: Symmetry making and breaking are specific and distinctive in their codes of chemical alphabet in side chains. Roteins Struct. Funct. Bioinform. 2010, 78, 3048–3055. [Google Scholar] [CrossRef]
- King, D.A.; Zhang, L.; Guarente, L.; Marmorstein, R. Structure of a HAP1-DNA complex reveals dramatically asymmetric DNA binding by a homodimeric protein. Nat. Struct. Biol. 1999, 6, 64–71. [Google Scholar] [CrossRef]
- Triki, D.; Kermarrec, M.; Visseaux, B.; Descamps, D.; Flatters, D.; Camproux, A.; Regad, L. Exploration of the effects of sequence variations between HIV-1 and HIV-2 proteases on their three-dimensional structures. J. Biomol. Struct. Dyn. 2020, 38, 5014–5026. [Google Scholar] [CrossRef]
- Kovalevsky, A.; Louis, J.; Aniana, A.; Ghosh, A.; Weber, I. Structural evidence for effectiveness of darunavir and two related antiviral inhibitors against HIV-2 protease. J. Mol. Biol. 2008, 384, 178–192. [Google Scholar] [CrossRef][Green Version]
- Li, H.; Robertson, A.; Jensen, J.H. Very fast empirical prediction and rationalization of protein pK a values. Proteins 2005, 61, 704–721. [Google Scholar] [CrossRef]
- Abraham, M.; Murtolad, T.; Schulz, R.; Pálla, S.; Smith, J.; Hess, B.; Lindahl, E. Gromacs: High performance molecular simulations through multi-level parallelism from laptops to supercomputers. SoftwareX 2015, 1–2, 19–25. [Google Scholar] [CrossRef]
- Murail, S. gromacs_py: A gromacs python wrapper. Zenodo 2018. [Google Scholar] [CrossRef]
- Lindorff-Larsen, K.; Piana, S.; Palmo, K.; Maragakis, P.; Klepeis, J.; Dror, R.; Shaw, D. Improved side-chain torsion potentials for the Amber ff99SB protein force field. Prot. Struct. Funct. Bioinform. 2010, 78, 1950–1958. [Google Scholar] [CrossRef]
- Zhang, Y.; Skolnick, J. TM-align: A protein structure alignment algorithm based on TM-score. Nucleic Acids Res. 2005, 33, 2302–2309. [Google Scholar] [CrossRef]
- Cox, T.; Cox, M. Multidimensional Scaling; Chapman & Hall: London, UK, 1994; pp. 315–347. [Google Scholar]
- Venables, W.N.; Ripley, B.D. Modern Applied Statistics with S; Springer: New York, NY, USA, 2002. [Google Scholar] [CrossRef]
- Schrödinger-LLC; DeLano, W. PyMOL; Version 2.4.0; Schrödinger-LLC: San Francisco, CA, USA, 2020. [Google Scholar]
- Lobanov, M.; Bogatyreva, N.; Galzitskaya, O. Radius of gyration as an indicator of protein structure compactness. Mol. Biol. 2008, 42, 623–628. [Google Scholar] [CrossRef]
- Amir, M.; Mohammad, T.; Kumar, V.; Alajmi, M.; Rehman, M.; Hussain, A.; Alam, P.; Dohare, R.; Islam, A.; Ahmad, F.; et al. Structural Analysis and Conformational Dynamics of STN1 Gene Mutations Involved in Coat Plus Syndrome. Front. Mol. Biosci. 2019, 6, 41. [Google Scholar] [CrossRef]
- Laville, P.; Martin, J.; Launay, G.; Regad, L.; Camproux, A.; de Vries, S.; Petitjean, M. A non-parametric method to compute protein–protein and protein–ligands interfaces. Application to HIV-2 protease–inhibitors complexes. bioRxiv 2018. [Google Scholar] [CrossRef]
- Eppstein, D.; Paterson, M.; Yao, F. On nearest-neighbor graphs. Discret. Comput. Geom. 1997, 17, 263–282. [Google Scholar] [CrossRef]
- Triki, D.; Billot, T.; Flatters, D.; Visseaux, B.; Descamps, D.; Camproux, A.; Regad, L. Exploration of the effect of sequence variations located inside the binding pocket of HIV-1 and HIV-2 proteases. Sci. Rep. 2018, 8, 5789. [Google Scholar] [CrossRef]
- Petitjean, M. Applications of the radius-diameter diagram to the classification of topological and geometrical shapes of chemical compounds. J. Chem. Inf. Model. 1992, 32, 331–337. [Google Scholar] [CrossRef]
- Borrel, A.; Regad, L.; Xhaard, H.; Petitjean, M.; Camproux, A. PockDrug: A Model for Predicting Pocket Druggability That Overcomes Pocket Estimation Uncertainties. J. Chem. Inf. Model. 2015, 55, 882–895. [Google Scholar] [CrossRef]
- Hubbard, S.; Thornton, J. NACCESS; Computer Program, Department of Biochemistry and Molecular Biology, University College London: London, UK, 1993. [Google Scholar]
- Lê, S.; Rennes, A.; Josse, J.; Husson, F. FactoMineR: An R Package for Multivariate Analysis. J. Stat. Softw. 2008, 25, 18677. [Google Scholar] [CrossRef]


Publisher’s Note: MDPI stays neutral with regard to jurisdictional claims in published maps and institutional affiliations. |
© 2022 by the authors. Licensee MDPI, Basel, Switzerland. This article is an open access article distributed under the terms and conditions of the Creative Commons Attribution (CC BY) license (https://creativecommons.org/licenses/by/4.0/).