Abstract
The hydrogen abstraction reaction OH + H2S→H2O + SH plays an important role in acid rain formation, air pollution and climate change. In this work, the product energy disposals of the reaction and its isotopic variants OD + H2S and OD + D2S are calculated on a new ab-initio-based ground electronic state potential energy surface (PES) using the quasi-classical trajectory method. The PES is developed by fitting a total of 72,113 points calculated at the level of UCCSD(T)-F12a/aug-cc-pVTZ and using the fundamental invariant-neural network method, resulting in a total RMSE of 4.14 meV. The product H2O formed in the OH + H2S reaction at 298 K is found to be largely populated in the first overtone states of its symmetric and asymmetric stretching modes, while the vibrational distributions of the products HOD and D2O in the isotopically substituted reactions are visibly different. The computed product vibrational state distributions agree reasonably well with experimental results and are rationalized by the sudden vector projection model.
1. Introduction
Hydrogen sulfide (H2S), as a well-known toxic gas and environmental pollutant, causes acid rain formation, some human and animal diseases and climate change [1,2]. The loss of H2S in the atmosphere is mainly by reacting with hydroxyl radical (∙OH), i.e., a typical representative of hydrogen abstraction reactions [2,3,4,5,6,7,8,9]. Accurate determination of the rate constant is important for constructing atmospheric chemical models. The OH + H2S→H2O + SH reaction is also thought to be the first stage in the oxidation of H2S, which possibly evolves into sulfuric acid or sulfate aerosol [10]. Therefore, much attention has been paid to studying the kinetics and dynamics of the OH + H2S→H2O + SH reaction both experimentally [11,12,13,14,15,16,17,18,19,20,21,22] and theoretically [23,24,25,26,27,28,29].
The rate constant of the reaction was measured to be (3.1–5.7) × 10−12 cm3 molecule−1 s−1 at 298 K and found to have a non-Arrhenius temperature dependence at relatively low and high temperatures [11,12,14,15,16,30,31]. Butkovskaya and Setser [19,20,21] studied the vibrational excitation of the product molecules from the reactions of OH and OD radicals with H2S at 298 K in a fast-flow reactor by modeling infrared emission spectra at 0.5 Torr of Ar, in which the dynamics associated with the energy disposal were analyzed.
Theoretically, Benjamin and Truhlar attributed the unusual temperature dependence to a dynamical bottleneck by direct dynamics at the level of M06-2X/MG3S and then investigated the kinetic isotope effects of the OH + D2S and OD + D2S reactions [25]. The interaction between OH radical and H2S has been investigated by different first-principle methods [25,27,32,33]. A complex H2S⋯OH was predicted to be formed by the two center and triple electron S-O bond (2c-3e) [32,33]. In 2017, Tang et al. studied the minimum energy path using the ‘gold standard’ CCSD(T) method with Dunning’s aug-cc-pV(X+d)Z(X = D, T, Q, 5) [27]. The barrier height was calculated to be 0.11 kcal mol−1 at the level of CCSD(T)/aug-cc-pV(5+d)Z with the geometries optimized at the level of aug-cc-pV(Q+d)Z. In 2018, some of the authors [28] constructed a global, full-dimensional potential energy surface (PES) for the OH + H2S→H2O + SH reaction and studied the kinetics and dynamics of the reaction using the quasi-classical trajectory (QCT) method. Quantum dynamics calculations on the PES showed that fundamental excitations of either the symmetric or the asymmetric stretching modes of H2S have similar and remarkable efficacy on promoting the reactivity, while exciting the bending mode slightly enhances the reaction at low collision energies, and the enhancement effect increases with the collision energy [29]. Although the PES is accurate and smooth, it is not suitable for simulating experimental conditions at 298 K due to the relatively short asymptotic region. The furthest distance between reactants (or products) from the sampled data points in the work was only 8 Å.
In this work, we construct a new full-dimensional and globally accurate ground electronic state PES. The PES can accurately describe the interaction between the reactants OH and H2S (or products) as far as 25 Å, which is sufficiently enough for simulating Butkovskaya and Setser’s experiment by QCT theory. The PES is fitted by the fundamental invariant-neural network (FI-NN) method [34] based on 72,113 ab initio points at the level of UCCSD(T)-F12a/aug-cc-pVTZ. The vibrational state distributions of products (H2O/HOD/D2O) in the OH + H2S reaction and its isotopic variants are calculated by the normal mode analysis (NMA) method [35,36,37,38] on the new PES and compared with available experimental results.
2. Potential Energy Surface
The PES is constructed as follows. The stationary points along the minimum energy path are first optimized at the level of UCCSD(T)-F12a/aug-cc-pVTZ [39,40] by the software Molpro 2012 [41]. Secondly, in order to obtain enough initial points, a batch of grid points are generated along the minimum energy path, with the condition that the grid points meet the energy range of −1.5–2.0 eV and the reactant (product) separation is less than 25 Å. Then, atom-centered density matrix propagation (ADMP) molecule dynamics are performed from each grid point at the level of M06-2X/6-31 + G(d) by the software Gaussian 09 [42]. The initial data points from the ADMP trajectories must be selected by the Euclidean distance, which is defined in terms of the bond lengths, ( and represent the nuclear distances of the reserved configuration in the data set and the new configuration, n represents the number of bonds). The permutationally equivalent points are also included in such a screening. Different from our previous work, the value of Euclidean distance is well designed in this work. The sampled configuration space is divided into three parts: the first part (), where Å; the second part (), where a linear function defined as is employed; and the third part (), where Å, is the longest bond in OH bond. Clearly, the new scheme to choose the value of Euclidean distance adjusts the density of the sample data points according to the varying of potential energy, which can save the computational cost of ab initio calculations. Thirdly, the FI-NN method is applied to fit the initial data set to generate a raw PES. Due to the lack of data points in some regions, artificial wells exist in the raw PES. Therefore, quasi-classical trajectories are then launched at a different temperature to get more trajectory points. To fill out artificial wells in the raw PES, a batch of PESs are fitted and are used to assess the error for each point that is defined as . N is the number of fitted PESs and here N = 10, and is the predicted potential energy by the ith PES. Thus, the sampled data points from quasi-classical trajectories are screened by both the error and the Euclidean distance. The procedure is repeated several times. Finally, a total of 72,113 points are selected with an energy interval of 3.5 eV.
In the FI-NN fitting, the Morse-like variables are used to construct the polynomials with as an adjustable constant, and is the internuclear distance between ith and jth atoms [43,44]. In this work, is taken as 2.0 Å. Twenty fundamental invariants with a maximum degree of 3 for the A3BC system exist. The structure of the neural network is 20 (input)-50 (hidden 1) -80 (hidden 2) -1 (output), giving a total of 5 211 parameters. The Levenberg–Marquardt algorithm [45] is used to update weights and biases. The root mean square error (RMSE), defined as , is used to evaluate the quality of each PES. The data points are divided into two groups, with 95% of the points as the training set and 5% as the validating set. The PESs with the RMSE of two data sets having similar small values are chosen to avoid overfitting. The so-called ensemble approach is used to diminish random errors. The final PES is selected to be the average of the three best PESs with training/validating/maximum RMSEs of 4.68/8.12/219.44, 4.66/9.42/193.21 and 4.75/9.41/220.61 meV. The overall RMSE of the PES is 4.14 meV.
3. Quasi-Classical Trajectory Method
QCT calculations, implemented in the software VENUS 96 [46], are carried out on the new PES. The integral cross-section of the reaction at a specific collision energy is computed by
where and are the numbers of reactive and total trajectories, respectively. The maximum impact parameter is tested by small batches of trajectories with trial values at each specified initial state. The relative statistical error is given by .
For diatomic product molecules, the vibrational quantum numbers are determined by the Einstein–Brllouin–Keller semi-classical quantization of the action integral. However, for product molecules involving more than two atoms, their vibrational quantum numbers become difficult to determine. At present, there are three methods: the fast Fourier transform [47,48], the adiabatic switching method [49] and the NMA method [50]. The first two methods have some disadvantages in determining vibrational state distributions of polyatomic molecules. For example, the fast Fourier transform integrals are well performed only if the trajectories are quasiperiodic, and the adiabatic switching method is sensitive to the choice of coordinate system and zero-order Hamiltonian. In this work, the NMA method [50,51] is employed to calculate classical action numbers. Traditionally, the geometry, including the Cartesian coordinates and momenta in the center of mass (COM) frame, is extracted from the last step of a trajectory. Due to the harmonic approximation, the deviation from the equilibrium geometry sometimes results in unphysical potential energies, giving invalid classical action numbers. To overcome this problem, the method proposed by our group is implemented in this work, in which the coordinates and velocities are taken from a specific step of each trajectory within the last vibrational period of the product molecule [52,53,54]. The step is determined by asking the corresponding geometry to have the minimum potential energy in the vibrational period. This scheme guarantees the chosen geometry to resemble the equilibrium geometry. Two binning methods, namely histogram binning (HB) and Gaussian binning (GB) [38,55], are employed to confer a “quantum spirit” on the non-integer classical harmonic action number.
In the QCT calculations, the initial conditions in the dynamics calculations are chosen to be similar to the experiment [19,20,21]. The initial distance of two reactants (OH and H2S or OD and H2S or OD and D2S) is 24.5 Å. The trajectory is stopped when the separation of the two reactants or products is larger than 25.0 Å. The time step of propagation is set as 0.035 fs. The convergence of total energy is better than 10−3 kcal mol−1. The collision energy and the initial ro-vibrational state of H2S (or D2S) are sampled from a Boltzmann distribution at 298 K. The initial states of OH (or OD) are sampled by the traditional semi-classical approach. For each of the three reactions, about 150,000 are launched and the relative statistical errors are all below 5%.
4. Results and Discussion
4.1. Properties of the Potential Energy Surface
Table 1 compares the parameters of the new PES with the previous one [28]. Firstly, due to the employment of the new scheme to choose the value of Euclidean distance, the number of sampled data points is decreased from 82,680 to 72,113. Secondly, the sampled data points in this work cover a larger region, in which the separation of reactants (or products) is up to 25 Å, in sharp contrast to 8 Å for the previous PES. Thirdly, the parameter in Morse-like variables, , is taken as 2.0. A relatively large value of should be used when the long-range interaction is strong. Finally, the overall RMSE of the new PES is 4.14 meV, 0.58 meV lower than that of the previous PES.

Table 1.
Comparison between previous and new potential energy surfaces.
The minimum energy path of the OH + H2S→H2O + SH reaction is illustrated in Figure 1. The ab initio energies are calculated at the level of UCCSD(T)-F12a/aug-cc-pVTZ [40,41]. All energies are given in kcal mol−1 and with respect to the reactant asymptote. Clearly, four minima exist in the entrance and exit valleys, in which RC-A and PC-A are formed by hydrogen bond, while RC-B and PC-B are hemibonded complexes with two center and triple electron S-O bond (2c-3e). The interaction of hydrogen bond between H2S (H2O) and OH (SH) is slightly stronger than the corresponding hemibond, consistent with Tang et al.’s results [27].
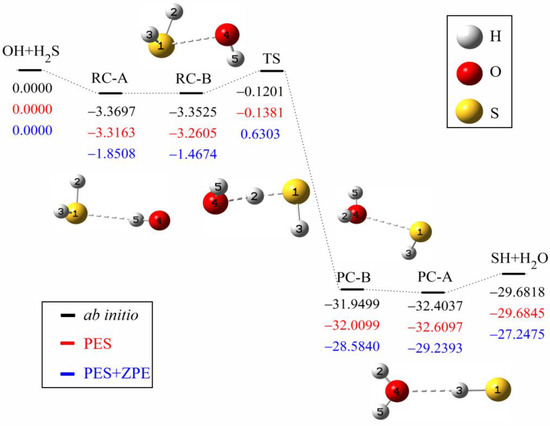
Figure 1.
Schematic diagram of the reaction path for the OH +H2S→H2O +SH reaction. The ab initio energies of stationary points at the level of UCCSD(T)-F12a/aug-cc-pVTZ (black) are shown below the corresponding geometries, together with the values of the fitted PES (red) and the zero-point corrected energies (blue). All energies are given in kcal mol−1 and relative to the reactant asymptote.
To assess the quality of the fitted PES, the optimized geometries by ab initio calculations, the geometries on the fitted PES and available experimental values are listed in Table 2. On one hand, the geometries of the stationary points at the level of UCCSD(T)-F12a/aug-cc-pVTZ are in accord with the geometries at the level of CCSD(T)/aug-cc-pV(Q+d)Z, where the biggest difference of bond length is 0.255 Å and the biggest difference of angle is 12.7°. On the other hand, the predicted geometries by the PES are also consistent with ab initio results. The deviations from the UCCSD(T)-F12a/aug-cc-pVTZ results are less than 0.171 Å for the bond length and 12.0° for the angle. Table 3 shows the energies and frequencies of the stationary points. To solve the problem of non-convergence, the basis function extrapolation and energy shift are adopted in the calculation of single-point energy, which causes a small difference from Ping et al.’s results [28]. The energy difference between the predicted PES and the corresponding ab initio one of UCCSD(T)-F12a/aug-cc-pVTZ is less than 0.1866 kcal mol−1, and the energy difference between UCCSD(T)-F12a/aug-cc-pVTZ and CCSD(T)/aug-cc-pV(Q+d)Z is less than 0.2425 kcal mol−1 [27]. The barrier height on the PES is to be −0.1381 kcal mol−1, which agrees well with the UCCSD(T)-F12a/aug-cc-pVTZ value of −0.1201 kcal mol−1, while it is slightly lower than the CCSD(T)/aug-cc-pV(Q+d)Z value of 0.0600 kcal mol−1. The frequency difference is less than 53 cm−1 compared with the UCCSD(T)-F12a/aug-cc-pVTZ results and the imaginary frequency of the transition state is the same.
Table 2.
Bond length (in angstrom) and angle (in degree) of stationary points of the reaction OH + H2S→H2O + SH. The atom labels are given in Figure 1.
Table 3.
Harmonic frequencies (cm−1) and energies (kcal mol−1) of stationary points for the reaction OH + H2S→H2O + SH.
Figure 2 shows the 2D contours of the PES as a function of the breaking HS and the forming OH with the other coordinates fixed at the geometry of the transition state. The energy gap of the fitted PES is from −1.5 eV to 2.0 eV. Clearly, the fitted PES is globally smooth. The insert zooms in the contours near the transition state. The pre- and post-reaction wells are nicely reproduced by the PES. The fitting errors of the sampled points are plotted in Figure 3. The errors for most of the sampled points are distributed in the range of −20 to 20 meV, with several scattered points as large as 200 meV. Overall, the new PES is globally accurate and satisfies the requirement of dynamics calculations.
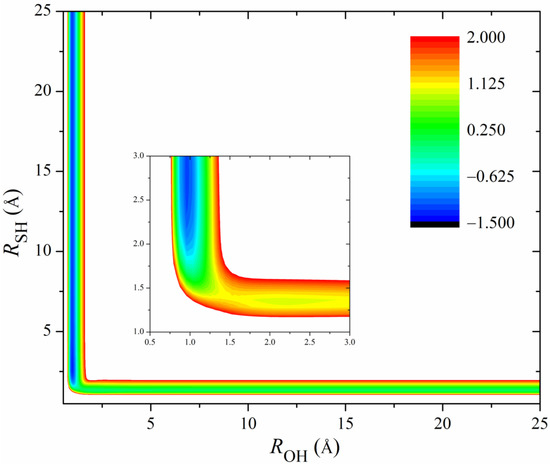
Figure 2.
2D Contours of the PES as a function of the breaking OH and the forming SH with the other coordinates fixed at the geometry of the transition state. The energy gap is from −1.5 to 2.0 eV. The insert zooms in the contours near the transition state with an energy gap from −1.5 to 0.5 eV.
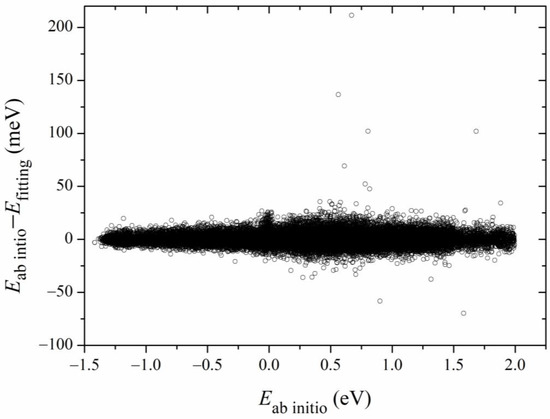
Figure 3.
Distributions of fitting errors of the sampled data points.
4.2. Product Energy Disposal
Figure 4 shows the calculated product vibrational state distributions. The reactant ro-vibrational states are sampled at 298 K. The three quantum numbers in the parentheses, (), denote excitations in the symmetric stretching, bending and asymmetric stretching modes of the products H2O and D2O. As to the product HOD, refers to excitation in the O-D stretching mode and in the O-H stretching mode. Two binning methods (HB and GB) are applied in the calculations. Since the two methods give similar distributions, the following discussions are based on the GB results. For the product molecule H2O in the OH + H2S reaction, as shown in Figure 4a, it is mainly populated in the states (200), (002), (012), (210) and (021). The significant excitation of the stretching modes of H2O results from the visible change of the OH bond among the minimum energy path. The bond length of OH from the transition state to the product H2O is shortened from 1.501 Å to 0.959 Å. Compared with the stretching modes, the bending mode of H2O is less excited and mainly populated in the ground and fundamental states.
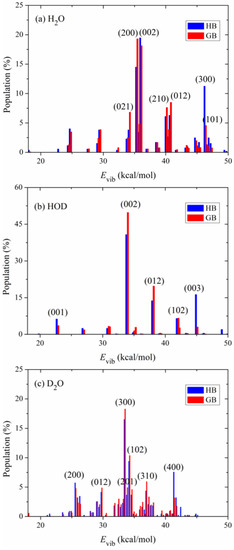
Figure 4.
Vibrational state distributions of the products (a) H2O, (b) HOD and (c) D2O in the reactions OH + H2S, OD + H2S and OD + D2S, respectively, with the reactants sampled at 298 K.
To study the effect of isotopic substitution on the dynamics, the vibrational state distributions of the products HOD in the reaction OD + H2S and D2O in the reaction OD + D2S are presented in Figure 4b,c, respectively. In sharp contrast to H2O, the product HOD is dominantly formed in the state (002), i.e., the first overtone of the OH stretching mode, followed by visible excitation in the state (012). The OD bond in the product HOD is nearly unexcited. According to the analysis of the reaction coordinate at the transition state, the stretching motion of the O-H bond is to a great extent along the reaction coordinate. Therefore, the initial available energy favors to flow into the O-H stretching mode of HOD. However, due to the large frequency difference between the OH and OD stretching modes, the intramolecular vibrational redistribution (IVR) is infeasible in the reaction process. In other words, the OD bond is more like a spectator bond in the OD + H2S reaction. When both reactants OH and H2S are isotopically substituted, as shown in Figure 4c, the product D2O is mainly populated in the state (300), followed by (102), (400) and (200). Interestingly, it appears that the IVR in D2O is not as strong as in H2O. The reaction OD + D2S prefers to produce D2O in the vibrational excited states of the symmetric stretching mode and the excitation energy in the symmetric stretching mode cannot efficiently flow into the asymmetric stretching mode. In addition, compared with the products H2O and HOD, D2O is formed in higher excited states due to its higher density of states. Actually, the products H2O, HOD and D2O are all largely populated in the vibrational states whose energies are around 35 kcal mol−1, close to the total available energy.
The vibrational state distributions of the products SH in the reactions OH + H2S and OD + H2S and SD in the reaction OD + D2S are illustrated in Figure 5a–c. Obviously, these products are almost exclusively formed in their ground vibrational states, indicating the nature of a spectator in the reaction OH + H2S and its isotopic variants.
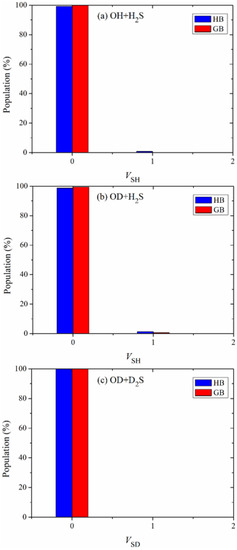
Figure 5.
Vibrational state distributions of the products (a) SH, (b) SH and (c) SD in the reactions OH + H2S, OD + H2S and OD + D2S, respectively, with the reactants sampled at 298 K.
Table 4 compares the calculated vibrational state distribution of the product H2O in the OH + H2S reaction with the experimental result from Seter’s group [19,21]. In the experiment, the symmetric () and asymmetric () stretching modes are difficult to distinguish. Thus, in the table represents the sum of and . Theoretical calculations show that the product is largely populated in the states for and in the states for . They are consistent with experimental observations, although visible quantitative difference exists. The theoretical proportion of the states for is higher than the corresponding experimental values, while the theoretical proportion of the states for is slightly lower. For , the experimental distributions are somewhat scattered, and one experiment gave the highest proportion for the states [19], consistent with theoretical results; the other experiment reported the highest proportion for the states [21]. The reactions in the experiment were carried out under the pressure of 0.5 Torr. However, this condition is not considered in theoretical calculations. Therefore, the quantitative difference between experimental and theoretical results is possibly caused by the pressure.
Table 4.
Vibrational state distribution of the product H2O for the reaction OH + H2S→H2O + SH.
The vibrational state distribution of the product HOD in the OD + H2S reaction is listed in Table 5. The quantum numbers and represent excitations in the OD stretching, bending and OH stretching modes. Since the frequency of OD stretching mode (2831 cm−1) is very close the to the double frequency of the bending mode (2888 cm−1), it is hard for the experiment to distinguish them as well. Hence, in the table is defined as the maximum value of and . For , theoretical calculations predict that the product HOD is largely distributed in the state , in accord with the experimental results. On the other hand, both experiment and theory show that the product HOD has larger distributions in and for and 2, respectively. In addition, visible difference between experimental and theoretical values also exists.
Table 5.
Vibrational state distribution of the product HOD for the reaction OD + H2S→HOD + SH.
Table 6 lists the vibrational state distribution of the product D2O in the OD + D2S reaction. Unfortunately, there are no experimental results for comparison. Like Table 4, in the table represents the sum of and . The product D2O is largely populated in states for and 1. For D2O is largely distributed in the states .
Table 6.
Vibrational state distribution of the product D2O for the reaction OD + D2S→D2O + SD.
The product energy disposals of the three reactions are shown in Figure 6. fv, fr and ft denote the fractions of available energy released as the product vibrational energy, the rotational energy and the translation energy, respectively. The product zero-point energy is subtracted from the corresponding vibrational energy. It can be seen that 68.04% of available energy is released as the vibrational energy of H2O in the OH + H2S reaction, followed by the rotational energy of H2O and the relative translational energy. The small proportion of vibrational and rotational energy of SH indicates that it is hard for the energy to flow into the product SH, no matter the vibrational mode and the rotational mode. When the reactants are isotopically substituted, the product energy disposal is nearly unchanged. Most of available energy flows into the vibrational and rotational modes of HOD in the OD + H2S reaction or D2O in the OD + D2S reaction. It appears that, compared with the former two reactions, a little more energy (12.92%) is transferred as the translational energy in the OD + D2S reaction. The fraction of fv(H2O) (fv(HOD)) is estimated to be 56% in the experiment [20,21], lower than the calculated value of 69.96% (69.94%). As mentioned, the difference is possibly caused by the pressure of 0.5 Torr in experiment, which is not considered in the simulation.
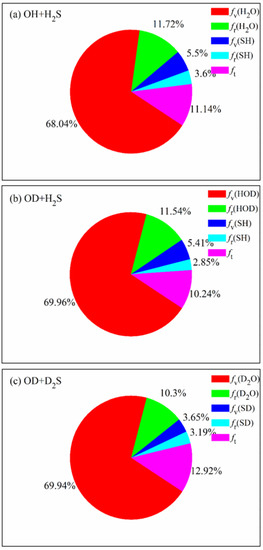
Figure 6.
Product energy disposals of the reactions OH +H2S, OD + H2S and OD + D2S with the reactants sampled at 298 K.
Although this reaction is likely to be barrierless, the submerged barrier could exert some control on the reactivity, especially for the reactive trajectories by the direct mechanism. The sudden vector projection (SVP) model [56,57,58,59] has been widely used to predict reactant mode selectivity and product energy disposal in many gas phase and gas surface reactions by calculating the coupling between the interested reactant or product normal mode vector () and the reaction coordinate vector () at the transition state: . The calculated SVP values of different product modes for the three reactions are listed in Table 7. For the OH + H2S reaction, the symmetric and asymmetric stretching modes of H2O have the largest projection on the reaction coordinate, followed by the product translational mode and the bending mode of H2O. The vibrational mode of the product SH has a negligible coupling with the reaction coordinate. This is consistent with QCT calculations, in which the formed H2O is largely populated in the excited states of the two stretching modes of H2O, while its bending mode is less excited. Most of available energy flows into the vibrational modes of H2O, followed by the translational mode, and a very small percentage of the energy is released as the vibrational and rotational energy of SH. For the OD + H2S reaction, the stretching mode of OH in HOD has the largest projection value, followed by the translational mode and the bending mode of HOD. The stretching mode of OD in HOD has a weak coupling with the reaction coordinate and the vibrational mode of SH has a negligible value. According to QCT calculations, the HOD is dominantly formed in the first overtone state of the OH moiety, well predicted by the SVP model. The product energy disposal of HOD can be explained by the SVP model as well. Furthermore, the SVP values of the product D2O are close to those of H2O, indicating similar energy disposal of D2O to that of H2O. This is also confirmed by QCT calculations.
Table 7.
Sudden vector projection (SVP) values of different product vibrational and translational modes. The numbers , and denote the symmetric, bending and the asymmetric stretching modes of the product H2O (or D2O).
5. Conclusions
In this work, a full-dimensional, globally accurate PES of the OH + H2S→SH + H2O reaction is constructed using the FI-NN method by fitting a total of 72,113 ab initio points calculated at the level of UCCSD(T)-F12a/aug-cc-pVTZ. The fitted PES has a RMSE of 4.14 meV. The geometries and frequencies of the stationary points on the PES agree well with ab initio calculations.
The vibrational state distributions and product energy disposals of the OH + H2S reaction and its isotopic variants OD + H2S and OD + D2S are calculated on the new PES using the QCT method and compared with recent experimental results. Theoretical calculations show that the product H2O in the OH + H2S reaction is largely distributed in the first overtone states of its symmetric and asymmetric stretching modes. By contrast, the product HOD is dominantly formed in the first overtone state of the OH stretching mode and the OD moiety is almost unexcited. Compared with the products H2O and HOD, the product D2O in the OD + D2S reaction is formed in higher excited states due to its higher density of states. For all of the three reactions, the products SH and DH are actually unexcited. Most of these conclusions are in reasonable agreement with experimental observations. The quantitative difference between experimental and theoretical distributions is possibly caused by the pressure in the experiment. In addition, most of available energy is released as the vibrational energy of H2O (or HOD in OD + H2S or D2O in OD + D2S), followed the translational energy. Only a very small proportion of the energy flows into the vibrational and rotational energy of SH (or SD). The dynamical behavior can be well rationalized by the SVP model. Although the classical barrier height of the reaction is negative, it is thought to affect the reactivity to a certain extent, possible due to the positive barrier height in the vibrationally adiabatic ground-state potential energy curve. The role of this kind of transition state deserves attention and further investigation.
Author Contributions
Conceptualization, H.S.; Investigation, Z.T.; Writing—original draft, Z.T. and H.S.; Writing—review & editing, Z.T., J.L., Y.W. and H.S.; Supervision, Y.W. and H.S.; Funding acquisition, H.S. and Y.W. All authors have read and agreed to the published version of the manuscript.
Funding
This work is supported by the National Natural Science Foundation of China under the Grant No. 21973109 to H.S. and No. 21963008 to Y.W.
Data Availability Statement
The data that support the findings of this study and the Fortran subroutine of the PES are available from the corresponding authors upon reasonable request.
Conflicts of Interest
The authors declare no conflict of interest.
References
- Zulfiqar, F.; Hancock, J.T. Hydrogen sulfide in horticulture: Emerging roles in the era of climate change. Plant Physiol. Biochem. 2020, 155, 667–675. [Google Scholar] [CrossRef] [PubMed]
- Cullis, C.F.; Hirschler, M.M. Atmospheric sulphur: Natural and man-made sources. Atmos. Environ. (1967) 1980, 14, 1263–1278. [Google Scholar] [CrossRef]
- Graedel, T.E. The homogeneous chemistry of atmospheric sulfur. Rev. Geophys. 1977, 15, 421–428. [Google Scholar] [CrossRef]
- Möller, D. Estimation of the global man-made sulphur emission. Atmos. Environ. (1967) 1984, 18, 19–27. [Google Scholar] [CrossRef]
- Hitchcock, D.R. Atmospheric Sulfates from Biological Sources. J. Air Pollut. Control Assoc. 1976, 26, 210–215. [Google Scholar] [CrossRef] [PubMed]
- Beauchamp, R.O.; Bus, J.S.; Popp, J.A.; Boreiko, C.J.; Andjelkovich, D.A.; Leber, P. A Critical Review of the Literature on Hydrogen Sulfide Toxicity. Crit. Rev. Toxicol. 1984, 13, 25–97. [Google Scholar]
- Jaeschke, W.; Claude, H.; Herrmann, J. Sources and sinks of atmospheric H2S. J. Geophys. Res. Oceans 1980, 85, 5639–5644. [Google Scholar] [CrossRef]
- Frenklach, M.; Lee, J.H.; White, J.N.; Gardiner, W.C. Oxidation of hydrogen sulfide. Combust. Flame 1981, 41, 1–16. [Google Scholar] [CrossRef]
- Gargurevich, I.A. Hydrogen Sulfide Combustion: Relevant Issues under Claus Furnace Conditions. Ind. Eng. Chem. Res. 2005, 44, 7706–7729. [Google Scholar] [CrossRef]
- Anderson, L.G. Atmospheric chemical kinetics data survey. Rev. Geophys. 1976, 14, 151–171. [Google Scholar] [CrossRef]
- Westenberg, A.A.; deHaas, N. Rate of the reaction OH + H2S → SH + H2O over an extended temperature range. J. Chem. Phys. 1973, 59, 6685–6686. [Google Scholar] [CrossRef]
- Perry, R.A.; Atkinson, R.; Pitts, J.N. Rate constants for the reactions OH + H2S → H2O + SH and OH + NH3 → H2O + NH2 over the temperature range 297–427 °K. J. Chem. Phys. 1976, 64, 3237–3239. [Google Scholar] [CrossRef]
- Wine, P.H.; Kreutter, N.M.; Gump, C.A.; Ravishankara, A.R. Kinetics of hydroxyl radical reactions with the atmospheric sulfur compounds hydrogen sulfide, methanethiol, ethanethiol, and dimethyl disulfide. J. Phys. Chem. 1981, 85, 2660–2665. [Google Scholar] [CrossRef]
- Lin, C.L. Temperature dependence of the rate constant for the reaction OH + H2S. Int. J. Chem. Kinet. 1982, 14, 593–598. [Google Scholar] [CrossRef]
- Lin, Y.-L.; Wang, N.-S.; Lee, Y.-P. Temperature dependence of the rate constant for the reaction OH + H2S in He, N2, and O2. Int. J. Chem. Kinet. 1985, 17, 1201–1214. [Google Scholar] [CrossRef]
- Lafage, C.; Pauwels, J.-F.; Carlier, M.; Devolder, P. Rate constant for the reaction OH + H2S in the range 243–463 K by discharge-flow laser-induced fluorescence. J. Chem. Soc. Faraday Trans. 2 1987, 83, 731–739. [Google Scholar] [CrossRef]
- Wang, H.; Zhu, D.; Wang, W.; Mu, Y. The impact of HS radicals on the measured rate constant of H2S with OH radicals. Chin. Sci. Bull. 2010, 55, 2951–2955. [Google Scholar] [CrossRef]
- Wategaonkar, S.; Setser, D.W. Vibrational energy disposal in the reactions of F atoms with NH3, ND3, N2H4, and CH3ND2. J. Chem. Phys. 1987, 86, 4477–4487. [Google Scholar] [CrossRef]
- Butkovskaya, N.I.; Setser, D.W. Chemical Dynamics of the OH and OD Radical Reactions with H2S, CH3SCH3, and CH3SH Studied by Infrared Chemiluminescence. J. Phys. Chem. A 1998, 102, 6395–6405. [Google Scholar] [CrossRef]
- Butkovskaya, N.I.; Setser, D.W. Rate constants and vibrational distributions for water-forming reactions of OH and OD radicals with thioacetic acid, 1,2-ethanedithiol and tert-butanethiol. Int. J. Chem. Kinet. 2019, 51, 395–404. [Google Scholar] [CrossRef]
- Butkovskaya, N.I.; Setser, D.W. Reactions of OH and OD radicals with simple thiols and sulfides studied by infrared chemiluminescence of isotopic water products: Reaction OH + CH3SH revisited. Int. J. Chem. Kinet. 2021, 53, 702–715. [Google Scholar] [CrossRef]
- Butkovskaya, N.I.; Setser, D.W. Reactions of OH and OD radicals with ethanethiol and diethylsulfide: Branching ratio and vibrational energy disposal for the product water molecules. Chem. Phys. 2022, 555, 111404. [Google Scholar] [CrossRef]
- Wilson, C.; Hirst, D.M. Reaction of H2S with OH and a study of the HSO and SOH isomers. High-level ab initio calculations. J. Chem. Soc. Faraday Trans. 1994, 90, 3051–3059. [Google Scholar] [CrossRef]
- Mousavipour, S.H.; Namdar-Ghanbari, M.A.; Sadeghian, L. A Theoretical Study on the Kinetics of Hydrogen Abstraction Reactions of Methyl or Hydroxyl Radicals with Hydrogen Sulfide. J. Phys. Chem. A 2003, 107, 3752–3758. [Google Scholar] [CrossRef]
- Ellingson, B.A.; Truhlar, D.G. Explanation of the Unusual Temperature Dependence of the Atmospherically Important OH + H2S → H2O + HS Reaction and Prediction of the Rate Constant at Combustion Temperatures. J. Am. Chem. Soc. 2007, 129, 12765–12771. [Google Scholar] [CrossRef]
- Du, B.; Zhang, W. The effect of (H2O)n (n = 1–2) or H2S on the hydrogen abstraction reaction of H2S by OH radicals in the atmosphere. Comput. Theor. Chem. 2015, 1069, 77–85. [Google Scholar] [CrossRef]
- Tang, M.; Chen, X.; Sun, Z.; Xie, Y.; Schaefer, H.F. The Hydrogen Abstraction Reaction H2S + OH → H2O + SH: Convergent Quantum Mechanical Predictions. J. Phys. Chem. A 2017, 121, 9136–9145. [Google Scholar] [CrossRef]
- Ping, L.; Zhu, Y.; Li, A.; Song, H.; Li, Y.; Yang, M. Dynamics and kinetics of the reaction OH + H2S → H2O + SH on an accurate potential energy surface. Phys. Chem. Chem. Phys. 2018, 20, 26315–26324. [Google Scholar] [CrossRef]
- Xiang, H.; Lu, Y.; Song, H.; Yang, M. Mode-Specific Quantum Dynamics Study of OH + H2S → H2O + SH Reaction. Chin. J. Chem. Phys. 2022, 35, 200–206. [Google Scholar] [CrossRef]
- Michael, J.V.; Nava, D.F.; Brobst, W.D.; Borkowski, R.P.; Stief, L.J. Temperature dependence of the absolute rate constant for the reaction of hydroxyl radical with hydrogen sulfide. J. Phys. Chem. 1982, 86, 81–84. [Google Scholar] [CrossRef]
- Leu, M.-T.; Smith, R.H. Rate constants for the gas-phase reaction between hydroxyl and hydrogen sulfide over the temperature range 228 to 518 K. J. Phys. Chem. 1982, 86, 73–81. [Google Scholar] [CrossRef]
- Alday, B.; Johnson, R.; Li, J.; Guo, H. Hemibond complexes between H2S and free radicals (F, Cl, Br, and OH). Theor. Chem. Acc. 2014, 133, 1540. [Google Scholar] [CrossRef]
- Uchimaru, T.; Tsuzuki, S.; Sugie, M.; Tokuhashi, K.; Sekiya, A. A theoretical study on the strength of two-center three-electron bond in (CH3)2S–OH and H2S–OH adducts. Chem. Phys. Lett. 2005, 408, 216–220. [Google Scholar] [CrossRef]
- Shao, K.; Chen, J.; Zhao, Z.; Zhang, D.H. Communication: Fitting potential energy surfaces with fundamental invariant neural network. J. Chem. Phys. 2016, 145, 071101. [Google Scholar] [CrossRef] [PubMed]
- Espinosa-García, J.; Bravo, J.L.; Rangel, C. New Analytical Potential Energy Surface for the F(2P) + CH4 Hydrogen Abstraction Reaction: Kinetics and Dynamics. J. Phys. Chem. A 2007, 111, 2761–2771. [Google Scholar] [CrossRef] [PubMed]
- Espinosa-García, J.; Bravo, J.L. State-to-State Dynamics Analysis of the F + CHD3 Reaction: A Quasiclassical Trajectory Study. J. Phys. Chem. A 2008, 112, 6059–6065. [Google Scholar] [CrossRef]
- Corchado, J.C.; Espinosa-Garcia, J. Product Vibrational Distributions in Polyatomic Species Based on Quasiclassical Trajectory Calculations. Phys. Chem. Chem. Phys. 2009, 11, 10157–10164. [Google Scholar] [CrossRef]
- Czakó, G.; Bowman, J.M. Quasiclassical Trajectory Calculations of Correlated Product Distributions for the F+CHD3(v1=0,1) Reactions Using an Ab Initio Potential Energy Surface. J. Chem. Phys. 2009, 131, 244302. [Google Scholar] [CrossRef]
- Rauhut, G.; Knizia, G.; Werner, H.-J. Accurate calculation of vibrational frequencies using explicitly correlated coupled-cluster theory. J. Chem. Phys. 2009, 130, 054105. [Google Scholar] [CrossRef]
- Shiozaki, T.; Werner, H.-J. Multireference explicitly correlated F12 theories. Mol. Phys. 2013, 111, 607–630. [Google Scholar] [CrossRef]
- Werner, H.-J.; Knowles, P.J.; Knizia, G.; Manby, F.R.; Schuetz, M. Molpro: A general-purpose quantum chemistry program package. Wiley Interdiscip. Rev. Comput. Mol. Sci. 2012, 2, 242–253. [Google Scholar] [CrossRef]
- Frisch, M.J.; Trucks, G.W.; Schlegel, H.B.; Scuseria, G.E.; Robb, M.A.; Cheeseman, J.R.; Scalmani, G.; Barone, V.; Petersson, G.A.; Nakatsuji, H.; et al. Gaussian 09, Revision B.01; Gaussian, Inc.: Wallingford, CT, UK, 2009.
- Braams, B.J.; Bowman, J.M. Permutationally invariant potential energy surfaces in high dimensionality. Int. Rev. Phys. Chem. 2009, 28, 577–606. [Google Scholar] [CrossRef]
- Xie, Z.; Bowman, J.M. Permutationally Invariant Polynomial Basis for Molecular Energy Surface Fitting via Monomial Symmetrization. J. Chem. Theory Comput. 2009, 6, 26–34. [Google Scholar] [CrossRef] [PubMed]
- Hagan, M.T.; Menhaj, M.B. Training feedforward networks with the Marquardt algorithm. IEEE Trans. Neural Netw. 1994, 5, 989–993. [Google Scholar] [CrossRef] [PubMed]
- Hase, W.L.; Duchovic, R.J.; Hu, X.; Komornicki, A.; Lim, K.F.; Lu, D.-H.; Peslherbe, G.H.; Swamy, K.N.; Vande Linde, S.R.; Varandas, A.; et al. VENUS96: A general chemical dynamics computer program. Quantum Chem. Program Exch. Bull. 1996, 16, 43. [Google Scholar]
- Eaker, C.W.; Schatz, G.C.; De Leon, N.; Heller, E.J. Fourier Transform Methods for Calculating Action Variables and Semiclassical Eigenvalues for Coupled Oscillator Systems. J. Chem. Phys. 1984, 81, 5913–5919. [Google Scholar] [CrossRef]
- Eaker, C.W.; Schatz, G.C. Semiclassical Vibrational Eigenvalues of Triatomic Molecules: Application of the FFT Method to SO2, H2O, H3+, and CO2. J. Chem. Phys. 1984, 81, 2394–2399. [Google Scholar] [CrossRef]
- Skodje, R.T.; Borondo, F.; Reinhardt, W.P. The Semiclassical Quantization of Nonseparable Systems Using the Method of Adiabatic Switching. J. Chem. Phys. 1985, 82, 4611–4632. [Google Scholar] [CrossRef]
- Espinosa-García, J.; Corchado, J.C. Quasi-Classical Trajectory Calculations of the Hydrogen Abstraction Reaction H + NH3. J. Phys. Chem. A 2010, 114, 6194–6200. [Google Scholar] [CrossRef]
- Espinosa-Garcia, J. Quasi-Classical Trajectory Study of the Vibrational and Translational Effects on the O(3P) + CD4 Reaction. J. Phys. Chem. A 2014, 118, 3572–3579. [Google Scholar] [CrossRef]
- Ping, L.; Tian, L.; Song, H.; Yang, M. New Method To Extract Final-State Information of Polyatomic Reactions Based on Normal Mode Analysis. J. Phys. Chem. A 2018, 122, 6997–7005. [Google Scholar] [CrossRef]
- Zhu, Y.; Ping, L.; Bai, M.; Liu, Y.; Song, H.; Li, J.; Yang, M. Tracking the Energy Flow in the Hydrogen Exchange Reaction OH + H2O → H2O + OH. Phys. Chem. Chem. Phys. 2018, 20, 12543–12556. [Google Scholar] [CrossRef]
- Tian, L.; Zhu, Y.; Song, H.; Yang, M. Theoretical study of the F(2P) + NH3 → HF + NH2 reaction on an accurate potential energy surface: Dynamics and kinetics. Phys. Chem. Chem. Phys. 2019, 21, 11385–11394. [Google Scholar] [CrossRef] [PubMed]
- Czakó, G. Gaussian Binning of the Vibrational Distributions for the Cl + CH4(v4/2 = 0, 1) → H + CH3Cl(n1n2n3n4n5n6) Reactions. J. Phys. Chem. A 2012, 116, 7467–7473. [Google Scholar] [CrossRef] [PubMed]
- Jiang, B.; Guo, H. Relative efficacy of vibrational vs. translational excitation in promoting atom-diatom reactivity: Rigorous examination of Polanyi’s rules and proposition of sudden vector projection (SVP) model. J. Chem. Phys. 2013, 138, 234104. [Google Scholar] [CrossRef]
- Guo, H.; Jiang, B. The Sudden Vector Projection Model for Reactivity: Mode Specificity and Bond Selectivity Made Simple. Acc. Chem. Res. 2014, 47, 3679–3685. [Google Scholar] [CrossRef] [PubMed]
- Jiang, B.; Li, J.; Guo, H. Effects of reactant rotational excitation on reactivity: Perspectives from the sudden limit. J. Chem. Phys. 2014, 140, 034112. [Google Scholar] [CrossRef]
- Jiang, B.; Yang, M.; Xie, D.; Guo, H. Quantum dynamics of polyatomic dissociative chemisorption on transition metal surfaces: Mode specificity and bond selectivity. Chem. Soc. Rev. 2016, 45, 3621–3640. [Google Scholar] [CrossRef]


Disclaimer/Publisher’s Note: The statements, opinions and data contained in all publications are solely those of the individual author(s) and contributor(s) and not of MDPI and/or the editor(s). MDPI and/or the editor(s) disclaim responsibility for any injury to people or property resulting from any ideas, methods, instructions or products referred to in the content. |
© 2023 by the authors. Licensee MDPI, Basel, Switzerland. This article is an open access article distributed under the terms and conditions of the Creative Commons Attribution (CC BY) license (https://creativecommons.org/licenses/by/4.0/).