


Integration of Decentralized Graph-Based Multi-Agent Reinforcement Learning with Digital Twin for Traffic Signal Optimization

 , and
, and
Abstract
:1. Introduction
2. Related Work
- Seamless Integration of Digital Twin and Decentralized Graph-based Multi-Agent Reinforcement Learning (DGMARL): The integration of Digital Twins and DGMARL allows for the dynamic optimization of traffic signal timing, leveraging real-time traffic data and simulation capabilities to improve traffic flow and reduce congestion.
- Distributed Multi-Agent Reinforcement Learning: Multi-agent reinforcement learning agents are deployed at individual intersections to observe traffic state features, including vehicle presence time in the detector zone. They exchange this information with neighboring agents to collectively determine an optimal policy for controlling traffic signals. The implementation of actions is validated against rules and constraints, such as minimum green time and pedestrian recall time, ensuring safe mobility for all users. In a coordinated multi-agent environment, the optimal policy is derived through reinforcement learning, where agents interact with the environment, learning from experiences to maximize rewards over time. Through iterative exploration, agents adjust policies to prioritize actions with higher rewards. Furthermore, agents engage in communication and coordination with neighboring agents to enhance decision-making and achieve better outcomes collectively.
- Consideration of All Directions of Traffic Demand: Unlike traditional approaches that may focus solely on specific traffic flows, the DGMARL model considers the traffic demands from all directions, ensuring a comprehensive approach to traffic signal optimization. This inclusion allows for more efficient management of traffic flow across the entire network.
- Dynamic Phasing: The DGMARL model offers dynamic phasing, enabling flexible adjustments to signal timing sequences based on evolving real-time traffic conditions. This flexibility enhances adaptability and responsiveness to changing traffic patterns and congestion levels.
- Handling Heterogeneous Data: The DGMARL model coordinates diverse data types, including vehicle presence time, count aggregates, pedestrian recall times, and current signal states, to optimize traffic flow efficiently. It achieves this through several mechanisms: feature engineering for data preprocessing, message passing and communication among agents, neural network processing to learn complex patterns, reward calculation based on coordinated data inputs, and policy optimization for dynamic signal timing decisions. By integrating these data types into a unified framework, the model performs comprehensive analysis and decision-making, enabling effective traffic management across the transportation network.
- Utilization of Component Object Model (COM) Interface: Leveraging the COM interface of PTV-Vissim, the proposed model can seamlessly take actions and control signal timing through the Digital Twins. This integration streamlines the implementation of optimized signal timing strategies in real-world traffic scenarios.
3. Digital Twin System for Traffic Network
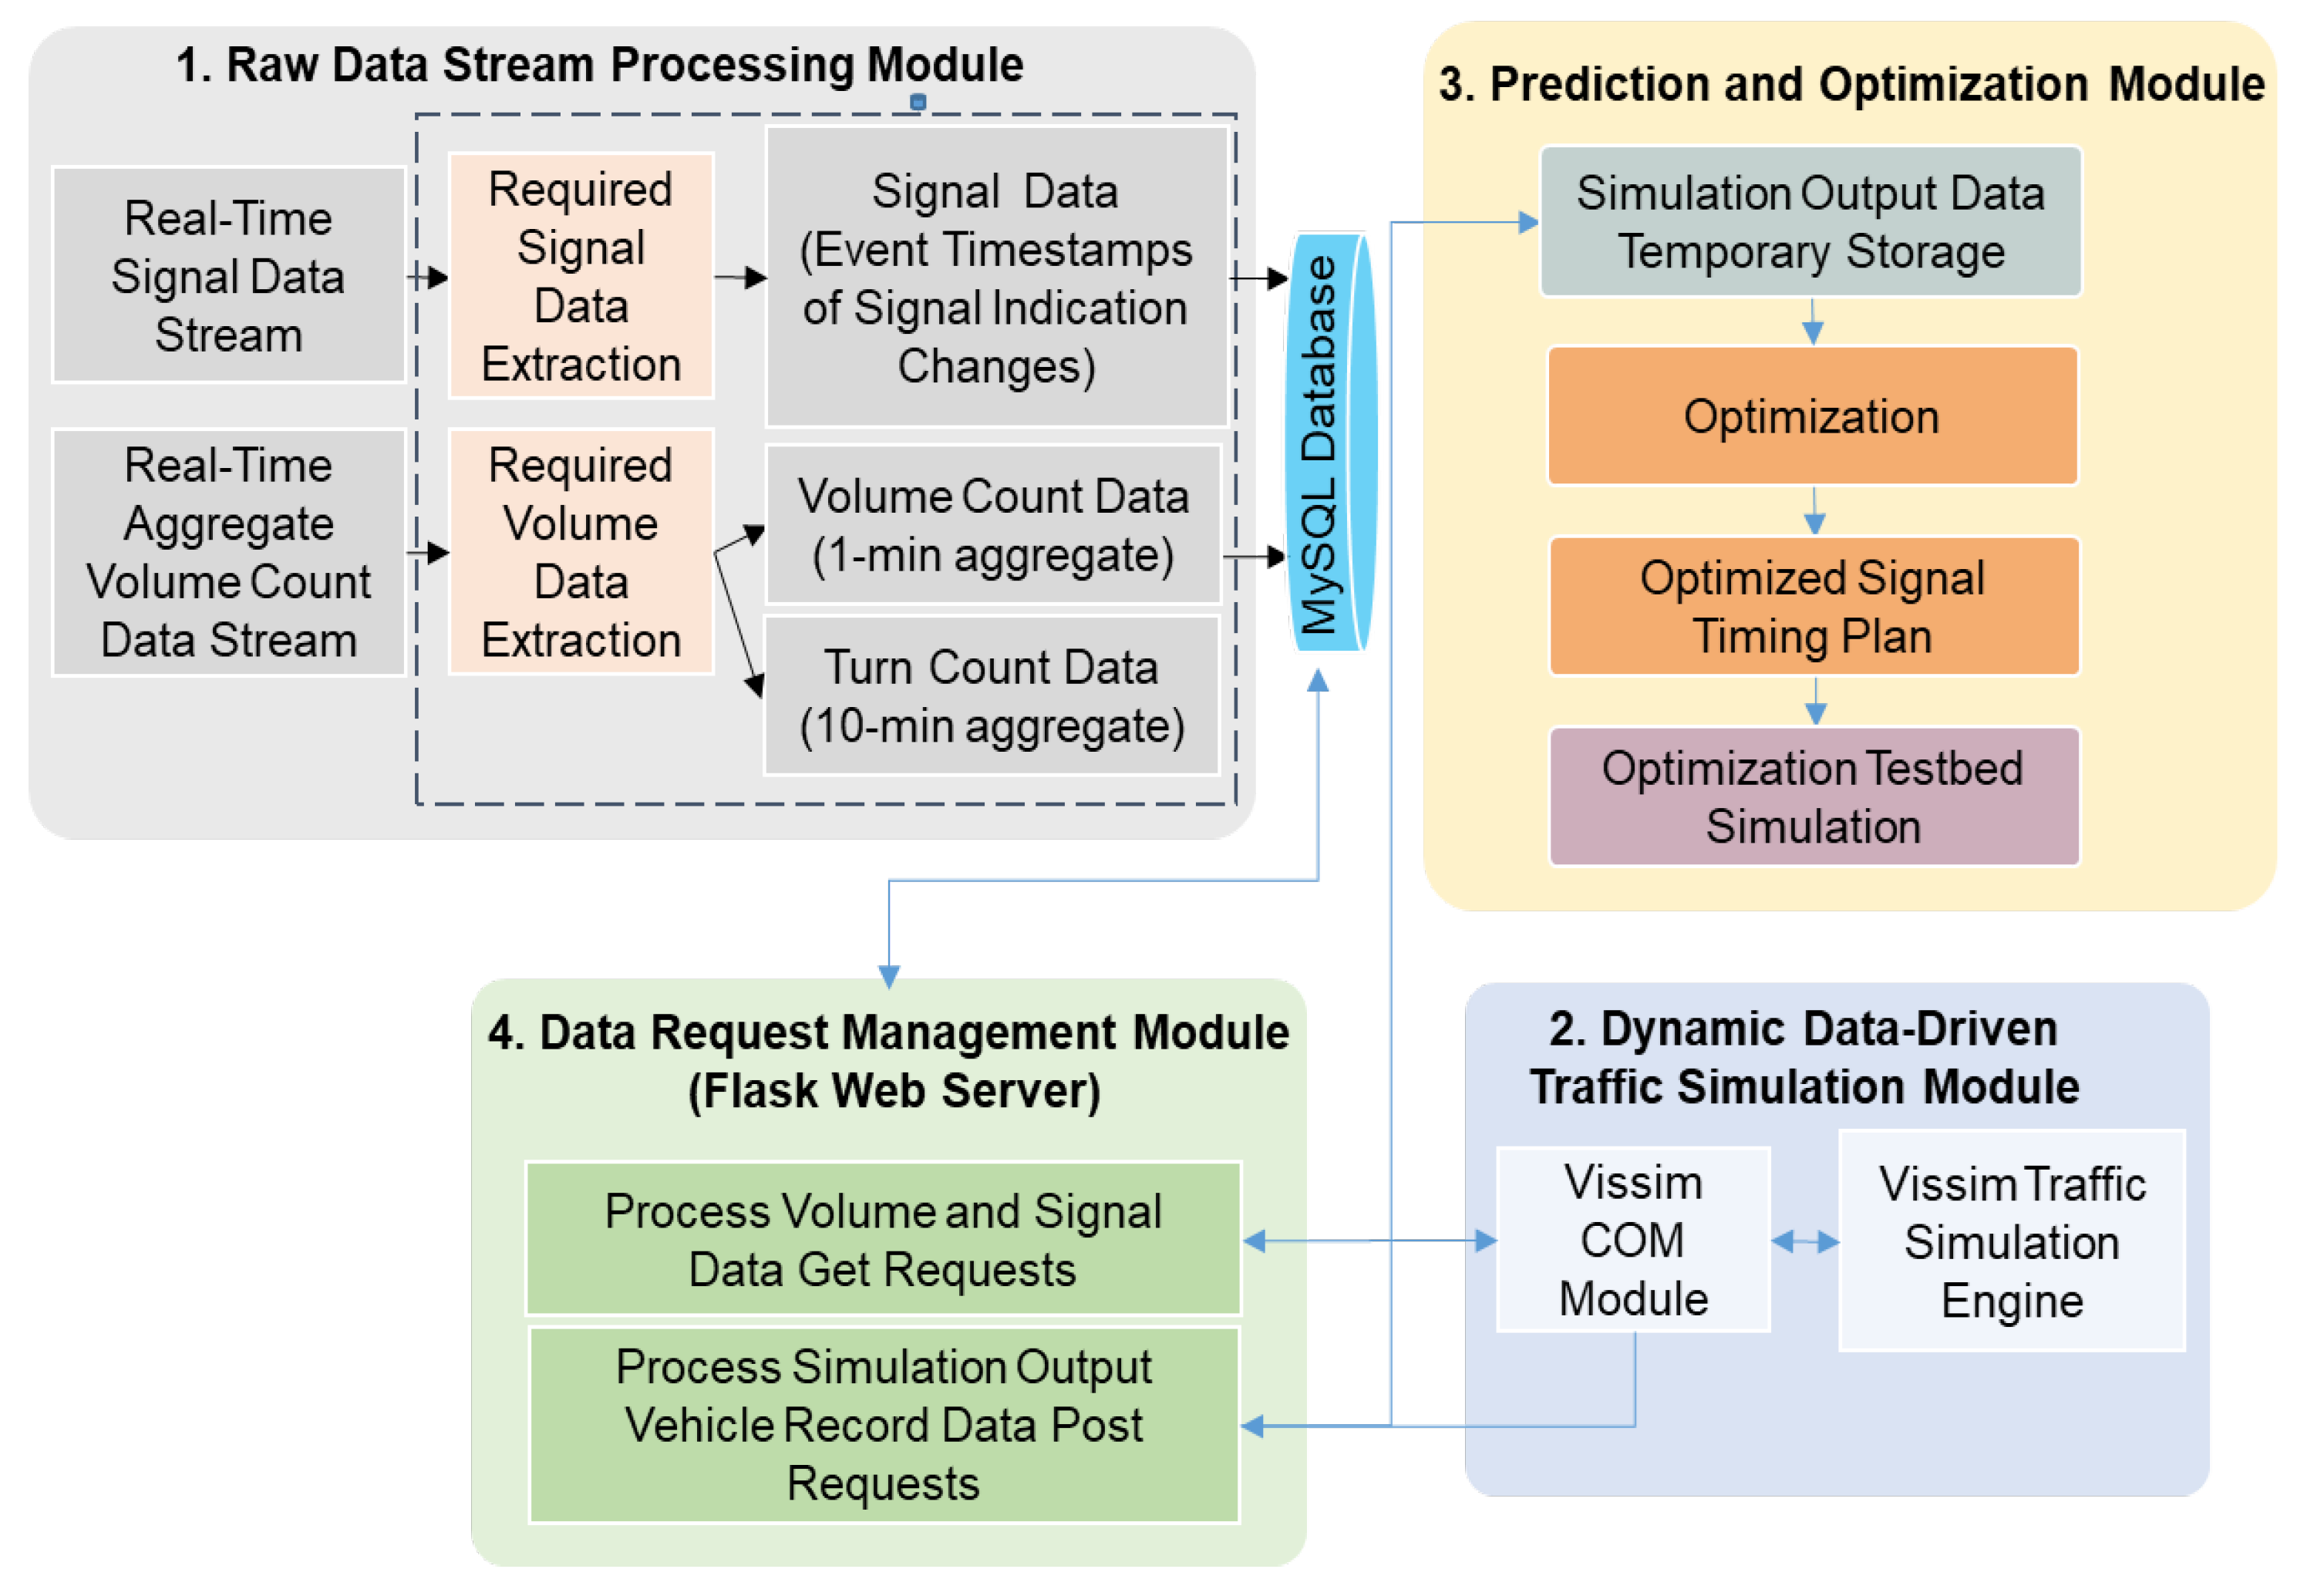
3.1. Physical Environment and Digital Twin
3.1.1. Digital Twin Architecture
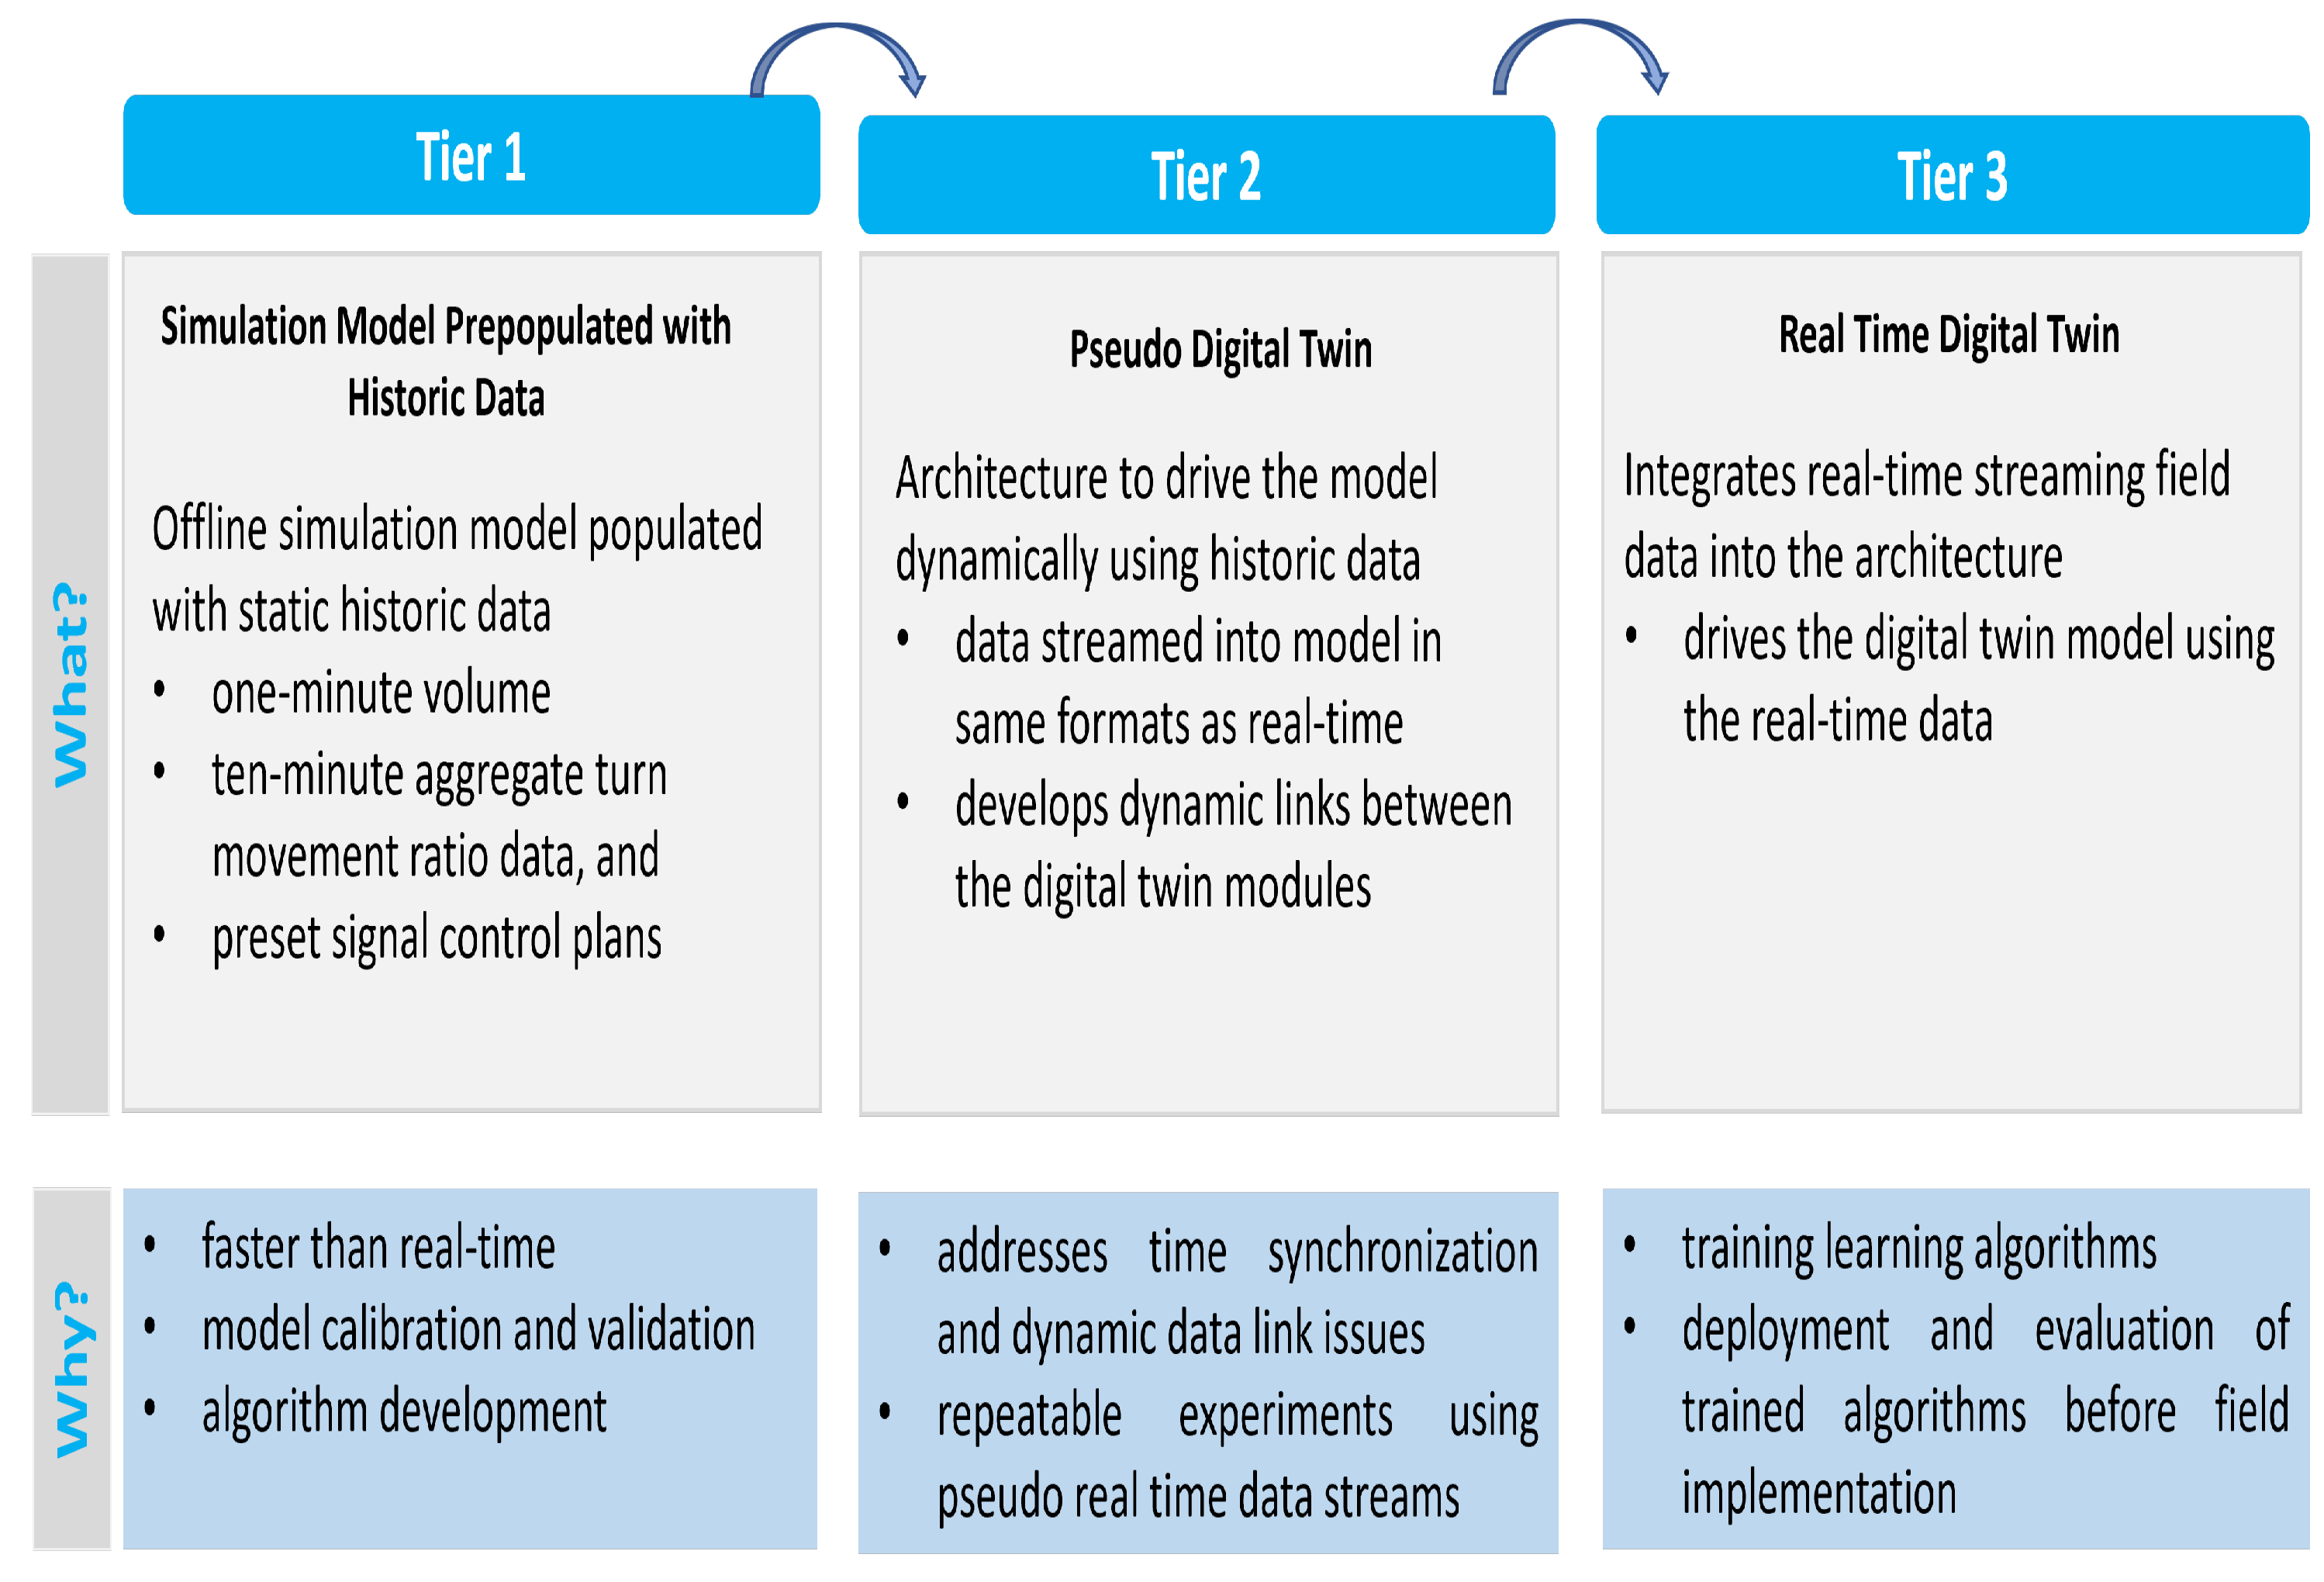
3.1.2. Muti-Tier Incremental Approach for Digital Twin Development
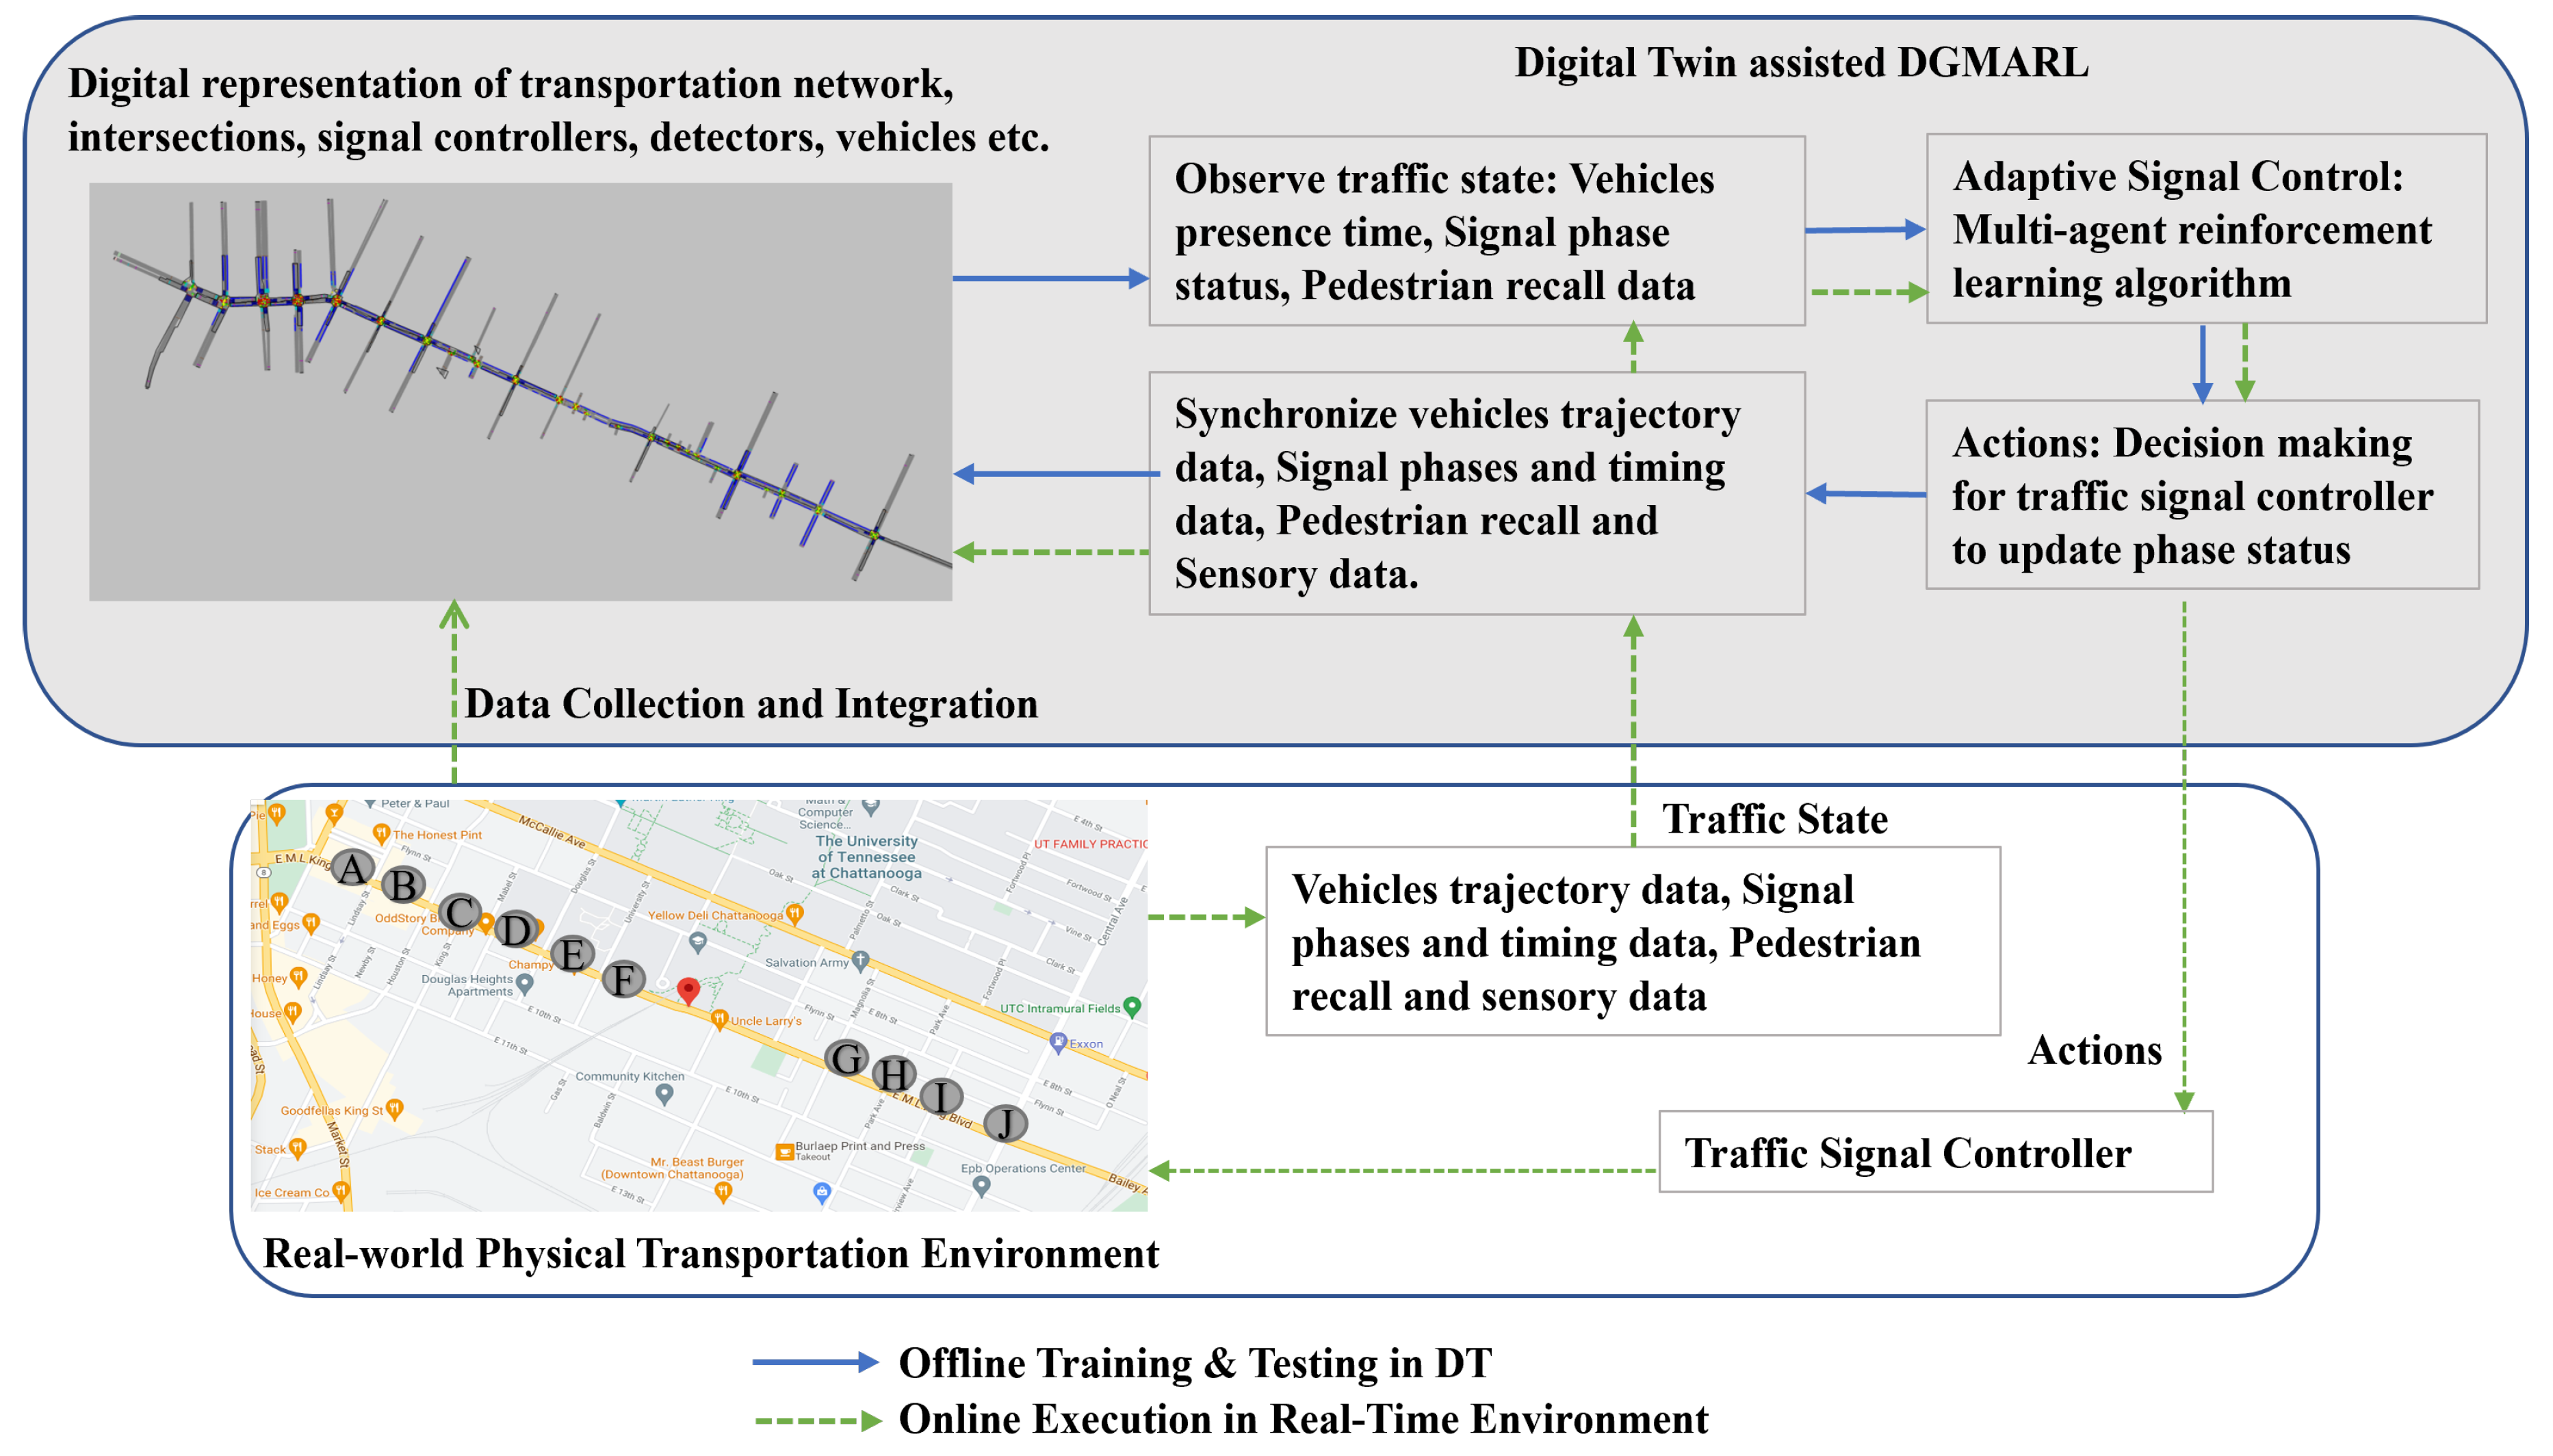
4. Digital Twin and Reinforcement Learning (RL)
- The decentralized multi-agent reinforcement learning algorithm leverages inputs such as vehicle presence time in the detector zone, current phase state, pedestrian recall time, etc., obtained from the Digital Twins. It then makes decisions, determining whether to maintain the current signal phase or switch to a phase with anticipated high traffic demand following a dynamic phasing approach. This decision is based on the current state of the intersection and the desired objective, which is to minimize the Eco_PI measure.
- The decision made by the decentralized multi-agent reinforcement learning algorithm is fed back to the Digital Twins, prompting an update to its simulation based on the decision. The updated simulation is subsequently utilized to provide new inputs to the decentralized multi-agent reinforcement learning algorithm. This iterative process continues until the desired optimization objective is achieved.
5. Implementation of Intelligent Agents to Optimize the Global Transportation
- Positive Impacts on Quality of Life, Environment, and Economic Growth: The deployment of intelligent agents has a direct positive impact on people’s quality of life by reducing congestion and improving travel experiences. Environmental benefits are realized through eco-friendly transportation practices promoted by optimized traffic flow. Economic growth is fostered as efficient transportation networks contribute to smoother logistics and infrastructure support
- Real-Time Traffic Optimization: Intelligent agents actively monitor real-time traffic conditions, offering dynamic recommendations to drivers. This includes suggesting alternate routes to avoid congestion, adjusting traffic signals for improved flow, and predicting maintenance needs [69].
- Optimized Resource Allocation and Safety Monitoring: Resource allocation is optimized for emergency vehicles, buses, trains, and other vehicles based on real-time demands. Safety is paramount, with intelligent agents detecting potential problems early [70,71,72]. This proactive approach contributes to a safer transportation environment.
- Comprehensive Situational Awareness: Processing and analyzing the traffic data is highly computationally costly and graph framework provides highly scalable strategies. Graph representation, employing nodes for intersections and edges for routes, provides a holistic view of the entire transportation network. Intelligent agents utilize this graph to track vehicle trajectory [73,74], predict congestion, optimize traffic states, and enhance overall situational awareness by efficiently monitoring the entire network [75,76,77]. This approach enables precise monitoring and analysis of traffic states within the transportation network, facilitating comprehensive situational awareness. By representing the transportation network as a graph, agents can analyze connectivity between intersections, assess traffic flow patterns, and identify potential bottlenecks or congestion points. This graphical representation empowers agents to make informed decisions regarding traffic signal control, route planning, and overall network management, leading to improved situational awareness and enhanced traffic management strategies.
- Integration of Machine Learning Algorithms: Reinforcement learning algorithms are seamlessly integrated, enabling agents to learn traffic patterns from both historical and real-time data. This integration enhances their adaptability to dynamic traffic conditions. By continuously observing and analyzing traffic data, the algorithm can respond to different traffic conditions such as anomalies, allowing agents to adapt and optimize traffic signal timing dynamically. This adaptability ensures that traffic management strategies remain effective in response to changing traffic patterns and unforeseen events, ultimately leading to improved traffic flow and congestion mitigation.
- Traffic Signal Control Optimization: Intelligent agents interact with local signal controllers, leveraging graph-based insights to optimize traffic signal timings by analyzing sensor data from key locations and communicating with local signal controllers [78,79]. This dynamic control mechanism helps in avoiding congestion and improving traffic flow.
- Challenges in Single-Agent Architecture: Centralized agents face limitations in processing, communication, and latency as the transportation network grows. Effectiveness in smaller networks may not translate to larger networks due to increasing demands.
- Multi-Agent Architecture for Scalability: Multiple agents, operating independently, optimize traffic signal timings at different intersections within the network. Asynchronous communication protocols, including message passing and attention mechanisms, reduce communication overhead [80]. Distribution of workload and efficient utilization of local data enhance scalability for larger volumes of data and intersections [22,23,81].
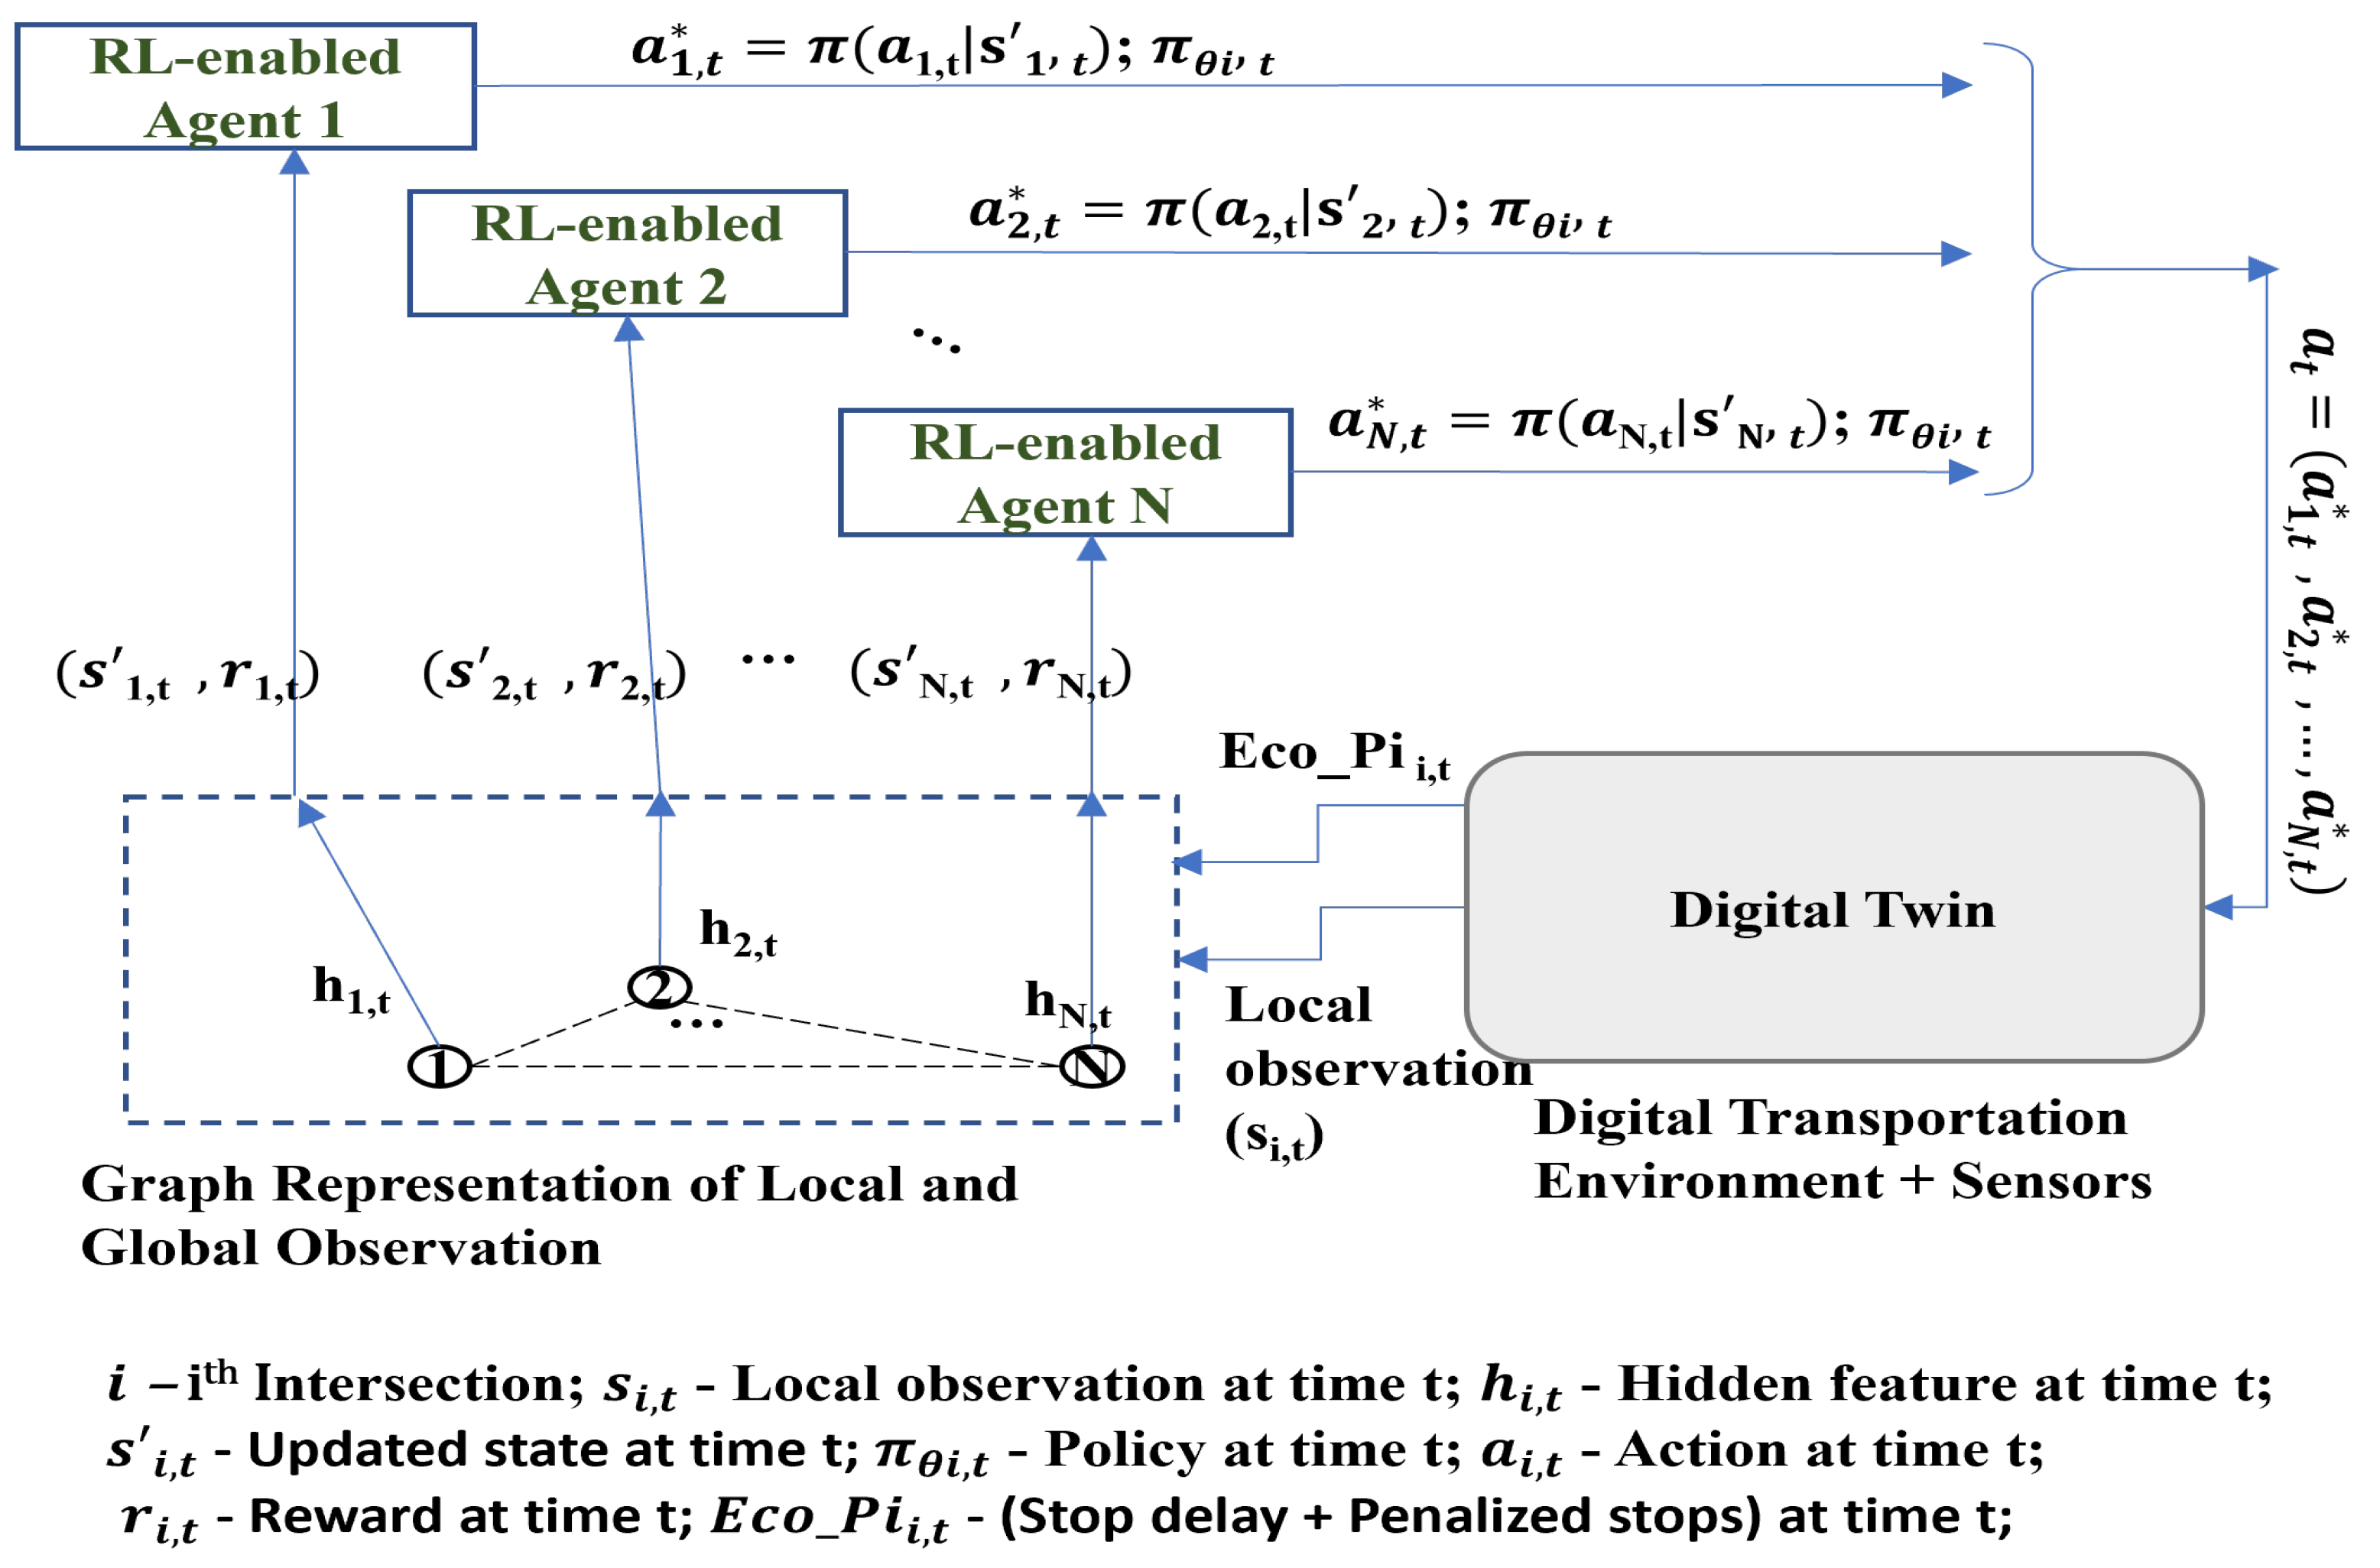
5.1. Graph Neural Network Formulation of Traffic Network
Graph Representation of Traffic Network
5.2. Infrastructure of DGMARL
5.2.1. State Space
5.2.2. Action Space
5.2.3. Reward Based on Eco_PI
5.2.4. Spatio-Temporal Multi-Agent Reinforcement Learning
5.3. Digital Twin Assisted Method
| Algorithm 1 Digital Twin assisted DGMARL Learning |
Require learning rate, entropy coefficient. Ensure: Initialize PTV-Vissim objects Vissim, Net, Links, Signal Controllers, and Signal Groups. Ensure: Initialize graph , agent , link , physical constraints , policy network parameters , and value network parameters .
|
6. Experiments
6.1. Experiment Design
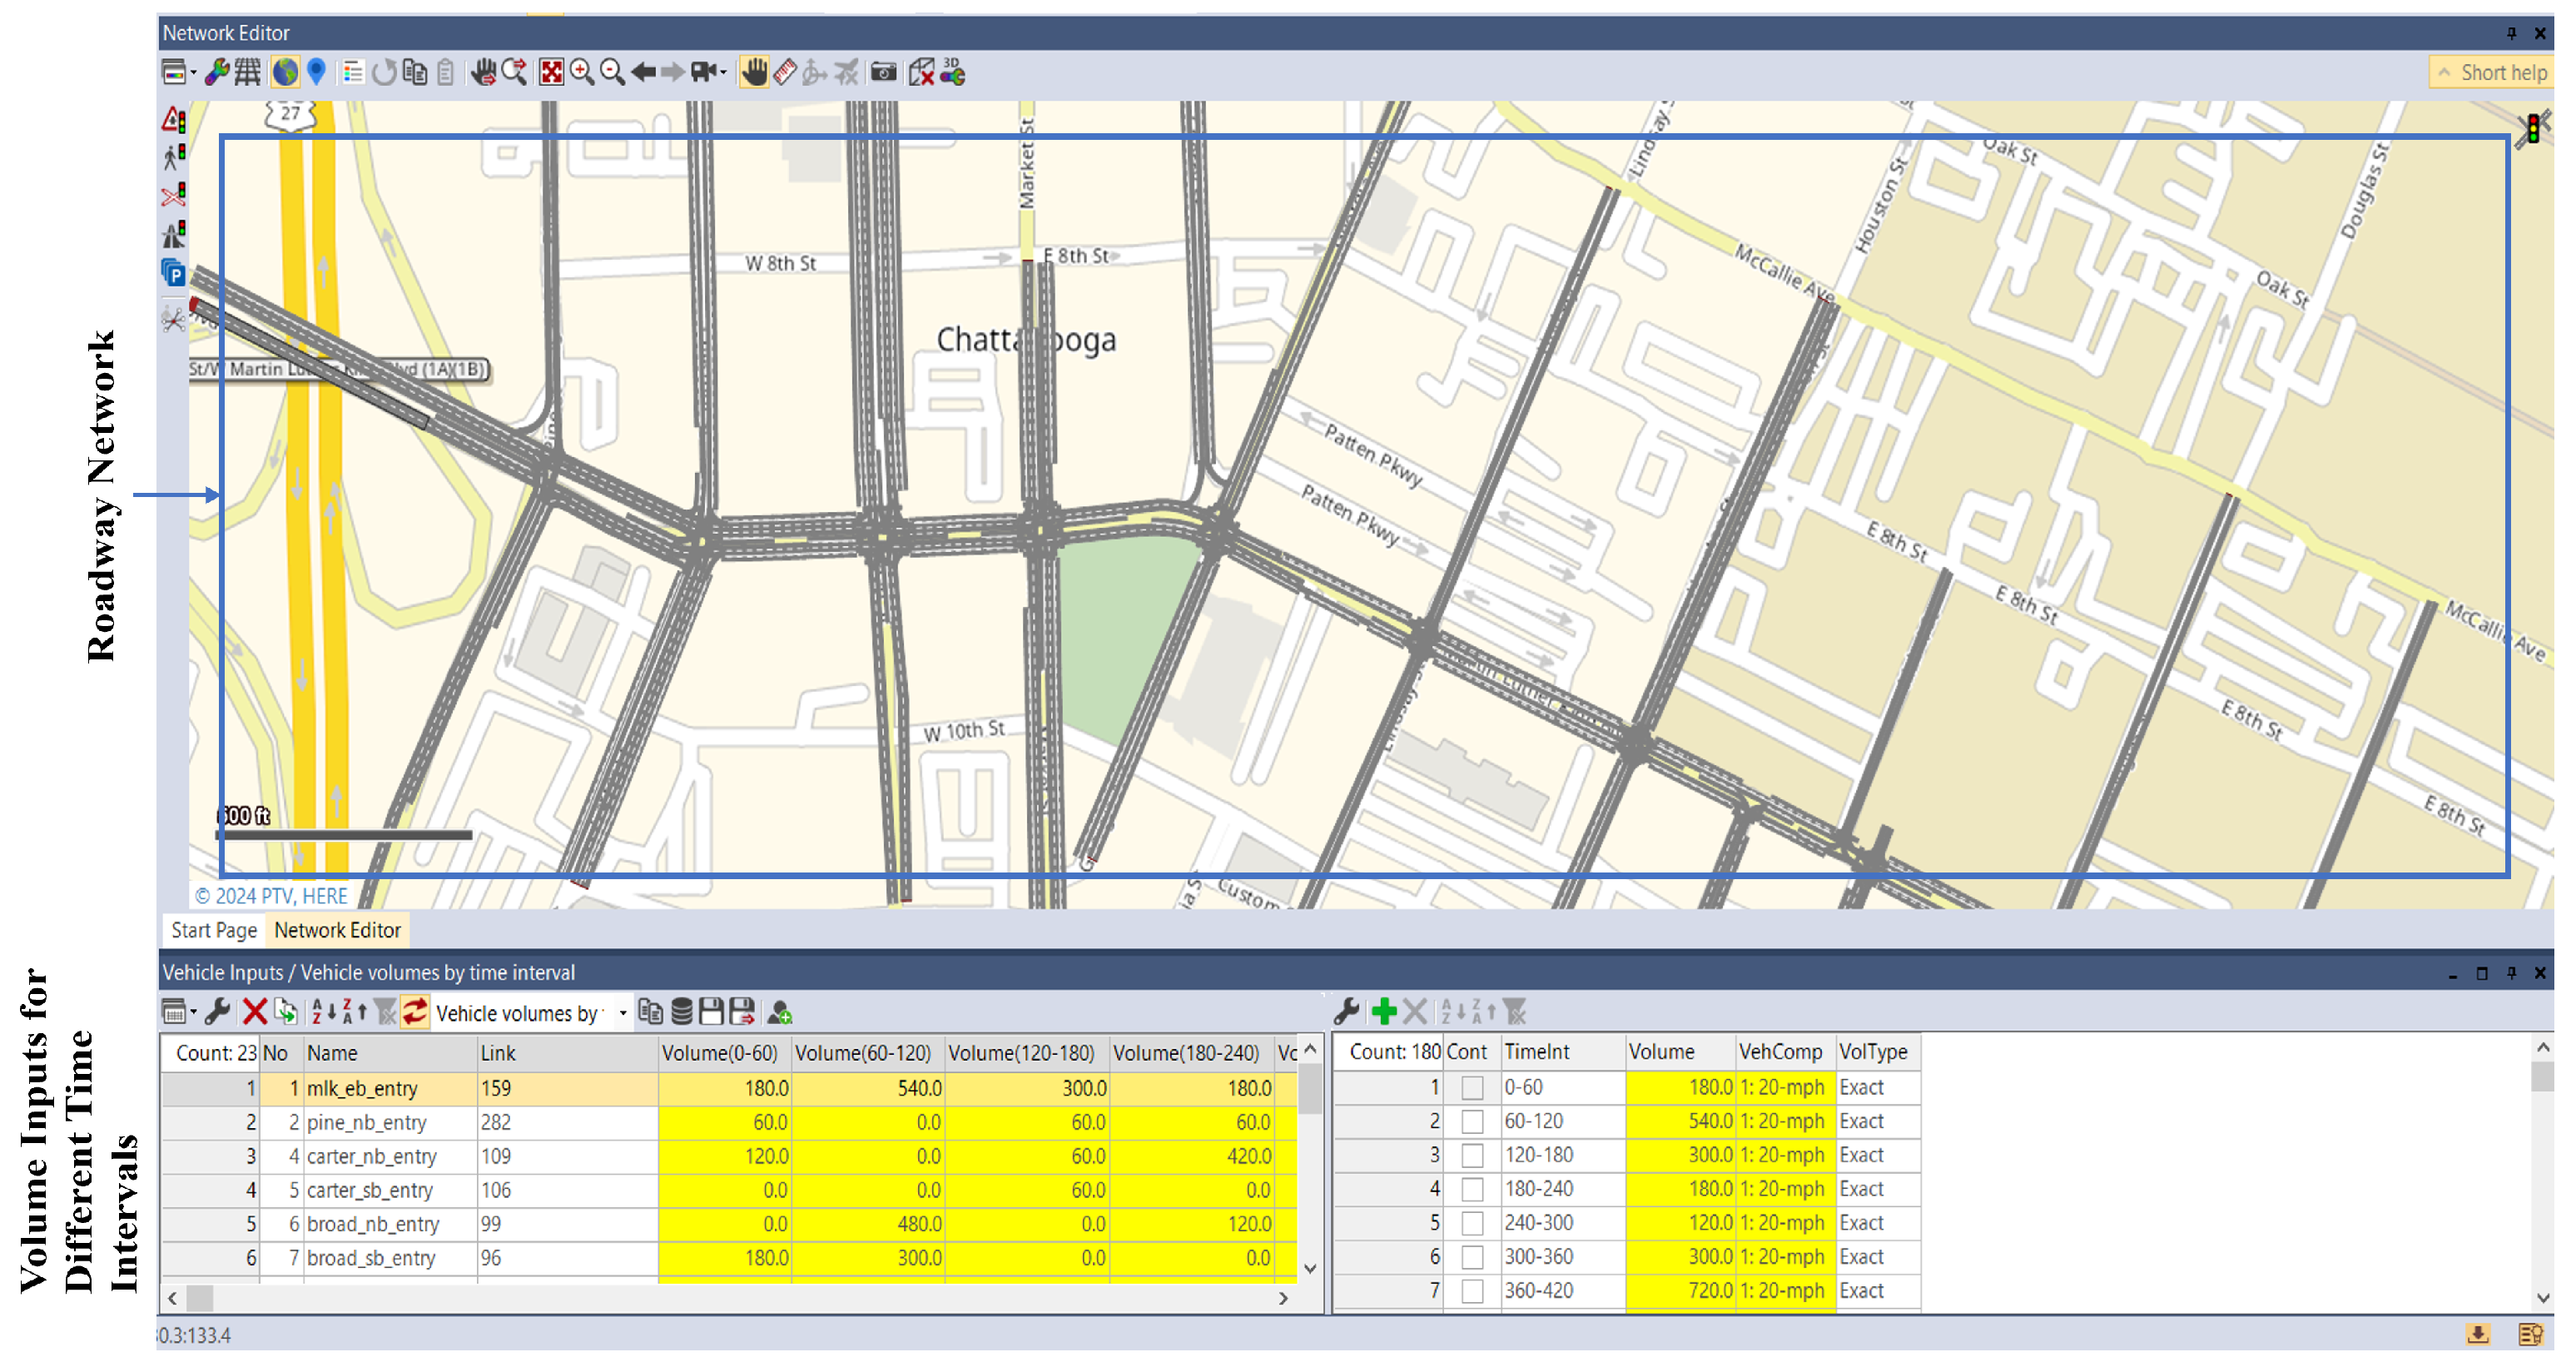
6.2. Digital Twin Setup
6.3. Impact of the Application of the Proposed Model
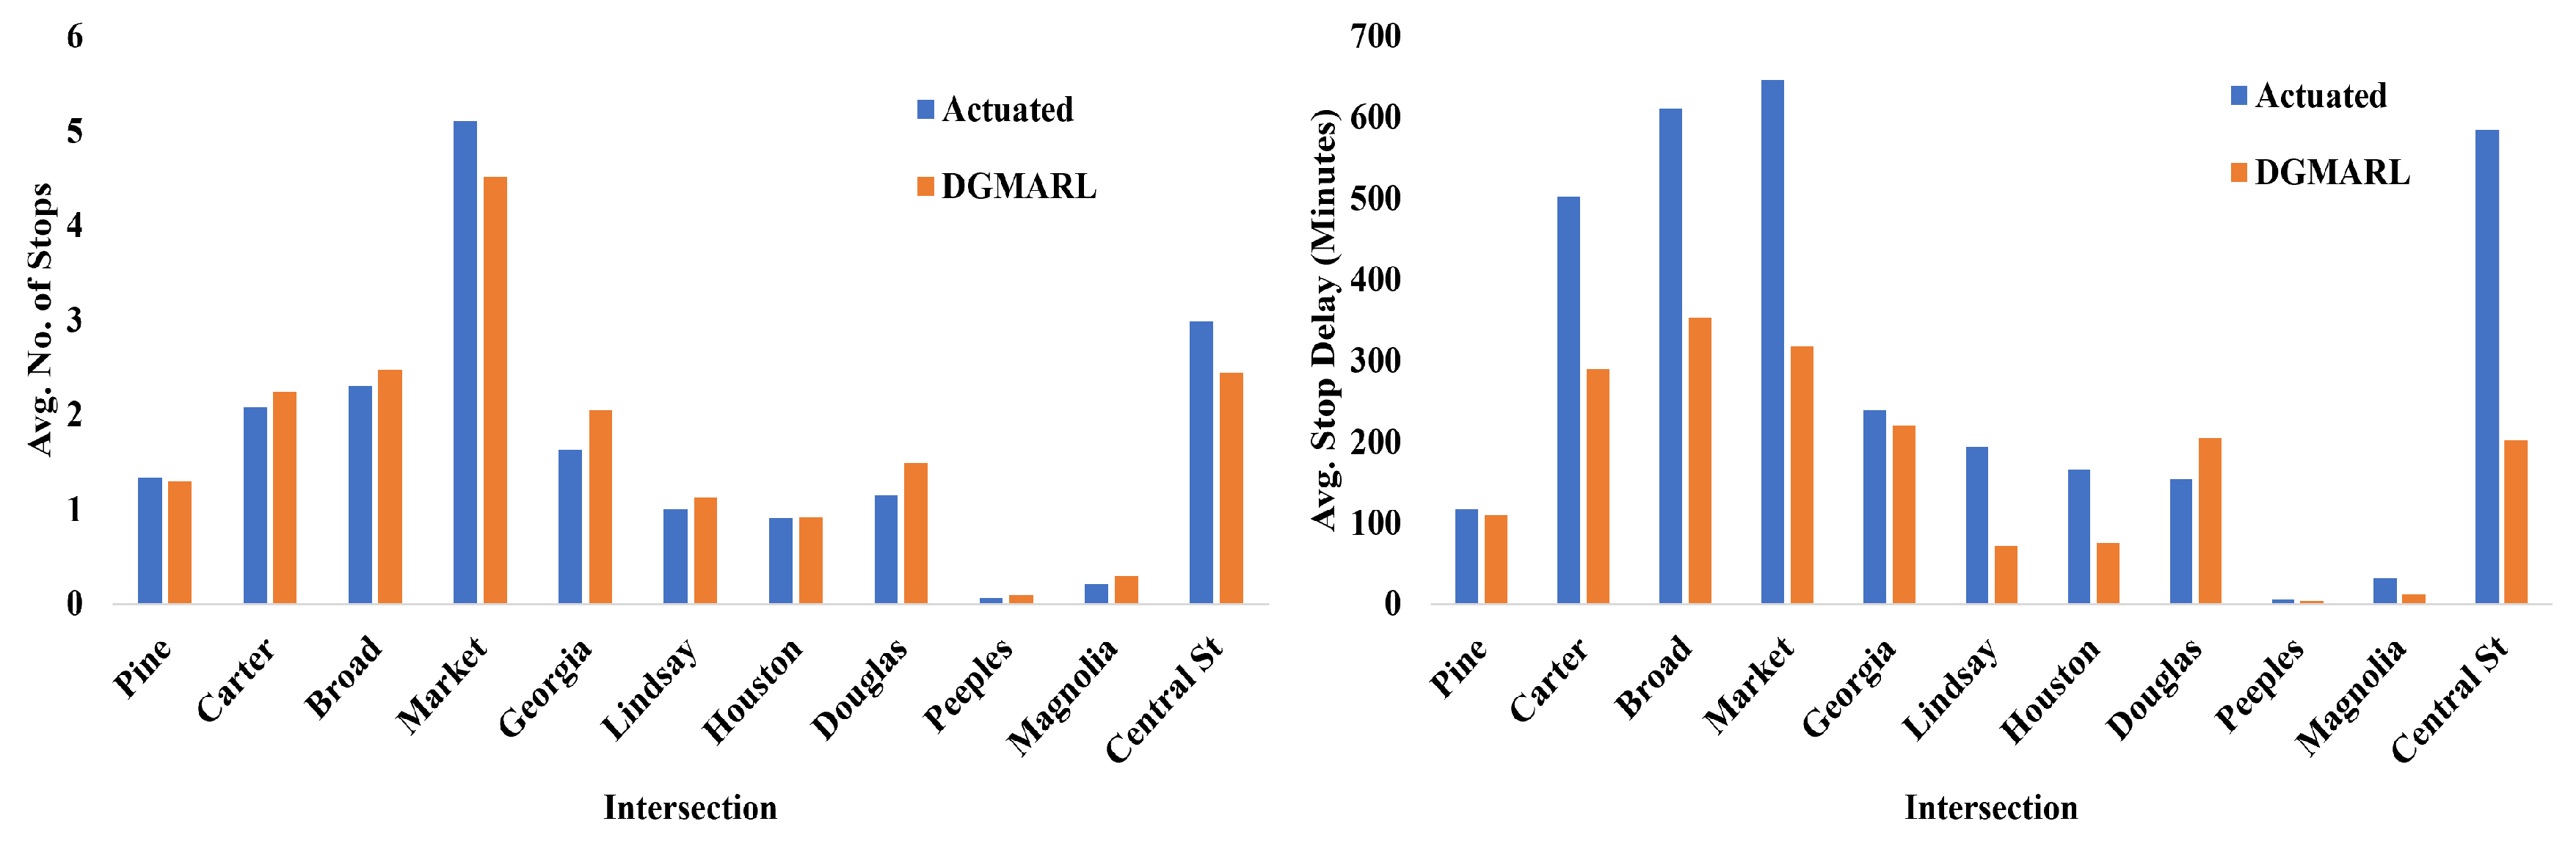
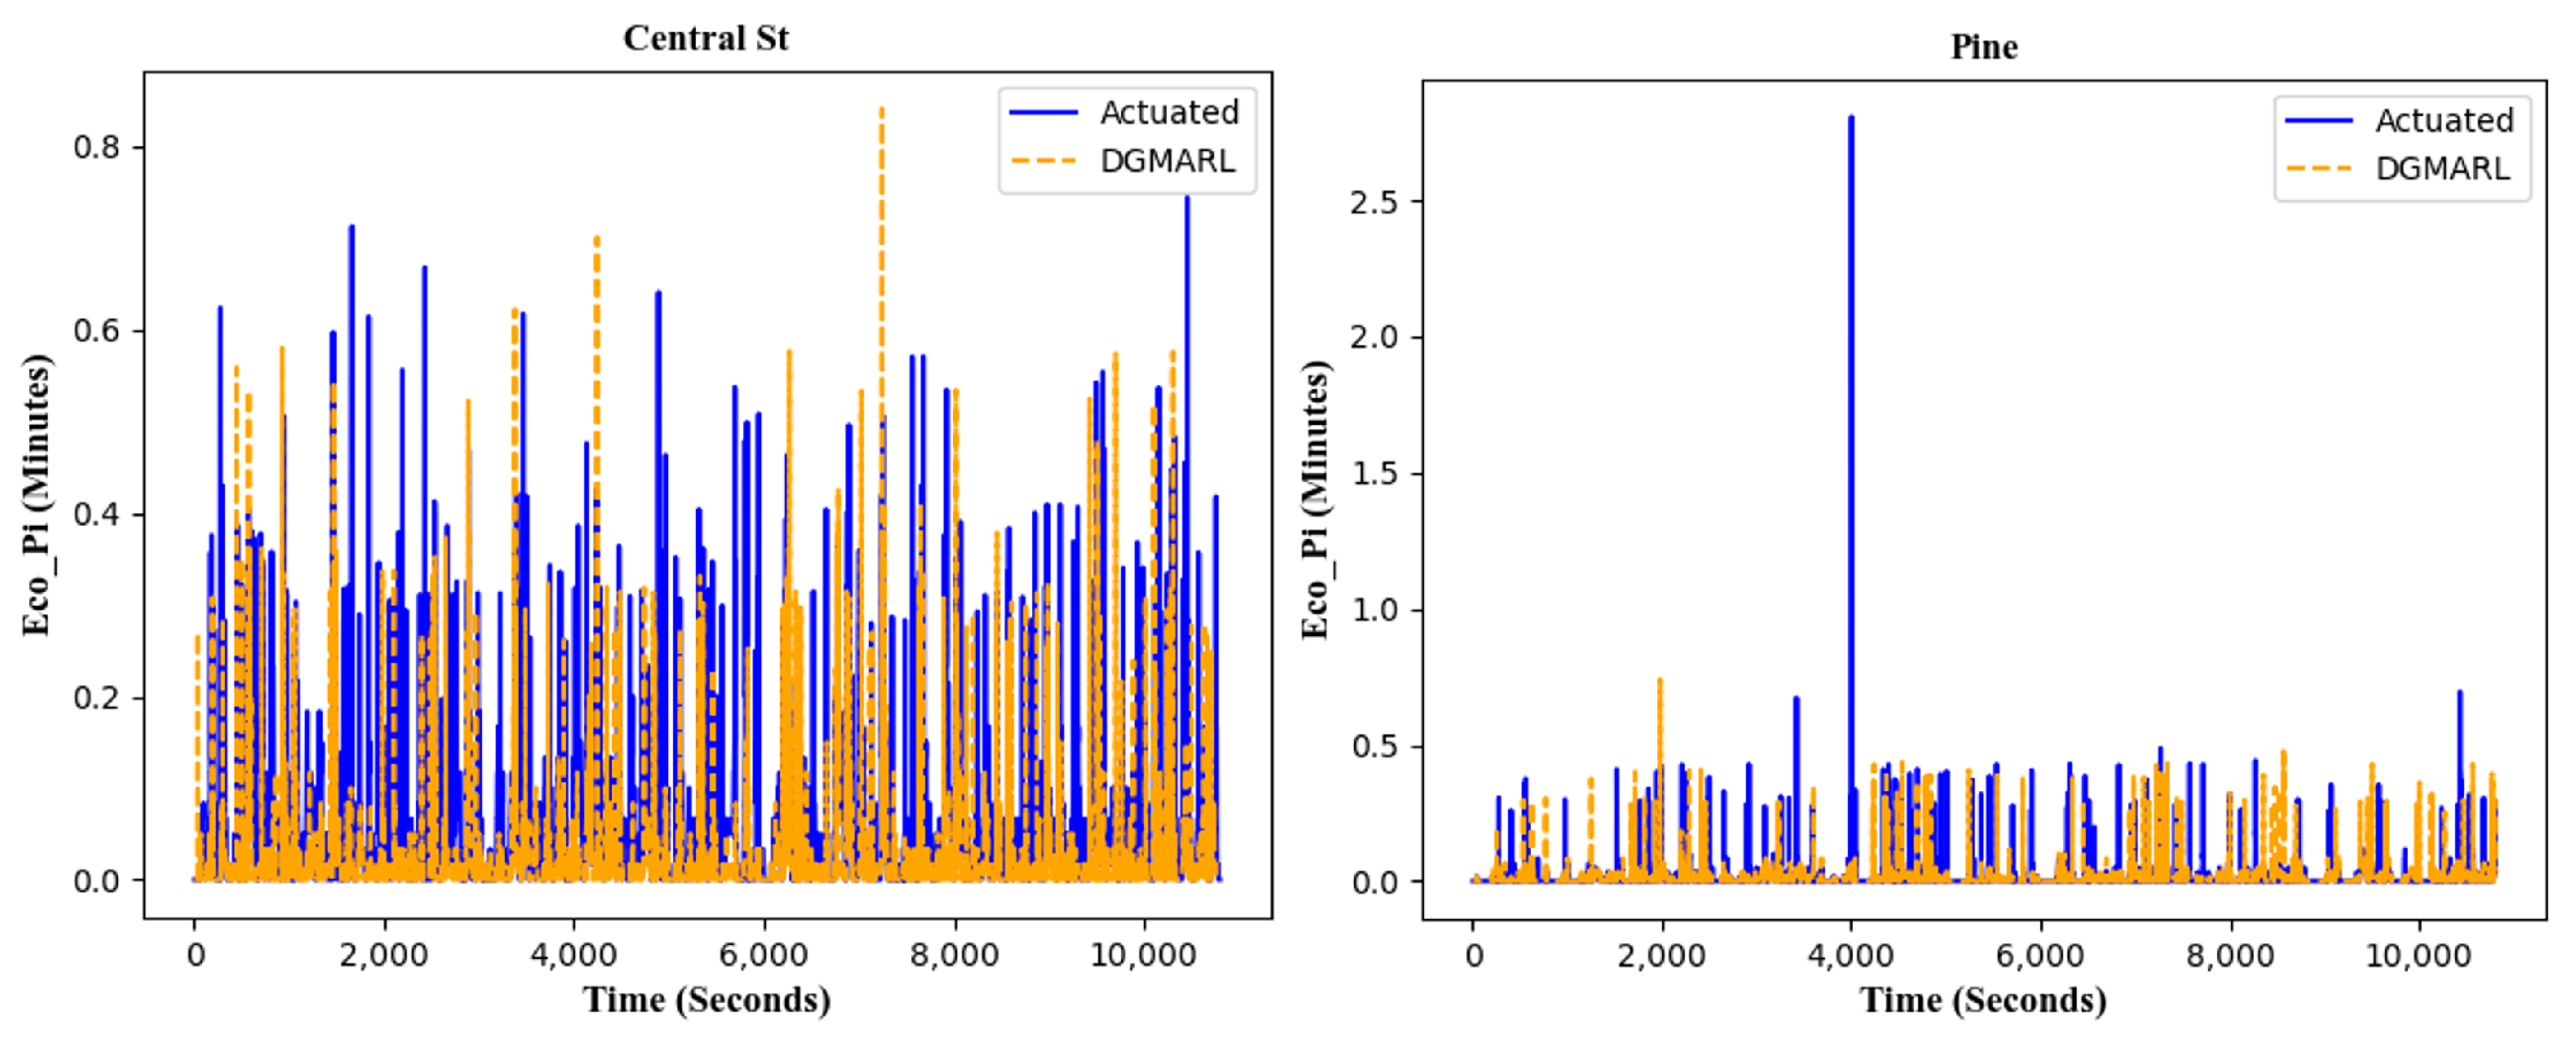
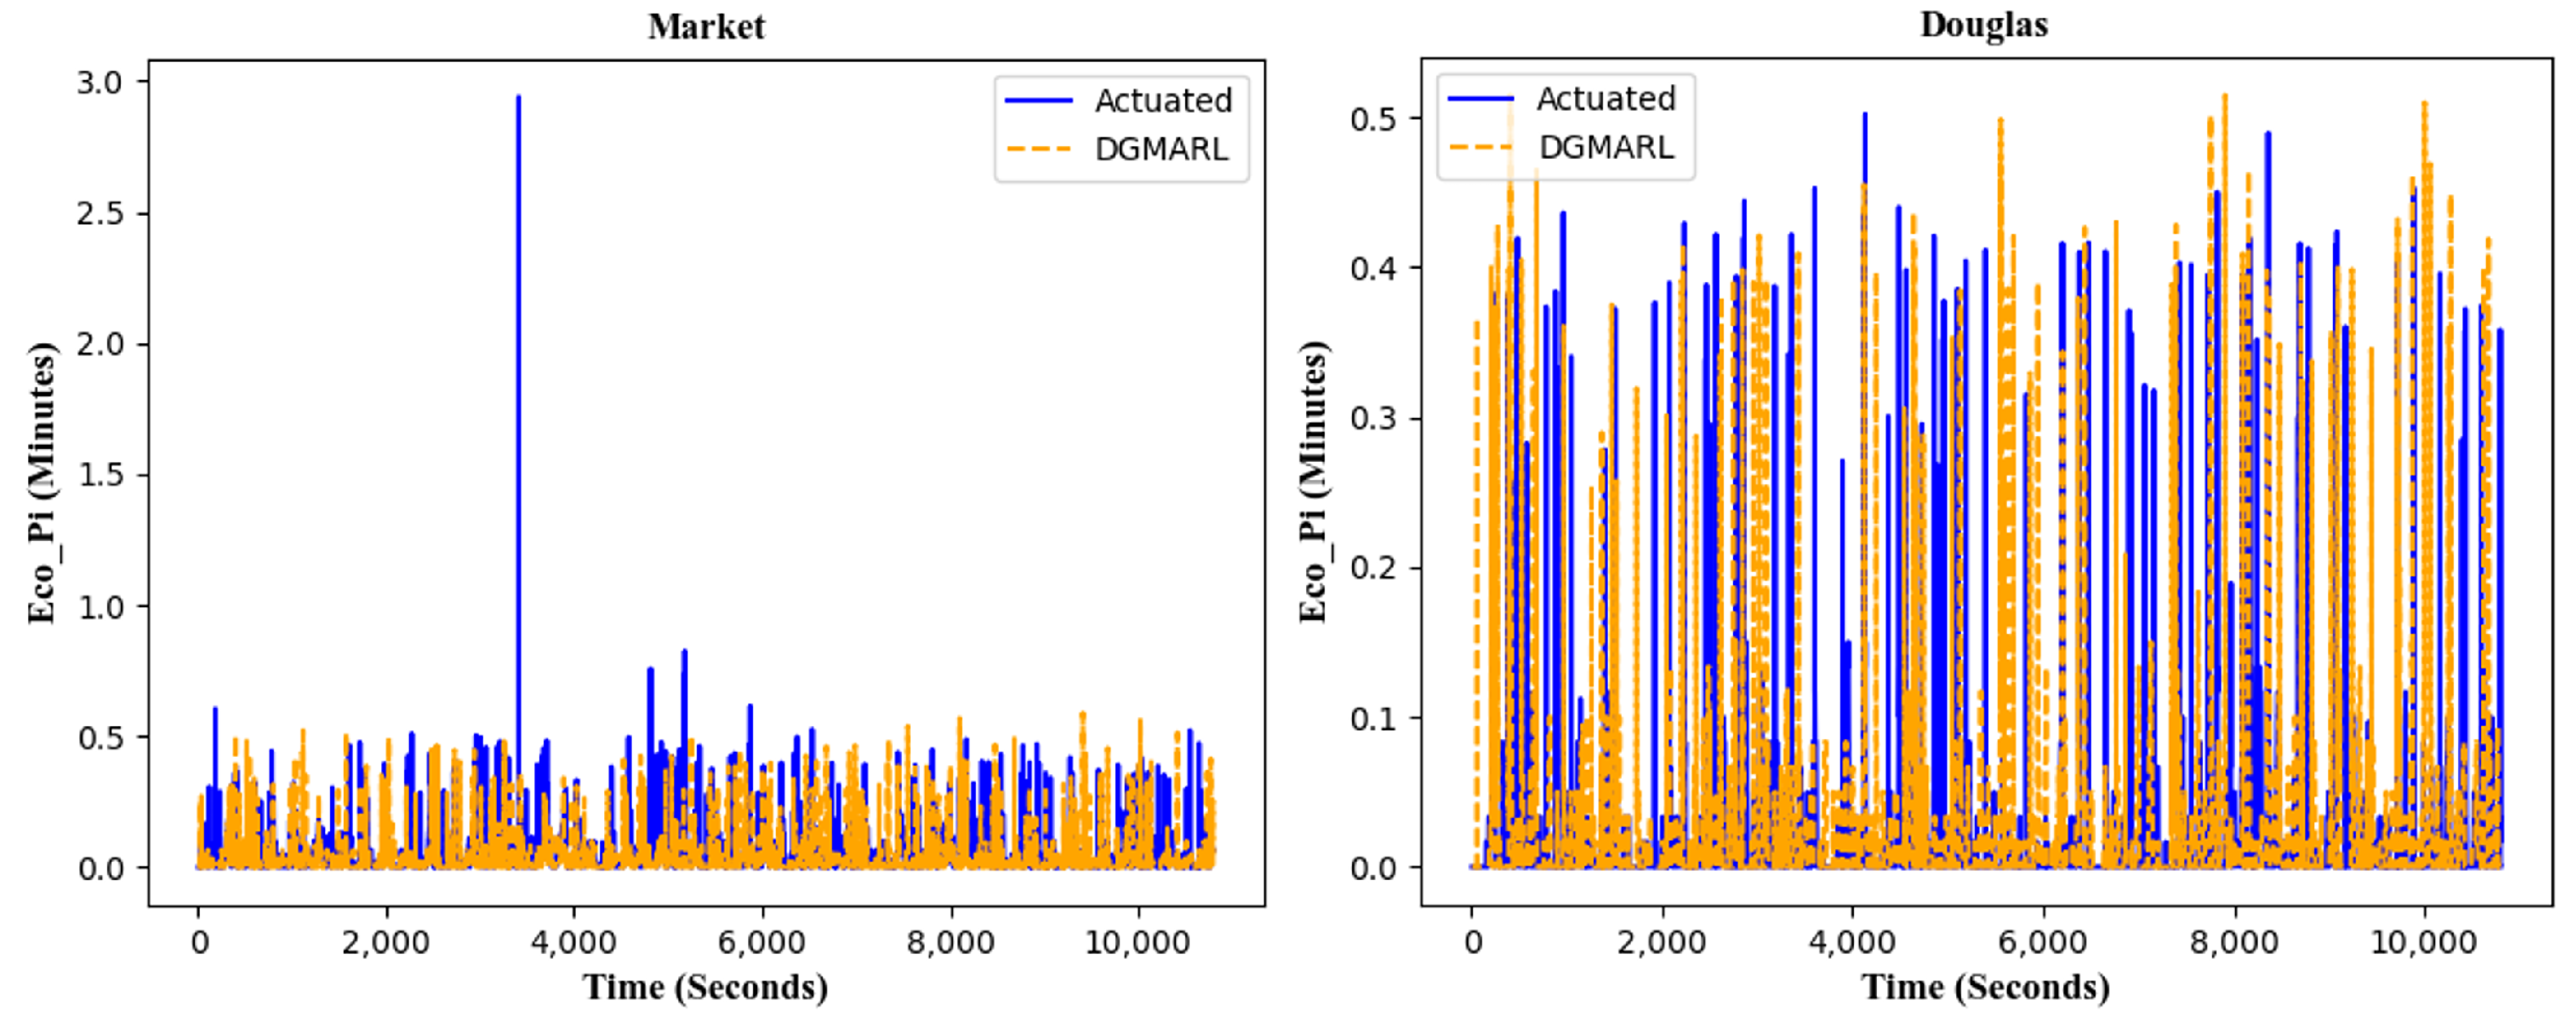
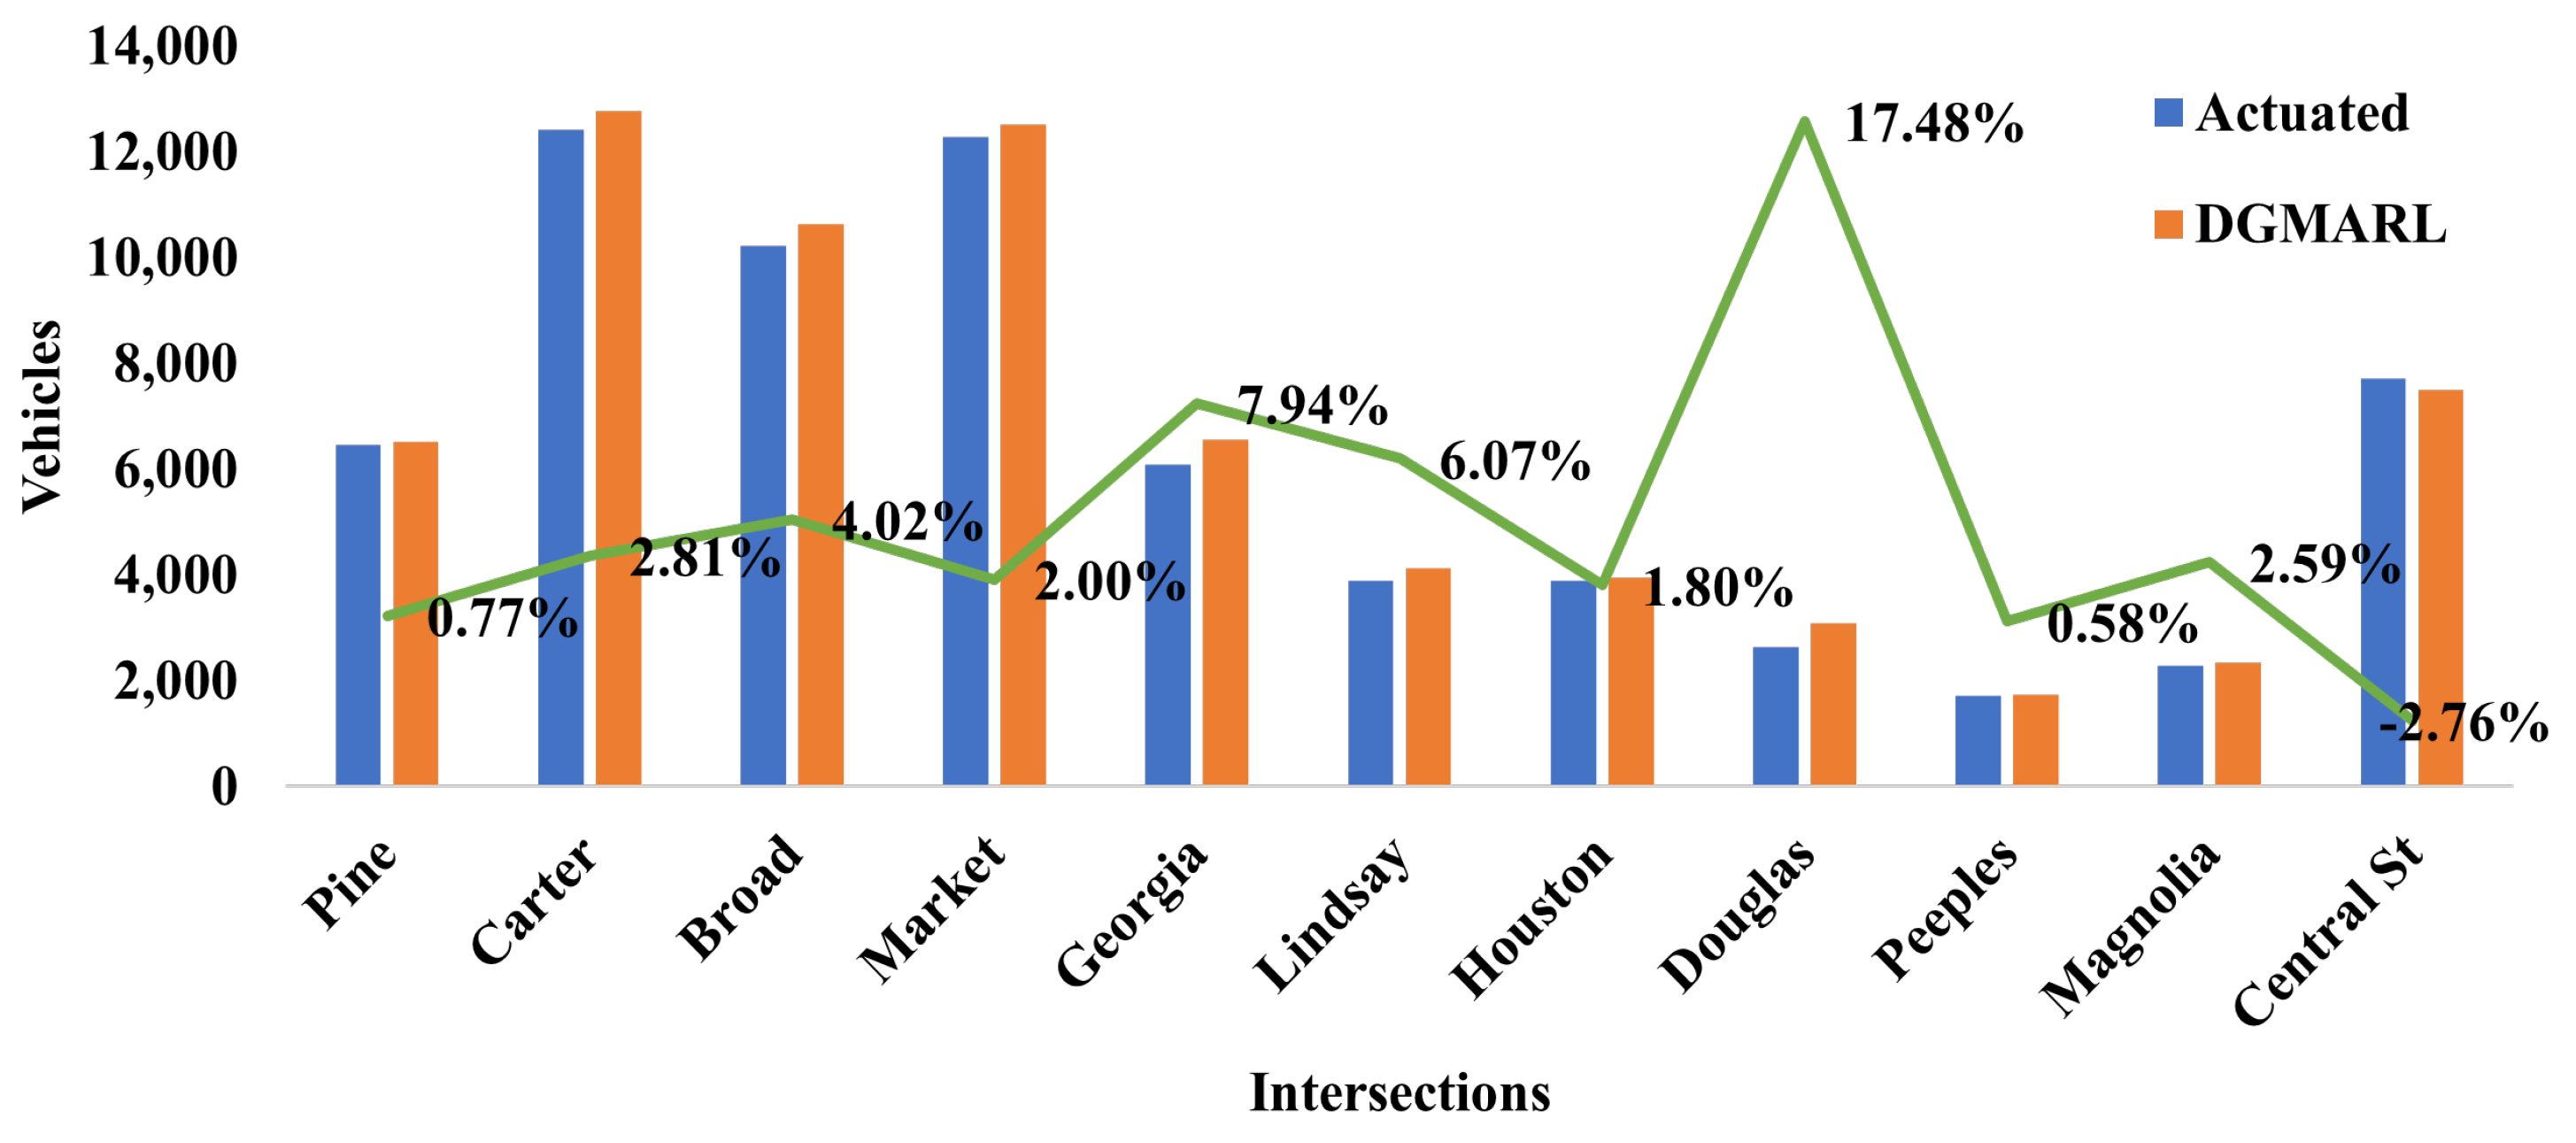
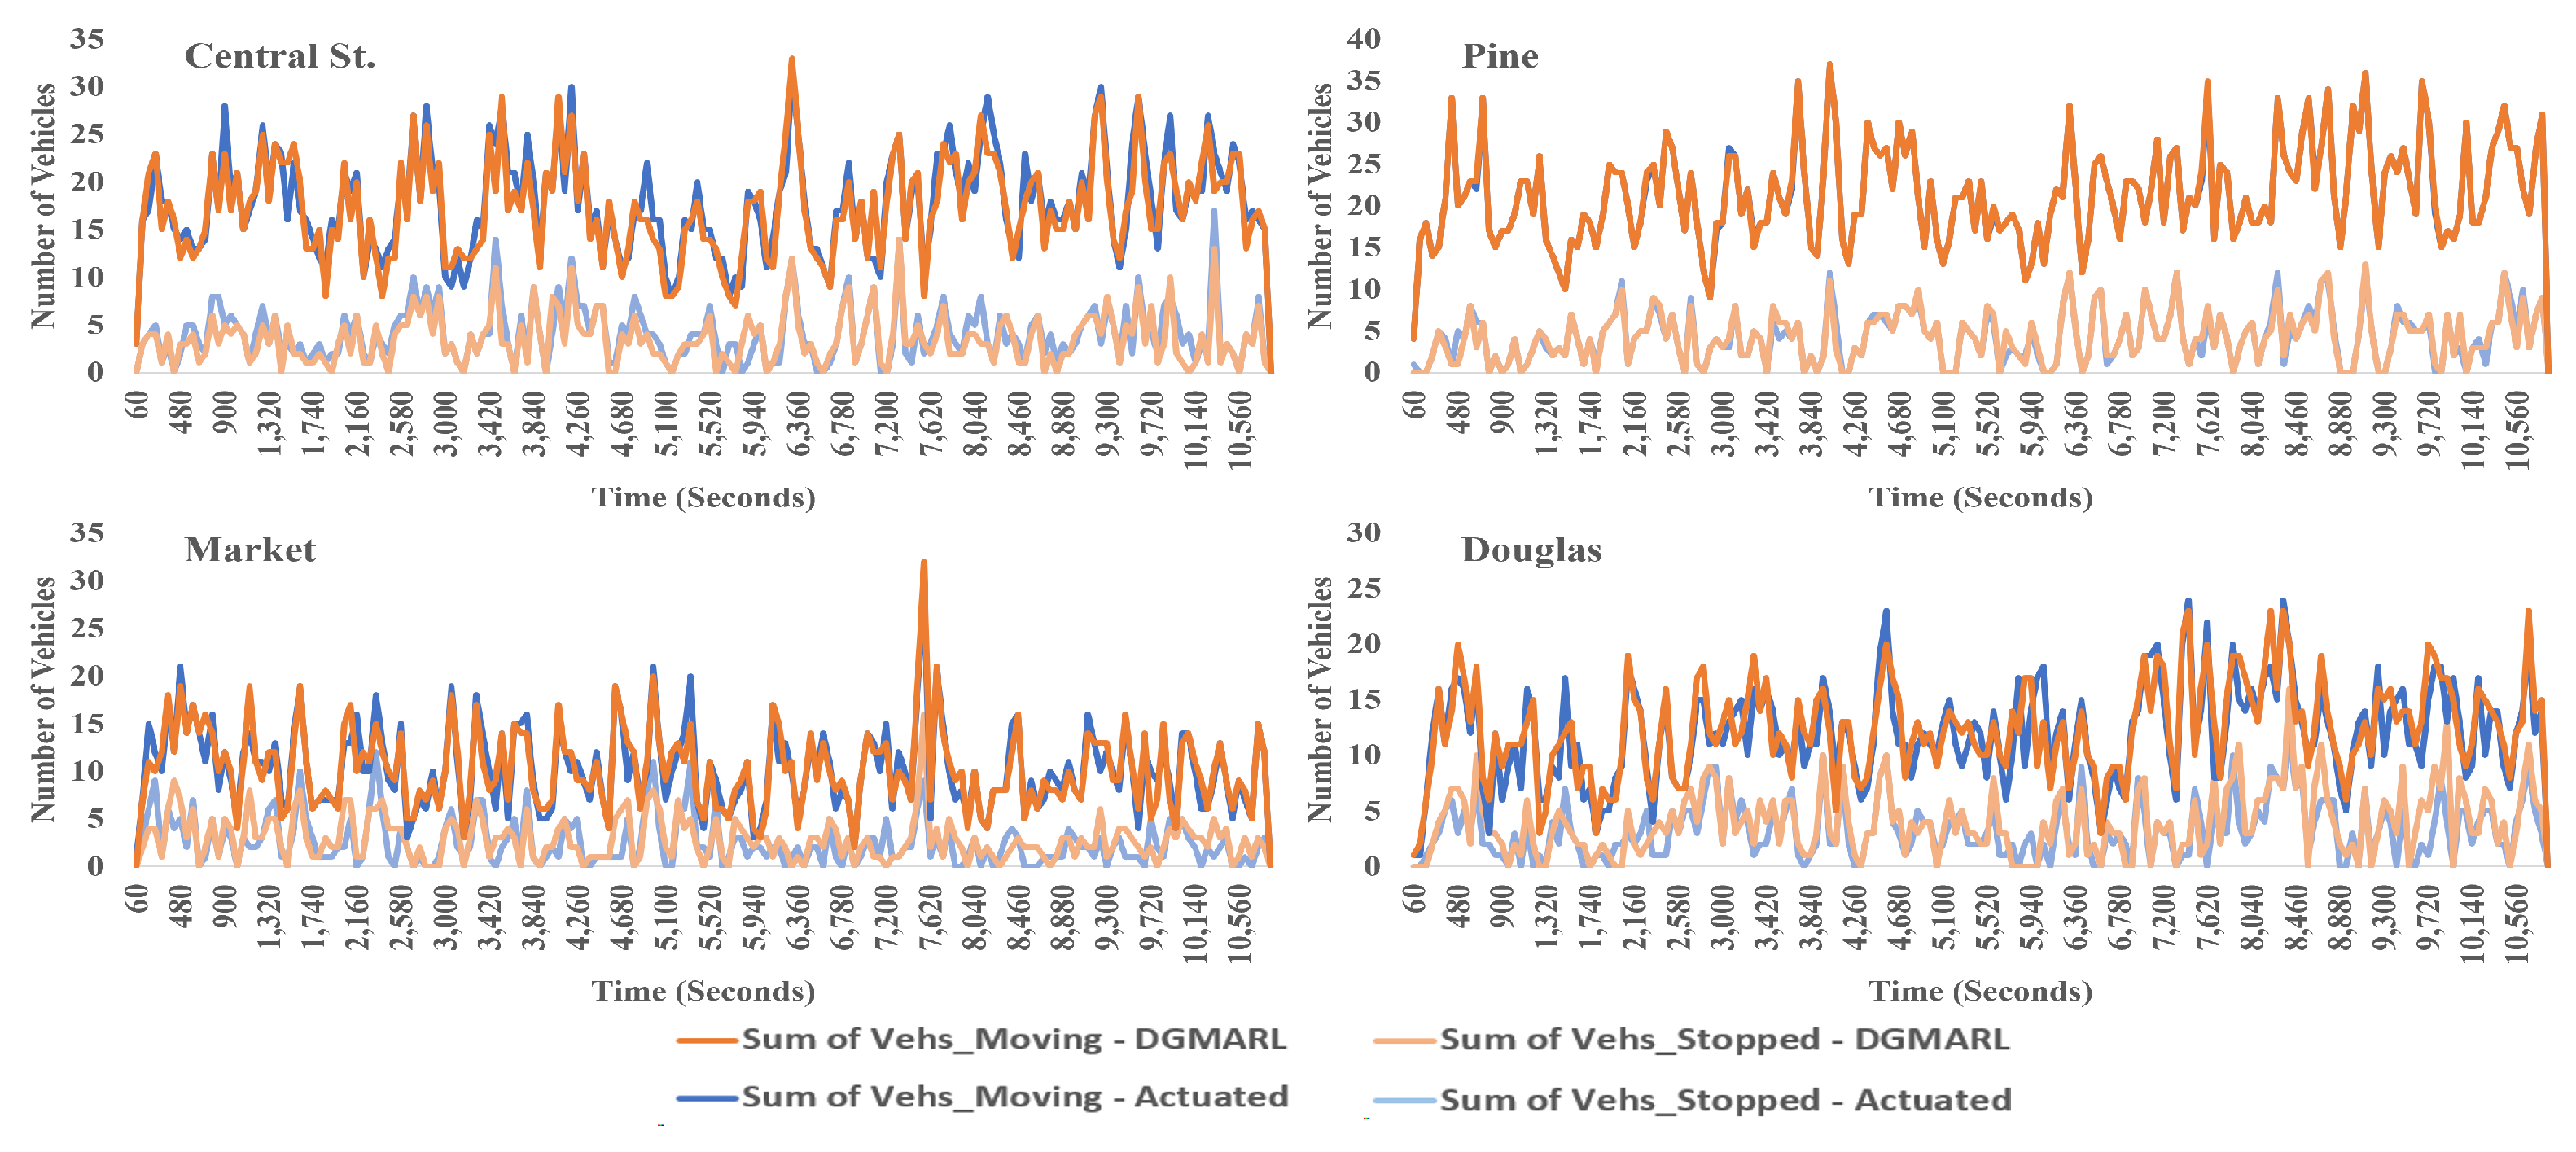
6.4. Experiment Results
6.4.1. 24-Hour Scenarios
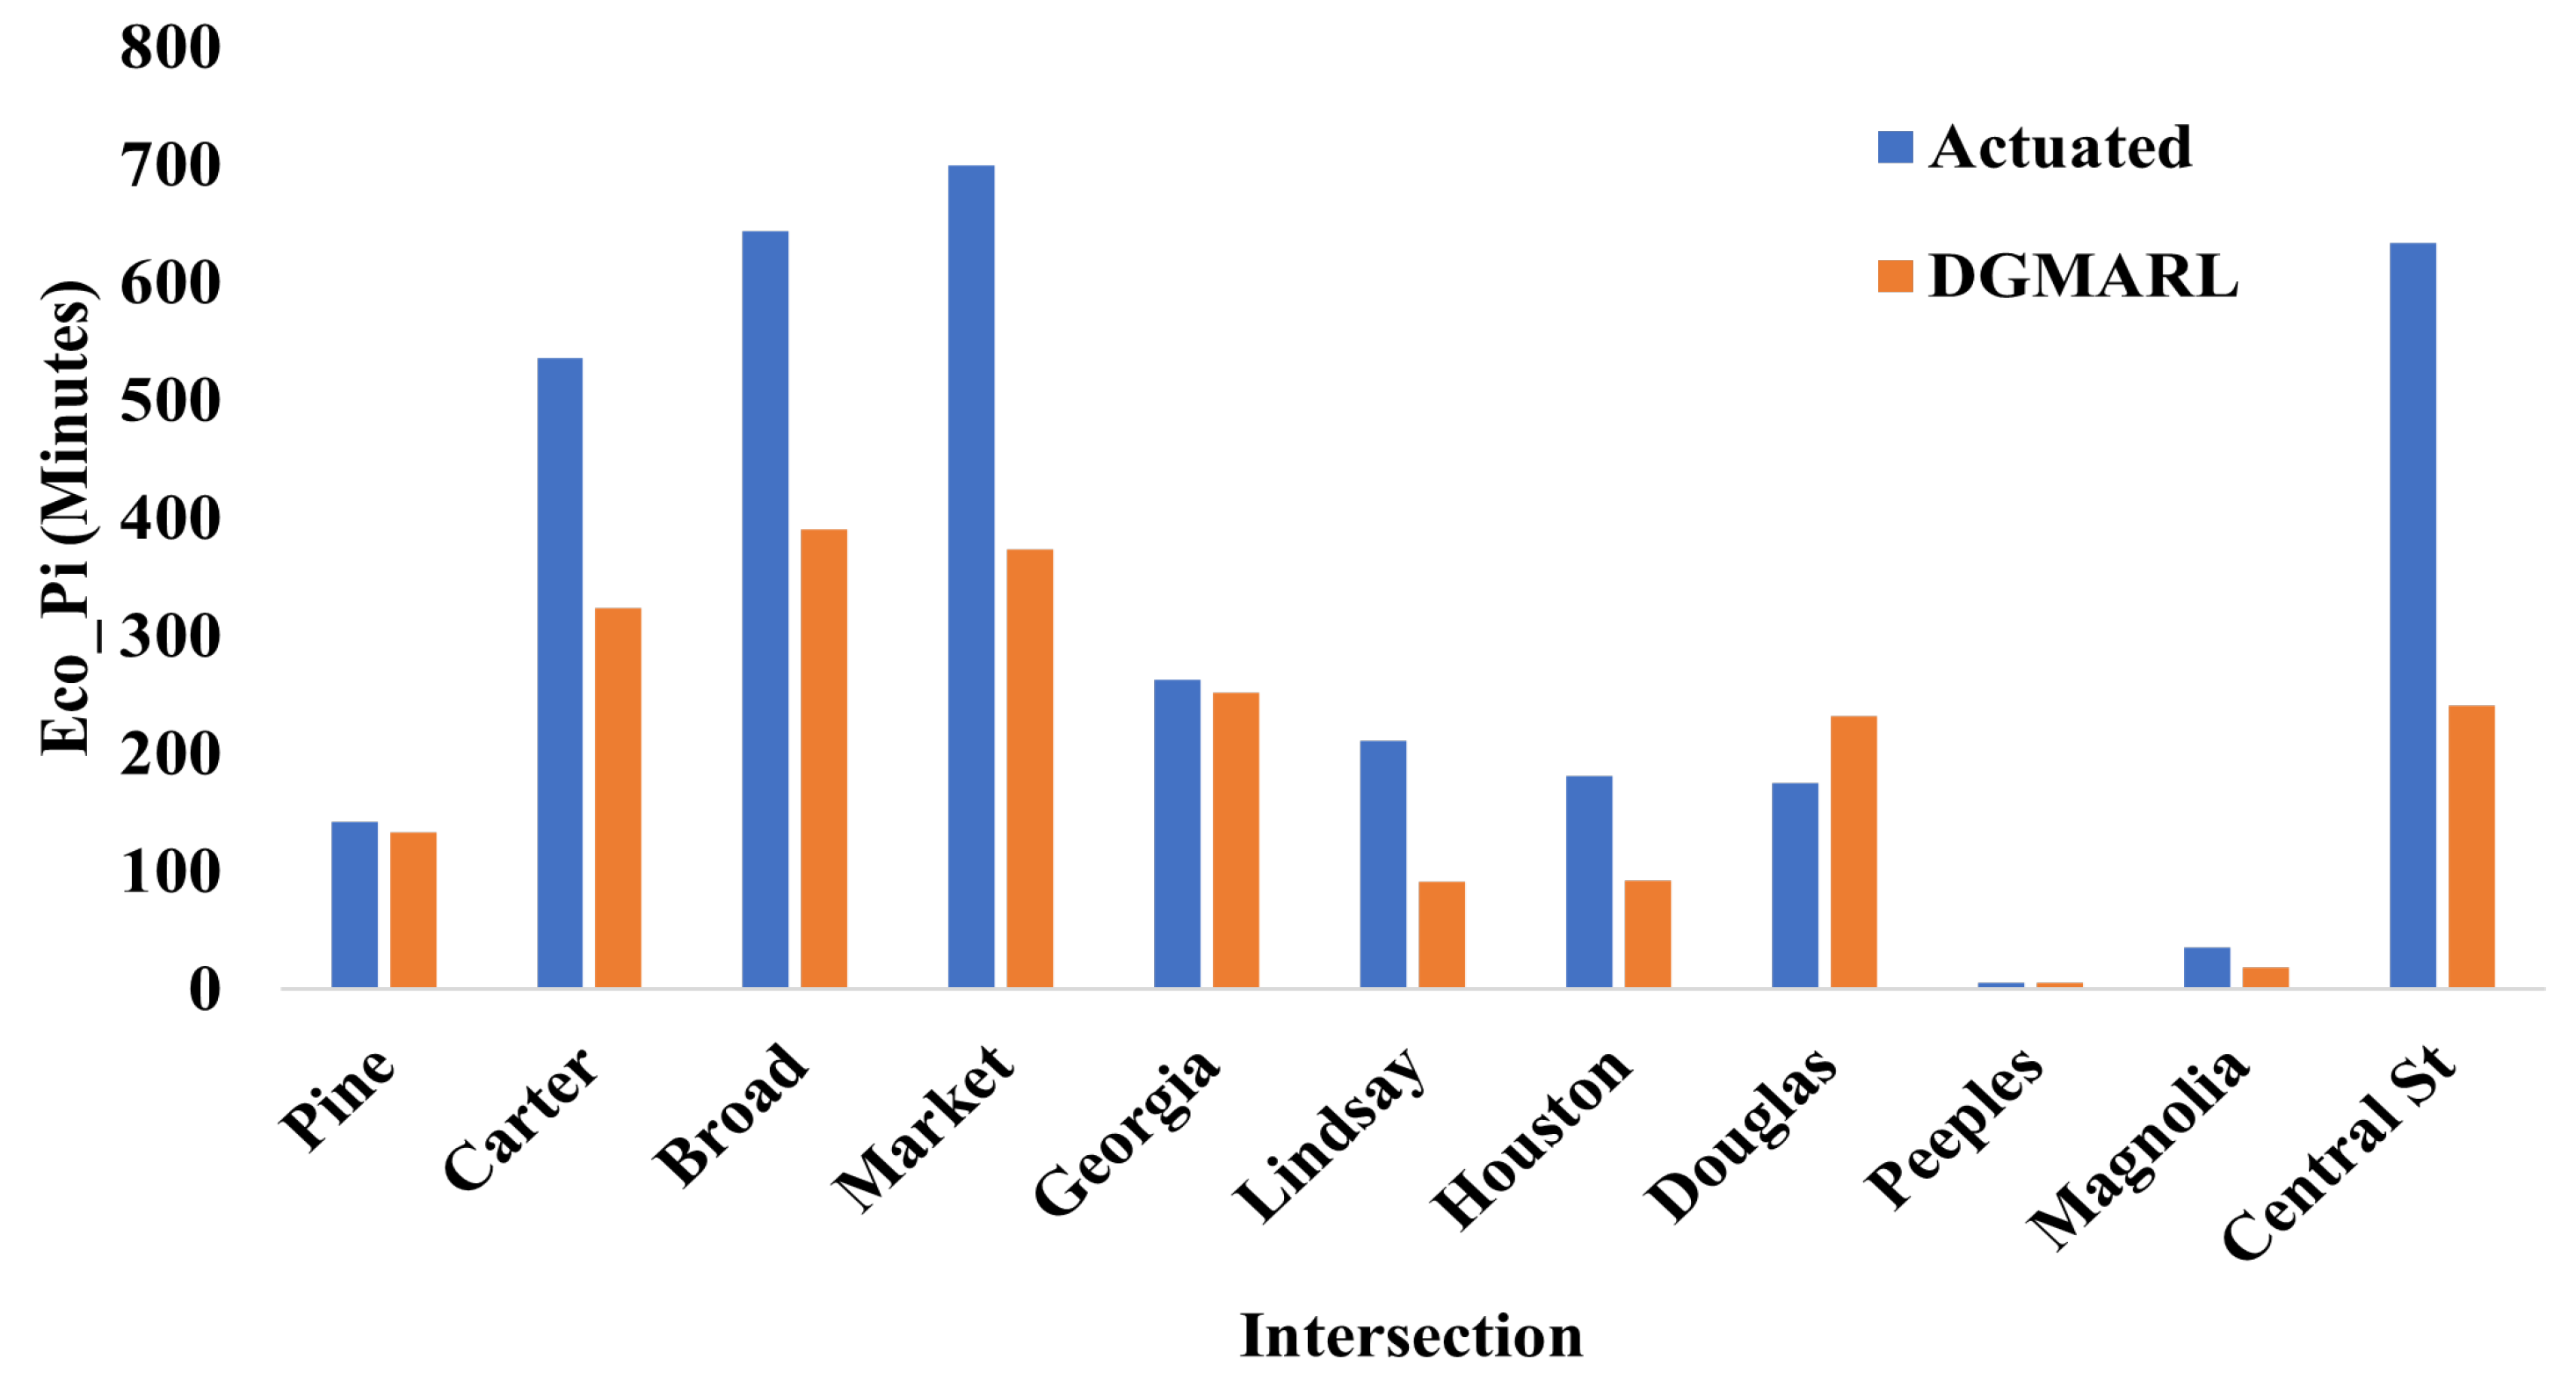
6.4.2. PM-Peak Hour Scenario
7. Discussion
8. Conclusions
Author Contributions
Funding
Data Availability Statement
Acknowledgments
Conflicts of Interest
Abbreviations
| DT | Digital Twin |
| DGMARL | Decentralized Graph-Based Multi-Agent Reinforcement Learning |
| AI | Artificial Intelligence |
| ML | Machine Learning |
| IoT | Internet of Things |
| RL | Reinforcement Learning |
| MARL | Multi-Agent Reinforcement Learning |
| MDP | Markov Decision Process |
| A2C | Advantage Actor-Critic |
| MA2C | Multi-Agent Advantage Actor-Critic |
| GNN | Graph Neural Network |
| LSTM | (Long Short-Term Memory) |
| ReLU | (Rectified Linear Unit) |
| ITS | Intelligent Transportation System |
| SPaT | Signal Phasing and Timing |
| RBC | Ring Barrier Controller |
| GUI | Graphical User Interface |
| COM | Component Object Model |
| MLK | Martin Luther King |
Appendix A
| Algorithm A1 Observing state from Digital Twin by thread |
Require PTV-Vissim objects and agents initialized, time t, thread
|
Appendix B

| Input Vehicles Generated | Actuated | DGMARL |
|---|---|---|
| Number of Vehicles | 8788 | 8788 |
| Unique Vehicle IDs | [1, 2, 3, …, 8786, 8787, 8788] | [1, 2, 3, …, 8786, 8787, 8788] |
| Algorithm A2 Apply action in Digital Twin by thread |
Require Time t, thread , Current phase , Next phase
|
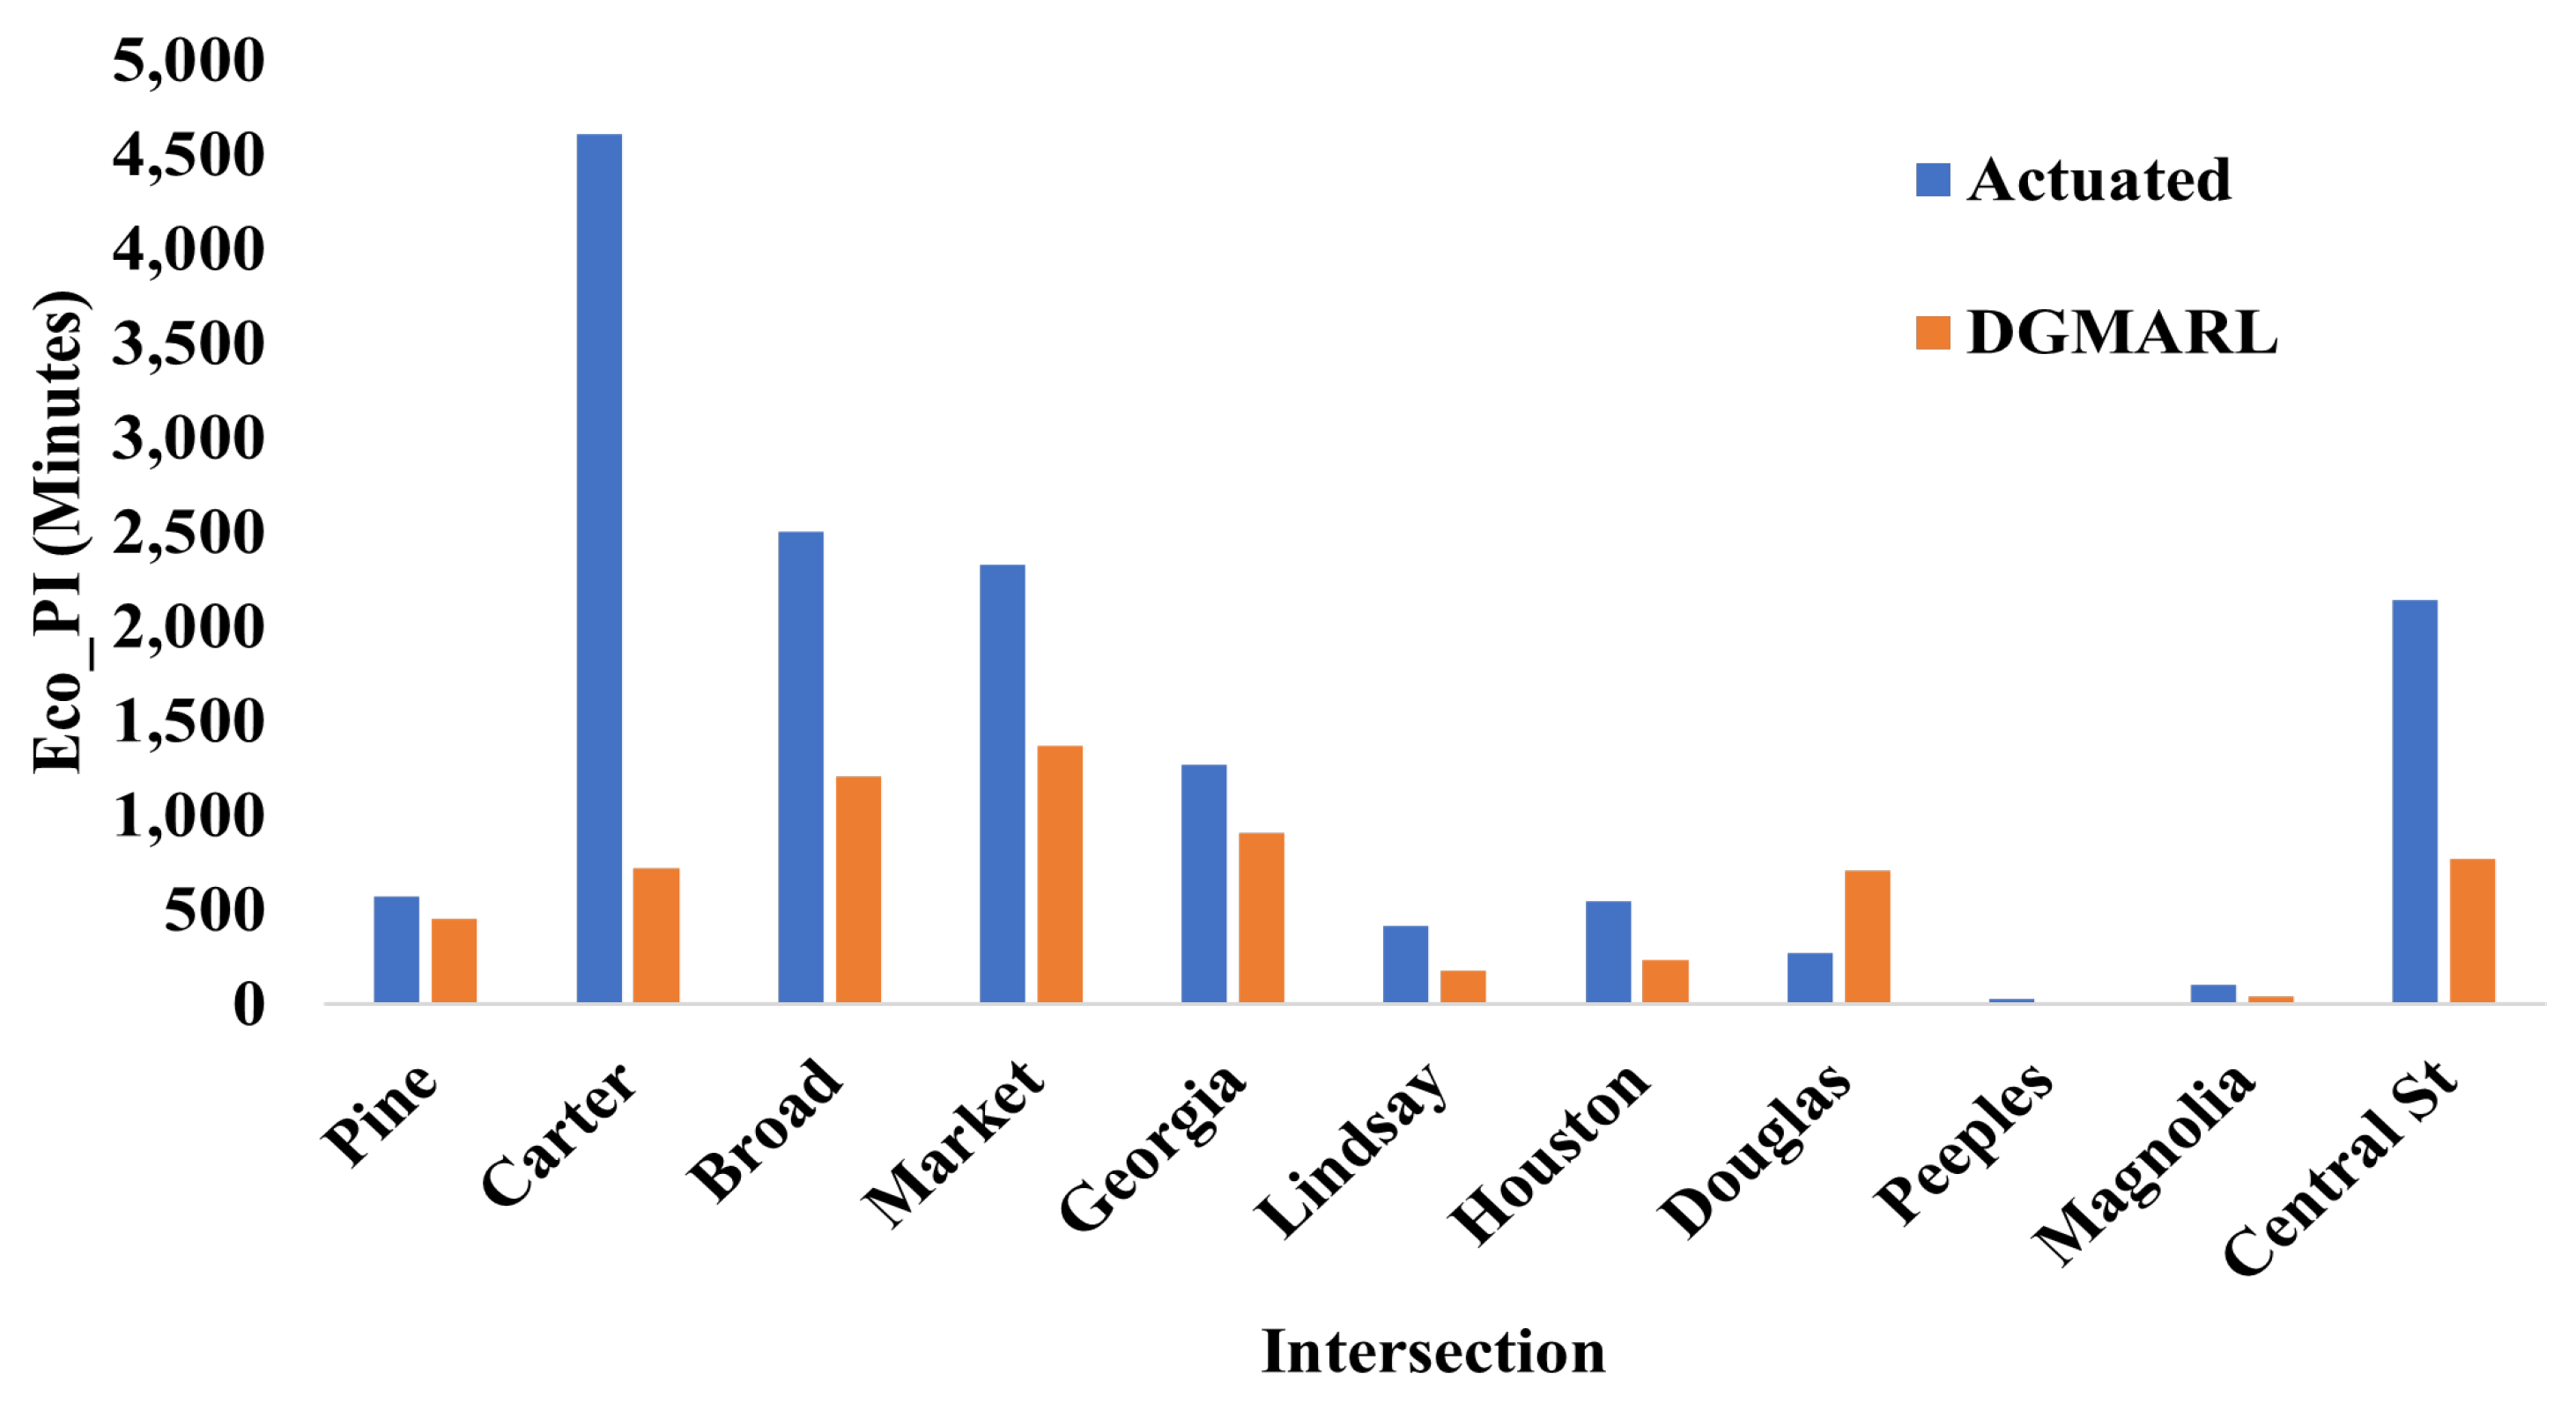
| Intersection | Actuated | DGMARL | Increase in % of Vehicles Crossed the Intersection at Green |
|---|---|---|---|
| Pine | 6472 | 6522 | 0.77% |
| Carter | 12,430 | 12,779 | 2.81% |
| Broad | 10,217 | 10,628 | 4.02% |
| Market | 12,282 | 12,528 | 2.00% |
| Georgia | 6083 | 6566 | 7.94% |
| Lindsay | 3886 | 4122 | 6.07% |
| Houston | 3886 | 3956 | 1.80% |
| Douglas | 2632 | 3092 | 17.48% |
| Peeples | 1723 | 1733 | 0.58% |
| Magnolia | 2280 | 2339 | 2.59% |
| Central St | 7723 | 7510 | −2.76% |
References
- Governments. Smart Corridor City/County Association of Governments. Available online: https://ccag.ca.gov/projects/smart-corridor/ (accessed on 1 June 2023).
- ARCADIS. Creating an Intelligent Transportation Systems for Atlanta’s First Smart Corridor. Available online: https://www.arcadis.com/en-us/projects/north-america/united-states/north-ave-corridor (accessed on 1 June 2023).
- California, US, R.T.T. I-80 SMART Corridor Project. Available online: https://www.roadtraffic-technology.com/projects/i-80-smart-corridor-project-california/ (accessed on 1 June 2023).
- San Francisco, CA, P. I-80 SMART Corridor. Available online: https://www.parsons.com/project/80-smart-corridor/ (accessed on 1 June 2023).
- Journal, A. Tennessee DOT Starts Phase 2 of I-24 SMART Corridor. Available online: https://aashtojournal.org/2022/04/01/tennessee-dot-starts-phase-2-of-i-24-smart-corridor/ (accessed on 1 June 2023).
- Wu, J.; Wang, X.; Dang, Y.; Lv, Z. Digital Twins and artificial intelligence in transportation infrastructure: Classification, application, and future research directions. Comput. Electr. Eng. 2022, 101, 107983. [Google Scholar] [CrossRef]
- Saroj, A.J.; Guin, A.; Hunter, M. Deep LSTM recurrent neural networks for arterial traffic volume data imputation. J. Big Data Anal. Transp. 2021, 3, 95–108. [Google Scholar] [CrossRef]
- Farazi, N.P.; Zou, B.; Ahamed, T.; Barua, L. Deep reinforcement learning in transportation research: A review. Transp. Res. Interdiscip. Perspect. 2021, 11, 100425. [Google Scholar]
- Chowdhury, M.; Sadek, A.W. Advantages and limitations of artificial intelligence. Artif. Intell. Appl. Crit. Transp. Issues 2012, 6, 360–375. [Google Scholar]
- Machin, M.; Sanguesa, J.A.; Garrido, P.; Martinez, F.J. On the use of artificial intelligence techniques in intelligent transportation systems. In Proceedings of the 2018 IEEE Wireless Communications and Networking Conference Workshops (WCNCW), Barcelona, Spain, 15–18 April 2018; pp. 332–337. [Google Scholar]
- Kumarasamy, V.K.; Saroj, A.J.; Liang, Y.; Wu, D.; Hunter, M.P.; Guin, A.; Sartipi, M. Traffic Signal Optimization by Integrating Reinforcement Learning and Digital Twins. In Proceedings of the 2023 IEEE Smart World Congress (SWC), Portsmouth, UK, 28–31 August 2023; pp. 1–8. [Google Scholar]
- Stevanovic, A.; Shayeb, S.A.; Patra, S.S. Fuel consumption intersection control Performance Index. Transp. Res. Rec. 2021, 2675, 690–702. [Google Scholar] [CrossRef]
- Alshayeb, S.; Stevanovic, A.; Effinger, J.R. Investigating impacts of various operational conditions on fuel consumption and stop penalty at signalized intersections. Int. J. Transp. Sci. Technol. 2022, 11, 690–710. [Google Scholar] [CrossRef]
- Stevanovic, A.; Dobrota, N. Impact of various operating conditions on simulated emissions-based stop penalty at signalized intersections. Sustainability 2021, 13, 10037. [Google Scholar] [CrossRef]
- Alshayeb, S.; Stevanovic, A.; Park, B.B. Field-based prediction models for stop penalty in traffic signal timing optimization. Energies 2021, 14, 7431. [Google Scholar] [CrossRef]
- Nia, N.G.; Amiri, A.; Nasab, A.; Kaplanoglu, E.; Liang, Y. The Power of ANN-Random Forest Algorithm in Human Activities Recognition Using IMU Data. In Proceedings of the 2023 IEEE EMBS International Conference on Biomedical and Health Informatics (BHI), Pittsburgh, PA, USA, 15–18 October 2023; pp. 1–7. [Google Scholar]
- Nia, N.G.; Kaplanoglu, E.; Nasab, A.; Qin, H. Human Activity Recognition Using Machine Learning Algorithms Based on IMU Data. In Proceedings of the 2023 5th International Conference on Bio-Engineering for Smart Technologies (BioSMART), Paris, France, 7–9 June 2023; pp. 1–8. [Google Scholar]
- Nia, N.G.; Nasab, A.; Kaplanoglu, E. Reinforcement Learning-Based Grasp Pattern Control of Upper Limb Prosthetics in an AI Platform. In Proceedings of the 2022 3rd International Informatics and Software Engineering Conference (IISEC), Ankara, Turkey, 15–16 December 2022; pp. 1–4. [Google Scholar]
- Sun, C.; Kumarasamy, V.K.; Liang, Y.; Wu, D.; Wang, Y. Using a Layered Ensemble of Physics-Guided Graph Attention Networks to Predict COVID-19 Trends. Appl. Artif. Intell. 2022, 36, 2055989. [Google Scholar] [CrossRef]
- Hassan, Y.; Sartipi, M. ChattSpeed: Toward a New Dataset for Single Camera Visual Speed Estimation for Urban Testbeds. In Proceedings of the 2023 IEEE International Conference on Big Data (BigData), Sorrento, Italy, 15–18 December 2023; pp. 2598–2605. [Google Scholar] [CrossRef]
- Hassan, Y.; Zhao, J.; Harris, A.; Sartipi, M. Deep Learning-Based Framework for Traffic Estimation for the MLK Smart Corridor in Downtown Chattanooga, TN. In Proceedings of the 2023 IEEE 26th International Conference on Intelligent Transportation Systems (ITSC), Bilbao, Spain, 24–28 September 2023; pp. 4564–4570. [Google Scholar] [CrossRef]
- Chu, T.; Chinchali, S.; Katti, S. Multi-agent Reinforcement Learning for Networked System Control. arXiv 2020, arXiv:2004.01339. [Google Scholar]
- Wang, Y.; Xu, T.; Niu, X.; Tan, C.; Chen, E.; Xiong, H. STMARL: A spatio-temporal multi-agent reinforcement learning approach for cooperative traffic light control. IEEE Trans. Mob. Comput. 2020, 21, 2228–2242. [Google Scholar] [CrossRef]
- Chu, T.; Wang, J.; Codecà, L.; Li, Z. Multi-agent deep reinforcement learning for large-scale traffic signal control. IEEE Trans. Intell. Transp. Syst. 2019, 21, 1086–1095. [Google Scholar] [CrossRef]
- Khaleghian, S.; Neema, H.; Sartipi, M.; Tran, T.; Sen, R.; Dubey, A. Calibrating Real-World City Traffic Simulation Model Using Vehicle Speed Data. In Proceedings of the 2023 IEEE International Conference on Smart Computing (SMARTCOMP), Nashville, TN, USA, 26–30 June 2023; pp. 303–308. [Google Scholar] [CrossRef]
- Gurjanov, A.; Zakoldaev, D.; Shukalov, A.; Zharinov, I. Formation principles of Digital Twins of Cyber-Physical Systems in the smart factories of Industry 4.0. IOP Conf. Ser. Mater. Sci. Eng. 2019, 483, 012070. [Google Scholar] [CrossRef]
- Leng, J.; Wang, D.; Shen, W.; Li, X.; Liu, Q.; Chen, X. Digital Twins-based smart manufacturing system design in Industry 4.0: A review. J. Manuf. Syst. 2021, 60, 119–137. [Google Scholar] [CrossRef]
- Stavropoulos, P.; Mourtzis, D. Digital Twins in industry 4.0. In Design and Operation of Production Networks for Mass Personalization in the Era of Cloud Technology; Elsevier: Amsterdam, The Netherlands, 2022; pp. 277–316. [Google Scholar]
- Wagner, R.; Schleich, B.; Haefner, B.; Kuhnle, A.; Wartzack, S.; Lanza, G. Challenges and potentials of Digital Twins and industry 4.0 in product design and production for high performance products. Procedia CIRP 2019, 84, 88–93. [Google Scholar] [CrossRef]
- Schluse, M.; Priggemeyer, M.; Atorf, L.; Rossmann, J. Experimentable Digital Twins—Streamlining simulation-based systems engineering for industry 4.0. IEEE Trans. Ind. Inform. 2018, 14, 1722–1731. [Google Scholar] [CrossRef]
- Cinar, Z.M.; Nuhu, A.A.; Zeeshan, Q.; Korhan, O. Digital Twins for industry 4.0: A review. In Proceedings of the Industrial Engineering in the Digital Disruption Era: Selected Papers from the Global Joint Conference on Industrial Engineering and Its Application Areas, GJCIE 2019, Gazimagusa, Turkey, 2–3 September 2019; Springer: Cham, Switzerland, 2020; pp. 193–203. [Google Scholar]
- Jiang, Y.; Yin, S.; Li, K.; Luo, H.; Kaynak, O. Industrial applications of Digital Twins. Philos. Trans. R. Soc. A 2021, 379, 20200360. [Google Scholar] [CrossRef] [PubMed]
- Sahal, R.; Alsamhi, S.H.; Brown, K.N.; O’shea, D.; McCarthy, C.; Guizani, M. Blockchain-empowered Digital Twins collaboration: Smart transportation use case. Machines 2021, 9, 193. [Google Scholar] [CrossRef]
- Kosacka-Olejnik, M.; Kostrzewski, M.; Marczewska, M.; Mrówczyńska, B.; Pawlewski, P. How Digital Twin concept supports internal transport systems?—Literature review. Energies 2021, 14, 4919. [Google Scholar] [CrossRef]
- Schwarz, C.; Wang, Z. The role of Digital Twins in connected and automated vehicles. IEEE Intell. Transp. Syst. Mag. 2022, 14, 41–51. [Google Scholar] [CrossRef]
- Samuel, P.; Saini, A.; Poongodi, T.; Nancy, P. Artificial intelligence–driven Digital Twins in Industry 4.0. In Digital Twin for Smart Manufacturing; Elsevier: Amsterdam, The Netherlands, 2023; pp. 59–88. [Google Scholar]
- Fedorko, G.; Molnar, V.; Vasil’, M.; Salai, R. Proposal of Digital Twin for testing and measuring of transport belts for pipe conveyors within the concept Industry 4.0. Measurement 2021, 174, 108978. [Google Scholar] [CrossRef]
- Novák, P.; Vyskočil, J. Digitalized Automation Engineering of Industry 4.0 Production Systems and Their Tight Cooperation with Digital Twins. Processes 2022, 10, 404. [Google Scholar] [CrossRef]
- Aheleroff, S.; Xu, X.; Zhong, R.Y.; Lu, Y. Digital Twin as a Service (DTaaS) in Industry 4.0: An Architecture Reference Model. Adv. Eng. Inform. 2021, 47, 101225. [Google Scholar] [CrossRef]
- Bhatti, G.; Mohan, H.; Raja Singh, R. Towards the future of smart electric vehicles: Digital Twin technology. Renew. Sustain. Energy Rev. 2021, 141, 110801. [Google Scholar] [CrossRef]
- Deryabin, S.A.; Temkin, I.O.; Zykov, S.V. About some issues of developing Digital Twins for the intelligent process control in quarries. In Proceedings of the 24th International Conference on Knowledge-Based and Intelligent Information & Engineering Systems, KES2020, Virtual, 16–18 September 2020; Procedia Computer Science. Volume 176, pp. 3210–3216. [Google Scholar] [CrossRef]
- Tao, F.; Zhang, H.; Liu, A.; Nee, A.Y. Digital Twin in industry: State-of-the-art. IEEE Trans. Ind. Inform. 2018, 15, 2405–2415. [Google Scholar] [CrossRef]
- Farsi, M.; Daneshkhah, A.; Hosseinian-Far, A.; Jahankhani, H. (Eds.) Digital Twin Technologies and Smart Cities; Springer: Cham, Switzerland, 2020. [Google Scholar]
- Jones, D.; Snider, C.; Nassehi, A.; Yon, J.; Hicks, B. Characterising the Digital Twin: A systematic literature review. CIRP J. Manuf. Sci. Technol. 2020, 29, 36–52. [Google Scholar] [CrossRef]
- Liu, M.; Fang, S.; Dong, H.; Xu, C. Review of Digital Twin about concepts, technologies, and industrial applications. J. Manuf. Syst. 2021, 58, 346–361. [Google Scholar] [CrossRef]
- Kaur, M.J.; Mishra, V.P.; Maheshwari, P. The convergence of Digital Twin, IoT, and machine learning: Transforming data into action. In Digital Twin Technologies and Smart Cities; Springer: Cham, Switzerland, 2020; pp. 3–17. [Google Scholar]
- Tao, F.; Xiao, B.; Qi, Q.; Cheng, J.; Ji, P. Digital Twin modeling. J. Manuf. Syst. 2022, 64, 372–389. [Google Scholar] [CrossRef]
- Haag, S.; Anderl, R. Digital Twin–Proof of concept. Manuf. Lett. 2018, 15, 64–66. [Google Scholar] [CrossRef]
- Rasheed, A.; San, O.; Kvamsdal, T. Digital Twin: Values, challenges and enablers from a modeling perspective. IEEE Access 2020, 8, 21980–22012. [Google Scholar] [CrossRef]
- Boschert, S.; Rosen, R. Digital Twin—the simulation aspect. In Mechatronic Futures: Challenges and Solutions for Mechatronic Systems and Their Designers; Springer: Cham, Switzerland, 2016; pp. 59–74. [Google Scholar]
- Bao, L.; Wang, Q.; Jiang, Y. Review of Digital Twin for intelligent transportation system. In Proceedings of the 2021 International Conference on Information Control, Electrical Engineering and Rail Transit (ICEERT), Lanzhou, China, 30 October–1 November 2021; pp. 309–315. [Google Scholar]
- Saroj, A.J.; Roy, S.; Guin, A.; Hunter, M. Development of a connected corridor real-time data-driven traffic Digital Twin simulation model. J. Transp. Eng. Part A Syst. 2021, 147, 04021096. [Google Scholar] [CrossRef]
- Rudskoy, A.; Ilin, I.; Prokhorov, A. Digital Twins in the intelligent transport systems. Transp. Res. Procedia 2021, 54, 927–935. [Google Scholar] [CrossRef]
- Zhang, K.; Cao, J.; Zhang, Y. Adaptive Digital Twin and multiagent deep reinforcement learning for vehicular edge computing and networks. IEEE Trans. Ind. Inform. 2021, 18, 1405–1413. [Google Scholar] [CrossRef]
- Dasgupta, S.; Rahman, M.; Lidbe, A.D.; Lu, W.; Jones, S. A Transportation Digital-Twin Approach for Adaptive Traffic Control Systems. arXiv 2021, arXiv:2109.10863. [Google Scholar]
- Chen, D.; Lv, Z. Artificial intelligence enabled Digital Twins for training autonomous cars. Internet Things Cyber-Phys. Syst. 2022, 2, 31–41. [Google Scholar] [CrossRef]
- Kumar, S.A.; Madhumathi, R.; Chelliah, P.R.; Tao, L.; Wang, S. A novel Digital Twin-centric approach for driver intention prediction and traffic congestion avoidance. J. Reliab. Intell. Environ. 2018, 4, 199–209. [Google Scholar] [CrossRef]
- Wang, X.; Ma, L.; Li, H.; Yin, Z.; Luan, T.; Cheng, N. Digital Twin-Assisted Efficient Reinforcement Learning for Edge Task Scheduling. In Proceedings of the 2022 IEEE 95th Vehicular Technology Conference:(VTC2022-Spring), Helsinki, Finland, 19–22 June 2022; pp. 1–5. [Google Scholar]
- Xia, K.; Sacco, C.; Kirkpatrick, M.; Saidy, C.; Nguyen, L.; Kircaliali, A.; Harik, R. A Digital Twin to train deep reinforcement learning agent for smart manufacturing plants: Environment, interfaces and intelligence. J. Manuf. Syst. 2021, 58, 210–230. [Google Scholar] [CrossRef]
- Pandit, K.; Ghosal, D.; Zhang, H.M.; Chuah, C.N. Adaptive traffic signal control with vehicular ad hoc networks. IEEE Trans. Veh. Technol. 2013, 62, 1459–1471. [Google Scholar] [CrossRef]
- Cao, M.; Li, V.O.; Shuai, Q. Book Your Green Wave: Exploiting Navigation Information for Intelligent Traffic Signal Control. IEEE Trans. Veh. Technol. 2022, 71, 8225–8236. [Google Scholar] [CrossRef]
- Guo, Q.; Li, L.; Ban, X.J. Urban traffic signal control with connected and automated vehicles: A survey. Transp. Res. Part C Emerg. Technol. 2019, 101, 313–334. [Google Scholar] [CrossRef]
- Jiang, X.; Jin, Y.; Ma, Y. Dynamic phase signal control method for unstable asymmetric traffic flow at intersections. J. Adv. Transp. 2021, 2021, 8843921. [Google Scholar] [CrossRef]
- Maroto, J.; Delso, E.; Felez, J.; Cabanellas, J.M. Real-time traffic simulation with a microscopic model. IEEE Trans. Intell. Transp. Syst. 2006, 7, 513–527. [Google Scholar] [CrossRef]
- Saroj, A.J.; Hunter, M.; Roy, S.; Guin, A. A Three-Tier Incremental Approach for Development of Smart Corridor Digital Twins. In Proceedings of the 2023 IEEE 26th International Symposium on Real-Time Distributed Computing (ISORC), Nashville, TN, USA, 23–25 May 2023; pp. 214–219. [Google Scholar]
- Rudowsky, I. Intelligent agents. Commun. Assoc. Inf. Syst. 2004, 14, 14. [Google Scholar] [CrossRef]
- Iyer, L.S. AI enabled applications towards intelligent transportation. Transp. Eng. 2021, 5, 100083. [Google Scholar] [CrossRef]
- Schleiffer, R. Intelligent agents in traffic and transportation. Transp. Res. Part Emerg. Technol. 2002, 10, 325–329. [Google Scholar] [CrossRef]
- Sadek, A.; Basha, N. Self-learning intelligent agents for dynamic traffic routing on transportation networks. In Unifying Themes in Complex Systems: Proceedings of the Sixth International Conference on Complex Systems, Boston, MA, USA, 25–30 June 2006; Springer: Berlin/Heidelberg, Germany, 2010; pp. 503–510. [Google Scholar]
- Roozemond, D.A. Using intelligent agents for pro-active, real-time urban intersection control. Eur. J. Oper. Res. 2001, 131, 293–301. [Google Scholar] [CrossRef]
- Zhu, L.; Yu, F.R.; Wang, Y.; Ning, B.; Tang, T. Big data analytics in intelligent transportation systems: A survey. IEEE Trans. Intell. Transp. Syst. 2018, 20, 383–398. [Google Scholar] [CrossRef]
- Roozemond, D.A. Using autonomous intelligent agents for urban traffic control systems. In Proceedings of the 6th World Congress on Intelligent Transport Systems (Its), Toronto, ON, Canada, 8–12 November 1999. [Google Scholar]
- Nguyen, T.T.; Nguyen, H.H.; Sartipi, M.; Fisichella, M. Multi-Vehicle Multi-Camera Tracking with Graph-Based Tracklet Features. IEEE Trans. Multimed. 2023, 26, 972–983. [Google Scholar] [CrossRef]
- Nguyen, T.T.; Nguyen, H.H.; Sartipi, M.; Fisichella, M. Real-time multi-vehicle multi-camera tracking with graph-based tracklet features. Transp. Res. Rec. 2024, 2678, 296–308. [Google Scholar] [CrossRef]
- Li, J.; Ma, H.; Zhang, Z.; Li, J.; Tomizuka, M. Spatio-temporal graph dual-attention network for multi-agent prediction and tracking. IEEE Trans. Intell. Transp. Syst. 2021, 23, 10556–10569. [Google Scholar] [CrossRef]
- Palit, J.R. Application of Machine Learning and Deep Learning Approaches for Traffic Operation and Safety Assessment at Signalized Intersections. Master’s Thesis, University of Tennessee at Chattanooga, Chattanooga, TN, USA, 2022. [Google Scholar]
- Protogerou, A.; Papadopoulos, S.; Drosou, A.; Tzovaras, D.; Refanidis, I. A graph neural network method for distributed anomaly detection in IoT. Evol. Syst. 2021, 12, 19–36. [Google Scholar] [CrossRef]
- Basmassi, M.A.; Boudaakat, S.; Chentoufi, J.A.; Benameur, L.; Rebbani, A.; Bouattane, O. Evolutionary reinforcement learning multi-agents system for intelligent traffic light control: New approach and case of study. Int. J. Electr. Comput. Eng. 2022, 12, 5519. [Google Scholar] [CrossRef]
- Xu, M.; Wu, J.; Huang, L.; Zhou, R.; Wang, T.; Hu, D. Network-wide traffic signal control based on the discovery of critical nodes and deep reinforcement learning. J. Intell. Transp. Syst. 2020, 24, 1–10. [Google Scholar] [CrossRef]
- Ge, H.; Gao, D.; Sun, L.; Hou, Y.; Yu, C.; Wang, Y.; Tan, G. Multi-agent transfer reinforcement learning with multi-view encoder for adaptive traffic signal control. IEEE Trans. Intell. Transp. Syst. 2021, 23, 12572–12587. [Google Scholar] [CrossRef]
- Zhu, R.; Li, L.; Wu, S.; Lv, P.; Li, Y.; Xu, M. Multi-agent broad reinforcement learning for intelligent traffic light control. Inf. Sci. 2023, 619, 509–525. [Google Scholar] [CrossRef]
- Jin, G.; Wang, M.; Zhang, J.; Sha, H.; Huang, J. STGNN-TTE: Travel time estimation via spatial–temporal graph neural network. Future Gener. Comput. Syst. 2022, 126, 70–81. [Google Scholar] [CrossRef]
- PTV Vissim 2022; PTV Group: Karlsruhe, Germany, 2022; Available online: https://www.ptvgroup.com/en/solutionsproducts/ptv-vissim/ (accessed on 1 June 2023).
- Harris, A.; Stovall, J.; Sartipi, M. Mlk smart corridor: An urban testbed for smart city applications. In Proceedings of the IEEE International Conference on Big Data, Los Angeles, CA, USA, 9–12 December 2019; pp. 3506–3511. [Google Scholar]
- GDOT. VISSIM Simulation Guidance; FHWA-GA-21-1833, 18-33; Georgia Department of Transportation: Atlanta, Georgia, 2021.


| Notation | Description |
|---|---|
| Bi-directional graph specified by | |
| set of intersections/agents (vertices) and set of links (edges) | |
| i, j | ID of intersections/agents/nodes |
| l | ID of links/edges |
| Link connecting intersections i and j | |
| Set of incoming neighbors of intersection i | |
| Traffic flow status intersection i | |
| Signal phases of intersection i |
| Notation | Description |
|---|---|
| , , p, and r | State space, Action sace, Agent’s Policy, and Reward |
| State of intersection i at time t | |
| Action taken by agent i at time t | |
| Eco_PI as reward r at time t | |
| Average stop delay occurred in the link l | |
| Number of stops occurred in the link l | |
| Average stop penalty calculated for link l | |
| Critic-State Value | |
| Actor-Action Value | |
| Initial policy p distribution of intersection i at time t | |
| Policy network parameters of intersection i | |
| Value network parameters of intersection i |
Disclaimer/Publisher’s Note: The statements, opinions and data contained in all publications are solely those of the individual author(s) and contributor(s) and not of MDPI and/or the editor(s). MDPI and/or the editor(s) disclaim responsibility for any injury to people or property resulting from any ideas, methods, instructions or products referred to in the content. |
© 2024 by the authors. Licensee MDPI, Basel, Switzerland. This article is an open access article distributed under the terms and conditions of the Creative Commons Attribution (CC BY) license (https://creativecommons.org/licenses/by/4.0/).
Share and Cite
Kumarasamy, V.K.; Saroj, A.J.; Liang, Y.; Wu, D.; Hunter, M.P.; Guin, A.; Sartipi, M. Integration of Decentralized Graph-Based Multi-Agent Reinforcement Learning with Digital Twin for Traffic Signal Optimization. Symmetry 2024, 16, 448. https://doi.org/10.3390/sym16040448
Kumarasamy VK, Saroj AJ, Liang Y, Wu D, Hunter MP, Guin A, Sartipi M. Integration of Decentralized Graph-Based Multi-Agent Reinforcement Learning with Digital Twin for Traffic Signal Optimization. Symmetry. 2024; 16(4):448. https://doi.org/10.3390/sym16040448
Chicago/Turabian StyleKumarasamy, Vijayalakshmi K., Abhilasha Jairam Saroj, Yu Liang, Dalei Wu, Michael P. Hunter, Angshuman Guin, and Mina Sartipi. 2024. "Integration of Decentralized Graph-Based Multi-Agent Reinforcement Learning with Digital Twin for Traffic Signal Optimization" Symmetry 16, no. 4: 448. https://doi.org/10.3390/sym16040448
APA StyleKumarasamy, V. K., Saroj, A. J., Liang, Y., Wu, D., Hunter, M. P., Guin, A., & Sartipi, M. (2024). Integration of Decentralized Graph-Based Multi-Agent Reinforcement Learning with Digital Twin for Traffic Signal Optimization. Symmetry, 16(4), 448. https://doi.org/10.3390/sym16040448