Article

An Effective Image Classification Method for Plant Diseases with Improved Channel Attention Mechanism aECAnet Based on Deep Learning

Henan Institute of Science and Technology, Xinxiang 453003, China
*
Author to whom correspondence should be addressed.
Symmetry 2024, 16(4), 451; https://doi.org/10.3390/sym16040451
Submission received: 10 March 2024 / Revised: 31 March 2024 / Accepted: 1 April 2024 / Published: 8 April 2024
(This article belongs to the Section Computer)

Abstract

:
Since plant diseases occurring during the growth process are a significant factor leading to the decline in both yield and quality, the classification and detection of plant leaf diseases, followed by timely prevention and control measures, are crucial for safeguarding plant productivity and quality. As the traditional convolutional neural network structure cannot effectively recognize similar plant leaf diseases, in order to more accurately identify the diseases on plant leaves, this paper proposes an effective plant disease image recognition method aECA-ResNet34. This method is based on ResNet34, and in the first and the last layers of this network, respectively, we add this paper’s improved aECAnet with the symmetric structure. aECA-ResNet34 is compared with different plant disease classification models on the peanut dataset constructed in this paper and the open-source PlantVillage dataset. The experimental results show that the aECA-ResNet34 model proposed in this paper has higher accuracy, better performance, and better robustness. The results show that the aECA-ResNet34 model proposed in this paper is able to recognize diseases of multiple plant leaves very accurately.

1. Introduction

Agriculture is a critical industry that significantly impacts the economic development of a country and the living standards of its people [1]. However, the productivity of this industry is often impeded by the persistent threat of pests, bacterial and fungal viruses that adversely affect important crops. The hindrance to increasing agricultural productivity is significant and requires proactive measures to mitigate the effects of these challenges. In order to safeguard plant health, there is a need to focus on enhancing the prevention and treatment of pests and diseases that affect plant leaves [2]. The integration of deep learning technology into the agricultural field has revolutionized the identification of plant leaf diseases, making it one of the most vital tools for the diagnosis and control of plant diseases [3] and ensuring crop safety. While traditional convolutional neural network (CNN) [
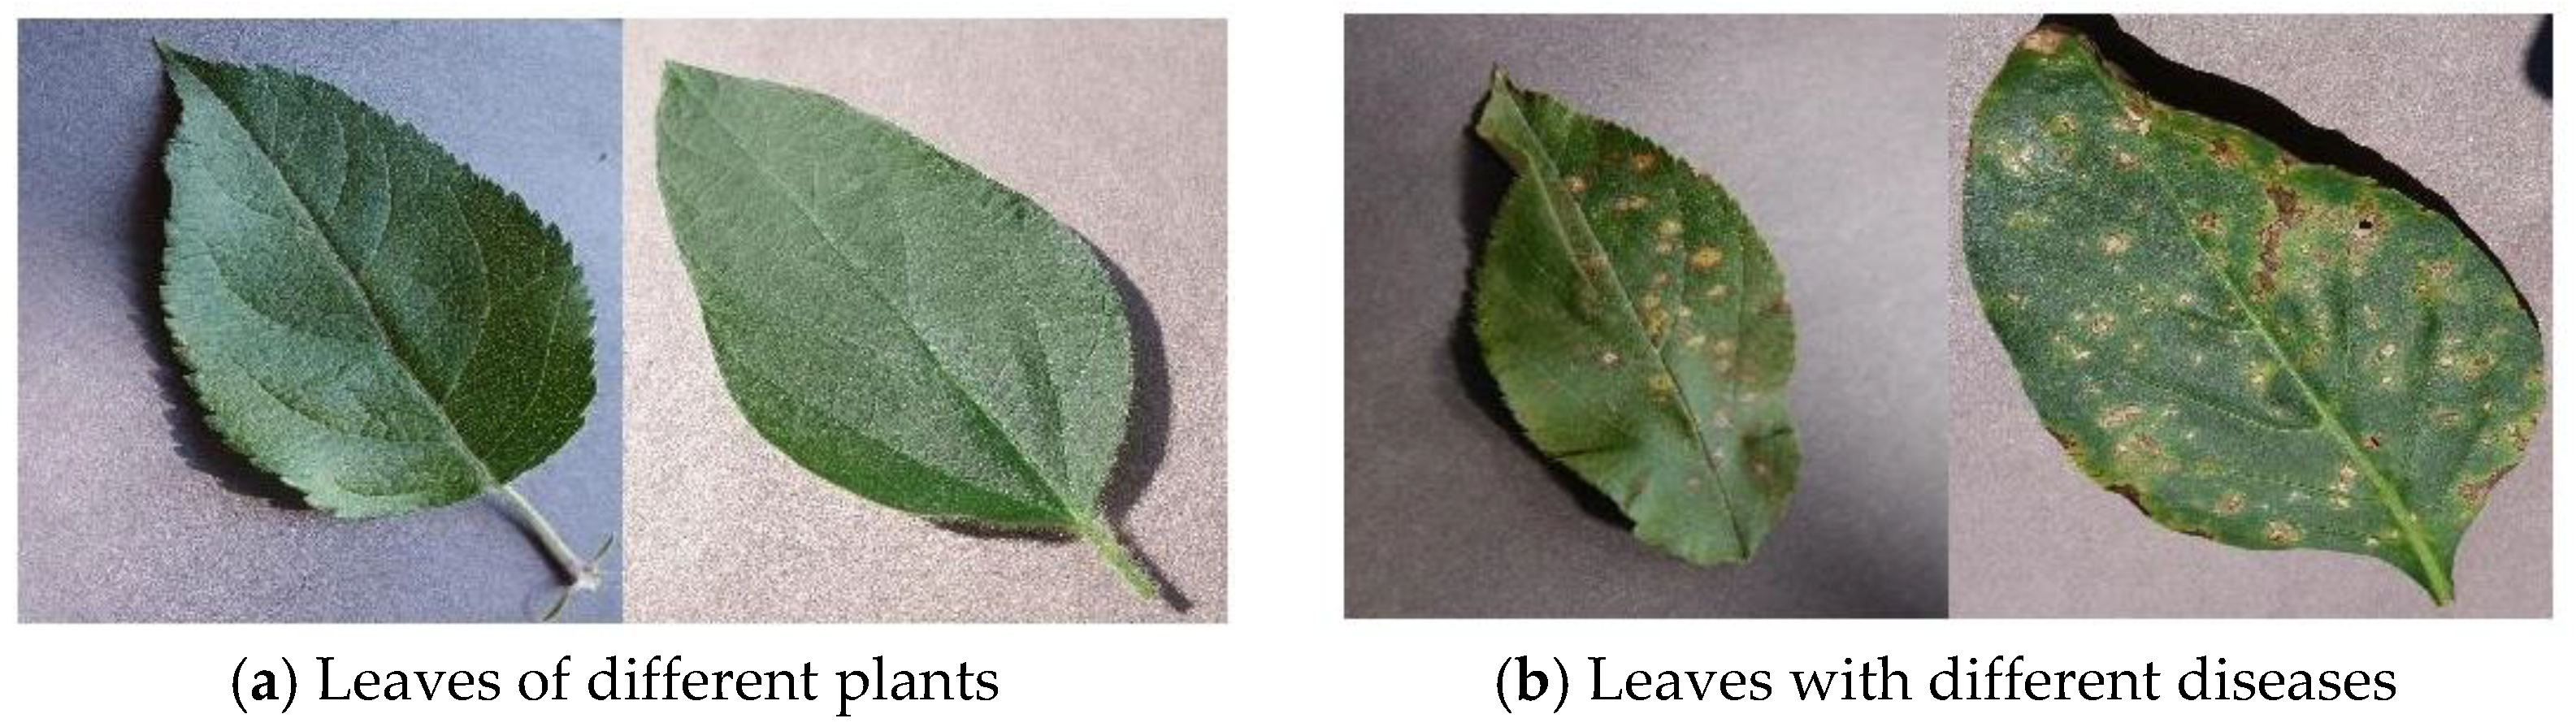
4] models are highly effective in identifying a few easily distinguishable types of plant diseases by extracting global features, they face significant challenges when dealing with a diverse range of similar plant disease species. The limited ability of traditional CNN models to extract only global features makes it difficult to distinguish between similar diseased leaves or similar healthy plant leaves [5], as shown in Figure 1. Figure 1a shows that different plants have similar leaves, and Figure 1b shows that different diseases have similar symptoms. To overcome this challenge, extracting local features has become an essential means to distinguish between different plant leaves, and the efficient and accurate extraction of local features is the core focus of this research.
Since the inception of deep learning in the field of artificial intelligence, image classification has become a key area of research. As this technology has evolved, the identification of plant diseases has emerged as a significant area of interest in the field of agriculture [6,7], building on the foundations of image classification. For the problem of disease recognition and classification of bean leaves, Elfatimi, E. et al. [8] proposed a network architecture based on MobileNetV2 and optimized the hyperparameters in the experiment; the results showed that this model can classify bean leaf diseases well. To improve the segmentation and recognition accuracy of plant leaf diseases, Hossain, S.M.M. et al. [9] proposed a DSCPLD recognition model based on depthwise separable convolution, and experimental results showed that this model had better segmentation and recognition accuracy compared with other advanced models. To address the issue of plant leaf disease classification, Atila, Ü. et al. [10] proposed a deep learning network model based on EfficientNet. The results showed that this model achieved higher accuracy on the PlantVillage dataset. Mukti et al. [11] used transfer learning to build the ResNet50 network model for plant diseases identification in the most cost-effective way on the PlantVillage dataset. Ji Miaomiao et al. [12] proposed a new network of BR-CNNs, a proposed network based on deep learning that can simultaneously identify plant species and plant diseases and estimate the degree of plant diseases. In order to minimize the effect of image background on image detection, Sunil, C.K. et al. [13] proposed a method for bean plant disease detection using an EfficientNetV2 model combined with U-2-Net. To minimize detection errors, Hernandez, S. et al. [14] proposed a method based on the combination of Bayesian and deep learning techniques to effectively improve the accuracy of plant disease detection. Addressing the problem that background and noise in tomato disease images can affect tomato disease detection, Albahli, Saleh et al. [15] proposed a tomato disease image detection method using DenseNet77 as backbone.
Moreover, attention mechanisms have been incorporated into machine vision, and researchers have focused on enhancing network performance by introducing various attention mechanisms to the network [16,17,18,19]. In order to synthesize two images with different styles into a single image that is not incongruous or realistic, Lu, Min et al. [20] proposed a deep learning method for coordinating the background and foreground of an image based on an improved self-attention mechanism. Aiming at the problem of tomato leaf disease identification, Deng, Hongxia et al. [21] proposed a data enhancement method named RAHC_GAN based on a GAN network; the results showed that this method can generate tomato leaves with disease characteristics and improve the classification accuracy. To address the issue of shadows in images generated by traditional data enhancement methods, Cap, Q.H. et al. [22] proposed a data enhancement method named LASSR; the results proved that this method generates images with better quality in cucumber datasets. To classify flowers automatically, Zhang, Mei et al. [23] proposed a spatial attention mechanism based on the Xception structure and used two loss functions, Triplet Loss and Softmax Loss, to improve the accuracy of the model, obtaining feature layers of images of flowers with higher precision. In order to improve the accuracy of facial expression recognition, Li, Jing et al. [24] constructed a new facial expression dataset and proposed a deep learning network method based on LBP features and attention mechanisms; experiments on the new dataset and other four datasets prove the effectiveness of the method. In order to improve the accuracy of plant disease recognition, Alirezazadeh, Pendar et al. [25] proposed a method combining a CBAM attention mechanism with a CNN and carried out experiments on two datasets; the results proved that the model combining a CBAM attention mechanism with an EfficientNetB0 network had the highest accuracy in identifying plant leaf diseases.
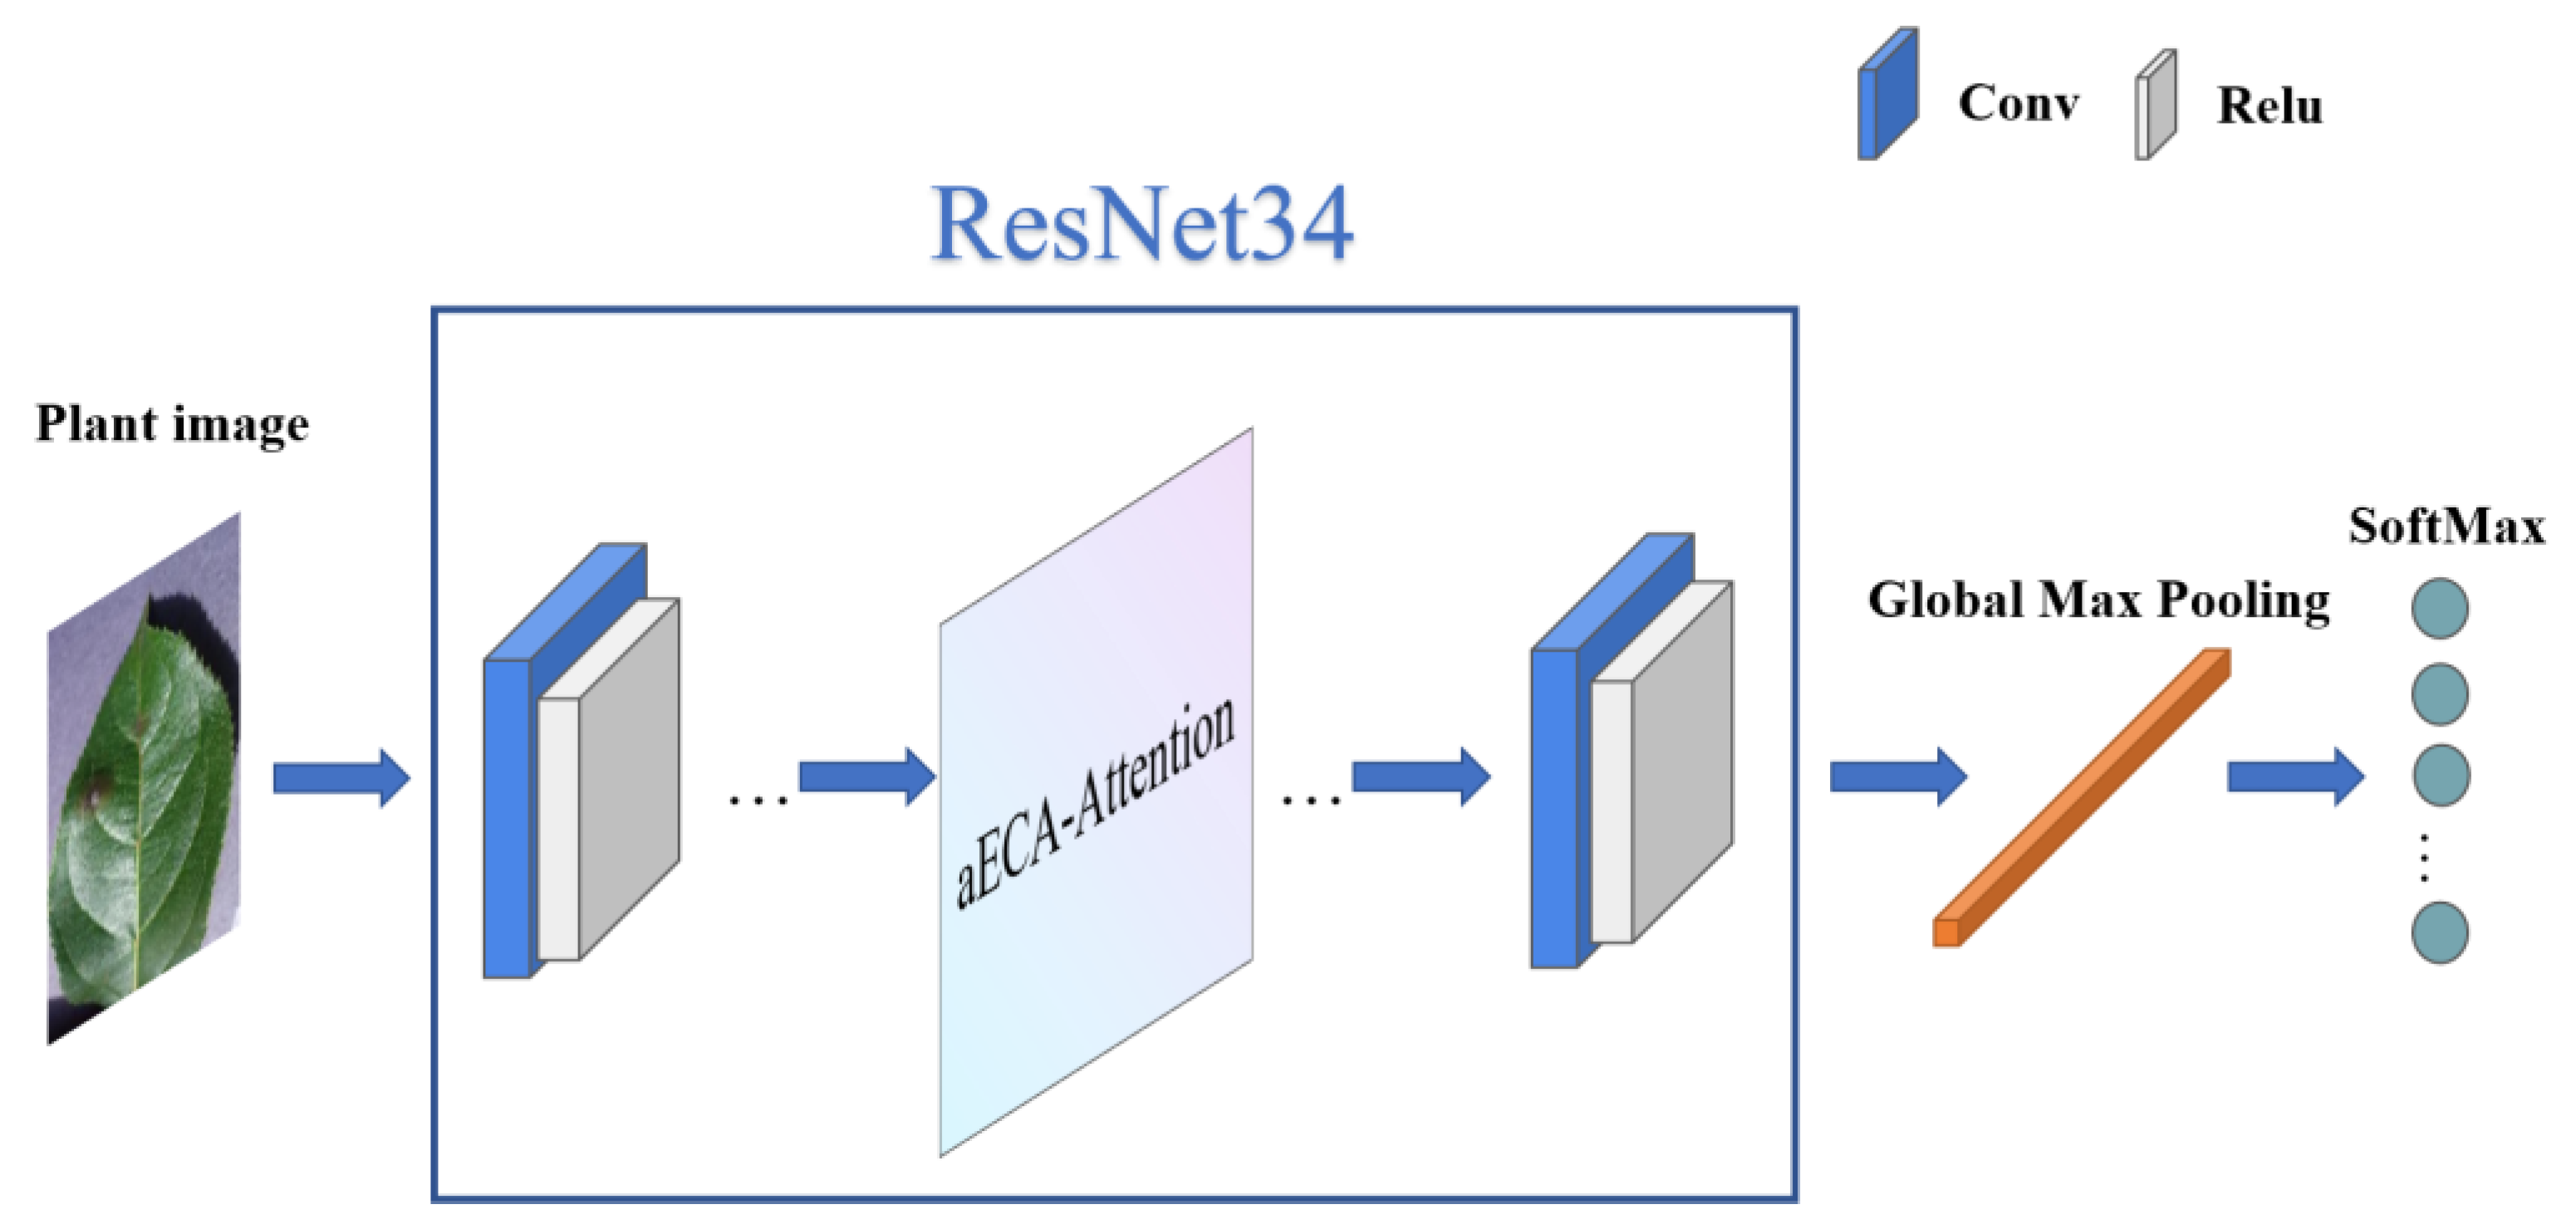
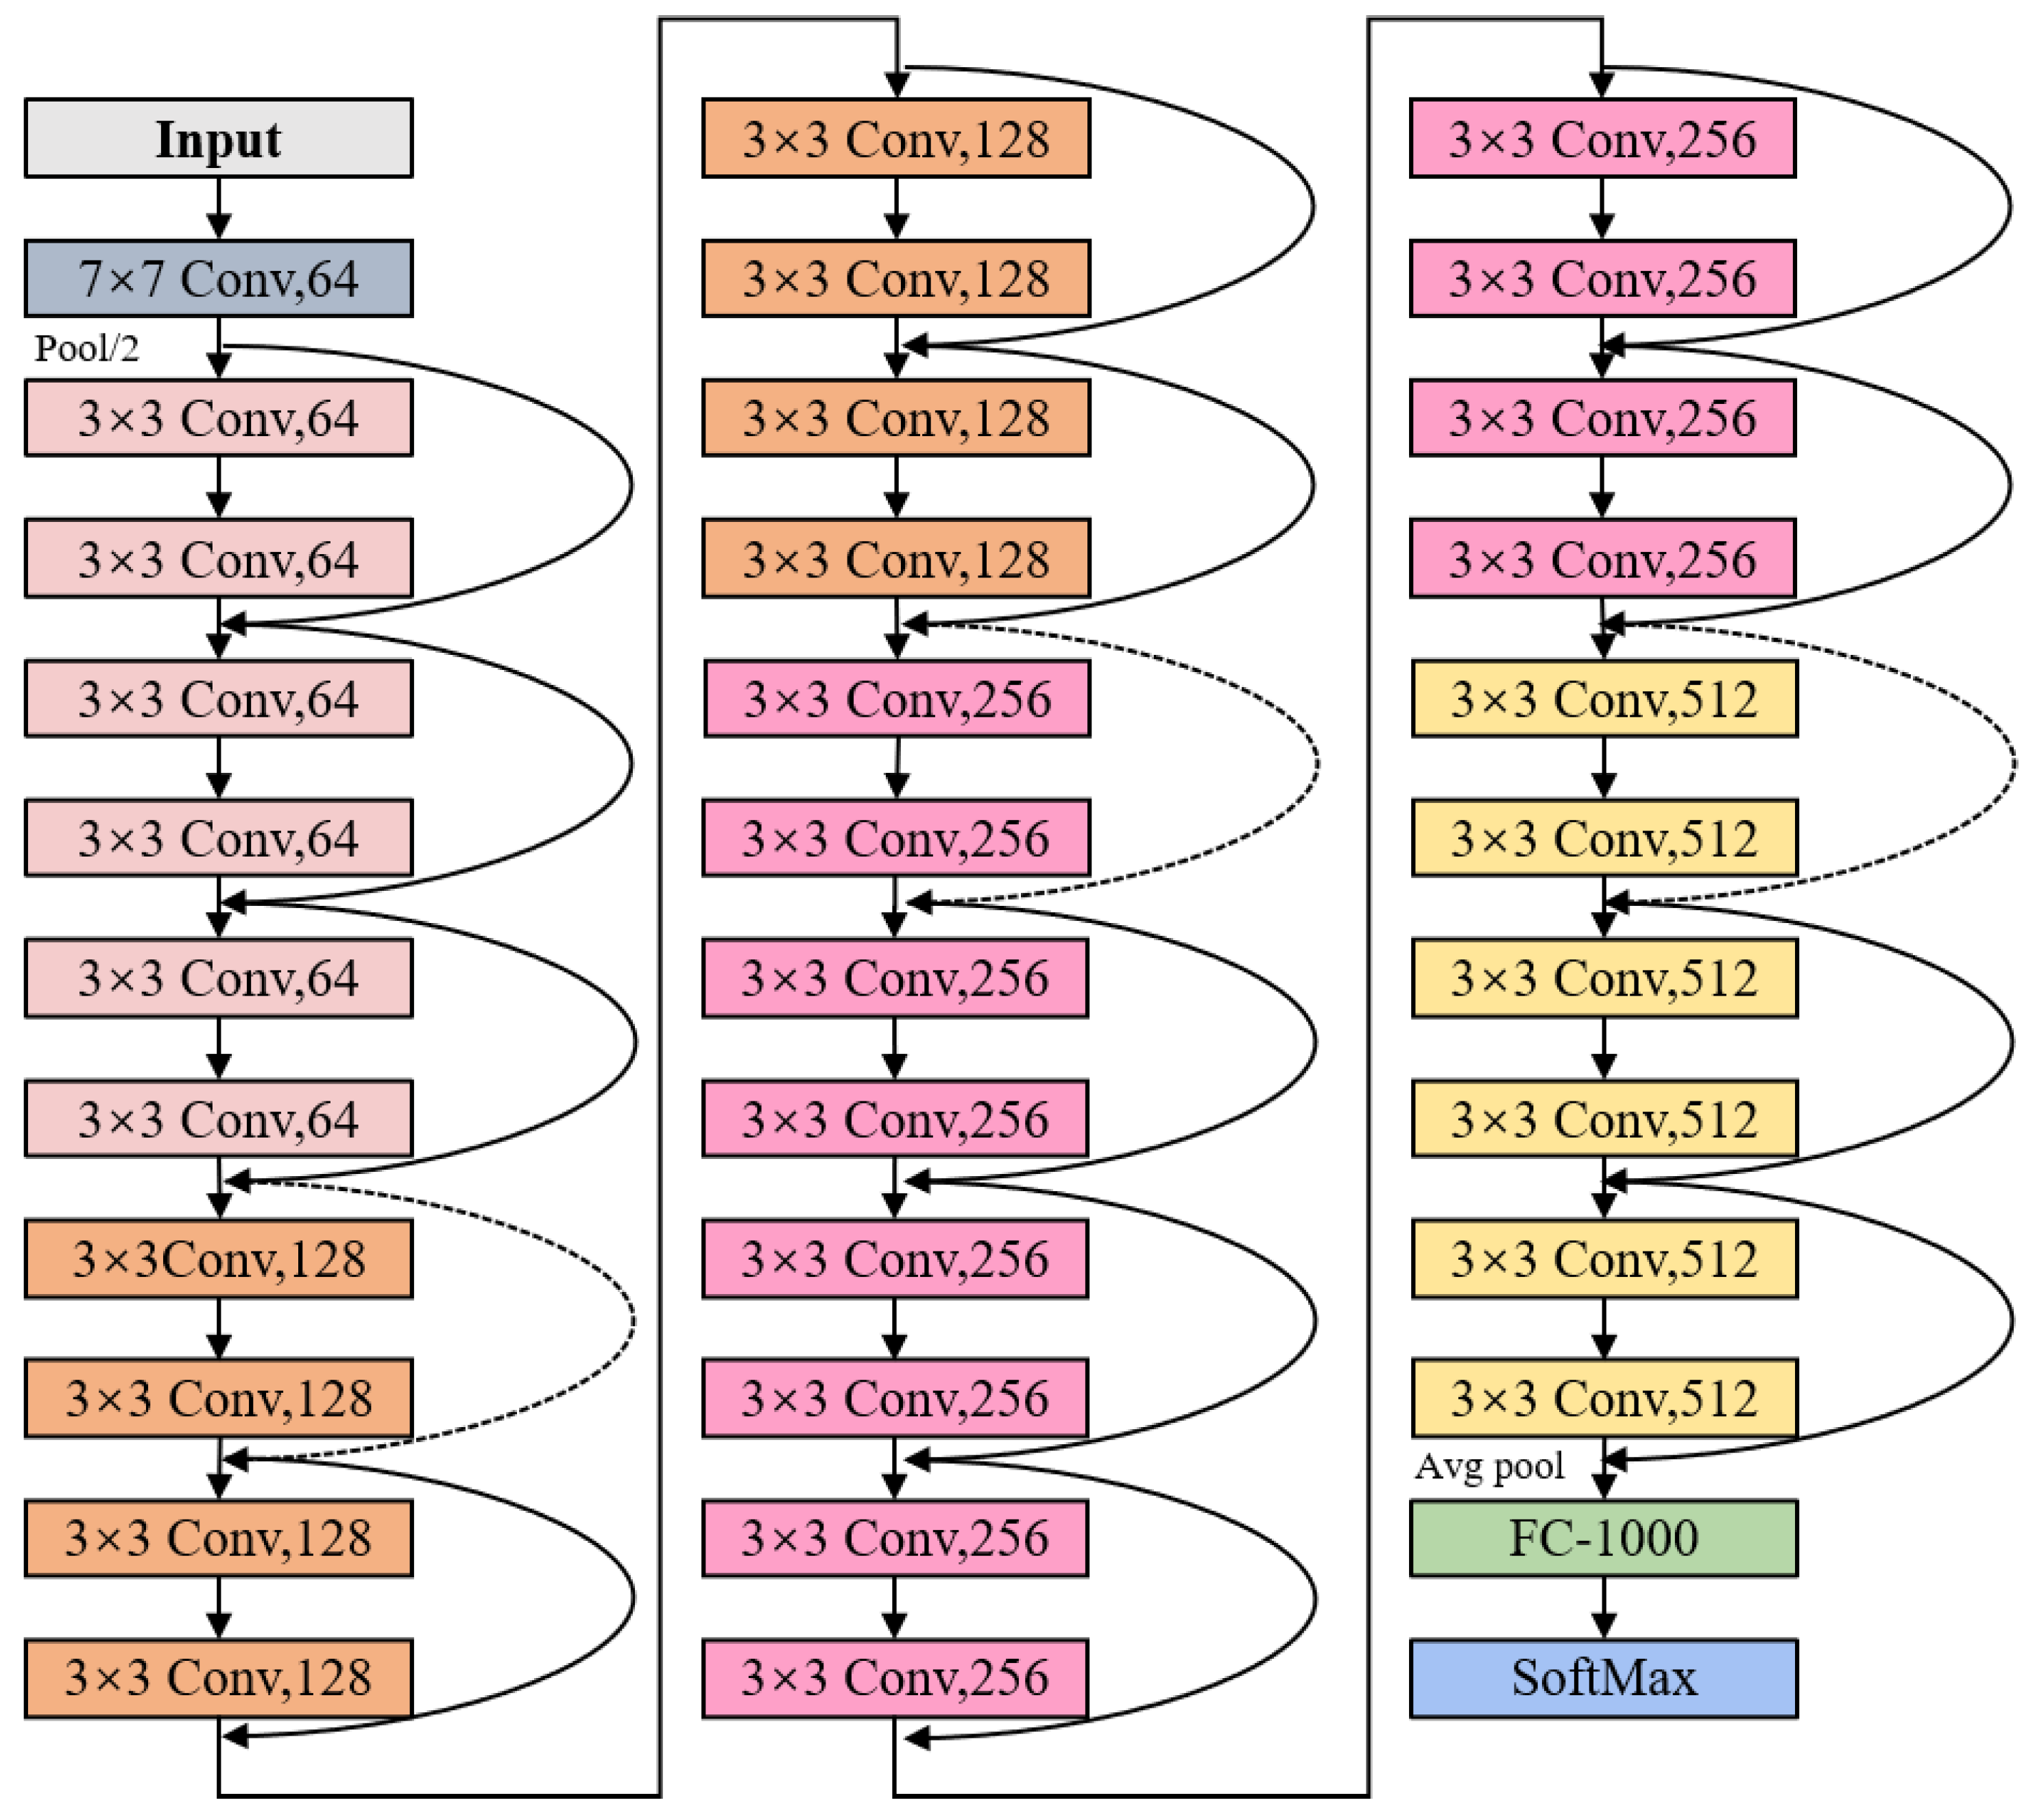
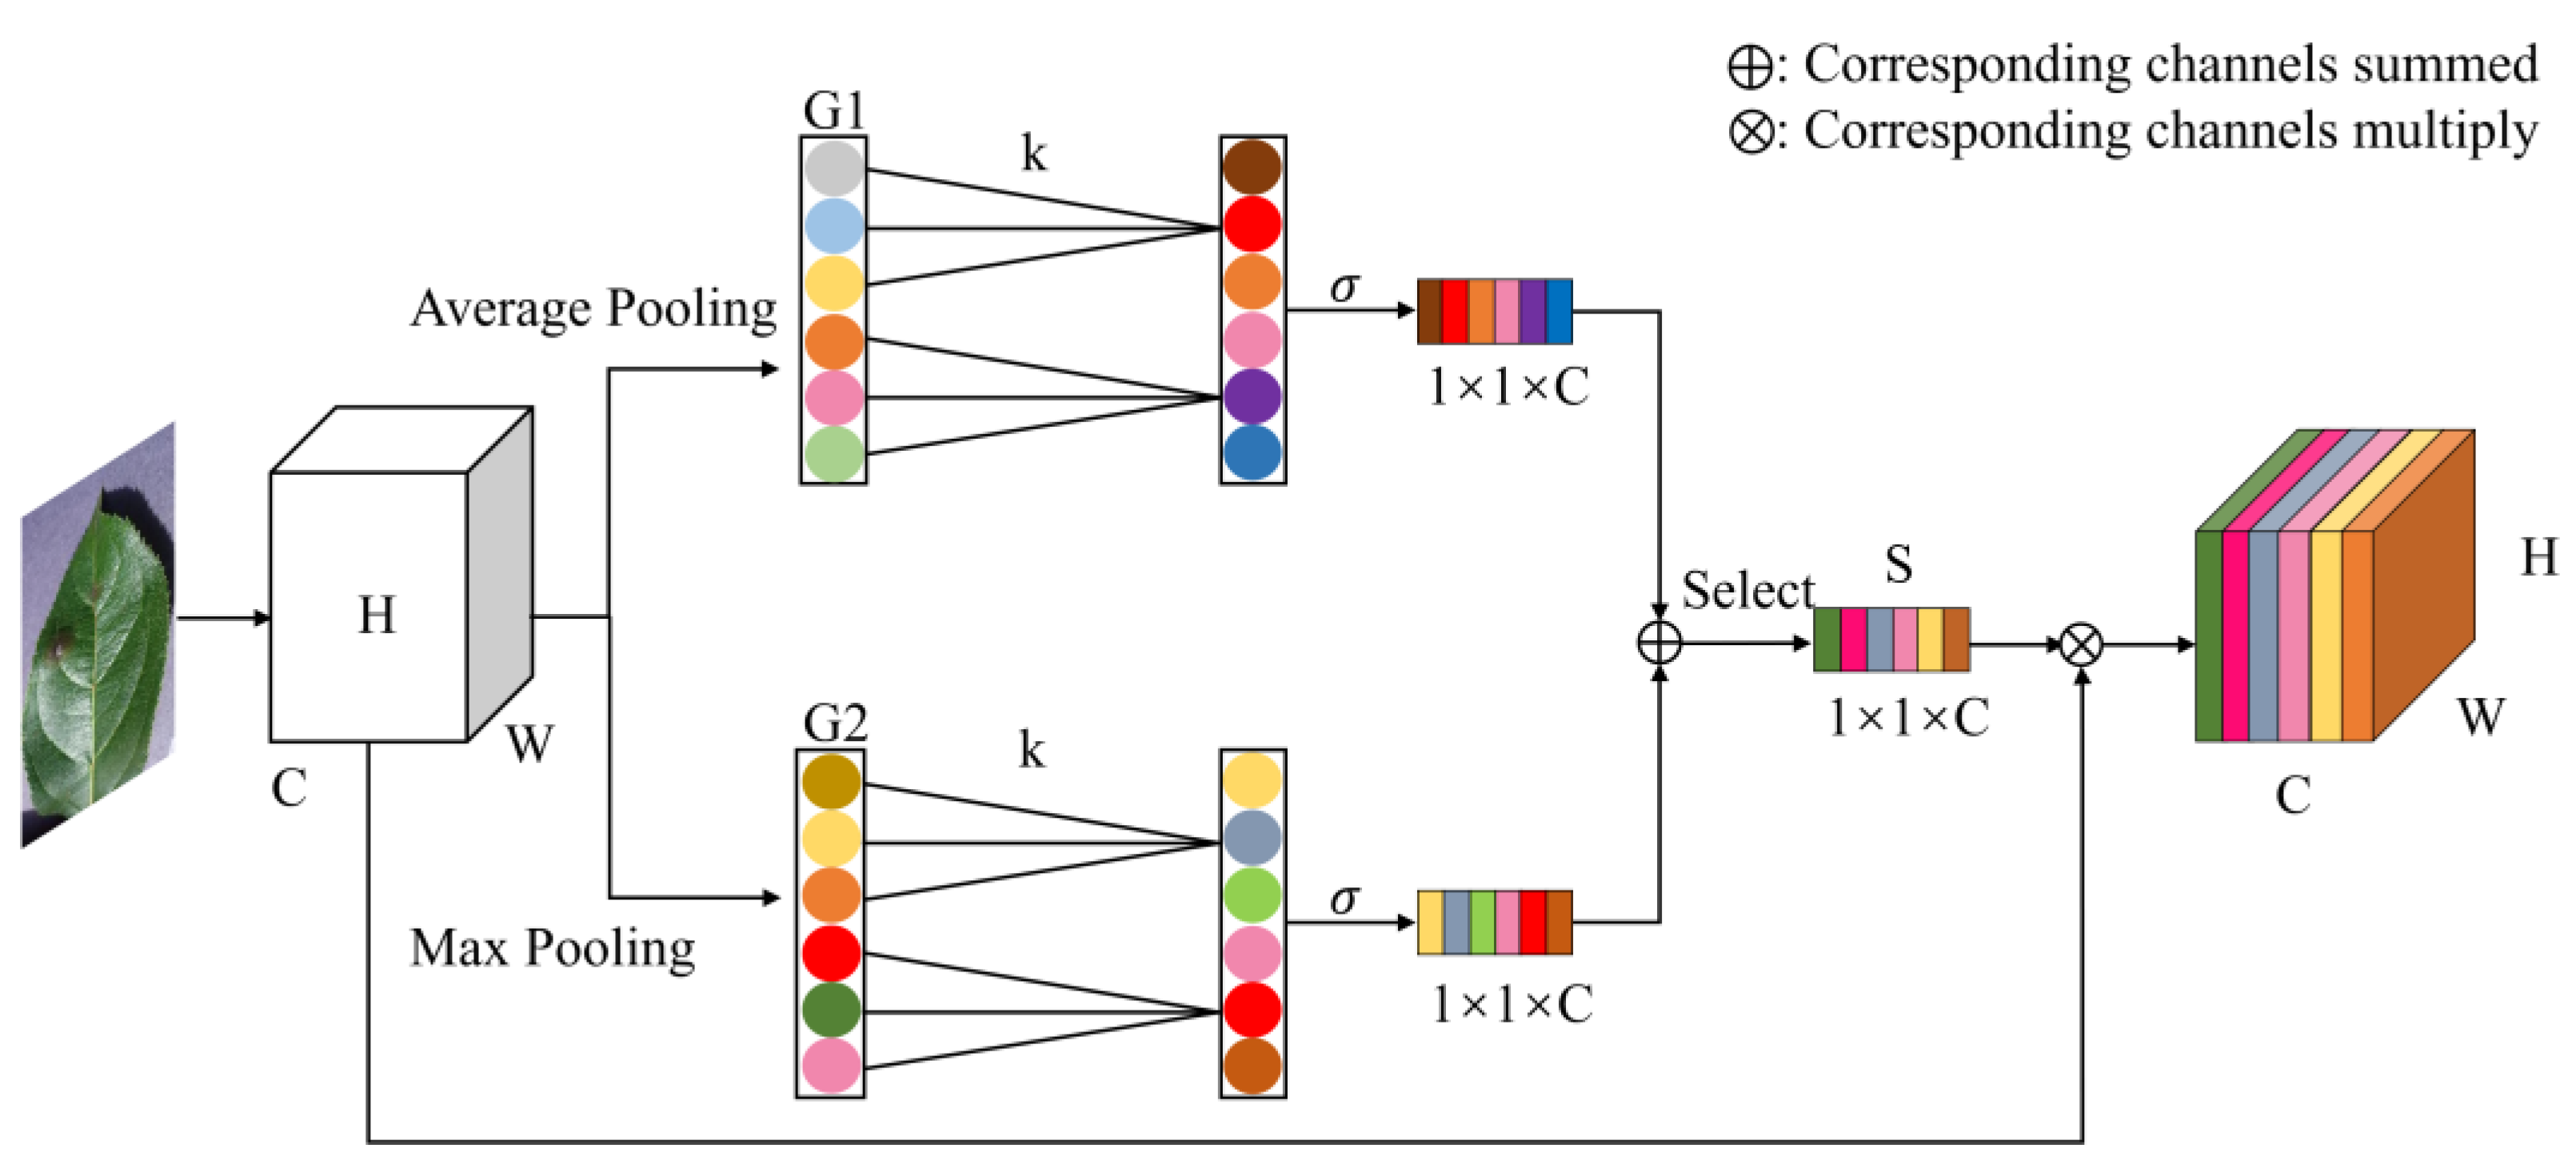
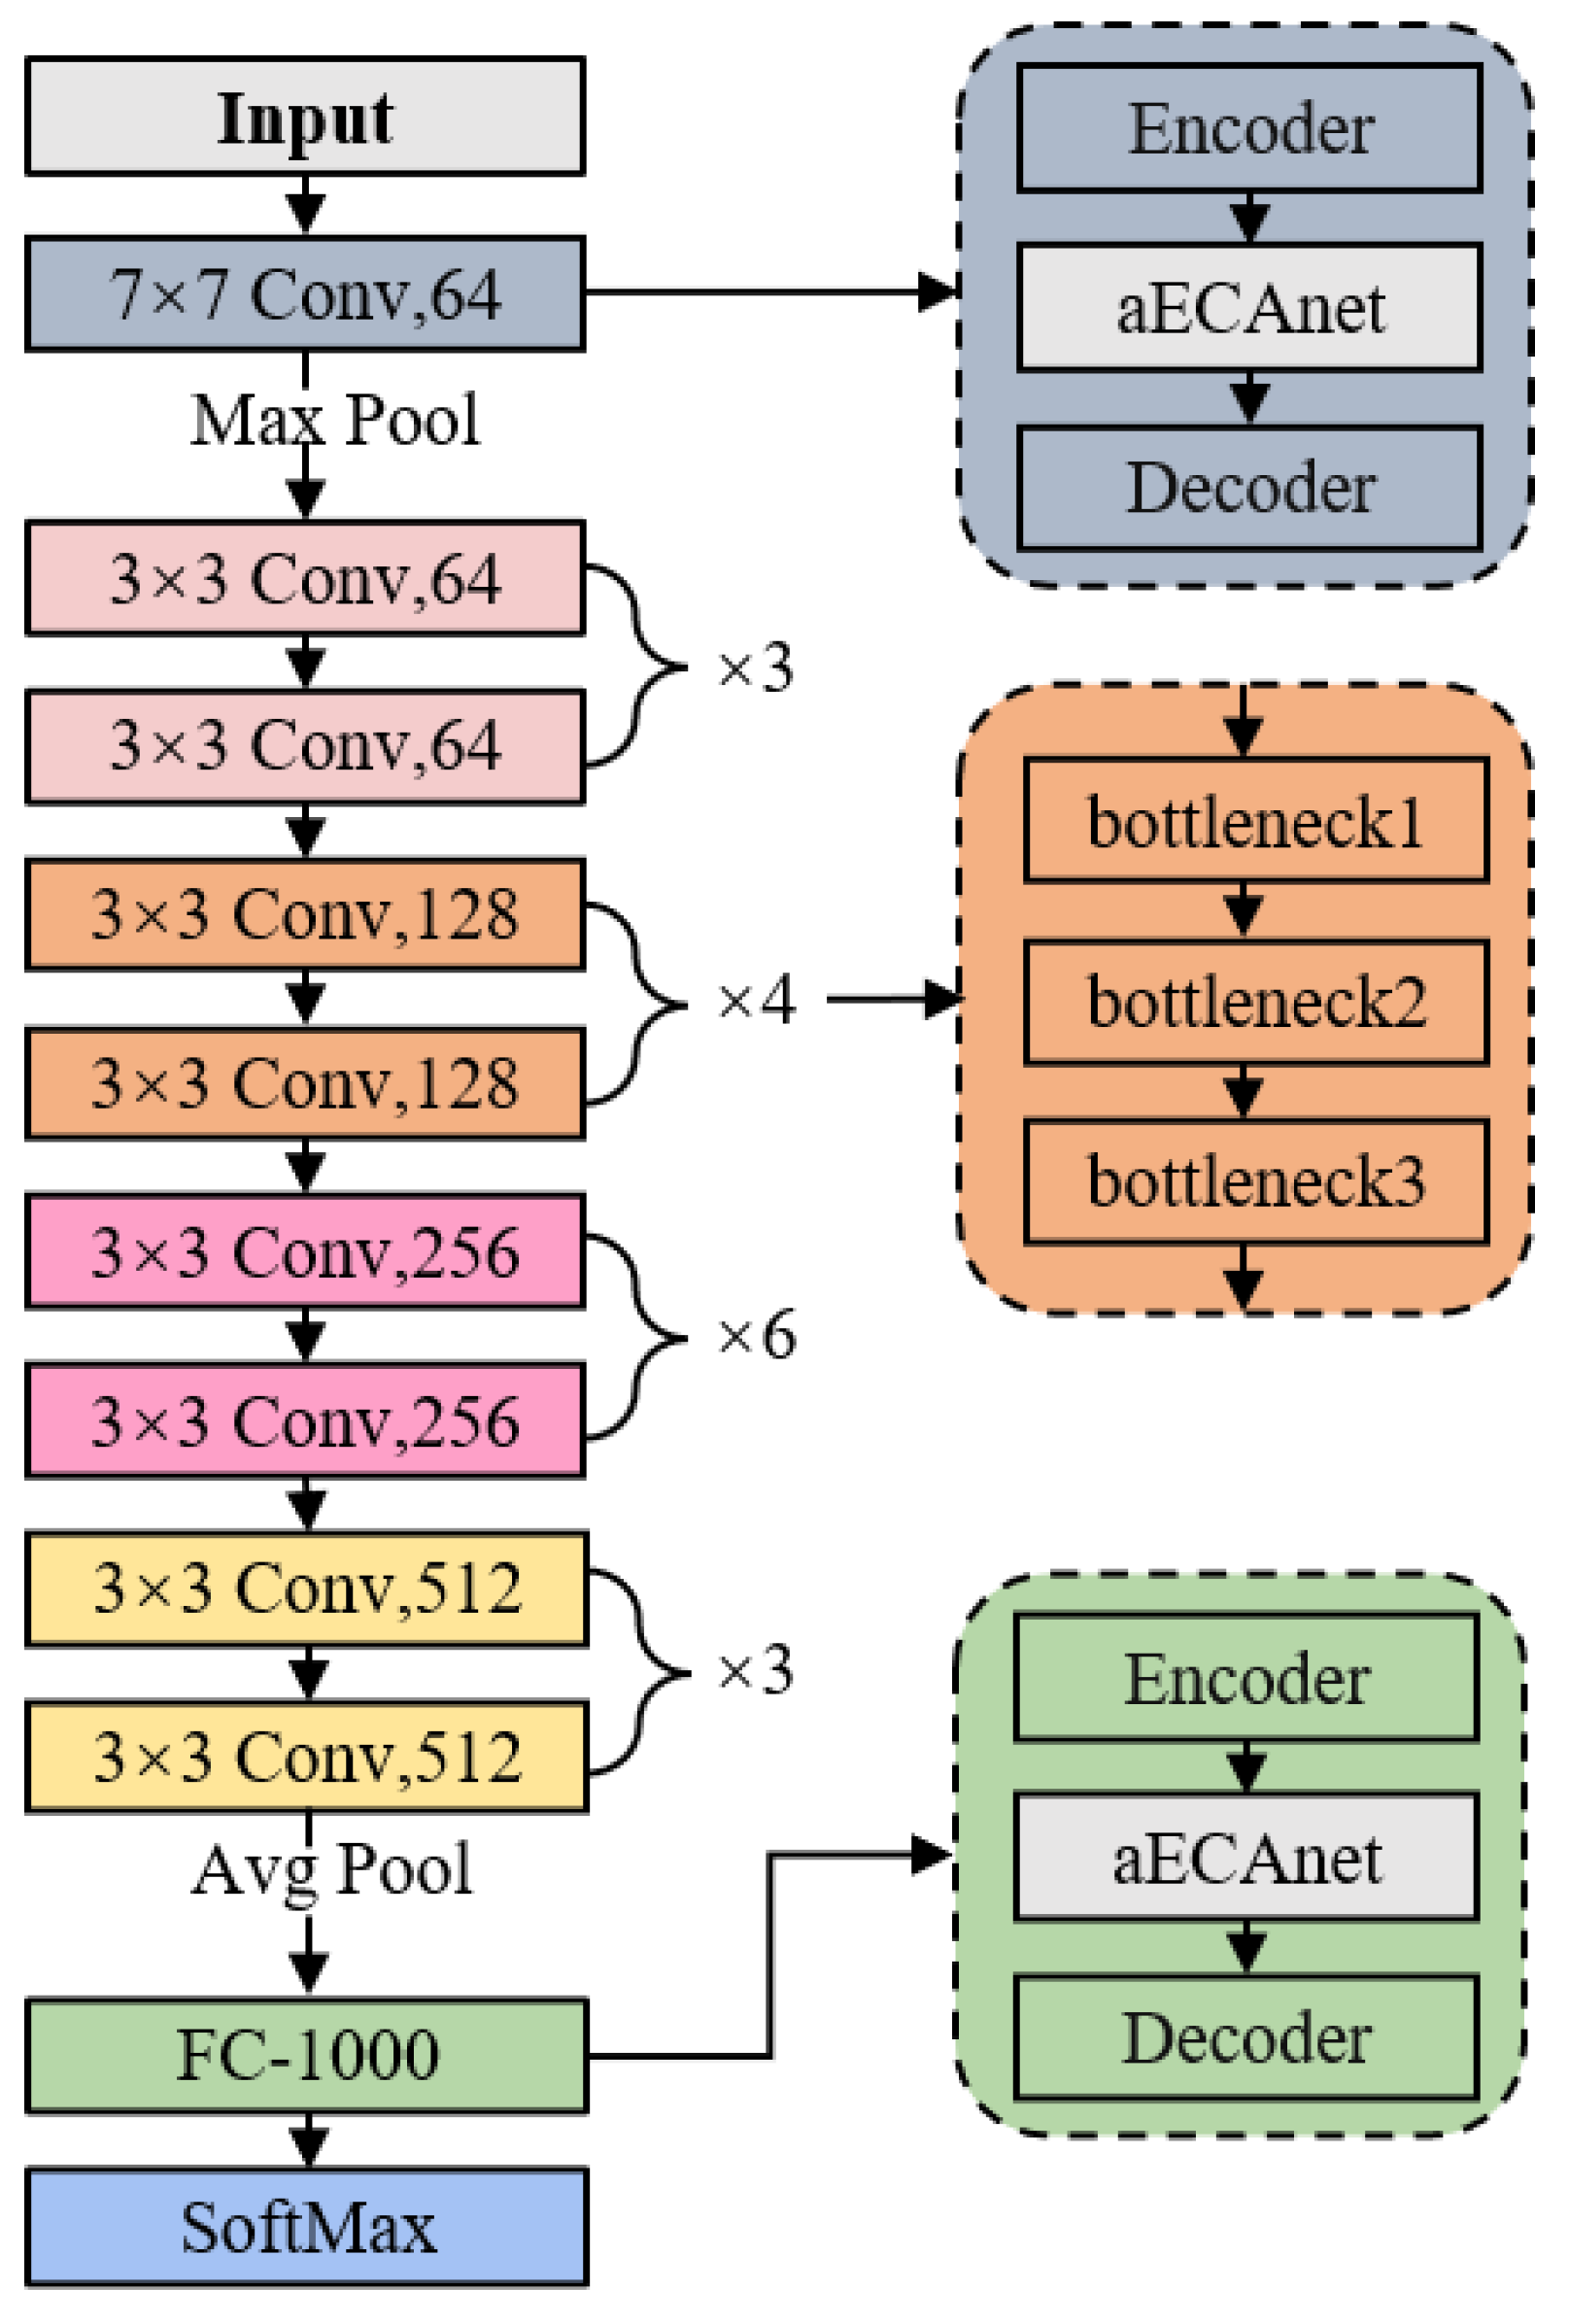
Despite the great role of attention mechanisms in major fields, there are still problems such as insufficient model accuracy and difficulty in local feature extraction for plant pests and disease identification and control. Therefore, this paper proposes an improved channel attention mechanism called aECAnet, which is combined with the traditional CNN ResNet34 to identify images of plant leaf diseases. The primary contributions of this research can be summarized in three aspects:
(1)
An improved channel attention aECAnet is proposed in this paper and its effectiveness in extracting local features of plant leaf images is demonstrated;
(2)
A novel network architecture called aECA-ResNet34 is developed, which combines ResNet34 with aECAnet to improve performance;
(3)
A comparative analysis is conducted among aECA-ResNet34 with other attention modules such as SENet and ECAnet. A series of experiments demonstrates the effectiveness of the proposed aECAnet in identifying similar plant species and similar disease symptoms compared with other models.

2. Convolutional Neural Network Model

The purpose of this study is to construct a deep CNN model that can extract local features effectively and exhibit high robustness for accurate recognition of plant disease images. In this section, the structure of deep CNN ResNet34, the structure of the channel attention network aECAnet, and the process of how to combine both will be described in detail.

2.1. General Framework

In order to extract the local features of plant leaves, the attention mechanism is introduced, and the combination of both improves the accuracy of plant leaf pest and disease classification. The network architecture is shown in Figure 2, which can be seen to contain ResNet34 and the improved channel attention mechanism, aECA-Attention network. As can be seen from Figure 2, the blue rectangular block represents the convolution block, the gray rectangular block represents the Relu activation function, and the diamond-shaped module represents the improved aECA-Attention network module. The peanut leaf images are input first and their global features are extracted through a series of convolutions [26], the aECA-Attention module is added in ResNet34 to extract the local features, then the feature texture is extracted through Global Max Pooling to reduce the influence of useless information, and finally, the classification results of this image are output through the Softmax function.

2.2. ResNet34

With the increase in the number of layers, the weight matrix degrades and the ability to learn features decreases, which may lead to the symmetric state of the network. In order to solve this problem, ResNet is a residual network structure proposed by Kaiming He et al. [27]. It proposed a new concept breaking the symmetry of the neural network: a Shortcut Connection. Not only does this successfully solve the problem of gradient vanishing and gradient explosion, but it also significantly enhances the training efficiency and performance of deep neural networks, which further promotes the development of deep learning technology. ResNet was proposed with different layers of network models, such as ResNet18, ResNet50, ResNet101 [28,29,30], etc. In this research, the ResNet34 network is used, and its structure is shown in Figure 3. First, the image size 224 × 224 is input into a convolution layer with a convolution kernel size of 7 × 7, 64 convolution kernels, a step size of 2, and padding of 3, and the output is 64 × 112 × 112. Then, after a pooling layer with a pooling core size of 3 × 3, pooling core numbers of 64, a step size of 2, and padding of 1, the output is 64 × 56 × 56. In addition, it is worth noting that there are two kinds of connecting lines in the figure: solid lines and dashed lines. Solid lines indicate that the input and output dimensions are the same, and the calculation method is to add them directly; dashed lines indicate that the input and output dimensions are different and cannot be added directly, and the calculation method is to convolve the input image by 1 × 1 first.

3. Attention Mechanism

The attention mechanism was first utilized in natural language processing and later extended to computer vision. Since then, it has been widely employed for visual information processing, particularly in the medical field [31,32]. Although there is no rigid mathematical definition for the attention mechanism, traditional methods such as local image feature extraction and sliding window approaches can also be viewed as attention mechanisms. In neural networks, the attention mechanism is typically an additional neural network that can selectively focus on particular regions of the input or allocate varying weights to different parts of the input [33,34]. This allows the attention mechanism to effectively extract vital information from a vast amount of data.

3.1. Improved Attention Mechanism aECAnet

There are many ways to introduce attention mechanisms in neural networks, either by adding them in the spatial dimension or in the channel dimension [35,36]. In this paper, an improved attention mechanism aECAnet is added to the channel dimension.
After the global average pooling operation on the feature map in ECAnet, the local dependency information between the current channel of the feature map and its k domain channels can be obtained, which reduces the number of parameters and the computation amount. But the single average pooling loses too much information, and the re-removal of the fully connected layer also makes the global dependency information between the channels lost, which is not conducive to the extraction of the local information of the image. To solve this problem, the improved aECAnet channel attention module parallelizes a branch of global max pooling on top of the original ECAnet, shown in Figure 4.
It can be seen from Figure 4, that average pooling and max pooling are structurally symmetric. This symmetry guarantees that their outputs are summable. The parallel method of the two pooling methods, average and max, loses less information than single pooling and extracts image local information better.
Assume that the output of a convolutional block is represented as x R W × H × C , where W, H, and C denote the width, height, and channel dimension, respectively, corresponding to W, H, and C in Figure 4. The first branch of the channel, the feature vector after global average pooling, is denoted as Equation (1).
G 1 = 1 W H i = 1 , j = 1 W , H x i j
The second branch of the channel, the feature vector after global maximum pooling, is denoted as Equation (2).
G 2 = max i , j R W × H x i j
where G1 is the feature vector obtained by global average pooling and G2 is the feature vector obtained by global maximum pooling. The pooled feature vectors G1 and G2 are collectively referred to as g , and its range is given as g R C . Then aECA-attention on the inter-channel weights is calculated as Equation (3).
ω = σ W k g
where σ is the sigmoid activation function, which is calculated as shown in Equation (4). W k is a band matrix to learn channel attention, as proposed in ECAnet. W k in Equation (5) involves k × C parameters.
σ x = 1 1 + e x
W k = w 1,1     w 1 , k     0 0   w 2,2       0           0     0     w C , C
According to Equation (5), it can be seen that only k channels of the current channel domain are considered in the calculation of inter-channel weights. Then its weight calculation formula can be changed from Equations (3)–(6).
ω i = σ j = 1 k w j g i j , g j   ϵ   Ω i k
where Ω i k denotes g i and the set of its k domain channels. w j indicates that all channels share the same learning parameters. To implement this strategy, a 1-dimensional convolution of convolution kernel size k can be used, as in Equations (7) and (8).
ω a = σ C 1 D k G 1
ω m = σ C 1 D k G 2
where CID denotes 1D convolution and the above method involves only k parameters. ω a is the channel weight obtained from the first branch, which applies global average pooling, and ω m is the channel weight obtained from the global maximum pooling of the second branch. The channel weights of the two branches are obtained, and the weight selection operation (Select) is obtained by weighting them by Equation (9) [37].
V = a ω a + b ω m ,   a + b = 1
where a and b are dynamic parameters that are continuously adjusted and optimized during the network training. The final output x ~ of the ECA-attention module is obtained by multiplying the inter-channel weights V and the input feature vector x , as shown in Equation (10).
x ~ = V x

3.2. Location of aECAnet in Combination with ResNet34

In the traditional application of the attention mechanism, there is no clear standard for the location of adding the backbone network. However, in the experiment, the location of adding the attention mechanism except the first and last layer will change the network structure, and the pre-trained weights cannot be used. Due to the use of pre-trained weights in the experiments of this paper, the attention mechanism can only be added in the middle of the encoder and decoder of the first and last layers of the ResNet34 network, and the model has the best training effect. The main structure of aECA-ResNet34 proposed in this paper is composed of ResNet34 as the backbone network, and the improved aECAnet attention mechanism is added to the middle of the ResNet34 network. From the above Figure 3, it can be seen that ResNet34 is composed of 34 convolutional layers, and the aECAnet module is added in the middle of the encoder and decoder of the first convolutional layer and the last fully connected layer of the ResNet34 network, as shown in Figure 5.
The bottleneck1, bottleneck2, and bottleneck3 in Figure 5 all have two convolution layers with kernels of size 3 × 3 and 64 and a residual skip connection between input and output. The composition of 4, 6, and 3 convolutions below consists of 2 convolutional layers with kernel size 3 × 3, number of kernels 128, 256, and 512, and a residual skip connection between input and output, respectively. In order not to destroy the structure of the bottleneck, this paper adds the aECAnet module in the middle of the encoder and decoder of the first convolutional layer and the last fully connected layer of the ResNet34 network.

4. Experiments and Results

In order to prove the effectiveness and superiority of the aECA-ResNet34 model proposed in this paper, experiments will be conducted on the PlantVillage dataset and peanut dataset, respectively. The experiments are mainly divided into two parts. The first part is a comparison experiment between the aECA-ResNet34 model and ResNet34 with different attention mechanisms. The second part is a comparison experiment between the aECA-ResNet34 model and different convolutional neural networks.

4.1. Dataset and Preprocessing

In this paper, we will use the PlantVillage dataset and peanut dataset for experiments.

4.1.1. PlantVillage Dataset

The PlantVillage dataset includes 54,303 health and diseases images [38], divided into 39 categories. Plant leaves of 14 species such as apple, corn, grape, bell pepper, potato, tomato, etc., are included. Diseases of 10 kinds, such as leaf blight, bacterial leaf spot, early blight, late blight, rust, etc., are included. The specific number of pictures in each category is shown in Table 1.

4.1.2. Peanut Dataset

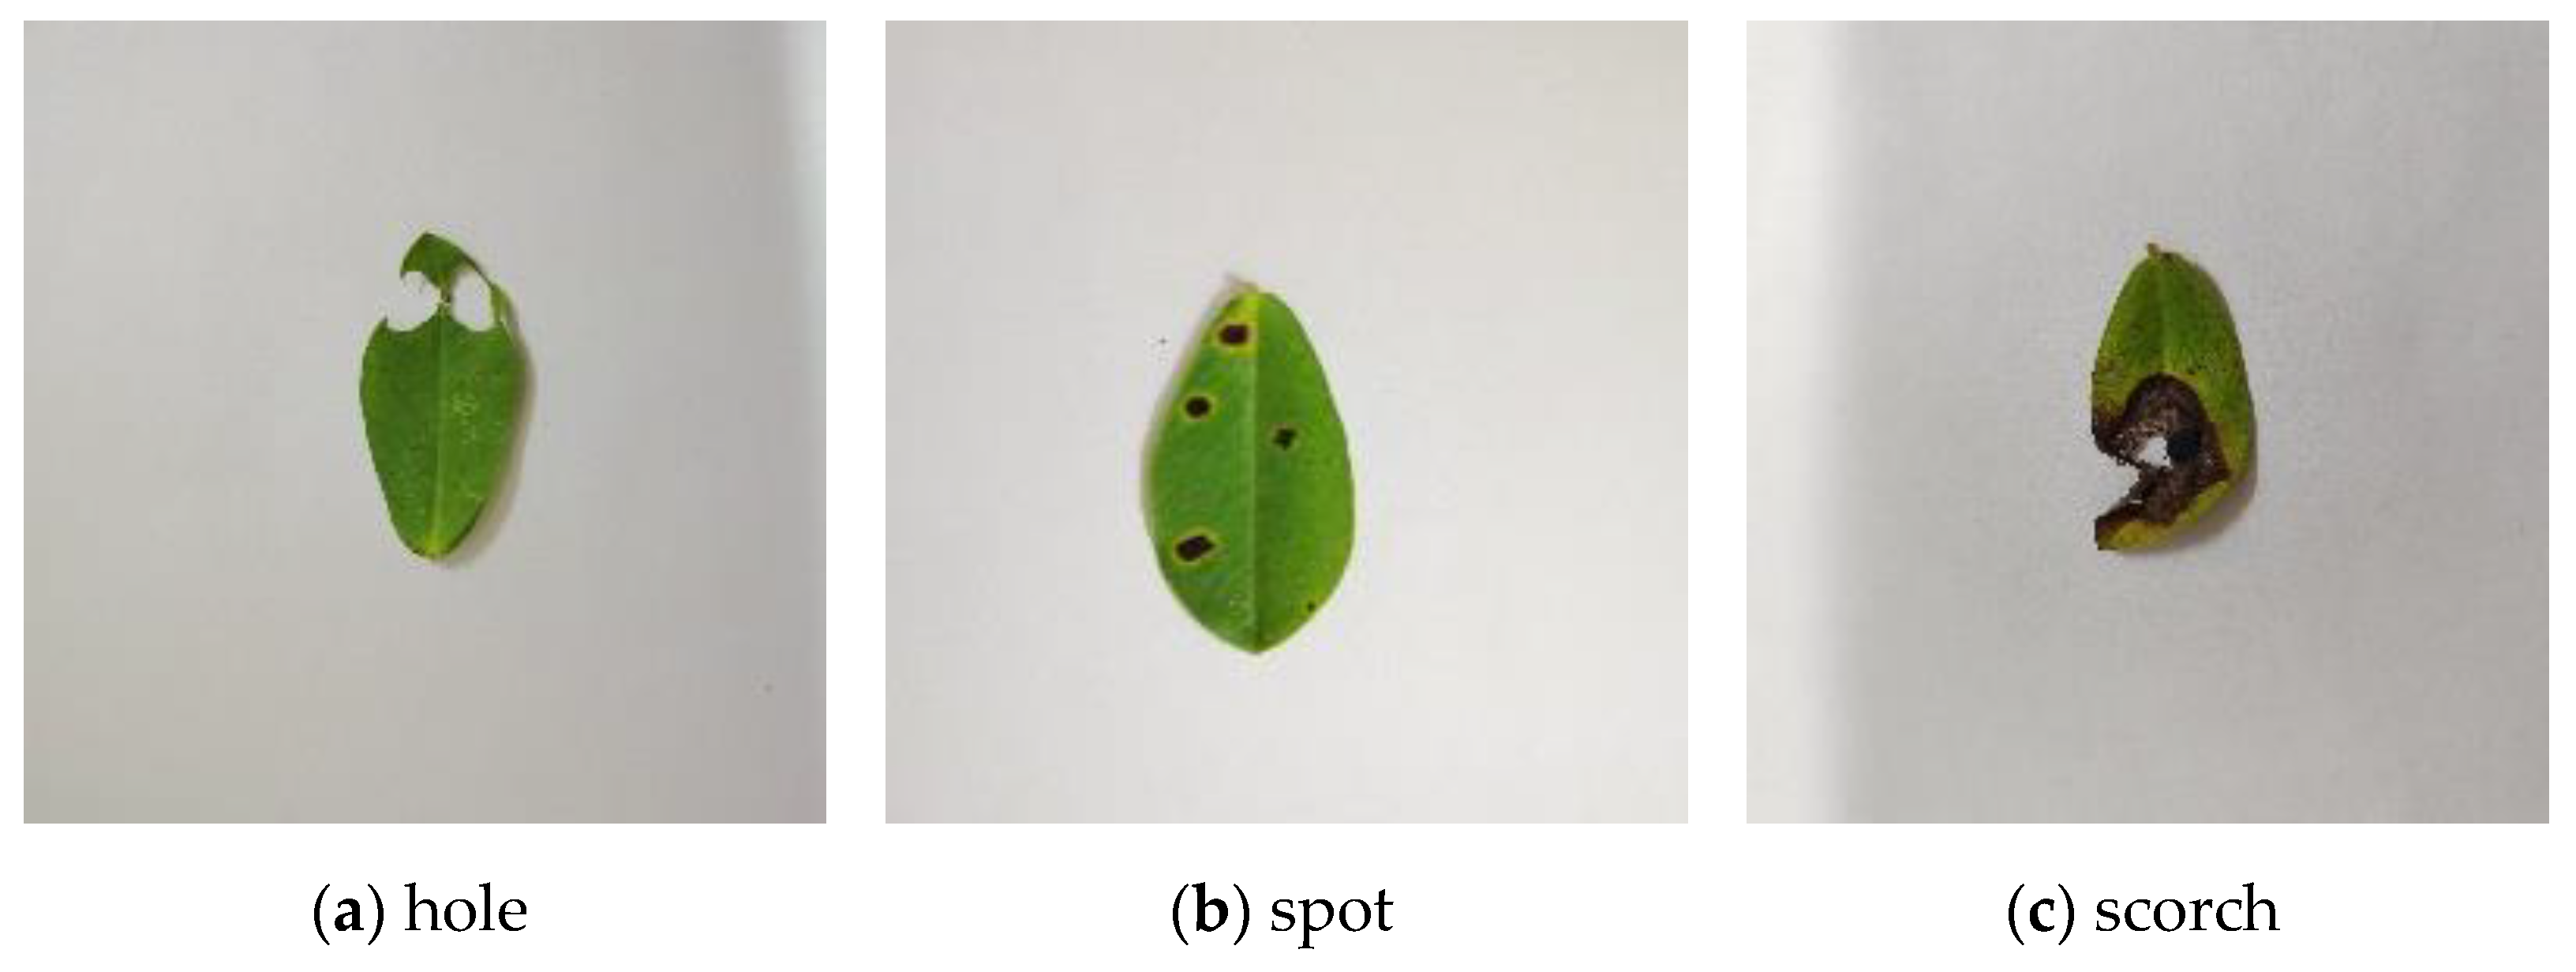
The images of the peanut dataset were taken by us, it contains 1329 images, and there are three types of diseases, namely hole, spot, and scorch disease, as shown, respectively, in Figure 6a–c. There are 466 images of hole disease, 351 images of spot disease, and 512 images of scorch disease. The peanut leaves were sourced from the experimental field of Baiquan Modern Agricultural Research Institute in Xinxiang, China (latitude 35°16′24″ N, longitude 113°56′46″ E), the shooting background was the intelligent measurement and control technology laboratory of Henan Science and Technology College in Xinxiang, China, and the shooting equipment was the Honor 30pro and the Honor 80gt cell phones produced by Honor Corporation in Shenzhen, China.

4.1.3. Preprocessing of Datasets

Since the images have different pixel sizes, sending the whole dataset directly into the network for training may result in the loss of individual image information and thus lead to unsatisfactory results; therefore, the images in the dataset are first cropped to the same pixel size 256 × 256, and then data augmentation is performed. Additionally, data augmentation is one of the important methods used to improve the performance of the network [39], which is to solve the problem of an uneven number of dataset images and small amount of data. This is mainly performed by random flipping, shifting, adding noise to the image in the categories of Gaussian noise and Salt Pepper noise, and color perturbation in the form of adding random factors to adjust the brightness, contrast, saturation, and hue of the image to generate new images and expand the dataset. The PlantVillage and peanut datasets are preprocessed in the laboratory. Finally, the enhanced dataset is normalized, and the resulting tensor is fed into the network.

4.2. Experimental Platform and Training Setup

In this paper, the experimental environment is configured as follows: the system version is Windows 10 Professional; the CPU is 12th Gen Intel(R) Core(TM) i7-12700KF; the GPU is NVIDIA GeForce RTX 3080, CUDA11.2.0; the Python version is 3.8.13; and the deep learning framework version is Pytorch1.12.1.
In order to reduce the impact of the imbalance between positive and negative samples on the model, this paper uses the cross-entropy loss function as the loss function of the model. In order to ensure smooth experiments and improve the stability of the model, the experiments in this paper use the SGD method to optimize the parameters in the network, with a batch size of 16, training epoch of 20, and initial learning rate set to 0.001.

4.3. Evaluation Indicators

In order to verify the superiority of the proposed aECA-ResNet34 model, this paper will compare the aECA-ResNet34 model with other neural networks under the same parameter settings using multiple evaluation indicators, including precision (Accuracy), average precision (AP), average recall (Rec), average F1 score (F1), and a confusion matrix [40]. The models involved in the evaluation include ResNet34, SE-ResNet34, ECA-ResNet34, VGG19, ShuffleNet V2, and DenseNet121 [41,42,43]. The formulas for Acc, AP, Rec, and F1 are shown in Equations (11)–(14).
A c c = T P + T N T P + F P + T N + F N × 100 %
A P = T P T P + F P × 100 %
R e c = T P T P + F N × 100 %
F 1 = 2 A P R e c A P + R e c
where TP stands for the number of positive samples predicted and the number of actual positive samples, FP stands for the number of positive samples predicted and the number of actual negative samples, TN stands for the number of negative samples predicted and the actual number of negative samples, and FN stands for the number of negative samples predicted and the actual number of positive samples. For multi-category tasks, the confusion matrix clearly reflects the probability of misclassification between categories, the better the classifier the larger the value on the diagonal and the smaller the value should be elsewhere.

4.4. Comparative Tests of Attentional Mechanisms

In order to verify the effectiveness of the aECA-ResNet34 model proposed in this paper, a comparison was conducted between its network performance and accuracy with that of four other models, namely ResNet34, SE-ResNet34, and ECA-ResNet34, on two datasets.

4.4.1. PlantVillage Dataset

Four network models were trained on the PlantVillage dataset, and the Acc change curves are shown in Figure 7. The optimal classification accuracy of the aECA-ResNet34 model proposed in this paper can reach 98.9% on the PlantVillage dataset, which is higher than the other three. The aECAnet network uses two types of pooling, and the performance of global average pooling is better than global maximum pooling in image localization [44]. Therefore, at the beginning of training, the classification performance on this branch of global maximum pooling is poor, resulting in low classification accuracy of aECAnet. But this situation only lasts for three epochs, and when this branch of global maximum pooling can capture image information well, aECAnet has the image information captured by two branches and the accuracy rate increases at this time.
Secondly, the excellent performance and accuracy of the four networks were compared in terms of the magnitude of three evaluation metrics, AP, Rec, and F1 score. AP represents how many of the samples predicted to be positive are true positive, Rec represents how many of the positive samples in the total sample were predicted correctly, and F1 score is an assessment indicator that combines these two indicators and is used to synthesize the overall indicator. Higher values of AP and Rec indicate better prediction results. The results of the optimal values of AP, Rec, and F1 are shown in Table 2.
From Table 2, it is easy to see that the aECA-ResNet34 proposed in this paper achieves 98.5% accuracy, 98.6% recall, and 98.5% F1 score, which shows the best performance among all models.

4.4.2. Peanut Dataset

In order to verify the generalization of the proposed aECA-ResNet34 model, this paper compares the performance indicators of the four network models on the peanut disease dataset, and the maximum values of the four performance indicators Acc, AP, Rec, and F1 are shown in Table 3.
As can be seen from 
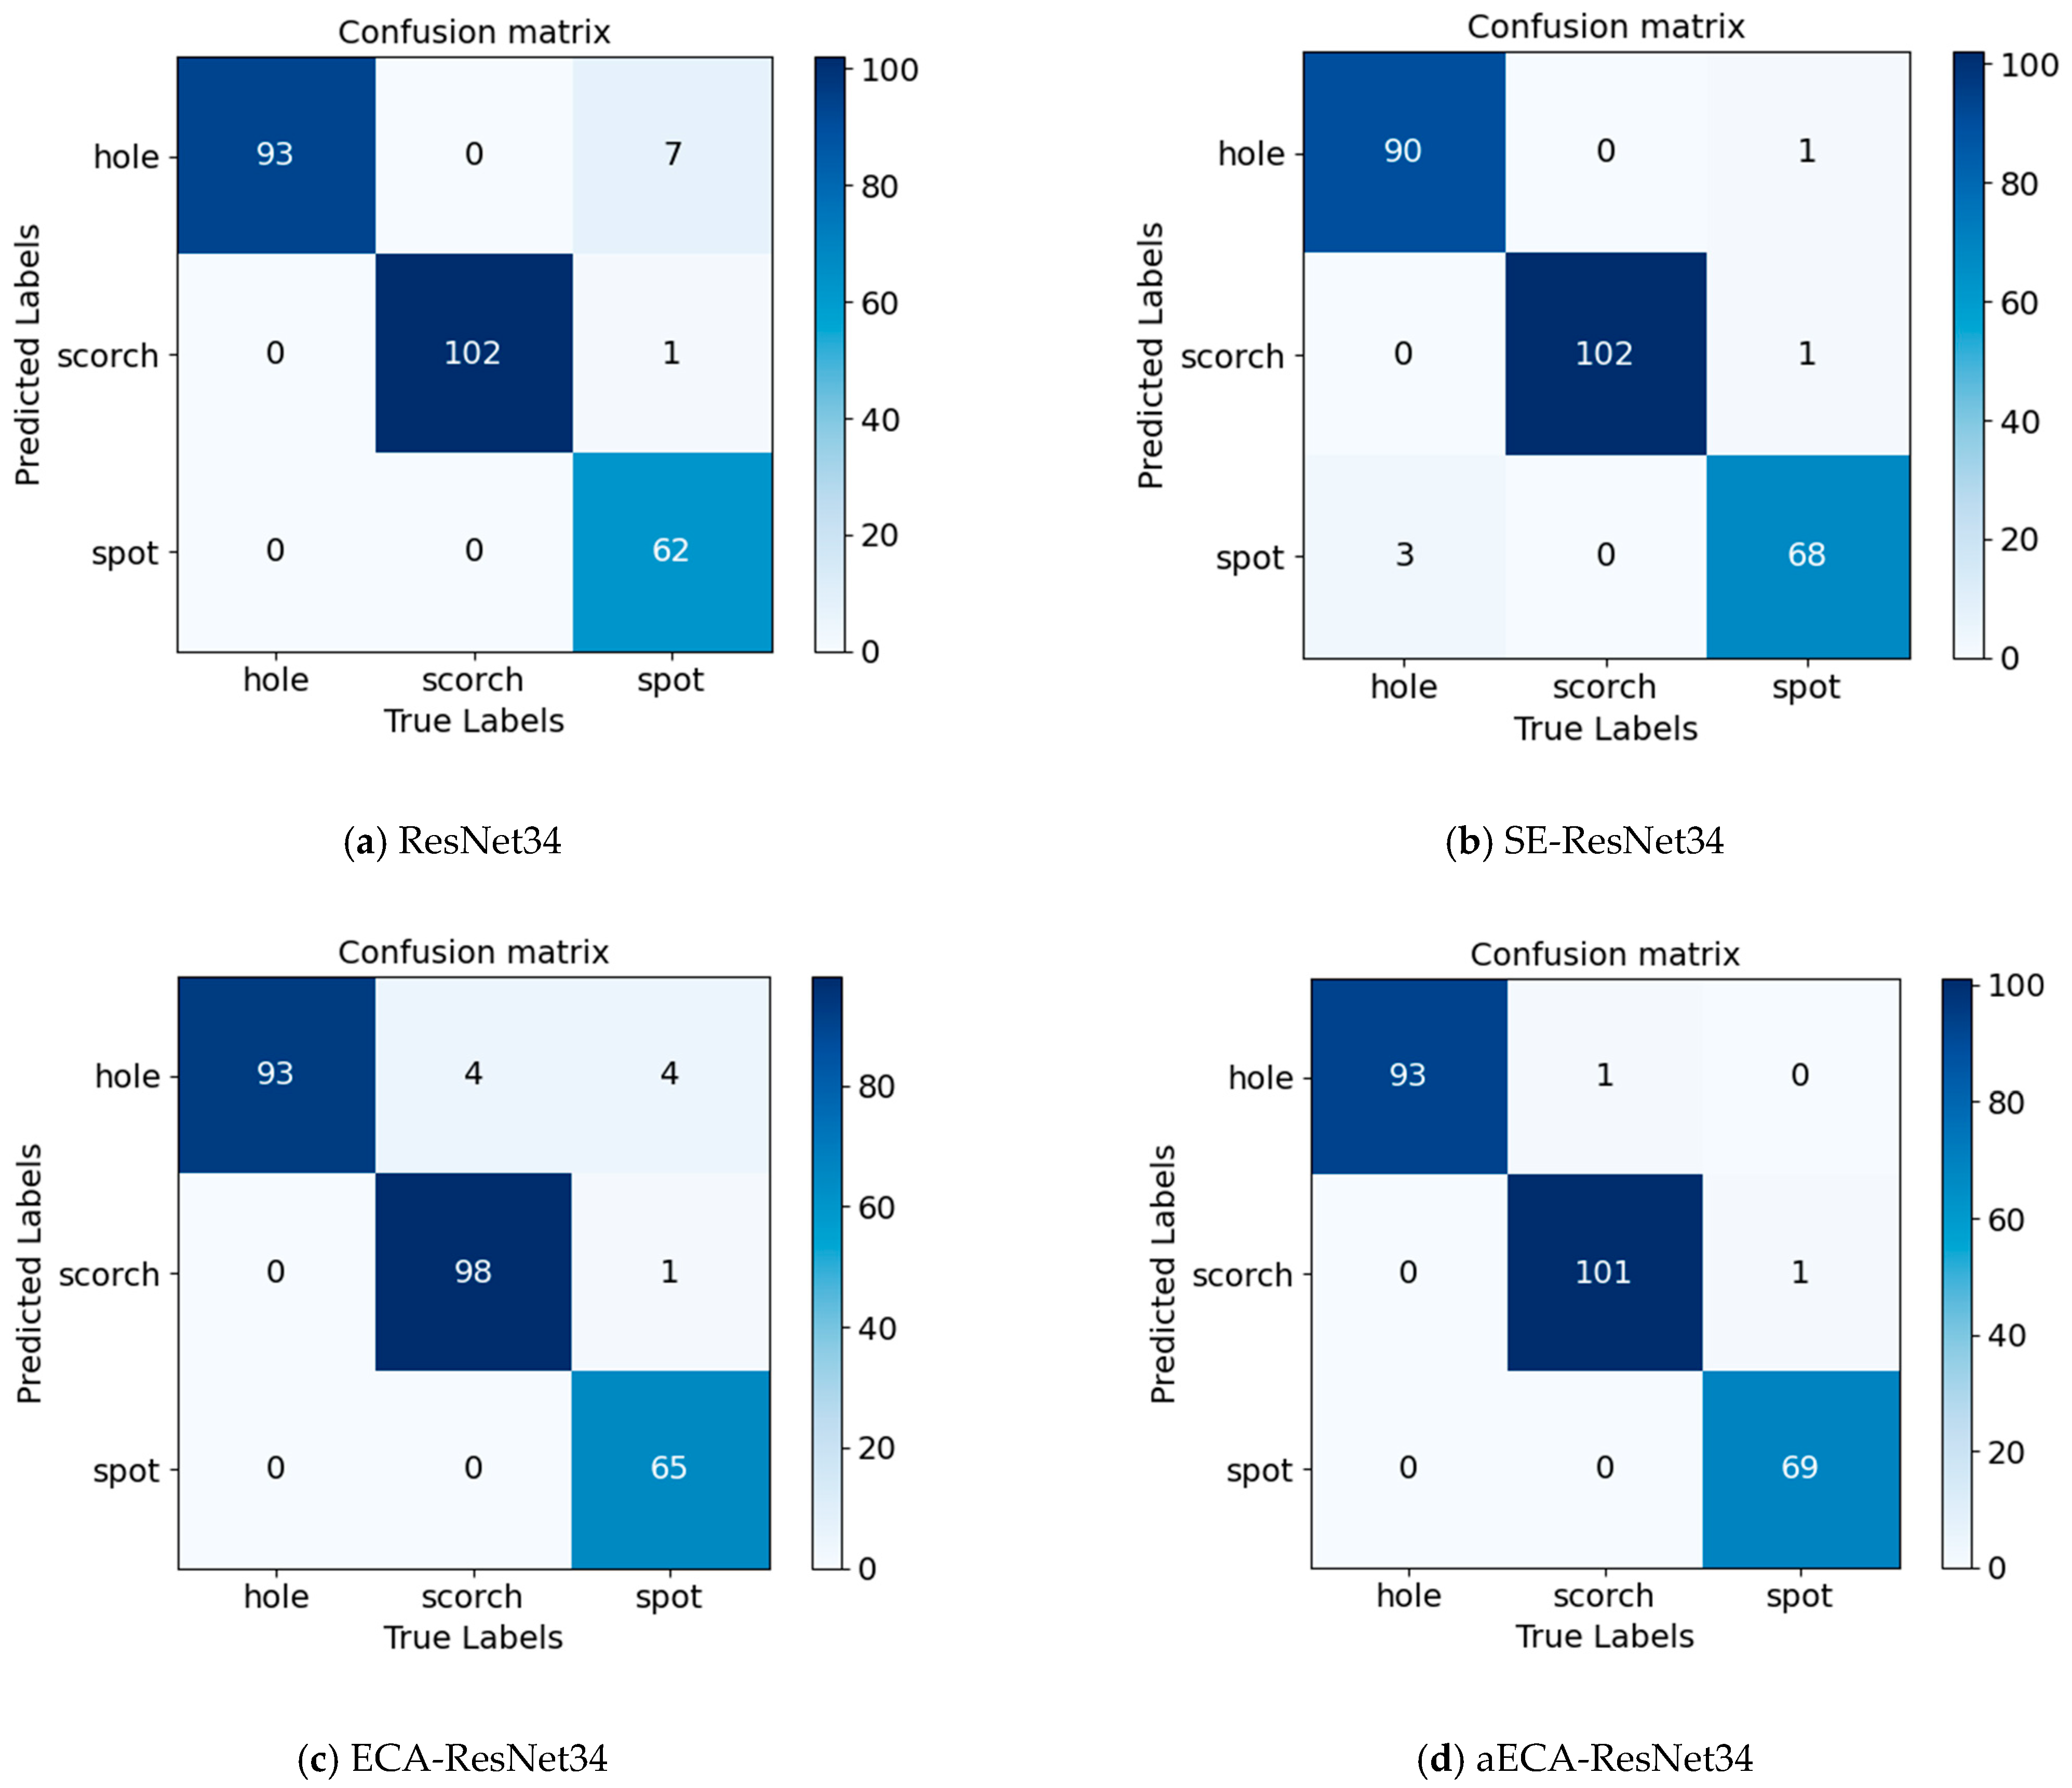
Table 3, the aECA-ResNet34 proposed in this paper has the highest Acc of 97.5%, AP of 97.3%, Rec of 98.2%, and F1 score of 97.7% on the peanut disease dataset. All four evaluation metrics of aECA-ResNet34 are higher than ECA-ResNet34, proving the effectiveness of this paper’s improvement of ECANet’s attention mechanism in enhancing network performance. In addition, in order to see the misclassification probability of each model more clearly, the confusion matrices of the three disease classifications of the peanut disease dataset are given below, as shown in Figure 8.
Figure 8a–d is the classification recognition of ResNet34, SE-ResNet34, ECA-ResNet34, and aECA-ResNet34 for the peanut dataset, respectively. Figure 8a–c all made some errors in predicting the types of peanut diseases, which may be due to the similar picture-taking angles and similar disease locations. The aECA-ResNet34 model in this paper represented by Figure 8d has the best confusion matrix, with small or zero values at all positions except the diagonal line.

4.4.3. Visualization of Different Attention Mechanisms

If the performance of a neural network model is assessed only by evaluation indicators, it does not fully satisfy the needs of the researcher. Researchers want to know the region of interest of the model, and visualization is one of the ways to solve this problem. Selvaraju, Ramprasaath R. et al. [45] proposed a method for visualizing neural networks based on deep learning technology, named Grad-CAM, which is based on the principle of calculating the weights of feature maps in the last convolutional layer to the categories of images, then the weighted sum of each feature map is calculated, and ultimately, the feature maps of different categories are mapped to the corresponding original images of those categories, which is also the process of heatmap formation. The original samples of five plant leaves under different attention mechanisms and their heat maps are shown in Table 4.
Table 4 gives five original samples of plant leaves and their heatmaps under different attention mechanisms. This paper selects hole, leaf spot, and scorch diseases of the peanut leaf disease dataset and randomly selects images of Apple scab and Cedar apple rust diseases of the PlantVillage dataset for detection. From the distribution of the heat map, it can be seen that SE-ResNet34, ECA-ResNet34, and aECA-ResNet34 with attention mechanism have higher local positioning ability than the original model, but the recognition ability of SE-ResNet34 and ECA-ResNet34 for different diseases is unstable. The aECA-ResNet34 model proposed in this paper has stronger and more stable local localization ability for these five diseases, which proves that compared with other attention mechanisms, the improved attention mechanism in this paper has stronger generalization ability and robustness.

4.5. Comparison Test with Other Networks

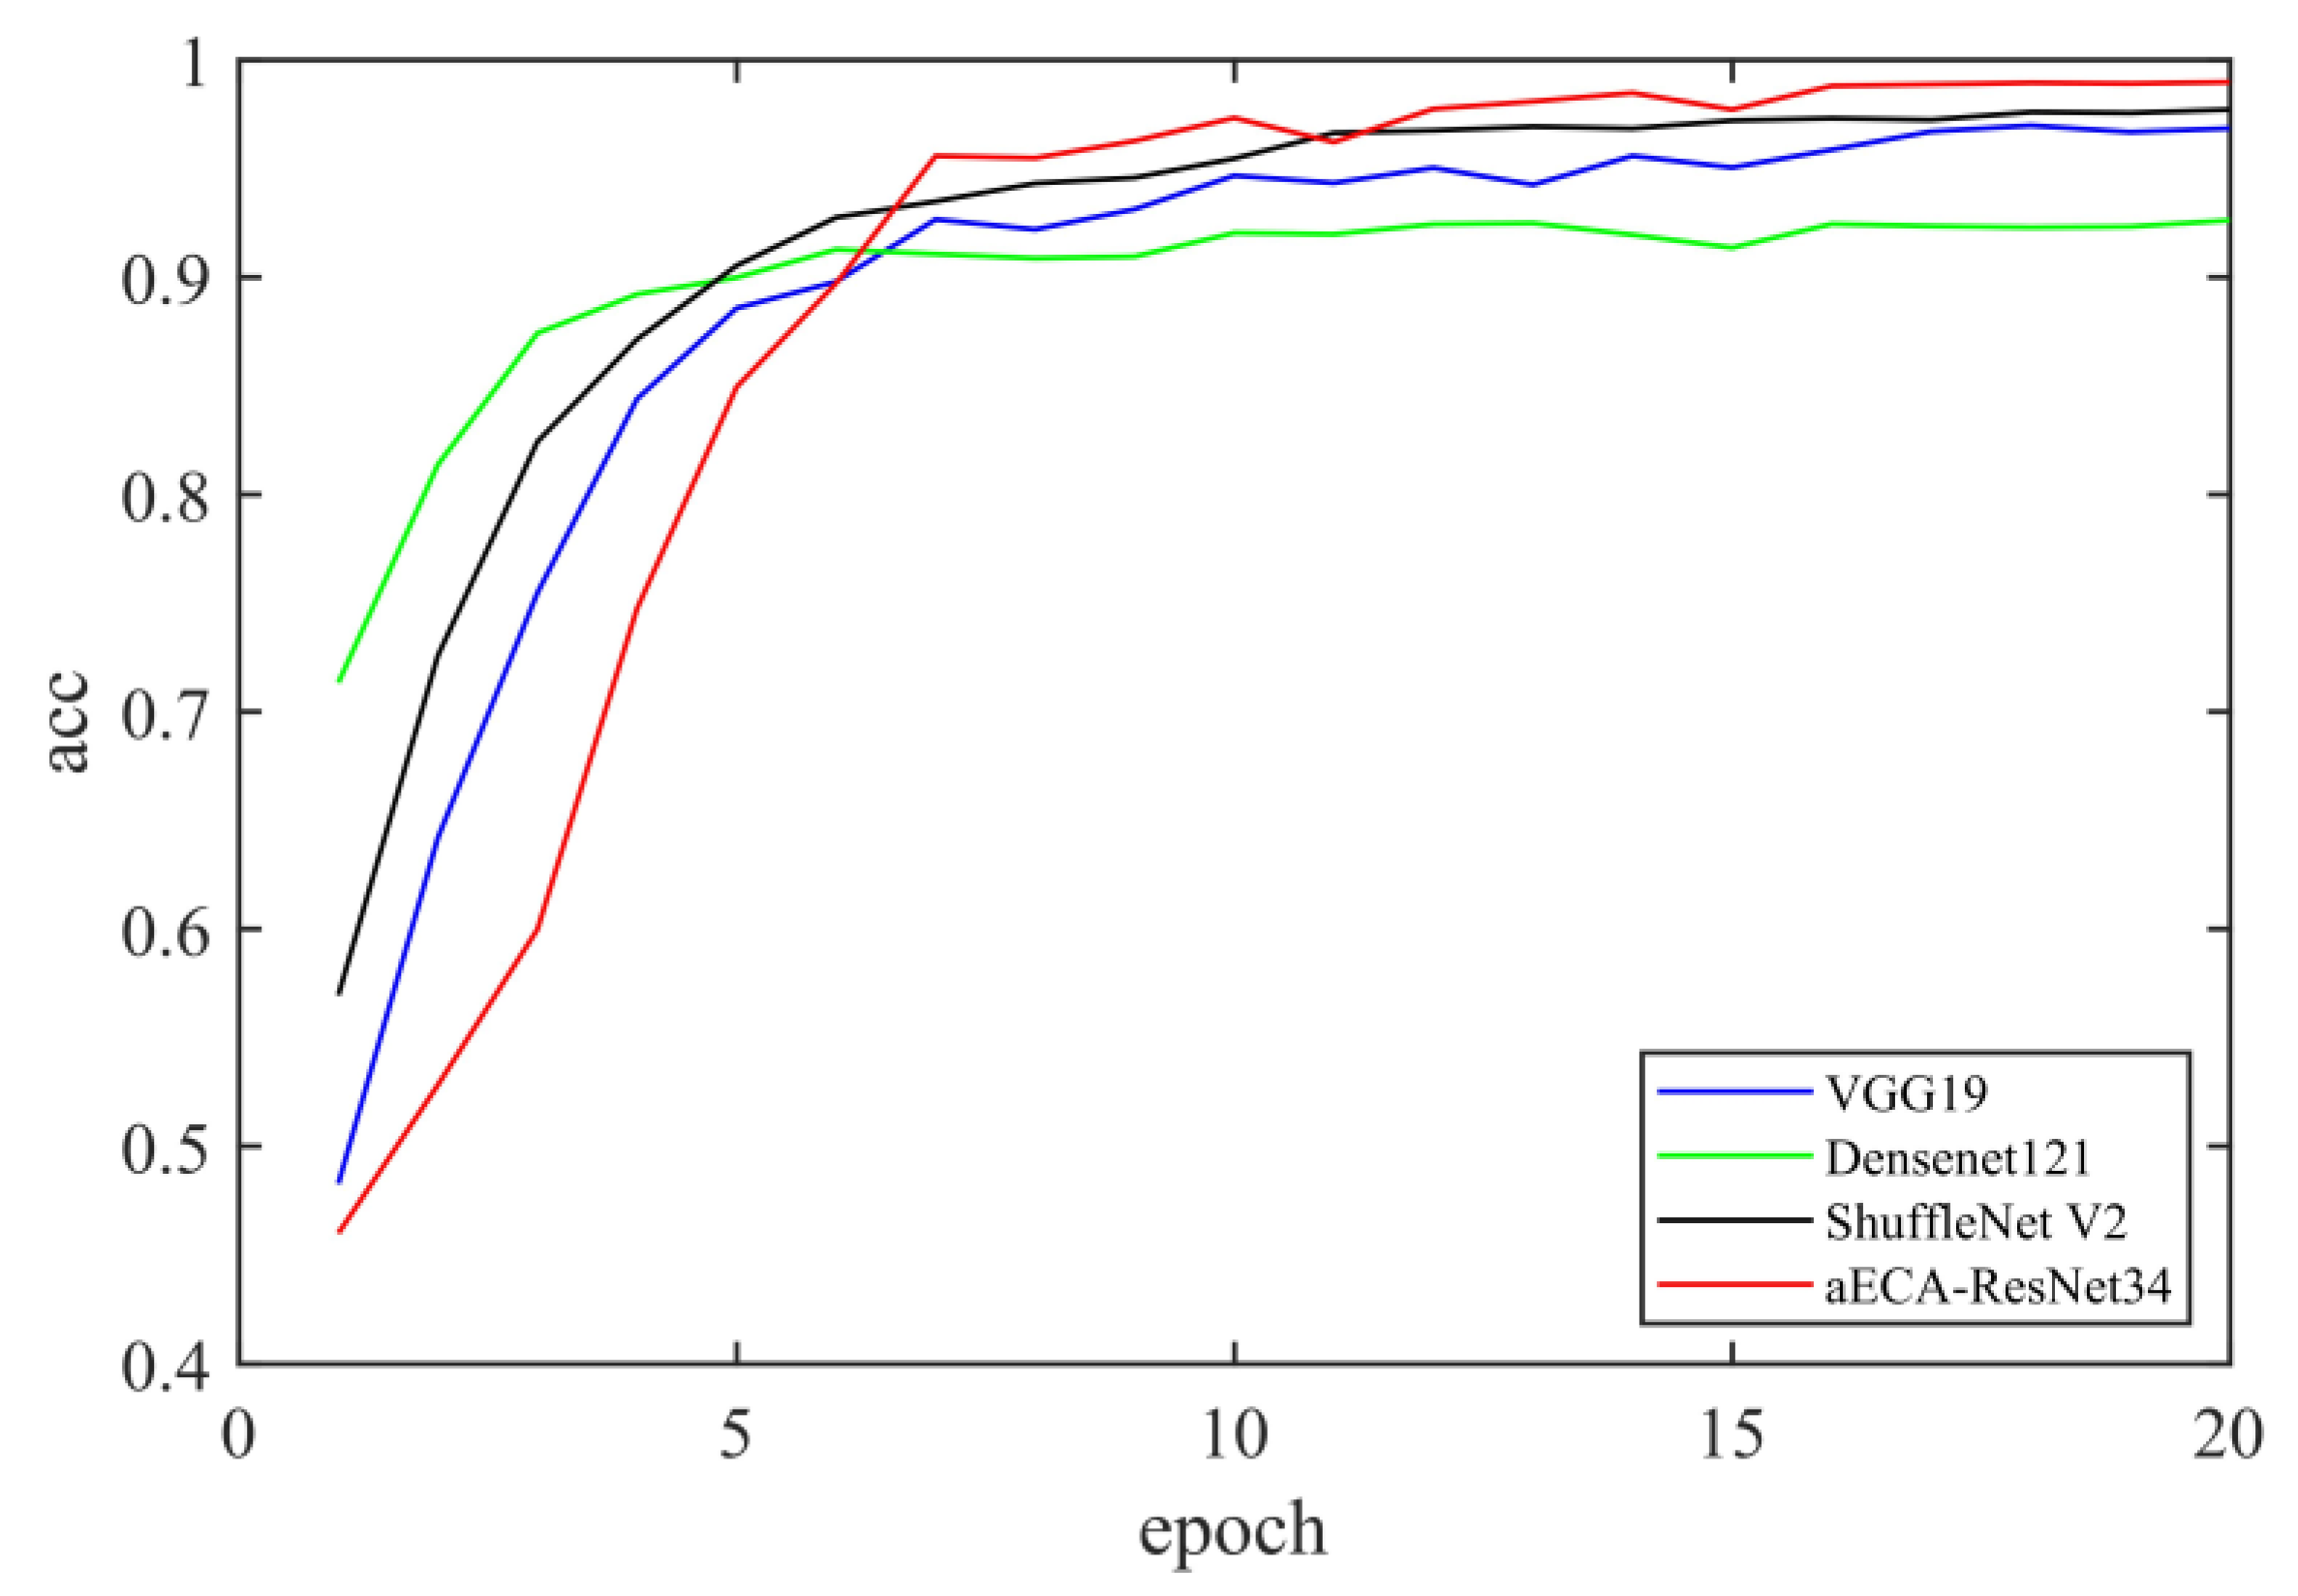
To validate the generalization capability of the aECA-ResNet model, this study conducts a comparative analysis with three prominent network models that have emerged in recent years: VGG19, ShuffleNet V2, and DenseNet121. These models were trained on two datasets, and their performance was evaluated using a range of metrics, including Acc, AP, Rec, F1 score, and a confusion matrix.

4.5.1. PlantVillage Dataset

The Acc curves of the four networks on the PlantVillage dataset are shown in Figure 9, and the other evaluation metrics are shown in Table 5. It can be seen that the Acc curves of VGG19, ShuffleNet V2, and DenseNet121 are stable but not as fast as aECA-ResNet34, which has a higher accuracy rate. The data in Table 5 still show that aECA-ResNet34 is superior, but there is a concern that the accuracy of DenseNet121 is much lower than the other networks, probably resulting in its poor performance due to its large number of convolutional layers and the variety of the PlantVillage dataset.

4.5.2. Peanut Dataset

Four networks were trained on the peanut dataset, and their evaluation metrics are shown in Table 6. It is not difficult to see that VGG19 is not as good at classifying datasets with few species as those with many species, and ShuffleNet V2 is the opposite. The classification performance of aECA-ResNet34 for the two datasets does not differ much; both are very great.
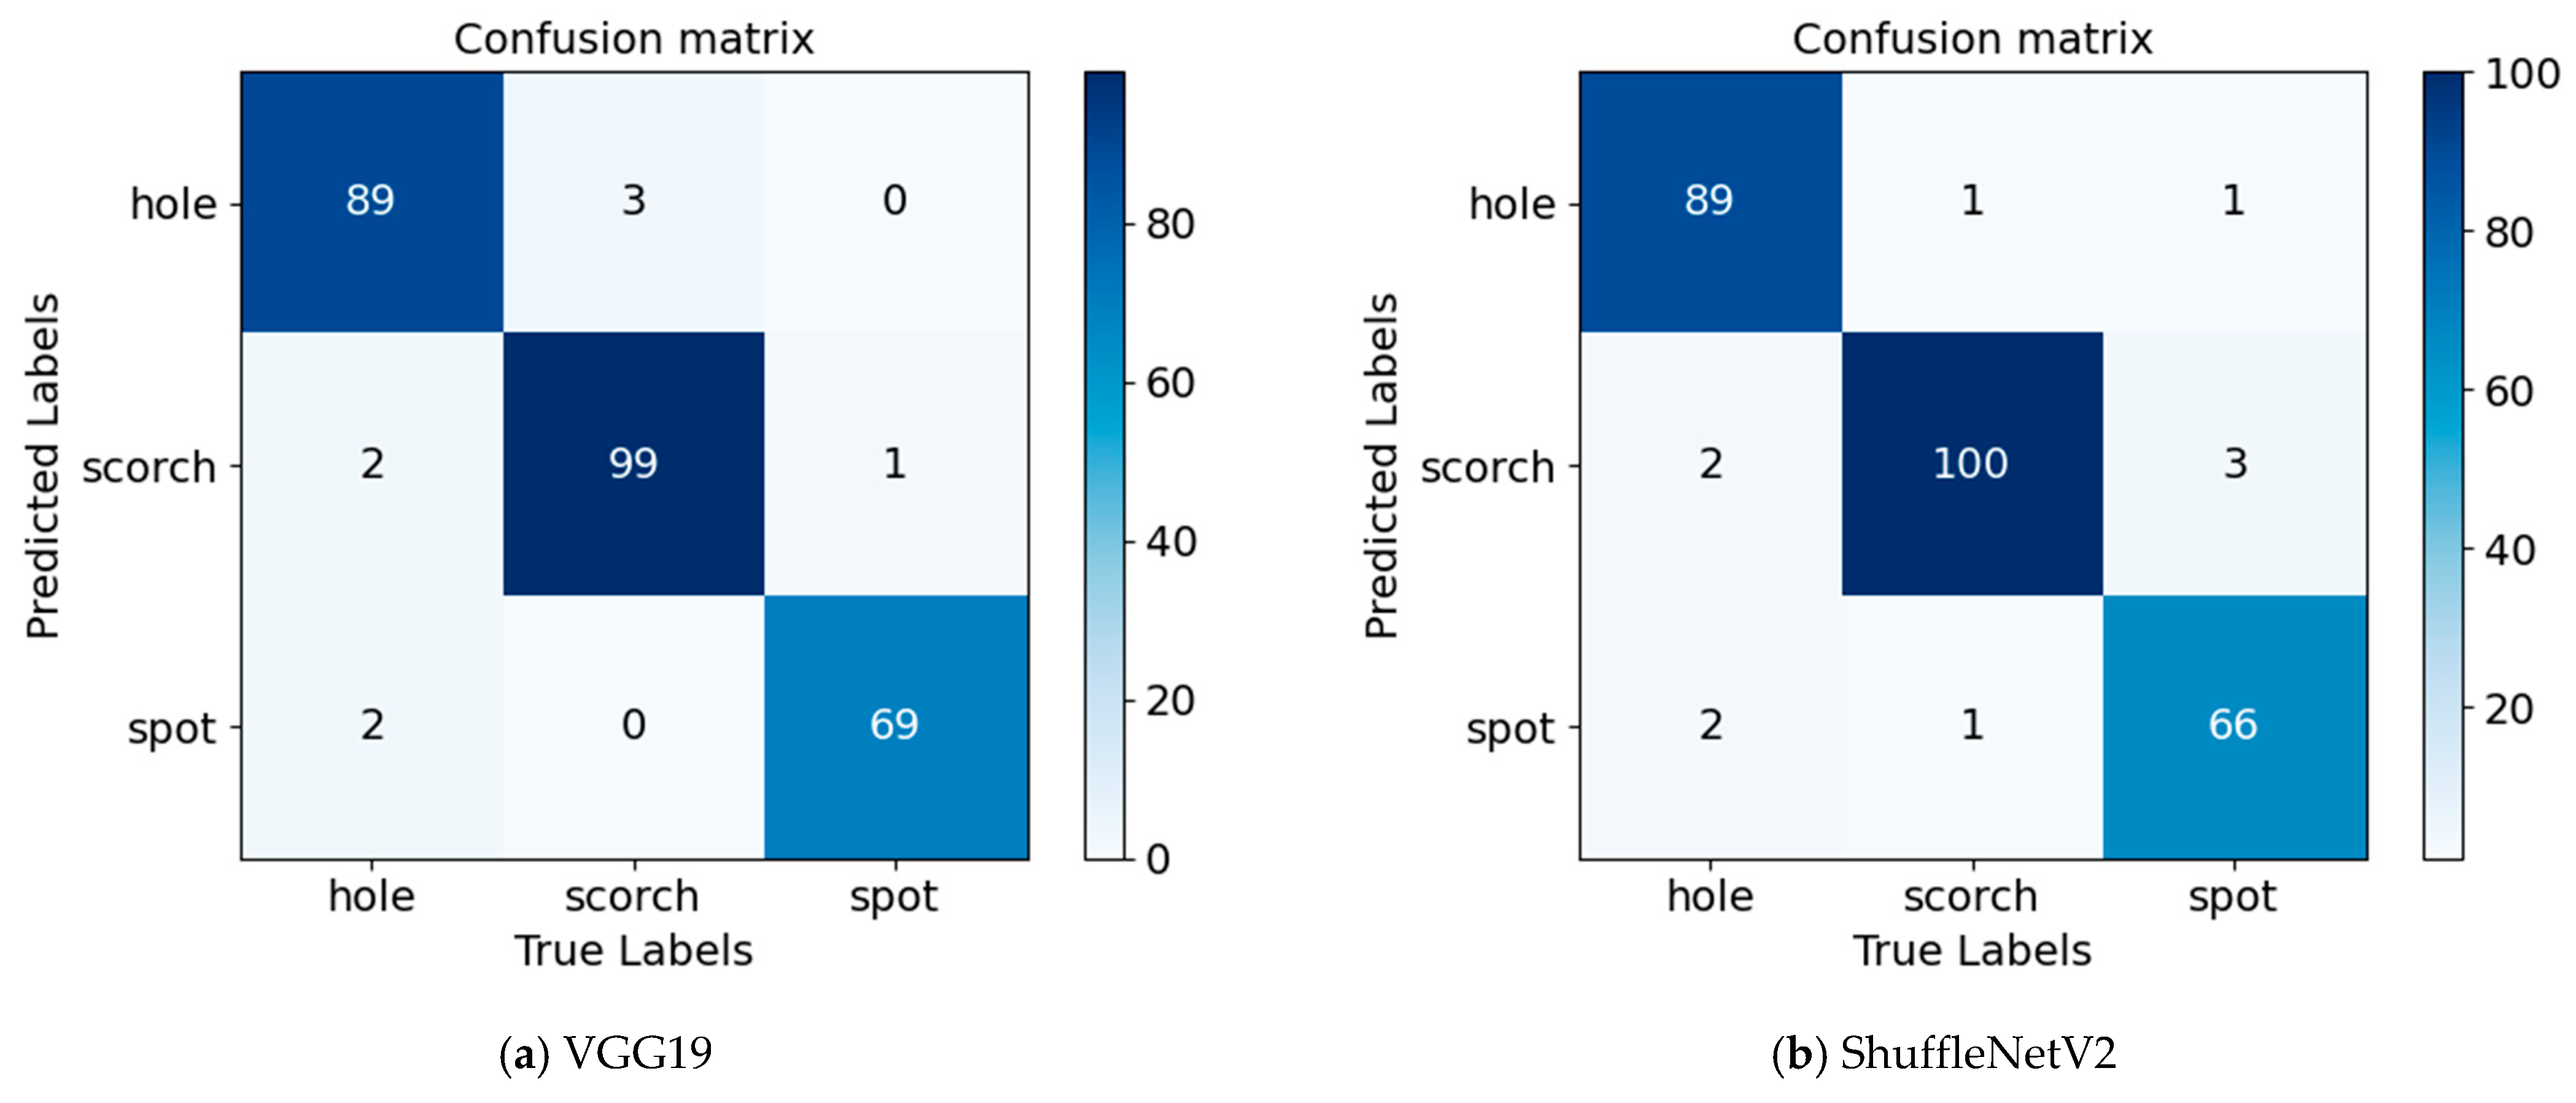
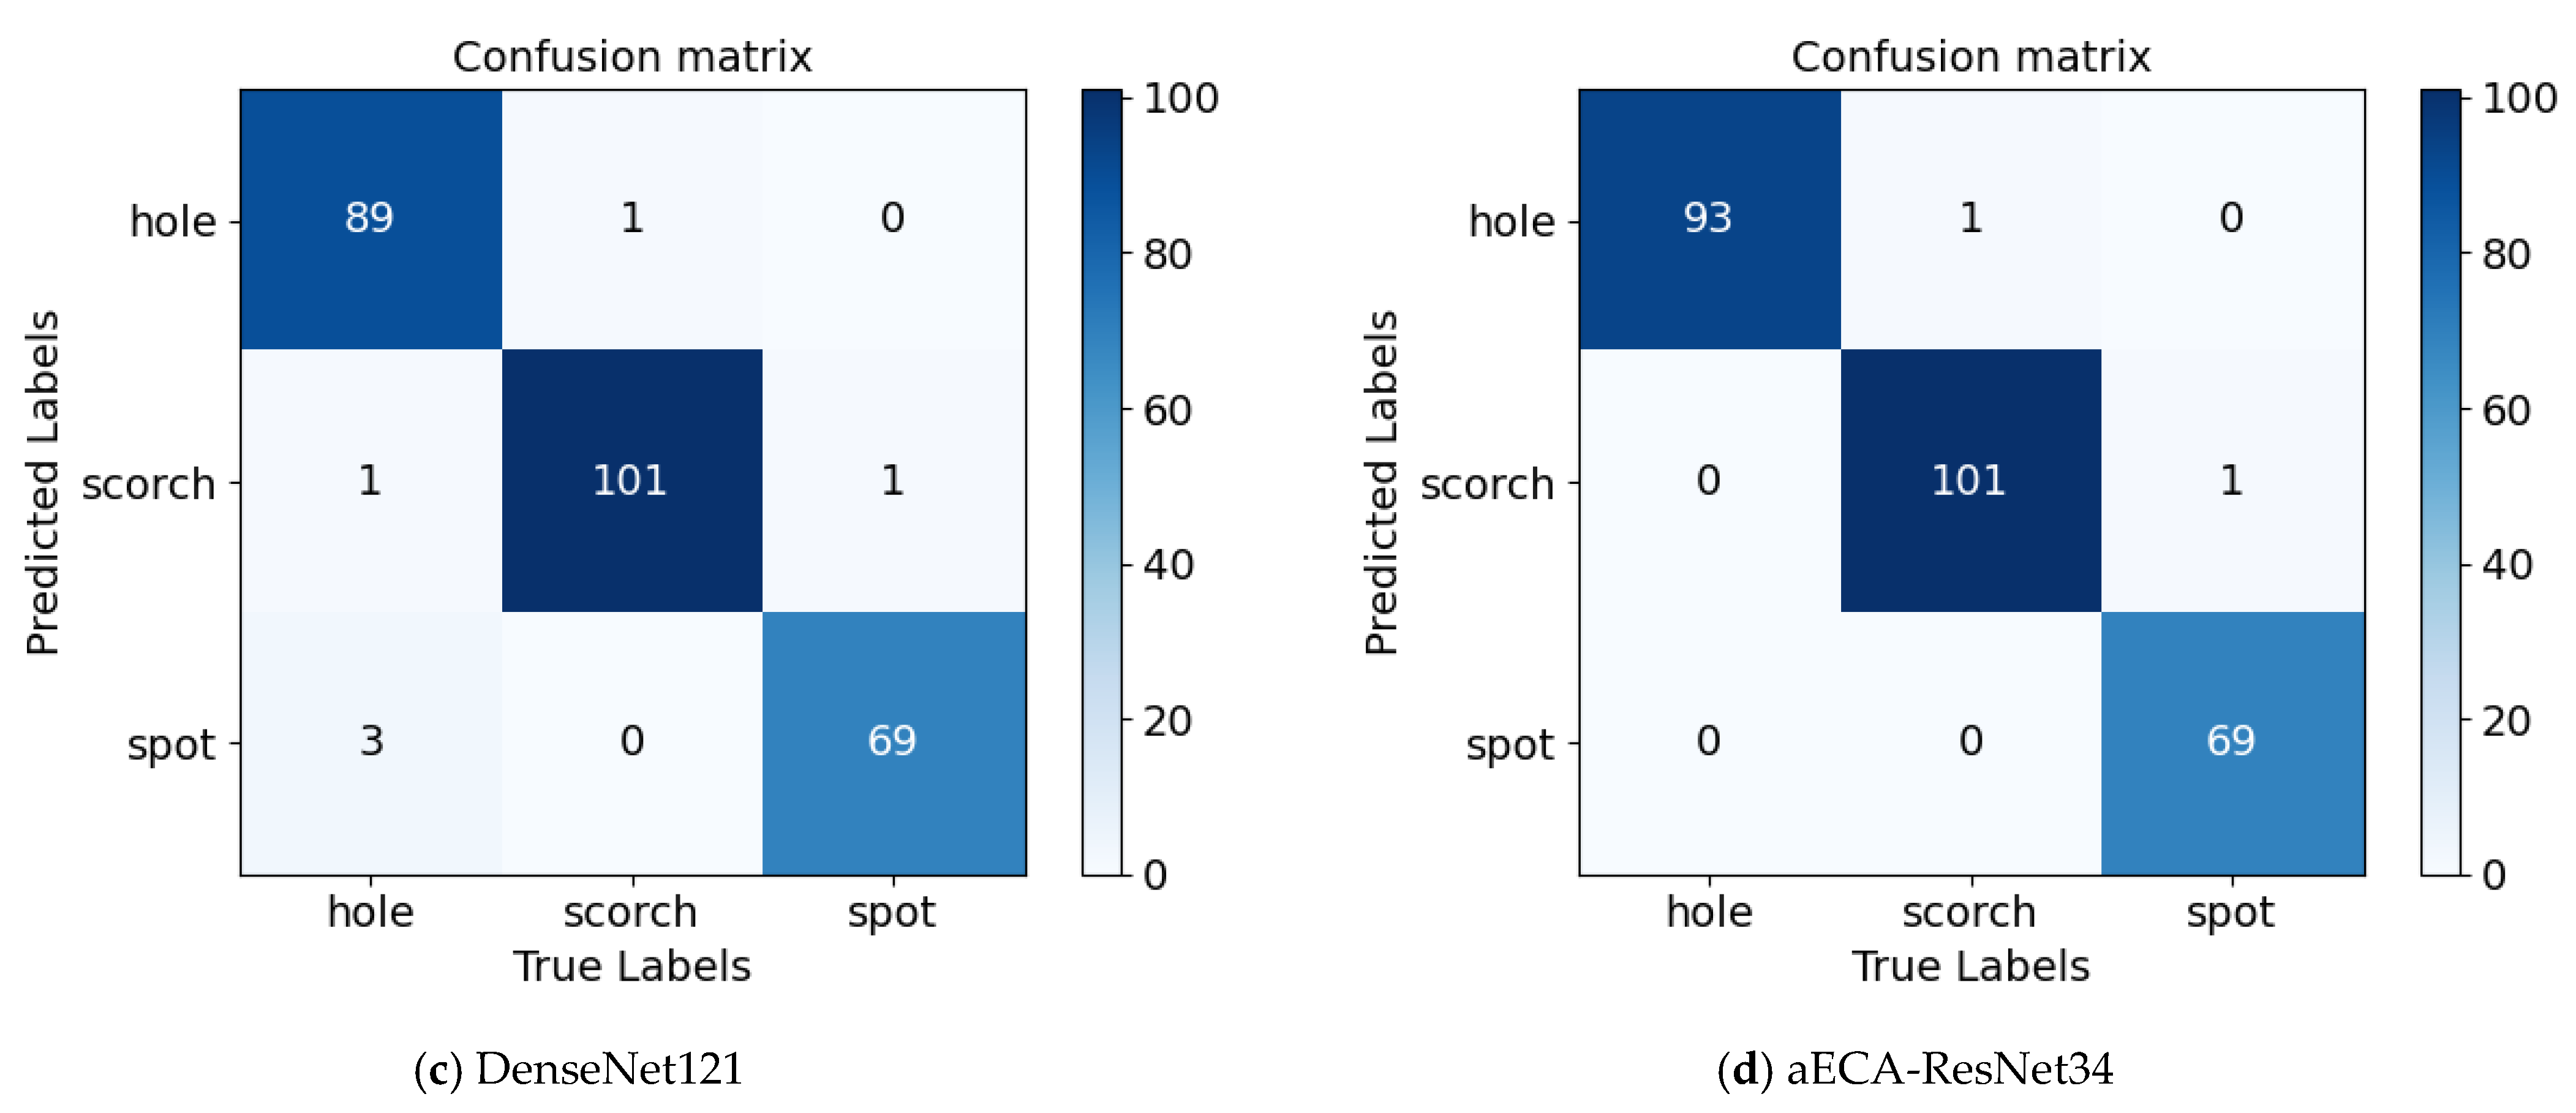
Similarly, the confusion matrixes for the classification of different networks are drawn here, as shown in Figure 10. Figure 10a–d is the classification recognition of VGG19, ShuffleNetV2, DenseNet121, and aECA-ResNet34. The results in Figure 10a,c show that the hole is easily predicted as the scorch by the networks, which may be due to the small sample size of the dataset, the spot in Figure 10b will be predicted easily by ShuffleNet V2 as scorch and hole, and aECA-ResNet34 in Figure 10d still has the best confusion matrix.

4.5.3. Visualization of Different Networks

In order to better observe the recognition effect of different network models on peanut leaf diseases and plant diseases in the PlantVillage dataset, this chapter uses the heat maps of five different disease leaves generated by four networks for comparison. The original images and heat maps generated by different networks are shown in Table 7.
The results in Table 7 show that aECA-ResNet34 performs better than other networks in accurately locating the diseases, while VGG19 is particularly poor in identifying apple blackstar disease and apple rust, and this difference may be caused by the training error of VGG19. These heatmaps prove that the proposed aECA-ResNet34 has superior localization capability for plant pest image classification compared to VGG19, ShuffleNet V2, and DenseNet121.

5. Conclusions

Plant diseases are an important factor affecting plant yield, therefore, research on plant leaf disease detection technology is very important. Traditional deep learning models have issues such as unclear recognition of similar diseases and low recognition accuracy for diseases with small lesions when it comes to identifying plant leaf diseases. To address the limitations of traditional deep learning network models in recognizing plant pests and diseases from images, firstly, this paper proposes an improved channel attention mechanism aECAnet and builds a disease recognition architecture based on plant leaves (aECA-ResNet34). Secondly, the peanut leaf disease dataset and PlantVillage dataset were input into the aECA-ResNet34 network for training and compared with other attention mechanisms. Finally, compared with other networks with the improved attention mechanism aECAnet, the experimental results show that the aECA-ResNet34 network model has the best classification effect on plant leaf diseases. The results show that avg&max parallel concatenation in the improved aECAnet channel attention module is better than single pooling, and the global average pooling and global maximum pooling parallel concatenation can retain more information between channels so as to extract the local information in the images of plant diseases more efficiently and to obtain a better performance in the classification of plant diseases. Moreover, the performance metrics of the model on the two distinct datasets are superior to those of other models that are compared. This indicates that the model possesses a robust generalization ability and could potentially have a positive impact on plant pest control when deployed in practical devices.

Author Contributions

All authors contributed to the study conception and design. F.N. provided the idea and methodology. The first draft of the manuscript was written by W.Y. Material preparation was performed by Y.Y. and D.Z. performed the data collection, L.Z. performed the data analysis, and all authors commented on previous versions of the manuscript. All authors have read and agreed to the published version of the manuscript.

Funding

This research was funded by the Scientific and Technological Project of Henan Province (Grant No. 222102110095 and 232102211044) and the Higher Learning Key Development Project of Henan Province (Grant No. 22A120007).

Data Availability Statement

The data that support the findings of this study are available from the corresponding author upon reasonable request.

Acknowledgments

The authors are grateful to other project participants for their cooperation and endeavor.

Conflicts of Interest

The authors report no disclosures.

References

  1. Khan, N.; Ray, R.L.; Sargani, G.R.; Ihtisham, M.; Khayyam, M.; Ismail, S. Current Progress and Future Prospects of Agriculture Technology: Gateway to Sustainable Agriculture. Sustainability 2021, 13, 4883. [Google Scholar] [CrossRef]
  2. Li, D.L.; Song, Z.Y.; Quan, C.Q.; Xu, X.B.; Liu, C. Recent advances in image fusion technology in agriculture. Comput. Electron. Agric. 2021, 191, 106491. [Google Scholar] [CrossRef]
  3. Santos, L.; Santos, F.N.; Oliveira, P.M.; Shinde, P. Deep Learning Applications in Agriculture: A Short Review. In Proceedings of the 4th Iberian Robotics Conference (Robot)—Advances in Robotics, Porto, Portugal, 20–22 November 2019; Volume 1092, pp. 139–151. [Google Scholar]
  4. Dhaka, V.S.; Meena, S.V.; Rani, G.; Sinwar, D.; Kavita; Ijaz, M.F.; Wozniak, M. A Survey of Deep Convolutional Neural Networks Applied for Prediction of Plant Leaf Diseases. Sensors 2021, 21, 4749. [Google Scholar] [CrossRef] [PubMed]
  5. Gui, P.H.; Dang, W.J.; Zhu, F.Y.; Zhao, Q.J. Towards automatic field plant disease recognition. Comput. Electron. Agric. 2021, 191, 106523. [Google Scholar] [CrossRef]
  6. Fountsop, A.N.; Ebongue Kedieng Fendji, J.L.; Atemkeng, M. Deep Learning Models Compression for Agricultural Plants. Appl. Sci. 2020, 10, 6866. [Google Scholar] [CrossRef]
  7. Thaiyalnayaki, K.; Joseph, C. Classification of plant disease using SVM and deep learning. Mater. Today Proc. 2021, 47, 468–470. [Google Scholar] [CrossRef]
  8. Elfatimi, E.; Eryigit, R.; Elfatimi, L. Beans Leaf Diseases Classification Using MobileNet Models. IEEE Access 2022, 10, 9471–9482. [Google Scholar] [CrossRef]
  9. Hossain, S.M.M.; Deb, K.; Dhar, P.K.; Koshiba, T. Plant Leaf Disease Recognition Using Depth-Wise Separable Convolution-Based Models. Symmetry 2021, 13, 511. [Google Scholar] [CrossRef]
  10. Atila, Ü.; Uçar, M.; Akyol, K.; Uçar, E. Plant leaf disease classification using EfficientNet deep learning model. Ecol. Inform. 2021, 61, 101182. [Google Scholar] [CrossRef]
  11. Mukti, I.Z.; Biswas, D. Transfer Learning Based Plant Diseases Detection Using ResNet50. In Proceedings of the 4th International Conference on Electrical Information and Communication Technology (EICT), Khulna, Bangladesh, 20–22 December 2019. [Google Scholar]
  12. Ji, M.M.; Zhang, K.K.; Wu, Q.F.; Deng, Z. Multi-label learning for crop leaf diseases recognition and severity estimation based on convolutional neural networks. Soft Comput. 2020, 24, 15327–15340. [Google Scholar] [CrossRef]
  13. Sunil, C.K.; Jaidhar, C.D.; Patil, N. Cardamom Plant Disease Detection Approach Using EfficientNetV2. IEEE Access 2022, 10, 789–804. [Google Scholar] [CrossRef]
  14. Hernandez, S.; Lopez, J.L. Uncertainty quantification for plant disease detection using Bayesian deep learning. Appl. Soft Comput. 2020, 96, 106597. [Google Scholar] [CrossRef]
  15. Albahli, S.; Nawaz, M. DCNet: DenseNet-77-based CornerNet model for the tomato plant leaf disease detection and classification. Front. Plant Sci. 2022, 13, 957961. [Google Scholar] [CrossRef]
  16. Ma, Z.H.; Yuan, M.K.; Gu, J.M.; Meng, W.L.; Xu, S.B.; Zhang, X.P. Triple-strip attention mechanism-based natural disaster images classification and segmentation. Vis. Comput. 2022, 38, 3163–3173. [Google Scholar] [CrossRef]
  17. Wang, P.; Niu, T.; Mao, Y.R.; Zhang, Z.; Liu, B.; He, D.J. Identification of Apple Leaf Diseases by Improved Deep Convolutional Neural Networks With an Attention Mechanism. Front. Plant Sci. 2021, 12, 723294. [Google Scholar] [CrossRef]
  18. Yu, H.L.; Cheng, X.H.; Li, Z.Q.; Cai, Q.; Bi, C.G. Disease Recognition of Apple Leaf Using Lightweight Multi-Scale Network with ECANet. CMES Comput. Model. Eng. Sci. 2022, 132, 711–738. [Google Scholar] [CrossRef]
  19. Zhou, W.Y.; Wang, H.; Wan, Z.B. Ore Image Classification Based on Improved CNN. Comput. Electr. Eng. 2022, 99, 107819. [Google Scholar] [CrossRef]
  20. Lu, M.; Zhang, L.T.; Liu, Y.M. Background-lead self-attention for image harmonization. J. Electron. Imaging 2022, 31, 063038. [Google Scholar] [CrossRef]
  21. Deng, H.X.; Luo, D.S.; Chang, Z.W.; Li, H.F.; Yang, X.F. RAHC_GAN: A Data Augmentation Method for Tomato Leaf Disease Recognition. Symmetry 2021, 13, 1597. [Google Scholar] [CrossRef]
  22. Cap, Q.H.; Tani, H.; Kagiwada, S.; Uga, H.; Iyatomi, H. LASSR: Effective super-resolution method for plant disease diagnosis. Comput. Electron. Agric. 2021, 187, 106271. [Google Scholar] [CrossRef]
  23. Zhang, M.; Su, H.H.; Wen, J.H. Classification of flower image based on attention mechanism and multi-loss attention network. Comput. Commun. 2021, 179, 307–317. [Google Scholar] [CrossRef]
  24. Li, J.; Jin, K.; Zhou, D.L.; Kubota, N.; Ju, Z.J. Attention mechanism-based CNN for facial expression recognition. Neurocomputing 2020, 411, 340–350. [Google Scholar] [CrossRef]
  25. Alirezazadeh, P.; Schirrmann, M.; Stolzenburg, F. Improving Deep Learning-based Plant Disease Classification with Attention Mechanism. Gesunde Pflanz. 2023, 75, 49–59. [Google Scholar] [CrossRef]
  26. Guo, T.M.; Dong, J.W.; Li, H.J.; Gao, Y.X. Simple Convolutional Neural Network on Image Classification. In Proceedings of the 2nd IEEE International Conference on Big Data Analysis (ICBDA), Beijing, China, 10–12 March 2017; pp. 721–724. [Google Scholar]
  27. He, K.M.; Zhang, X.Y.; Ren, S.Q.; Sun, J. Deep Residual Learning for Image Recognition. In Proceedings of the 2016 IEEE Conference on Computer Vision and Pattern Recognition (CVPR), Las Vegas, NV, USA, 27–30 June 2016; pp. 770–778. [Google Scholar]
  28. Al-Falluji, R.A.; Katheeth, Z.D.; Alathari, B. Automatic Detection of COVID-19 Using Chest X-Ray Images and Modified ResNet18-Based Convolution Neural Networks. CMC-Comput. Mater. Contin. 2021, 66, 1301–1313. [Google Scholar] [CrossRef]
  29. Elpeltagy, M.; Sallam, H. Automatic prediction of COVID-19 from chest images using modified ResNet50. Multimed. Tools Appl. 2021, 80, 26451–26463. [Google Scholar] [CrossRef]
  30. Xu, Z.G.; Sun, K.; Mao, J.Y. Research on ResNet101 Network Chemical Reagent Label Image Classification Based on Transfer Learning. In Proceedings of the 2nd IEEE International Conference on Civil Aviation Safety and Information Technology (ICCASIT), Weihai, China, 14–16 October 2020; pp. 354–358. [Google Scholar]
  31. Galassi, A.; Lippi, M.; Torroni, P. Attention in Natural Language Processing. IEEE Trans. Neural Netw. Learn. Syst. 2021, 32, 4291–4308. [Google Scholar] [CrossRef] [PubMed]
  32. Li, X.; Shen, X.; Zhou, Y.X.; Wang, X.H.; Li, T.Q. Classification of breast cancer histopathological images using interleaved DenseNet with SENet (IDSNet). PLoS ONE 2020, 15, e0232127. [Google Scholar] [CrossRef]
  33. Gao, R.H.; Wang, R.; Feng, L.; Li, Q.F.; Wu, H.R. Dual-branch, efficient, channel attention-based crop disease identification. Comput. Electron. Agric. 2021, 190, 106410. [Google Scholar] [CrossRef]
  34. Yu, Y.; Zhang, K.L.; Yang, L.; Zhang, D.X. Fruit detection for strawberry harvesting robot in non-structural environment based on Mask-RCNN. Comput. Electron. Agric. 2019, 163, 104846. [Google Scholar] [CrossRef]
  35. Mei, X.G.; Pan, E.T.; Ma, Y.; Dai, X.B.; Huang, J.; Fan, F.; Du, Q.L.; Zheng, H.; Ma, J.Y. Spectral-Spatial Attention Networks for Hyperspectral Image Classification. Remote Sens. 2019, 11, 963. [Google Scholar] [CrossRef]
  36. Qin, Z.Q.; Zhang, P.Y.; Wu, F.; Li, X. FcaNet: Frequency Channel Attention Networks. In Proceedings of the 18th IEEE/CVF International Conference on Computer Vision (ICCV), Montreal, QC, Canada, 11–17 October 2021; pp. 763–772. [Google Scholar]
  37. Li, X.; Wang, W.; Hu, X.; Yang, J. Selective kernel networks. In Proceedings of the IEEE/CVF Conference on Computer Vision and Pattern Recognition, Long Beach, CA, USA, 15–20 June 2019; pp. 510–519. [Google Scholar]
  38. Hughes, D.; Salathé, M. An open access repository of images on plant health to enable the development of mobile disease diagnostics. arXiv 2015, arXiv:1511.08060. [Google Scholar]
  39. Alzubaidi, L.; Zhang, J.L.; Humaidi, A.J.; Al-Dujaili, A.; Duan, Y.; Al-Shamma, O.; Santamaria, J.; Fadhel, M.A.; Al-Amidie, M.; Farhan, L. Review of deep learning: Concepts, CNN architectures, challenges, applications, future directions. J. Big Data 2021, 8, 53. [Google Scholar] [CrossRef] [PubMed]
  40. Zhang, J.; Dai, L.M.; Cheng, F. Corn seed variety classification based on hyperspectral reflectance imaging and deep convolutional neural network. J. Food Meas. Charact. 2021, 15, 484–494. [Google Scholar] [CrossRef]
  41. Huang, G.; Liu, Z.; van der Maaten, L.; Weinberger, K.Q. Densely Connected Convolutional Networks. In Proceedings of the 30th IEEE/CVF Conference on Computer Vision and Pattern Recognition (CVPR), Honolulu, HI, USA, 21–26 July 2016; pp. 2261–2269. [Google Scholar]
  42. Junaidi, A.; Lasama, J.; Adhinata, F.D.; Iskandar, A.R. Image Classification for Egg Incubator using Transfer Learning of VGG16 and VGG19. In Proceedings of the 10th IEEE International Conference on Communication, Networks and Satellite (IEEE COMNETSAT), Purwokerto, Indonesia, 28–30 November 2021; pp. 324–328. [Google Scholar]
  43. Ma, N.N.; Zhang, X.Y.; Zheng, H.T.; Sun, J. ShuffleNet V2: Practical Guidelines for Efficient CNN Architecture Design. In Proceedings of the 15th European Conference on Computer Vision (ECCV), Munich, Germany, 8–14 September 2018; Volume 11218, pp. 122–138. [Google Scholar]
  44. Liu, X.B.; Wang, R.L.; Cai, Z.H.; Cai, Y.M.; Yin, X. Deep Multigrained Cascade Forest for Hyperspectral Image Classification. IEEE Trans. Geosci. Remote Sens. 2019, 57, 8169–8183. [Google Scholar] [CrossRef]
  45. Selvaraju, R.R.; Cogswell, M.; Das, A.; Vedantam, R.; Parikh, D.; Batra, D. Grad-CAM: Visual Explanations from Deep Networks via Gradient-Based Localization. Int. J. Comput. Vis. 2020, 128, 336–359. [Google Scholar] [CrossRef]
Figure 1. Similar leaves.
Symmetry 16 00451 g001
Figure 2. General framework of aECA-ResNet34.
Symmetry 16 00451 g002
Figure 3. Network structure diagram of ResNet34.
Symmetry 16 00451 g003
Figure 4. Structure of aECAnet.
Symmetry 16 00451 g004
Figure 5. Location of aECAnet in combination with ResNet34.
Symmetry 16 00451 g005
Figure 6. Examples of peanut leaf disease images.
Symmetry 16 00451 g006
Figure 7. Accuracy of ResNet34 with different attention mechanisms (PlantVillage).
Symmetry 16 00451 g007
Figure 8. Comparison of confusion matrix for different attention mechanisms (peanut).
Symmetry 16 00451 g008
Figure 9. Accuracy of different networks (PlantVillage).
Symmetry 16 00451 g009
Figure 10. Comparison of confusion matrix for different networks (peanut).
Symmetry 16 00451 g010aSymmetry 16 00451 g010b
Table 1. PlantVillage dataset.
CategoryNumberCategoryNumber
Apple_scab1000Corn_healthy1162
Apple_black_rot1000Corn_leaf_Blight1000
Apple_cedar_rust1000Grape_black_rot1180
Apple_healthy1645Grape_esca1383
Background1143Grape_healthy1000
Blueberry_healthy1502Grape_leaf_blight1076
Cherry_healthy1000Orange_citrus_greening5507
Cherry_Powdery_mildew1052Peach_bacterial_spot2297
Corn_gray_spot1000Peach_healthy1000
Corn_rust1192Pepper_bacterial_spot1000
Pepper_healthy1477Tomato_early_blight1000
Potato_early_blight1000Tomato_healthy1591
Potato_healthy1000Tomato_late_blight1909
Potato_late_blight1000Tomato_leaf_mold1000
Raspberry_healthy1000Tomato_spot1771
Soybean_healthy5090Tomato_spider_mites1676
Squash_powdery_mildew1835Tomato_target_spot1404
Strawberry_healthy1000Tomato_mosaic_virus1000
Strawberry_scorch1109Tomato_leaf_curl5357
Tomato_bacterial_spot2127
Table 2. Comparison of performance of different attention mechanisms (PlantVillage).
ModelAP/%Rec/%F1/%
ResNet3494.4%93.4%93.9%
SE-ResNet3492.4%92.1%92.2%
ECA-ResNet3496.4%96.7%96.5%
aECA-ResNet3498.5%98.6%98.5%
Table 3. Comparison of performance of different attention mechanisms (peanut).
ModelAcc/%AP/%Rec/%F1/%
ResNet3495.5%95.2%94.7%94.9%
SE-ResNet3495.1%95.8%95.5%95.6%
ECA-ResNet3493.5%92.5%92.3%92.3%
aECA-ResNet3497.5%97.3%98.2%97.7%
Table 4. Heatmaps of ResNet34 with different attention mechanisms.
ClassOriginal ImageResNet34SE-ResNet34ECA-ResNet34aECA-ResNet34
HoleSymmetry 16 00451 i001Symmetry 16 00451 i002Symmetry 16 00451 i003Symmetry 16 00451 i004Symmetry 16 00451 i005
SpotSymmetry 16 00451 i006Symmetry 16 00451 i007Symmetry 16 00451 i008Symmetry 16 00451 i009Symmetry 16 00451 i010
ScorchSymmetry 16 00451 i011Symmetry 16 00451 i012Symmetry 16 00451 i013Symmetry 16 00451 i014Symmetry 16 00451 i015
Cedar rustSymmetry 16 00451 i016Symmetry 16 00451 i017Symmetry 16 00451 i018Symmetry 16 00451 i019Symmetry 16 00451 i020
Apple scabSymmetry 16 00451 i021Symmetry 16 00451 i022Symmetry 16 00451 i023Symmetry 16 00451 i024Symmetry 16 00451 i025
Table 5. Comparison of performance of different models (PlantVillage).
ModelAP/%Rec/%F1/%
VGG1995.8%96.0%95.9%
ShuffleNet V297.2%97.5%97.3%
DenseNet12192.3%93.0%92.6%
aECA-ResNet3498.5%98.6%98.5%
Table 6. Comparison of performance of different models (peanut).
ModelAcc/%AP/%Rec/%F1/%
VGG1992.4%91.9%91.4%91.6%
ShuffleNet V295.7%95.2%94.9%95.0%
DenseNet12194.3%93.5%92.8%93.1%
aECA-ResNet3497.5%97.3%98.2%97.7%
Table 7. Heatmaps of different networks.
ClassOriginal ImageVGG19ShuffleNet V2DenseNet121aECA-ResNet34
HoleSymmetry 16 00451 i026Symmetry 16 00451 i027Symmetry 16 00451 i028Symmetry 16 00451 i029Symmetry 16 00451 i030
SpotSymmetry 16 00451 i031Symmetry 16 00451 i032Symmetry 16 00451 i033Symmetry 16 00451 i034Symmetry 16 00451 i035
ScorchSymmetry 16 00451 i036Symmetry 16 00451 i037Symmetry 16 00451 i038Symmetry 16 00451 i039Symmetry 16 00451 i040
Cedar rustSymmetry 16 00451 i041Symmetry 16 00451 i042Symmetry 16 00451 i043Symmetry 16 00451 i044Symmetry 16 00451 i045
Apple scabSymmetry 16 00451 i046Symmetry 16 00451 i047Symmetry 16 00451 i048Symmetry 16 00451 i049Symmetry 16 00451 i050
Disclaimer/Publisher’s Note: The statements, opinions and data contained in all publications are solely those of the individual author(s) and contributor(s) and not of MDPI and/or the editor(s). MDPI and/or the editor(s) disclaim responsibility for any injury to people or property resulting from any ideas, methods, instructions or products referred to in the content.

