Article

Improved Weed Detection in Cotton Fields Using Enhanced YOLOv8s with Modified Feature Extraction Modules

by
Doudou Ren
1,
Wenzhong Yang
1,2,*,
Zhifeng Lu
3,*,
Danny Chen
1 and
Houwang Shi
1
1
School of Information Science and Engineering, Xinjiang University, Urumqi 830017, China
2
Xinjiang Key Laboratory of Multilingual Information Technology, Xinjiang University, Urumqi 830017, China
3
School of Information Science and Technology, Xinjiang Teacher’s College, Urumqi 830043, China
*
Authors to whom correspondence should be addressed.
Symmetry 2024, 16(4), 450; https://doi.org/10.3390/sym16040450
Submission received: 19 March 2024 / Revised: 2 April 2024 / Accepted: 3 April 2024 / Published: 7 April 2024

Abstract

:
Weed detection plays a crucial role in enhancing cotton agricultural productivity. However, the detection process is subject to challenges such as target scale diversity and loss of leaf symmetry due to leaf shading. Hence, this research presents an enhanced model, EY8-MFEM, for detecting weeds in cotton fields. Firstly, the ALGA module is proposed, which combines the local and global information of feature maps through weighting operations to better focus on the spatial information of feature maps. Following this, the C2F-ALGA module was developed to augment the feature extraction capability of the underlying backbone network. Secondly, the MDPM module is proposed to generate attention matrices by capturing the horizontal and vertical information of feature maps, reducing duplicate information in the feature maps. Finally, we will replace the upsampling module of YOLOv8 with the CARAFE module to provide better upsampling performance. Extensive experiments on two publicly available datasets showed that the F1, mAP50 and mAP75 metrics improved by 1.2%, 5.1%, 2.9% and 3.8%, 1.3%, 2.2%, respectively, compared to the baseline model. This study showcases the algorithm’s potential for practical applications in weed detection within cotton fields, promoting the significant development of artificial intelligence in the field of agriculture.

1. Introduction

Cotton, as a crucial economic crop, significantly contributes to the advancement of the global economy and is recognized as one of the foremost textile raw materials worldwide. With the ongoing expansion of the global population and the progress of urbanization, the available land area for cultivation is decreasing day by day, and the importance of smart agriculture is gradually becoming prominent [1]. Precision agriculture [2] refers to the specific application and implementation of information technology in the field of agriculture, to achieve refined management and decision support in agricultural production [3]. Among them, the task of weed detection in cotton fields is a specific application in the field of precision agriculture, which has important significance and impact on the agricultural production of cotton.
Weeds, as one of the important factors leading to a decrease in cotton crop yield, occupy the growth space and survival resources of cotton, resulting in insufficient nutrient absorption by cotton crops and a decrease in crop yield [4]. At present, chemical weed control and mechanical weed control are mainly used in farmland for prevention and control. Pesticide residues in the air, soil and crop surfaces not only cause respiratory irritation, skin allergies and poisoning to those who come into contact with them, but also affect the safety of the surrounding water sources, thus affecting people’s health. In contrast, mechanical weeding has the characteristics of environmental friendliness and strong controllability. But when the spacing between crops is small, problems such as seedling damage may occur, and after mechanical weeding, weeds may grow again, requiring multiple weeding operations [5]. One way to solve the above problems is to use deep learning algorithms to accurately locate weeds within agricultural fields and use agricultural intelligent robots for precise weed control [6], thereby reducing the use of chemical pesticides and indirectly having a positive impact on human health.
The weed detection process poses numerous challenges. Firstly, the existence of crops and weeds in the growth cycle has diverse target scales, and the same crop has different morphological and appearance characteristics in different growth cycles. In addition, plants within the same growth cycle may exhibit appearance characteristics of varying sizes due to uneven distribution of nutrients. These changes require considering the changes in target scale under different growth cycles in object detection. Secondly, there is a problem of leaf obstruction between crops and weeds. Throughout the growth cycle of plants, leaf occlusion emerges as a prevalent challenge in object detection. As plants grow, their leaves may cross or obstruct each other, resulting in partial or complete obstruction of the target. A complete blade has a high degree of symmetry that can be easily recognized by the machine, but this blade symmetry is lost when the blade is occluded, and this occlusion adds a degree of difficulty to the detection process. Secondly, there is a problem of morphological similarity between weeds and crops. Distinguishing weeds and crops has become a challenge in object detection due to their similar appearance and morphological characteristics.
In response to the above issues, researchers have adopted methods such as data augmentation, vegetation index features, multi-scale feature fusion, and attention mechanisms to achieve weed detection for different crops. Eide et al. [7] used thermal remote sensing and multispectral remote sensing images obtained by drones, combined with the normalized vegetation index and synthesized wavelength maps to distinguish weed populations. Chen et al. [8] employed a support vector machine classifier along with fused feature combinations to achieve precise detection of diverse weed types and corn seedlings. Li et al. [9] utilized color index features and the Otsu threshold algorithm to accomplish the segmentation of vegetation and weeds, and input the processed dataset into the PSPNet model for training to achieve accurate segmentation of areas under high weed pressure. Moazzam et al. [10] introduced an innovative convolutional neural network named VGG Beet for the classification of multispectral datasets.This method simplifies the three-pixel classification problems into two categories to improve the classification accuracy. Wang et al. [11] introduced an enhanced YOLO model tailored for the precise detection of sunflower plants. This approach segments high-resolution images into pertinent subgraphs through overlap rate calculations, employing multi-scale training techniques to attain accuracy and recall rates of 0.9465 and 0.9017, respectively. In addressing the issue of inadequate focus on crucial target features and noise feature suppression within the YOLOv5 model’s feature extraction network, Wang et al. [12] introduced the C3 Host bottleneck module and integrated an attention mechanism to improve the network’s emphasis on relevant features. However, this model may mistakenly identify some wheat seedlings as weeds when processing them, so there remains potential for further enhancement in the feature extraction network.
Given the significant advantages of YOLO series models in real-time, accuracy, and ease of deployment, they are widely used in weed detection tasks. Firstly, this study drew on the idea of attention mechanism [13] and the idea of symmetry [14] to design an ALGA module to enhance the concentration on spatial information within feature maps. Meanwhile, to bolster the feature extraction capacity of the backbone network and address the challenge of distinguishing between crops and weeds in weed detection, we propose the C2F-ALGA module. Secondly, we observed that the SPPF structure may contain similar or repetitive information in the feature maps after feature fusion. To mitigate feature redundancy and computational complexity within the model, we propose the MDPM. This module enables the capture of a broader spectrum of contextual information across both horizontal and vertical directions within the feature map, and adjust the relationships between channels in the feature map through operations in different directions, thereby generating an attention matrix to improve the expressive capacity of features. Finally, this study improved the upsampling module of YOLOv8 by introducing CARAFE [15]. By reusing fine-grained features and adjusting content awareness, the CARAFE module can automatically adjust the upsampling method to provide better upsampling results. This enhancement notably enhances the model’s performance in tasks related to feature reconstruction and recovery. The main contributions of this study include:
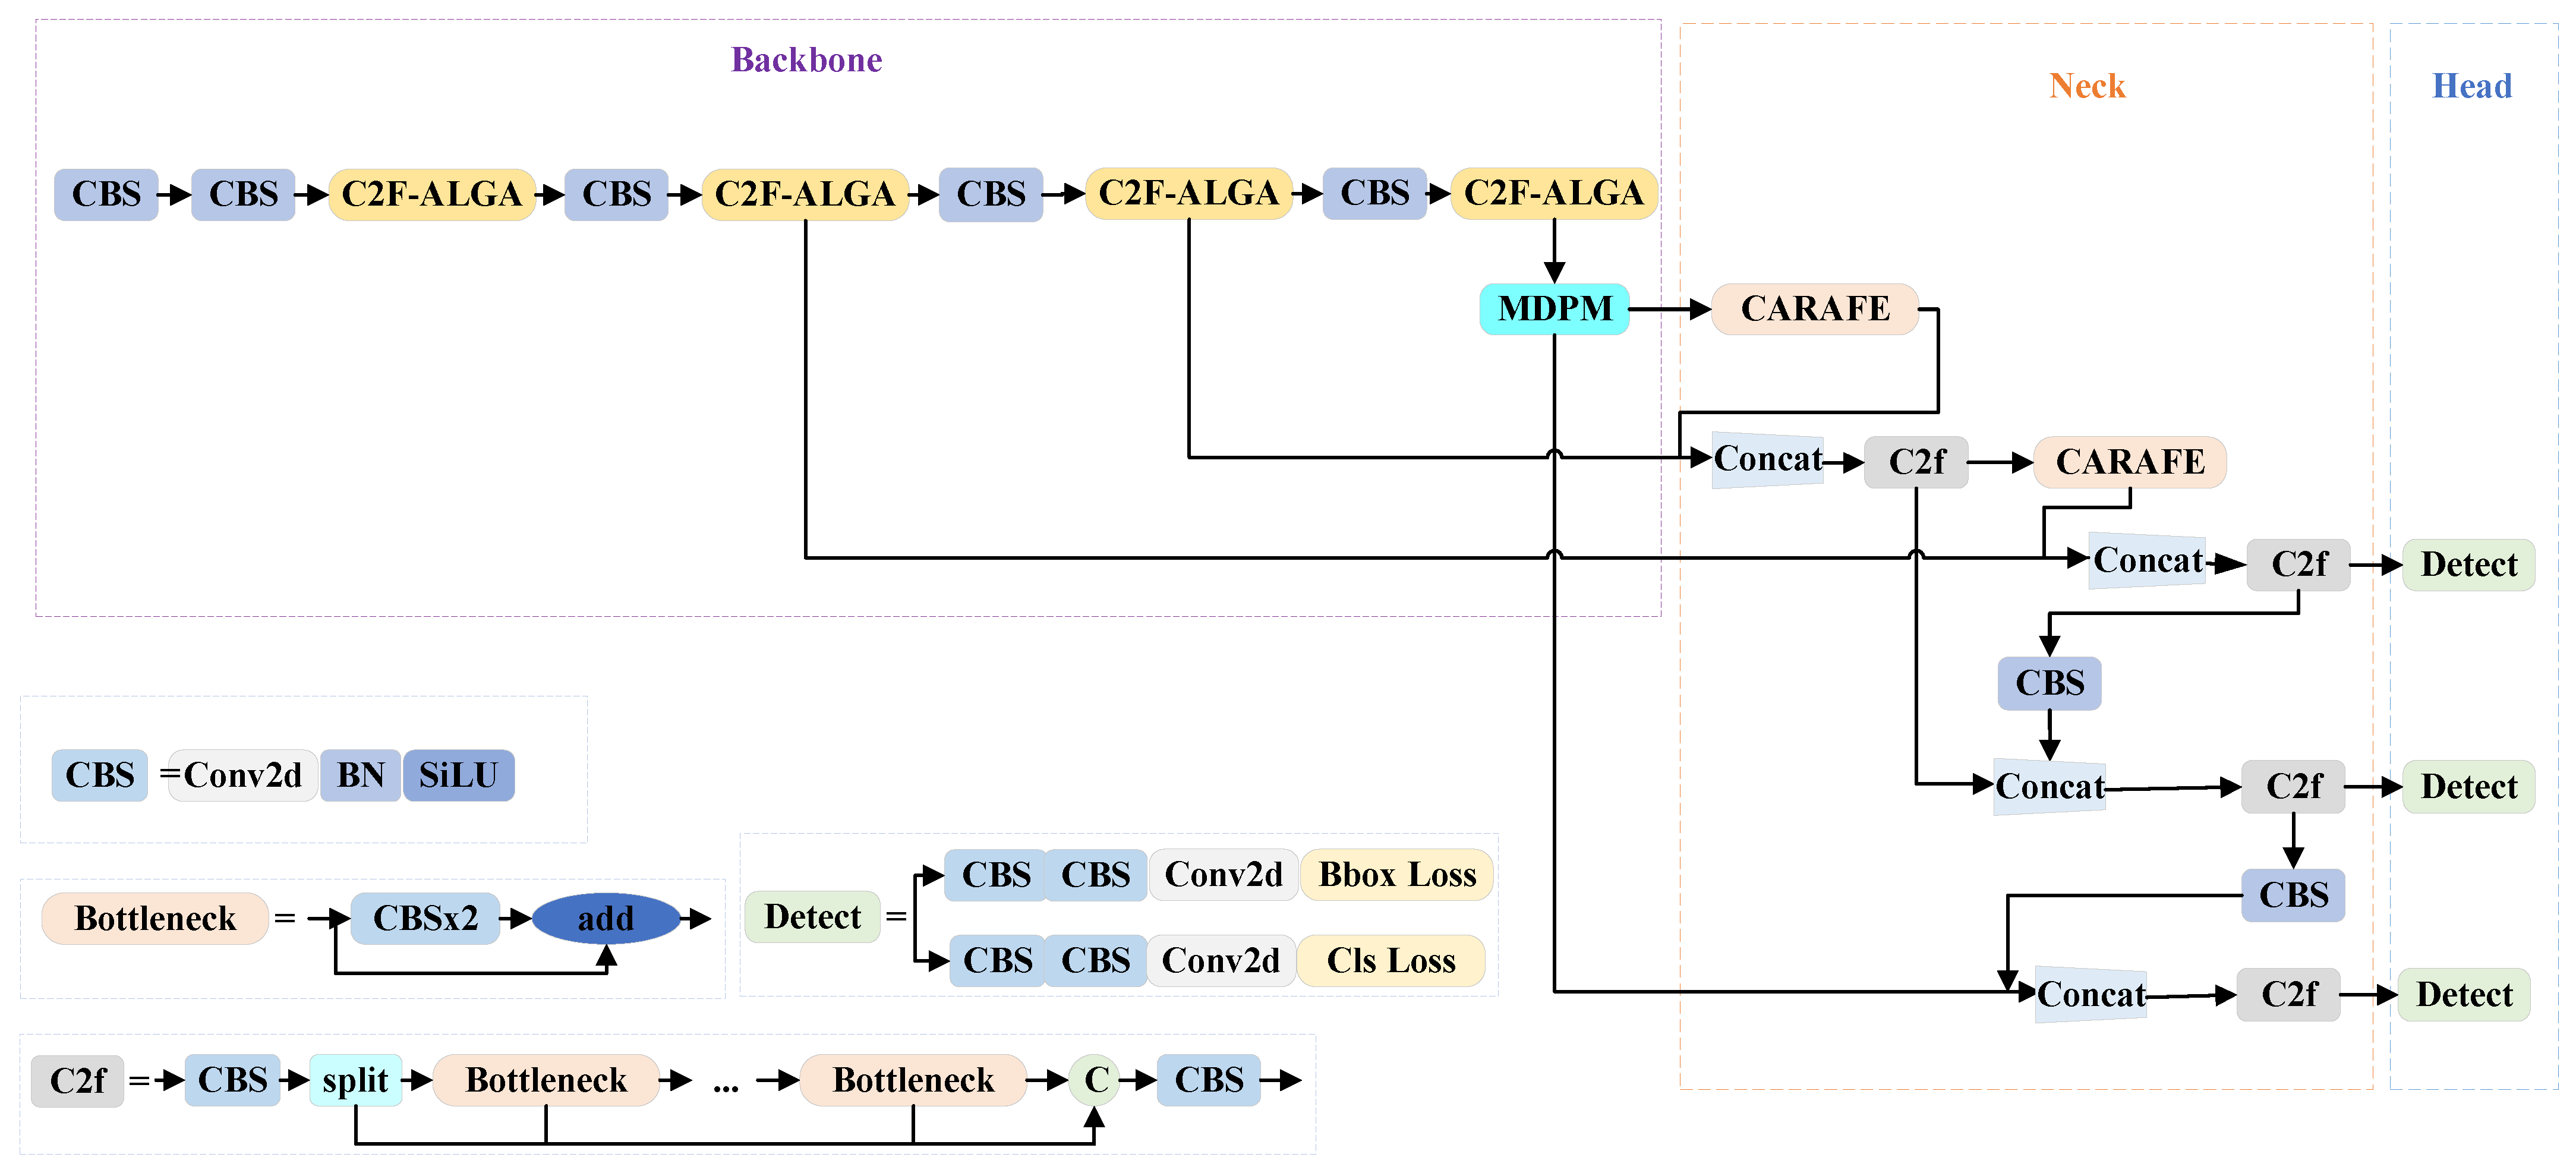
  • We propose an improved cotton field weed detection model EY8-MFEM to address real-time and efficient issues such as diverse target scales and occlusion of crops and weeds during the growth cycle during the detection process.
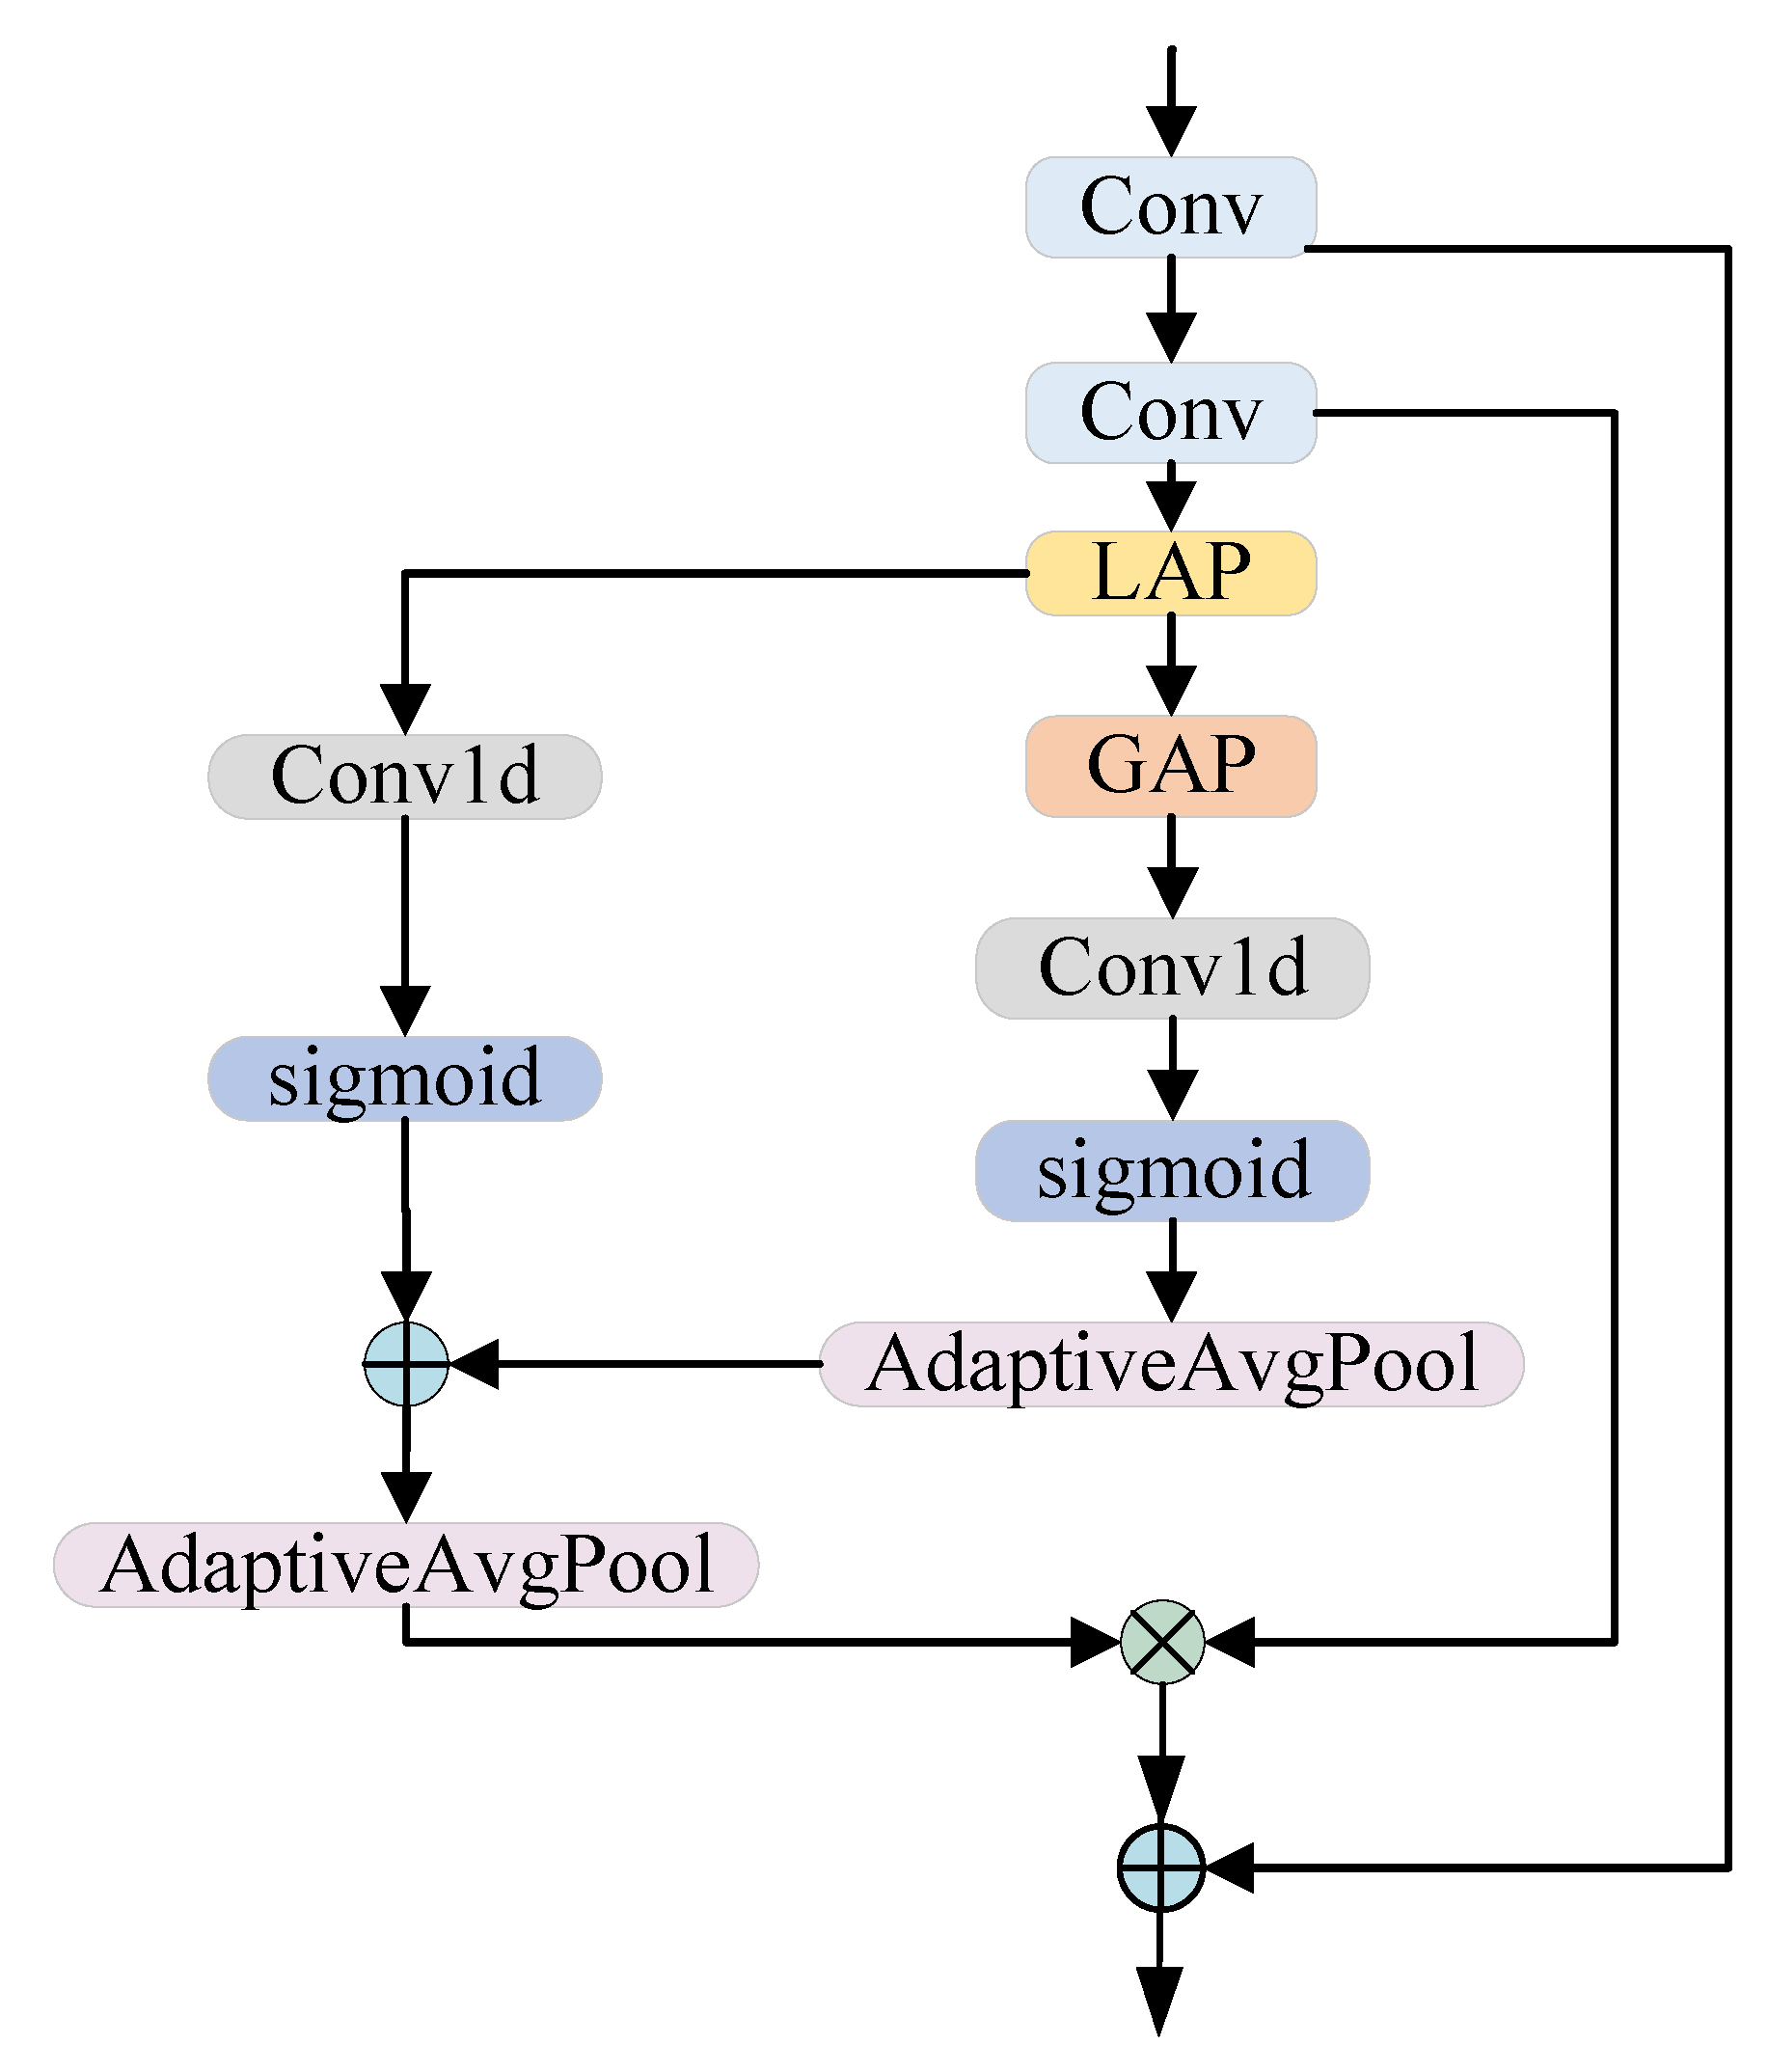
  • To emphasize crucial feature information, we introduce the ALGA module, which evaluates both local and global information within the feature map to generate an attention matrix. This approach enhances the focus on and utilization of spatial information within the feature map.
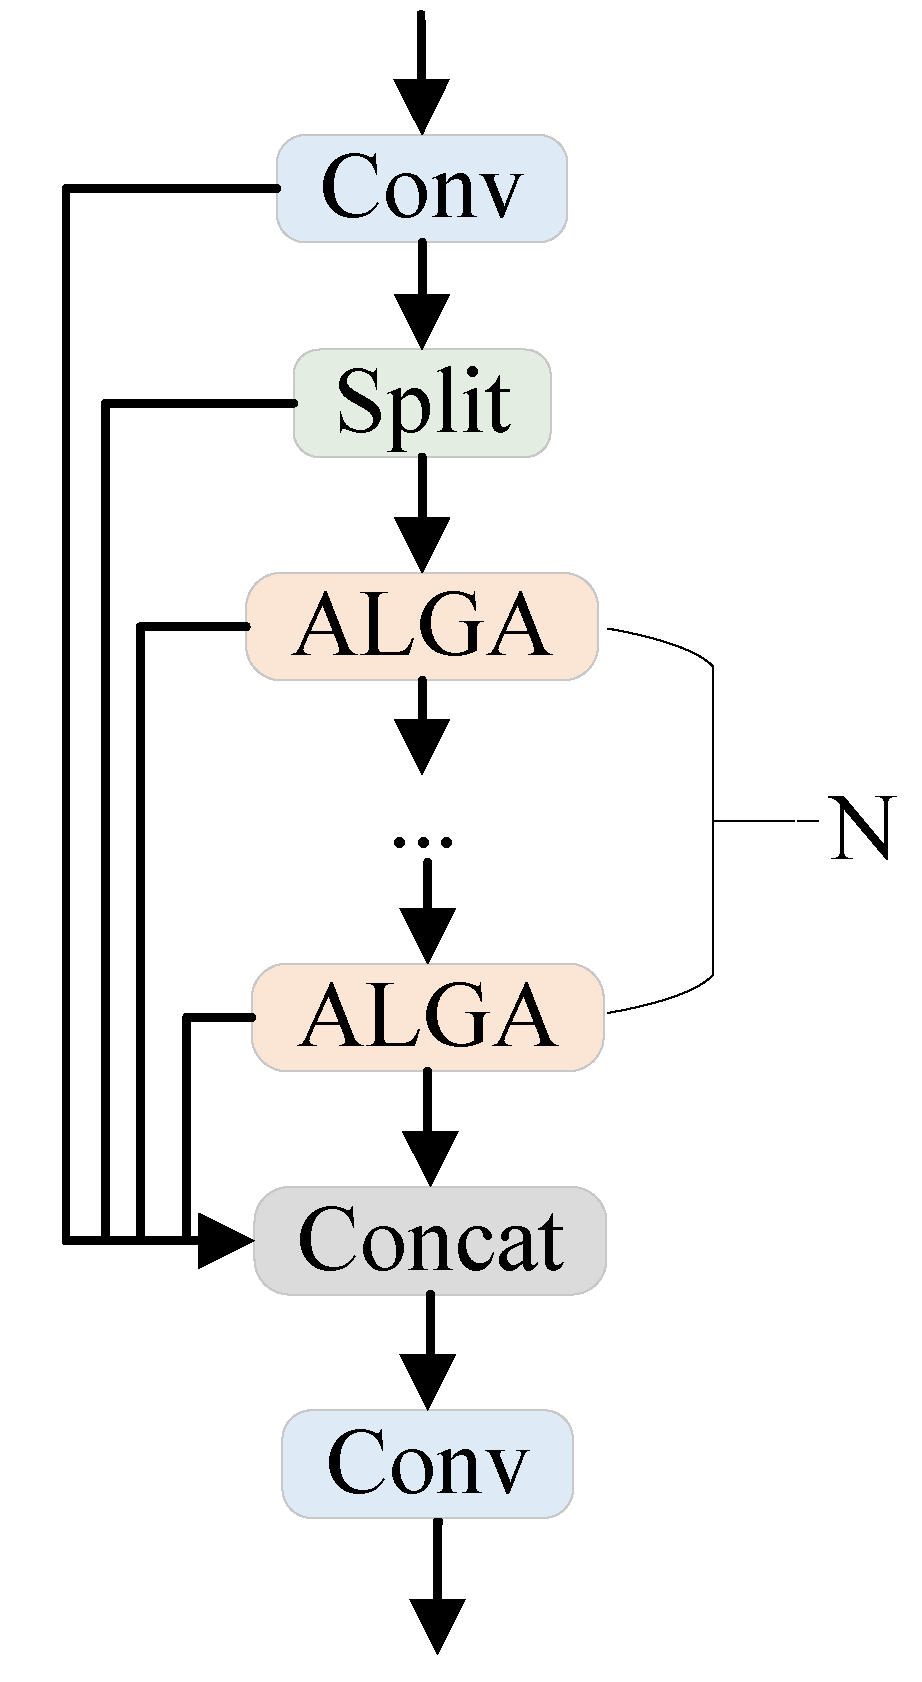
  • We’ve introduced the C2F-ALGA module with the aim of enhancing the feature extraction capacity of the backbone network. This module facilitates the adaptive fusion of local and global features, enabling the model to capture local details and global contextual information in images more effectively.
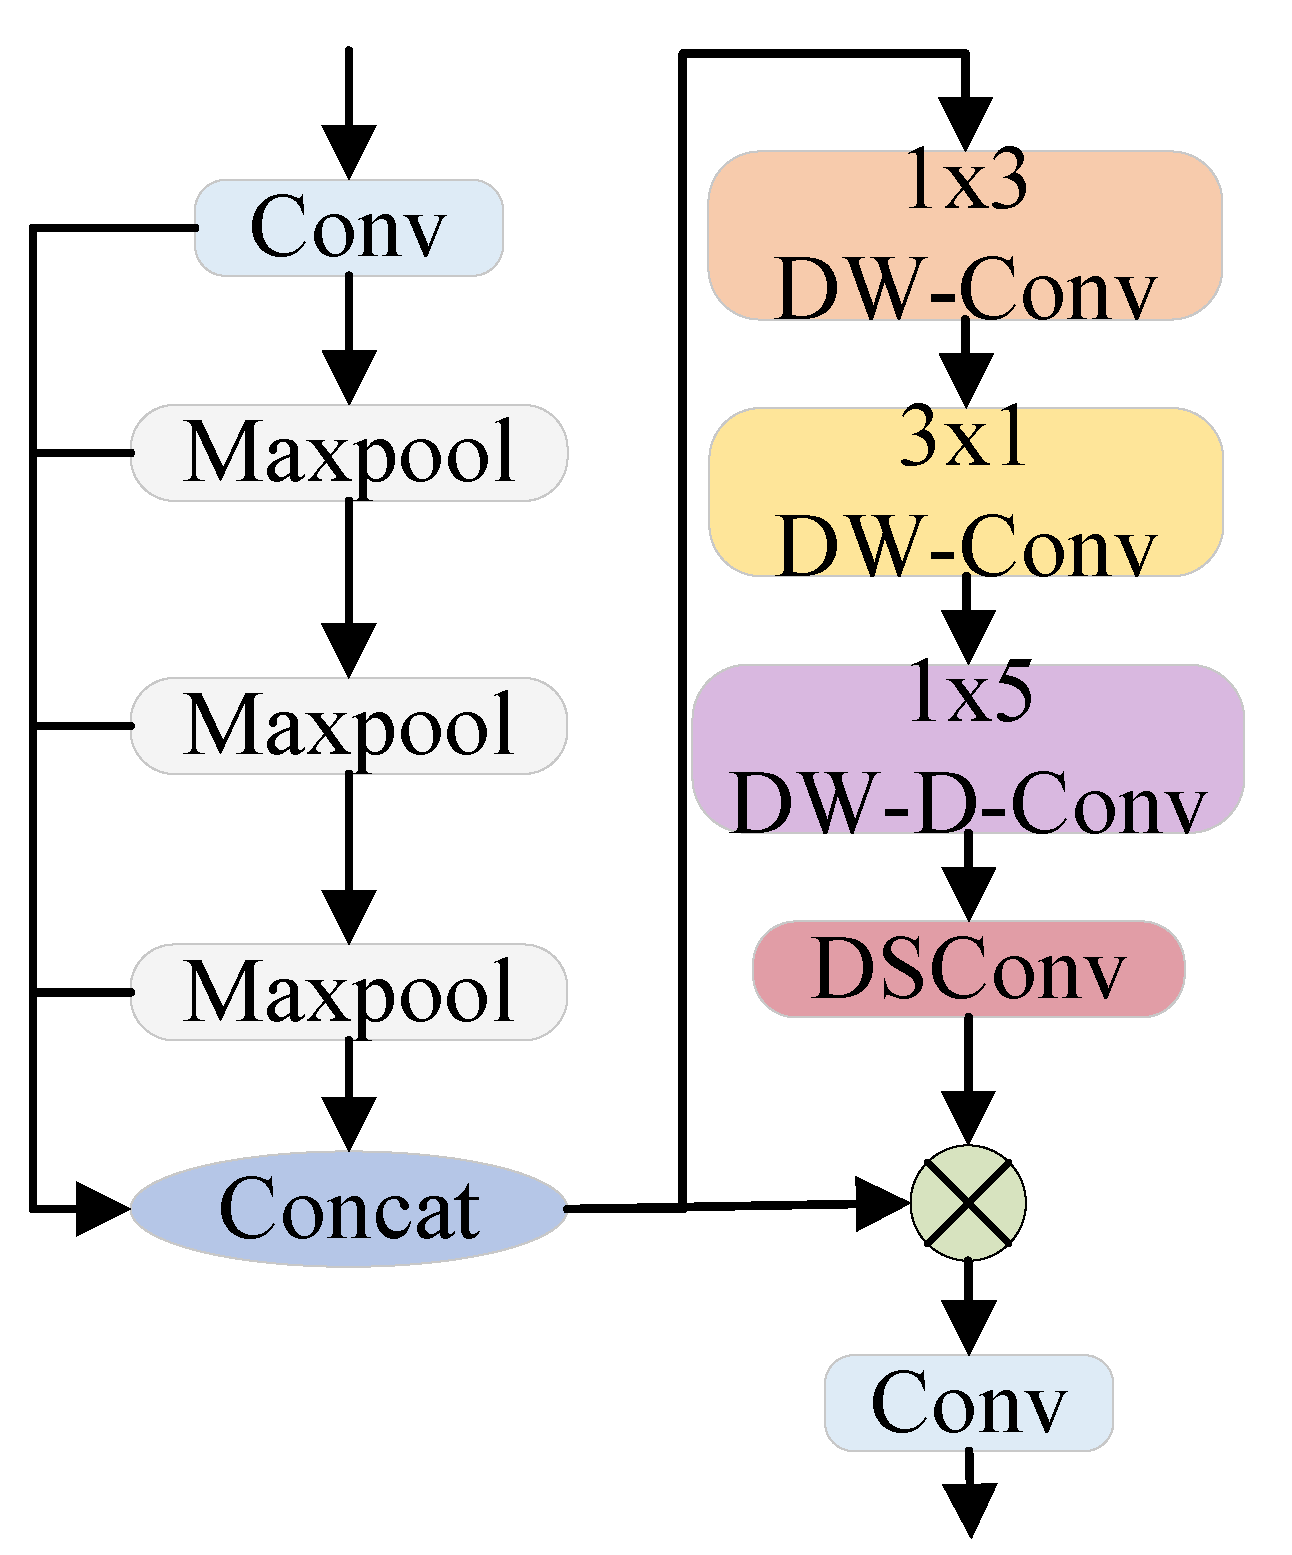
  • We introduce the MDPM module, designed to selectively extract and leverage horizontal and vertical information from feature maps. It generates attention matrices to enhance the model’s awareness of spatial structure and diverse directional features.

2. Related Work

2.1. Weed Detection

Amidst the swift advancements in artificial intelligence, a plethora of methods rooted in traditional machine learning and deep learning have surfaced within the domain of weed detection. The methods based on traditional machine vision mainly cover image-based filtering, color features, spectral features and other technologies, including the use of threshold processing and the use of classifiers to predict weed positions. The methods based on deep learning mainly focus on segmenting, classifying, and detecting weed positions. Sheffield et al. [16] used aerial images for training and used two random forest algorithms to classify aquatic weeds, but the detection performance was poor when the patch area was less than 3 square meters. Naveed et al. [17] utilized the calculation of NDVI indices for near-infrared and infrared spectral images of crops and weeds, and applied the Ostu algorithm to predict the fusion saliency images of weeds and crops. However, it relies on predefined fixed filter weights, which limits its flexibility and adaptability. Xu et al. [18] proposed an instance segmentation method that combines visible color indexing and encoder-decoder architecture. To tackle the challenge of weed targets with notable variations in size and specifications often being disregarded, Chen et al. [19] introduced YOLO-Sesame. This method incorporates local importance pooling within the SPP (Spatial Pyramid Pooling) layer of the YOLOv4 model, aiming to enhance the attention directed towards individual targets. Furthermore, the model incorporates an adaptive spatial feature fusion architecture to proficiently detect targets of diverse specifications. To tackle the challenges associated with weed detection arising from the overlap between crops and weeds, Peng et al. [20] proposed a RetinaNet-based model called WeedDet. By improving the backbone network, the model has achieved substantial results. Arsa et al. [21] proposed a dual decoder branch network to detect weed growth points. The decoder component of the model amalgamates spatial attention and channel attention while introducing a activation gate mechanism to regulate attention allocation. Punithavathi et al. [22] introduced the CVDL-WDC model, which initially employs a multi-scale Faster RCNN for object detection, followed by an optimal limit learning machine for weed classification. This approach effectively discerns weeds amidst crops.

2.2. YOLO Algorithm

The YOLO series models are widely favored due to their advantages such as lightweight and high accuracy. With the continuous evolution of the YOLO model, its main idea is to divide the image into grid-like regions during the image input stage and extract features through the backbone network. Subsequently, multi-scale feature fusion is performed through networks such as feature pyramids to form feature maps at multiple scales. Ultimately, the model conducts object detection on feature maps at varying scales. The output of this model encompasses category labels of the detected targets, coordinates of the center point, width and height coordinates of the bounding box, along with confidence information. The single-stage detection method represented by YOLOv1 [23] does not require generating candidate regions, but directly performs target classification and bounding box regression on the image. This method greatly improves detection speed while slightly sacrificing some accuracy. YOLOv2 [24] proposed a new training method that significantly expands the number of detectable object categories. YOLOv3 [25] introduced a multi-scale prediction module, allowing the model to simultaneously perform regression prediction on multiple feature maps of different scales. In the same year, YOLOv4 [26] and YOLOv5 [27] successively proposed and introduced technologies such as the CSP module and adaptive anchor box calculation, significantly improving detection performance. Li et al. [28] proposed YOLOv6, which introduces an efficient decoupling head and designs a reparameterized backbone network to further improve object detection performance. Alexey et al. [29] proposed YOLOv7, which adopts a new data augmentation method and proposes a strategy of merging the Neck layer and Head layer into a Head layer to significantly improve the accuracy of object detection. YOLOv8 [30] proposed a new C2F structure and operations such as separating classification and detection heads, which significantly improved the target detection accuracy of the model. Due to achieving a good balance between accuracy, real-time performance, and deployment difficulty, the YOLO model has been widely used in the industry and in various real-time scenarios. With the application of the YOLO model in various tasks, we have noticed that in certain specific tasks, the YOLO model faces problems such as insufficient feature extraction, redundancy in feature fusion, and loss of image details caused by upsampling. In response to these challenges, numerous researchers have proposed enhanced YOLO models tailored to meet the demands of specific tasks.

2.3. Attention

Attention mechanisms enhance focus on relevant feature area information. Lau et al. [31] proposed LSKA, which divides conventional convolutional kernels within convolutional layers into kernels oriented in different directions. This decomposition allows for the direct utilization of deep convolutional layers with large kernels within attention modules, obviating the necessity for additional blocks. Hassani et al. [32] proposed Neighborhood Attention. This attention mechanism focuses self-attention on the nearest neighboring pixels through pixel-by-pixel operations, thereby achieving local attention to the feature map. This approach efficiently extracts correlation information among neighboring pixels. Tan et al. [33] introduced a temporal attention unit that decomposes temporal attention into static attention and dynamic attention. Through this approach, the time module not only achieves parallelization processing but also captures the characteristics of long-term time evolution. Compared with single-modal information, the attention fusion mechanism using multiple-modal information will significantly increase the computational cost. To address this issue, Cao et al. [34] proposed a lightweight multimodal information fusion module. This module effectively integrates inputs from different modalities by applying channel switching and spatial attention methods. The design of this module not only achieves efficient fusion of multimodal information but also reduces the computational burden. Due to the high complexity of the multi-head attention mechanism in high-resolution computing, Ning et al. [35] proposed a new trap attention mechanism. This mechanism establishes traps within the expanded space of each pixel and constructs an attention mechanism based on the feature retention rate of the convolutional window. This conversion effectively reduces quadratic computational complexity to a linear form. This method effectively solves the complexity problem of multi-head attention calculation in high-resolution scenes. The spatiotemporal cross-attention module proposed by Tang et al. [36] first evenly divides the input features into two sub-regions in the channel dimension, and then calculates spatial and temporal attention for each sub-region separately. Then, connecting the outputs of the attention layers can lead to significant memory consumption and computational burden when calculating attention at all positions on the feature map. To tackle this challenge, Zhu et al. [37] proposed a dynamic sparse attention method. Initially, it filters out irrelevant key-value pairs and then focuses attention on other candidate regions. This approach enhances computational efficiency while preserving performance quality.

3. Proposed Method

In this chapter, we will first introduce the model structure in Section 3.1. Next, in Section 3.2, we provided a detailed introduction to our proposed ALGA module and C2F-ALGA module. Subsequently, in Section 3.3, we introduced our proposed MDPM module. Finally, an introduction to the CARAFE module is provided in Section 3.4.

3.1. Model

As a highly anticipated object detection model, YOLOv8 has been widely applied in various tasks that require real-time performance, such as weed detection tasks. In addition, the model weight of YOLOv8 is relatively small, making it very suitable for applications on resource-limited platforms such as agricultural inspection robots and micro drones. Although YOLOv8 performs well on the MS COCO dataset, it may not necessarily achieve optimal performance in weed detection tasks. Based on the above considerations, this study adopts YOLOv8 as the baseline model and proposes a network model called EY8-MFEM for specific weed detection scenarios to fulfill the criteria of being lightweight, real-time, and efficient.
As depicted in Figure 1, EY8-MFEM comprises three primary components. Within the network, the backbone is used to extract multi-scale features from input images, while the neck is responsible for integrating these extracted features. The Head module generates the final detection results by performing bounding box regression and target classification on feature maps of three different scales. Firstly, in EY8-MFEM, to address issues such as crop weed similarity during weed detection, we introduce the C2f-ALGA module to augment the feature extraction capacity of the Backbone module, replacing the C2F module in YOLOv8. Secondly, we observed that the SPPF structure first extracts and encodes features of different scales, and then fuses the feature maps of different pooling layers through simple channel concatenation operations. However, this approach has a problem, which is that the fused feature maps may contain similar or repetitive information. To mitigate feature redundancy and computational complexity within the model, we replaced the SPPF module of YOLOv8 with our proposed MDPM module. This module is capable of capturing a broader spectrum of contextual information in both horizontal and vertical directions within the feature map, and adjusting the relationships between channels in the feature map through operations in different directions, thereby enhancing the expression ability of features. Ultimately, the absence of a discriminative weighting mechanism for distinct positional features within the upsampling module of YOLOv8 impedes its ability to adjust to the significance of various positional features. Consequently, this constraint restricts the expressive capability of upsampled features and the richness of semantic information. This study improved the up-sampling module of YOLOv8 by introducing the CARAFE module. By reusing fine-grained features and adjusting content awareness, the CARAFE module can automatically adjust the upsampling method to provide better upsampling results.

3.2. Adaptive Local–Global Attention & C2F-ALGA

We note that commonly used attention mechanisms (such as ECA [38], SE [39], etc.) mainly adjust the importance of channels based on information from the channel dimension. When modeling the relationships between channels, these mechanisms compress the entire channel feature map into one value, which inevitably reduces the attention to spatial information. Therefore, when processing feature maps, the attention to spatial information on each channel dimension will decrease. When the attention of a channel is low, but certain spatial positions of that channel have important features, the channel attention mechanism may not be able to accurately capture this local spatial information. In this case, the channel attention mechanism cannot fully utilize local features, thus restricting the model’s capability to grasp crucial spatial information.

3.2.1. Adaptive Local–Global Attention

Inspired by the concept of symmetry, we use a two-branch path to generate the attention matrix. We propose ALGA (Adaptive Local Global Attention) to address the above issues, as shown in Figure 2. To improve the utilization of spatial information, this module incorporates local adaptive average pooling and global adaptive average pooling operations to capture the spatial characteristics of feature maps. Subsequently, it combines the local and global information weights of the input feature map to generate an attention weight matrix. Finally, this attention weight matrix is applied to the original feature map to emphasize crucial feature information. Through this approach, we can better focus on and utilize spatial information in feature maps.
In particular, for the input features, we initially employ two consecutive convolution operations to extract refined semantic features from the input data. For the extracted high-level semantic features, this study adopts two paths to extract local spatial information and global spatial information features. This design enables the model to simultaneously focus on local details and global context. Firstly, this study employs a local adaptive average pooling layer to perform pooling operations on input features, to extract the average value of local regions and obtain local features. Considering that global features can provide comprehensive information about the entire input, which helps the model understand and judge the overall feature pattern, we adopt a global adaptive average pooling operation to process local features. By compressing the entire local feature to 1 in both height and width directions, we obtain a global feature tensor. For the convenience of subsequent processing, we reshaped the local features. Meanwhile, we also reshaped the global feature tensor. To capture the spatial relationships and patterns between features and extract the spatial contextual information of features, this study uses one-dimensional convolution to model the spatial relationships of feature tensors. Through one-dimensional convolution operations, the model can perceive and extract features across the entire spatial dimension, thereby capturing richer feature patterns. Following the dimensionality reduction of the spatial feature tensor, we utilize the sigmoid function to model the attention of local features and global features separately. Next, we will adapt the global attention feature weights to the shape of local adaptive feature weights through adaptive pooling operations, so that they have the same shape. Then, we weighted and summed the attention weights of these two parts to obtain the attention weights. Next, we use the adaptive average pooling operation to adjust the attention weights to the same size as the features extracted by the second convolution. Then, we adjust the weighted feature map from local size to the same size as the input. To achieve feature weighting, element-wise multiplication is conducted on the adjusted feature map with the features extracted from the second convolution. This approach enables us to weight the features based on attention weights, thereby highlighting important feature components and further enhancing the expressive capability and discriminability of features. By following the aforementioned steps, the model can prioritize crucial global and local information, thereby enhancing its performance in specific tasks. Finally, to enhance the transmission of important features and reduce the risk of overfitting, we use skip connections to connect shallower features with deeper features. The equation representing the ALGA module is given by the following:
X 1 = C o n v X
X 2 = C o n v X 1
F 1 = A A P f C o n v 1 × 1 p e r m u t a t i o n G A P L A P X 2
F 2 = σ f C o n v 1 × 1 p e r m u t a t i o n L A P X 2
Y = C o n c a t A A P C o n c a t ( F 1 , F 2 ) X 2 , X 1
where X represents the original input feature, X 1 and X 2 represents the intermediate characteristics, Y represents the final output characteristics, C o n v ( · ) represents 1 × 1 convolution, batch normalization, SiLu activation function operation, L A P ( · ) represents the local tie pooling operation, G A P ( · ) represents the global average pooling operation, p e r m u t a t i o n ( · ) is the dimension displacement operation, f ( · ) operation restores the dimension of the displacement, A A P ( · ) represents the adaptive average pooling operation, ⊗ represents the multiplication operation by element, and o represents the sigmoid function.

3.2.2. C2F-ALGA

In this study, we devised a C2F-ALGA module by integrating the proposed Adaptive Local Global Attention (ALGA) module to substitute the C2F module within the original network, as depicted in Figure 3. This improvement module combines the characteristics of the C2F module and the ALGA mechanism. By introducing the ALGA mechanism, the module can adaptively fuse local and global features, allowing the model to more effectively capture both local details and global contextual information within the image. Within the C2F-ALGA module, the input features undergo convolution through the first convolutional layer, followed by partitioning into two tensors, laying the groundwork for subsequent processing. Finally, the tensors from multiple processing steps are concatenated using the Concat operation. Then, the desired output features are obtained through the final convolution operation with the help of the second convolutional layer. By replacing the Bottleneck module in the C2F module, C2F-ALGA introduces more complex feature transformation and fusion mechanisms, thereby improving the model’s understanding of input data and further enhancing the backbone network’s ability in feature extraction and representation.

3.3. Multi-Scale Directional Perception Module
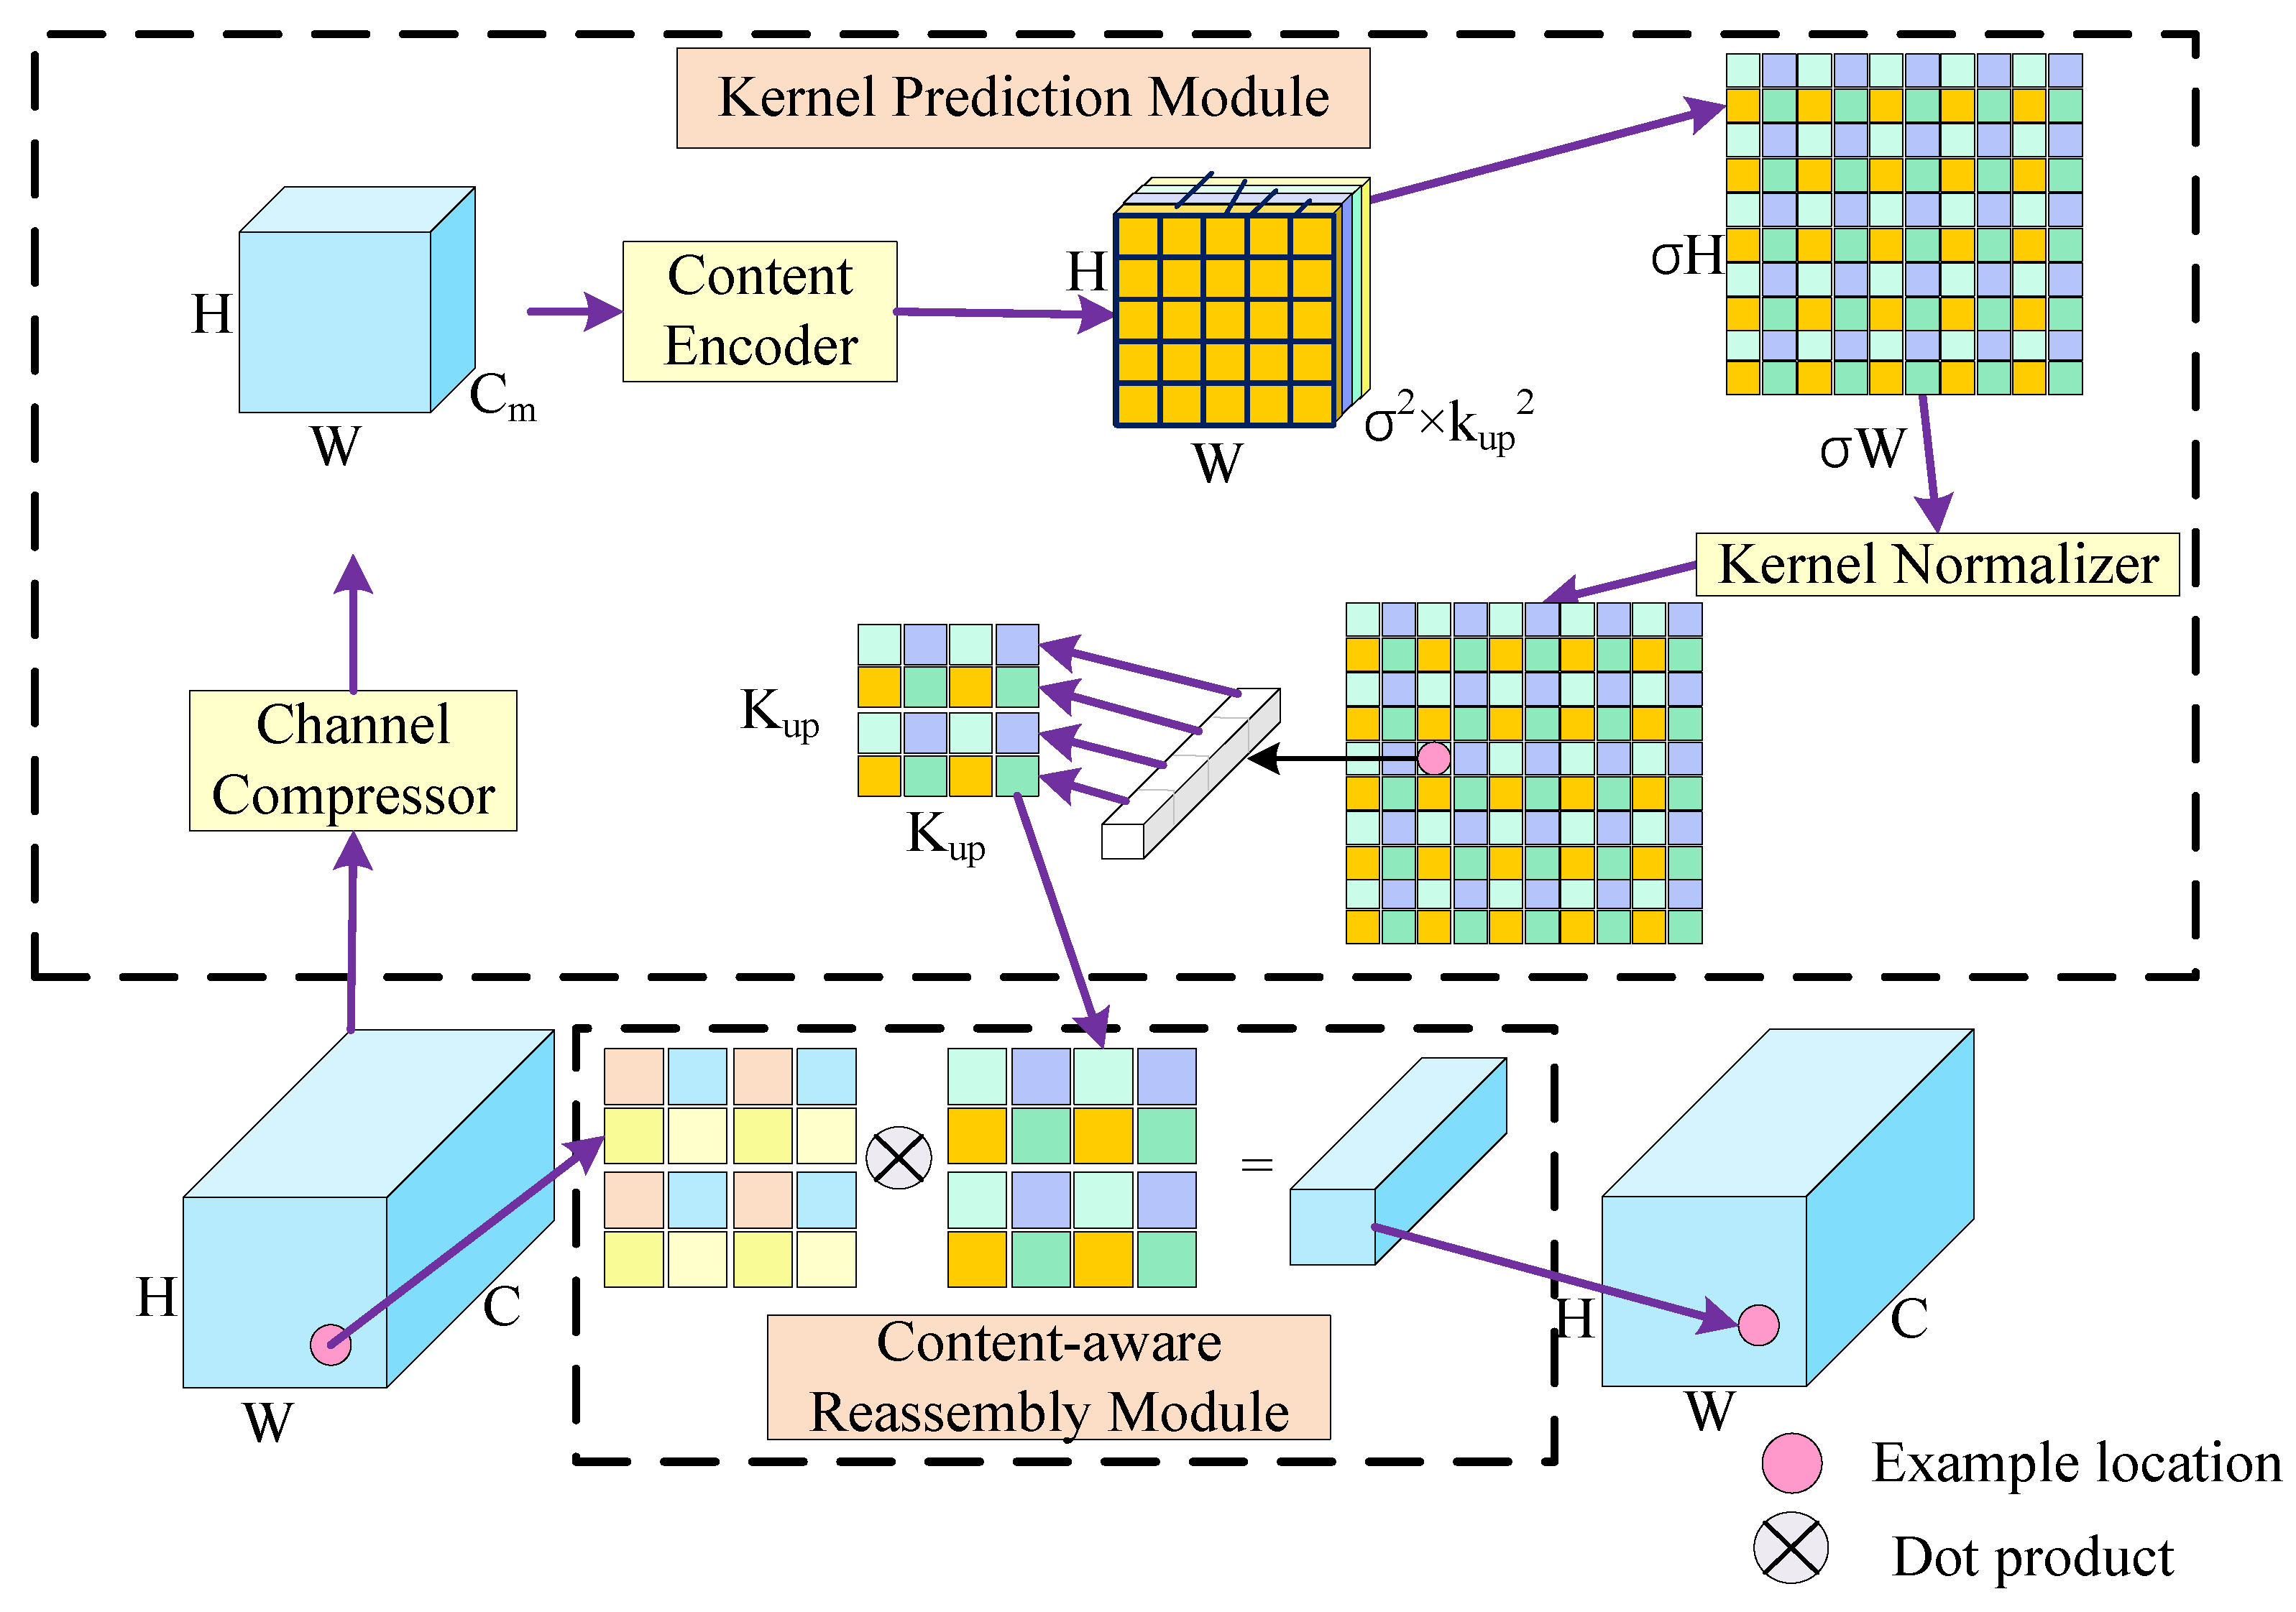
The spatial pyramid pooling structure of YOLOv8 generates feature maps of different scales through multiple pooling operations, which often contain similar information. Moreover, simply concatenating these feature maps together can cause duplicate representations of features, making the model overly dependent on similar feature representations, thereby increasing the risk of overfitting. We observed that weeds and crops have symmetrical morphology and are very similar both horizontally and vertically. Inspired by this, we consider further capturing the spatial detail features between weeds and crops from multiple perspectives, thereby generating an attention matrix and paying special attention to the original fused feature map. Therefore, we propose MDPM (Multi-Scale Directional Perception Module) to replace the traditional SPPF structure, as shown in Figure 4.
To enhance the model’s understanding of spatial structure and directional features within the fused feature map, we specifically targeted horizontal and vertical features separately. Taking into account the number of model parameters, we incorporated the concept of group convolution into our design. Through deep convolution, we segment the input channels into multiple groups and independently conduct convolution operations on the channels within each group. This strategy of group convolution effectively diminishes the number of model parameters while retaining ample representation of input features. Initially, for targeted extraction of horizontal features from the input feature map, we applied a 1 × 3 convolution kernel to execute horizontal convolution operations on the fused feature map. Through this step, we can effectively capture the horizontal spatial relationships between different positions in the input feature map. Subsequently, we employed a 3 × 1 convolution kernel to conduct vertical convolution operations on the feature map. By performing vertical convolution operations, We can efficiently capture crucial features in the vertical direction of the image, enhancing our understanding and representation of the image structure. Furthermore, vertical convolution operations can bolster the model’s nonlinear capability, enhancing its capacity to adapt to the nonlinear features present in the input data. To increase the perceptual range and contextual information, we introduce a dilated convolution operation, using 1 × 5 convolution kernels to further expand the model’s perceptual range of information in the horizontal direction. At the same time, we set the dilated sampling rate of the convolutional kernel to 2, so that it can span a wider area for feature extraction, better capturing long-distance dependencies and contextual information in the input feature map. To maintain effective feature extraction capability while minimizing computational and parameter complexity, we adopted a strategy of depthwise separable convolution. Among them, point-by-point convolution operation can not only adjust the number of channels but also help the model learn the weight relationship between channels, further extract features, or change the representation of features. The multi-scale directional perception attention weights generated through this step are multiplied element by element with the fused original feature map, to promote the model to enhance or suppress features at different positions, improve the understanding and representation ability of the data, and effectively mitigate the issue of feature redundancy. The MDPM formula is as follows:
F 1 = X × K 1 × 3 ( i , j , k ) × K 3 × 1 ( i , j , k )
F 2 = F 1 × K 1 × 5 ( 2 ) ( i , j , k )
Y = C o n v ( F 2 × K d e p t h w i s e ( i , j , k ) × K p o i n t w i s e ( i , j , k ) × X )
where X represents the input image, Y represents the final output image, F 1 , F 2 as the intermediate feature, m and n in K m × n ( i , j , k ) represent the convolution kernel size depth convolution of m × n , where m × n represents the spatial coordinates and channel index in the output image, respectively, K d e p t h w i s e ( i , j , k ) and K p o i n t w i s e ( i , j , k ) represents the operation in depth separable convolution. C o n v ( · ) indicates that the representatives operate successively through 1 × 1 convolution, batch normalization, and SiLu activation functions.

3.4. CARAFE

In YOLOv8, we noticed the use of nearest neighbor interpolation for upsampling. While the nearest neighbor interpolation method is straightforward and computationally efficient, it fails to fully exploit the semantic information within the feature map in cotton weed detection tasks. Additionally, its limited perception range may result in the loss of detailed information. Considering the aforementioned observations, we introduce an enhancement approach, which substitutes the upsampling module of the YOLOv8 model with the CARAFE module, as depicted in Figure 5. Through this change, we can achieve a more detailed upsampling effect, thereby improving the detail representation ability of the upsampling feature map.
The CARAFE operator includes a kernel prediction module (KPM) and a content aware reassembly module (CARM). The low-resolution features are first processed by the kernel prediction module (KPM) to generate upsampled recombination kernels, followed by the content-aware recombination module to implement the upsampling process. Specifically, KPM includes three parts: channel compression, content encoding, and kernel normalization. To alleviate the parameter count and computational burden, we initially employ a 1 × 1 convolution operation to reduce the number of channels in the original feature map to 64. Next, to encode the compressed feature map into a representation suitable for generating recombination kernels, we use an encoding function to map the number of channels to 36. Next, we use pixel shuffling to rearrange the input feature map tensor. Through this operation, we reduce the number of feature channels obtained in the previous step from 36 to 9, while simultaneously increasing the spatial size of feature mapping from H × W to 2H × 2W. The normalized feature map will be used for the upsampling process of content awareness in subsequent operations. After generating the recombination kernel, we map the original features twice in height and width directions and adjust the spatial size through dimension transformation operations. Then, we perform a dot product operation on the adjusted feature map and the generated recombination kernel to achieve content-aware recombination and upsampling. By generating the upsampling kernel in the above way, we have achieved expansion of the actual receiving domain. This approach can enable sampling points to extract information within a wider contextual range, thereby obtaining richer contextual information and improving the effectiveness of recombination and upsampling.

4. Experiment

In this section, we present the dataset and implementation specifics utilized in this study. Additionally, we perform ablation studies on the proposed EY8-MFEM, showcasing its effectiveness. In addition, we compared and evaluated EY8-MFEM with other methods, and conducted an in-depth analysis of the experimental results. Finally, we presented and explained the detection results using visual analysis, indicating that EY8-MFEM has excellent performance in weed detection tasks.

4.1. Implementation

We use NVIDIA A40 for single card training, in which the relevant parameters of the experimental platform are shown in Table 1. Meanwhile, we show some training parameters of the model during the training process in Table 2, which include the initial learning rate lr0, the cosine annealing hyperparameter lrf, the learning rate momentum, the weight decay coefficient, the optimizer class, the number of training rounds of the model and the amount of data used in each training iteration. During the experiments, we input an image size of 640 × 640 pixels and used half-precision hybrid training to speed up the training process. We implemented an early stopping mechanism to reduce the risk of model overfitting.

4.2. Datasets

We first conducted extensive experiments using the CottonWeedDet3 dataset [40]. This dataset contains RGB images of weed growth in cotton fields captured by smartphone cameras or handheld digital cameras, saved in .jpg format. The images were captured by photographers at different locations in the U.S. Cotton Belt states (mainly North Carolina and Mississippi) during the planting period from 2020 to 2021. The collection process was conducted under natural field light conditions, and images of various stages of weed growth were captured from different viewpoints. Our study focused on three main weed classes, Mollugo verticillata, the genus Ipomoea, and Amaranthus palmeri. These captured images averaged 4442 × 4335 pixels in size and consisted of a total of 848 images with more than 1500 bounding-box annotations labeling the three different types of weeds commonly found in cotton fields in the southern United States.
Second, we further validate the generalization ability of the model using the cotton weed dataset [41]. This dataset contains 570 images covering two labelled categories, weeds and cotton. The weed categories include dozens of weed categories such as Artemisia incarnata, groundsel, endive, Tribulus terrestris, Ginkgo biloba, castor beans, Matang, false hippocampus tooth, and iron amaranth, which ensures the diversity of the data. Most of these images were taken by smartphones or digital cameras under natural light conditions in Indian cotton fields and saved in .jpg format. Images within the same weed category are highly variable in terms of leaf color, morphology, soil background and ambient light conditions, which helps in constructing models that are robust to image conditions or shifts in the dataset. To accommodate the model inputs, the images in this dataset were uniformly compressed to 416 × 416 pixels. During model training, we divided the dataset in the ratio of 60%:20%:20% for training, validation and testing to better evaluate the performance and generalization ability of the model.

4.3. Ablation Experiment

To verify the effectiveness of the method, we performed ablation experiments to scrutinize the contribution of each component, contrasting it with the baseline model YOLOv8s across two datasets. We integrated C2F-ALGA, MDPM, and CARAFE into the baseline model YOLOv8s to assess their influence on performance. Ablation study are depicted in Table 3 and Table 4, with an IoU nonmaximum inhibition threshold set to 0.7, with an IoU nonmaximum inhibition threshold set to 0.7. We observe a notable enhancement in object detection performance, particularly evident for smaller targets, through our method. In our experiments, we assessed the model’s detection performance using metrics such as average precision (mAP), accuracy (P), recall (R), and parameter count (Params). CARAFE uses a fixed set of hyperparameters in its experiments, where the C m of the channel compressor is 64, the kernel size of the content encoder K e n c o d e r = 3 , and the reassembly kernel size K u p = 3 .
Upon integrating the C2f-ALGA module, the experimental findings outlined in Table 3 indicate a 1% enhancement in F1, a 2.9% increase in mAP50, and a 2.7% improvement in mAP75. Table 4 indicate that F1 increased by 4.2%, mAP50 increased by 0.5%, and mAP75 increased by 2.9%. In the process of weed detection, there are often problems such as diversified target scales and occlusion of crops and weeds during the growth cycle. Hence, enhancing the feature extraction capability of the backbone network is paramount. The C2F-ALGA module introduces local adaptive average pooling and global adaptive average pooling operations, which dynamically fuse local and global features. By doing so, the model is able to effectively capture both local details and global contextual information in images of weeds and cotton. This enhancement significantly improves the network’s capability to extract essential backbone features. Upon incorporating the MDPM module, the experimental outcomes in Table 3 indicate a 0.1% enhancement in F1, a 1.9% increase in mAP50, and a 0.4% improvement in mAP75. The findings from the experiments detailed in Table 4 demonstrate a 3.2% rise in F1, a 1.2% increase in mAP50 and a 1.6% improvement in mAP75. We believe that the SPPF module of YOLOv8 simply concatenates some feature maps generated through multiple pooling operations, which can cause duplicate representation of features and make the model overly dependent on similar feature representations, thereby increasing the risk of overfitting. The MDPM module extracts and leverages information in both the horizontal and vertical directions of the feature map to produce multi-scale directional perceptual attention weights, which promote the model to enhance or suppress features at different positions, improve the ability to understand and represent data, and effectively alleviate feature redundancy and reduce overfitting. Substituting the upsampling module in YOLOv8 with the CARAFE module resulted in experimental findings showcased in Table 3, indicating a 1.1% enhancement in F1, a 2.1% increase in mAP50, and a 2.9% improvement in mAP75. The experimental findings detailed in Table 4 demonstrate a 3.8% elevation in F1, a 1.3% rise in mAP50, and a 2.2% enhancement in mAP75. We posit that conventional upsampling modules may readily result in the loss of intricate information for targets such as cotton and weeds, which exhibit similar shapes. CARAFE can enable sampling points to extract information in a wider contextual range, thereby obtaining richer contextual information. Although the application of the CARAFE module has brought significant performance improvements, with the increase of parameter count and FLOPs, it has increased by 1.07 M and 0.2 G, respectively. This is mainly because the performance of CARAFE is affected by multiple factors, including the number of output channels of the channel compressor C m , the kernel size of the content encoder K e n c o d e r , and the size of the reassembled kernel K u p . As these parameter values increase, the number of parameters and computational complexity of the model will also increase accordingly. Specifically, increasing the K e n c o d e r can expand the encoder’s receptive domain and utilize contextual information within a larger area, but its computational complexity increases with the square of the kernel size.
The C2F-ALGA and MDPM modules demonstrated some positive effects when acting together on the benchmark model, and the experiments in Table 3 show that its mAP50 metrics are 0.1% and 1.1% higher than the effects of the C2F-ALGA and MDPM modules alone, respectively, and the experiments in Table 4 show that the mAP50 is 0.6% higher than that when the C2F-ALGA is acting alone, and its mAP75 was 0.2% higher than when MDPM acted alone. When the C2F-ALGA and CARAFE modules act together on the benchmark model, the mAP50 metrics on both datasets are somewhat higher than when the two modules act alone. When the MDPM and CARAFE modules act together on the benchmark model, the experiments in Table 3 show an improvement of 1.4%, 2.8% and 1.2% on the mAP50 and mAP75 metrics, respectively, compared to when the two act alone, and the experiments in Table 4 show an improvement in their metrics on the mAP75 of 2.1% and 2%, respectively, compared to when the two act alone. These inter-module comparison experiments show that most of these modules have a mutually reinforcing effect on each other.
Finally, our proposed EY8-MFEM model achieved an overall improvement in performance compared to the benchmark model YOLOv8s. The F1, mAP50, and mAP75 metrics improved by 1.2%, 5.1%, 2.9% and 3.8%, 1.3%, 2.2%, respectively, on two publicly available datasets. Under significant performance improvements, the parameter count only increased by 1.16 M and the computational load increased by only 1.1 G, meeting the requirements for detection deployed on embedded devices with various real-time requirements.

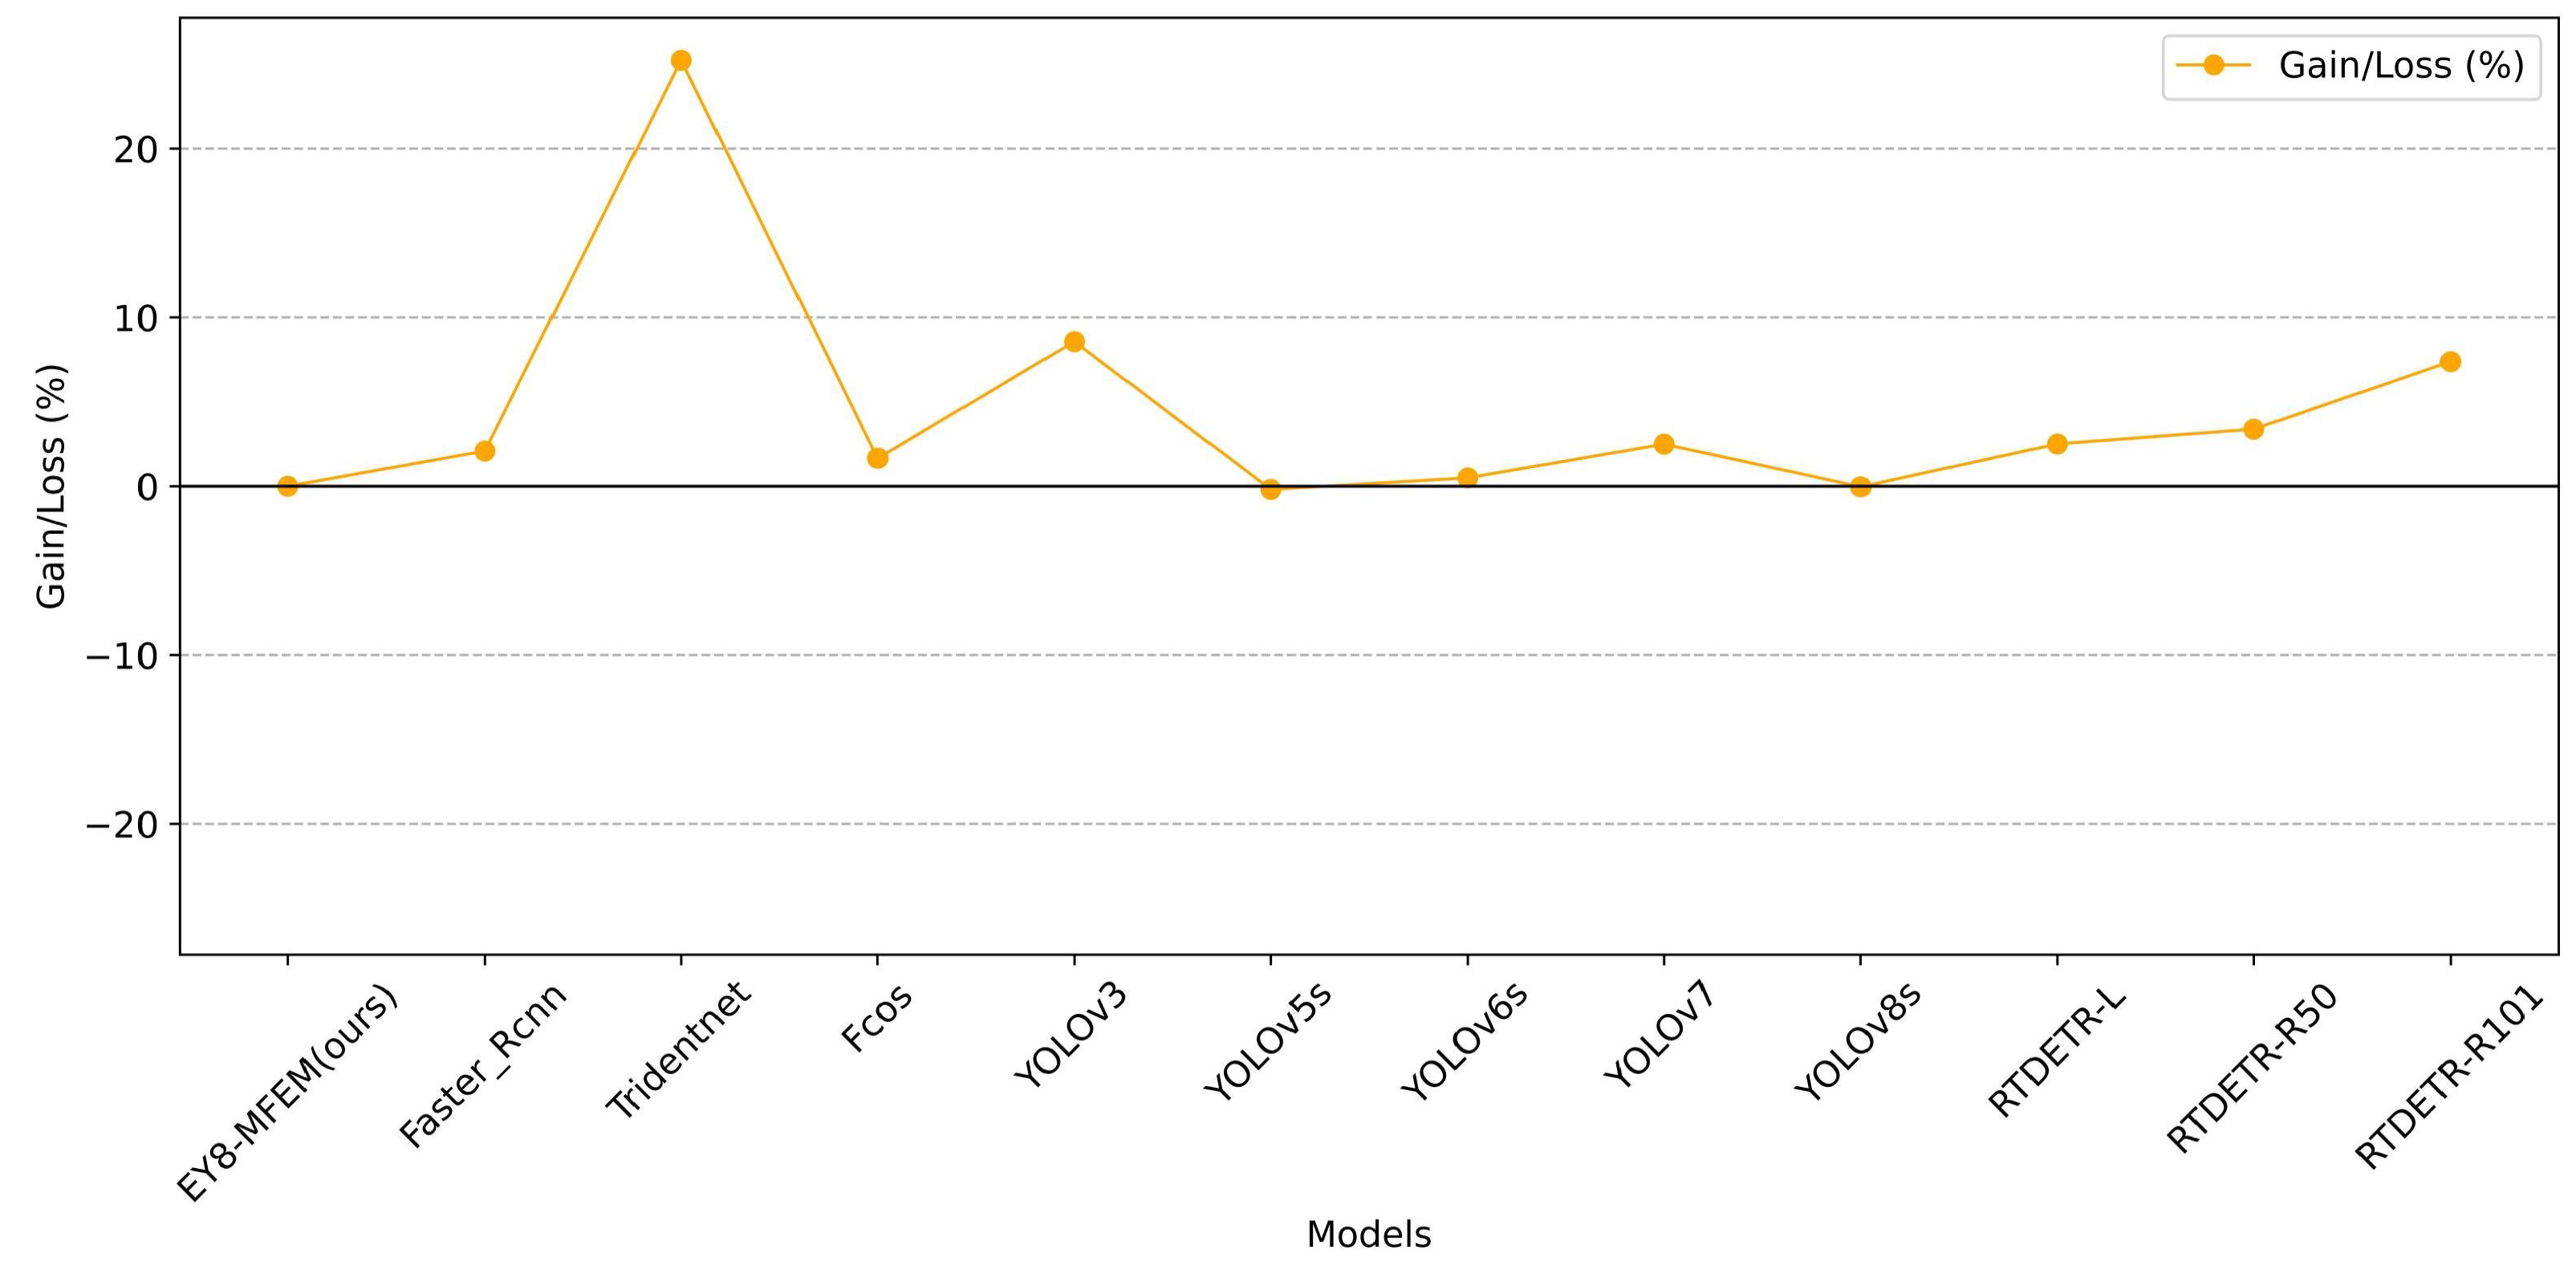
4.4. Compared with Other Methods
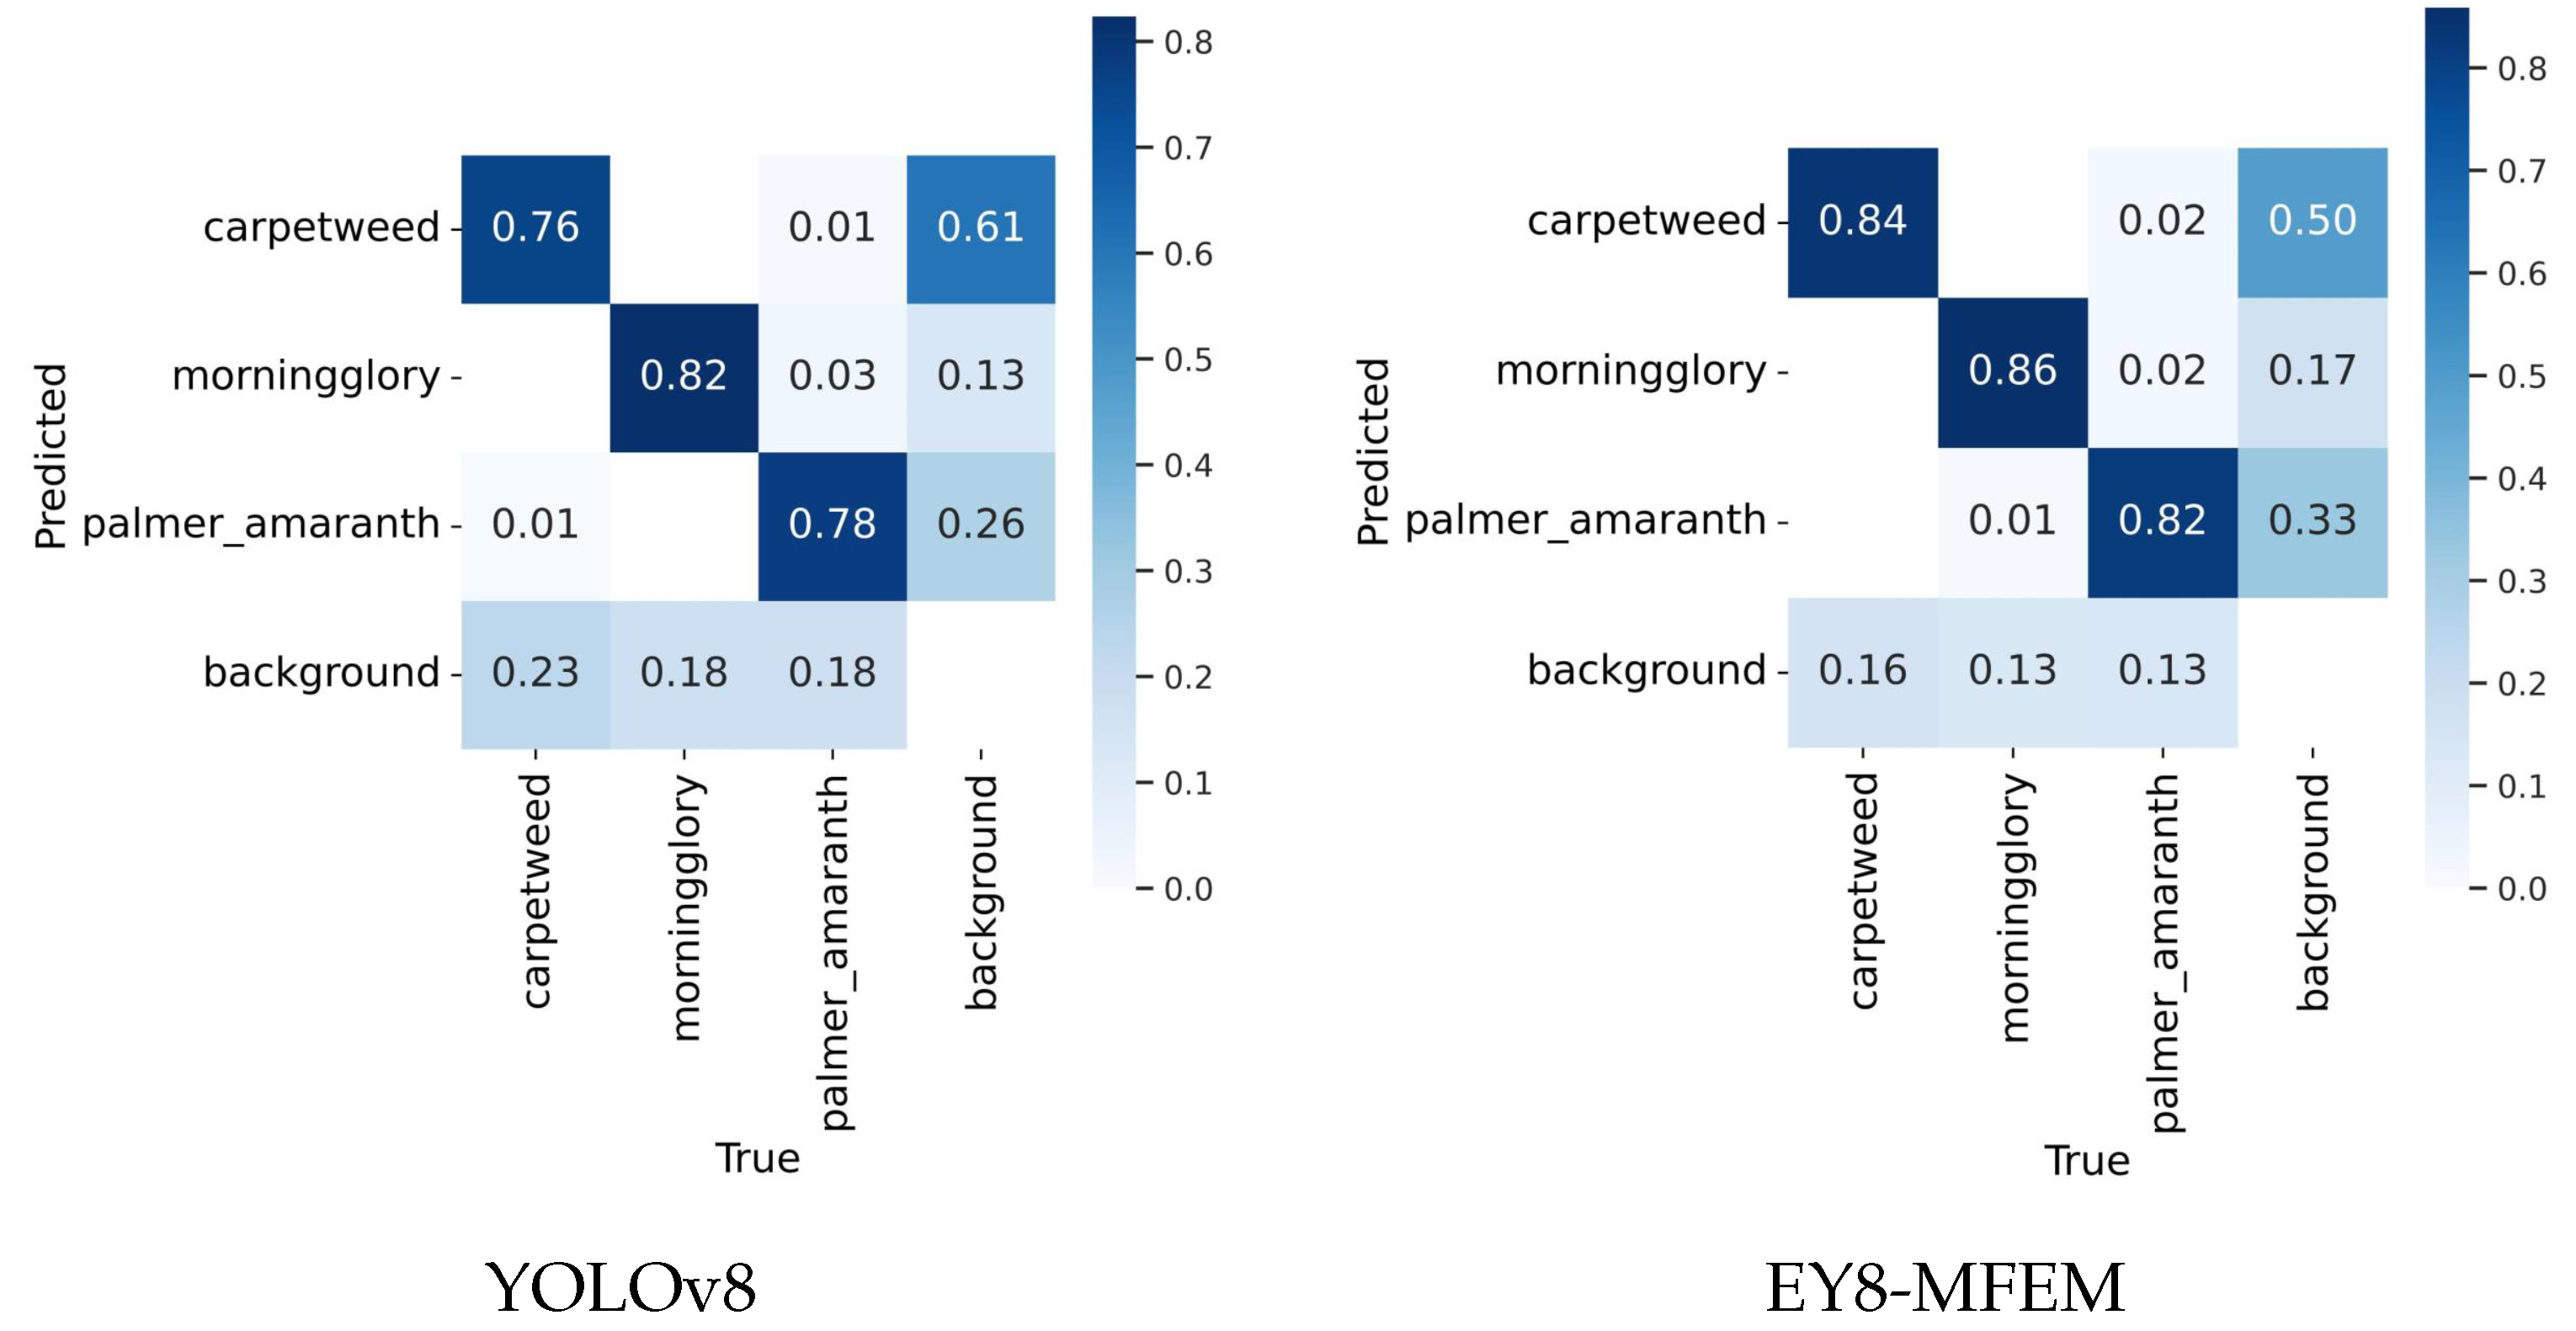
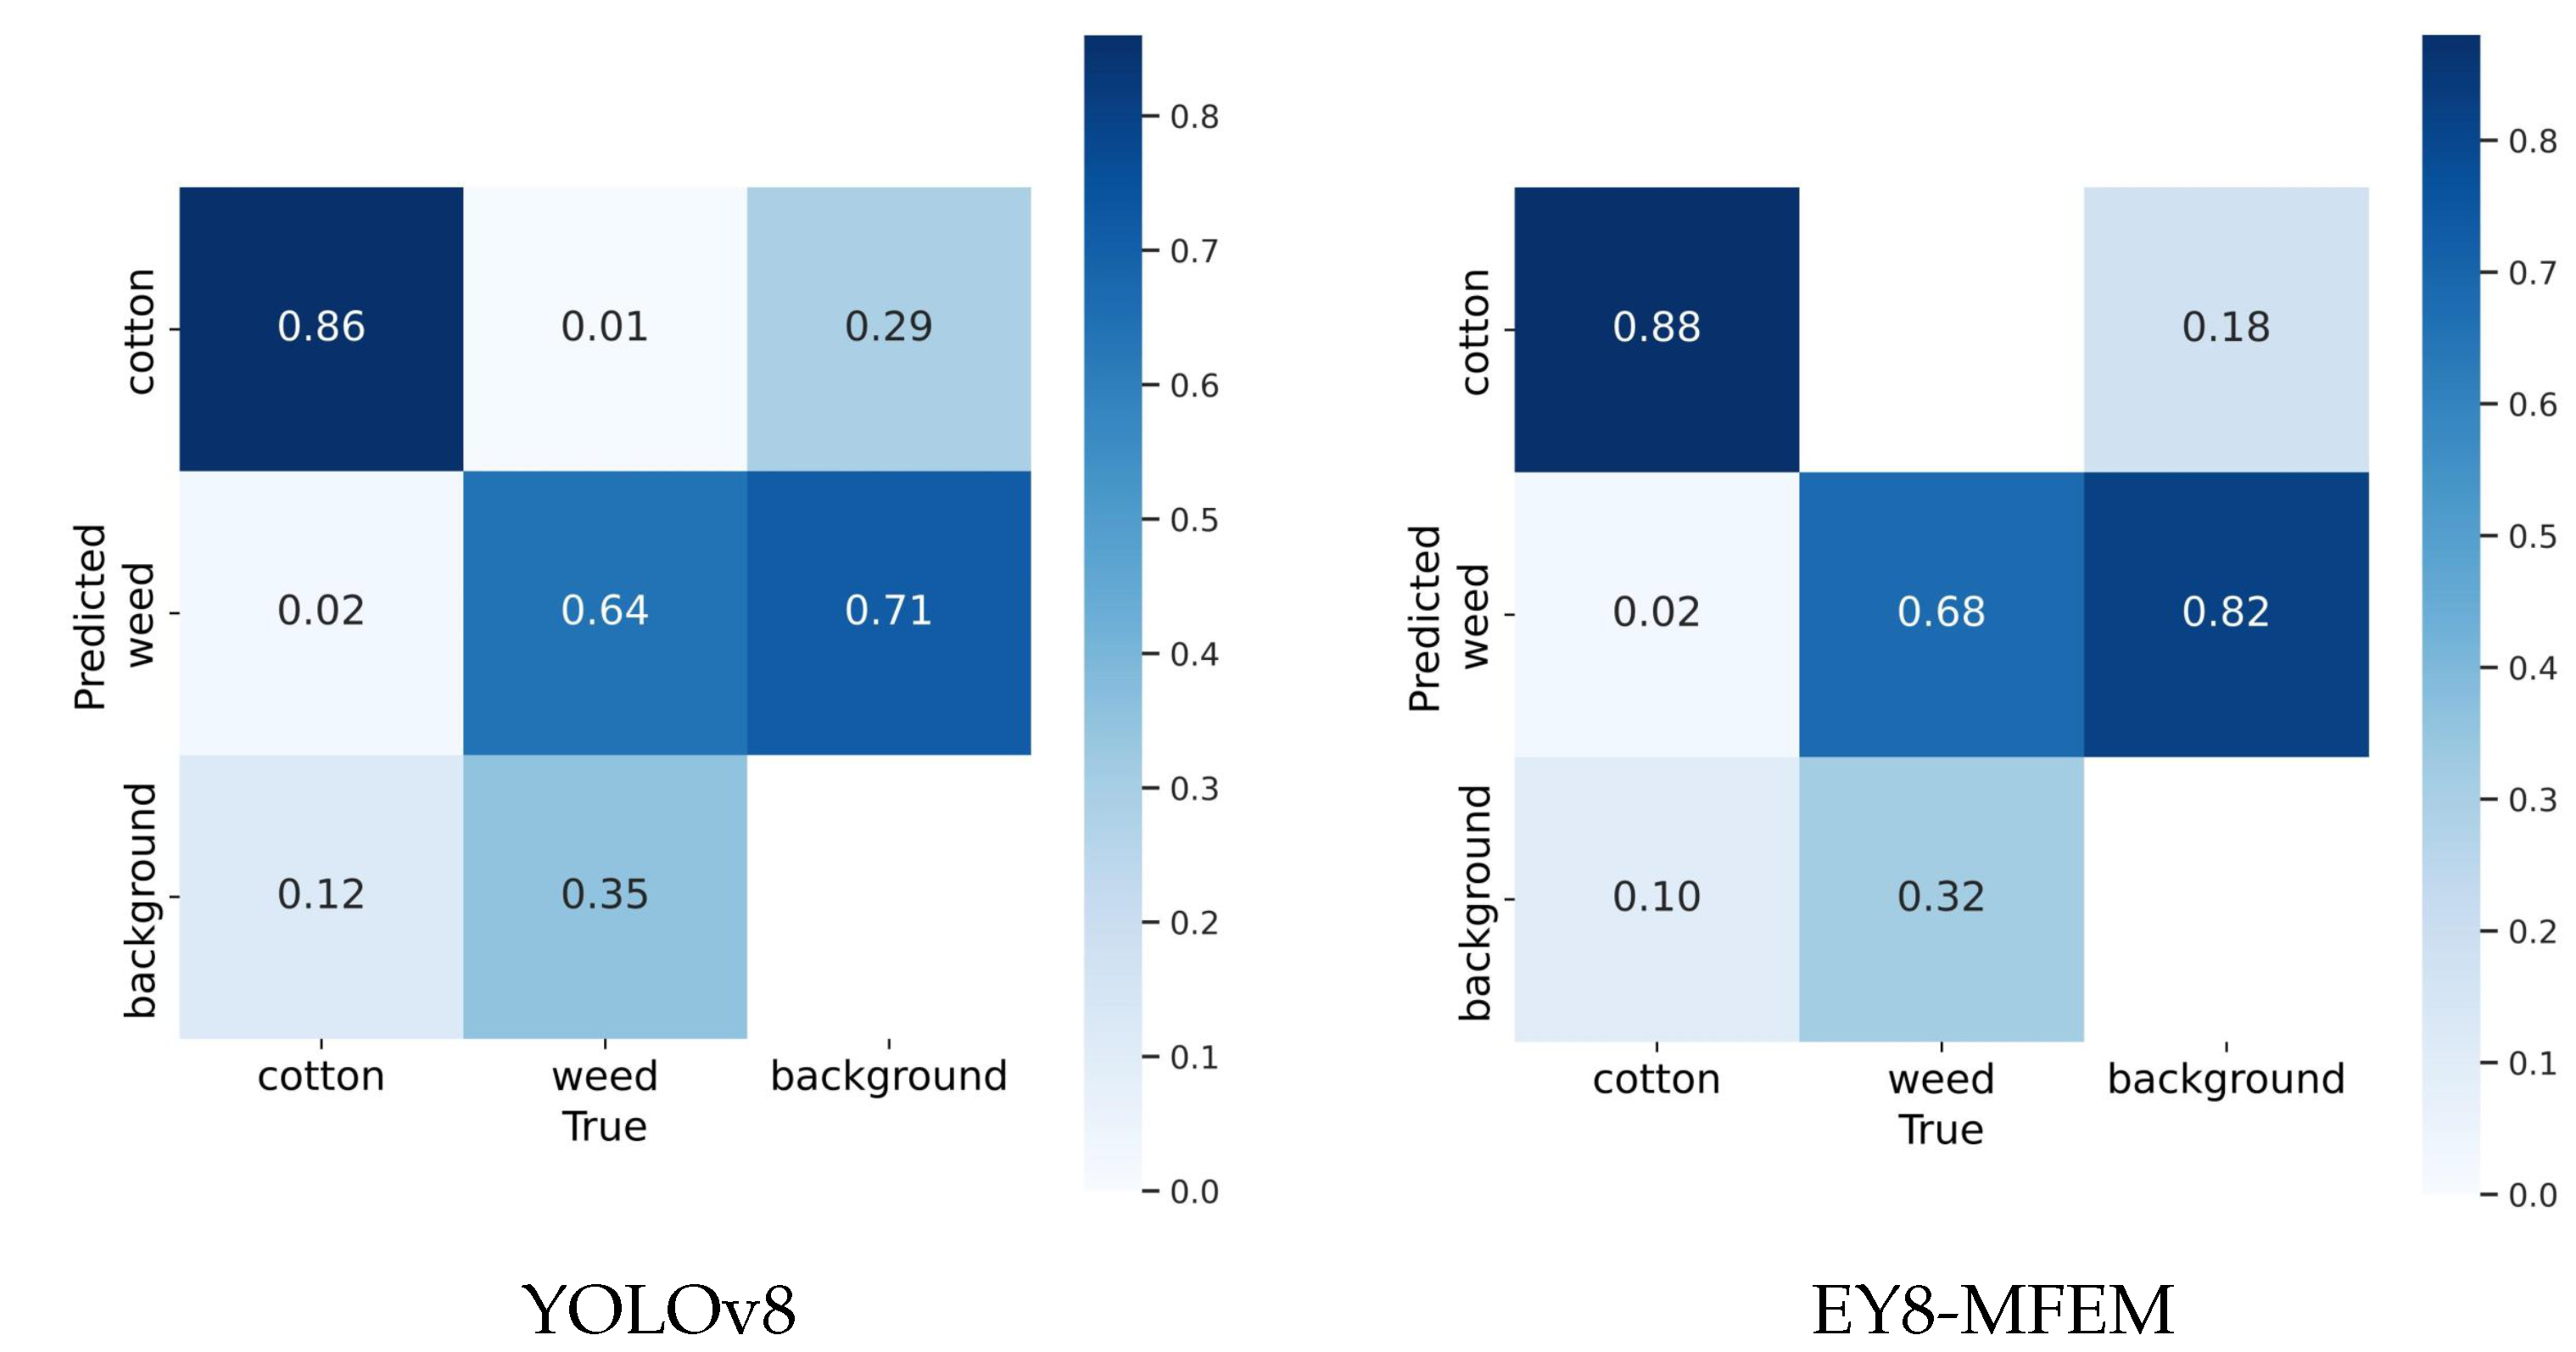
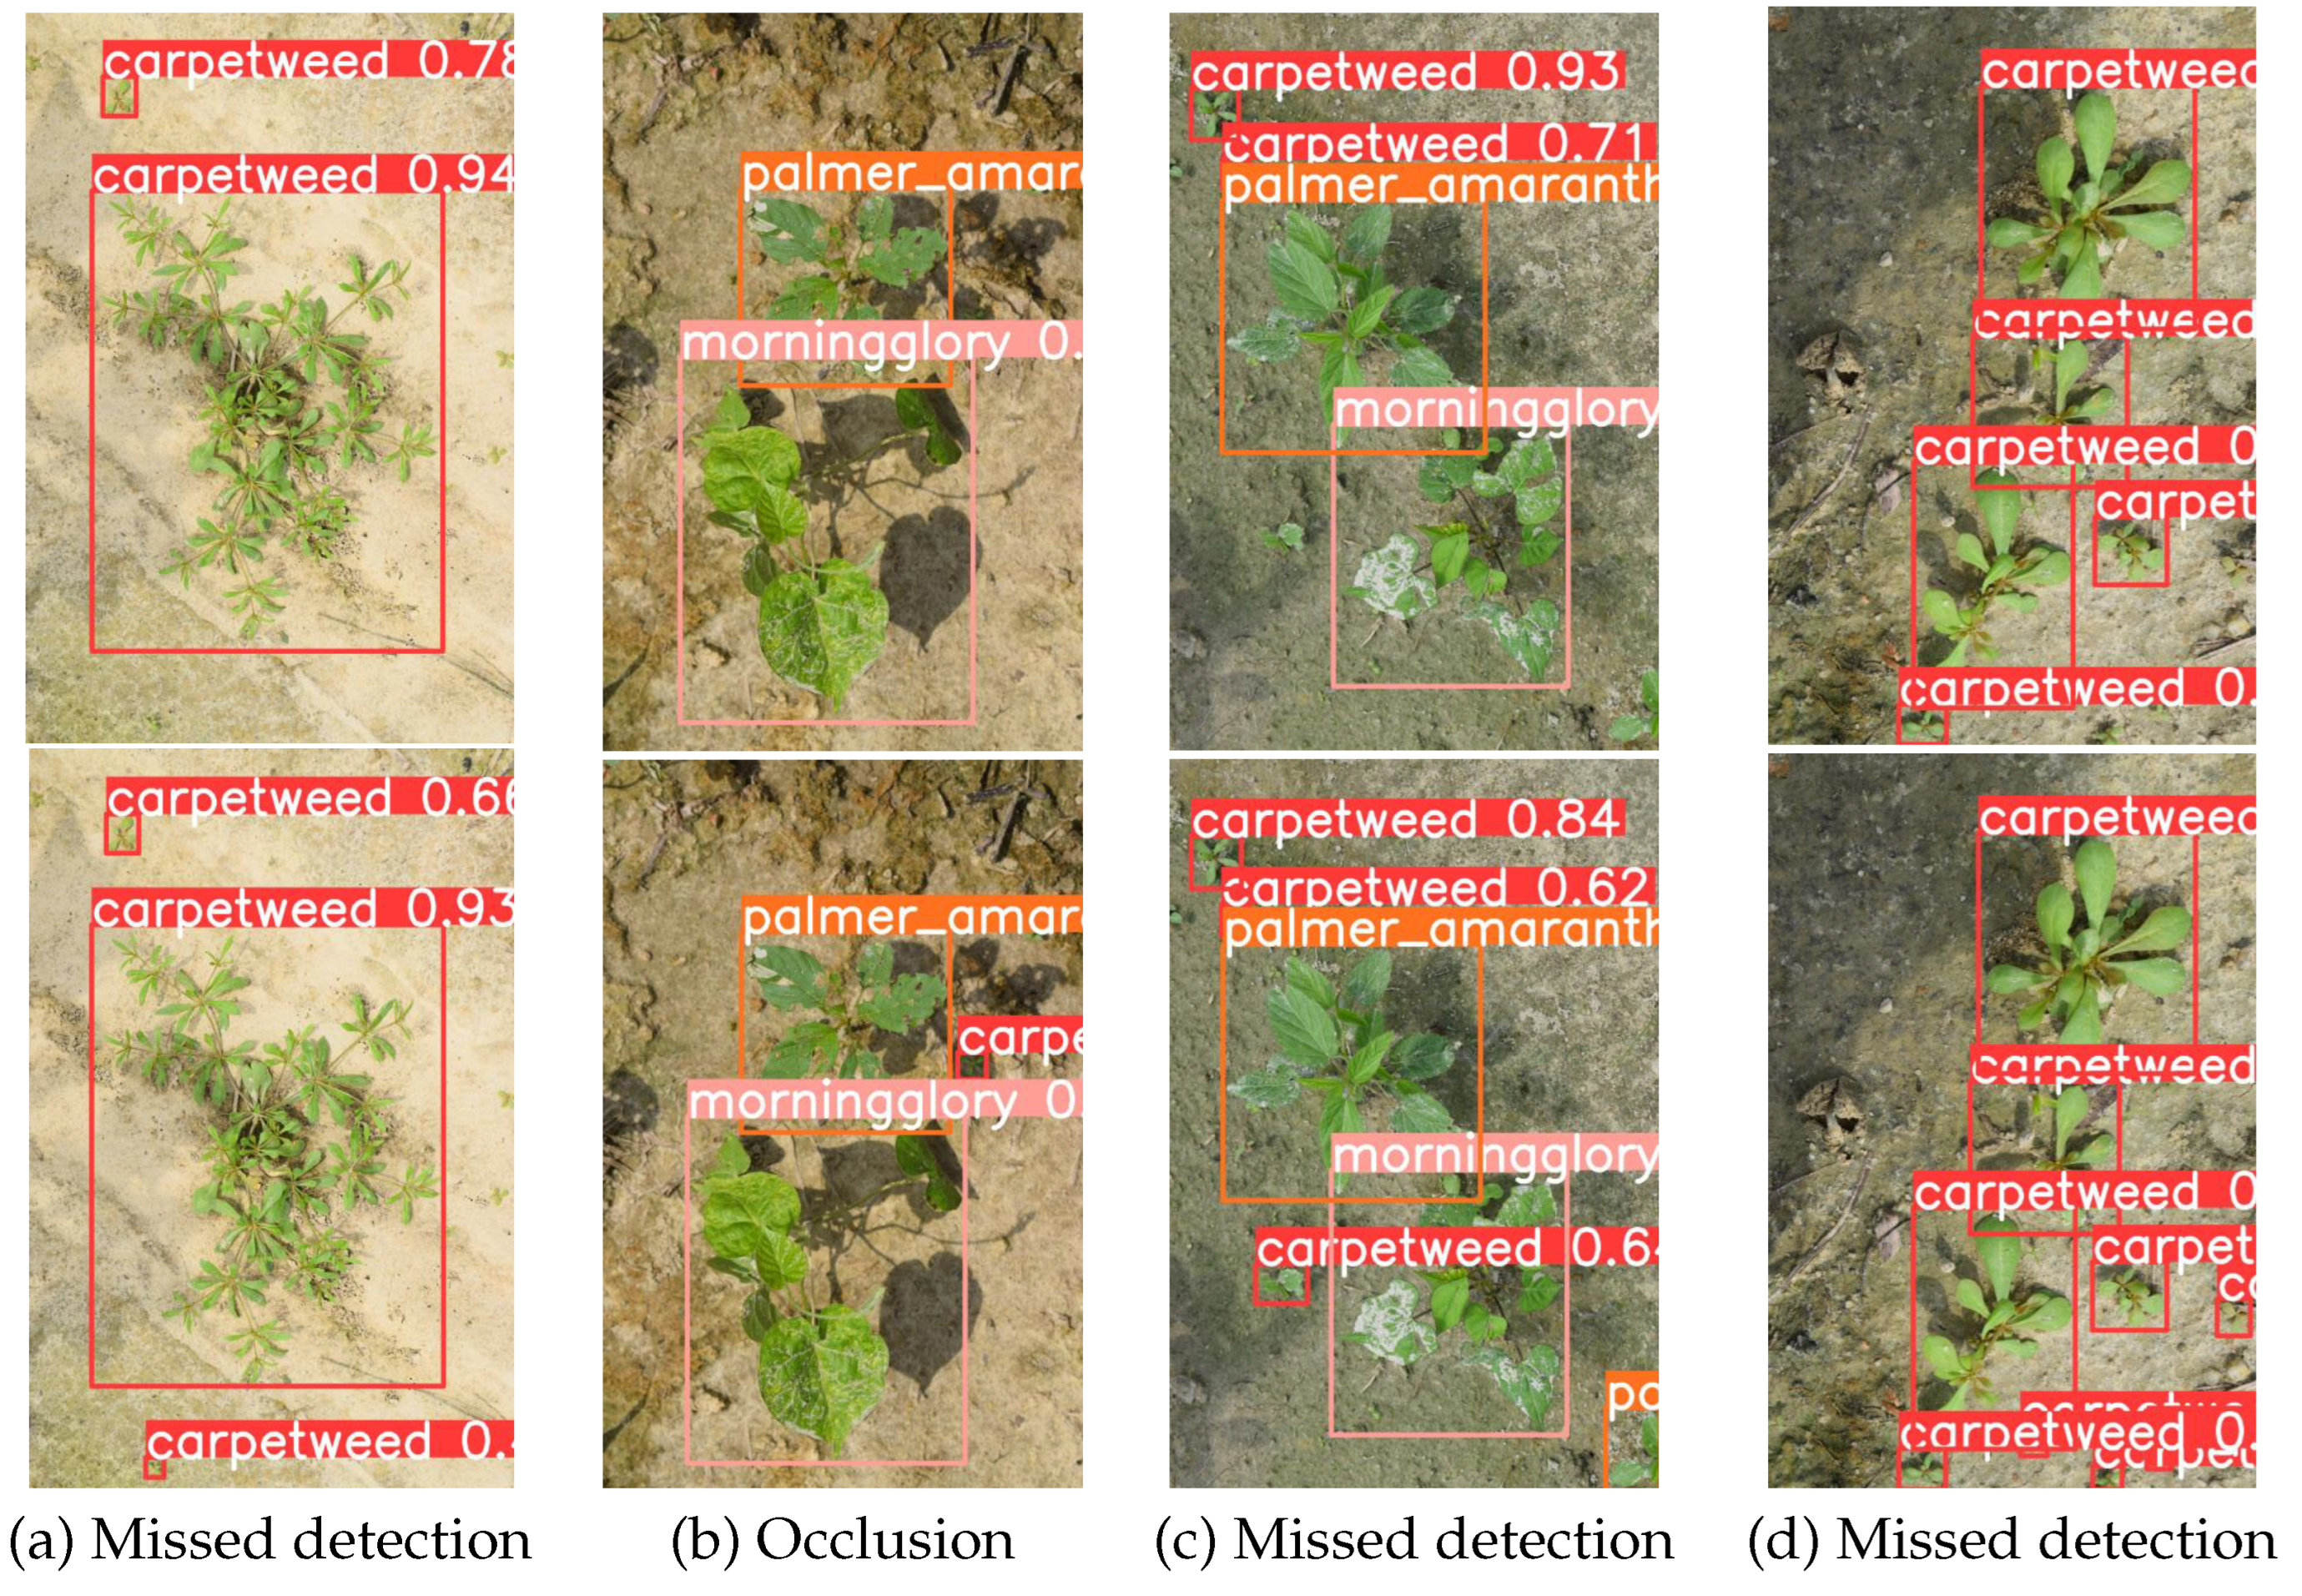
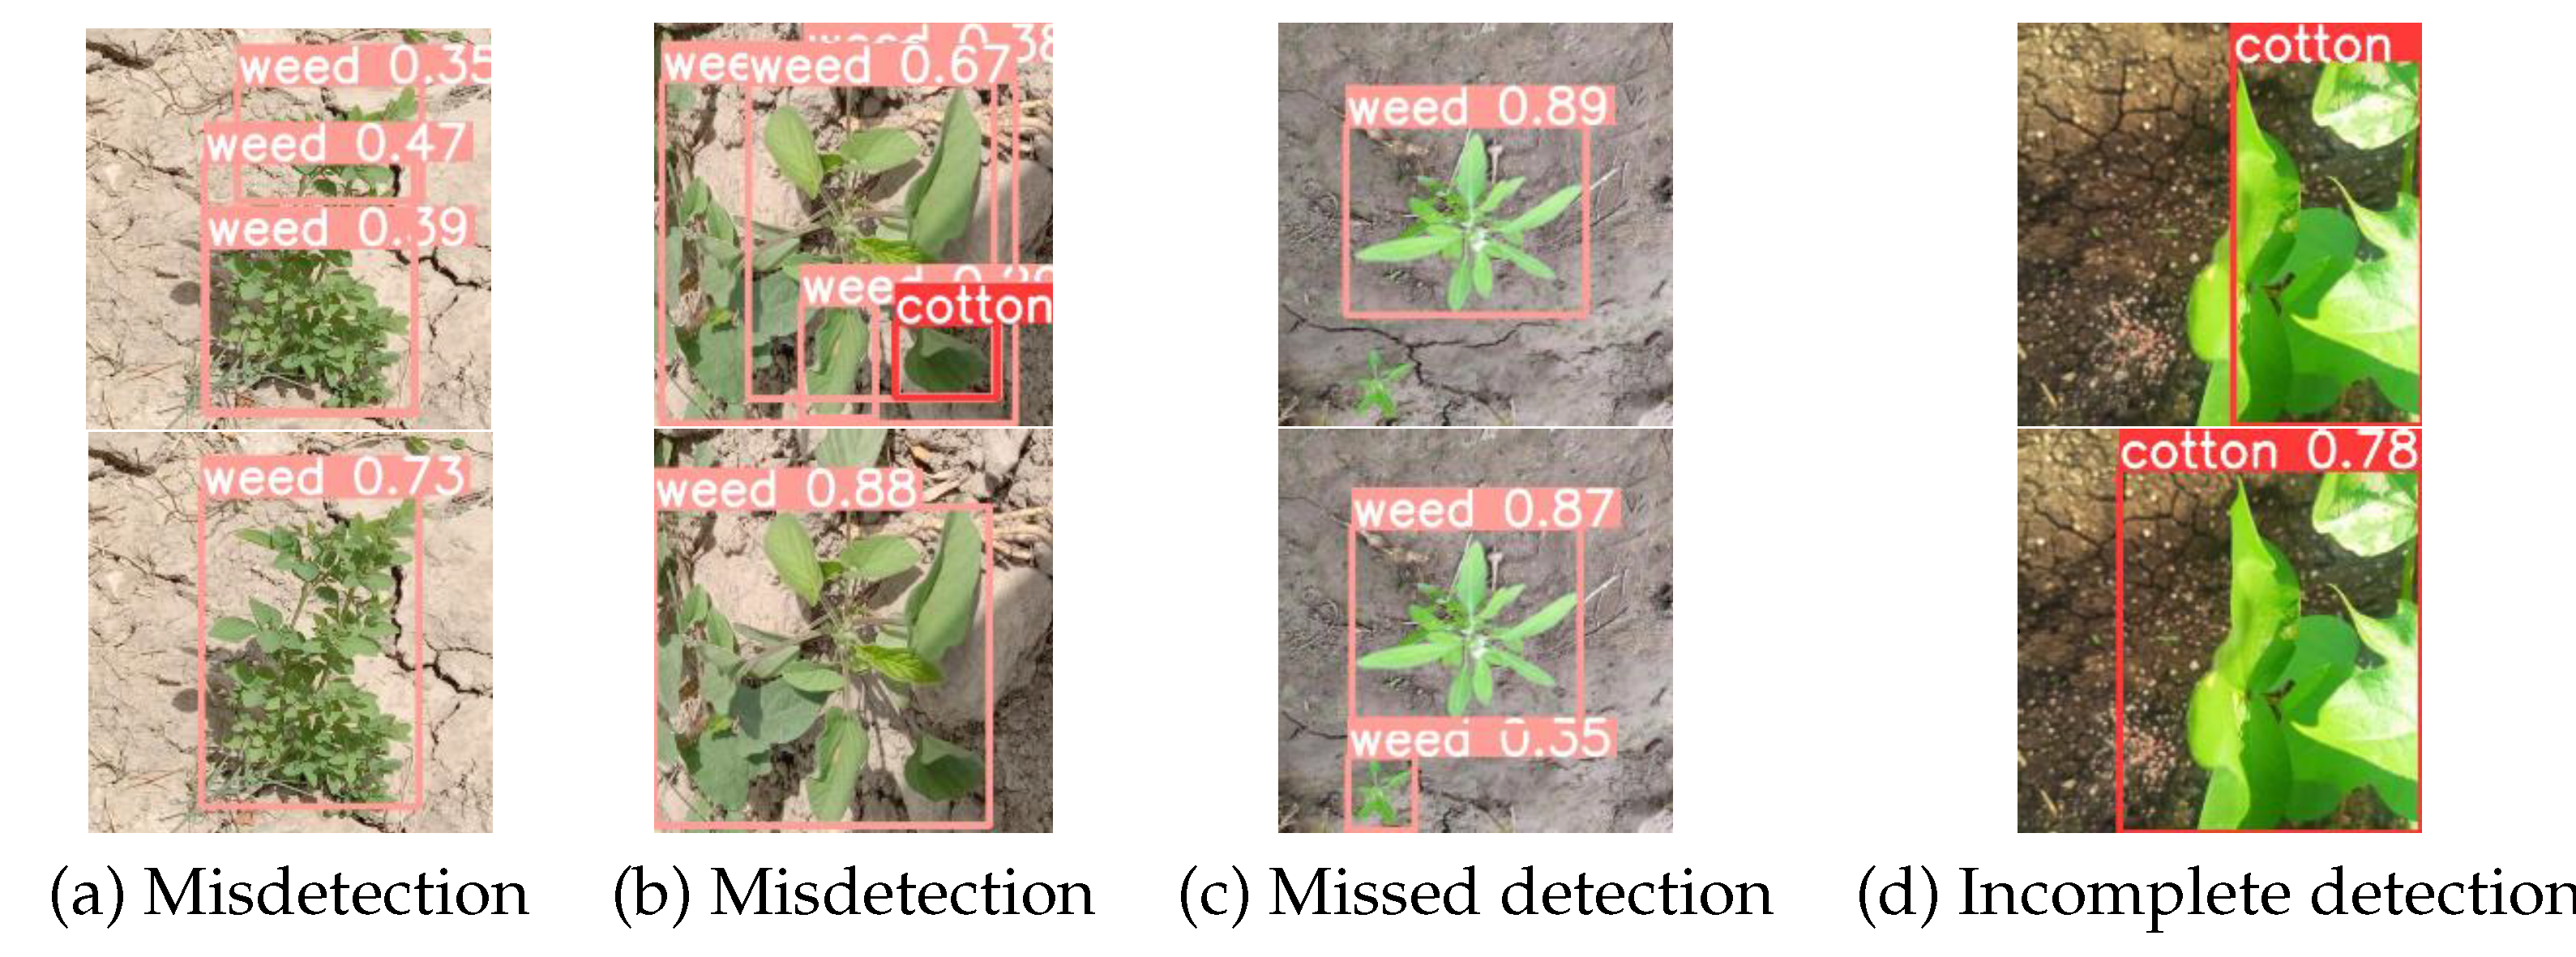
To holistically assess the performance of the enhanced model, we conducted comparisons between my EY8-MFEM and several other advanced models. These included representative models based on two-stage anchors, single-stage anchors, and anchor-free models. F1, mAP50, mAP75, parameter count, and computational complexity were our evaluation indicators. The comparison of experimental results can be referred to Table 5, Table 6, Table 7 and Table 8. The experimental results comparison allows for referencing Table 5 and Table 6. Also, we added a computational gain/consumption comparison to better understand the time complexity of the proposed technique, as shown in Figure 6.
As demonstrated in Table 5 and Table 7, our proposed EY8-MFEM has shown some improvement in all aspects compared to two-stage detection models such as Faster-Rcnn and Tridentnet. However, Table 6 and Table 8 show that these two-stage detection models have a very large computational and parameter load, making them unsuitable for deployment on lightweight devices for real-time detection. In Table 5, the metrics of EY8-MFEM are superior to those of the anchor-free box detection model Fcos. However, in Table 7, the recall and F1 of Fcos are superior to EY8-MFEM. We analyze that this is because different datasets have different characteristics such as target distribution and object scale, and the design of Fcos may make it more suitable for the characteristics of the dataset, resulting in higher recall rates on that dataset. In the comparison process of YOLO series models, we mainly selected model architectures with smaller versions of each model. Referring to Table 5, it is evident that the F1, mAP50, and mAP75 of EY8-MFEM perform better than previous versions of YOLO models with similar parameters and computational sizes. At the same time, we noticed that the various indicators of YOLOv7 are close to EY8-MFEM because we did not use the tiny version of YOLOv7. Table 6 illustrates that YOLOv7 encompasses approximately three times the number of parameters and computations when compared to EY8-MFEM. From Table 7, it can be seen that the mAP50 of YOLOv3 is 0.4% higher than that of EY8-MFEM, but the parameter count of YOLOv3 is approximately 8.5 times that of EY8-MFEM, indicating low computational efficiency. At the same time, it can be seen that the mAP50 of YOLOv5s and YOLOv6s are 1.6% and 0.2% higher than that of EY8-MFEM, respectively. However, their mAP75 is 4.2% and 0.5% lower than that of EY8-MFEM, indicating that EY8-MFEM has higher accuracy and robustness. Table 5 and Table 6 show that the RTDETR series models have 2–8 times more parameters and computational complexity than EY8-MFEM, and have not shown significant advantages in F1, mAP50, and mAP75. This is because the Transformer series models require a larger data size to better learn useful features. In terms of comparing model parameter quantity and computational complexity, while YOLOv5s and YOLOv8s surpass our model in Table 5 and Table 8, achieving our desired accuracy level remains challenging in the comparison between the two. In summary, our proposed EY8-MFEM model performs well in terms of parameter and computational complexity, achieving ideal levels. On two different datasets, the model demonstrated excellent performance, meeting the requirements of real-time and efficient weed detection on edge devices.
In order to better reflect the advantages of EY8-MFEM in terms of time complexity, we use EY8-MFEM as a baseline to calculate the computational gain/loss of other different models under the FLOPs metric relative to EY8-MFEM. In Figure 6, the lower the value of the curve, the more realistic it is. Although the computational performance of the YOLOv8s and YOLOv5s models is better than that of EY8-MFEM, with gain/loss values of 0.037 % and 0.193 % , respectively, EY8-MFEM is still more advantageous from the perspective of accuracy.

4.5. Visualization

To effectively showcase the performance of EY8-MFEM in weed detection, we use a confusion matrix to demonstrate its accuracy in classifying different categories. Given the variance in samples across different categories, normalizing the confusion matrix allows for a more precise assessment of the classification model’s effectiveness on each category. In the normalized confusion matrix, the rows correspond to predicted labels, while the columns represent true labels. Observing Figure 7 and Figure 8, it is apparent that the normalized results of the comprehensive confusion matrix show a significant improvement in EY8-MFEM compared to the YOLOv8 model on the CottonWeedDet3 dataset, especially in categories such as carpetweed, Morning Glory, and palmer amaranth, where the accuracy increases by 8%, 4%, and 4%, respectively. On the Cotton Weed dataset, improvements for the Cotton and Weed categories were 2% and 4%, respectively. These results strongly demonstrate the excellent performance of EY8-MFEM in weed detection tasks.
In real agricultural scenes, there are some small weed targets. YOLOv8 can easily detect some larger targets, but it is difficult to distinguish these small weed targets. However, EY8-MFEM, which has enhanced the ability to extract backbone features, can easily detect these small weed targets, as shown in the comparison images of groups (a), (c), and (d) in Figure 9 and (c) in Figure 10. Simultaneously, we observed that the YOLOv8 model encounters challenges in detecting weed targets obscured by page shadows, as shown in the comparison figure of Group (b) in Figure 9. When there are weed targets in leaf shadows, EY8-MFEM can also detect them well. This is attributed to our proposed C2F-ALGA module, which dynamically integrates local and global features, thereby enhancing the model’s ability to capture intricate local details and comprehensive global contextual information within the image. In Figure 10, Group (a) shows that when the weeds grow densely, YOLOv8 will recognize this as a whole as multiple individual weed plants; When the shape and texture of cotton and weeds are similar, traditional networks often find it difficult to distinguish these feature categories, resulting in false positives; The figure in (d) shows that when the picture of the cotton plant is incomplete, the YOLOv8 network cannot recognize the entire cotton plant because the morphology of weeds and crops is very similar in both horizontal and vertical directions. Our proposed MDPM can selectively extract and utilize the horizontal and vertical information in feature maps to enhance the model’s perception of spatial structure and directional features. The visualization results of the model illustrate the outstanding performance achieved by EY8-MFEM.

5. Conclusions and Future Work

5.1. Conclusions

This study presents an enhanced EY8-MFEM model, derived from the YOLOv8 model, to tackle the challenges of scale variation and occlusion encountered during the growth stages of crops and weeds in weed detection within cotton fields. Initially, we devised the ALGA module, which assigns weights to both local and global information within the feature map, generating an attention matrix that accentuates crucial information within the feature map. Through this approach, we can better focus on and utilize spatial information in feature maps. Next, we introduced the C2F-ALGA module to bolster the feature extraction prowess of the backbone network. This module dynamically merges local and global features, empowering the model to more effectively capture intricate local details and overarching contextual information within the image. Subsequently, to tackle the redundancy issue within the SPPF module’s fused feature map, we developed the MDPM module. This module selectively captures and leverages both horizontal and vertical information within the feature map, generating an attention matrix to heighten the model’s sensitivity to spatial arrangement and directional characteristics. Furthermore, the algorithm employs a lightweight CARAFE upsampling operator, which significantly mitigates the omission of crucial information and enhances the foundational feature representation capability. The experiments demonstrated that the enhanced model led to improvements in the mAP50 and mAP75 metrics by 5.1%, 2.9% and 1.3%, 2.2% on two public datasets, respectively, achieving scores of 82.3%, 69.7% and 77.7%, 55.6%, respectively. Compared with other mainstream algorithms, EY8-MFEM exhibits outstanding performance in both real-time processing demands and accuracy. In future research, for the complex and diverse cotton field environment, these datasets are still far from sufficient. We will collect more cotton field weed images, explore the design of lighter and more efficient models under low resource conditions, and develop a cotton field weed recognition and detection system for better deployment and application on edge devices with limited computing power.

5.2. Future Work

Although we have made some progress, there are some limitations in this study that require further improvement. Firstly, our model may not be able to accurately adapt to all situations when dealing with complex and diverse cotton field environments, leading to performance degradation due to the complexity of cotton field environments, which includes factors such as the growth characteristics of different plants, variations in light conditions, and the diversity of soil types. In the future, we will explore the use of cross-domain knowledge transfer techniques to introduce advanced methods and technologies from other domains into cotton field weed detection to improve the generalization and robustness of the model to adapt to a wider range of cotton field environments. Secondly, when using the CARAFE module, we observed that although increasing the kernel size of the content encoder can expand its perceptual range to utilize a wider range of contextual information, as the kernel size increases, the computational complexity also shows a square increase. In the future, we plan to explore the use of adaptive kernel size adjustment strategies to dynamically select the appropriate kernel size based on the characteristics of the input image. In addition, we will also study and apply model compression and optimization techniques such as pruning, distillation, sparsification, quantization, and low rank approximation to reduce the parameter and computational complexity of the CARAFE module, achieving the best balance between performance and efficiency. Finally, we will continue to develop a cotton field weed identification and detection system to better deploy and apply it on edge devices with limited computing power.

Author Contributions

Conceptualization, D.R.; methodology, D.R.; validation, D.R.; writing—original draft preparation, D.R.; writing—review and editing, D.R., W.Y. and D.C.; supervision, D.C., Z.L. and H.S.; funding acquisition, W.Y. All authors have read and agreed to the published version of the manuscript.

Funding

This research was funded by the National Key R & D Program of China (grant No. 2022ZD0115802), the Key Research and Development Program of the Autonomous Region (grant No. 2022B01008), the National Natural Science Foundation of China (grant No. 62262065), the Tianshan Science and Technology Innovation Leading talent Project of the Autonomous Region (grant No. 2022TSYCLJ0037).

Data Availability Statement

Data are contained within the article.

Conflicts of Interest

The authors declare no conflicts of interest.

References

  1. Kwaghtyo, D.K.; Eke, C.I. Smart farming prediction models for precision agriculture: A comprehensive survey. Artif. Intell. Rev. 2023, 56, 5729–5772. [Google Scholar] [CrossRef]
  2. Phang, S.K.; Chiang, T.H.A.; Happonen, A.; Chang, M.M.L. From Satellite to UAV-based Remote Sensing: A Review on Precision Agriculture. IEEE Access 2023, 11, 127057–127076. [Google Scholar] [CrossRef]
  3. Zhou, R.; Yin, Y. Digital agriculture: Mapping knowledge structure and trends. IEEE Access 2023, 11, 103863–103880. [Google Scholar] [CrossRef]
  4. Iqbal, N.; Manalil, S.; Chauhan, B.S.; Adkins, S.W. Investigation of alternate herbicides for effective weed management in glyphosate-tolerant cotton. Arch. Agron. Soil Sci. 2019, 65, 1885–1899. [Google Scholar] [CrossRef]
  5. Liu, B.; Bruch, R. Weed detection for selective spraying: A review. Curr. Robot. Rep. 2020, 1, 19–26. [Google Scholar] [CrossRef]
  6. Raja, R.; Slaughter, D.C.; Fennimore, S.A.; Siemens, M.C. Real-time control of high-resolution micro-jet sprayer integrated with machine vision for precision weed control. Biosyst. Eng. 2023, 228, 31–48. [Google Scholar] [CrossRef]
  7. Eide, A.; Koparan, C.; Zhang, Y.; Ostlie, M.; Howatt, K.; Sun, X. UAV-assisted thermal infrared and multispectral imaging of weed canopies for glyphosate resistance detection. Remote Sens. 2021, 13, 4606. [Google Scholar] [CrossRef]
  8. Chen, Y.; Wu, Z.; Zhao, B.; Fan, C.; Shi, S. Weed and corn seedling detection in field based on multi feature fusion and support vector machine. Sensors 2020, 21, 212. [Google Scholar] [CrossRef] [PubMed]
  9. Li, X.; Duan, F.; Hu, M.; Hua, J.; Du, X. Weed Density Detection Method Based on a High Weed Pressure Dataset and Improved PSP Net. IEEE Access 2023, 11, 98244–98255. [Google Scholar] [CrossRef]
  10. Moazzam, S.I.; Khan, U.S.; Qureshi, W.S.; Tiwana, M.I.; Rashid, N.; Alasmary, W.S.; Iqbal, J.; Hamza, A. A patch-image based classification approach for detection of weeds in sugar beet crop. IEEE Access 2021, 9, 121698–121715. [Google Scholar] [CrossRef]
  11. Wang, Q.; Cheng, M.; Huang, S.; Cai, Z.; Zhang, J.; Yuan, H. A deep learning approach incorporating YOLO v5 and attention mechanisms for field real-time detection of the invasive weed Solanum rostratum Dunal seedlings. Comput. Electron. Agric. 2022, 199, 107194. [Google Scholar] [CrossRef]
  12. Wang, B.; Yan, Y.; Lan, Y.; Wang, M.; Bian, Z. Accurate detection and precision spraying of corn and weeds using the improved YOLOv5 model. IEEE Access 2023, 11, 29868–29882. [Google Scholar] [CrossRef]
  13. Wan, D.; Lu, R.; Shen, S.; Xu, T.; Lang, X.; Ren, Z. Mixed local channel attention for object detection. Eng. Appl. Artif. Intell. 2023, 123, 106442. [Google Scholar] [CrossRef]
  14. Sheng, W.; Shen, J.; Huang, Q.; Liu, Z.; Lin, J.; Zhu, Q.; Zhou, L. Symmetry-Based Fusion Algorithm for Bone Age Detection with YOLOv5 and ResNet34. Symmetry 2023, 15, 1377. [Google Scholar] [CrossRef]
  15. Wang, J.; Chen, K.; Xu, R.; Liu, Z.; Loy, C.C.; Lin, D. Carafe: Content-aware reassembly of features. In Proceedings of the IEEE/CVF International Conference on Computer Vision, Seoul, Republic of Korea, 27 October–2 November 2019; pp. 3007–3016. [Google Scholar]
  16. Sheffield, K.J.; Clements, D.; Clune, D.J.; Constantine, A.; Dugdale, T.M. Detection of aquatic alligator weed (Alternanthera philoxeroides) from aerial imagery using random forest classification. Remote Sens. 2022, 14, 2674. [Google Scholar] [CrossRef]
  17. Naveed, A.; Muhammad, W.; Irshad, M.J.; Aslam, M.J.; Manzoor, S.M.; Kausar, T.; Lu, Y. Saliency-Based Semantic Weeds Detection and Classification Using UAV Multispectral Imaging. IEEE Access 2023, 11, 11991–12003. [Google Scholar] [CrossRef]
  18. Xu, B.; Fan, J.; Chao, J.; Arsenijevic, N.; Werle, R.; Zhang, Z. Instance segmentation method for weed detection using UAV imagery in soybean fields. Comput. Electron. Agric. 2023, 211, 107994. [Google Scholar] [CrossRef]
  19. Chen, J.; Wang, H.; Zhang, H.; Luo, T.; Wei, D.; Long, T.; Wang, Z. Weed detection in sesame fields using a YOLO model with an enhanced attention mechanism and feature fusion. Comput. Electron. Agric. 2022, 202, 107412. [Google Scholar] [CrossRef]
  20. Peng, H.; Li, Z.; Zhou, Z.; Shao, Y. Weed detection in paddy field using an improved RetinaNet network. Comput. Electron. Agric. 2022, 199, 107179. [Google Scholar] [CrossRef]
  21. Arsa, D.M.S.; Ilyas, T.; Park, S.H.; Won, O.; Kim, H. Eco-friendly weeding through precise detection of growing points via efficient multi-branch convolutional neural networks. Comput. Electron. Agric. 2023, 209, 107830. [Google Scholar] [CrossRef]
  22. Punithavathi, R.; Rani, A.D.C.; Sughashini, K.; Kurangi, C.; Nirmala, M.; Ahmed, H.F.T.; Balamurugan, S. Computer Vision and Deep Learning-enabled Weed Detection Model for Precision Agriculture. Comput. Syst. Sci. Eng. 2023, 44, 2759–2774. [Google Scholar] [CrossRef]
  23. Redmon, J.; Divvala, S.; Girshick, R.; Farhadi, A. You only look once: Unified, real-time object detection. In Proceedings of the IEEE Conference on Computer Vision and Pattern Recognition, Las Vegas, NV, USA, 26 June–1 July 2016; pp. 779–788. [Google Scholar]
  24. Redmon, J.; Farhadi, A. YOLO9000: Better, faster, stronger. In Proceedings of the IEEE Conference on Computer Vision and Pattern Recognition, Honolulu, HI, USA, 21–26 July 2017; pp. 7263–7271. [Google Scholar]
  25. Redmon, J.; Farhadi, A. Yolov3: An incremental improvement. arXiv 2018, arXiv:1804.02767. [Google Scholar]
  26. Bochkovskiy, A.; Wang, C.Y.; Liao, H.Y.M. Yolov4: Optimal speed and accuracy of object detection. arXiv 2020, arXiv:2004.10934. [Google Scholar]
  27. Jocher, G. Ultralytics YOLOv5. 2020. Available online: https://doi.org/10.5281/zenodo.3908559 (accessed on 16 March 2024).
  28. Li, C.; Li, L.; Jiang, H.; Weng, K.; Geng, Y.; Li, L.; Ke, Z.; Li, Q.; Cheng, M.; Nie, W.; et al. YOLOv6: A single-stage object detection framework for industrial applications. arXiv 2022, arXiv:2209.02976. [Google Scholar]
  29. Wang, C.Y.; Bochkovskiy, A.; Liao, H.Y.M. YOLOv7: Trainable bag-of-freebies sets new state-of-the-art for real-time object detectors. In Proceedings of the IEEE/CVF Conference on Computer Vision and Pattern Recognition, Vancouver, BC, Canada, 17–24 June 2023; pp. 7464–7475. [Google Scholar]
  30. Jocher, G.; Chaurasia, A.; Qiu, J. Ultralytics YOLOv8. 2023. Available online: https://github.com/ultralytics/ultralytics (accessed on 16 March 2024).
  31. Lau, K.W.; Po, L.M.; Rehman, Y.A.U. Large separable kernel attention: Rethinking the large kernel attention design in cnn. Expert Syst. Appl. 2024, 236, 121352. [Google Scholar] [CrossRef]
  32. Hassani, A.; Walton, S.; Li, J.; Li, S.; Shi, H. Neighborhood attention transformer. In Proceedings of the IEEE/CVF Conference on Computer Vision and Pattern Recognition, Vancouver, BC, Canada, 17–24 June 2023; pp. 6185–6194. [Google Scholar]
  33. Tan, C.; Gao, Z.; Wu, L.; Xu, Y.; Xia, J.; Li, S.; Li, S.Z. Temporal attention unit: Towards efficient spatiotemporal predictive learning. In Proceedings of the IEEE/CVF Conference on Computer Vision and Pattern Recognition, Vancouver, BC, Canada, 17–24 June 2023; pp. 18770–18782. [Google Scholar]
  34. Cao, Y.; Bin, J.; Hamari, J.; Blasch, E.; Liu, Z. Multimodal object detection by channel switching and spatial attention. In Proceedings of the IEEE/CVF Conference on Computer Vision and Pattern Recognition, Vancouver, BC, Canada, 17–24 June 2023; pp. 403–411. [Google Scholar]
  35. Ning, C.; Gan, H. Trap attention: Monocular depth estimation with manual traps. In Proceedings of the IEEE/CVF Conference on Computer Vision and Pattern Recognition, Vancouver, BC, Canada, 17–24 June 2023; pp. 5033–5043. [Google Scholar]
  36. Tang, Z.; Qiu, Z.; Hao, Y.; Hong, R.; Yao, T. 3D human pose estimation with spatio-temporal criss-cross attention. In Proceedings of the IEEE/CVF Conference on Computer Vision and Pattern Recognition, Vancouver, BC, Canada, 17–24 June 2023; pp. 4790–4799. [Google Scholar]
  37. Zhu, L.; Wang, X.; Ke, Z.; Zhang, W.; Lau, R.W. Biformer: Vision transformer with bi-level routing attention. In Proceedings of the IEEE/CVF Conference on Computer Vision and Pattern Recognition, Vancouver, BC, Canada, 17–24 June 2023; pp. 10323–10333. [Google Scholar]
  38. Wang, Q.; Wu, B.; Zhu, P.; Li, P.; Zuo, W.; Hu, Q. ECA-Net: Efficient channel attention for deep convolutional neural networks. In Proceedings of the IEEE/CVF Conference on Computer Vision and Pattern Recognition, Seattle, WA, USA, 13–19 June 2020; pp. 11534–11542. [Google Scholar]
  39. Hu, J.; Shen, L.; Sun, G. Squeeze-and-excitation networks. In Proceedings of the IEEE Conference on Computer Vision and Pattern Recognition, Salt Lake City, UT, USA, 18–23 June 2018; pp. 7132–7141. [Google Scholar]
  40. Rahman, A.; Lu, Y.; Wang, H. Deep Neural Networks for Weed Detections Towards Precision Weeding. In Proceedings of the 2022 ASABE Annual International Meeting. American Society of Agricultural and Biological Engineers, Houston, TX, USA, 17–20 July 2022. [Google Scholar]
  41. Kumaran, D.T. Cotton-Weed Dataset. 2021. Available online: https://universe.roboflow.com/deepak-kumaran-t/cotton-weed (accessed on 16 March 2024).
  42. Ren, S.; He, K.; Girshick, R.; Sun, J. Faster r-cnn: Towards real-time object detection with region proposal networks. Adv. Neural Inf. Process. Syst. 2015, 28, 1–9. [Google Scholar] [CrossRef] [PubMed]
  43. Li, Y.; Chen, Y.; Wang, N.; Zhang, Z. Scale-aware trident networks for object detection. In Proceedings of the IEEE/CVF International Conference on Computer Vision, Seoul, Republic of Korea, 27 October–2 November 2019; pp. 6054–6063. [Google Scholar]
  44. Tian, Z.; Chu, X.; Wang, X.; Wei, X.; Shen, C. Fully convolutional one-stage 3d object detection on lidar range images. Adv. Neural Inf. Process. Syst. 2022, 35, 34899–34911. [Google Scholar]
  45. Lv, W.; Xu, S.; Zhao, Y.; Wang, G.; Wei, J.; Cui, C.; Du, Y.; Dang, Q.; Liu, Y. Detrs beat yolos on real-time object detection. arXiv 2023, arXiv:2304.08069. [Google Scholar]
Figure 1. Overall structure diagram of EY8-MFEM.
Symmetry 16 00450 g001
Figure 2. ALGA structure diagram.
Symmetry 16 00450 g002
Figure 3. Overall structure diagram of C2F-ALGA.
Symmetry 16 00450 g003
Figure 4. Overall structure diagram of MDPM.
Symmetry 16 00450 g004
Figure 5. Overall structure diagram of CARAFE.
Symmetry 16 00450 g005
Figure 6. Comparison of gains/losses (%) of computational costs for different models.
Symmetry 16 00450 g006
Figure 7. Normalized Confusion Matrix for YOLOv8 and EY8-MFEM (CottonWeedDet3).
Symmetry 16 00450 g007
Figure 8. Normalized Confusion Matrix for YOLOv8 and EY8-MFEM (cotton-weed).
Symmetry 16 00450 g008
Figure 9. Visualization of YOLOv8 (top) and EY8-MFEM (bottom) on CottonWeedDet3.
Symmetry 16 00450 g009
Figure 10. Visualization of YOLOv8 (top) and EY8-MFEM (bottom) on cotton-weed.
Symmetry 16 00450 g010
Table 1. Experimental platform settings.
AttributeValue
OSUbuntu 18.04.6 LTS
GPUNVIDIA A40
Driver Version for A40460.106.00
CUDA Version11.2
Deep Learning FrameworkPytorch 2.0.1
Torchvision Version0.15.2
Table 2. Experimental training settings.
AttributeValue
lr00.01
lrf0.01
momentum0.937
weight_decay0.0005
optimizerSGD
epoch110
batchsize16
Table 3. Ablation experiments on the CottonWeedDet3 dataset.
YOLOv8sC2F-ALGAMDPMCARAFEPRF1mAP50mAP75Params (M)FLOPs (G)
   81.175.578.177.266.811.1228.4
  81.177.379.180.169.511.1228.4
  79.077.678.279.167.212.1929.3
  80.677.979.279.369.712.1928.6
 77.77777.380.266.612.1929.3
 83.377.680.381.769.612.2829.5
 86.270.477.580.570.012.2829.5
81.677.279.282.369.712.2829.5
Table 4. Ablation experiments on the cotton-weed dataset.
YOLOv8sC2F-ALGAMDPMCARAFEPRF1mAP50mAP75Params (M)FLOPs (G)
   84.167.274.776.353.411.1228.4
  83.574.978.976.856.311.1228.4
  84.272.577.977.555.012.1929.3
  82.973.377.876.855.112.1928.6
 84.072.077.577.255.212.1929.3
 88.367.976.776.953.612.2829.5
 83.173.678.076.657.112.2829.5
87.871.178.577.655.612.2829.5
Table 5. Comparison of Accuracy on CottonWeedDet3.
MethodPRF1mAP50mAP75
Faster_Rcnn [42]67.779.272.978.163.3
Tridentnet [43]56.178.665.474.663.5
Fcos [44]75.256.464.465.642.2
YOLOv3 [25]78.768.673.375.363.4
YOLOv5s [27]82.570.676.177.261.3
YOLOv6s [28]76.272.674.377.661.2
YOLOv7 [29]82.980.681.781.369.8
YOLOv8s [30]81.175.578.177.266.8
RTDETR-L [45]86.975.380.678.868.2
RTDETR-R50 [45]79.671.575.373.659.9
RTDETR-R101 [45]82.470.475.974.159.2
EY8-MFEM (ours)81.677.279.382.369.7
Table 6. Performance comparison on CottonWeedDet3.
MethodSizeParams (M)FLOPs (G)
Faster_Rcnn [42]640 × 64041.3669.32
Tridentnet [43]640 × 64033.0776.3
Fcos [44]640 × 64032.1156.58
YOLOv3 [25]640 × 640103.66282.2
YOLOv5s [27]640 × 6409.1123.8
YOLOv6s [28]640 × 64016.2944.0
YOLOv7 [29]640 × 64036.49103.2
YOLOv8s [30]640 × 64011.1228.4
RTDETR-L [45]640 × 64031.99103.4
RTDETR-R50 [45]640 × 64041.96129.6
RTDETR-R101 [45]640 × 64074.66247.1
EY8-MFEM (ours)640 × 64012.2829.5
Table 7. Comparison of accuracy on cotton-weed.
MethodPRF1mAP50mAP75
Faster_Rcnn [42]54.077.263.572.952.2
Tridentnet [43]54.281.164.974.553.7
Fcos [44]87.071.878.675.350.9
YOLOv3 [25]83.271.576.978.054.5
YOLOv5s [27]80.371.075.379.251.4
YOLOv6s [28]85.369.276.477.855.1
YOLOv7 [29]77.672.174.774.945.2
YOLOv8s [30]84.167.274.776.353.4
RTDETR-L [45]86.274.079.677.857.0
RTDETR-R50 [45]91.762.674.475.553.7
RTDETR-R101 [45]85.265.173.873.053.1
EY8-MFEM (ours)87.871.178.577.655.6
Table 8. Performance comparison on cotton-weed.
MethodSizeParams (M)FLOPs (G)
Faster_Rcnn [42]640 × 64041.3690.91
Tridentnet [43]640 × 64033.0777.4
Fcos [44]640 × 64032.1178.59
YOLOv3 [25]640 × 640103.66282.2
YOLOv5s [27]640 × 6409.1123.8
YOLOv6s [28]640 × 64016.2944.0
YOLOv7 [29]640 × 64036.49103.2
YOLOv8s [30]640 × 64011.1228.4
RTDETR-L [45]640 × 64031.98103.4
RTDETR-R50 [45]640 × 64041.95129.5
RTDETR-R101 [45]640 × 64074.65247.1
EY8-MFEM (ours)640 × 64012.2829.5
Disclaimer/Publisher’s Note: The statements, opinions and data contained in all publications are solely those of the individual author(s) and contributor(s) and not of MDPI and/or the editor(s). MDPI and/or the editor(s) disclaim responsibility for any injury to people or property resulting from any ideas, methods, instructions or products referred to in the content.

