
Geometric Parameter Effects on Bandgap Characteristics of Periodic Pile Barriers in Passive Vibration Isolation

Abstract
:1. Introduction
2. Bandgap Calculation Method
2.1. Theoretical Framework
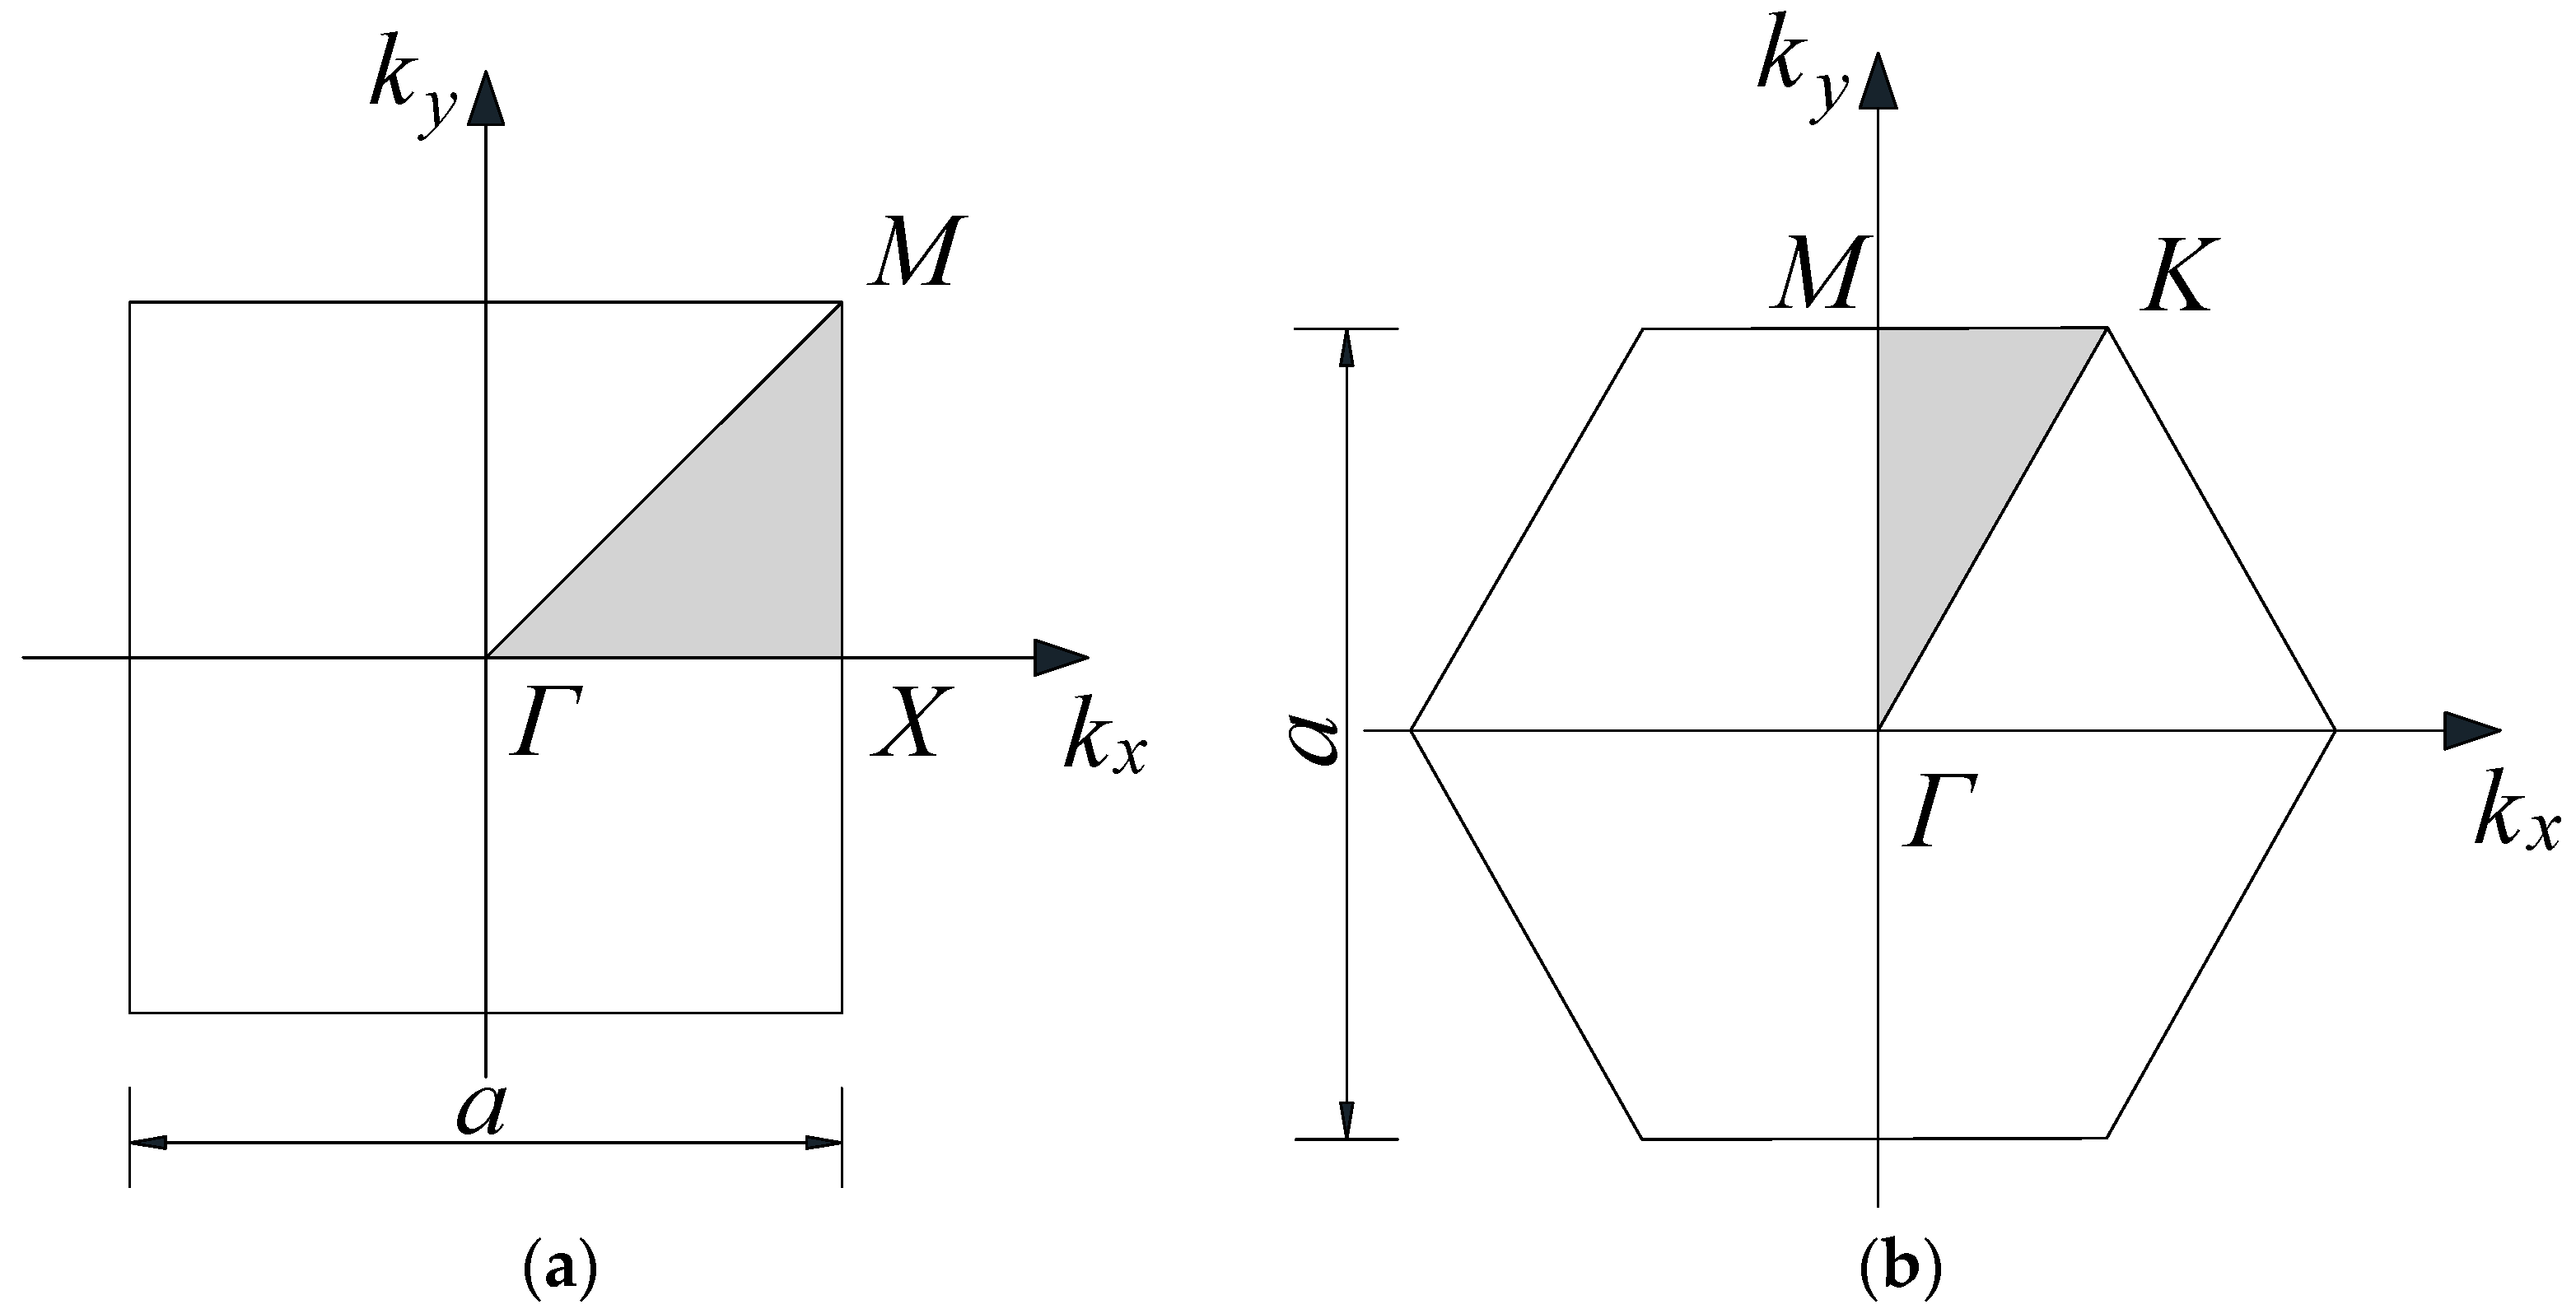
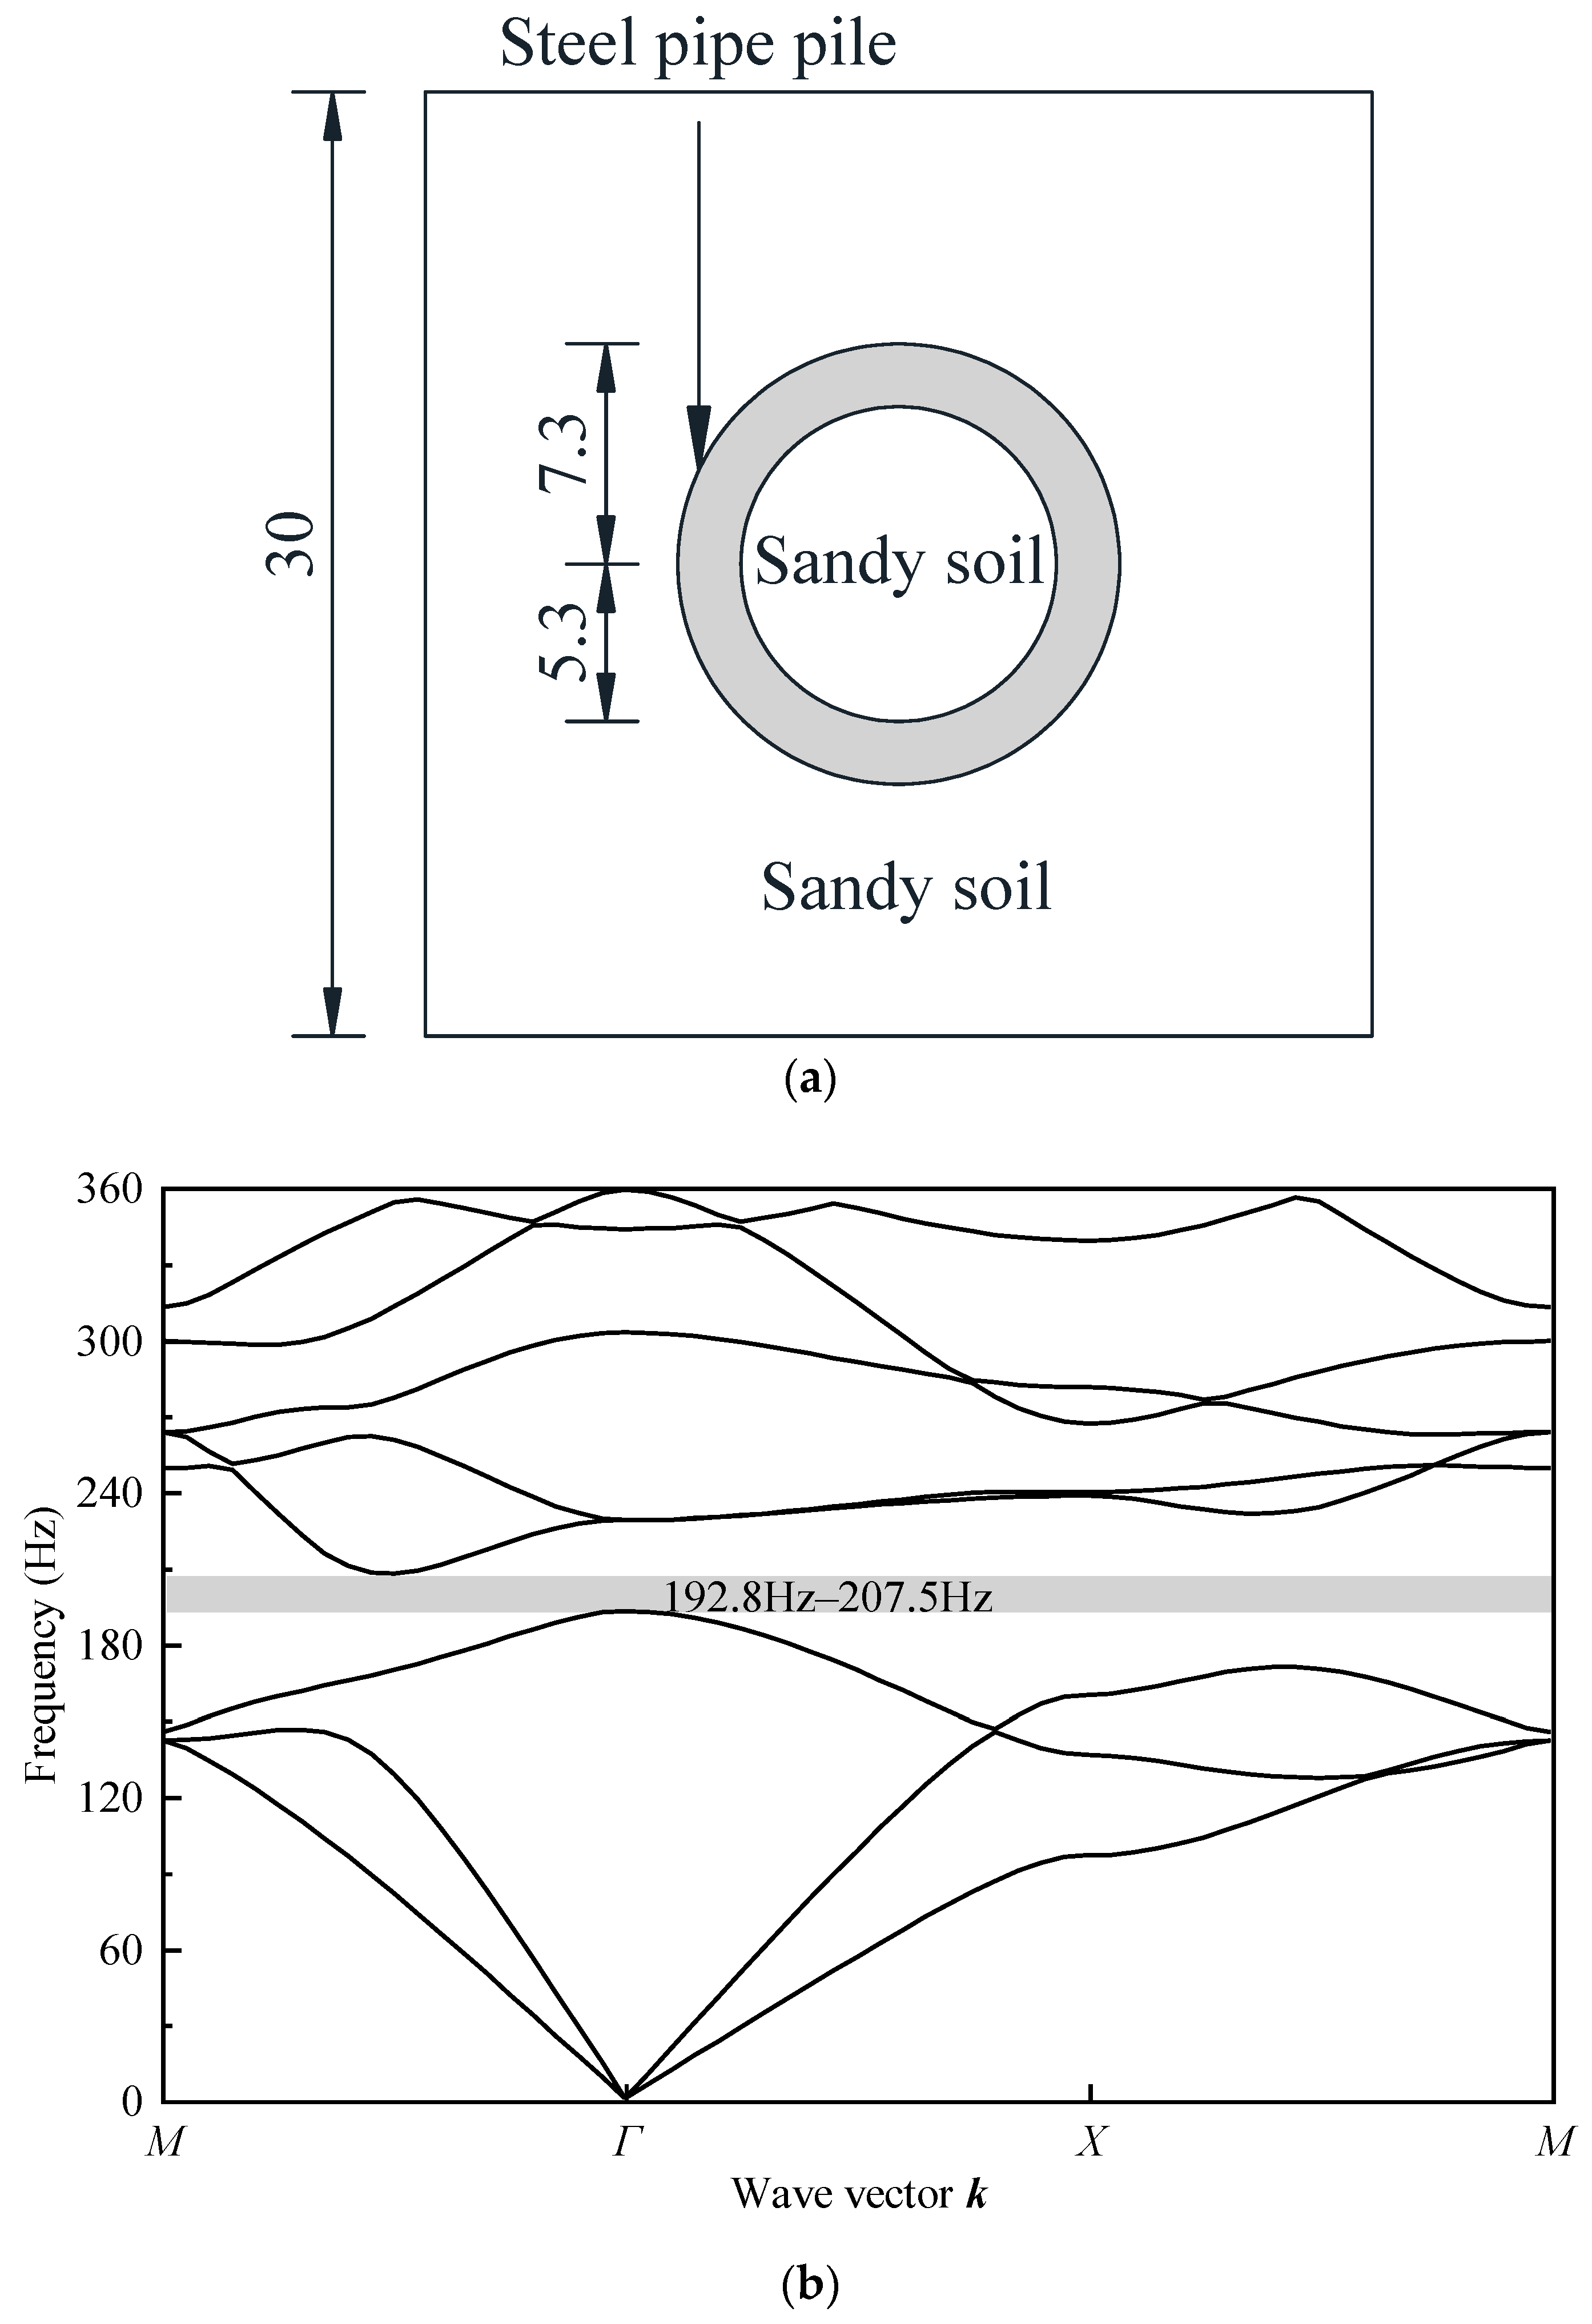
2.2. Bandgap Calculation
3. Model Test and Validation of FEM
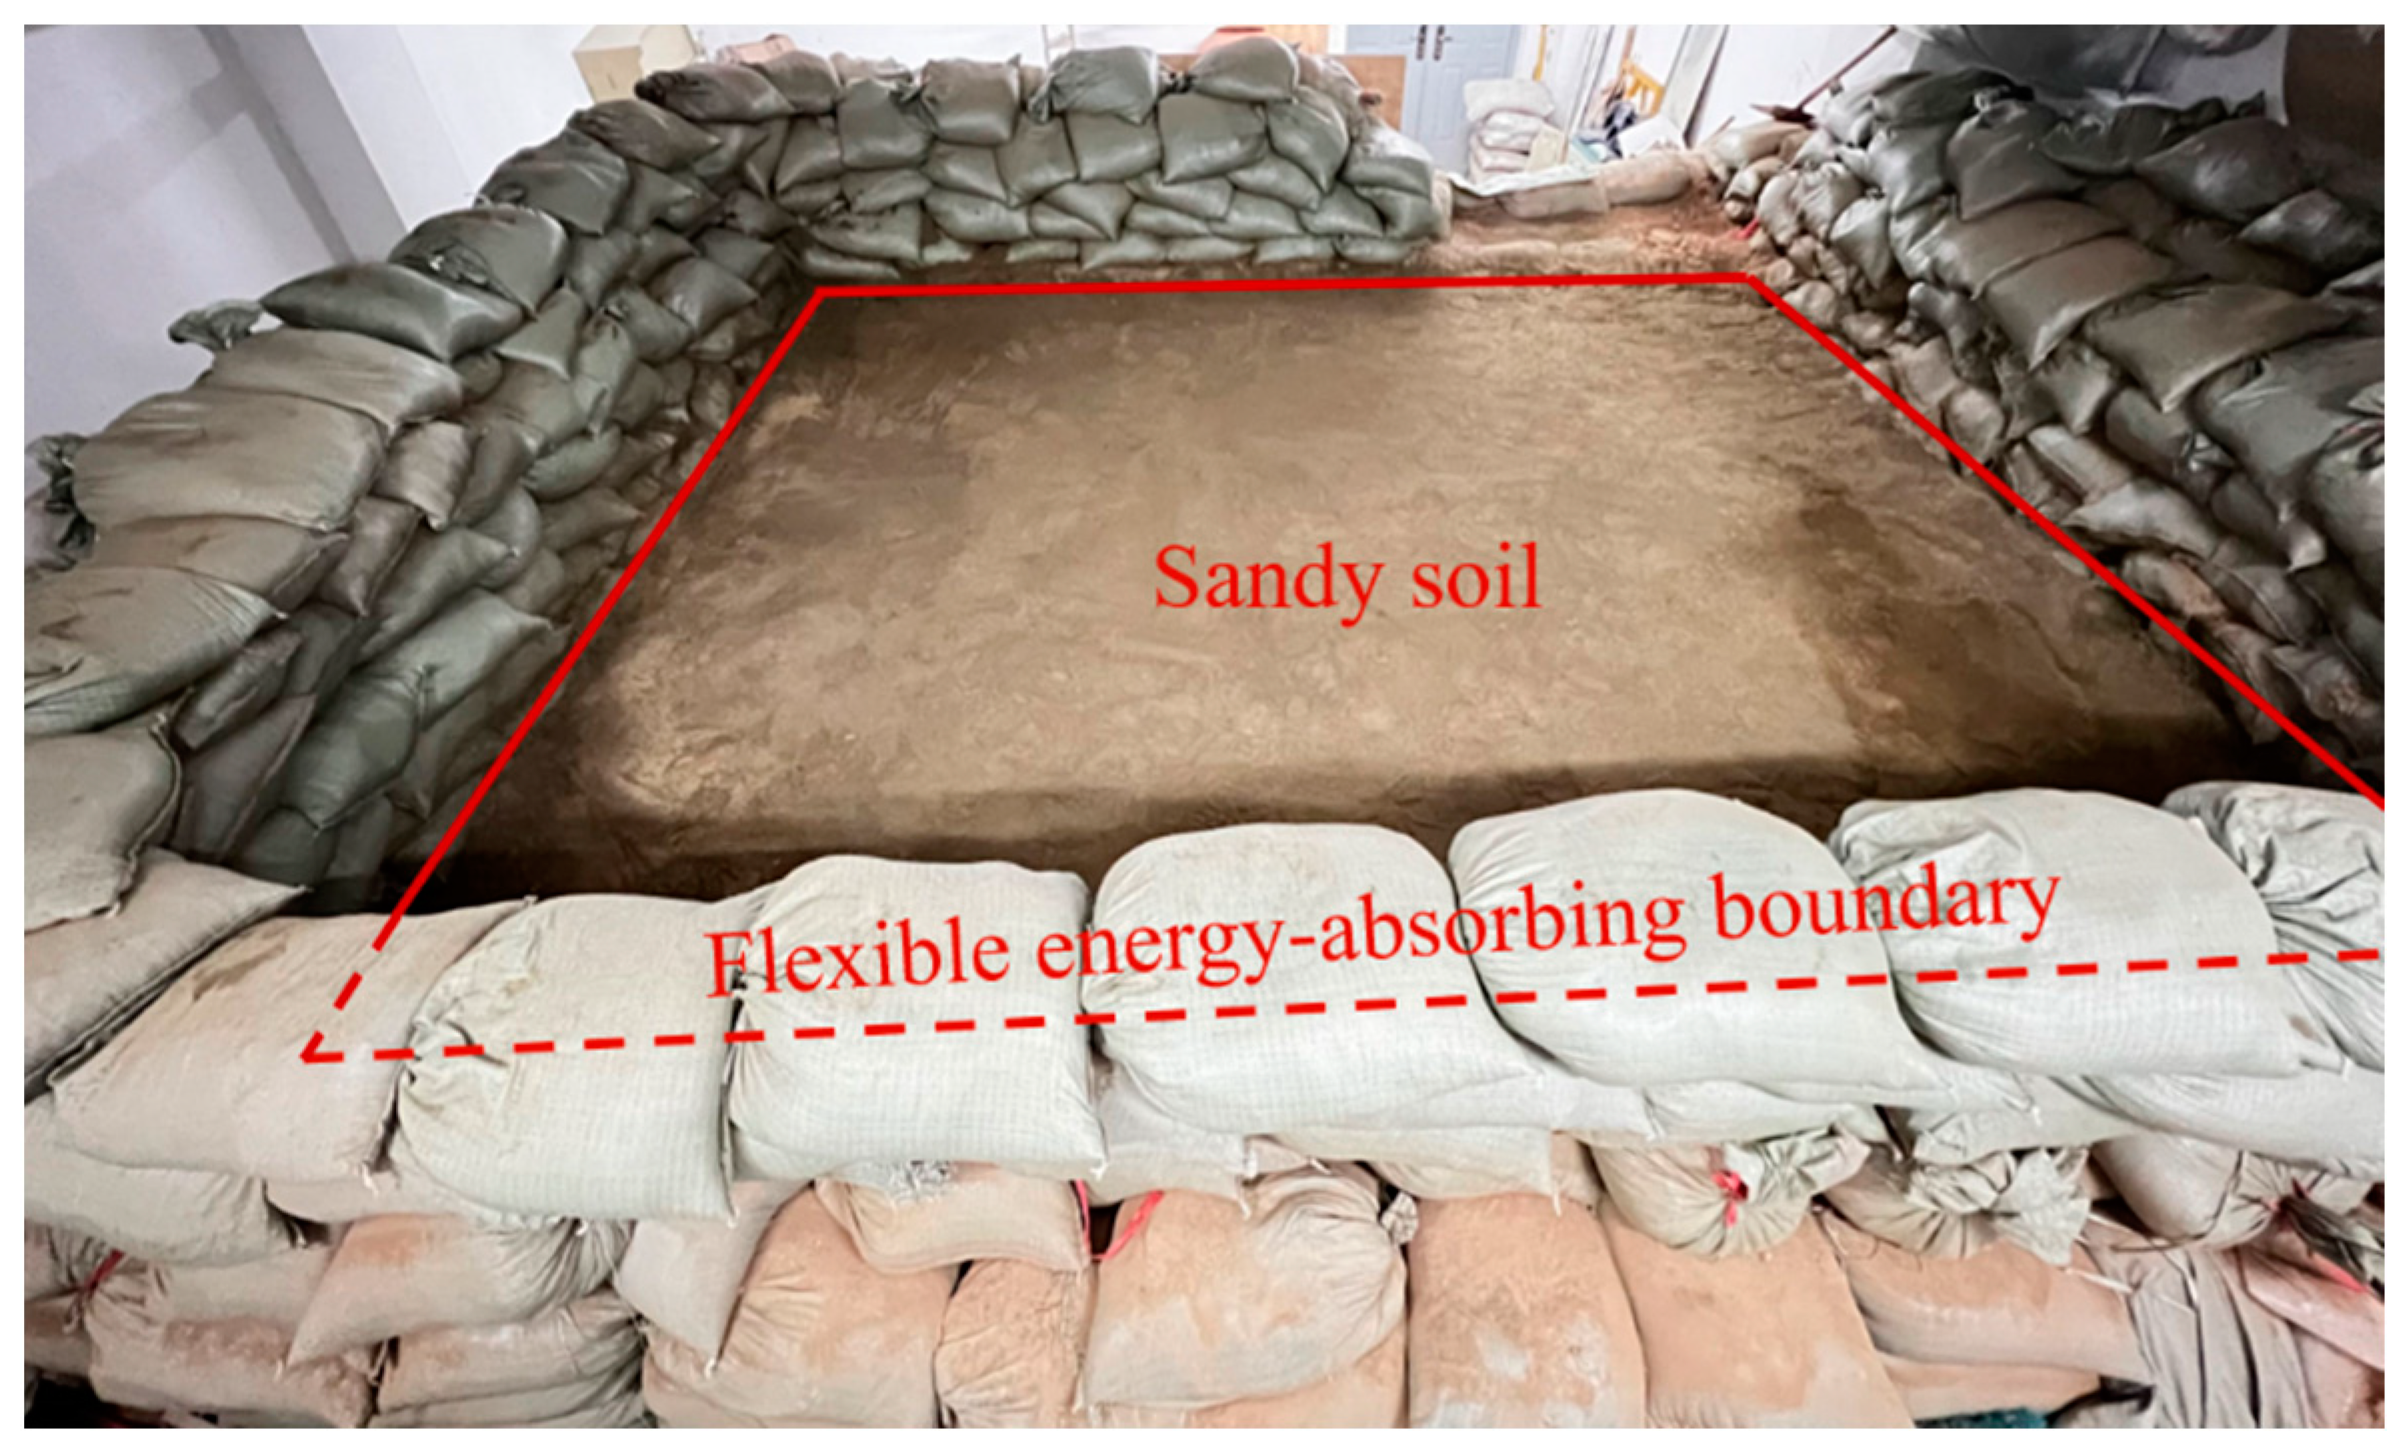
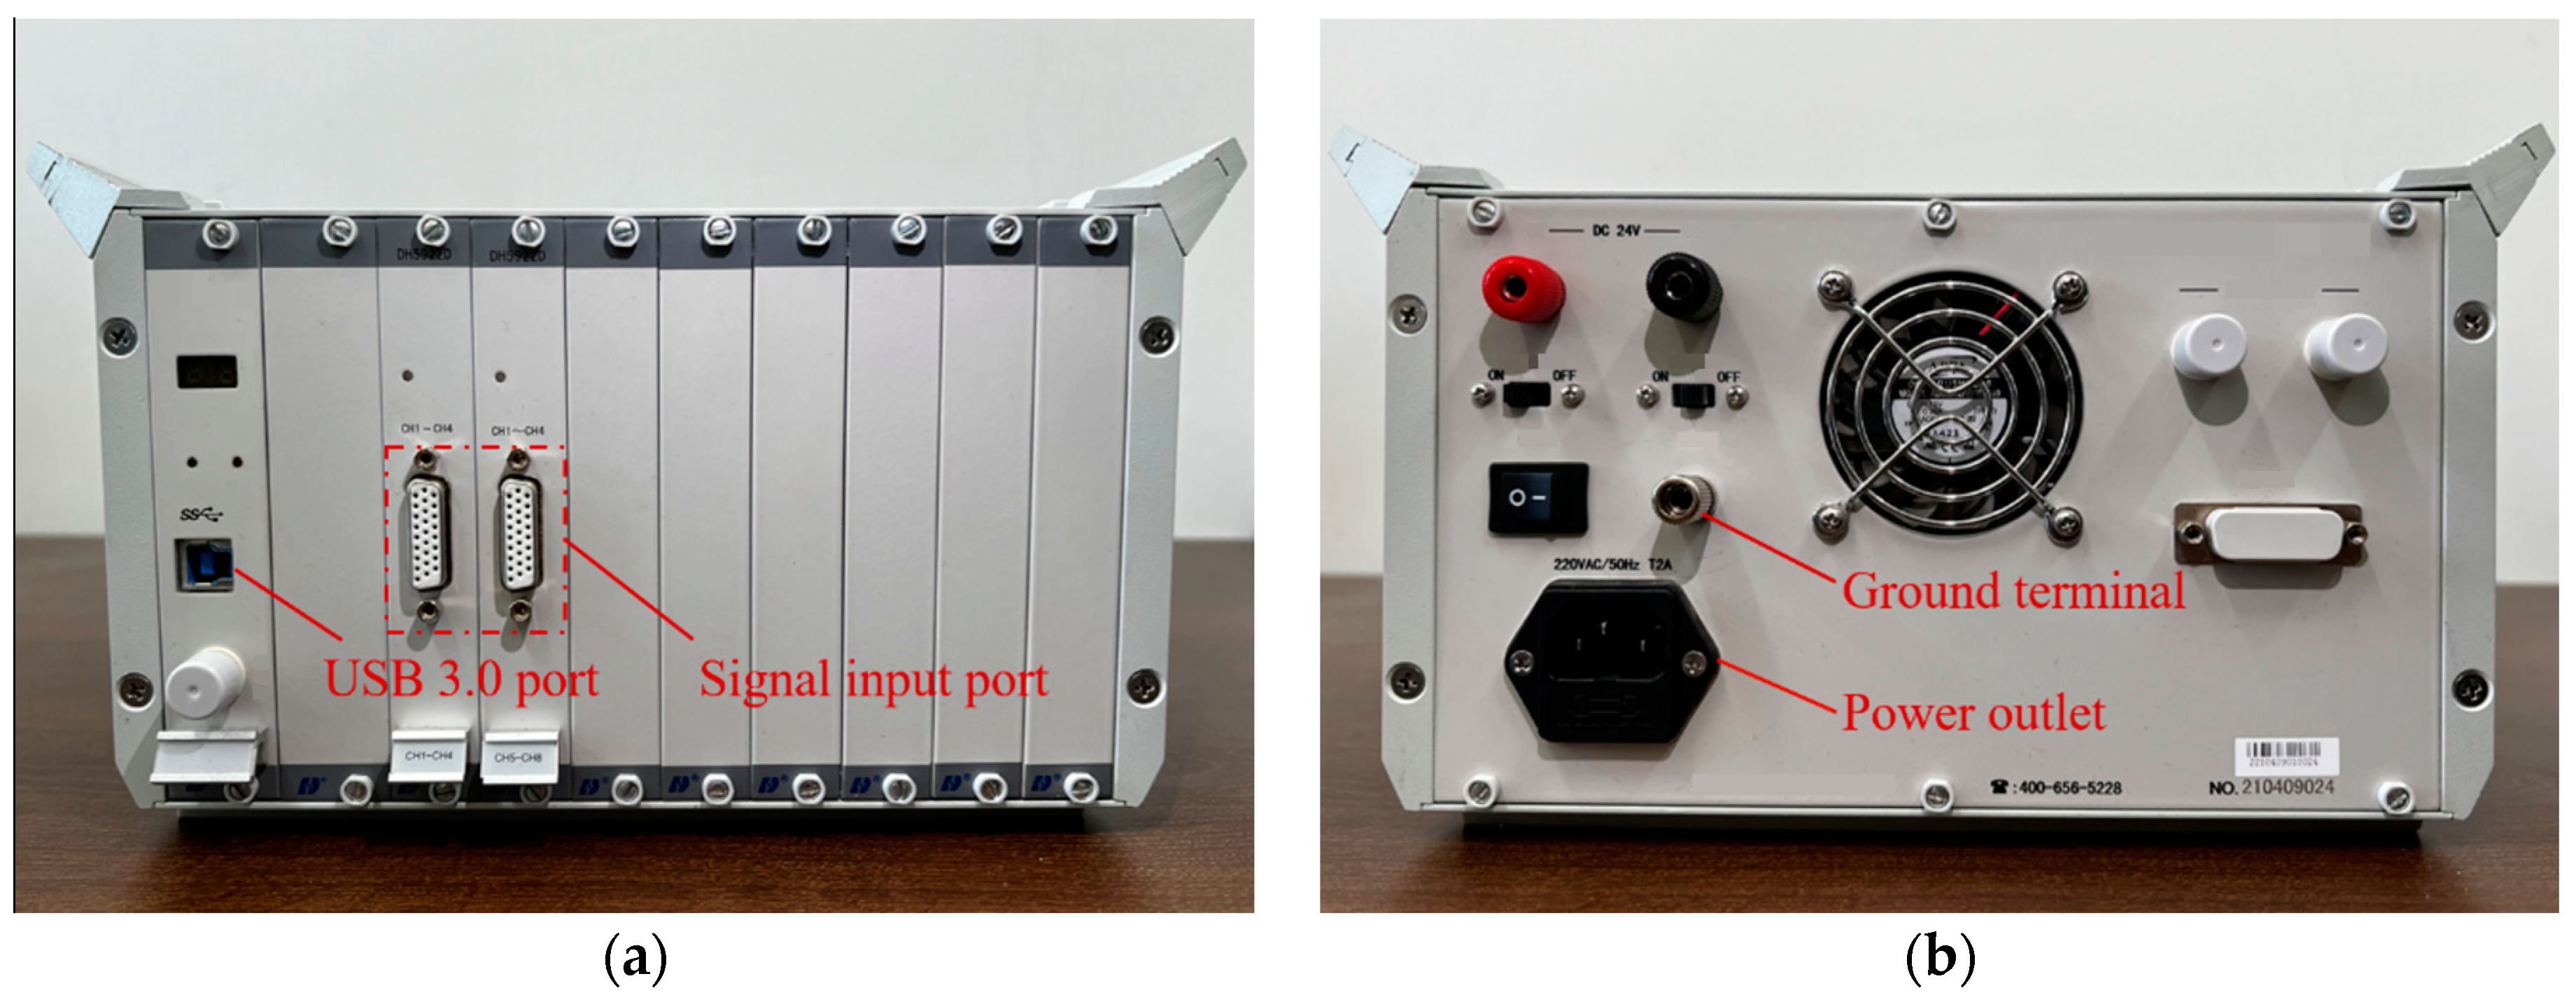
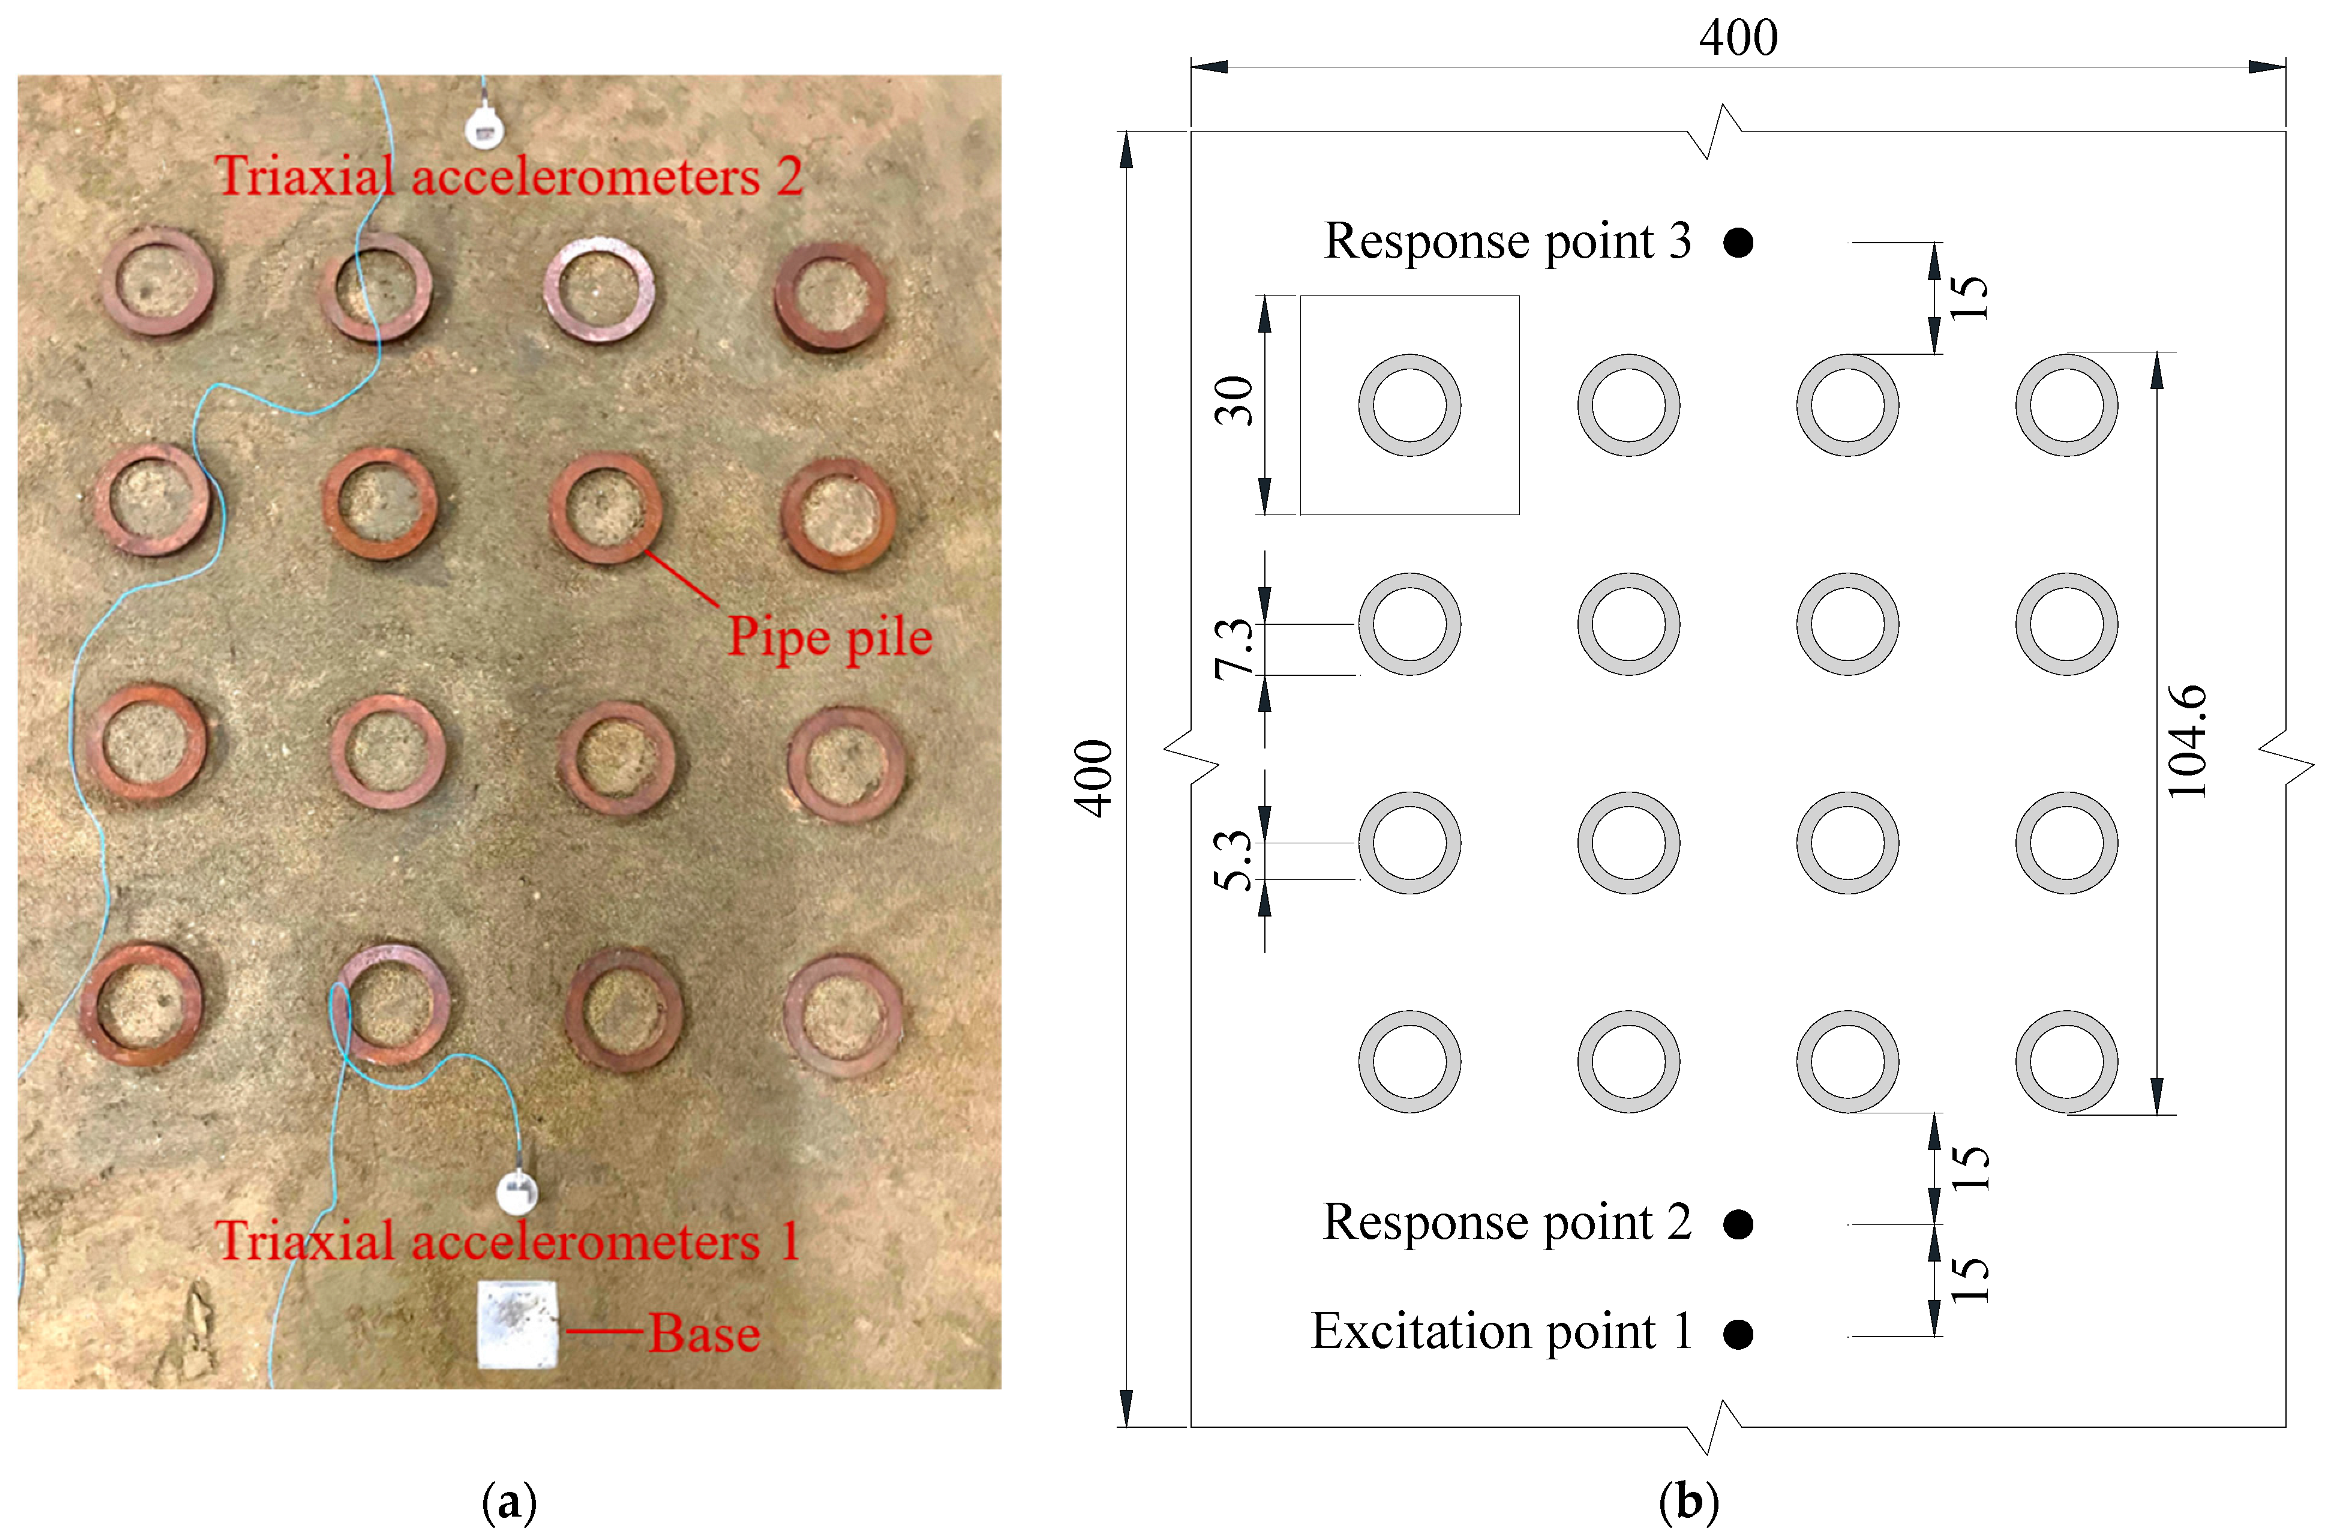
3.1. Model Test
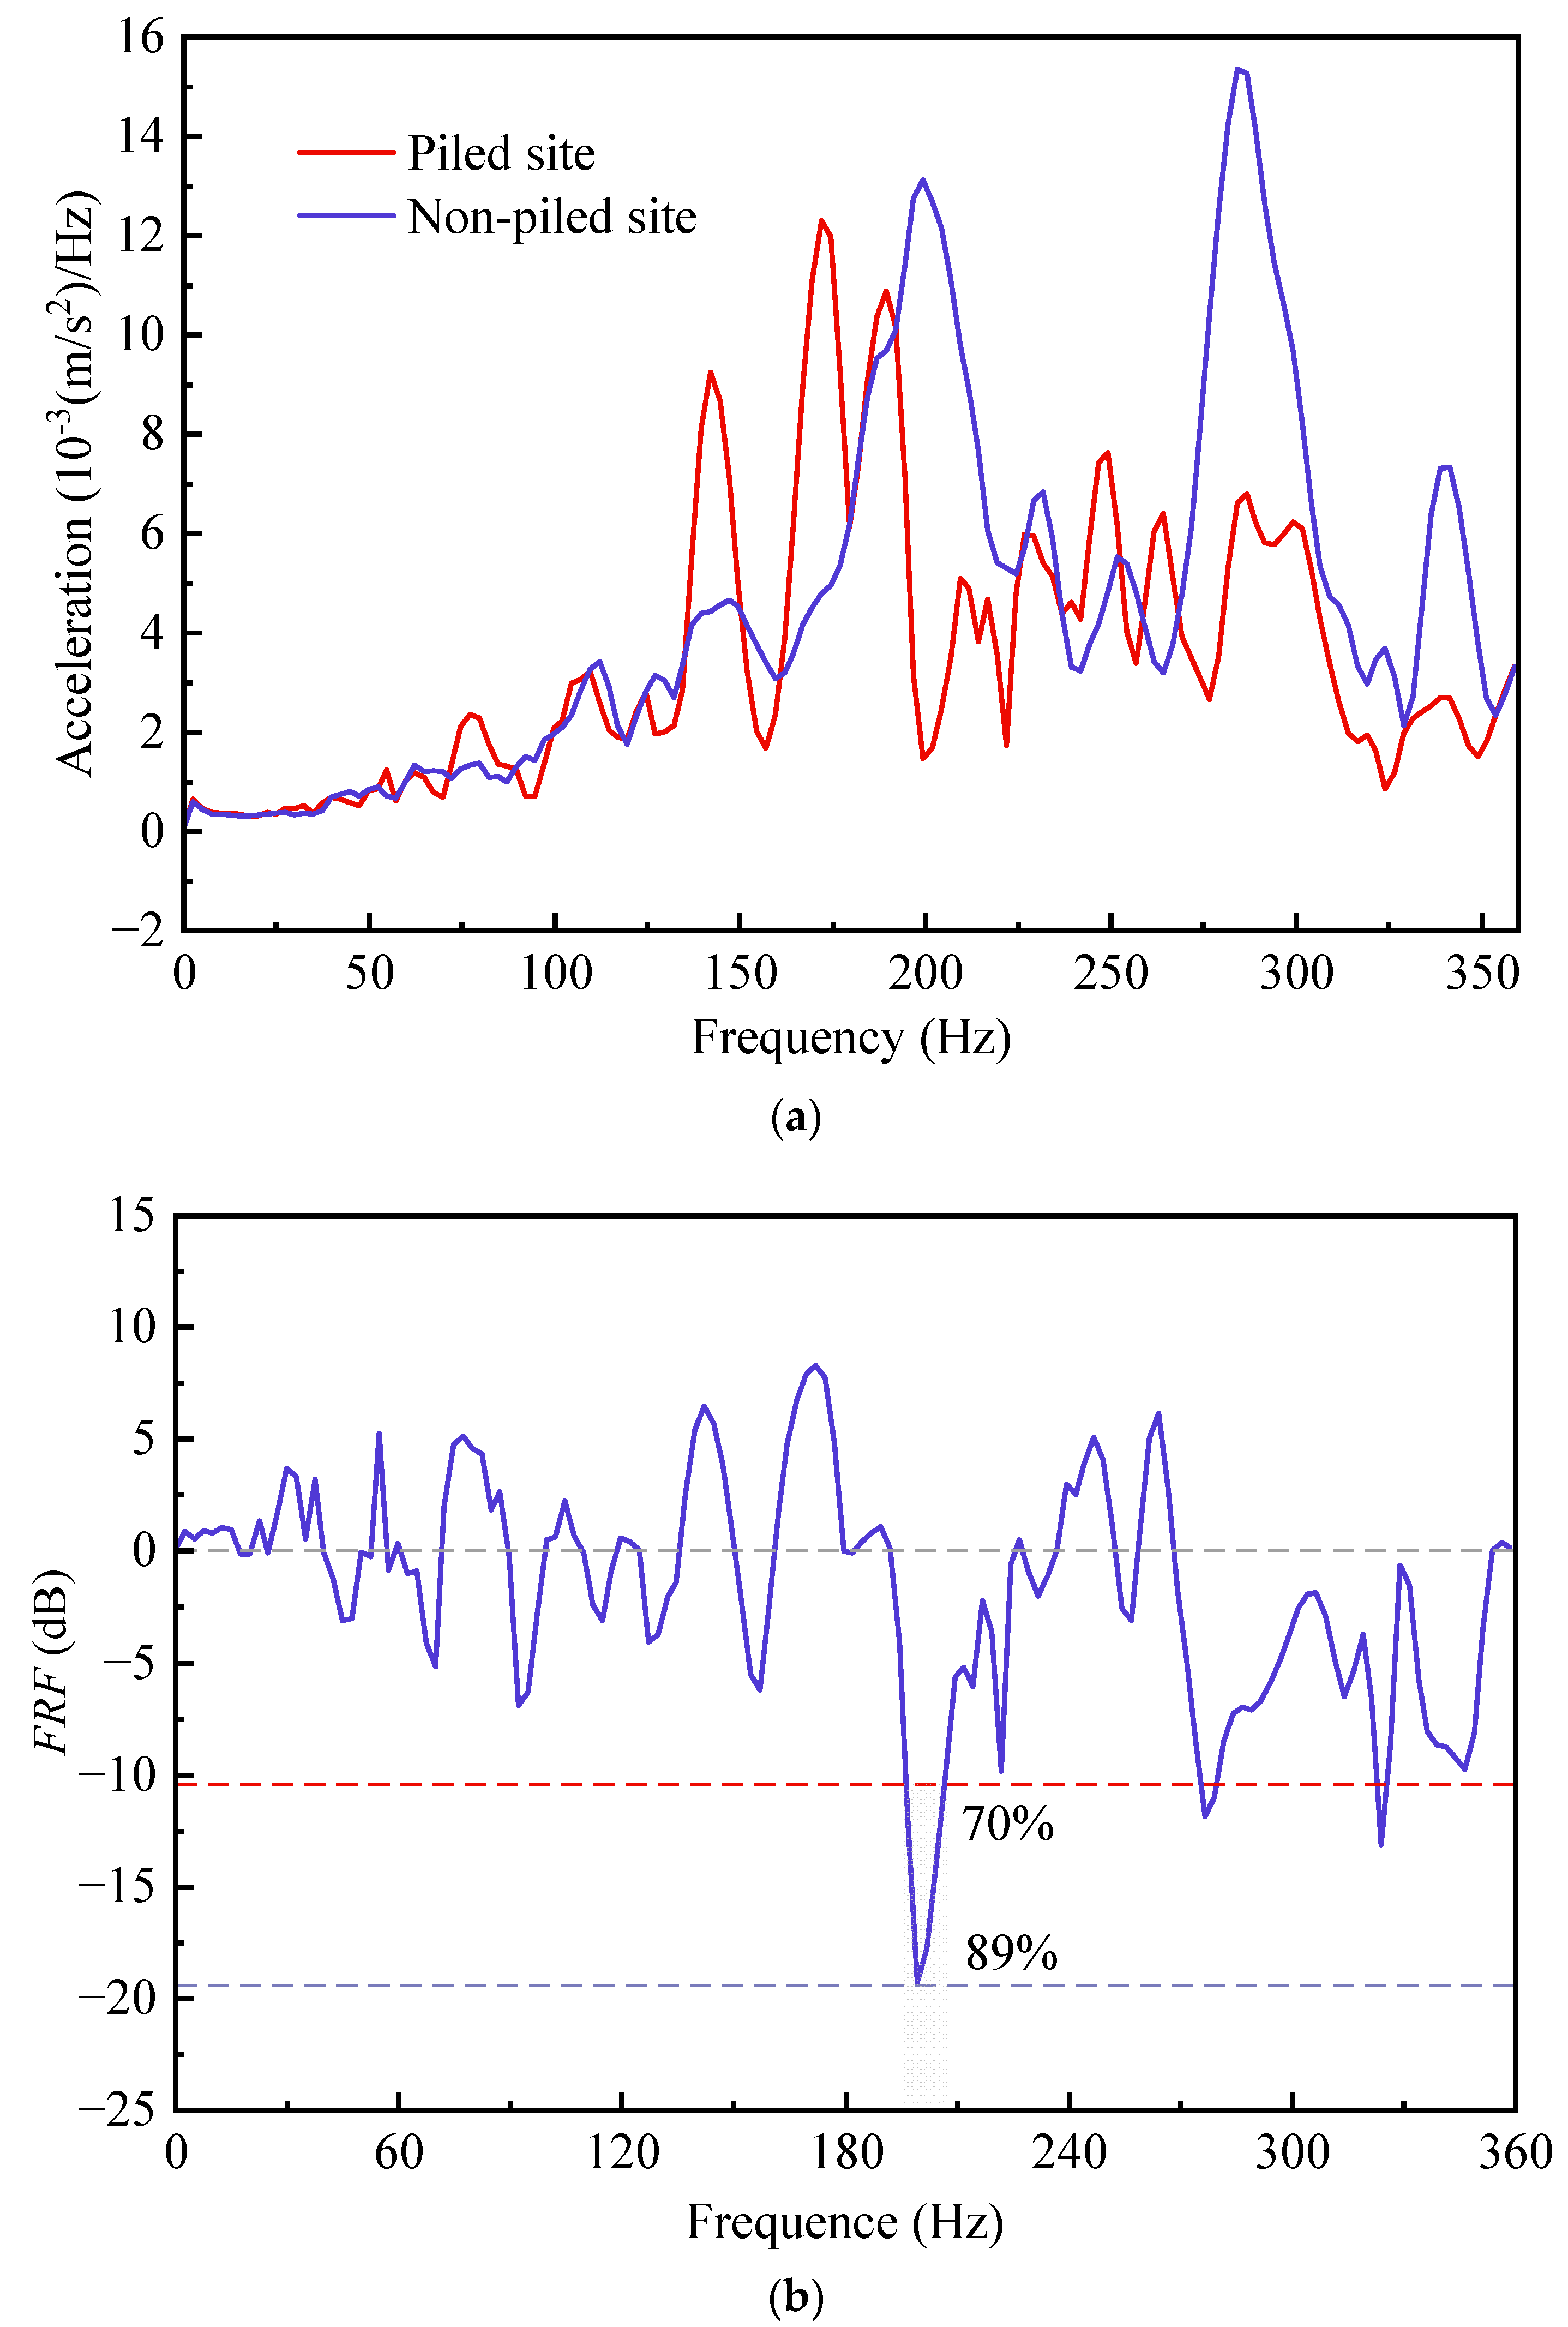
3.2. Validation
4. Bandgap Influencing Factor Analysis
4.1. Pipe Pile Thickness
4.2. Periodic Constant
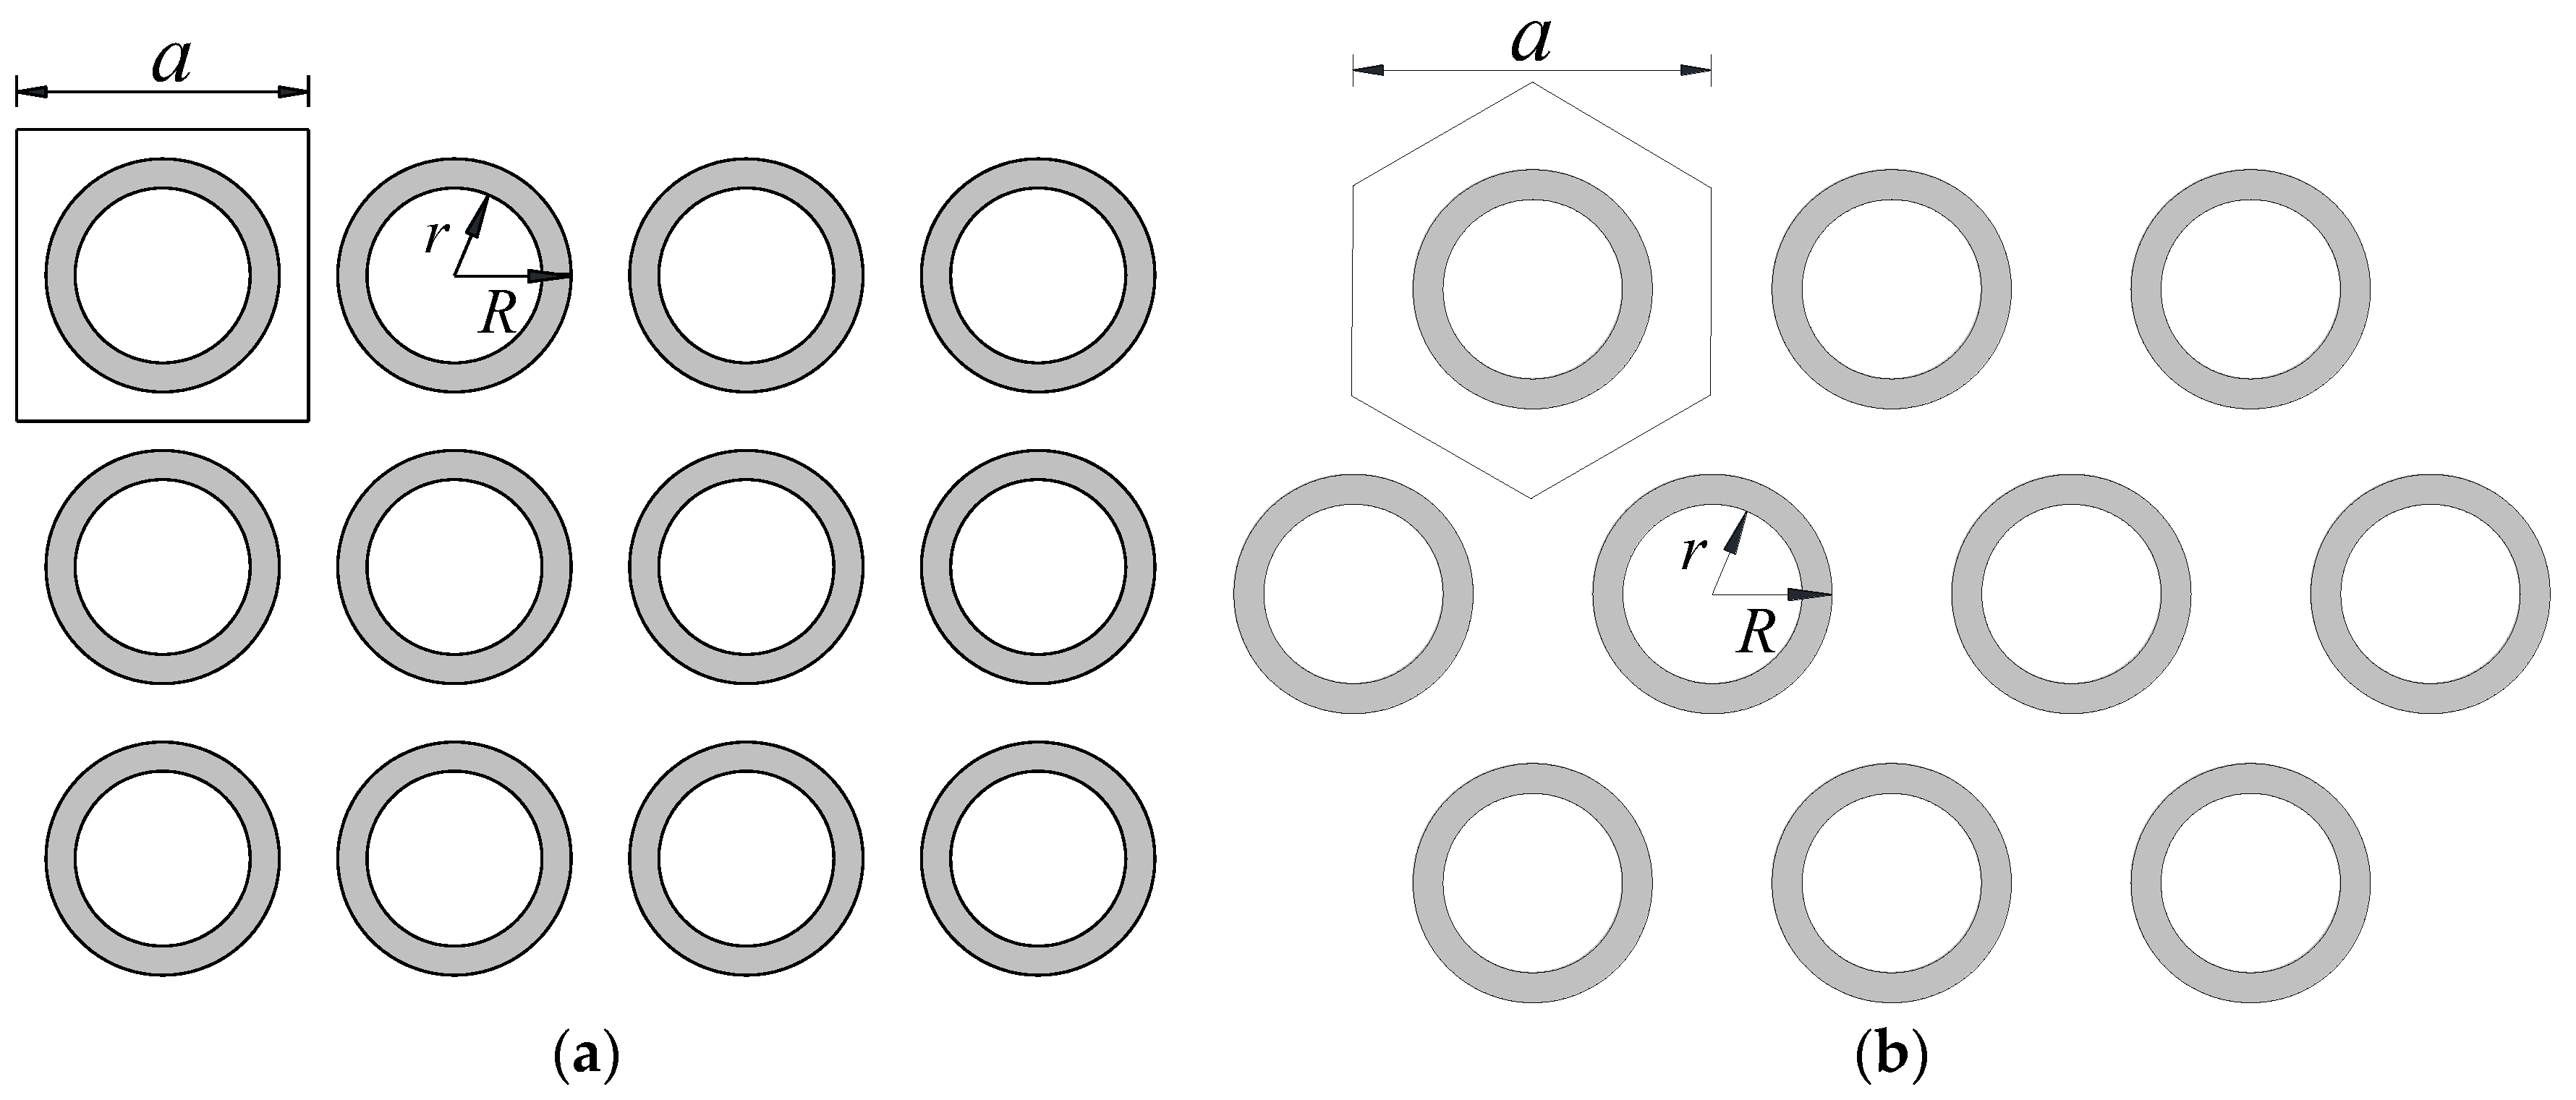
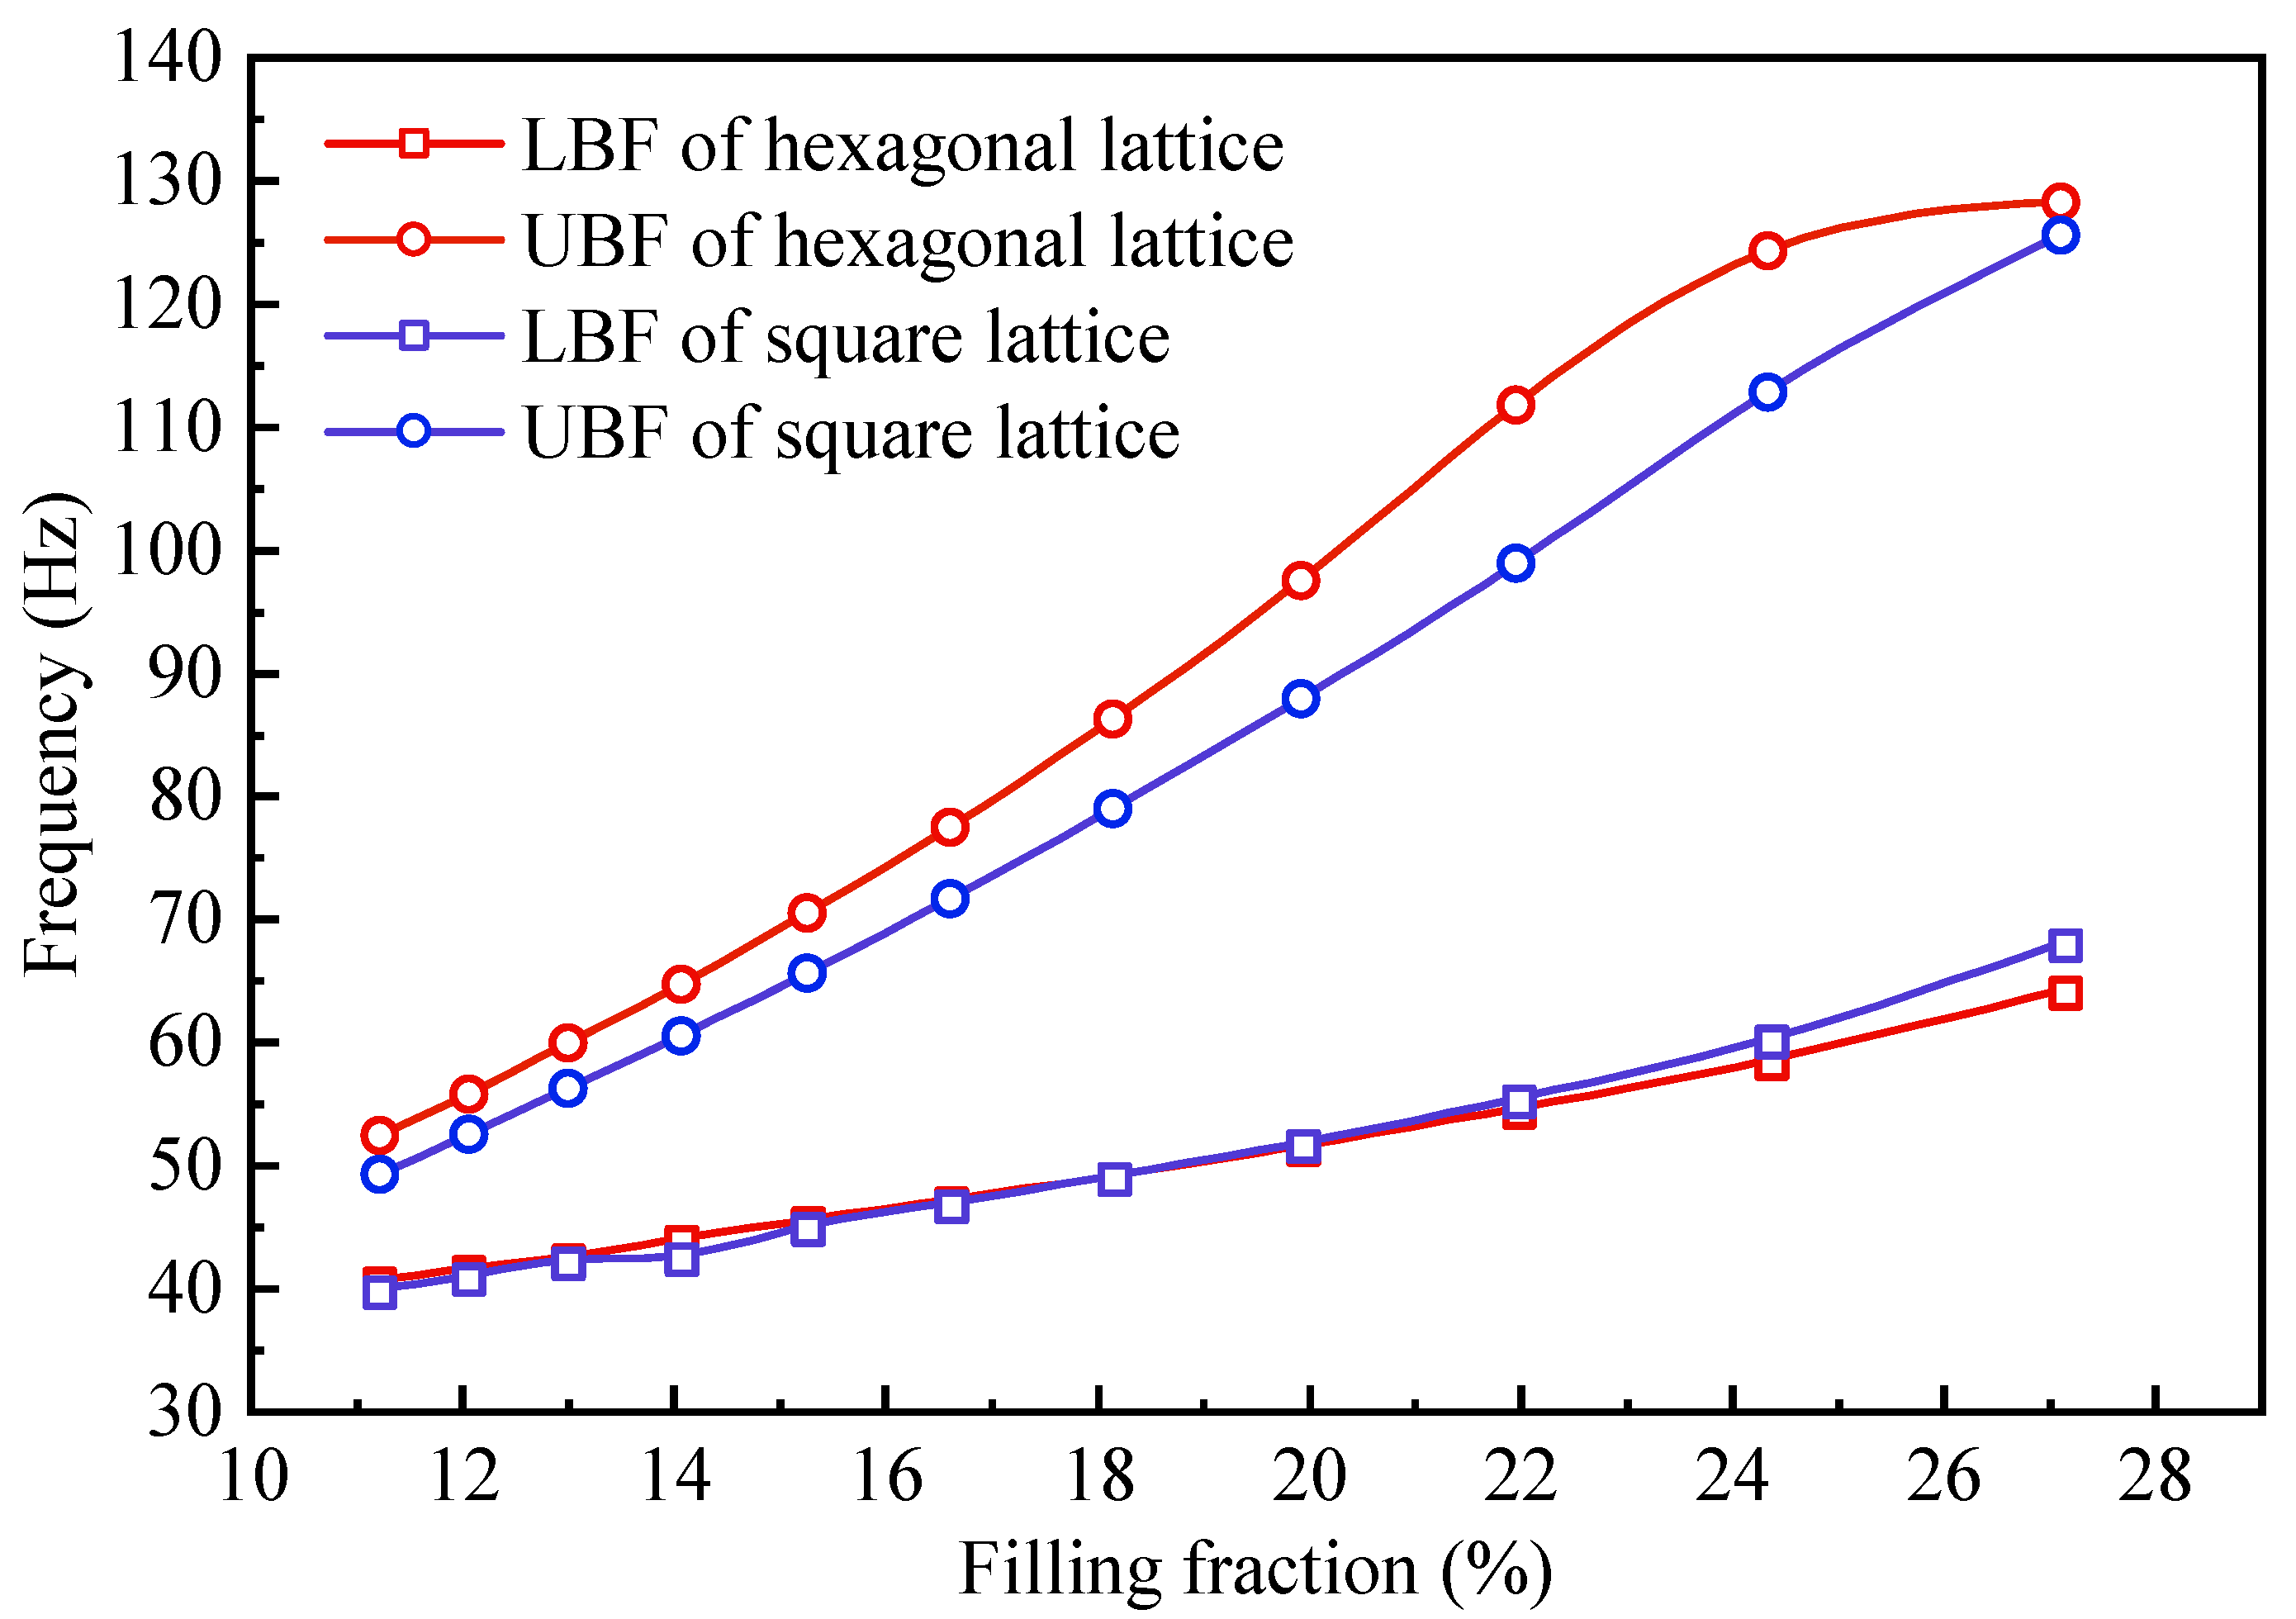
4.3. Arrangement Pattern
4.4. Cross-Sectional Shape
4.4.1. Periodic H-Shaped Pile Barriers
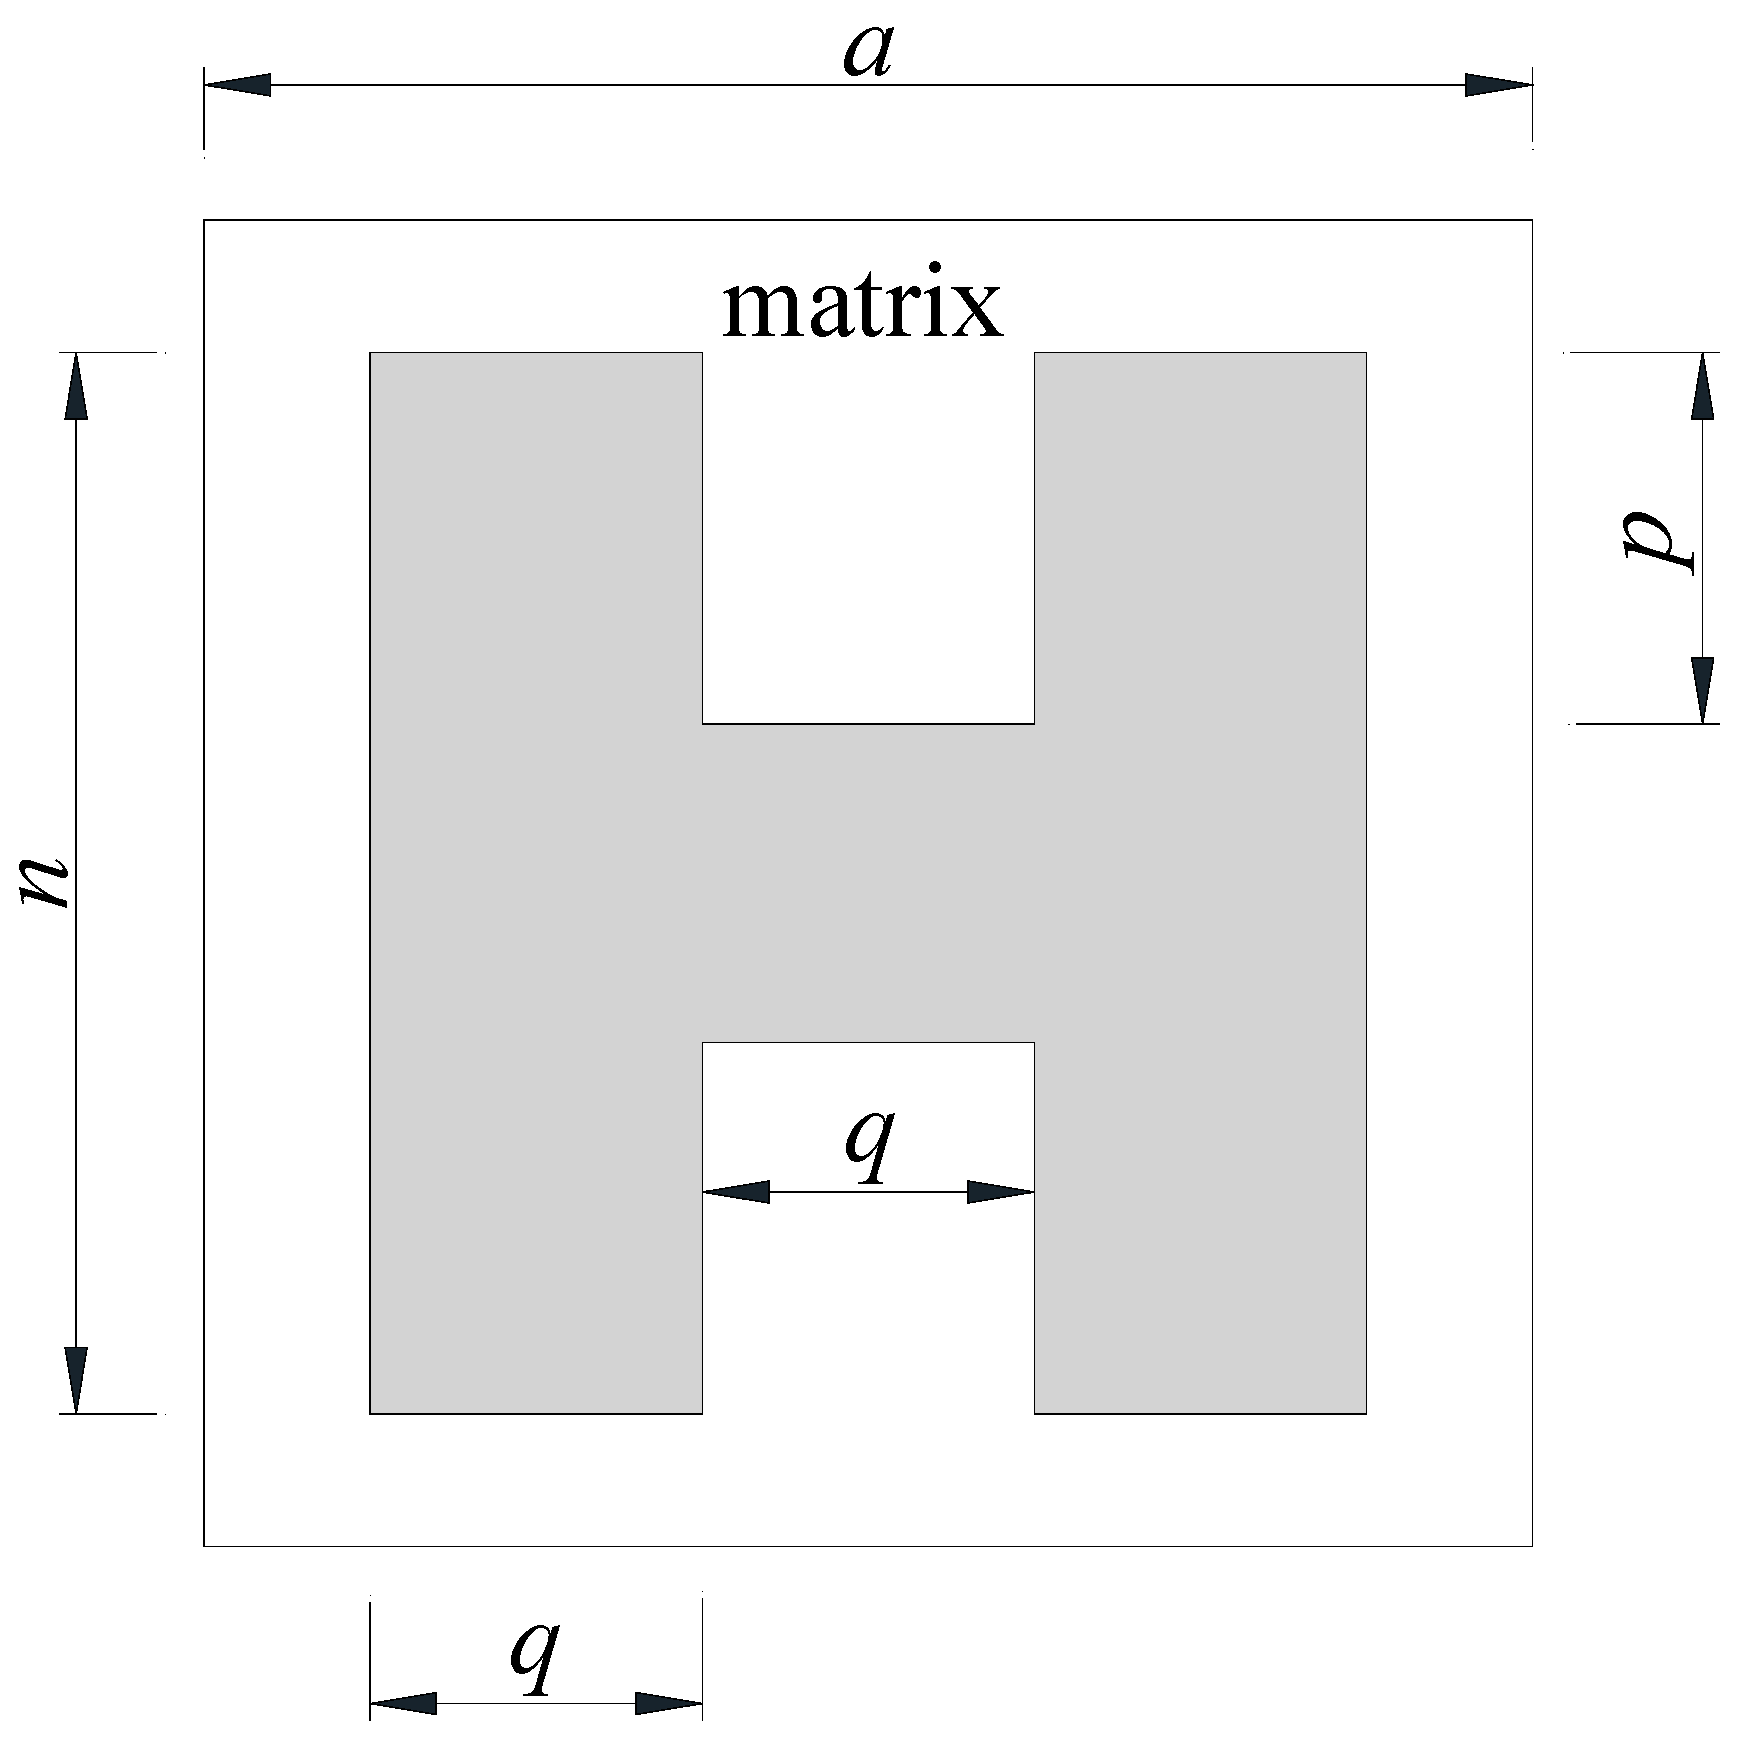
4.4.2. H-Shaped Pile Geometric Configuration
5. Conclusions
- (1)
- The bandgap frequency ranges determined through the FEM for square-arranged piles showed a strong correlation with the attenuation domains observed in the model testing. This concordance underscored the effectiveness of using the FEM to analyze the bandgap characteristics of periodic pile barriers.
- (2)
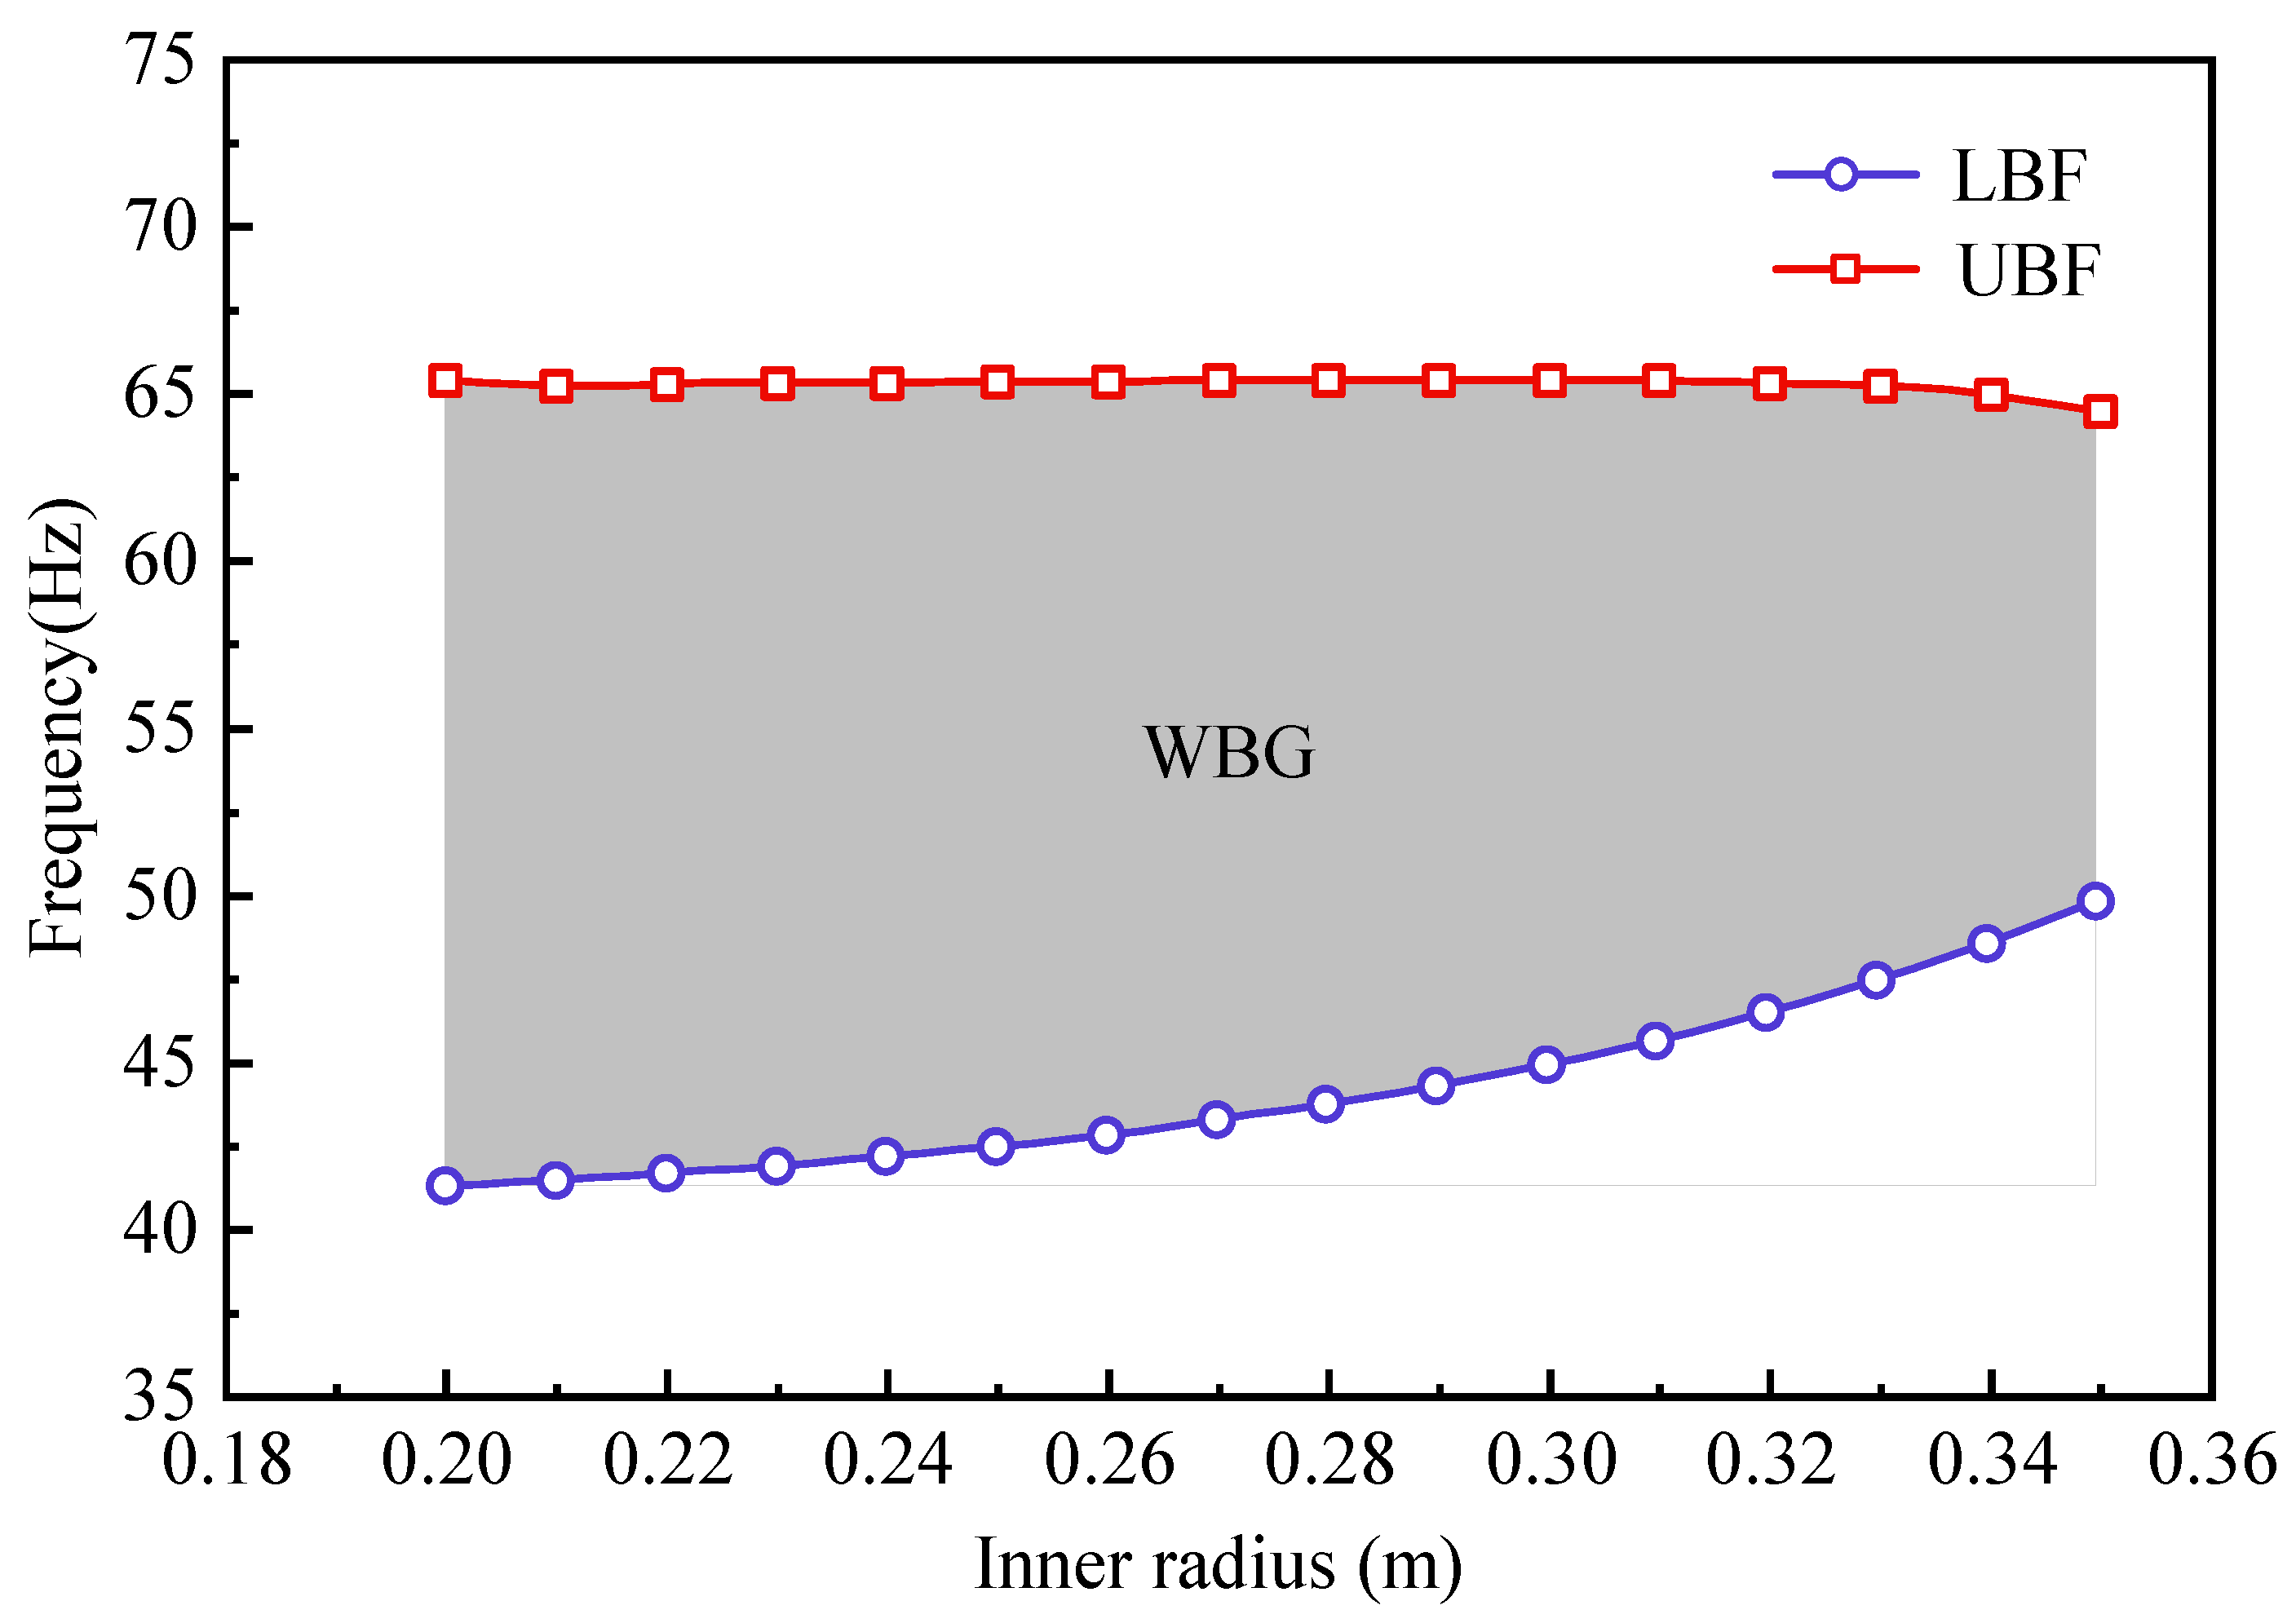
- The FEM revealed that the LBF was predominantly affected by the outer radius of the steel pipe piles and the periodic constant. Specifically, changes of 23.68% and 55.56% in the outer radius and periodic constant, respectively, resulted in LBF variations of 13.79% and 42.91%. Periodic pile barriers with larger periodic constants, larger outer radius, and smaller inner radius yielded a lower LBF. Furthermore, employing a hexagonal lattice proved beneficial for attaining a larger WBG.
- (3)
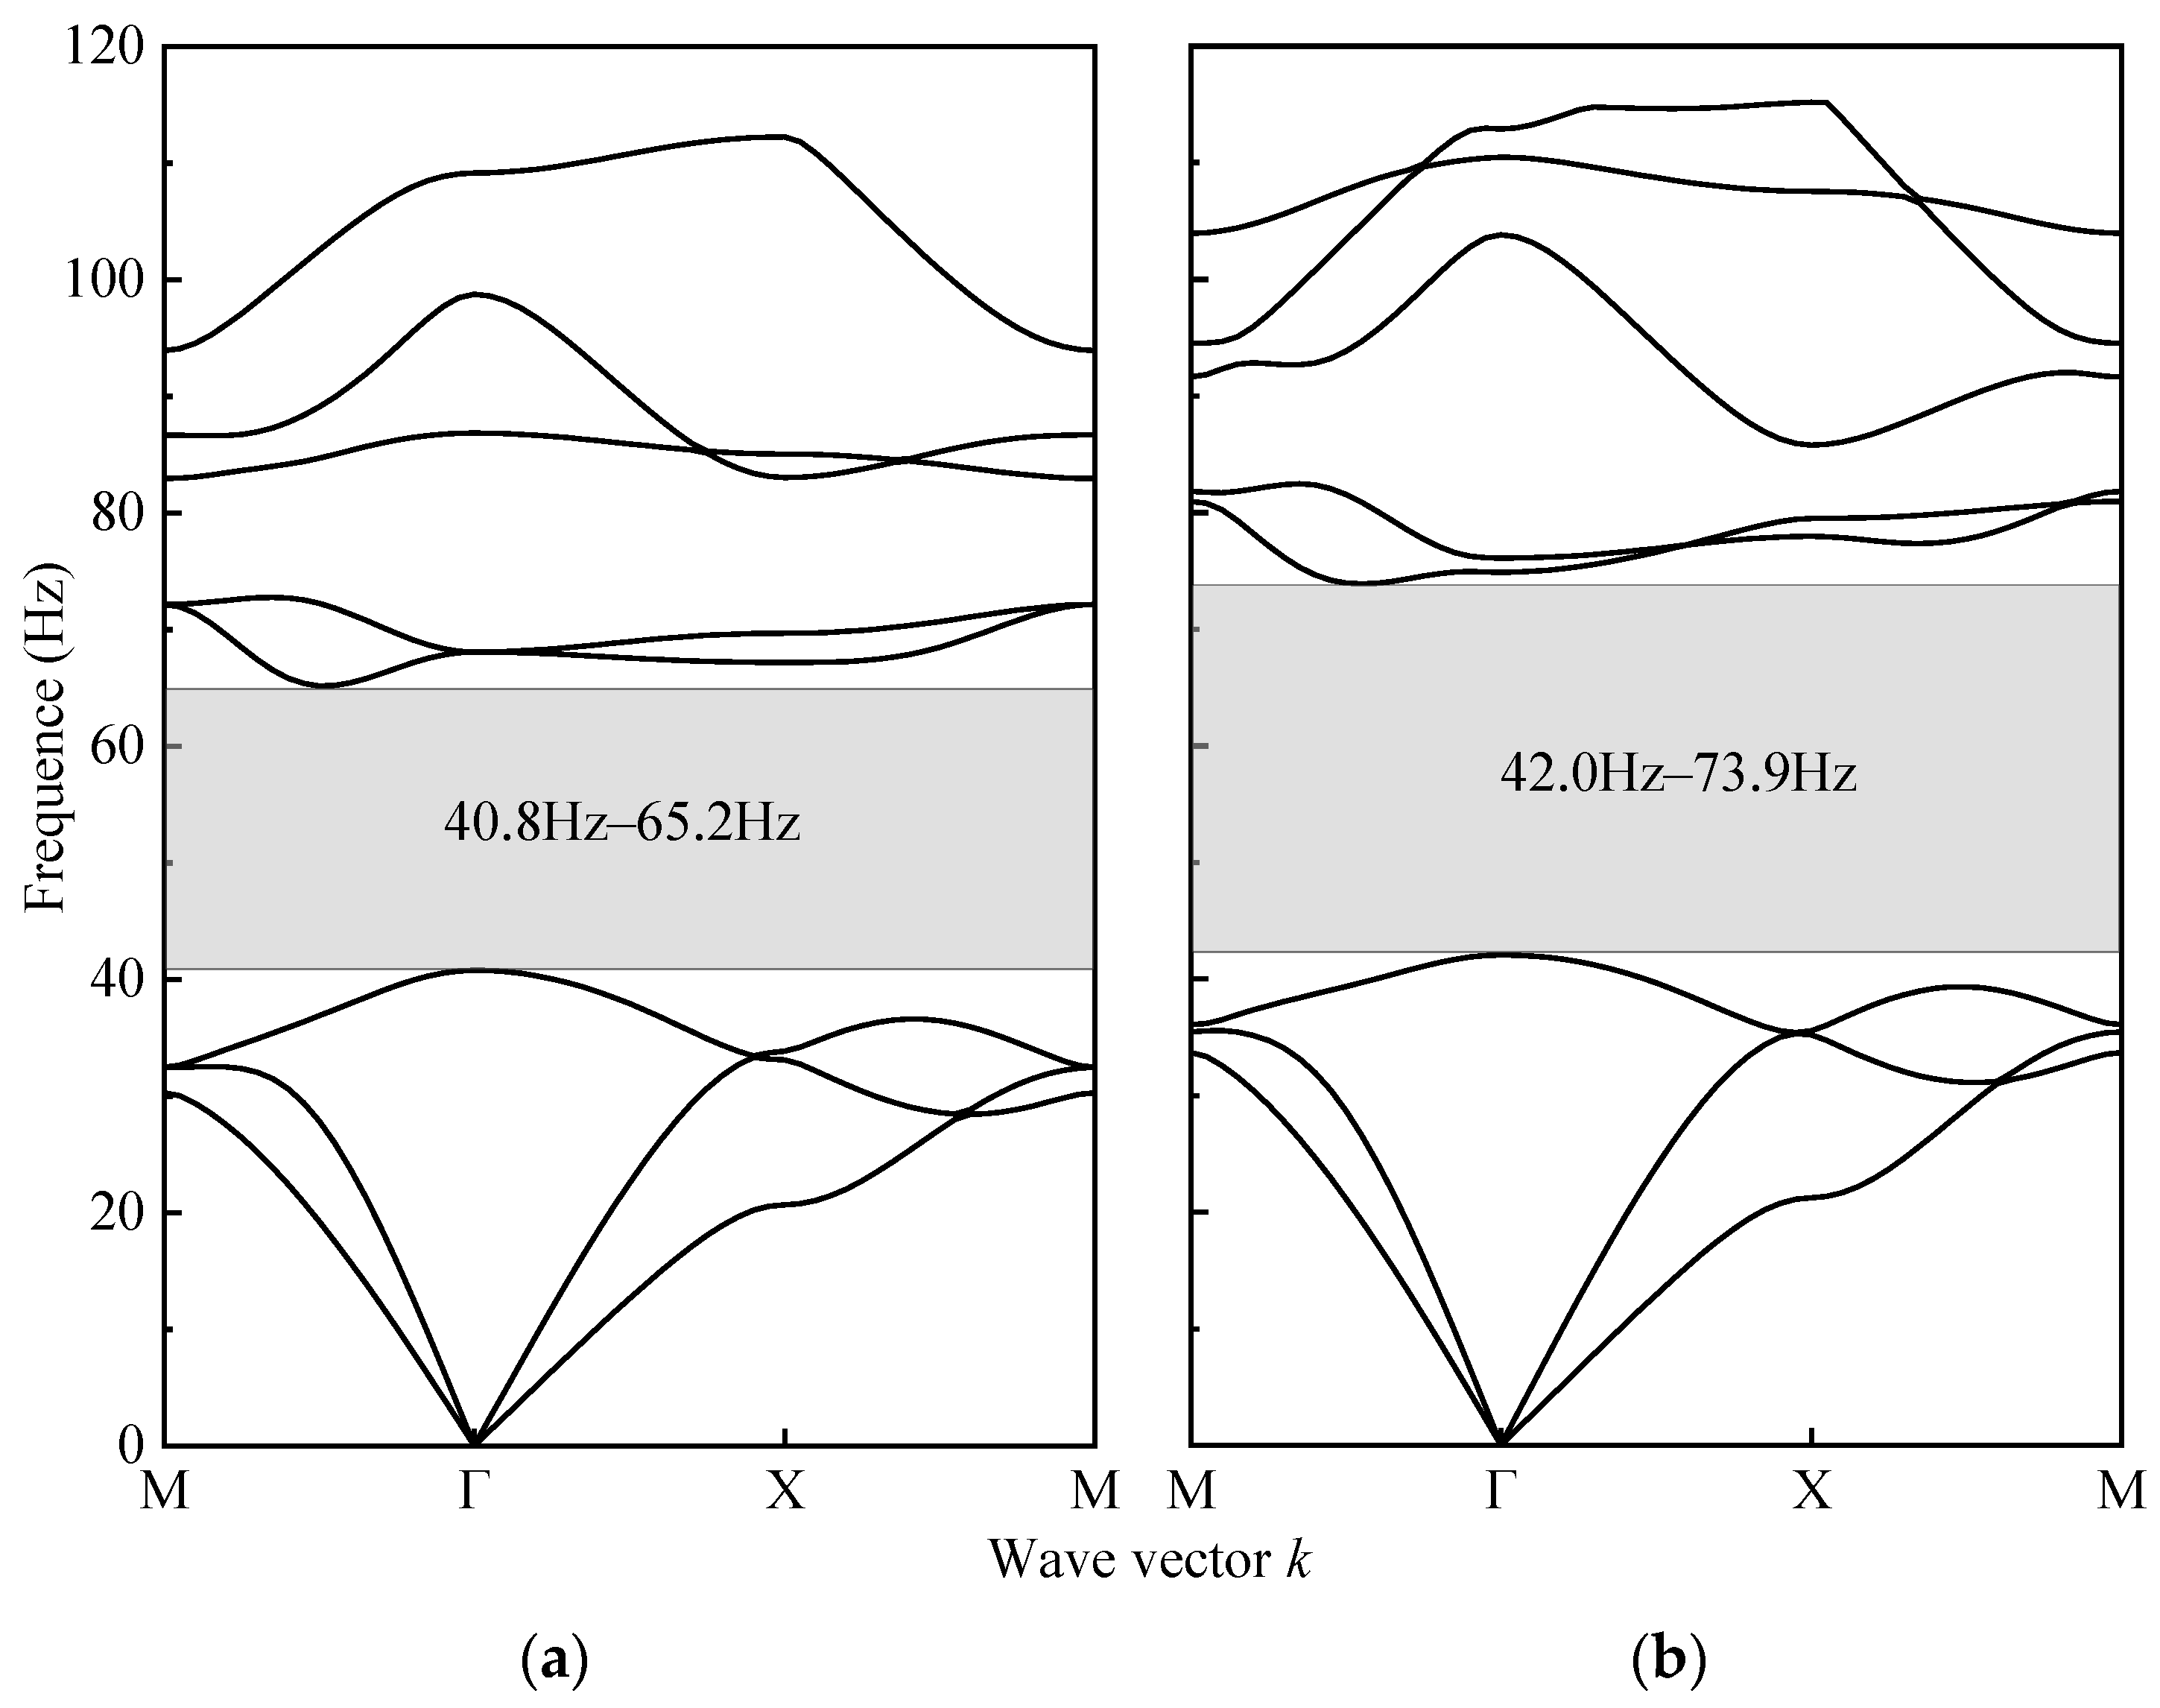
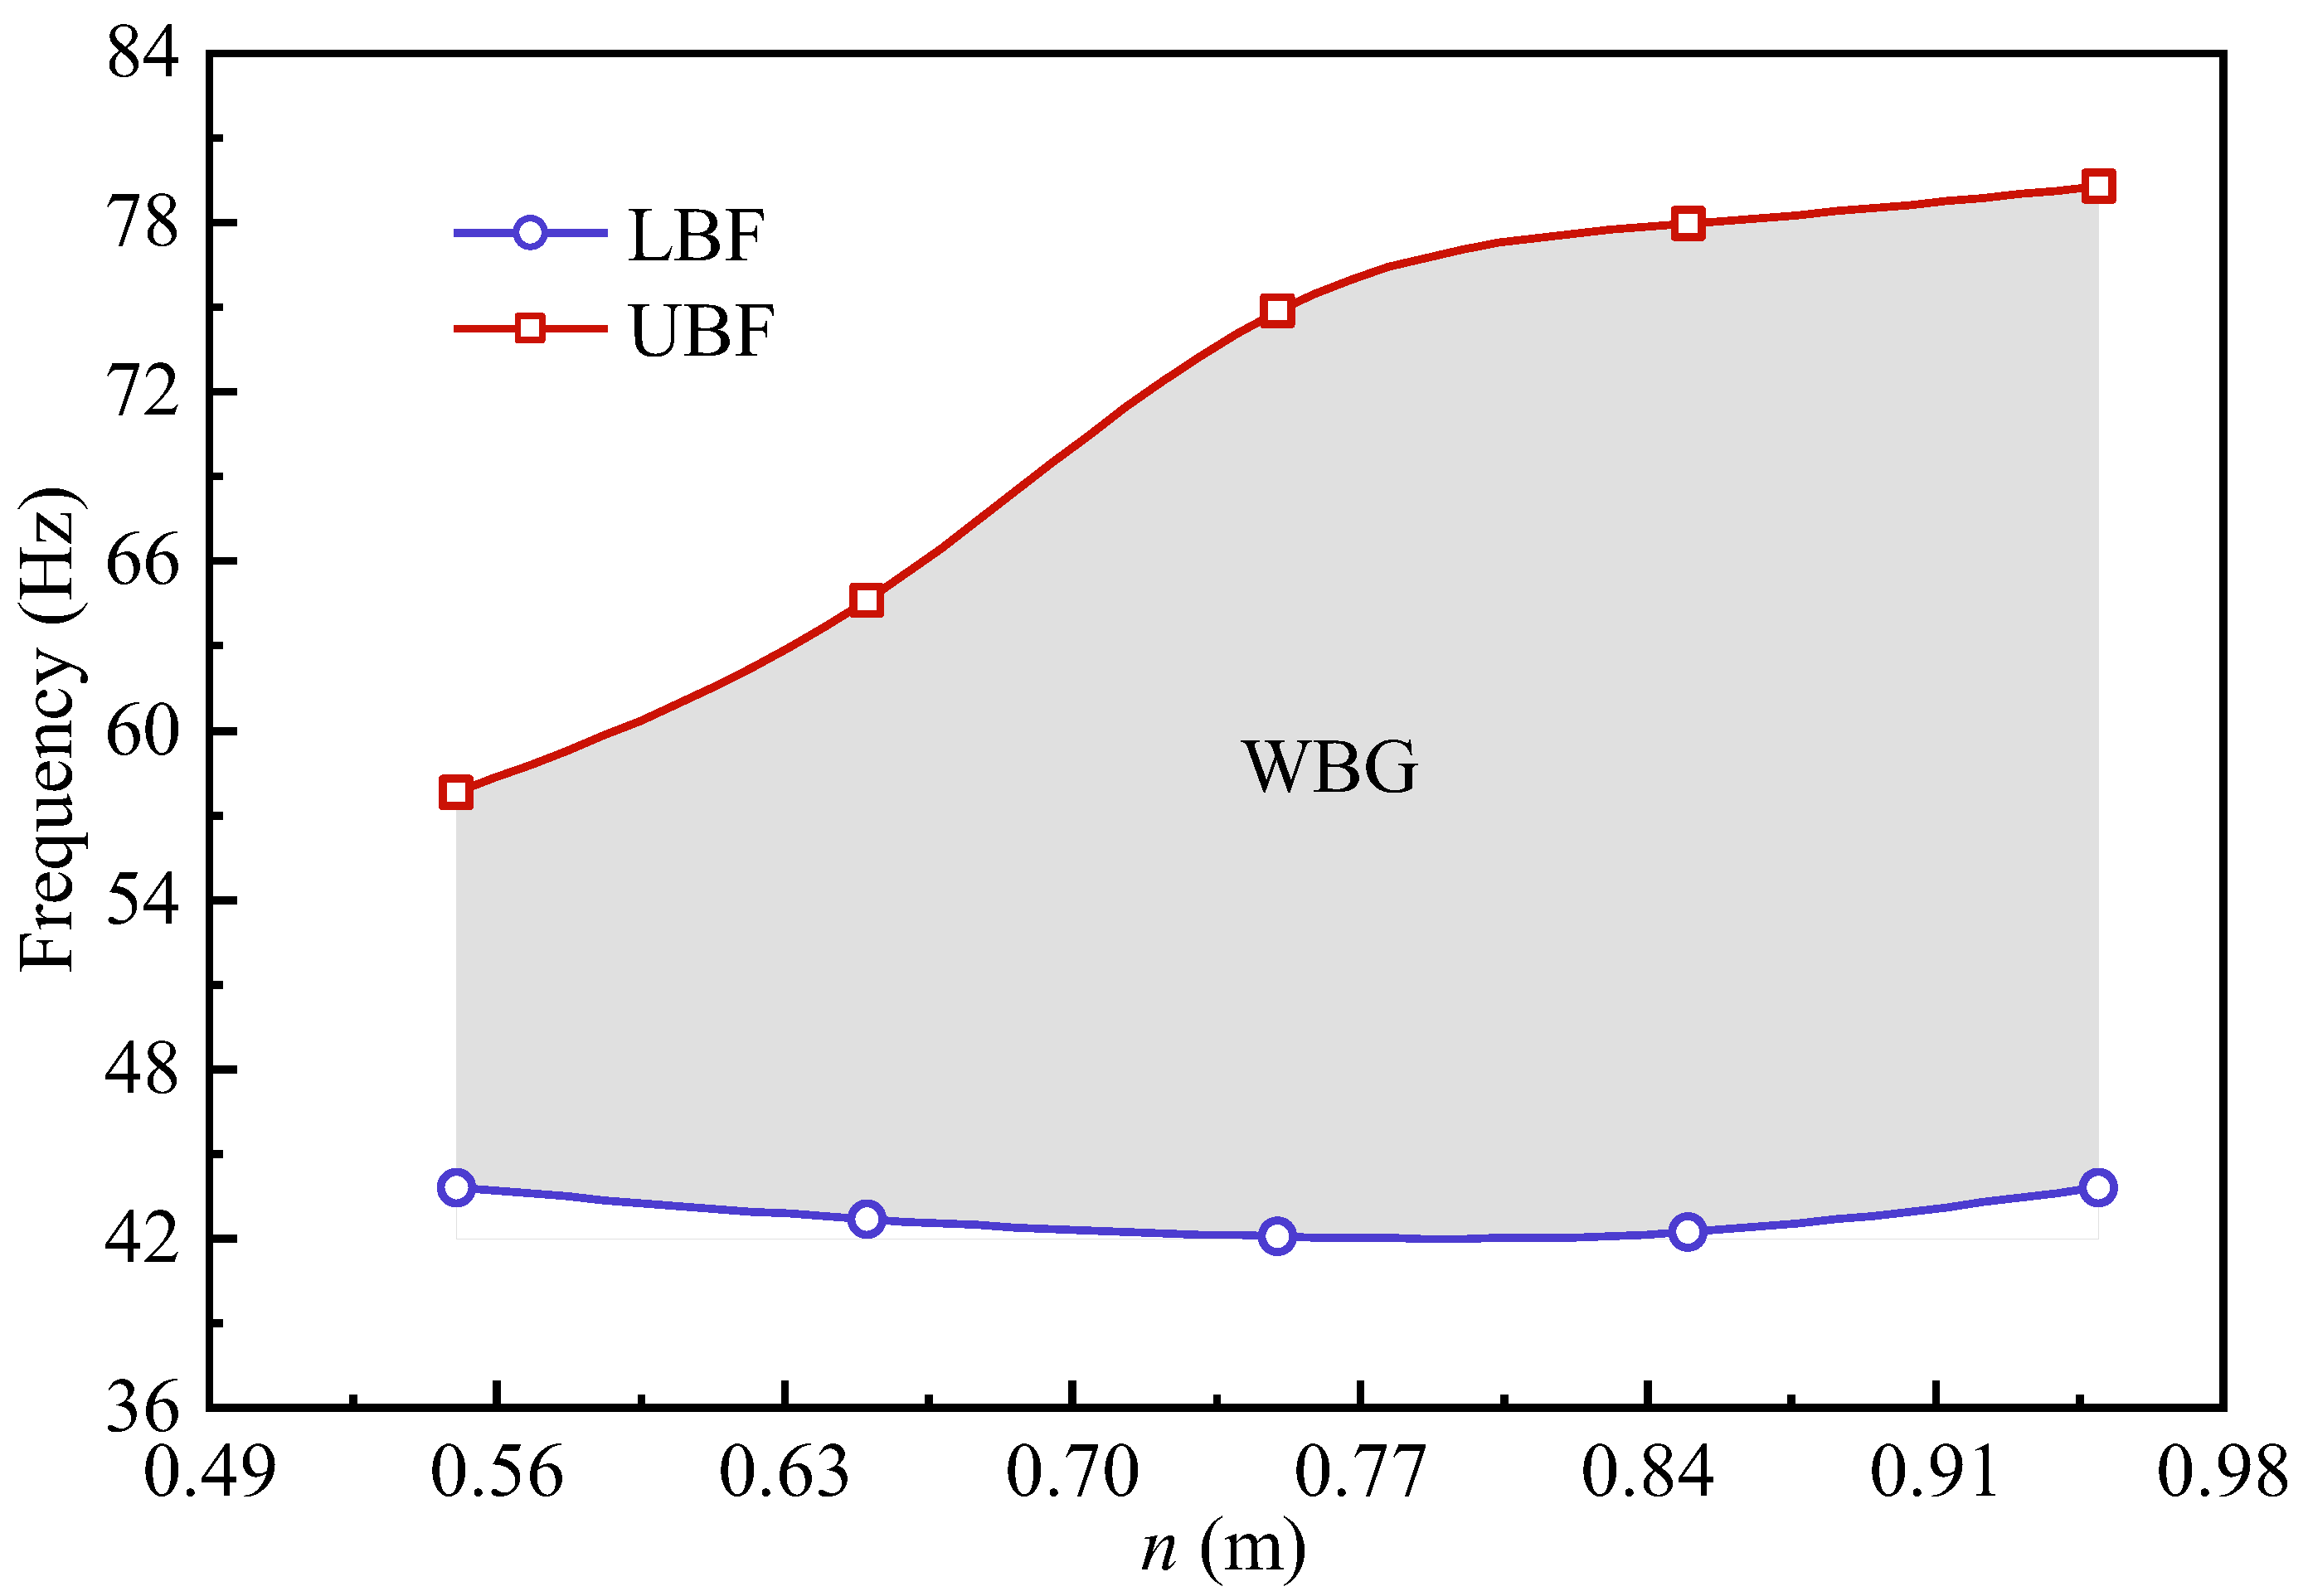
- With identical cross-sectional areas, the WBG of the H-shaped steel piles was 1.31 times greater than that of steel pipe piles. H-shaped steel piles outperformed steel pipe piles in modulating the bandgap distribution. This was particularly evident in the wider WBG and higher UBF. Analysis of the bandgap distribution adjustments for H-shaped steel piles indicated that the LBF, UBF, and the WBG were particularly sensitive to variations in the horizontal characteristic dimension q, while showing minimal sensitivity to changes in the vertical characteristic dimensions p and n.
Author Contributions
Funding
Data Availability Statement
Conflicts of Interest
References
- Alves Costa, P.; Calçada, R.; Silva Cardoso, A. Track–Ground Vibrations Induced by Railway Traffic: In-Situ Measurements and Validation of a 2.5D FEM-BEM Model. Soil Dyn. Earthq. Eng. 2012, 32, 111–128. [Google Scholar] [CrossRef]
- Di, G.; Xie, Z.; Guo, J. Predict the Influence of Environmental Vibration from High-Speed Railway on Over-Track Buildings. Sustainability 2021, 13, 3218. [Google Scholar] [CrossRef]
- Beben, D.; Maleska, T.; Bobra, P.; Duda, J.; Anigacz, W. Influence of Traffic-Induced Vibrations on Humans and Residential Building—A Case Study. IJERPH 2022, 19, 5441. [Google Scholar] [CrossRef]
- Wang, S.; Xin, T.; Wang, P.; Yang, Y.; Zhao, L. Assessment and Mitigation of Railway-Induced Environmental Vibrations over Underground Comprehensive Transportation Hub. Struct. Infrastruct. Eng. 2024, 20, 883–894. [Google Scholar] [CrossRef]
- Chen, X.; Jiang, J.; Hu, Y.; Sheng, T.; Tang, K. Experimental Study on The Influence of Precision Instruments Caused by Heavy Vehicles Vibration. J. Phys. Conf. Ser. 2021, 2044, 012113. [Google Scholar] [CrossRef]
- Seyedi, M. Impact of Train-Induced Vibrations on Residents’ Comfort and Structural Damages in Buildings. J. Vib. Eng. Technol. 2024, 1–18. [Google Scholar] [CrossRef]
- Xu, W.; Zhao, J.; Yang, W.; Yu, D.; Qiu, L.; Chen, Z.; Qiu, Y. The Effects of Construction Vibration on Stone Cultural Relics: A Case Study from the Qingdao Museum. Herit Sci 2023, 11, 250. [Google Scholar] [CrossRef]
- Li, Z.; Gao, G.; Qiu, C.; Yang, X. Analysis of Multi-Row of Piles as Barriers for Isolating Vibration in Far Field. Chin. J. Rock Mech. Eng. 2005, 24, 192–197. [Google Scholar]
- Ma, M.; Jiang, B.; Gao, J.; Liu, W. Experimental Study on Attenuation Zone of Soil-Periodic Piles System. Soil Dyn. Earthq. Eng. 2019, 126, 105738. [Google Scholar] [CrossRef]
- Lu, J.-F.; Xu, B.; Wang, J.-H. A Numerical Model for the Isolation of Moving-Load Induced Vibrations by Pile Rows Embedded in Layered Porous Media. Int. J. Solids Struct. 2009, 46, 3771–3781. [Google Scholar] [CrossRef]
- Cai, Y.-Q.; Ding, G.-Y.; Xu, C.-J. Amplitude Reduction of Elastic Waves by a Row of Piles in Poroelastic Soil. Comput. Geotech. 2009, 36, 463–473. [Google Scholar] [CrossRef]
- Kattis, S.E.; Polyzos, D.; Beskos, D.E. Vibration Isolation by a Row of Piles Using a 3-D Frequency Domain BEM. Int. J. Numer. Meth. Engng. 1999, 46, 713–728. [Google Scholar] [CrossRef]
- Qian, Y.; Wang, H.; Zhang, D. Bursting Dynamics in the General Hybrid Rayleigh-van Der Pol-Duffing Oscillator with Two External Periodic Excitations. J. Vib. Eng. Technol. 2024, 12, 2943–2957. [Google Scholar] [CrossRef]
- Wu, L.; Shi, Z. Feasibility of Vibration Mitigation in Unsaturated Soil by Periodic Pile Barriers. Comput. Geotech. 2023, 164, 105798. [Google Scholar] [CrossRef]
- Chen, X.; Wang, Y.; Meng, F.; Xie, K.; Yi, L.; Zheng, Y. Isolation Effect Analysis of Periodic Pile Barriers for Rayleigh Waves Using Complex Band Diagram. Comput. Geotech. 2023, 158, 105370. [Google Scholar] [CrossRef]
- Zhao, C.; Zeng, C.; Wang, Y.; Bai, W.; Dai, J. Theoretical and Numerical Study on the Pile Barrier in Attenuating Seismic Surface Waves. Buildings 2022, 12, 1488. [Google Scholar] [CrossRef]
- Wu, M.; Wang, B.; Ba, Z.; Dai, K.; Liang, J. Vibration Isolation of Infinitely Periodic Pile Barriers for Anti-Plane Shear Waves: An Exact Series Solution. Soil Dyn. Earthq. Eng. 2024, 176, 108347. [Google Scholar] [CrossRef]
- Woods, R.D.; Barnett, N.E.; Sagesser, R. Holography—A New Tool for Soil Dynamics. J. Geotech. Engrg. Div. 1974, 100, 1231–1247. [Google Scholar] [CrossRef]
- Gao, G.; Yang, X.; Wang, Y.; Wu, S. Theory and Application of Pile Vibration Isolation. J. Build. Struct. 1997, 18, 58–69. [Google Scholar] [CrossRef]
- Sun, L.; Li, J.; Liu, B.; Fan, J. Experimental Study on Vibration-Isolation Effects of Open Trench, Gravel-Filled Trench, and Piles in a Row. J. Earthq. Eng. 2015, 37, 342–348. [Google Scholar]
- Liu, J.; Liu, H.; Liu, P.; Wang, Y. Experimental Study on Vibration Isolation Performance of Double Row Pile Barrier under Railway Vibration. J. Build. Struct. 2020, 41, 184–190. [Google Scholar] [CrossRef]
- Liu, J.; Feng, G.; Zhang, J.; Zhao, X.; Yu, C.; Zhao, M. Vibration Isolation Mechanism of Concrete Piles for Rayleigh Waves on Sand Foundations. Shock Vib. 2018, 2018, 1–13. [Google Scholar] [CrossRef]
- Jia, G.; Shi, Z. A New Seismic Isolation System and Its Feasibility Study. Earthq. Engin. Engin. Vib. 2010, 9, 75–82. [Google Scholar] [CrossRef]
- Liu, W.; Jiang, B.; Ma, M.; Gao, J. Elementary Experimental Investigation Of The Periodic Piles For Vibration Isolation Of Design Frequency Range. Geotech. Eng. 2019, 40, 4138–4148. [Google Scholar] [CrossRef]
- Huang, J.; Shi, Z. Attenuation Zones of Periodic Pile Barriers and Its Application in Vibration Reduction for Plane Waves. J. Sound Vib. 2013, 332, 4423–4439. [Google Scholar] [CrossRef]
- Huang, J.; Shi, Z. Vibration Reduction of Plane Waves Using Periodic In-Filled Pile Barriers. J. Geotech. Geoenviron. Eng. 2015, 141, 04015018. [Google Scholar] [CrossRef]
- Meng, Q.; Shi, Z. Ambient Vibration Attenuation By Periodic Pile Barriers Using Periodic Theory And COMSOL PDE Method. Geotech. Eng. 2018, 39, 4251–4260. [Google Scholar] [CrossRef]
- Sun, J.-H.; Wu, T.-T. Propagation of Surface Acoustic Waves through Sharply Bent Two-Dimensional Phononic Crystal Waveguides Using a Finite-Difference Time-Domain Method. Phys. Rev. B 2006, 74, 174305. [Google Scholar] [CrossRef]
- Zhou, J.; Shi, Z.; Cheng, Z. Surface Wave Bloch Mode Synthesis for Accelerating the Calculations of Elastic Periodic Structures. J. Vib. Eng. Technol. 2024, 12, 5835–5847. [Google Scholar] [CrossRef]
- Mandal, P.; Somala, S.N. Periodic Pile-Soil System as a Barrier for Seismic Surface Waves. SN Appl. Sci. 2020, 2, 1184. [Google Scholar] [CrossRef]
- Huang, J.; Shi, Z. Application of Periodic Theory to Rows of Piles for Horizontal Vibration Attenuation. Int. J. Geomech. 2013, 13, 132–142. [Google Scholar] [CrossRef]
- Ma, M.; Jiang, B.; Liu, W.; Liu, K. Control of Metro Train-Induced Vibrations in a Laboratory Using Periodic Piles. Sustainability 2020, 12, 5871. [Google Scholar] [CrossRef]
- Wang, X.; Wan, S.; Zhou, P.; Zhou, L.; Zhu, Y. Topology Optimization of Periodic Pile Barriers and Its Application in Vibration Reduction for Plane Waves. Soil Dyn. Earthq. Eng. 2022, 153, 107119. [Google Scholar] [CrossRef]
- Jiang, B. Study on configuration influencing factors of band gap characteristics of vibration iIsolation periodic piles with complex sections. Noise Vib. Control 2021, 41, 168–176. [Google Scholar]
- Gudapati, P.; Sudhi, D.; Biswas, S. Performance Characteristics of Y-Shaped Pile under Industrial Machine Induced Harmonic Vibration. Sādhanā 2024, 49, 123. [Google Scholar] [CrossRef]
- Liu, X.; Shi, Z.; Mo, Y.L. Comparison of 2D and 3D Models for Numerical Simulation of Vibration Reduction by Periodic Pile Barriers. Soil Dyn. Earthq. Eng. 2015, 79, 104–107. [Google Scholar] [CrossRef]
- Li, S.; Dou, Y.; Chen, T.; Xu, J.; Li, B.; Zhang, F. Designing a Broad Locally-Resonant Bandgap in a Phononic Crystals. Phys. Lett. A 2019, 383, 1371–1377. [Google Scholar] [CrossRef]
- Geng, Z.; Jin, D.; Yuan, D. Face Stability Analysis of Cohesion-Frictional Soils Considering the Soil Arch Effect and the Instability Failure Process. Comput. Geotech. 2023, 153, 105050. [Google Scholar] [CrossRef]
- He, C.; Zhou, S.; Guo, P. Mitigation of Railway-Induced Vibrations by Using Periodic Wave Impeding Barriers. Appl. Math. Model. 2022, 105, 496–513. [Google Scholar] [CrossRef]
- Pu, X.; Shi, Z. Surface-Wave Attenuation by Periodic Pile Barriers in Layered Soils. Constr. Build. Mater. 2018, 180, 177–187. [Google Scholar] [CrossRef]
- Huang, J.; Liu, W.; Shi, Z. Surface-Wave Attenuation Zone of Layered Periodic Structures and Feasible Application in Ground Vibration Reduction. Constr. Build. Mater. 2017, 141, 1–11. [Google Scholar] [CrossRef]
- Huang, H.W.; Wang, J.; Zhao, C.; Mo, Y.L. Two-Dimensional Finite-Element Simulation of Periodic Barriers. J. Eng. Mech. 2021, 147, 04020150. [Google Scholar] [CrossRef]
- Meng, Q.; Shi, Z. Vibration Isolation of Plane Waves by Periodic Pipe Pile Barriers in Saturated Soil. J. Aerosp. Eng. 2019, 32, 04018114. [Google Scholar] [CrossRef]
- Zhao, C.; Chen, C.; Zeng, C.; Bai, W.; Dai, J. Novel Periodic Pile Barrier with Low-Frequency Wide Bandgap for Rayleigh Waves. Int. J. Mech. Sci. 2023, 243, 108006. [Google Scholar] [CrossRef]
- Meng, Q.; Shi, Z. Propagation Attenuation of Plane Waves in Single-Phased Soil by Periodic Pile Barriers. Int. J. Geomech. 2018, 18, 04018035. [Google Scholar] [CrossRef]
- Pu, X.; Shi, Z. A Novel Method for Identifying Surface Waves in Periodic Structures. Soil Dyn. Earthq. Eng. 2017, 98, 67–71. [Google Scholar] [CrossRef]
- Graczykowski, B.; Alzina, F.; Gomis-Bresco, J.; Sotomayor Torres, C.M. Finite Element Analysis of True and Pseudo Surface Acoustic Waves in One-Dimensional Phononic Crystals. J. Appl. Phys. 2016, 119, 025308. [Google Scholar] [CrossRef]
- Badreddine Assouar, M.; Oudich, M. Dispersion Curves of Surface Acoustic Waves in a Two-Dimensional Phononic Crystal. Appl. Phys. Lett. 2011, 99, 123505. [Google Scholar] [CrossRef]
- Kattis, S.E.; Polyzos, D.; Beskos, D.E. Modelling of Pile Wave Barriers by Effective Trenches and Their Screening Effectiveness. Soil Dyn. Earthq. Eng. 1999, 18, 1–10. [Google Scholar] [CrossRef]
- Chopra, A.K. Dynamics of Structures: Theory and Applications to Earthquake Engineering, 2nd ed.; Prentice Hall: Upper Saddle River, NJ, USA, 2001; ISBN 978-0-13-086973-9. [Google Scholar]


| Components | Modulus (MPa) | Density (kg/m3) | Poisson’s Ratio |
|---|---|---|---|
| Steel piles | 206,000 | 7800 | 0.3 |
| Sandy soil | 20 | 1710 | 0.25 |
| (a) | |||||
| Number | Periodic Constant a (m) | Vertical Dimension n (m) | Horizontal Dimension q (m) | Vertical Dimension p (m) | Filling Fraction f (%) |
| 1 | 0.6 | 0.48 | 0.15 | 0.25 | 39.17 |
| 2 | 0.8 | 0.64 | 0.20 | 0.33 | 39.17 |
| 3 | 1.0 | 0.80 | 0.25 | 0.42 | 39.17 |
| 4 | 1.2 | 0.96 | 0.30 | 0.50 | 39.17 |
| 5 | 1.4 | 1.12 | 0.35 | 0.58 | 39.17 |
| (b) | |||||
| Number | Periodic constant a (m) | Vertical dimension n (m) | Horizontal dimension q (m) | Vertical dimension p (m) | Filling fraction f (%) |
| 1 | 1.2 | 0.55 | 0.25 | 0.25 | 19.97 |
| 2 | 1.2 | 0.65 | 0.25 | 0.25 | 25.17 |
| 3 | 1.2 | 0.75 | 0.25 | 0.25 | 30.38 |
| 4 | 1.2 | 0.85 | 0.25 | 0.25 | 35.59 |
| 5 | 1.2 | 0.95 | 0.25 | 0.25 | 40.80 |
| (c) | |||||
| Number | Periodic constant a (m) | Vertical dimension n (m) | Horizontal dimension q (m) | Vertical dimension p (m) | Filling fraction f (%) |
| 1 | 1.2 | 0.90 | 0.15 | 0.25 | 22.92 |
| 2 | 1.2 | 0.90 | 0.20 | 0.25 | 30.56 |
| 3 | 1.2 | 0.90 | 0.25 | 0.25 | 38.19 |
| 4 | 1.2 | 0.90 | 0.30 | 0.25 | 45.83 |
| 5 | 1.2 | 0.90 | 0.35 | 0.25 | 53.47 |
| (d) | |||||
| Number | Periodic constant a (m) | Vertical dimension n (m) | Horizontal dimension q (m) | Vertical dimension p (m) | Filling fraction f (%) |
| 1 | 1.2 | 0.90 | 0.25 | 0.20 | 39.93 |
| 2 | 1.2 | 0.90 | 0.25 | 0.25 | 38.19 |
| 3 | 1.2 | 0.90 | 0.25 | 0.30 | 36.46 |
| 4 | 1.2 | 0.90 | 0.25 | 0.35 | 34.72 |
| 5 | 1.2 | 0.90 | 0.25 | 0.40 | 32.99 |
| Characteristic Dimensions | n/p/q | LBF | UBF |
|---|---|---|---|
| n | 72.73% | 3.93% | 37.36% |
| q | 133.33% | 7.83% | 103.52% |
| p | 100% | 1.44% | 0.28% |
Disclaimer/Publisher’s Note: The statements, opinions and data contained in all publications are solely those of the individual author(s) and contributor(s) and not of MDPI and/or the editor(s). MDPI and/or the editor(s) disclaim responsibility for any injury to people or property resulting from any ideas, methods, instructions or products referred to in the content. |
© 2024 by the authors. Licensee MDPI, Basel, Switzerland. This article is an open access article distributed under the terms and conditions of the Creative Commons Attribution (CC BY) license (https://creativecommons.org/licenses/by/4.0/).
Share and Cite
Liu, J.; Li, X.; Cao, J.; Duan, Z.; Ye, Q.; Feng, G. Geometric Parameter Effects on Bandgap Characteristics of Periodic Pile Barriers in Passive Vibration Isolation. Symmetry 2024, 16, 1130. https://doi.org/10.3390/sym16091130
Liu J, Li X, Cao J, Duan Z, Ye Q, Feng G. Geometric Parameter Effects on Bandgap Characteristics of Periodic Pile Barriers in Passive Vibration Isolation. Symmetry. 2024; 16(9):1130. https://doi.org/10.3390/sym16091130
Chicago/Turabian StyleLiu, Jinglei, Xiuxin Li, Jinyuan Cao, Zhengchun Duan, Qingzhi Ye, and Guishuai Feng. 2024. "Geometric Parameter Effects on Bandgap Characteristics of Periodic Pile Barriers in Passive Vibration Isolation" Symmetry 16, no. 9: 1130. https://doi.org/10.3390/sym16091130
APA StyleLiu, J., Li, X., Cao, J., Duan, Z., Ye, Q., & Feng, G. (2024). Geometric Parameter Effects on Bandgap Characteristics of Periodic Pile Barriers in Passive Vibration Isolation. Symmetry, 16(9), 1130. https://doi.org/10.3390/sym16091130