Article

Research on Investment and Coordination Strategies for Supply Chain Resilience under Supply Disruption Risk

1
School of Economics and Management, Nanjing University of Aeronautics and Astronautics, Nanjing 210000, China
2
School of Economics and Management, Guangxi Normal University, Guilin 541000, China
*
Authors to whom correspondence should be addressed.
Symmetry 2024, 16(9), 1192; https://doi.org/10.3390/sym16091192
Submission received: 30 June 2024 / Revised: 14 August 2024 / Accepted: 26 August 2024 / Published: 10 September 2024
(This article belongs to the Section Mathematics)

Abstract

:
In the context of supply disruption, having a resilient supply chain is crucial for the survival and growth of enterprises. It is also essential for gaining a competitive advantage in a turbulent environment. Enterprises need to invest in supply chain resilience to better deal with future uncertainties. This paper constructs a Stackelberg game model with the manufacturer as the leader and the retailer as the follower. We explored how supply chain-related factors under supply interruption risk affect supply chain resilience investment, and studied how to choose supply chain coordination strategies to improve the effectiveness of manufacturer capacity recovery and mutual profits in the context of supply interruption. The study also analyzes the asymmetrical impact of changes in product order quantity, supply disruption probability, and the capacity recovery coefficient on retailer decision-making and the profits of supply chain members. The results indicate that manufacturer profits are negatively correlated with supply disruption probability, while retailer profits are positively correlated with supply disruption probability when product order quantities are low and negatively correlated when product order quantities are high. The supply chain resilience investment is positively correlated with the supply disruption probability. Furthermore, the effectiveness of the cost-sharing contract is closely related to product order quantity and supply disruption probability. When the product order quantity d < α L c [ 1 ξ a L + ξ a H ] + s α H ξ + w α L ( 1 ξ ) k or α H c [ 1 ξ a L + ξ a H ] + s α H ξ + w α L ( 1 ξ ) k < d < α H [ 1 ξ a L + ξ a H ] ( w c ) k , manufacturers can withstand the risk of supply interruption by investing in supply chain resilience alone. But when the product order quantity is α L c [ 1 ξ a L + ξ a H ] + s α H ξ + w α L ( 1 ξ ) k < d < α H c [ 1 ξ a L + ξ a H ] + s α H ξ + w α L ( 1 ξ ) k and α H [ 1 ξ a L + ξ a H ] ( w c ) k < d , the use of cost-sharing contracts is more effective. Additionally, when the sensitivity analysis is conducted, the capacity recovery coefficient positively correlates with supply chain profits in a decentralized mode. However, under the cost-sharing contract mode, it exhibits a U-shaped fluctuation pattern, indicating that the impact of improving capacity recovery efficiency on the profits of both parties is not symmetrical and linear. As ξ approaches 0.5, the profits of manufacturers and retailers decrease. Instead, it undergoes an initial decline followed by a subsequent increase, highlighting the nonlinear benefits of capacity recovery strategies under the cooperative approach.

1. Introduction

As economic globalization and regional economic integration trends deepen, the interconnections between supply chain enterprises become more intimate, and their cooperation more diversified and concrete [1]. The supply chain, as a complex system encompassing multiple stakeholders, follows the principle of efficiency prioritization to maximize profits [2]. Although supply chain diversification strategies have, to some extent, fostered the growth of corporate profits, they have inadvertently undermined supply chain resilience, rendering the supply chain architecture more fragile and reducing its overall capability to withstand external shocks and resist risks [3]. Consequently, when supply chains encounter risks such as market volatility and supplier reputation damage, specific nodes within the supply chain are vulnerable to shocks, leading to potential supply chain disruptions [4]. At the onset of the COVID-19 pandemic, China, a major global supplier of automotive parts, experienced widespread factory shutdowns, resulting in a worldwide shortage of components for automobile manufacturers. For instance, the lockdown in Wuhan, a critical hub for automotive parts production and logistics, directly led to reduced production or temporary shutdowns of production lines for numerous enterprises in the global automotive supply chains. The estimated economic losses amounted to billions of dollars. In light of the significant economic impact caused by supply disruptions, enhancing supply chain resilience has been identified as a fundamental solution to address this challenge. Therefore, exploring how to build a more adaptive and resilient supply chain system to ensure that the supply chain can continuously operate in a business environment with high uncertainty and obtain strong shock resistance to cope with the challenges posed by various risks is not only a theoretical focus in academic discussions but also an urgent practical necessity for enterprises.
In the concept of supply chain management, supply chain resilience refers to the systemic adaptive capability to swiftly plan and maintain normal operations when facing uncertain risks [5]. Therefore, a resilient supply chain not only reacts quickly upon predicting risks but also recovers rapidly and grows following disruptions [6]. Consequently, enterprises should consider enhancing supply chain resilience as a critical strategic decision and integrate resilience elements as essential metrics for sustaining competitive advantages in the supply chain [7]. While supply chain resilience enhances the supply chain’s ability to withstand risks, excessive investment in resilience may potentially reduce supply chain profitability, thereby hindering enterprise development [8]. Hence, navigating optimal strategies for supply chain resilience investment in complex and volatile market environments requires thorough investigation [9].
In the context of supply disruption risks, existing research predominantly focuses on optimizing supply chain structures to resist potential risks yet overlooks the question of how supply chains should effectively self-repair once disruption events occur [10]. Measures such as establishing excess inventory reserves, implementing multi-sourcing strategies, and backup supplier systems can alleviate immediate pressures. However, these actions typically concentrate costs on the affected party and come with drawbacks such as prolonged recovery processes, inefficiencies, and a lack of willingness for proactive improvements [11]. With the increasing complexity of supply chain structures and fierce market competition, enterprises tend to favor cost-effective but less validated single-supplier models, exacerbating potential risks. Therefore, from a long-term strategic perspective, fostering cooperative alliances among all participants in the supply chain is crucial. Specifically, downstream enterprises can intervene through collaborative strategies to assist upstream suppliers in enhancing supply stability and resilience. This approach serves as a fundamental pathway to improving overall supply chain resilience [12]. Therefore, how to actively promote resilience investment among supply chain members to enhance the stability of the supply chain has become a major challenge. In response to a research gap, this study aims to analyze the supply chain resilience investment mechanisms of manufacturers and retailers under different interruption probability scenarios based on game theory.
This article systematically addresses the following question: How do the relevant factors of manufacturers and retailers affect supply chain resilience investment? How to choose supply chain coordination strategies under different supply interruption probabilities and other influencing factors? To achieve these goals, we constructed a manufacturer-led Stackelberg game model and conducted numerical simulations. The main research results are as follows: (1) A supply chain resilience investment game model was developed under different supply interruption probability scenarios, and the resilience investment and mechanism of each subject in the supply chain were explored; (2) The impact of parameters such as product order quantity d, supply interruption risk λ, capacity recovery coefficient ξ , and unit product shortage loss u on supply chain resilience investment was elucidated through numerical simulation methods; (3) A cost-sharing model has been proposed, providing the optimal coordination strategy for addressing the resilience investment decision-making problem in supply chains under supply disruptions.
The possible innovation of this article is that the model provides a detailed analysis of supply chain resilience investment strategies under different supply interruption risks. And the model also considers resilience investment strategies in both scenarios of uninterrupted and interrupted supply. The model considers the impact of different levels of capacity recovery on supply chain resilience investment. Different levels of capacity recovery will affect the product supply capability of manufacturers, and different levels of capacity recovery will affect the coordination strategy between manufacturers and retailers in terms of supply chain resilience cooperation.
The study developed a Stackelberg game model led by manufacturers, focusing on a secondary supply chain involving a single manufacturer and retailer. This model comprehensively analyzed resilience investment strategies in the face of varying supply disruption intensity and risk levels. This research contributes to integrating supply disruption risks with supply chain resilience, quantifying resilience investments using game theory, expanding theoretical frameworks for resilience investment strategies in supply disruption management, and developing a research framework for resilience investment under supply disruption scenarios. The aim is to optimize strategies for supply chain resilience investment. Finally, the paper proposes a cost-sharing model that offers an optimal coordination strategy for addressing resilience investment decisions under supply disruption.
This paper is structured as follows: Section 2 provides a literature review, which introduces the terms and research relevant to this paper. This is followed by the model construction and game decision model analysis. Section 4 performs numerical simulation analysis. Section 5 summarizes the main findings and suggests directions for future research.

2. Literature Review

2.1. Supply Disruption

Supply disruption, a central challenge in supply chain management, stems from fundamental issues such as product quality defects and insufficient production capacity on the supplier side. This disruption has far-reaching impacts and has become a focal point of academic inquiry [13]. Research indicates that factors like supply shortages, adverse changes in market conditions, and disruptions in logistics contribute collectively to supply chain disruptions. These disruptions propagate downward layer by layer from their source and can disrupt the regular operation of the entire supply chain [14]. Furthermore, consumer behavior undergoes significant changes in response to supply disruptions. To mitigate the inconvenience caused by shortages, consumers tend to stockpile goods extensively, exacerbating market demand imbalances. This behavior further affects downstream operations in the supply chain and distorts actual consumer demand [15].
In the study of supply disruption risk, scholars have worked to develop innovative approaches to identify, assess, and address this challenge. On the one hand, advancements in risk identification and assessment technologies include the fuzzy DEMATEL method, which systematically analyzes uncertainty and risk factors in supply chains using fuzzy logic systems [16]. The application of Conditional Random Field models enables real-time detection of disruption events within supply chains, facilitating rapid responses by enterprises [17]. Additionally, the Markov Chain model not only monitors risks but also dynamically adjusts inventory strategies based on supplier status, enhancing supply chain adaptability [18].
On the other hand, research on strategies to cope with supply disruptions is equally active, encompassing various approaches aimed at enhancing risk resilience and sustaining competitive advantage through technological innovations. One such strategy is digital transformation, which aims to bolster enterprises’ resilience and ongoing competitiveness, particularly small- and medium-sized enterprises in the service sector [19]. Additionally, the introduction of revenue-sharing contracts, grounded in game theory, encourages cooperation and risk-sharing among supply chain nodes. This mechanism ensures that even in environments with high demand and supply uncertainties, the supply chain can maintain coordination and achieve multi-party win-win outcomes [20,21]. For specific industries such as apparel manufacturing, studies have proposed using deposit systems as a risk buffer, ensuring close collaboration between upstream and downstream supply chain entities [22]. In the field of cold chain products, integrated inspection strategies have been innovated to reduce costs while ensuring the continuity of the product supply chain [23]. These diverse strategies collectively contribute to enhancing the resilience and robustness of supply chains across various sectors.
In particular, scholars have constructed time-sensitive dynamic models in response to global public health events such as COVID-19. These models assist decision-makers in balancing epidemic prevention measures with economic activities, thereby effectively mitigating the economic losses caused by supply chain disruptions during pandemics [24,25]. Furthermore, research on dual-channel supply chains has highlighted the limitations of single coordination mechanisms. It suggests that only by combining the revenue and distribution cost-sharing mechanisms can conflicts between channels be effectively managed, ensuring the smooth operation of the supply chain [26,27]. Table 1 summarizes the research results on supply disruptions in recent years.

2.2. Supply Chain Resilience

Supply chain resilience refers to the ability of a supply chain to quickly respond to and address disruptive events to maintain normal operations [28]. From the dynamic capabilities perspective, a resilient supply chain not only accurately predicts potential disruptions but also demonstrates strong capabilities in responding to, recovering from, and even growing despite such challenges [29,30]. Analyzing supply chain resilience across different phases of risk occurrence can be categorized into four phases: readiness, response, recovery, and growth [31]. In the readiness phase, supply chains can enhance predictive capabilities by fostering the risk management culture and improving supply chain visibility. These enable supply chains to detect early warnings and effectively plan, assess, and mitigate risks [32]. During the response phase, enterprises can increase their reaction capabilities by improving information sharing and building trust so that the supply chain can swiftly and effectively respond to disruptions [33]. In the recovery phase, the supply chain can bolster its recovery capabilities by increasing redundancy, optimizing its structure, and enhancing logistics capabilities [34]. Finally, in the growth phase, the supply chain can respond to disruptions and achieve new advancements by strengthening its innovation and absorptive capacities [35].
Scholars generally study supply chain resilience from two main perspectives: influencing factors and internal mechanisms [36,37]. Regarding influencing factors, some researchers have analyzed the key factors affecting resilience and evaluated resilience levels [38,39]. Cohen et al. [40] introduced a “Triple-P” framework, highlighting that different resilience requirements necessitate different approaches. They identified “homogeneity of internal supply chain processes” and “supply chain integration between enterprises” as critical factors influencing supply chain resilience. Shanker et al. [41] examined the perishable food supply chain and found that price fluctuations, panic buying, and hoarding are key factors affecting its resilience. Guoli et al. [42] explored the factors influencing supply chain resilience from the perspectives of dynamic capabilities and relationships, highlighting its value for operational performance from a sustainability viewpoint. Mohamad et al. [43] proposed 14 indicators for assessing supply chain resilience, focusing on vulnerability and dynamic capabilities. They recommended enhancing dynamic capabilities to reduce vulnerabilities. Zhang et al. [44] developed a supply chain resilience evaluation system for small- and medium-sized enterprises using fuzzy AHP and Topsis. They concluded that solely enhancing dynamic capabilities or reducing vulnerabilities is not the optimal strategy.
Some scholars have extensively explored the internal mechanisms of supply chain resilience [45,46]. Ke et al. [47] utilized grounded theory to identify key elements of supply chain resilience, including product supply resilience, resource resilience, partner resilience, information response resilience, capital resilience, and knowledge resilience, and further analyzed the relevant relationships through structural equation modeling. Siva Kumar and Anbanandam [35] combined the interpretive structural model with Bayesian network methods to analyze not only the correlation between the indicators but also the degree of interdependence of the indicators. Vimal et al. [48] combined the decision-making trial and evaluation laboratory method with the total interpretive structural modeling approach to determine the causal relationships and influence strengths among factors in implementing resilient net-zero carbon supply chains. Liu et al. [49] employed an integrated multi-criteria decision-making method to study the hierarchy and causal relationships among factors influencing maritime supply chain resilience. They concluded that redundancy planning is the most significant factor affecting supply chain resilience. Despite the abundant literature on the concepts, influencing factors, and internal mechanisms of supply chain resilience, research on quantifying resilience investments remains underdeveloped. And supply chain resilience investment not only has the effect of risk mitigation, but also can control costs. Although increasing resilience in the short term may require additional investment, in the long run, it can avoid higher losses caused by supply chain disruptions, ensuring that businesses can continue to operate during crises and maintain core functions without interruption. Therefore, further research is needed on investment strategies for supply chain resilience under supply interruption risk scenarios.
Based on existing research findings, studies on supply disruptions have mostly focused on risk assessment and response strategies. Most research on supply chain resilience focuses on the influencing factors and underlying mechanisms of supply chain resilience. However, little is known about the relationship between supply interruption probability and supply chain resilience investment. And research literature on supply disruptions considers using deposit systems and contract coordination to address supply chain uncertainty. Although these methods can to some extent resist the risk of supply interruption, they do not consider the response plans under different supply interruption probabilities, nor do they lack a comprehensive supply chain resilience improvement strategy to maintain the normal operation of the supply chain. However, research on supply chain resilience mostly focuses on the influencing factors and underlying mechanisms of supply chain resilience, and rarely quantifies the level of investment in supply chain resilience. Therefore, in order to address the research limitations mentioned earlier, this article needs to further study the impact of different supply interruption probabilities on supply chain resilience investment, and propose supply chain resilience investment models under different supply interruption risks, thereby enriching the literature on supply interruption and supply chain resilience. Furthermore, it effectively solves the problem of how to accurately assess risks and allocate resources reasonably in uncertain environments to enhance supply chain resilience in supply chain management, providing new theoretical guidance and practical strategies for improving the overall adaptability and resilience of the supply chain.

3. Model Construction and Game Decision Model Analysis

3.1. Problem Description and Modeling Assumptions

Due to the destruction and uncertainty of supply chain risks, the manufacturer will make resilience investment as a risk mitigation strategy. Based on the evolutionary analysis of stakeholder behavior presented earlier, the retailer, acting as an “economic agent”, has two strategic options: refrain from investing in resilience or engage in coordinated decision-making. The retailer proposes a cost-sharing contract when both parties opt for coordinated action. In response, the manufacturer determines the optimal capacity recovery based on the cost-sharing contract to mitigate the losses incurred from disruptions. The timeline of the entire event is illustrated in Figure 1.
For purposes of calculation and description, the following hypotheses are proposed without loss of generality:
Hypothesis 1:
It is assumed that information is shared between manufacturers and retailers, aiming to maximize expected profits. Additionally, manufacturers will ship the goods to retailers upon completing all orders.
Hypothesis 2:
Due to the impact of uncertain factors, manufacturers are prone to supply disruptions. Let the probability of the supply disruption occurring be denoted as  λ , while the probability of supply non-disruption is  1 λ .
Hypothesis 3:
Due to the uncertainty in the capacity recovery ability after a supply disruption, let α be a random variable following a binomial distribution, representing the recovery level of the supply chain. After resilience investments in the supply chain, the manufacturer has a probability ξ of achieving a high recovery level α H and a probability 1 ξ of attaining a low recovery level α L . Thus, the recovery level is denoted as E α = 1 ξ a L + ξ a H .
Hypothesis 4:
To maximize capacity recovery and meet demand, the manufacturer may appropriately increase the recovery amount based on the order quantity d to ensure that the deliverable quantity, m i n d , α e , is higher. However, considering recovery and production costs, the capacity recovery amount will not result in d < α L .
Hypothesis 5:
When a supply disruption occurs, the supply chain resilience investment level is e , with the associated cost of resilience investment given by C e = k e 2 / 2 .
Hypothesis 6:
For the retailer, the supply amount it receives is α e . There may be a discrepancy between this recovery amount and the order quantity d . When the actual recovery amount is less than the order quantity, the retailer incurs a stockout loss. Suppose the profit loss per unit of stockout is μ ; then the retailer’s stockout loss is μ d α e + . When the actual recovery amount exceeds the order quantity, the manufacturer generates surplus products. Suppose each unit of surplus product has a salvage value of s ; then the manufacturer’s revenue from surplus products is s d α e + .
The symbols in this Section are described in Table 2.

3.2. Decentralized Decision Model under the Supply Disruption Risk (Model M)

This Section constructs a decision model (referred to as Model M) in which the manufacturer independently invests in resilience. The aim is to explore the changes in profits for each supply chain participant under this scenario. In this case, the manufacturer determines its capacity recovery based on the order quantity provided by the retailer. To investigate the impact of supply disruption risk on the profits and resilience investments of supply chain participants, the profit functions for the manufacturer and the retailer are constructed as follows:
max π m M = λ [ w E min { d , α e } c E α e k e 2 2 + s ( α e d ) + ] + ( 1 λ ) ( w c ) d
max π r M = λ [ ( p w ) E min { d , α e } E u ( d α e ) + ] + ( 1 λ ) ( p w ) d

3.2.1. Manufacturer’s Profit Decision Model

To derive the optimal supply chain resilience investment level e , the manufacturer’s profit function is simplified as follows:
max π m M = λ [ ( w c ) E α e k e 2 2 ] + ( 1 λ ) ( w c ) d α H e < d λ [ w ξ d + w ( 1 ξ ) α L e c E α e k e 2 2 + s ξ ( α H e d ) ] + ( 1 λ ) ( w c ) d α L e < d < α H e
The manufacturer’s profit is solved by the Lagrangian function and its K-T condition with the following results:
max π m M = λ [ ( w c ) E α e k e 2 2 ] + ( 1 λ ) ( w c ) d + v 1 ( d α H e ) s . t . v 1 0 , v 1 ( d α H e ) = 0 λ [ w ξ d + w ( 1 ξ ) α L e c E α e k e 2 2 + s ξ ( α H e d ) ] + ( 1 λ ) ( w c ) d + v 2 ( α H e d ) + v 3 ( d α L e ) s . t . v 2 0 , v 2 ( α H e d ) = 0 . v 3 0 , v 3 ( d α L e ) = 0
And due to E α = 1 ξ a L + ξ a H . Subsequently, the supply chain resilience investment level e and the manufacturer’s profit π m can be obtained as:
e = [ 1 ξ a L + ξ a H ] ( w c ) k α H [ 1 ξ a L + ξ a H ] ( w c ) k < d d α H α H c [ 1 ξ a L + ξ a H ] + s α H ξ + w α L ( 1 ξ ) k < d < α H [ 1 ξ a L + ξ a H ] ( w c ) k c [ 1 ξ a L + ξ a H ] + s α H ξ + w α L ( 1 ξ ) k α L c [ 1 ξ a L + ξ a H ] + s α H ξ + w α L ( 1 ξ ) k < d < α H c [ 1 ξ a L + ξ a H ] + s α H ξ + w α L ( 1 ξ ) k d α L d < α L c [ 1 ξ a L + ξ a H ] + s α H ξ + w α L ( 1 ξ ) k
π m M = d ( w c ) ( 1 λ ) + [ 1 ξ a L + ξ a H ] 2 λ ( w c ) 2 2 k α H [ 1 ξ a L + ξ a H ] ( w c ) k < d d ( w c ) ( 1 λ ) λ [ k d 2 2 α 2 H [ 1 ξ a L + ξ a H ] d ( w c ) α H ] α H c [ 1 ξ a L + ξ a H ] + s α H ξ + w α L ( 1 ξ ) k < d < α H [ 1 ξ a L + ξ a H ] ( w c ) k d ( w c ) ( 1 λ ) + λ { d ξ w ( ε 1 ) 2 2 k ξ s ( d + α H ε 1 k ) + c ε 1 [ α H ξ α L ( ξ 1 ) ] k + w ε 1 α L ( ξ 1 ) k } α L c [ 1 ξ a L + ξ a H ] + s α H ξ + w α L ( 1 ξ ) k < d < α H c [ 1 ξ a L + ξ a H ] + s α H ξ + w α L ( 1 ξ ) k d 2 α 2 L ( c w ) + dk λ + 2 α 2 L ξ λ ( s c ) 2 α H α L ξ λ ( s c ) 2 a 2 L d < α L c [ 1 ξ a L + ξ a H ] + s α H ξ + w α L ( 1 ξ ) k
where ε 1 = c [ 1 ξ a L + ξ a H ] s ξ a H 1 ξ w a L .
Based on the supply chain capacity recovery level, it can be observed that the manufacturer’s optimal capacity recovery amount [ 1 ξ a L + ξ a H ] ( w c ) k is related to the capacity recovery coefficient ξ , the wholesale price w , the manufacturer’s production cost c , the manufacturer’s capacity recovery level α i , and the supply chain resilience investment cost sensitivity coefficient k . Supply chain resilience investment level e varies under different product order quantities, and it decreases as the order quantity d decreases. This is consistent with real-world practice, where enterprises always seek a balance between profit and investment cost. When the product order quantity is minimal, the manufacturer can meet demand with a lower capacity recovery level α L . At this point, the manufacturer’s optimal recovery amount is c [ 1 ξ a L + ξ a H ] + s α H ξ + w α L ( 1 ξ ) k . As the product order quantity increases, the supply chain resilience investment level e gradually approaches d α H . Once the order quantity exceeds c [ 1 ξ a L + ξ a H ] + s α H ξ + w α L ( 1 ξ ) k , the manufacturer’s resilience investment level stabilizes at [ 1 ξ a L + ξ a H ] ( w c ) k , influenced by the manufacturer capacity recovery coefficient ξ . At this point, the resilience investment level e is positively correlated with the manufacturer’s revenue (the wholesale price w ) and the recovery level α i , and negatively correlated with the product production cost c and the sensitivity coefficient of the supply chain resilience investment cost k . Overall, the supply chain resilience investment level exhibits a growth–stable–growth–stable wave pattern as the product order quantity increases.

3.2.2. Retailer’s Profit Decision Model

According to the previous analysis, the retailer’s profit function can be simplified as:
max π r M = λ [ ( p w + u ) E α e u d ] + ( 1 λ ) ( P w ) d α H e < d λ [ ( p w ) ( ξ d + ( 1 ξ ) α L e ) u ( 1 ξ ) ( d α L e ) ] + ( 1 λ ) ( P w ) d α L e < d < α H e
Entering the supply chain resilience investment level e into Equation (7) yields the retailer’s profit as:
π r M = λ [ ( p w + u ) [ 1 ξ a L + ξ a H ] 2 ( w c ) k u d ] + ( 1 λ ) ( P w ) d α H [ 1 ξ a L + ξ a H ] ( w c ) k < d λ { ( p w + u ) [ 1 ξ a L + ξ a H ] d α H u d } + ( 1 λ ) ( P w ) d α H c [ 1 ξ a L + ξ a H ] + s α H ξ + w α L ( 1 ξ ) k < d < α H [ 1 ξ a L + ξ a H ] ( w c ) k λ [ u ( d + α L ε 1 k ) ( 1 ξ ) + d ξ ( p w ) α L ( p w ) ( 1 ξ ) ε 1 k α L c [ 1 ξ a L + ξ a H ] + s α H ξ + w α L ( 1 ξ ) k < d < α H c [ 1 ξ a L + ξ a H ] + s α H ξ + w α L ( 1 ξ ) k ( p w ) d d < α L c [ 1 ξ a L + ξ a H ] + s α H ξ + w α L ( 1 ξ ) k
where ε 1 = c [ 1 ξ a L + ξ a H ] s ξ a H 1 ξ w a L .
From the above results, it can be concluded that when the retailer chooses not to invest in resilience in the absence of incentive measures, their profitability entirely depends on the capacity recovery determined by the manufacturer. In practice, the greater the manufacturer’s capacity recovery ability, the less likely the retailer’s profit will decrease due to insufficient supply capability. It is worth noting that when the potential loss due to stockouts is too significant for the retailer, they will opt to invest in resilience, enabling the manufacturer to achieve more excellent capacity recovery. The previous analysis shows that the profitability levels of both the manufacturer and the retailer are closely related to the product order quantity d and are constrained by multiple variables such as production cost c , wholesale price w , and recovery level α i .
Given that retailers find it challenging to estimate the manufacturer’s actual capacity recovery level, they can indirectly encourage the manufacturer to scale up capacity recovery by assisting in sharing part of capacity recovery costs with the manufacturer, sharing information with the manufacturer, and reducing its financial burden. In certain situations, such measures can lead to a Pareto improvement for both parties, enhancing the benefits without harming either party. The following content will elaborate on the decision-making and cost-sharing strategies under a centralized decision-making model, exploring the effectiveness of the retailer’s cost-sharing measures in promoting the manufacturer’s capacity recovery in the context of supply chain disruption.

3.3. Centralized Decision Model under the Supply Disruption Risk (Model C)

In this Section, the manufacturer and retailer are considered as a single decision-making entity, with the entire supply chain viewed as a benchmark model. The total profit of the supply chain equals the sum of the retailer’s sales revenue and salvage value minus the manufacturer’s production cost and stockout cost. The coordinated decision-making model for the overall supply chain profit (referred to as Model C) is as follows:
max π s c C = λ [ p E min { d , α e } E u ( d α e ) + c E α e k e 2 2 + E s ( α e d ) + ] + ( 1 λ ) ( p c ) d
In order to find an optimal solution for the supply chain resilience investment level e , the manufacturer’s profit function is simplified as:
max π s c C = λ [ ( p c ) E α e E u ( d α e ) k e 2 2 ] + ( 1 λ ) ( p c ) d α H e < d λ [ p [ ξ d + ( 1 ξ ) α L e ] u ( 1 ξ ) ( d α L e ) c E α e k e 2 2 + s ξ ( α H e d ) ] + ( 1 λ ) ( p c ) d α L e < d < α H e
The manufacturer’s profit is solved by the Lagrangian function and its K-T condition with the following result:
max π s c C = λ [ ( p c ) E α e E u ( d α e ) k e 2 2 ] + ( 1 λ ) ( p c ) d + v 4 ( d α H e ) s . t . v 4 0 , v 4 ( d α H e ) = 0 λ [ p [ ξ d + ( 1 ξ ) α L e ] c E α e u ( 1 ξ ) ( d α L e ) k e 2 2 + s ξ ( α H e d ) ] + ( 1 λ ) ( p c ) d + v 5 ( α H e d ) + v 6 ( d α L e ) s . t . v 5 0 , v 5 ( α H e d ) = 0 . v 6 0 , v 6 ( d α L e ) = 0
and due to E α = 1 ξ a L + ξ a H . The supply chain resilience investment level e and the overall supply chain profit π s c C can subsequently be obtained as:
e = [ 1 ξ a L + ξ a H ] ( p c + u ) k α H [ 1 ξ a L + ξ a H ] ( p c + u ) k < d d α H α H c [ 1 ξ a L + ξ a H ] + s α H ξ + ( p + u ) α L ( 1 ξ ) k < d < α H [ 1 ξ a L + ξ a H ] ( p c + u ) k c [ 1 ξ a L + ξ a H ] + s α H ξ + ( p + u ) α L ( 1 ξ ) k α L c [ 1 ξ a L + ξ a H ] + s α H ξ + ( p + u ) α L ( 1 ξ ) k < d < α H c [ 1 ξ a L + ξ a H ] + s α H ξ + ( p + u ) α L ( 1 ξ ) k d α L d < α L c [ 1 ξ a L + ξ a H ] + s α H ξ + ( p + u ) α L ( 1 ξ ) k
π s c C = d ( 1 λ ) ( p c ) + λ { u d [ 1 ξ a L + ξ a H ] 2 ( p c + u ) 2 2 k } α H [ 1 ξ a L + ξ a H ] ( p c + u ) k < d d ( 1 λ ) ( p c ) λ { u d + k d 2 2 α 2 H d [ 1 ξ a L + ξ a H ] ( p c + u ) α H } α H c [ 1 ξ a L + ξ a H ] + s α H ξ + ( p + u ) α L ( 1 ξ ) k < d < α H [ 1 ξ a L + ξ a H ] ( p c + u ) k d ( 1 λ ) ( p c ) + λ [ u ( d + α L ε 2 k ) ( ξ 1 ) ε 2 2 2 k + d ξ p ξ s ( d + α H ε 2 k ) + c ε 2 [ 1 ξ a L + ξ a H ] k + α L p ( ξ 1 ) ε 2 k α L c [ 1 ξ a L + ξ a H ] + s α H ξ + ( p + u ) α L ( 1 ξ ) k < d < α H c [ 1 ξ a L + ξ a H ] + s α H ξ + ( p + u ) α L ( 1 ξ ) k d 2 α 2 L ( c p ) + dk λ 2 α L ( a H α L ) ξ ( s c ) λ 2 a 2 L d < α L c [ 1 ξ a L + ξ a H ] + s α H ξ + ( p + u ) α L ( 1 ξ ) k
where ε 2 = c [ 1 ξ a L + ξ a H ] α H ξ s α L ( p + u ) ( 1 ξ ) .
In the centralized model, when the product order quantity is minimal, the manufacturer can meet the demand with a lower capacity recovery level α L , which is not influenced by the order quantity. The manufacturer’s optimal recovery amount is c [ 1 ξ a L + ξ a H ] + s α H ξ + ( p + u ) α L ( 1 ξ ) k . This recovery level is influenced by several factors, including the supply disruption probability ξ , sales price p , production cost c , capacity recovery α i , and product salvage value s . When the product order quantity is large, a high recovery level α H is needed to meet the demand. As the product order quantity increases, the supply chain resilience investment level continues to rise. Once the product order quantity exceeds a H [ 1 ξ a L + ξ a H ] ( p c + u ) k , the manufacturer’s supply chain resilience investment level stabilizes at [ 1 ξ a L + ξ a H ] ( p c + u ) k , which is influenced by the supply disruption probability ξ . At this point, the resilience investment level e is positively correlated with the product sales price p , recovery level α i , and stockout loss u . Conversely, it negatively correlates with the product production cost c and the supply chain resilience investment cost sensitivity coefficient k .
By analyzing the overall supply chain profit under the coordinated decision model, it is clear that the supply chain’s recovery level can handle a specific range of product order quantities. However, when the product order quantity exceeds the upper limit of recovery capacity, the supply chain will still face supply shortages. It is worth noting that the manufacturer can achieve complete delivery when the product order quantity is minimal. In this case, the optimal recovery amount is significantly lower than the optimal recovery amount at the maximum product order quantity. This is likely because, with smaller product order quantities, the supply chain has resilience and lacks the motivation for active recovery, thus avoiding the disruption issues seen with larger order quantities.

3.4. Decision Model for Cost-Sharing under the Supply Disruption Risk (Model M-C)

3.4.1. Manufacturer’s Profit Decision Model under the Cost-Sharing Contract

According to the cost-sharing concept, in the coordinated decision model (referred to as Model M-C), the retailer bears a ratio φ of the resilience investment cost. Under this contract, the manufacturer’s profit function can be expressed as:
max π m M C = λ [ w E min { d , α e } c E α e ( 1 φ ) k e 2 2 + s ( α e d ) + ] + ( 1 λ ) ( w c ) d
In order to find an optimal solution for the supply chain resilience investment level e , the manufacturer’s profit function can be simplified as:
max π m M C = λ [ ( w c ) E α e ( 1 φ ) k e 2 2 ] + ( 1 λ ) ( w c ) d α H e d λ [ w ξ d + w ( 1 ξ ) α L e c E α e ( 1 φ ) k e 2 2 + s ξ ( α H e d ) ] + ( 1 λ ) ( w c ) d α L e d < α H e
The manufacturer’s profit is obtained by solving for the Lagrangian function and its K-T condition:
max π m M C = λ [ ( w c ) E α e ( 1 φ ) k e 2 2 ] + ( 1 λ ) ( w c ) d + v 7 ( d α H e ) s . t . v 7 0 , v 7 ( d α H e ) = 0 λ [ w ξ d + w ( 1 ξ ) α L e c E α e ( 1 φ ) k e 2 2 + s ξ ( α H e d ) ] + ( 1 λ ) ( w c ) d + v 8 ( α H e d ) + v 9 ( d α L e ) s . t . v 8 0 , v 8 ( α H e d ) = 0 . v 9 0 , v 9 ( d α L e ) = 0
and due to E α = 1 ξ a L + ξ a H . Subsequently, the supply chain resilience investment level e and the manufacturer’s profit π m can be obtained as:
e = [ 1 ξ a L + ξ a H ] ( w c ) k ( 1 φ ) α H [ 1 ξ a L + ξ a H ] ( w c ) k ( 1 φ ) < d d α H α H c [ 1 ξ a L + ξ a H ] + s α H ξ + w α L ( 1 ξ ) k ( 1 φ ) < d < α H [ 1 ξ a L + ξ a H ] ( w c ) k ( 1 φ ) c [ 1 ξ a L + ξ a H ] + s α H ξ + w α L ( 1 ξ ) k ( 1 φ ) α L c [ 1 ξ a L + ξ a H ] + s α H ξ + w α L ( 1 ξ ) k ( 1 φ ) < d < α H c [ 1 ξ a L + ξ a H ] + s α H ξ + w α L ( 1 ξ ) k ( 1 φ ) d α L d < α L c [ 1 ξ a L + ξ a H ] + s α H ξ + w α L ( 1 ξ ) k ( 1 φ )
π m M C = d ( w c ) ( 1 λ ) + [ 1 ξ a L + ξ a H ] 2 λ ( w c ) 2 2 k ( 1 φ ) α H [ 1 ξ a L + ξ a H ] ( w c ) k ( 1 φ ) < d d ( w c ) ( 1 λ ) λ [ k d 2 ( 1 φ ) 2 α 2 H [ 1 ξ a L + ξ a H ] d ( w c ) α H ] α H c [ 1 ξ a L + ξ a H ] + s α H ξ + w α L ( 1 ξ ) k ( 1 φ ) < d < α H [ 1 ξ a L + ξ a H ] ( w c ) k ( 1 φ ) d ( w c ) ( 1 λ ) λ [ ξ s ( d + a L ε 1 k ( 1 φ ) ) + ε 2 1 2 k ( 1 φ ) d ξ w c [ 1 ξ a L + ξ a H ] ε 1 k ( 1 φ ) + w α L ε 1 ( 1 ξ ) k ( 1 φ ) ] α L c [ 1 ξ a L + ξ a H ] + s α H ξ + w α L ( 1 ξ ) k ( 1 φ ) < d < α H c [ 1 ξ a L + ξ a H ] + s α H ξ + w α L ( 1 ξ ) k ( 1 φ ) d ( w c ) ( 1 λ ) λ [ ξ s ( d d α H α L ) d ξ w + d w ( ξ 1 ) + d 2 k ( 1 φ ) 2 α 2 L + c d [ 1 ξ a L + ξ a H ] α L ] d < α L c [ 1 ξ a L + ξ a H ] + s α H ξ + w α L ( 1 ξ ) k ( 1 φ )
where ε 1 = c [ 1 ξ a L + ξ a H ] s ξ a H 1 ξ w a L .
Compared to the situation without the cost-sharing contract, the manufacturer’s optimal capacity recovery strategies remain unchanged for minimal and maximal product order quantities, α L c 1 ξ α L + ξ α H + s α H ξ + w α L 1 ξ k 1 φ and α H 1 ξ α L + ξ α H w c k 1 φ respectively. However, it is noteworthy that when α L c 1 ξ α L + ξ α H + s α H ξ + w α L 1 ξ k 1 φ < d < α H 1 ξ α L + ξ α H w c k 1 φ , due to the retailer’s effective incentive measures, the manufacturer’s optimal capacity recovery level has increased. When deciding on their maximum capacity recovery level, manufacturers balance the product order quantity against the supply disruption risk. This decision-making tendency changes, particularly when the retailer shares the supply chain resilience investment cost as an incentive. As a result, the manufacturer’s capacity recovery decisions become less dependent on the product order quantity and more stable and independent of demand fluctuations.

3.4.2. Retailer’s Profit Decision Model under the Cost-Sharing Contract

Based on the previous analysis, the retailer profit’s function can be simplified as:
max π r M C = λ [ ( p w + u ) E α e u d φ k e 2 2 ] + ( 1 λ ) ( P w ) d α H e < d λ [ ( p w ) ( ξ d + ( 1 ξ ) α L e ) u ( 1 ξ ) ( d α L e ) φ k e 2 2 ] + ( 1 λ ) ( P w ) d α L e < d < α H e
(1) When e * = d α L , the retailer’s profit decreases as the cost-sharing ratio increases. Since a lower capacity recovery level is sufficient to meet the product order quantity, the retailer is unwilling to bear the supply chain resilience investment cost. In this case, the entire supply chain resilience investment cost is borne by the manufacturer. The profit functions are as follows:
π r M C = λ [ ( p w ) ( ξ d + ( 1 ξ ) α L e ) u ( 1 ξ ) ( d α L e ) φ k e 2 2 ] + ( 1 λ ) ( P w ) d
At this time, d π r M C d φ = k e 2 2 < 0 , d < α L c [ 1 ξ a L + ξ a H ] + s α H ξ + w α L ( 1 ξ ) k .
(2) When e * = c [ 1 ξ a L + ξ a H ] + s α H ξ + w α L ( 1 ξ ) k ( 1 φ ) , then
φ = 1 c [ 1 ξ a L + ξ a H ] + s α H ξ + w α L ( 1 ξ ) k e .
Therefore, we can construct a function regarding e and build the Lagrangian function.
π r M C = λ [ ( p w ) ( ξ d + ( 1 ξ ) α L e ) u ( 1 ξ ) ( d α L e ) k e 2 2 + c [ 1 ξ a L + ξ a H ] + s α H ξ + w α L ( 1 ξ ) 2 e ] + ( 1 λ ) ( P w ) d + v 10 ( α H e d ) + v 11 ( d α L e )
s . t .   v 10 0 , v 10 ( α H e d ) = 0 ;   v 11 0 , v 11 ( d α L e ) = 0 .
The optimal cost-sharing ratio for the manufacturer under condition α L ( 2 p w + 2 u ) ( 1 ξ ) a L c [ 1 ξ a L + ξ a H ] + s α H ξ 2 k < d < α H ( 2 p w + 2 u ) ( 1 ξ ) a L c [ 1 ξ a L + ξ a H ] + s α H ξ 2 k can be obtained as:
φ * = 1 2 { c [ 1 ξ a L + ξ a H ] + s α H ξ + w α L ( 1 ξ ) } ( 2 p w + 2 u ) ( 1 ξ ) a L c [ 1 ξ a L + ξ a H ] + s α H ξ α L c [ 1 ξ a L + ξ a H ] + s α H ξ + w α L ( 1 ξ ) k ( 1 φ * ) < d < α H [ 1 ξ a L + ξ a H ] ( w c ) k ( 1 φ * )
(3) When e * = d α H , similar to the case when e * = d α L , the retailer’s profit decreases as the cost-sharing ratio increases. Therefore, the retailer is unwilling to bear the supply chain resilience investment cost. In this situation, the retailer’s profit is:
π r M C = λ [ ( p w + u ) E α e u d φ k e 2 2 ] + ( 1 λ ) ( P w ) d
d π r M C d φ = k e 2 2 < 0 . At this time, φ * = 0 , d < α H [ 1 ξ a L + ξ a H ] ( w c ) k .
(4) When e * = E α ( w c ) k ( 1 φ ) , then φ * = 1 E α ( w c ) k e , we can transform the retailer’s profit as a function of e and construct a Lagrangian function.
π r M C = λ [ ( p w + u ) E α e u d k e 2 2 + E α ( w c ) e 2 ] + ( 1 λ ) ( P w ) d + v 12 ( d α H e ) s . t .   v 12 0 , v 12 ( d α H e ) = 0
When α H ( 2 p w c + 2 u ) 2 k < d , then φ * = 1 2 { ( w c ) [ 1 ξ a L + ξ a H ] } 2 p w + 2 u c .
In summary, the retailer’s profit function is:
π r M C = λ [ ( p w + u ) [ 1 ξ a L + ξ a H ] 2 ( w c ) k ( 1 φ ) u d φ k 2 [ [ 1 ξ a L + ξ a H ] ( w c ) k ( 1 φ ) ] 2 ] + ( 1 λ ) ( P w ) d α H [ 1 ξ a L + ξ a H ] ( 2 p w c + 2 u ) k < d { 2 [ 1 ξ a L + ξ a H ] 1 } ( 2 p w c + 2 u ) 2 2 k λ [ ( p w + u ) [ 1 ξ a L + ξ a H ] d α H u d φ k 2 ( d α H ) 2 ] + ( 1 λ ) ( P w ) d α H ( 2 p w + 2 u ) ( 1 ξ ) a L c [ 1 ξ a L + ξ a H ] + s α H ξ 2 k < d < α H [ 1 ξ a L + ξ a H ] ( 2 p w c + 2 u ) k λ [ ( p w ) ( ξ d + ( 1 ξ ) α L c [ 1 ξ a L + ξ a H ] + s α H ξ + w α L ( 1 ξ ) k ( 1 φ ) ) u ( 1 ξ ) ( d α L c [ 1 ξ a L + ξ a H ] + s α H ξ + w α L ( 1 ξ ) k ( 1 φ ) ) φ k 2 [ c [ 1 ξ a L + ξ a H ] + s α H ξ + w α L ( 1 ξ ) k ( 1 φ ) ] 2 ] + ( 1 λ ) ( P w ) d α L ( 2 p w + 2 u ) ( 1 ξ ) a L c [ 1 ξ a L + ξ a H ] + s α H ξ 2 k < d < α H ( 2 p w + 2 u ) ( 1 ξ ) a L c [ 1 ξ a L + ξ a H ] + s α H ξ 2 k ( p w ) d λ φ k 2 ( d α L ) 2 d < α L c [ 1 ξ a L + ξ a H ] + s α H ξ + w α L ( 1 ξ ) k
In the cost-sharing decision under the centralized decision-making model, the retailer determines the optimal cost-sharing ratio influenced by the relationship between various factors. This relationship pattern is similar to the scenario with lower product order quantities. From the analysis of results, the optimal ratio varies significantly under different product order quantities and capacity recovery levels. Additionally, it is directly affected by critical parameters such as product sales price p , production cost c , wholesale price w , and stockout loss u . However, as a core variable, the manufacturer’s capacity recovery coefficient has a particularly complex relationship with the retailer’s strategic choices. This variable affects the retailer’s decision-making process under incentive measures and influences the manufacturer’s decision path when incentives are ineffective. Its underlying impact mechanism is not easily deduced directly from the surface of the optimal decision equation. The subsequent content will delve into specific case studies to explore how the manufacturer’s capacity recovery coefficient concretely impacts the profit performance of both manufacturers and retailers in practice, thereby revealing the substantial effects of this complex relationship.

4. Numerical Simulation

4.1. Supply Chain Members’ Optimal Profit and Resilience Investment Decisions

This Section uses MATLAB software for numerical simulation to analyze and compare the impact of decentralized decision-making, centralized decision-making, and cost-sharing contract models on the profits of manufacturers and retailers. The simulation model parameters are assigned corresponding values based on the basic assumptions and reasonable logical relationships of the model, and further sensitivity analysis of the main parameters is conducted to demonstrate the effectiveness of the proposed model and obtain some management insights. The parameters were assigned as follows: p = 20 , c = 2 , w = 10 , α L = 1 , α H = 2 , k = 1 , u = 10 , s = 1 , ξ = 0.5 , λ 0 , 1 , d 0 , 100 .

4.1.1. Analysis of Overall Supply Chain Profit

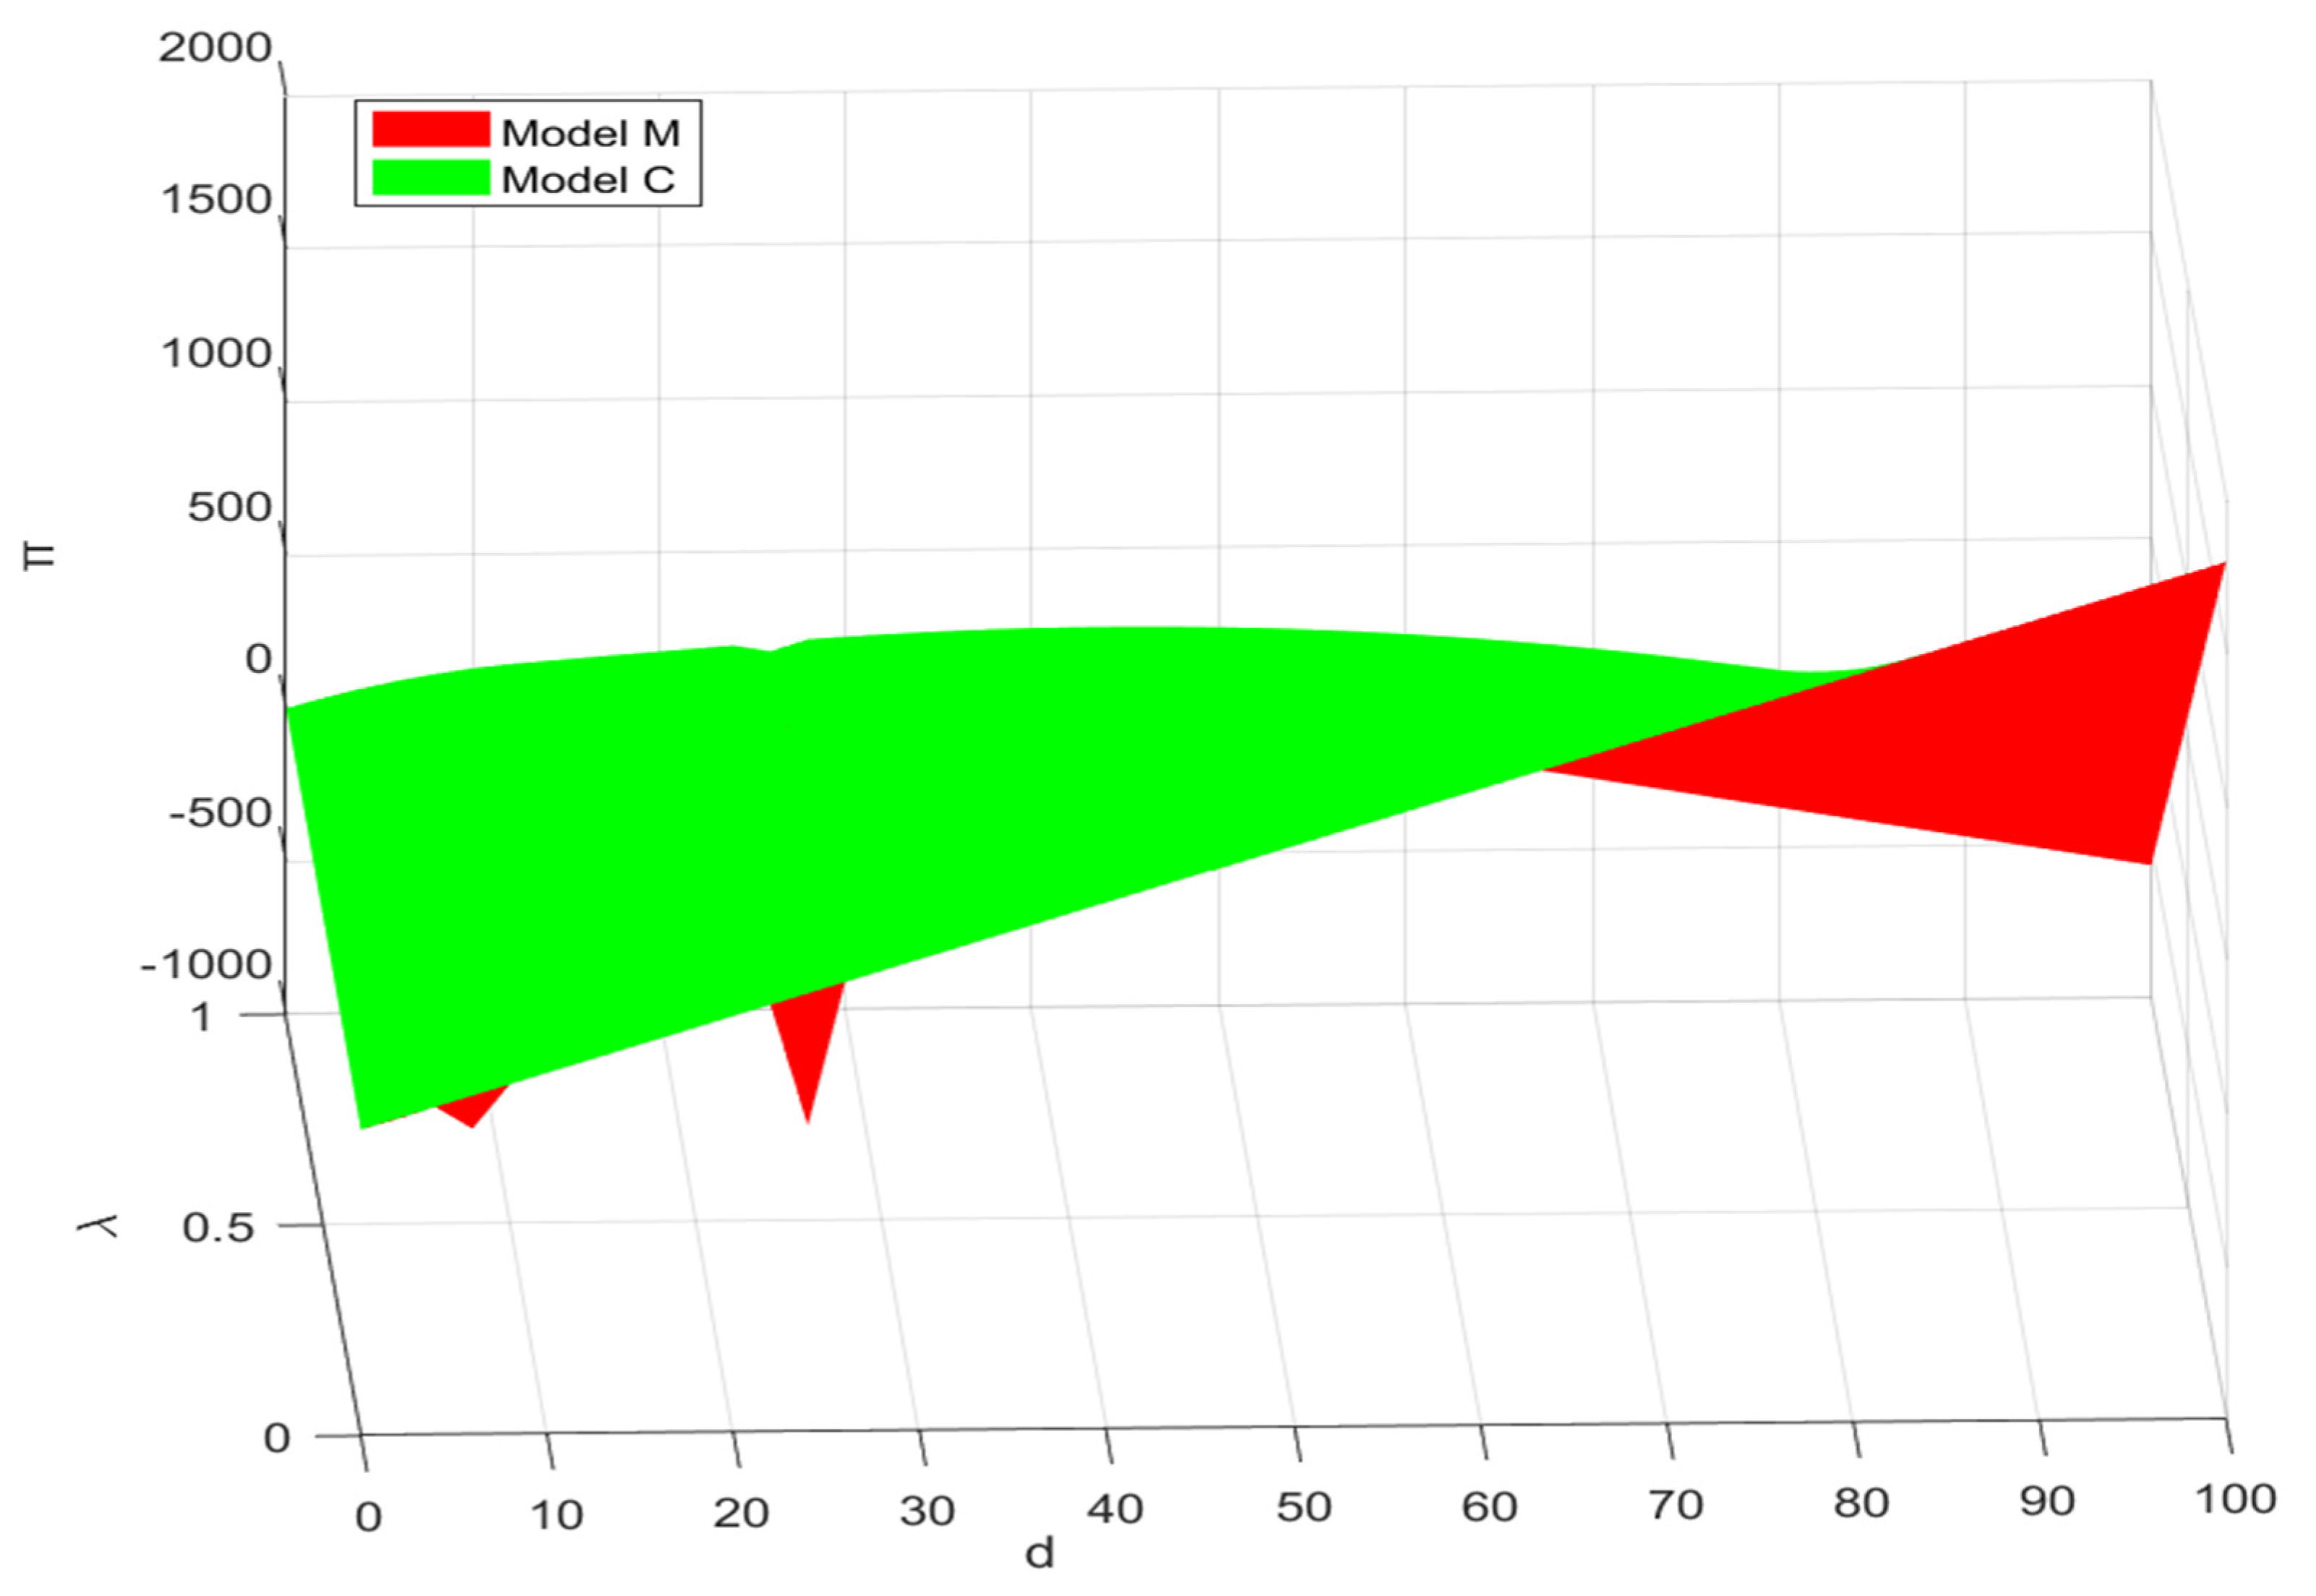
This subsection analyzes the impact of product order quantity d and supply disruption risk λ on the profits of channel members. The results are shown in Figure 2.
As can be seen from Figure 2, the overall supply chain profit is significantly influenced by the product order quantity d and supply disruption risk λ . The centralized mode consistently yields higher total profits compared to the decentralized mode, and total profits in both modes increase with the positive growth of product order quantity d . When the product order quantity d < α L c [ 1 ξ a L + ξ a H ] + s α H ξ + w α L ( 1 ξ ) k , the difference in total profit between centralized operation mode and decentralized operation mode is not prominent, indicating that manufacturers in this situation can effectively buffer small fluctuations in product order quantity, making the impact of these changes on the overall profit of the supply chain relatively limited. However, with the significant increase in product order quantity d and supply interruption risk λ, especially when α H [ 1 ξ a L + ξ a H ] ( w c ) k < d , the advantages of centralized mode over decentralized mode in profit acquisition become increasingly significant, and the gap gradually widens. This reflects that under high product order scenarios, the supply chain faces increased supply disruption risk that exceeds its inherent resilience capabilities. Consequently, fluctuations in product order quantity have a more significant impact on the overall supply chain profit. This observation aligns with previous research findings by Ye et al. [50].
Subsequently, the effect of supply disruption probability λ on the overall supply chain profit is further analyzed. As the supply disruption probability λ increases, the total profits under both centralized and decentralized modes decrease. This phenomenon occurs because supply disruption risk exacerbates the uncertainty within the supply chain. Such uncertainty necessitates higher inventory levels to cope with unforeseen circumstances, but increased inventory also raises holding costs, thereby compressing profit margins and creating a dilemma. Simultaneously, in order to seek alternative suppliers or implement emergency measures, enterprises must invest additional resources and time, inevitably increasing operational costs and reducing overall supply chain efficiency. Therefore, in situations of supply disruption, compared to decentralized decision-making, it is more advisable for supply chain entities to adopt a centralized decision-making model and utilize contracts to coordinate overall supply chain profits.

4.1.2. Analysis of Manufacturer’s Profit

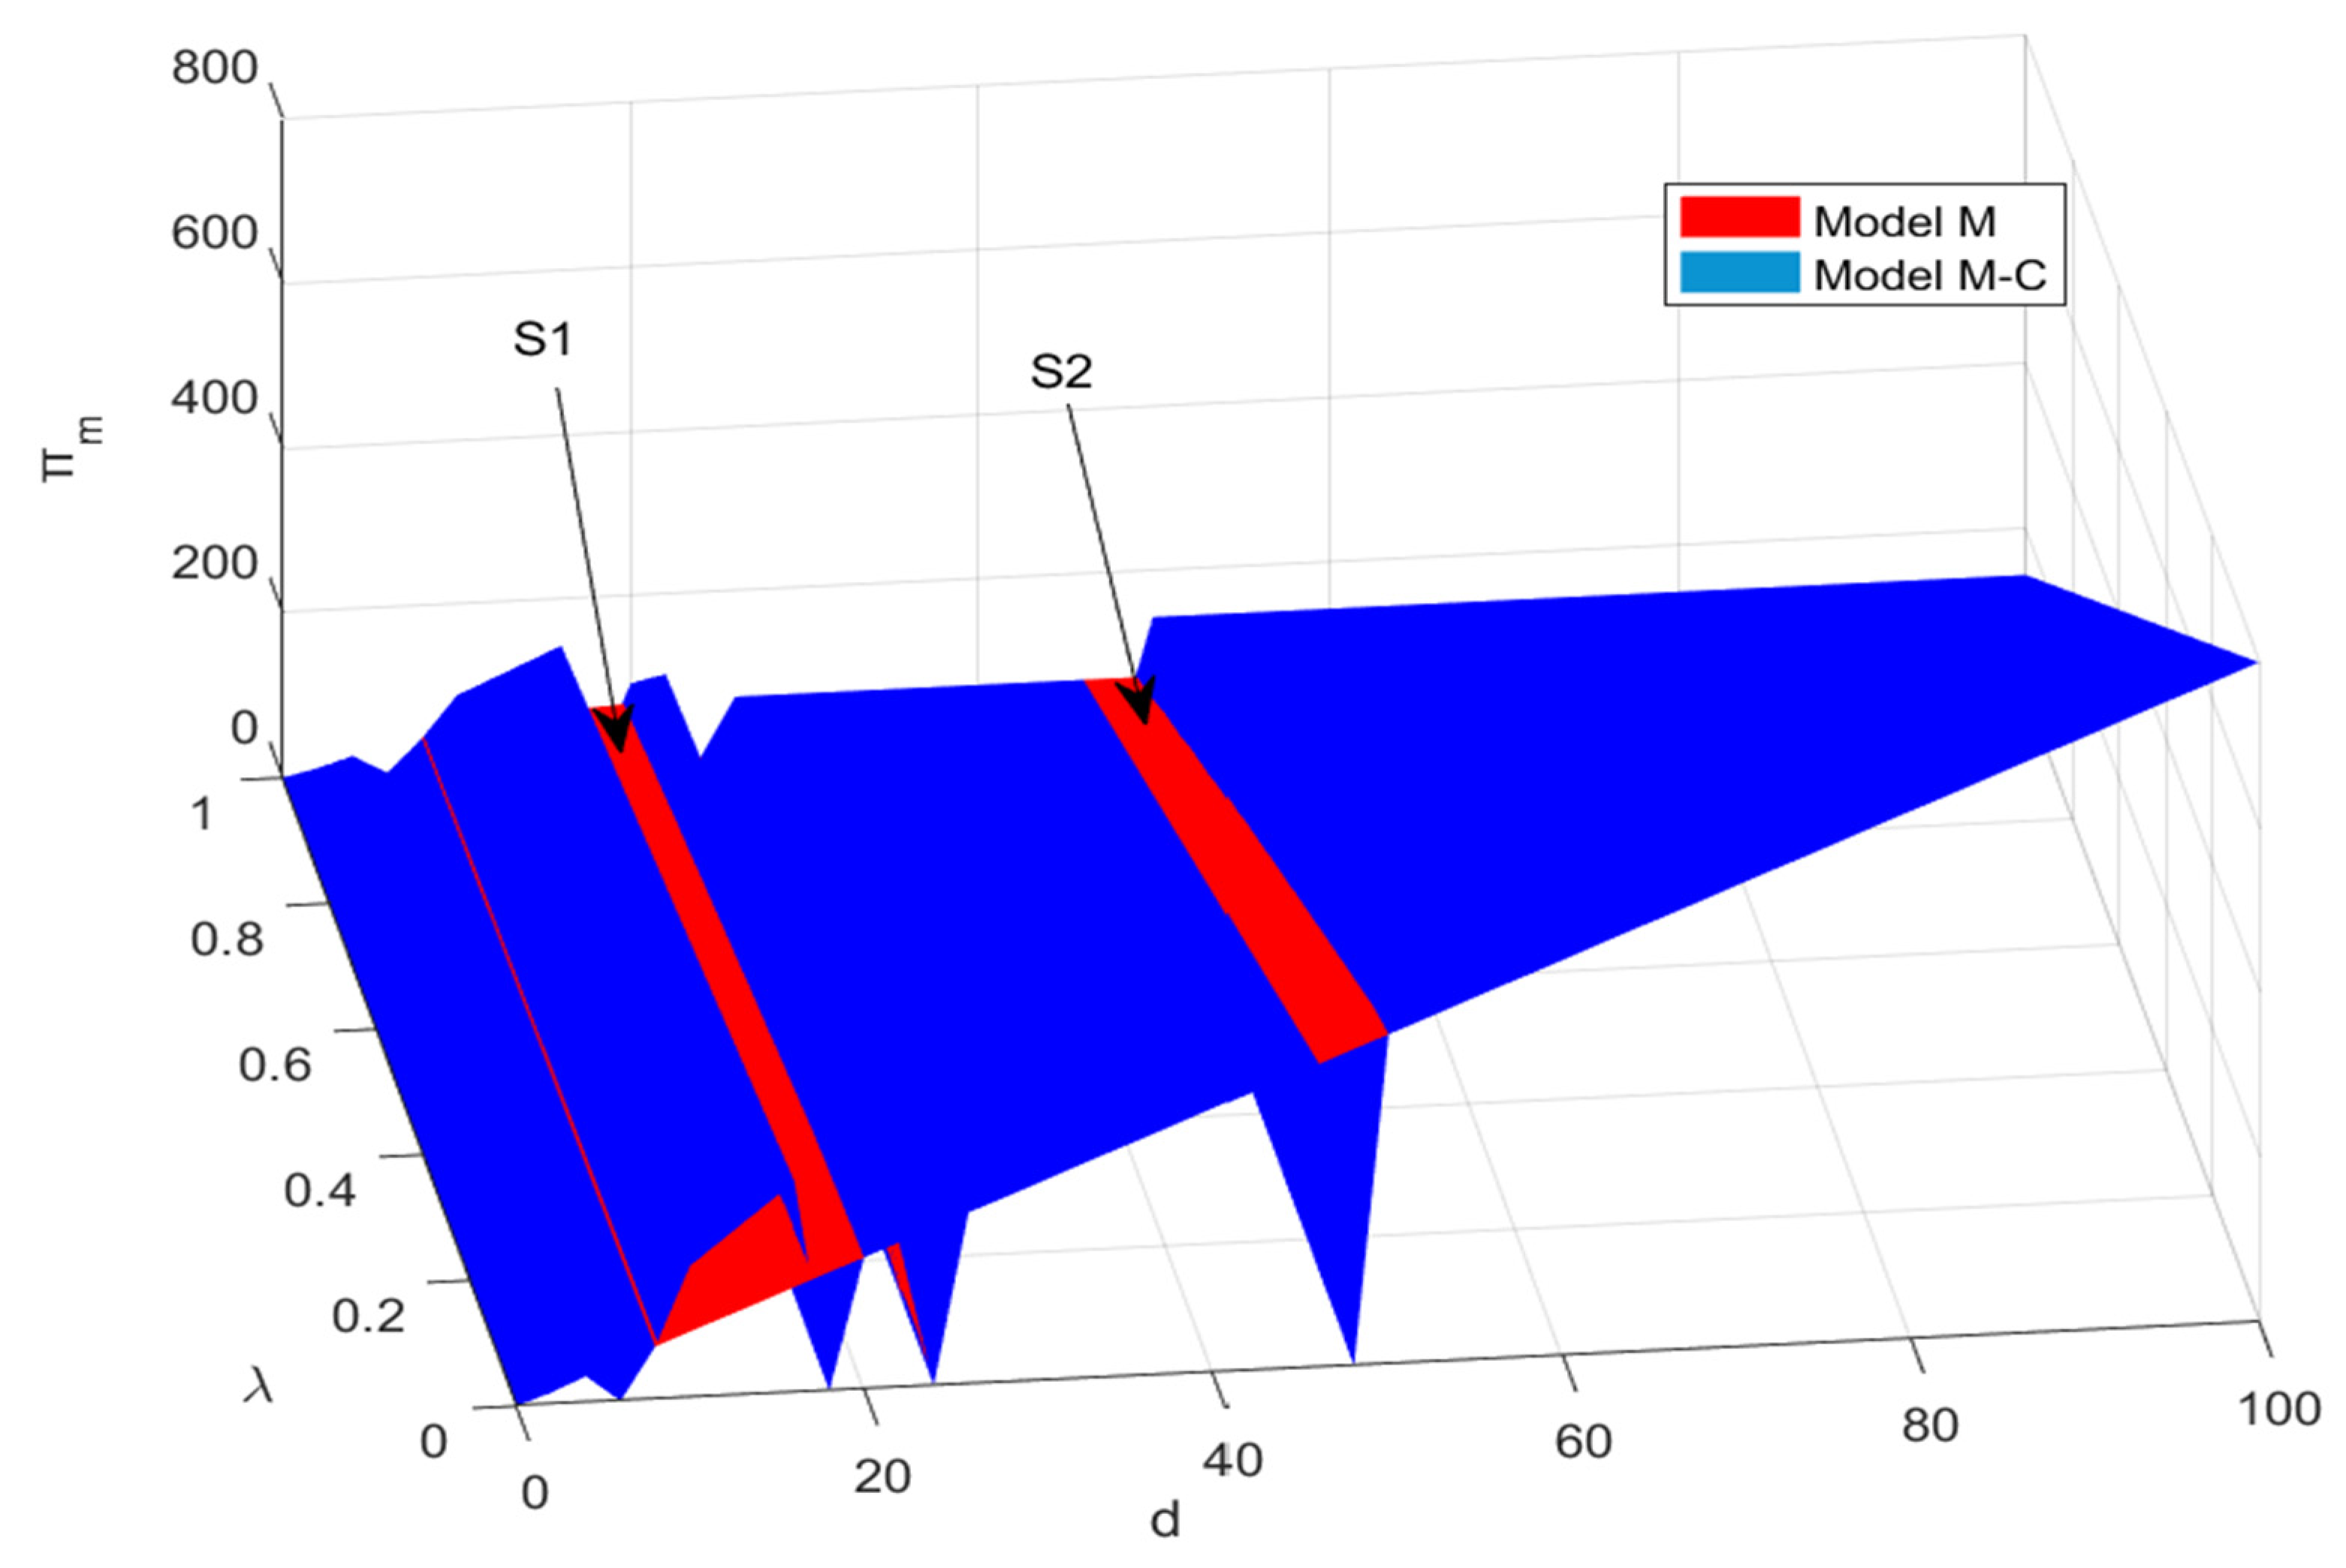
Figure 3 shows that the manufacturer’s profit curve also fluctuates in response to the product order quantity. Depending on the order quantities, this dynamic profit curve can be segmented into four distinct intervals marked by clear inflection points, thereby revealing the phased impact of order quantity on retailer profitability.
(1) In the first interval of product order quantity variation, where d < α L c [ 1 ξ a L + ξ a H ] + s α H ξ + w α L ( 1 ξ ) k , the manufacturer’s profit in the decentralized mode equals that in the cost-sharing contract mode. The manufacturer’s profit increases with an increase in product order quantity d and decreases with an increase in supply disruption risk λ . Therefore, contract coordination is not necessary. This indicates that when the product order quantity is low, the supply chain exhibits a certain resilience, capable of maintaining normal operational needs.
(2) In the second interval of product order quantity variation, where α L c [ 1 ξ a L + ξ a H ] + s α H ξ + w α L ( 1 ξ ) k < d < α H c [ 1 ξ a L + ξ a H ] + s α H ξ + w α L ( 1 ξ ) k , the manufacturer’s profit is negatively correlated with supply disruption risk λ , and under the cost-sharing contract mode, the manufacturer’s profit decreases with an increase in product order quantity d . At this point, the manufacturer’s profit under the cost-sharing contract equals that under the decentralized mode. Therefore, there is no need for the manufacturer and retailer to sign a cost-sharing contract to address supply disruption risk.
(3) In the third interval of product order quantity variation, where α H c [ 1 ξ a L + ξ a H ] + s α H ξ + w α L ( 1 ξ ) k < d < α H [ 1 ξ a L + ξ a H ] ( w c ) k , the manufacturer’s profit remains negatively correlated with supply disruption risk λ . Under the decentralized mode, the manufacturer’s profit exhibits an inverted U-shaped pattern with increasing product order quantity d , indicating that profit first increases and then decreases. In contrast, under the cost-sharing contract mode, the manufacturer’s profit fluctuates with increasing product order quantity d , where profit initially increases, then decreases, and increases again. Specifically, under the cost-sharing contract, the manufacturer’s profit initially exceeds, then falls below, and finally equals the profit under the decentralized mode. More precisely, within the S1 region, the manufacturer’s profit under the cost-sharing contract mode is lower than that under the decentralized mode. Outside the S1 region, the manufacturer’s profit under the cost-sharing contract mode is not lower than that under the decentralized mode, indicating that the manufacturer can achieve supply chain coordination by formulating a cost-sharing contract.
(4) In the fourth interval of product order quantity variation, where α H [ 1 ξ a L + ξ a H ] ( w c ) k < d , the manufacturer’s profit also correlates negatively with supply disruption risk λ . Under the decentralized mode, the manufacturer’s profit increases with increased product order quantity d . In the cost-sharing contract mode, the manufacturer’s profit exhibits an N-shaped pattern with the increase in product order quantity d . Specifically, under the cost-sharing contract mode, manufacturer profits first equal, then decrease below, and finally exceed those under the decentralized mode. Specifically, outside the S2 region, the manufacturer’s profit under the cost-sharing contract mode is not lower than that of the decentralized mode. Within the S2 region, the manufacturer’s profit under the decentralized mode is higher than those under the cost-sharing contract mode, indicating a failure to achieve supply chain coordination. In general, as the quantity of product orders increases, the effectiveness of the cost-sharing contract becomes more pronounced.
In summary, manufacturers’ profits are jointly influenced by supply disruption risk and order quantity, with profits negatively correlated with supply disruption risk λ . When order quantities are low, the supply chain exhibits resilience, obviating the need for a cost-sharing contract. In contrast, higher order quantities and disruption risks lead manufacturers to prefer implementing the cost-sharing contract for supply chain coordination. However, if retailers’ order quantities are moderate, manufacturers must decide whether to use the cost-sharing contract based on supply disruption risks and order quantities to maximize their interests.

4.1.3. Analysis of Retailer’s Profit

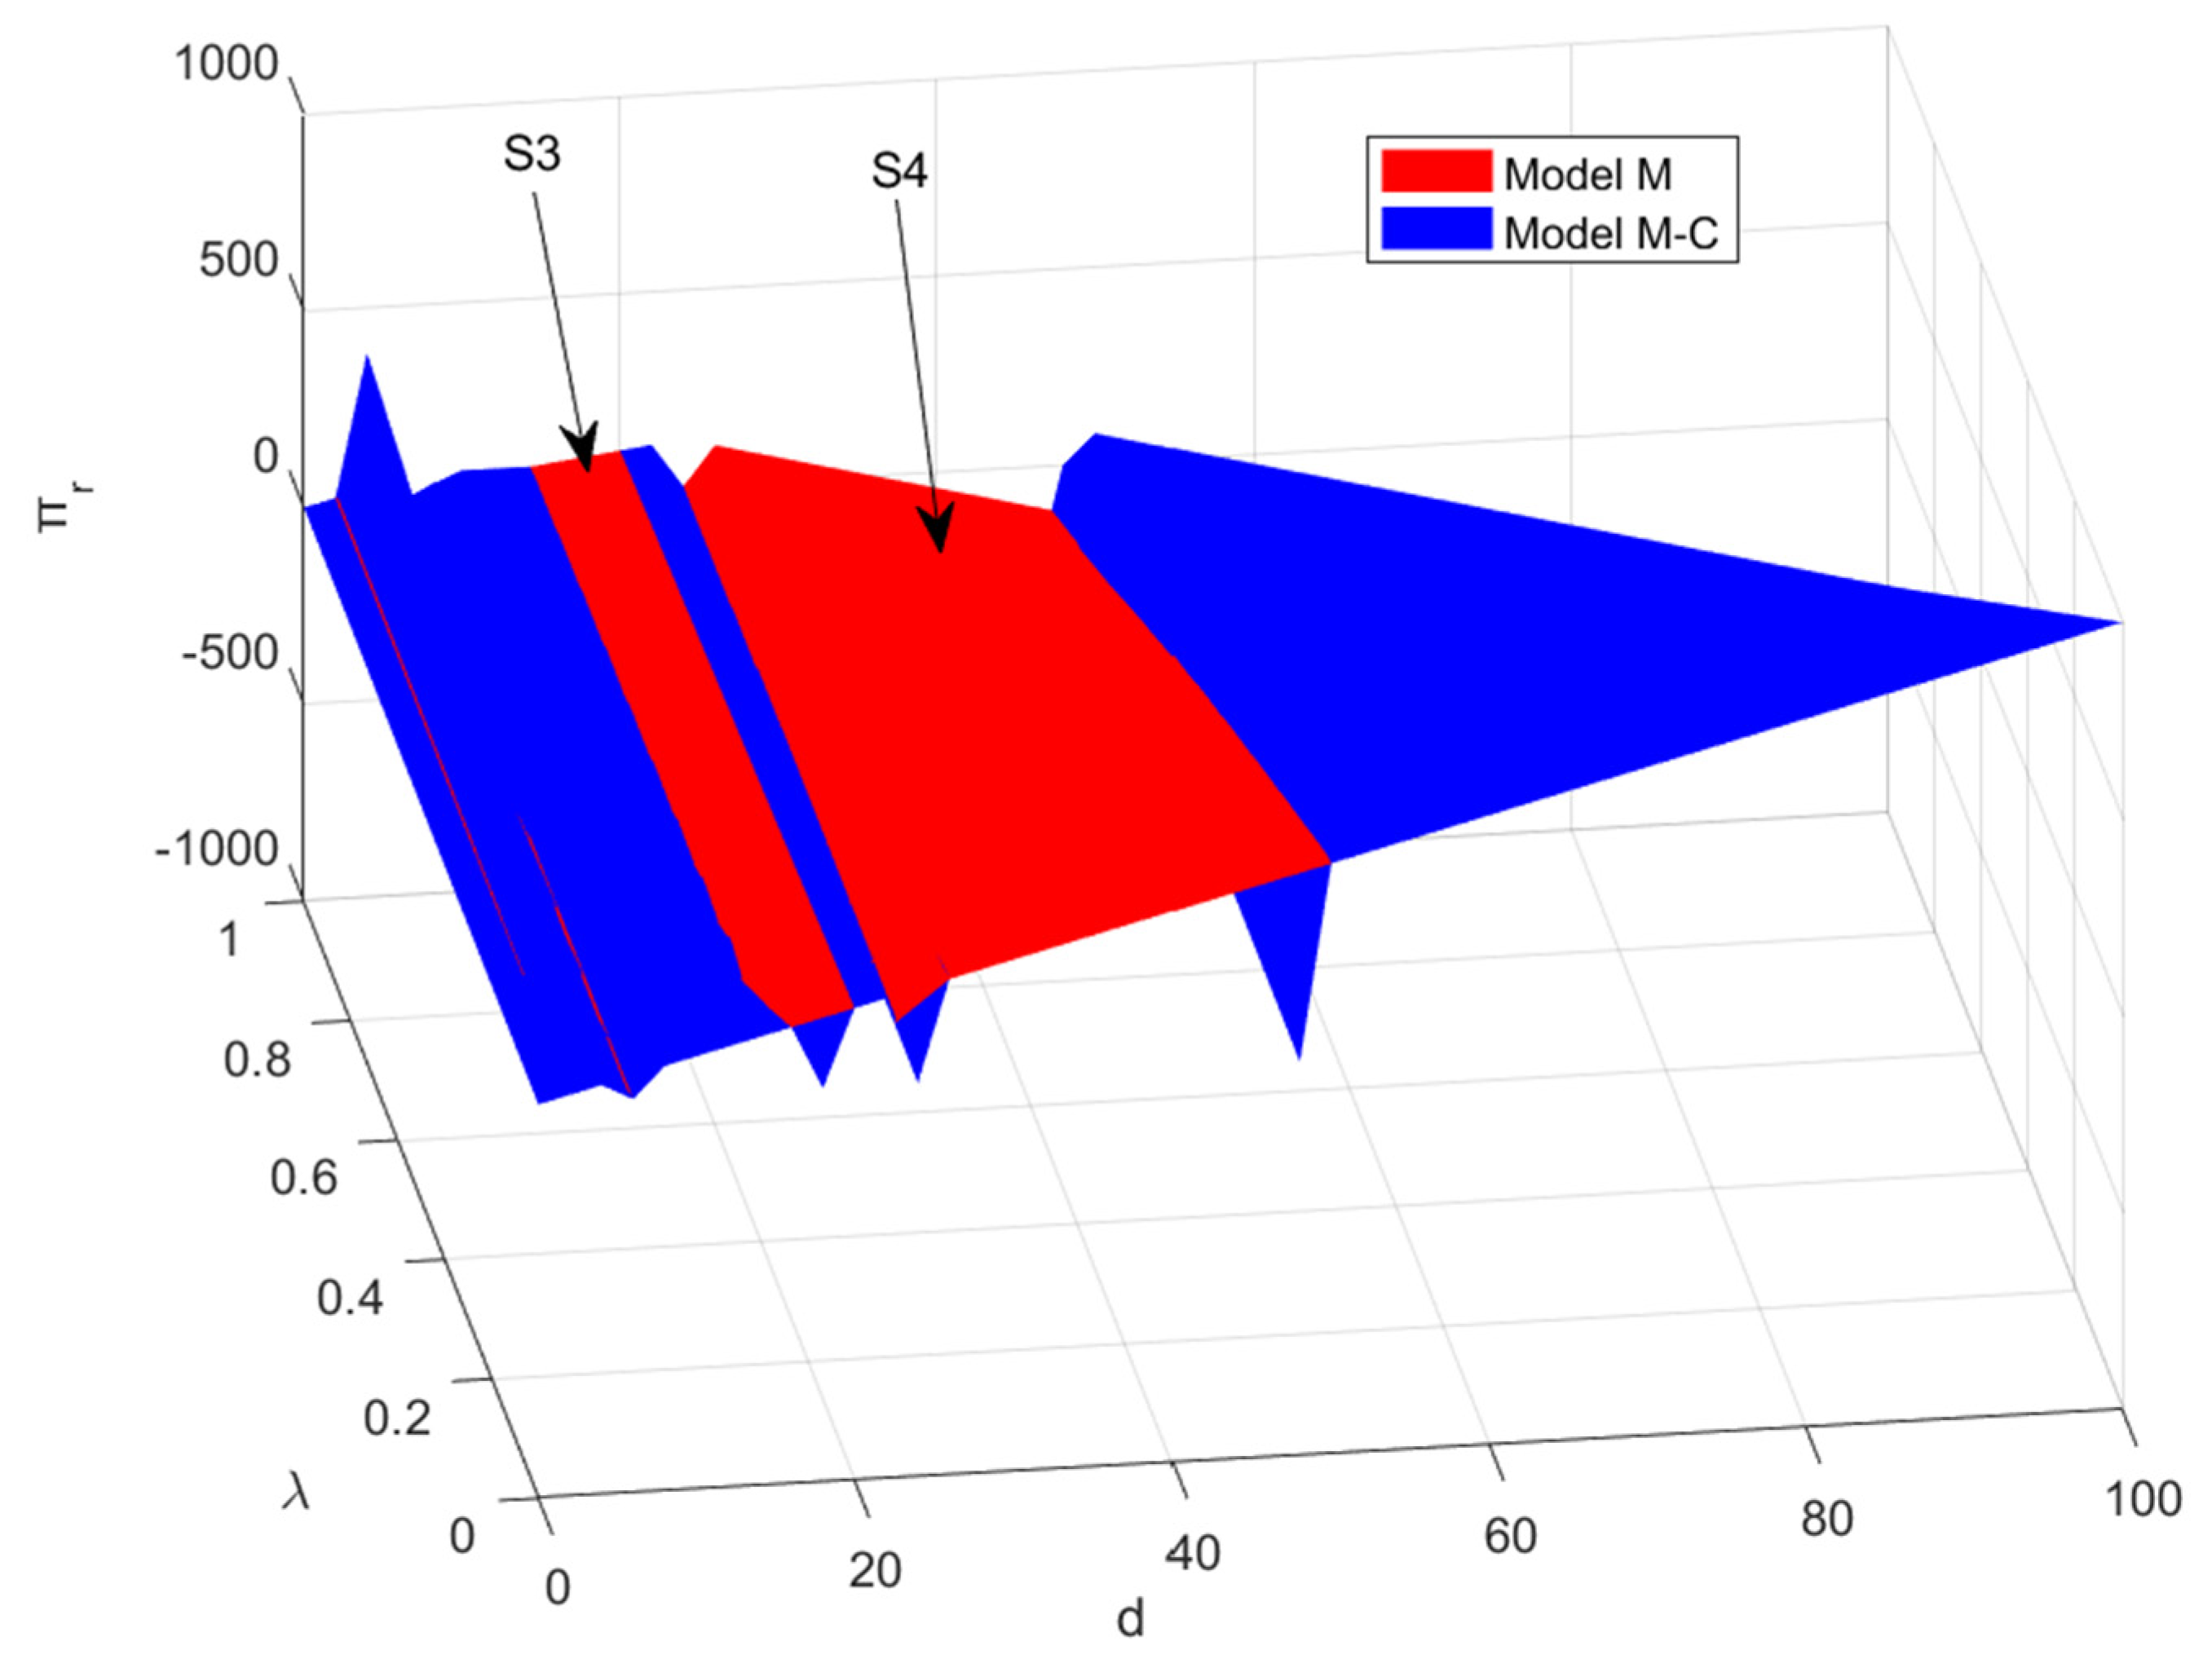
According to Figure 4, the retailer’s profit does not always increase steadily as the product order quantity increases. The retailer’s profit curve exhibits fluctuating trends with changes in supply disruption probability and order quantity, characterized by a generally stable upward trend with slight fluctuations. Based on varying levels of supply disruption probabilities and order quantities, it vividly illustrates the phased impact of these factors on retailer profitability. Further analysis reveals that under high order quantities and supply disruption probabilities, the retailer’s profit in decentralized mode generally falls below that under the cost-sharing contract, aligning with certain real-world supply chain practices. Therefore, retailers are more willing to allocate specific costs to manufacturers to enhance their production recovery capacity, improve supply chain resilience, and maximize their interests.
(1) In the first interval of product order quantity variation, denoted as d < α L c [ 1 ξ a L + ξ a H ] + s α H ξ + w α L ( 1 ξ ) k , under the cost-sharing contract mode, the retailer’s profit correlates positively with the order quantity d and the supply disruption risk λ . At this stage, the retailer’s profit under the decentralized mode equals that under the cost-sharing contract mode. This indicates that manufacturers can maintain normal product supply when the order quantity is relatively low by adjusting their production and operational activities.
(2) In the second interval of product order quantity variation, denoted as α L c [ 1 ξ a L + ξ a H ] + s α H ξ + w α L ( 1 ξ ) k < d < α H c [ 1 ξ a L + ξ a H ] + s α H ξ + w α L ( 1 ξ ) k , the retailer’s profit positively correlates with the supply disruption risk λ , exhibiting an inverted U-shaped trend concerning the order quantity d . Additionally, under the cost-sharing contract at this stage, the retailer’s profit is equal to that of the decentralized mode. This further illustrates that the supply chain possesses a certain resilience, capable of adjusting production and operational activities accordingly.
(3) In the third interval of product order quantity variation, denoted as α H c [ 1 ξ a L + ξ a H ] + s α H ξ + w α L ( 1 ξ ) k < d < α H [ 1 ξ a L + ξ a H ] ( w c ) k , the retailer’s profit negatively correlates with the supply disruption risk λ . Under the cost-sharing contract, the retailer’s profit initially equals, then exceeds, subsequently falls below, and finally equals the profit under the decentralized mode. Specifically, within the S3 region, the retailer’s profit under the decentralized mode surpasses that under the cost-sharing contract mode. This is due to the ongoing disagreement between the manufacturer and the retailer on the cost-sharing ratio, which incurs additional operational costs. Outside the S3 region, the retailer’s profit under the decentralized mode does not fall below that under the cost-sharing contract mode. At this point, the manufacturer and the retailer can achieve supply chain coordination by establishing an appropriate cost-sharing ratio.
(4) In the fourth interval of product order quantity variation, denoted as α H [ 1 ξ a L + ξ a H ] ( w c ) k < d , the retailer’s profit negatively correlates with the supply disruption risk λ . Within the S4 region, the retailer’s profit under the cost-sharing mode equals that under the decentralized mode. This indicates that, in this interval, the manufacturer and retailer cannot establish an appropriate cost-sharing ratio to achieve supply chain coordination, making it unnecessary to implement a cost-sharing contract in this interval. Outside the S4 region, the retailer’s profit under the decentralized mode is consistently lower than that under the cost-sharing contract mode. This suggests that when the order quantity is large, the retailer can achieve supply chain coordination through a cost-sharing contract. Moreover, as the supply disruption risk increases, the effectiveness of the cost-sharing contract becomes more pronounced.
When the order quantity is large, the retailer bears a portion of the manufacturer’s supply chain resilience investment costs. This cost-sharing strategy helps manufacturers increase their capacity recovery and supply chain resilience but also aids retailers in achieving their own profit maximization goals. Conversely, retailers prefer a decentralized decision-making mode when the order quantity is small. This is because manufacturers can handle supply disruption risks and maintain normal product supply under such conditions. With a stable supply from manufacturers, retailers can secure a competitive advantage in the market, achieving more significant profit margins.

4.1.4. Analysis of Resilience Investment Decision

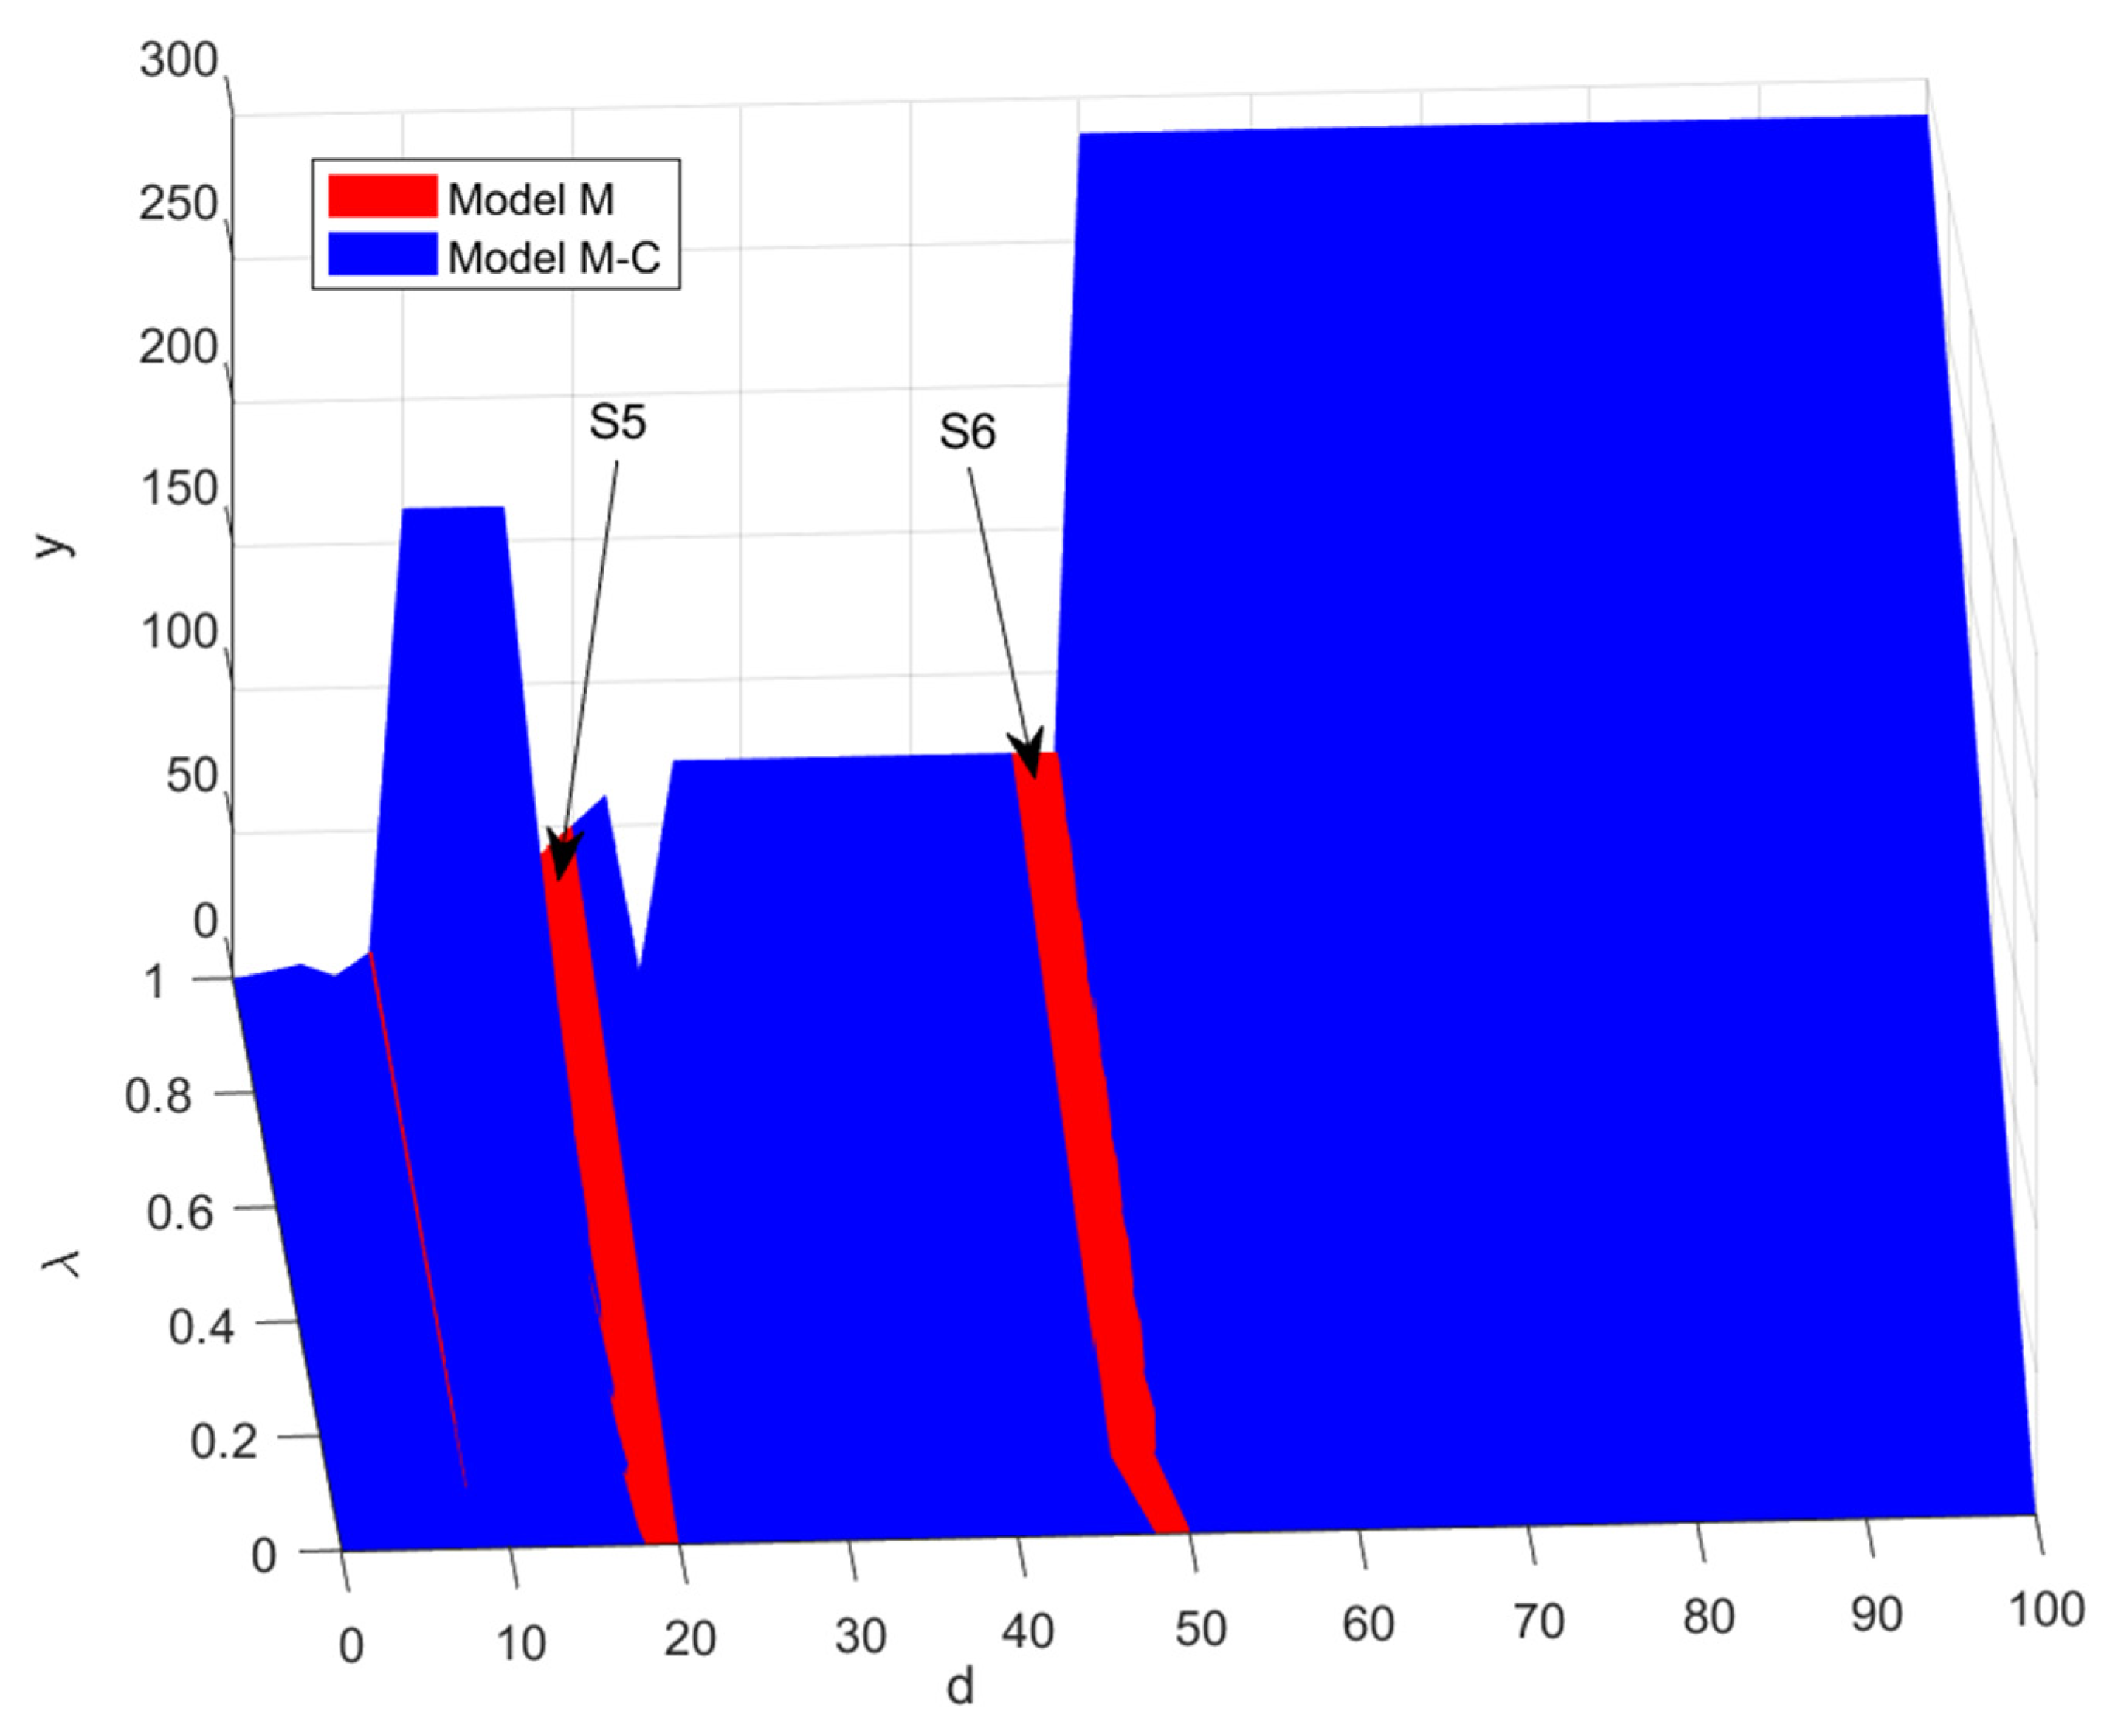
From Figure 5, it can be observed that under the consideration of supply disruption risk, the supply chain resilience investment exhibits a fluctuating trend: it first increases, then decreases, and rises again. This unique pattern is closely related to the product order quantity and the supply disruption probability. Based on different levels of product order quantities, four distinct intervals can be identified. Additionally, it can be seen that the supply chain resilience investment fluctuates with market demand d , but the overall trend is upward.
(1) In the first interval of order quantity variation, denoted as d < α L c [ 1 ξ a L + ξ a H ] + s α H ξ + w α L ( 1 ξ ) k , the supply chain resilience investment under the cost-sharing model is positively correlated with the product order quantity d and supply disruption risk λ . During this interval, the resilience investment in the decentralized model is equal to that of the cost-sharing contract model. This indicates that when the order quantity is relatively low, the supply chain possesses inherent resilience and does not require a specialized contract to coordinate the supply chain.
(2) In the second range of order quantity variation, denoted as α L c [ 1 ξ a L + ξ a H ] + s α H ξ + w α L ( 1 ξ ) k < d < α H c [ 1 ξ a L + ξ a H ] + s α H ξ + w α L ( 1 ξ ) k , the supply chain resilience investment considering the supply disruption probability is positively correlated with the supply disruption risk λ and exhibits an inverted U-shaped variation with the product order quantity d . During this period, the resilience investment in both decentralized and centralized modes of the supply chain remains identical.
(3) In the third range of order quantity variation, denoted as α H c [ 1 ξ a L + ξ a H ] + s α H ξ + w α L ( 1 ξ ) k < d < α H [ 1 ξ a L + ξ a H ] ( w c ) k , the retailer’s profit is positively correlated with the supply disruption risk λ . In the S5 region, the supply chain resilience investment in the decentralized mode is higher because, at this point, the cost-sharing contract fails to coordinate the profit distribution between the manufacturer and the retailer, leading to unnecessary losses. Outside the S5 region, the resilience investment in the cost-sharing contract mode is higher. At this point, the supply chain entities can achieve coordination through the cost-sharing contract.
(4) In the fourth range of order quantity variation, denoted as α H [ 1 ξ a L + ξ a H ] ( w c ) k < d , the supply chain resilience investment is positively correlated with the supply disruption risk λ . In the S6 region, the supply chain resilience under the cost-sharing mode is lower, indicating that the cost-sharing contract cannot achieve supply chain coordination in this range. Outside the S6 region, the resilience investment in the cost-sharing contract mode is higher. This demonstrates that the retailer’s profit in the decentralized mode is consistently lower than in the cost-sharing contract mode. Furthermore, the higher the supply disruption risk, the greater the supply chain resilience investment. Therefore, when both order quantity and supply disruption risk are high, the cost-sharing contract’s coordination effect is more pronounced.
In general, the supply chain resilience investment positively correlates with the supply disruption risk; the more significant the disruption risk, the higher the supply chain resilience investment. Moreover, when product order quantities are lower, the supply chain exhibits a certain degree of resilience. At this juncture, there is minimal difference in resilience investment between cost-sharing and diversified mode, indicating the supply chain’s capability to withstand supply disruption risks. Therefore, when manufacturers and retailers face low product order quantities, utilizing the cost-sharing contract may not be necessary. When product order quantities are moderate, consideration should be given to both product order quantities and supply disruption risks. However, manufacturers and retailers should opt for cost-sharing contracts when product order quantities are high to maximize supply chain resilience investment.

4.2. Sensitivity Analysis

(1) Impact analysis of capacity recovery coefficient
As discussed and analyzed earlier, decisions made by supply chain members are often influenced by stochastic changes in the capacity recovery coefficient. This influence relationship is not straightforward. To further explore the effect of this coefficient variation on supply chain member decisions and profits, holding other parameters constant, take ξ = [ 0.1 , 0.3 , 0.5 , 0.7 , 0.9 ] and d = 10 and observe the experimental results under three different supply disruption risk scenarios represented by λ = 0.2 , λ = 0.5 , and λ = 0.8 . The results are shown in Table 3.
As shown in Table 2, with the increase in production capacity recovery coefficient ξ , the profits of manufacturers and retailers in the decentralized mode show an increasing trend. In contrast, manufacturers and retailers exhibit a U-shaped profit trend in the centralized mode. This phenomenon arises because when manufacturer production capacity is inadequate, manufacturers and retailers engage in close cooperation, with retailers more willing to bear the costs associated with supply chain resilience. However, as production capacity gradually recovers, retailers and manufacturers adjust cost-sharing ratios based on their profit maximization goals, incurring additional costs to establish cost-sharing contracts accordingly. When production capacity recovery reaches a very high level, manufacturers and retailers can meet market demand adequately, even without enhanced cooperation. Here, the increased production capacity recovery coefficient enhances the likelihood of manufacturers achieving higher recovery levels, enabling manufacturers and retailers to derive greater profits from manufacturing and sales activities, respectively. Cross-sectional analysis reveals that when disruption probability and production capacity recovery coefficient remain consistent, profits for manufacturers and retailers decrease with increasing disruption probability. Notably, under the cost-sharing strategy, profits for both parties generally equal or exceed those without cost-sharing, further validating the effectiveness of the cost-sharing contract.
In scenarios with low disruption probability ( λ = 0.2 ), it is observed that the profits of supply chain members do not exhibit significant changes as the production capacity recovery coefficient increases. Moreover, when the production capacity recovery coefficient is low, both manufacturer and retailer profits exceed those in the decentralized mode, demonstrating a preference among retailers for implementing cost-sharing contracts. However, as the production capacity recovery coefficient increases, the retailer’s profit under the cost-sharing mode decreases compared to the decentralized mode. Consequently, retailers may opt out of continuing to share the costs associated with supply chain resilience with manufacturers in such circumstances.
In scenarios with high disruption probability ( λ = 0.5 ), under decentralized management, the profits of manufacturers and retailers are positively correlated with ξ . In contrast, under the cost-sharing contract, their profits initially decrease and then increase with ξ . Specifically, when disruption probability is extremely high, the decentralized mode demonstrates that a smaller ξ value results in higher retailer profits. This suggests that a higher ξ expands the range of retailer profits, enhancing their ability to cope with severe supply disruptions under decentralized modes.
In scenarios with very high disruption probability ( λ = 0.8 ), the profits of manufacturers and retailers exhibit a U-shaped trend with ξ under the cost-sharing contract. This suggests that when production recovery capability is low, increasing the production recovery coefficient can increase manufacturers’ profit opportunities. Additionally, manufacturers and retailers prefer the cost-sharing contract when the production recovery coefficient is low. However, retailer profits under the cost-sharing contract decrease when ξ exceeds 0.5. This indicates that as the production recovery coefficient increases, manufacturers approach achieving comprehensive and efficient recovery, thereby reducing the urgency and initiative for retailers to adopt incentive measures.
In environments with potential supply disruption risks, changes in the capacity recovery coefficient significantly influence retailers’ decision-making. Therefore, when designing the cost-sharing contract, retailers should conduct comprehensive market research to accurately assess manufacturers’ capacity recovery capabilities. This assessment should be combined with the severity of market disruptions to formulate a cost-sharing contract that is both practical and strategically sound.

5. Conclusions

The probability of supply disruption affects members’ decision-making regarding supply chain resilience investment. Additionally, product order quantity and manufacturer capacity recovery level are important influencing factors. Therefore, by constructing the Stackelberg model under supply disruption risk, the results of this study show the following:
(1) Retailers incentivizing manufacturers to recover capacity by sharing recovery costs after supply chain disruptions is an effective strategy, contingent upon specific circumstances. Manufacturers determine optimal capacity recovery levels based on fluctuating product order quantity, supply disruption risk, and supply revenue during the disruption period. Specifically, if the increase in product order quantity is not significant and the risk of supply interruption is low. Both d < α L c [ 1 ξ a L + ξ a H ] + s α H ξ + w α L ( 1 ξ ) k and α H c [ 1 ξ a L + ξ a H ] + s α H ξ + w α L ( 1 ξ ) k < d < α H [ 1 ξ a L + ξ a H ] ( w c ) k . The profit difference between the cost-sharing model and the decentralized model is not significant; on the contrary, if the order quantity of the product increases sharply or the risk of supply interruption increases, both α L c [ 1 ξ a L + ξ a H ] + s α H ξ + w α L ( 1 ξ ) k < d < α H c [ 1 ξ a L + ξ a H ] + s α H ξ + w α L ( 1 ξ ) k and α H [ 1 ξ a L + ξ a H ] ( w c ) k < d . Retailers are more inclined to adopt cost-sharing strategies.
(2) The supply chain resilience investment positively correlates with the supply disruption risk; higher risk necessitates more significant investment to enhance resilience. Meanwhile, research has shown that when the product order quantity d < α L c [ 1 ξ a L + ξ a H ] + s α H ξ + w α L ( 1 ξ ) k and the supply chain resilience level is d α L , there is no need to immediately activate cost-sharing contracts. At this point, the manufacturer’s resilience investment and restoration of α L production capacity are sufficient to cope with the risk of supply disruption. When α H c [ 1 ξ a L + ξ a H ] + s α H ξ + w α L ( 1 ξ ) k < d < α H [ 1 ξ a L + ξ a H ] ( w c ) k , the resilience level of the supply chain is d α H . At this time, manufacturers can invest in resilience alone and restore α H production capacity to cope with the risk of supply interruption. But as the number of product orders and the probability of supply interruption increase, when α L c [ 1 ξ a L + ξ a H ] + s α H ξ + w α L ( 1 ξ ) k < d < α H c [ 1 ξ a L + ξ a H ] + s α H ξ + w α L ( 1 ξ ) k , the resilience level of the supply chain is c [ 1 ξ a L + ξ a H ] + s α H ξ + w α L ( 1 ξ ) k , and manufacturers cannot cope with the risk of supply interruption by investing in resilience alone. And when the order quantity is α H [ 1 ξ a L + ξ a H ] ( w c ) k < d , the level of resilience investment in the supply chain is fixed at [ 1 ξ a L + ξ a H ] ( w c ) k . Manufacturers and retailers also need to consider adopting cost-sharing contracts to optimize the supply chain. Therefore, establishing a well-designed cost-sharing-contract mechanism is crucial for guiding optimal decision-making within the supply chain and enhancing overall supply chain resilience.
(3) Under the given condition of the capacity recovery coefficient ξ , the profitability of manufacturers and retailers shows an inverse relationship with the supply disruption risks, meaning higher risks lead to decreased profits for both parties. However, when the supply disruption risk remains constant, analysis results indicate that in the decentralized mode, the profitability of manufacturers and retailers is positively correlated with the capacity recovery coefficient. As ξ approaches one, the profits of manufacturers and retailers increase. In contrast, when adopting a cost-sharing model, the profitability of manufacturers and retailers exhibits a U-shaped trend concerning the capacity recovery coefficient. This means that in the initial stage, it is necessary to increase the level of supply chain resilience investment to restore production capacity. But as ξ approaches 0.5, increasing production capacity will reduce the profits of both parties. But after reaching 0.5, profits began to grow again with the enhancement of recovery ability. This dynamic highlights the importance, under a cost-sharing contract, of balancing investments in capacity recovery with expected revenue.
The research in this paper is not without limitations. This article is aimed at the general supply chain structure. However, there may be industry-specific restrictions, such as grocery products, fast-moving consumer goods, durable goods, etc. In the future, specific supply chains can be developed for research. In addition, this article only considers the scenario of supply interruption, and in the future, the impact of supply interruption and demand interruption occurring simultaneously on the supply chain can be explored.

Author Contributions

Conceptualization, X.L.; methodology, K.K.; software, Y.K.; validation, X.L.; formal analysis, K.K.; investigation, L.L.; resources, X.L.; data curation, Y.K.; writing—original draft preparation, K.K.; writing—review and editing, X.L.; visualization, L.L.; supervision, L.L. All authors have read and agreed to the published version of the manuscript.

Funding

This research was funded by Guangxi Key R&D Plan (Project No: 2022AB34029): The Key Technologies and Industrialization of Intelligent Traceability in the Whole Link of High-quality Seedling Seed Supply Chain in Lijiang River Basin and by Guangxi Philosophy and Social Science Research Project (20FJY026): Research on the upgrading path and countermeasures of county-level industries in Guangxi and by the Research Fund Project of Development Institute of Zhujiang–Xijiang Economic Zone, Key Research Base of Humanities and Social Sciences in Guangxi Universities (Project No: ZX2023051).

Data Availability Statement

No new data were created or analyzed in this study. Data sharing is not applicable to this article.

Conflicts of Interest

The authors declare no conflicts of interest.

References

  1. Hu, X.; Li, X.; Luo, F.; Wang, M.; Liu, L. How to Promote Mobile Phone Trade-in and the Integration of Green Supply Chain from the Perspective of Multi-Party Game Theory. RAIRO-Oper. Res. 2022, 56, 3117–3135. [Google Scholar] [CrossRef]
  2. Xu, J.; Bai, Q.; Li, Z.; Zhao, L. Maximizing the Profit of Omnichannel Closed-Loop Supply Chains with Mean–Variance Criteria. Comput. Electr. Eng. 2024, 113, 109030. [Google Scholar] [CrossRef]
  3. Adobor, H. Supply Chain Resilience: A Multi-Level Framework. Int. J. Logist. Res. Appl. 2019, 22, 533–556. [Google Scholar] [CrossRef]
  4. Browning, T.; Kumar, M.; Sanders, N.; Sodhi, M.S.; Thürer, M.; Tortorella, G.L. From Supply Chain Risk to System-Wide Disruptions: Research Opportunities in Forecasting, Risk Management and Product Design. Int. J. Oper. Prod. Manag. 2023, 43, 1841–1858. [Google Scholar] [CrossRef]
  5. Sturm, S.; Hohenstein, N.-O.; Hartmann, E. Linking Entrepreneurial Orientation and Supply Chain Resilience to Strengthen Business Performance: An Empirical Analysis. Int. J. Oper. Prod. Manag. 2023, 43, 1357–1386. [Google Scholar] [CrossRef]
  6. Huo, B.; Li, D.; Gu, M. The Impact of Supply Chain Resilience on Customer Satisfaction and Financial Performance: A Combination of Contingency and Configuration Approaches. J. Manag. Sci. Eng. 2024, 9, 38–52. [Google Scholar] [CrossRef]
  7. Ekanayake, E.M.A.C.; Shen, G.Q.P.; Kumaraswamy, M.M. A Fuzzy Synthetic Evaluation of Capabilities for Improving Supply Chain Resilience of Industrialised Construction: A Hong Kong Case Study. Prod. Plan. Control 2023, 34, 623–640. [Google Scholar] [CrossRef]
  8. Liu, M.; Ding, Y.; Chu, F.; Dolgui, A.; Zheng, F. Robust Actions for Improving Supply Chain Resilience and Viability. Omega 2024, 123, 102972. [Google Scholar] [CrossRef]
  9. Torshizi, E.; Bozorgi-Amiri, A.; Sabouhi, F. Resilient and Sustainable Global COVID-19 Vaccine Supply Chain Design Considering Reverse Logistics. Appl. Soft Comput. 2024, 151, 111041. [Google Scholar] [CrossRef]
  10. Lou, G.; Guo, Y.; Lai, Z.; Ma, H.; Tu, X. Optimal Resilience Strategy for Manufacturers to Deal with Supply Disruptions: Investment in Supply Stability versus Dual Sourcing. Comput. Ind. Eng. 2024, 190, 110030. [Google Scholar] [CrossRef]
  11. Joshi, S.; Luong, H.T. A Two-Stage Capacity Reservation Contract Model with Backup Sourcing Considering Supply Side Disruptions. J. Ind. Prod. Eng. 2024, 41, 60–80. [Google Scholar] [CrossRef]
  12. Mukherjee, S.; Nagariya, R.; Mathiyazhagan, K.; Scuotto, V. Linking Supply Chain Resilience with Knowledge Management for Achieving Supply Chain Performance. J. Knowl. Manag. 2023, 28, 971–993. [Google Scholar] [CrossRef]
  13. Gupta, V.; Ivanov, D.; Choi, T.-M. Competitive Pricing of Substitute Products under Supply Disruption. Omega 2021, 101, 102279. [Google Scholar] [CrossRef] [PubMed]
  14. Ivanov, D.; Dolgui, A.; Sokolov, B.; Ivanova, M. Literature Review on Disruption Recovery in the Supply Chain. Int. J. Prod. Res. 2017, 55, 6158–6174. [Google Scholar] [CrossRef]
  15. Yoon, J.; Narasimhan, R.; Kim, M.K. Retailer’s Sourcing Strategy under Consumer Stockpiling in Anticipation of Supply Disruptions. Int. J. Prod. Res. 2018, 56, 3615–3635. [Google Scholar] [CrossRef]
  16. Gultekin, B.; Demir, S.; Gunduz, M.A.; Cura, F.; Ozer, L. The Logistics Service Providers during the COVID-19 Pandemic: The Prominence and the Cause-Effect Structure of Uncertainties and Risks. Comput. Ind. Eng. 2022, 165, 107950. [Google Scholar] [CrossRef]
  17. Janjua, N.K.; Nawaz, F.; Prior, D.D. A Fuzzy Supply Chain Risk Assessment Approach Using Real-Time Disruption Event Data from Twitter. Enterp. Inf. Syst. 2023, 17, 1959652. [Google Scholar] [CrossRef]
  18. Shourabizadeh, H.; Kundakcioglu, O.E.; Bozkir, C.D.C.; Tufekci, M.B.; Henry, A.C. Healthcare Inventory Management in the Presence of Supply Disruptions and a Reliable Secondary Supplier. Ann. Oper. Res. 2023, 331, 1149–1206. [Google Scholar] [CrossRef]
  19. Behl, A.; Gaur, J.; Pereira, V.; Yadav, R.; Laker, B. Role of Big Data Analytics Capabilities to Improve Sustainable Competitive Advantage of MSME Service Firms during COVID-19—A Multi-Theoretical Approach. J. Bus. Res. 2022, 148, 378–389. [Google Scholar] [CrossRef]
  20. Giri, B.C.; Majhi, J.K.; Chaudhuri, K. Coordination Mechanisms of a Three-Layer Supply Chain under Demand and Supply Risk Uncertainties. RAIRO-Oper. Res. 2021, 55, S2593–S2617. [Google Scholar] [CrossRef]
  21. Rosales, F.P.; Oprime, P.C.; Royer, A.; Batalha, M.O. Supply Chain Risks: Findings from Brazilian Slaughterhouses. Supply Chain Manag. Int. J. 2020, 25, 343–357. [Google Scholar] [CrossRef]
  22. Choi, T.-M.; Shi, X. Reducing Supply Risks by Supply Guarantee Deposit Payments in the Fashion Industry in the “New Normal after COVID-19”. Omega 2022, 109, 102605. [Google Scholar] [CrossRef]
  23. Liu, J.; Zhou, H.; Wang, J. The Coordination Mechanisms of Emergency Inventory Model under Supply Disruptions. Soft Comput. 2018, 22, 5479–5489. [Google Scholar] [CrossRef]
  24. Fang, X.; Yuan, F. The Coordination and Preference of Supply Chain Contracts Based on Time-Sensitivity Promotional Mechanism. J. Manag. Sci. Eng. 2018, 3, 158–178. [Google Scholar] [CrossRef]
  25. Saha, S.; Modak, N.M.; Panda, S.; Sana, S.S. Managing a Retailer’s Dual-Channel Supply Chain under Price- and Delivery Time-Sensitive Demand. J. Model. Manag. 2018, 13, 351–374. [Google Scholar] [CrossRef]
  26. Salam, M.A.; Bajaba, S. The Role of Supply Chain Resilience and Absorptive Capacity in the Relationship between Marketing–Supply Chain Management Alignment and Firm Performance: A Moderated-Mediation Analysis. J. Bus. Ind. Mark. 2022, 38, 1545–1561. [Google Scholar] [CrossRef]
  27. Li, X.; Ghadami, A.; Drake, J.M.; Rohani, P.; Epureanu, B.I. Mathematical Model of the Feedback between Global Supply Chain Disruption and COVID-19 Dynamics. Sci. Rep. 2021, 11, 15450. [Google Scholar] [CrossRef]
  28. Liu, H.; Lu, F.; Shi, B.; Hu, Y.; Li, M. Big Data and Supply Chain Resilience: Role of Decision-Making Technology. Manag. Decis. 2023, 61, 2792–2808. [Google Scholar] [CrossRef]
  29. Munir, M.; Jajja, M.S.S.; Chatha, K.A. Capabilities for Enhancing Supply Chain Resilience and Responsiveness in the COVID-19 Pandemic: Exploring the Role of Improvisation, Anticipation, and Data Analytics Capabilities. Int. J. Oper. Prod. Manag. 2022, 42, 1576–1604. [Google Scholar] [CrossRef]
  30. Liu, W.; Liu, Z. Simulation Analysis of Supply Chain Resilience of Prefabricated Building Projects Based on System Dynamics. Buildings 2023, 13, 2629. [Google Scholar] [CrossRef]
  31. Adobor, H.; McMullen, R.S. Supply Chain Resilience: A Dynamic and Multidimensional Approach. Int. J. Logist. Manag. 2018, 29, 1451–1471. [Google Scholar] [CrossRef]
  32. Rajesh, R. Forecasting Supply Chain Resilience Performance Using Grey Prediction. Electron. Commer. Res. Appl. 2016, 20, 42–58. [Google Scholar] [CrossRef]
  33. Kazancoglu, I.; Ozbiltekin-Pala, M.; Mangla, S.K.; Kazancoglu, Y.; Jabeen, F. Role of Flexibility, Agility and Responsiveness for Sustainable Supply Chain Resilience during COVID-19. J. Clean. Prod. 2022, 362, 132431. [Google Scholar] [CrossRef]
  34. Al-Hakimi, M.A.; Saleh, M.H.; Borade, D.B. Entrepreneurial Orientation and Supply Chain Resilience of Manufacturing SMEs in Yemen: The Mediating Effects of Absorptive Capacity and Innovation. Heliyon 2021, 7, e08145. [Google Scholar] [CrossRef]
  35. Siva Kumar, P.; Anbanandam, R. Theory Building on Supply Chain Resilience: A SAP–LAP Analysis. Glob. J. Flex. Syst. Manag. 2020, 21, 113–133. [Google Scholar] [CrossRef]
  36. Lu, J.; Wang, J.; Song, Y.; Yuan, C.; He, J.; Chen, Z. Influencing Factors Analysis of Supply Chain Resilience of Prefabricated Buildings Based on PF-DEMATEL-ISM. Buildings 2022, 12, 1595. [Google Scholar] [CrossRef]
  37. Rajesh, R. Technological Capabilities and Supply Chain Resilience of Firms: A Relational Analysis Using Total Interpretive Structural Modeling (TISM). Technol. Forecast. Soc. Chang. 2017, 118, 161–169. [Google Scholar] [CrossRef]
  38. Lee, S.M.; Rha, J.S. Ambidextrous Supply Chain as a Dynamic Capability: Building a Resilient Supply Chain. Manag. Decis. 2016, 54, 2–23. [Google Scholar] [CrossRef]
  39. Chowdhury, M.M.H.; Quaddus, M. Supply Chain Resilience: Conceptualization and Scale Development Using Dynamic Capability Theory. Int. J. Prod. Econ. 2017, 188, 185–204. [Google Scholar] [CrossRef]
  40. Cohen, M.; Cui, S.; Doetsch, S.; Ernst, R.; Huchzermeier, A.; Kouvelis, P.; Lee, H.; Matsuo, H.; Tsay, A.A. Bespoke Supply-Chain Resilience: The Gap between Theory and Practice. J. Oper. Manag. 2022, 68, 515–531. [Google Scholar] [CrossRef]
  41. Shanker, S.; Barve, A.; Muduli, K.; Kumar, A.; Garza-Reyes, J.A.; Joshi, S. Enhancing Resiliency of Perishable Product Supply Chains in the Context of the COVID-19 Outbreak. Int. J. Logist. Res. Appl. 2022, 25, 1219–1243. [Google Scholar] [CrossRef]
  42. Pu, G.; Qiao, W.; Feng, Z. Antecedents and Outcomes of Supply Chain Resilience: Integrating Dynamic Capabilities and Relational Perspective. J. Contingencies Crisis Manag. 2023, 31, 706–726. [Google Scholar] [CrossRef]
  43. Kaviani, M.A.; Tavana, M.; Kowsari, F.; Rezapour, R. Supply Chain Resilience: A Benchmarking Model for Vulnerability and Capability Assessment in the Automotive Industry. Benchmarking Int. J. 2020, 27, 1929–1949. [Google Scholar] [CrossRef]
  44. Zhang, H.; Jia, F.; You, J.-X. Striking a Balance between Supply Chain Resilience and Supply Chain Vulnerability in the Cross-Border e-Commerce Supply Chain. Int. J. Logist. Res. Appl. 2023, 26, 320–344. [Google Scholar] [CrossRef]
  45. Shin, N.; Park, S. Evidence-Based Resilience Management for Supply Chain Sustainability: An Interpretive Structural Modelling Approach. Sustainability 2019, 11, 484. [Google Scholar] [CrossRef]
  46. Wang, Y.; Ren, J.; Zhang, L.; Liu, D. Research on Resilience Evaluation of Green Building Supply Chain Based on ANP-Fuzzy Model. Sustainability 2023, 15, 285. [Google Scholar] [CrossRef]
  47. Ke, Y.; Lu, L.; Luo, X. Identification and Formation Mechanism of Key Elements of Supply Chain Resilience: Exploration Based on Grounded Theory and Verification of SEM. PLoS ONE 2023, 18, e0293741. [Google Scholar]
  48. Vimal, K.E.K.; Kumar, A.; Sunil, S.M.; Suresh, G.; Sanjeev, N.; Kandasamy, J. Analysing the Challenges in Building Resilient Net Zero Carbon Supply Chains Using Influential Network Relationship Mapping. J. Clean. Prod. 2022, 379, 134635. [Google Scholar]
  49. Liu, J.; Gu, B.; Chen, J. Enablers for Maritime Supply Chain Resilience during Pandemic: An Integrated MCDM Approach. Transp. Res. Part Policy Pract. 2023, 175, 103777. [Google Scholar] [CrossRef]
  50. Ye, F.; Hou, G.; Li, Y.; Fu, S. Managing Bioethanol Supply Chain Resiliency: A Risk-Sharing Model to Mitigate Yield Uncertainty Risk. Ind. Manag. Data Syst. 2018, 118, 1510–1527. [Google Scholar] [CrossRef]
Figure 1. The sequence of events.
Symmetry 16 01192 g001
Figure 2. Overall supply chain profit under different strategies.
Symmetry 16 01192 g002
Figure 3. Manufacturer’s profit under different strategies.
Symmetry 16 01192 g003
Figure 4. Retailer’s profit under different strategies.
Symmetry 16 01192 g004
Figure 5. Supply chain resilience investment decision under different strategies.
Symmetry 16 01192 g005
Table 1. Research on Supply Interruption.
AuthorMain Contributions
Beyza et al. (2022) [16]This article is based on the fuzzy DEMATEL method, where supply chain disruptions and demand changes are two factors caused by the COVID-19 pandemic that can affect financial failure and forecast scope.
Khalid et al. (2023) [17]This article develops a new method for identifying supply chain disruption events in real time using Twitter sources.
Hamed et al. (2023) [18]This article proposes a Markov chain model to analyze inventory management in situations of supply interruption and reliable secondary suppliers.
Abhishek et al. (2022) [19]This article analyzes how small- and medium-sized enterprises lacking research and discussion on big data analysis capabilities can gain sustainable competitive advantages through supply chain coordination, fast trust, and supply chain risk when facing challenges such as supply disruptions.
Bibhas et al. (2021) [20]This article proposes price-only contracts and new revenue-sharing contracts to alleviate the uncertainty of demand and supply in decentralized models, and observes that revenue-sharing contracts can fully coordinate the supply chain.
Rosales et al. (2020) [21]This article aims to identify the risks faced by the supply chain and analyze how these risks affect the coordination level of the supply chain.
Ming et al. (2022) [22]This article explores the common “supply margin payment” plan in the fashion supply chain during supply disruptions.
Liu et al. (2018) [23]This article establishes a collaborative emergency inventory model for responding to supply disruptions and explores the coordination mechanism between both parties in the supply chain.
Xingyu et al. (2021) [27]This article establishes a mathematical model to explore the impact of supply disruptions on global healthcare services.
Table 2. Description of symbols.
SymbolDescription
c Production cost per unit of product
p Sales price per unit of product
w Wholesale price per unit of product
d Product order quantity
e Supply chain resilience investment level
k Supply chain resilience investment cost sensitivity coefficient
α i Stochastic capacity recovery level, i = L ,   H
ξ Capacity recovery coefficient, 0 ξ 1
μ Loss per unit of product stockout
s Salvage value per unit of product
λ Probability of supply disruption, 0 λ 1
φ Retailer supply chain resilience cost-sharing ratio, 0 φ 1
π s c Supply chain profit
π m Manufacturer’s profit
π r Retailer’s profit
Table 3. The impact of changes in the capacity recovery coefficient on the supply chain’s optimal profit.
ξ π m π r
λ = 0.2 λ = 0.5 λ = 0.8 λ = 0.2 λ = 0.5 λ = 0.8
DCDCDCDCDCDC
0.170.380.5155.7579.1341.2078.6582.00109.9455.00124.8428.00139.75
0.371.9075.4759.7568.6747.6061.8786.0097.3265.0093.2944.0089.27
0.573.5074.7363.7566.8154.0058.9090.0089.9275.0074.8060.0059.68
0.775.1076.7367.7571.8160.4066.9094.0089.4785.0073.6776.0057.88
0.976.7080.3071.7580.7566.8081.2098.0096.0095.0090.0092.0084.00
Note: D = decentralized model; C = centralized model.
Disclaimer/Publisher’s Note: The statements, opinions and data contained in all publications are solely those of the individual author(s) and contributor(s) and not of MDPI and/or the editor(s). MDPI and/or the editor(s) disclaim responsibility for any injury to people or property resulting from any ideas, methods, instructions or products referred to in the content.