

A Data-Driven Methodology for Industrial Design Optimization and Consumer Preference Modeling: An Application of Computer-Aided Design in Sustainable Refrigerator Design Research

Abstract
:1. Introduction
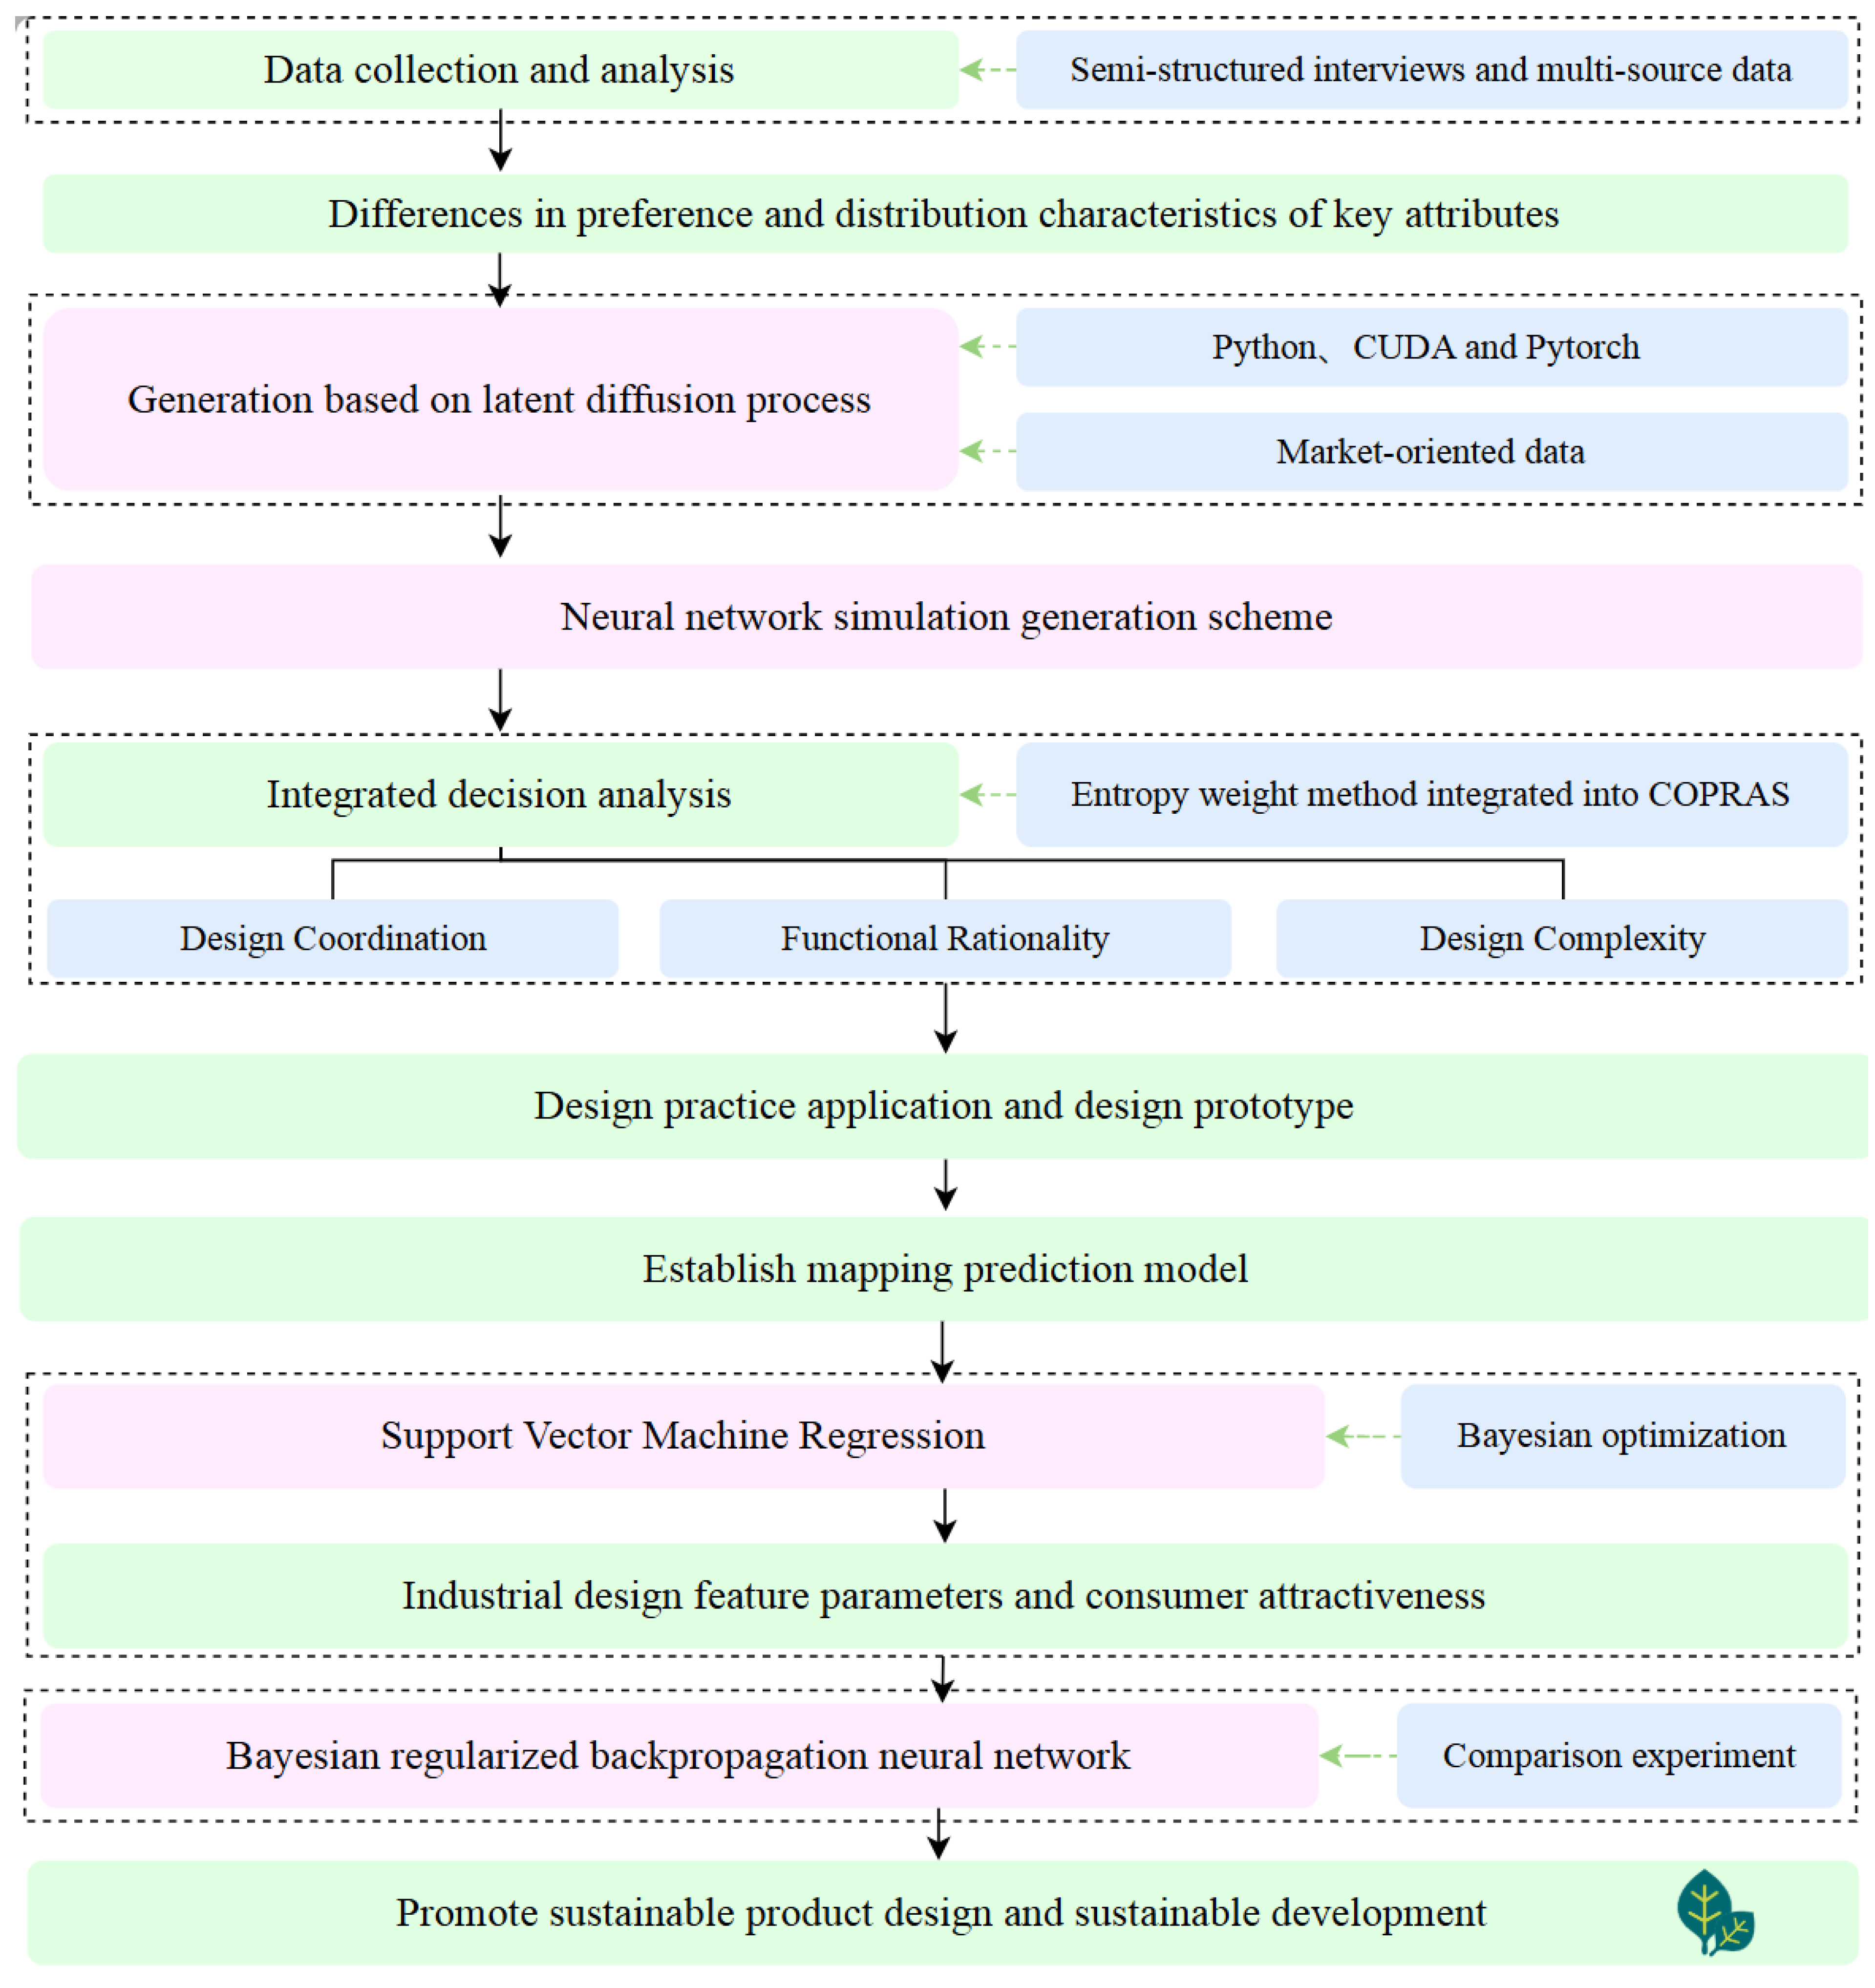
- For the first time, an LDM is integrated with empirically derived user constraints in home appliance design, innovatively employing entropy-weighted COPRAS to address multi-attribute trade-offs in generative deep neural network outputs, achieving balanced benefits among functionality, aesthetics, and sustainability.
- A closed-loop research paradigm of “demand insight—intelligent generation—decision optimization—market prediction” is established, overcoming the limitations of one-way user data transfer inherent in traditional design processes.
- The theoretical advantage of the structural risk minimization framework is validated within small-sample industrial design data scenarios, providing novel tools for decision-making analysis under limited data conditions.
2. Related Work
3. Methodology
3.1. Data Collection
3.2. Sustainable Design Research and Analysis
4. Results and Discussion
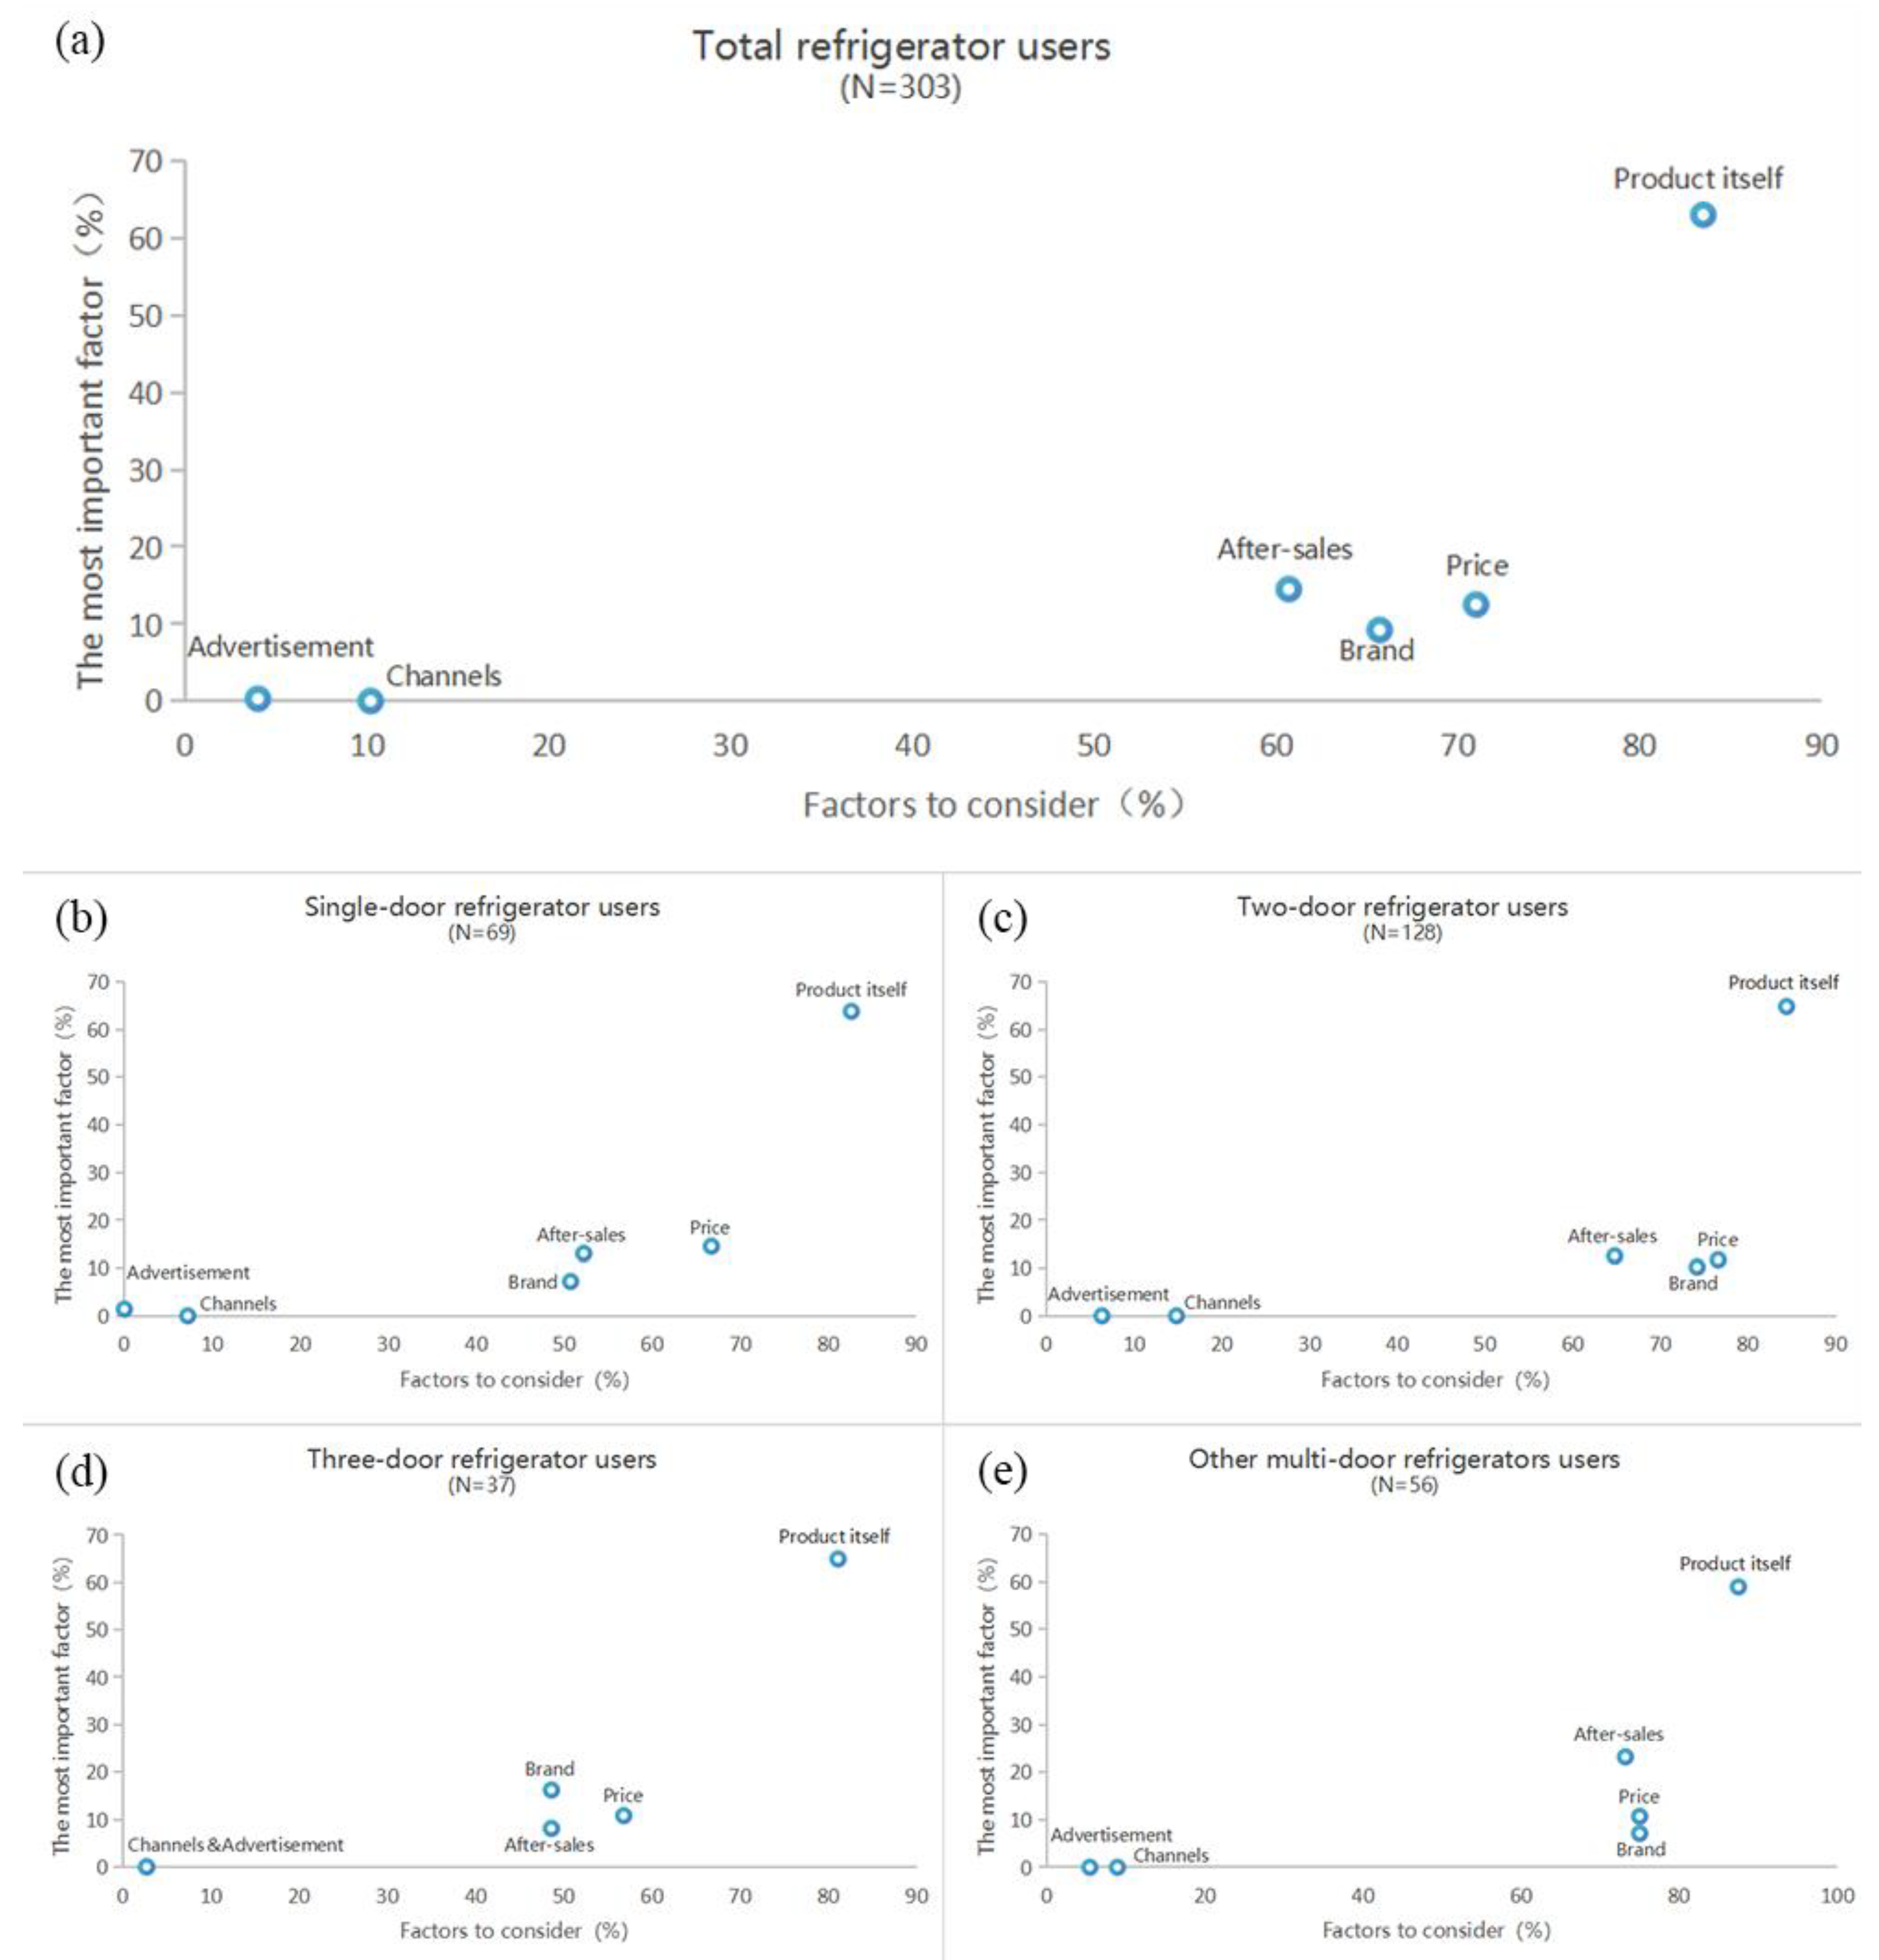
4.1. Consumer Feedback on Refrigerator Product Features and Energy Consumption
- Overall Refrigerator Capacity
- Exterior Design
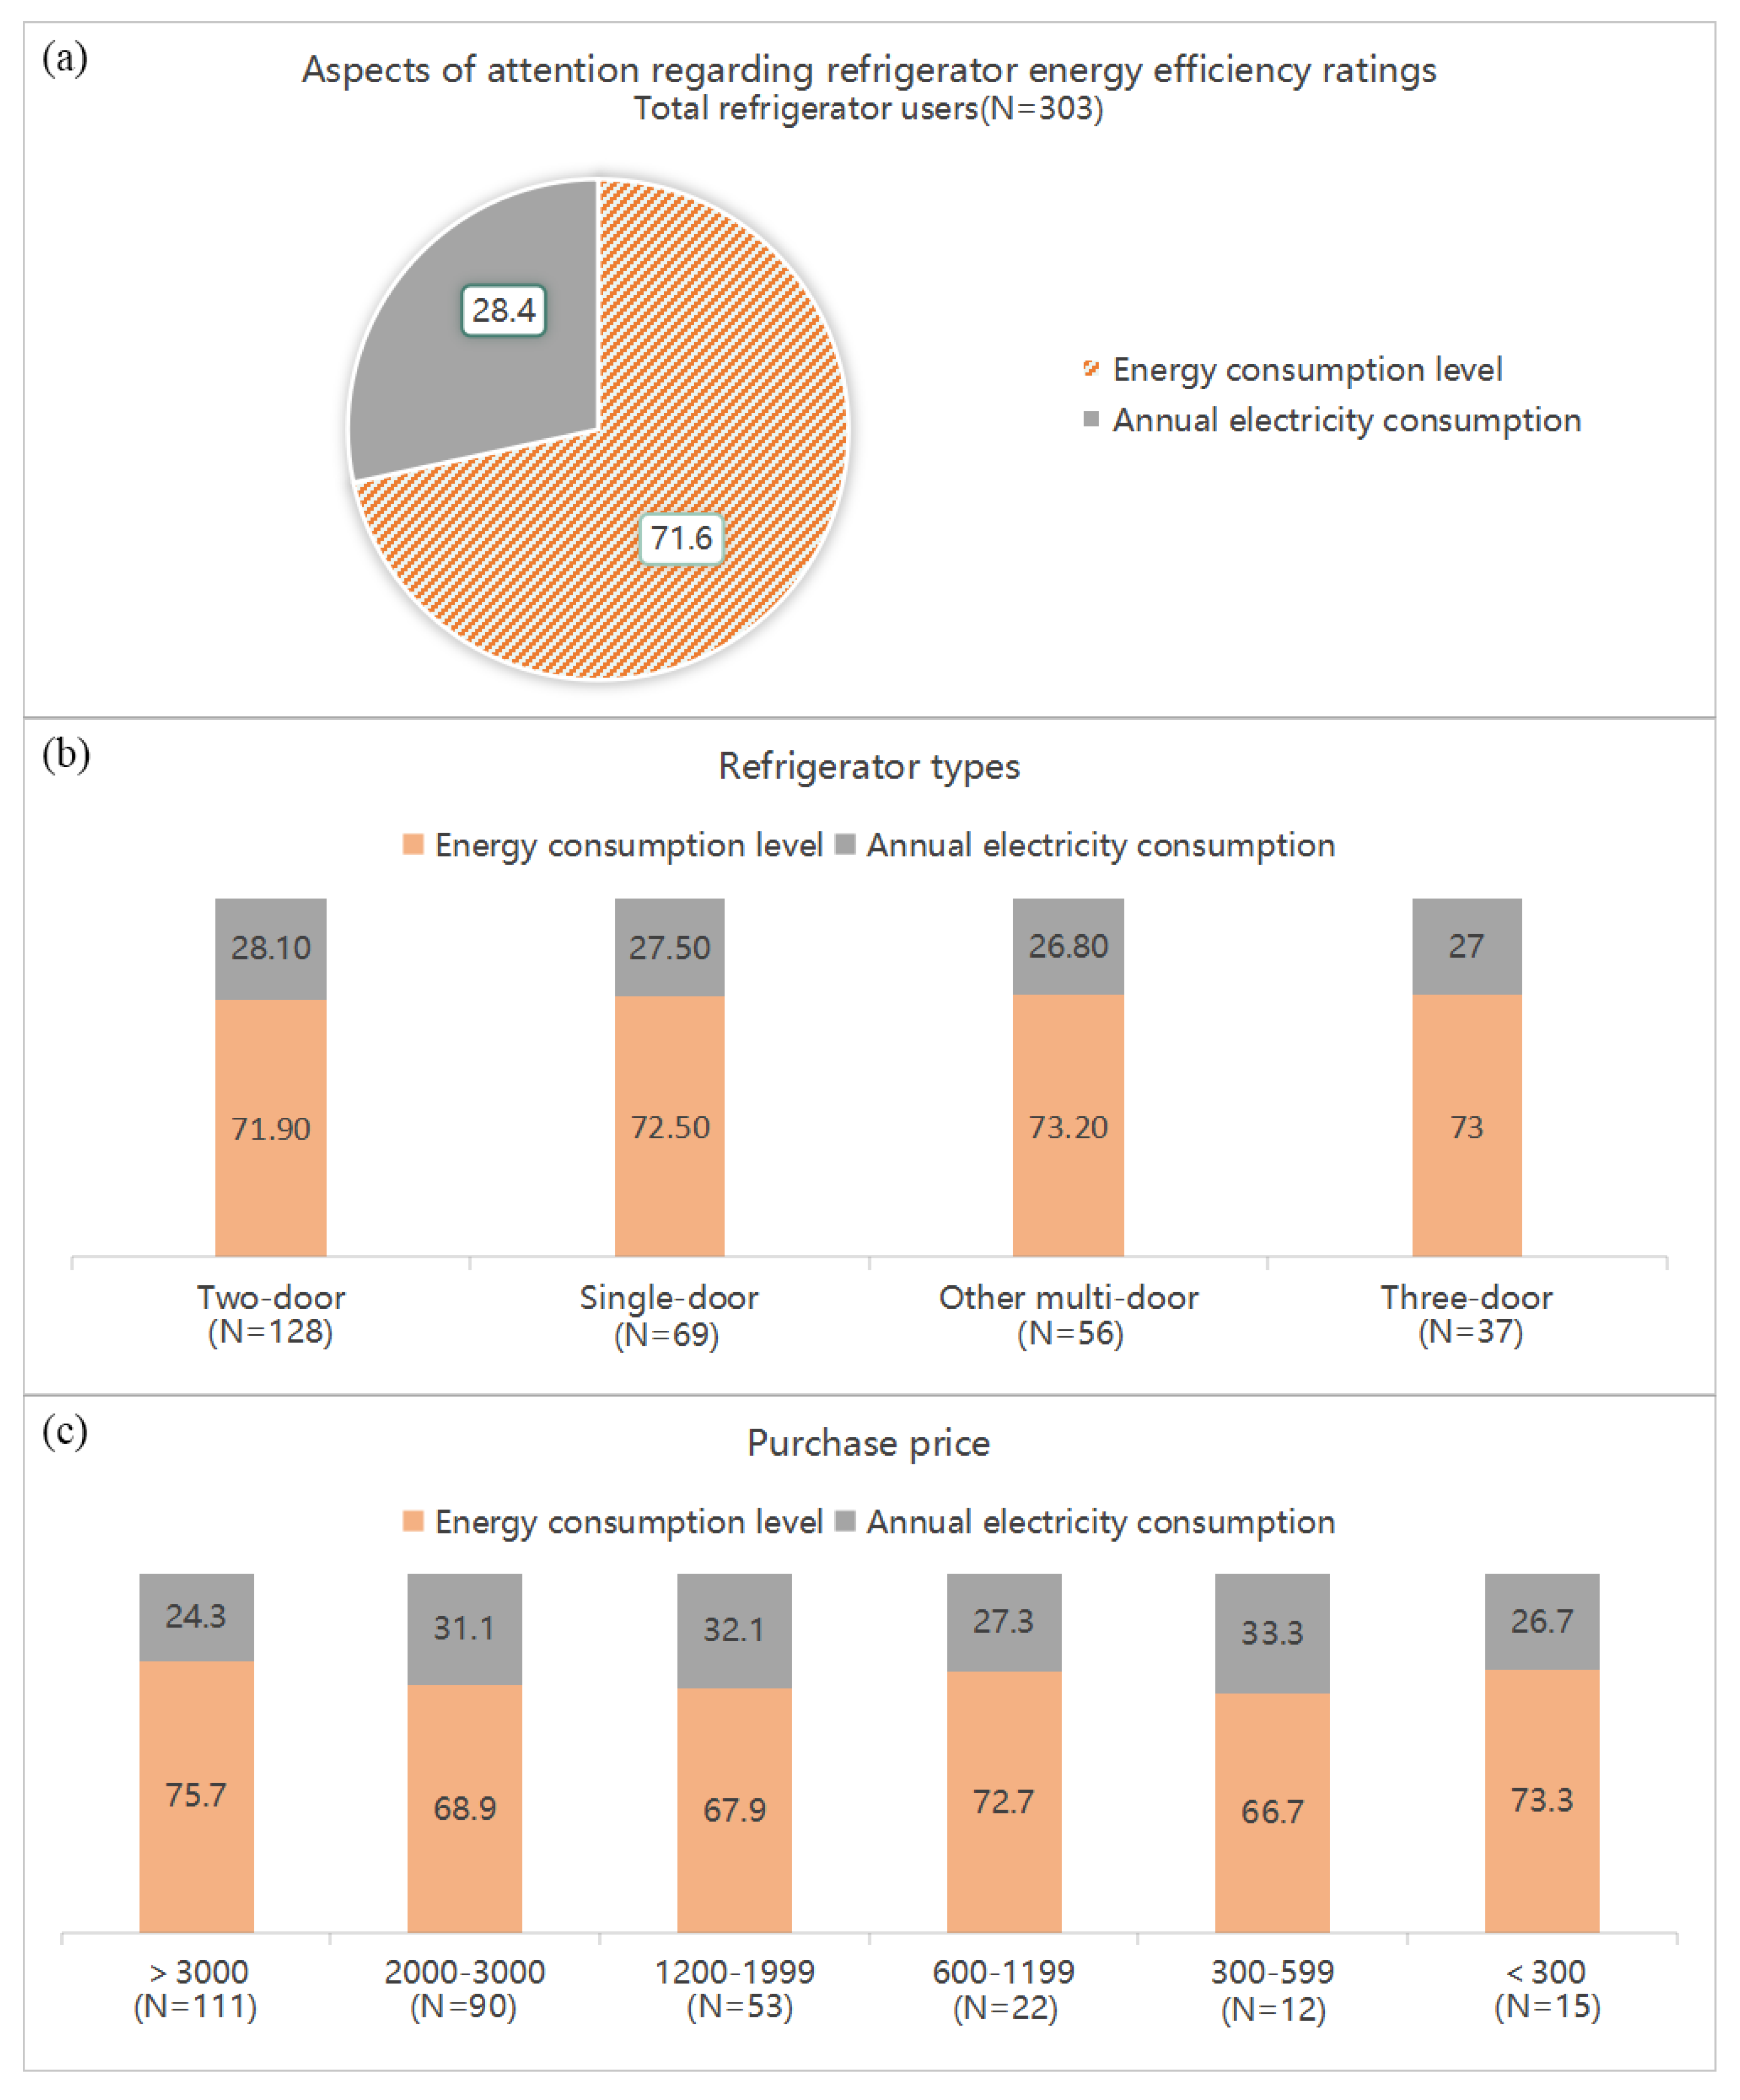
- Energy Efficiency Rating
- Size
- Freezer Capacity
- Operating Noise
- Internal Space Layout/Compartment Design
- Intelligent/Technological Functions
- Refrigerator Compartment Capacity
- Convenience of Storing Items
- Cooling Method
- Special Function Compartments
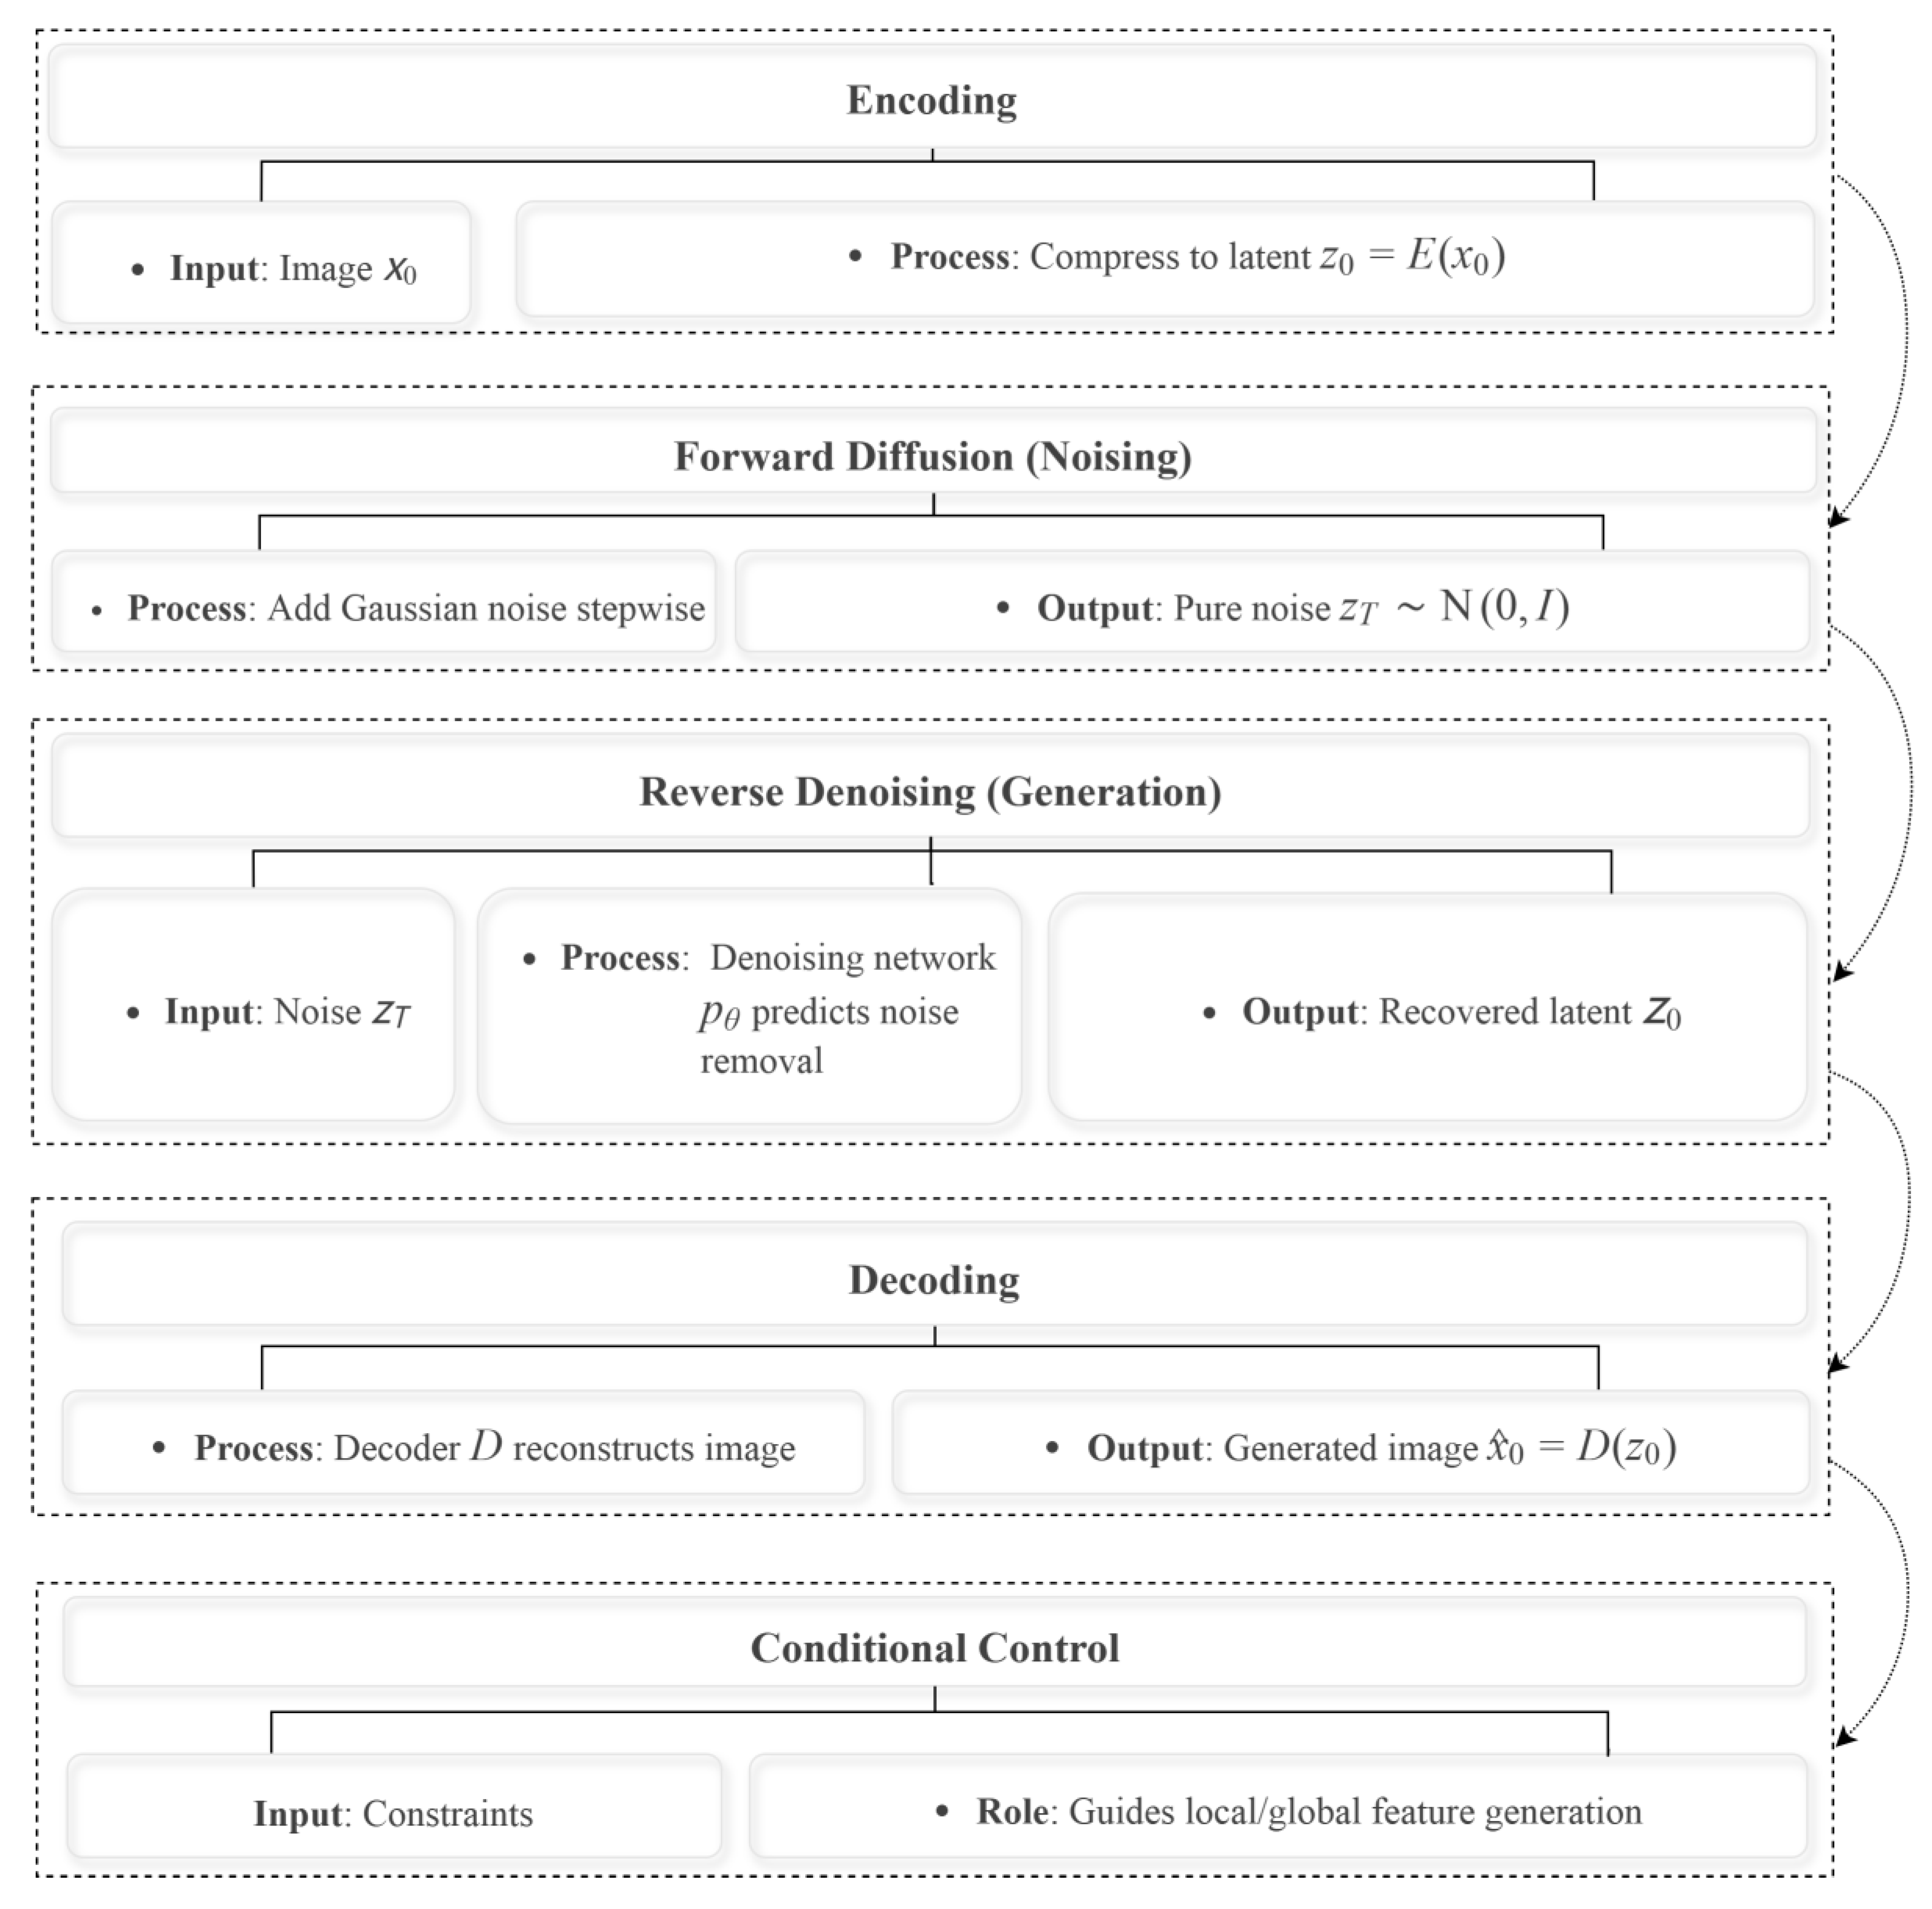
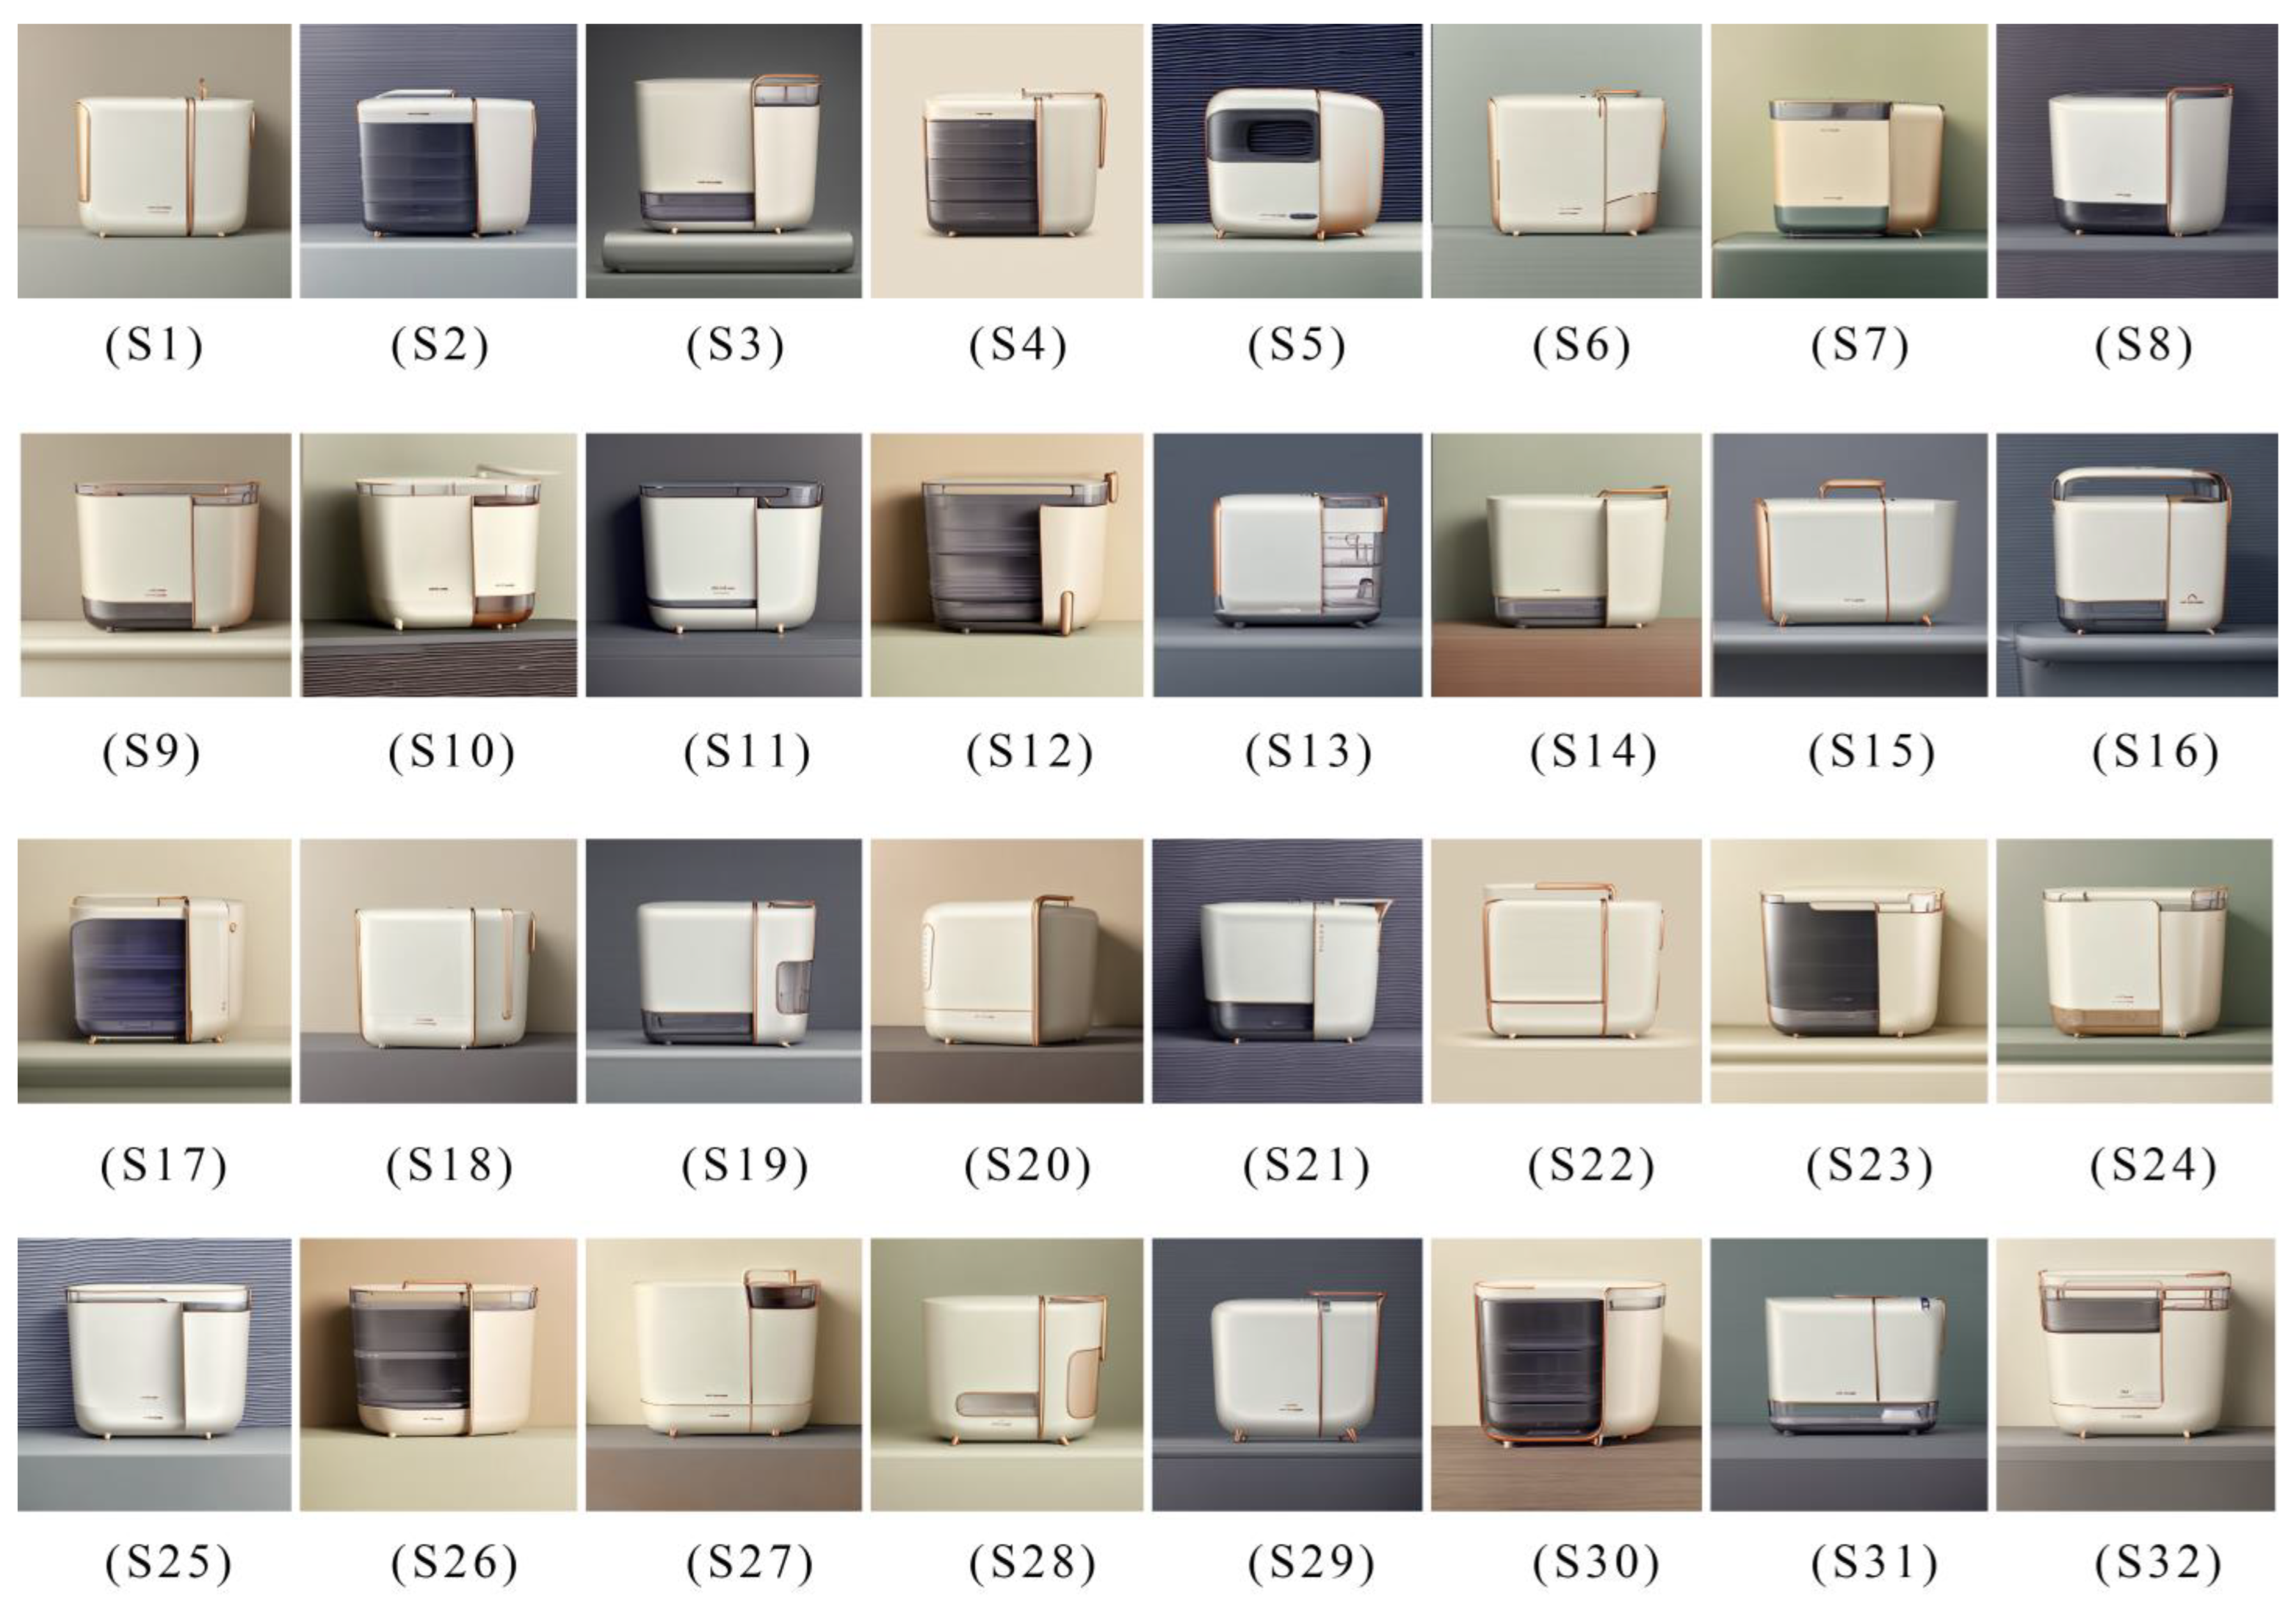
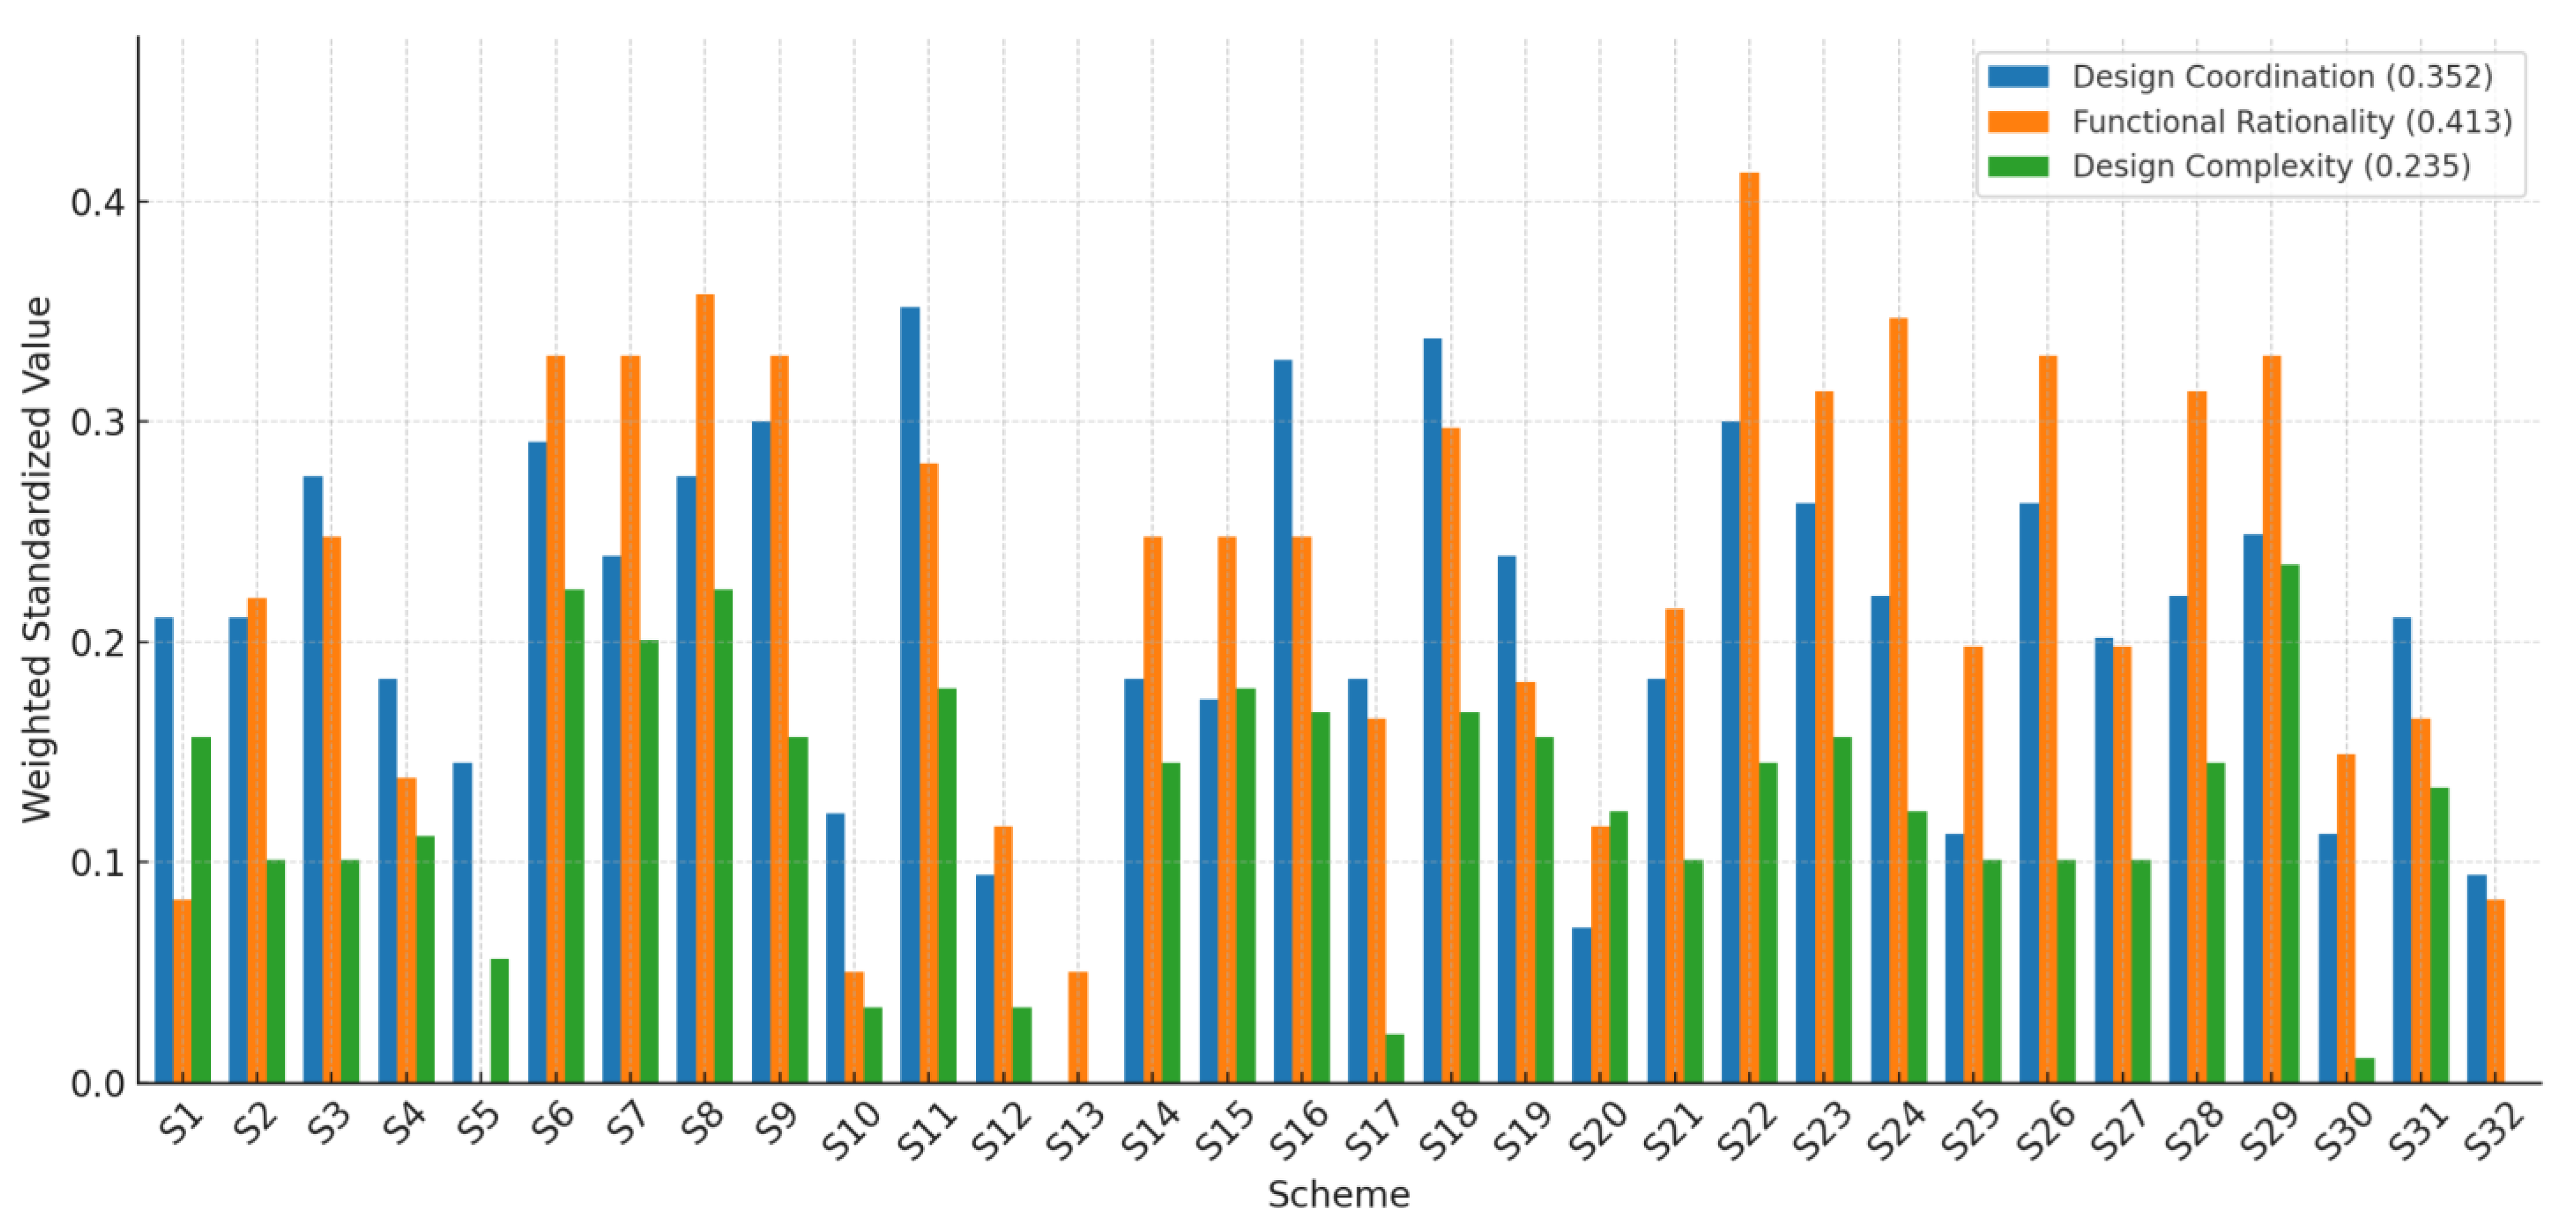
4.2. Generation and Analysis of Sustainable Design Schemes via Computational Methods
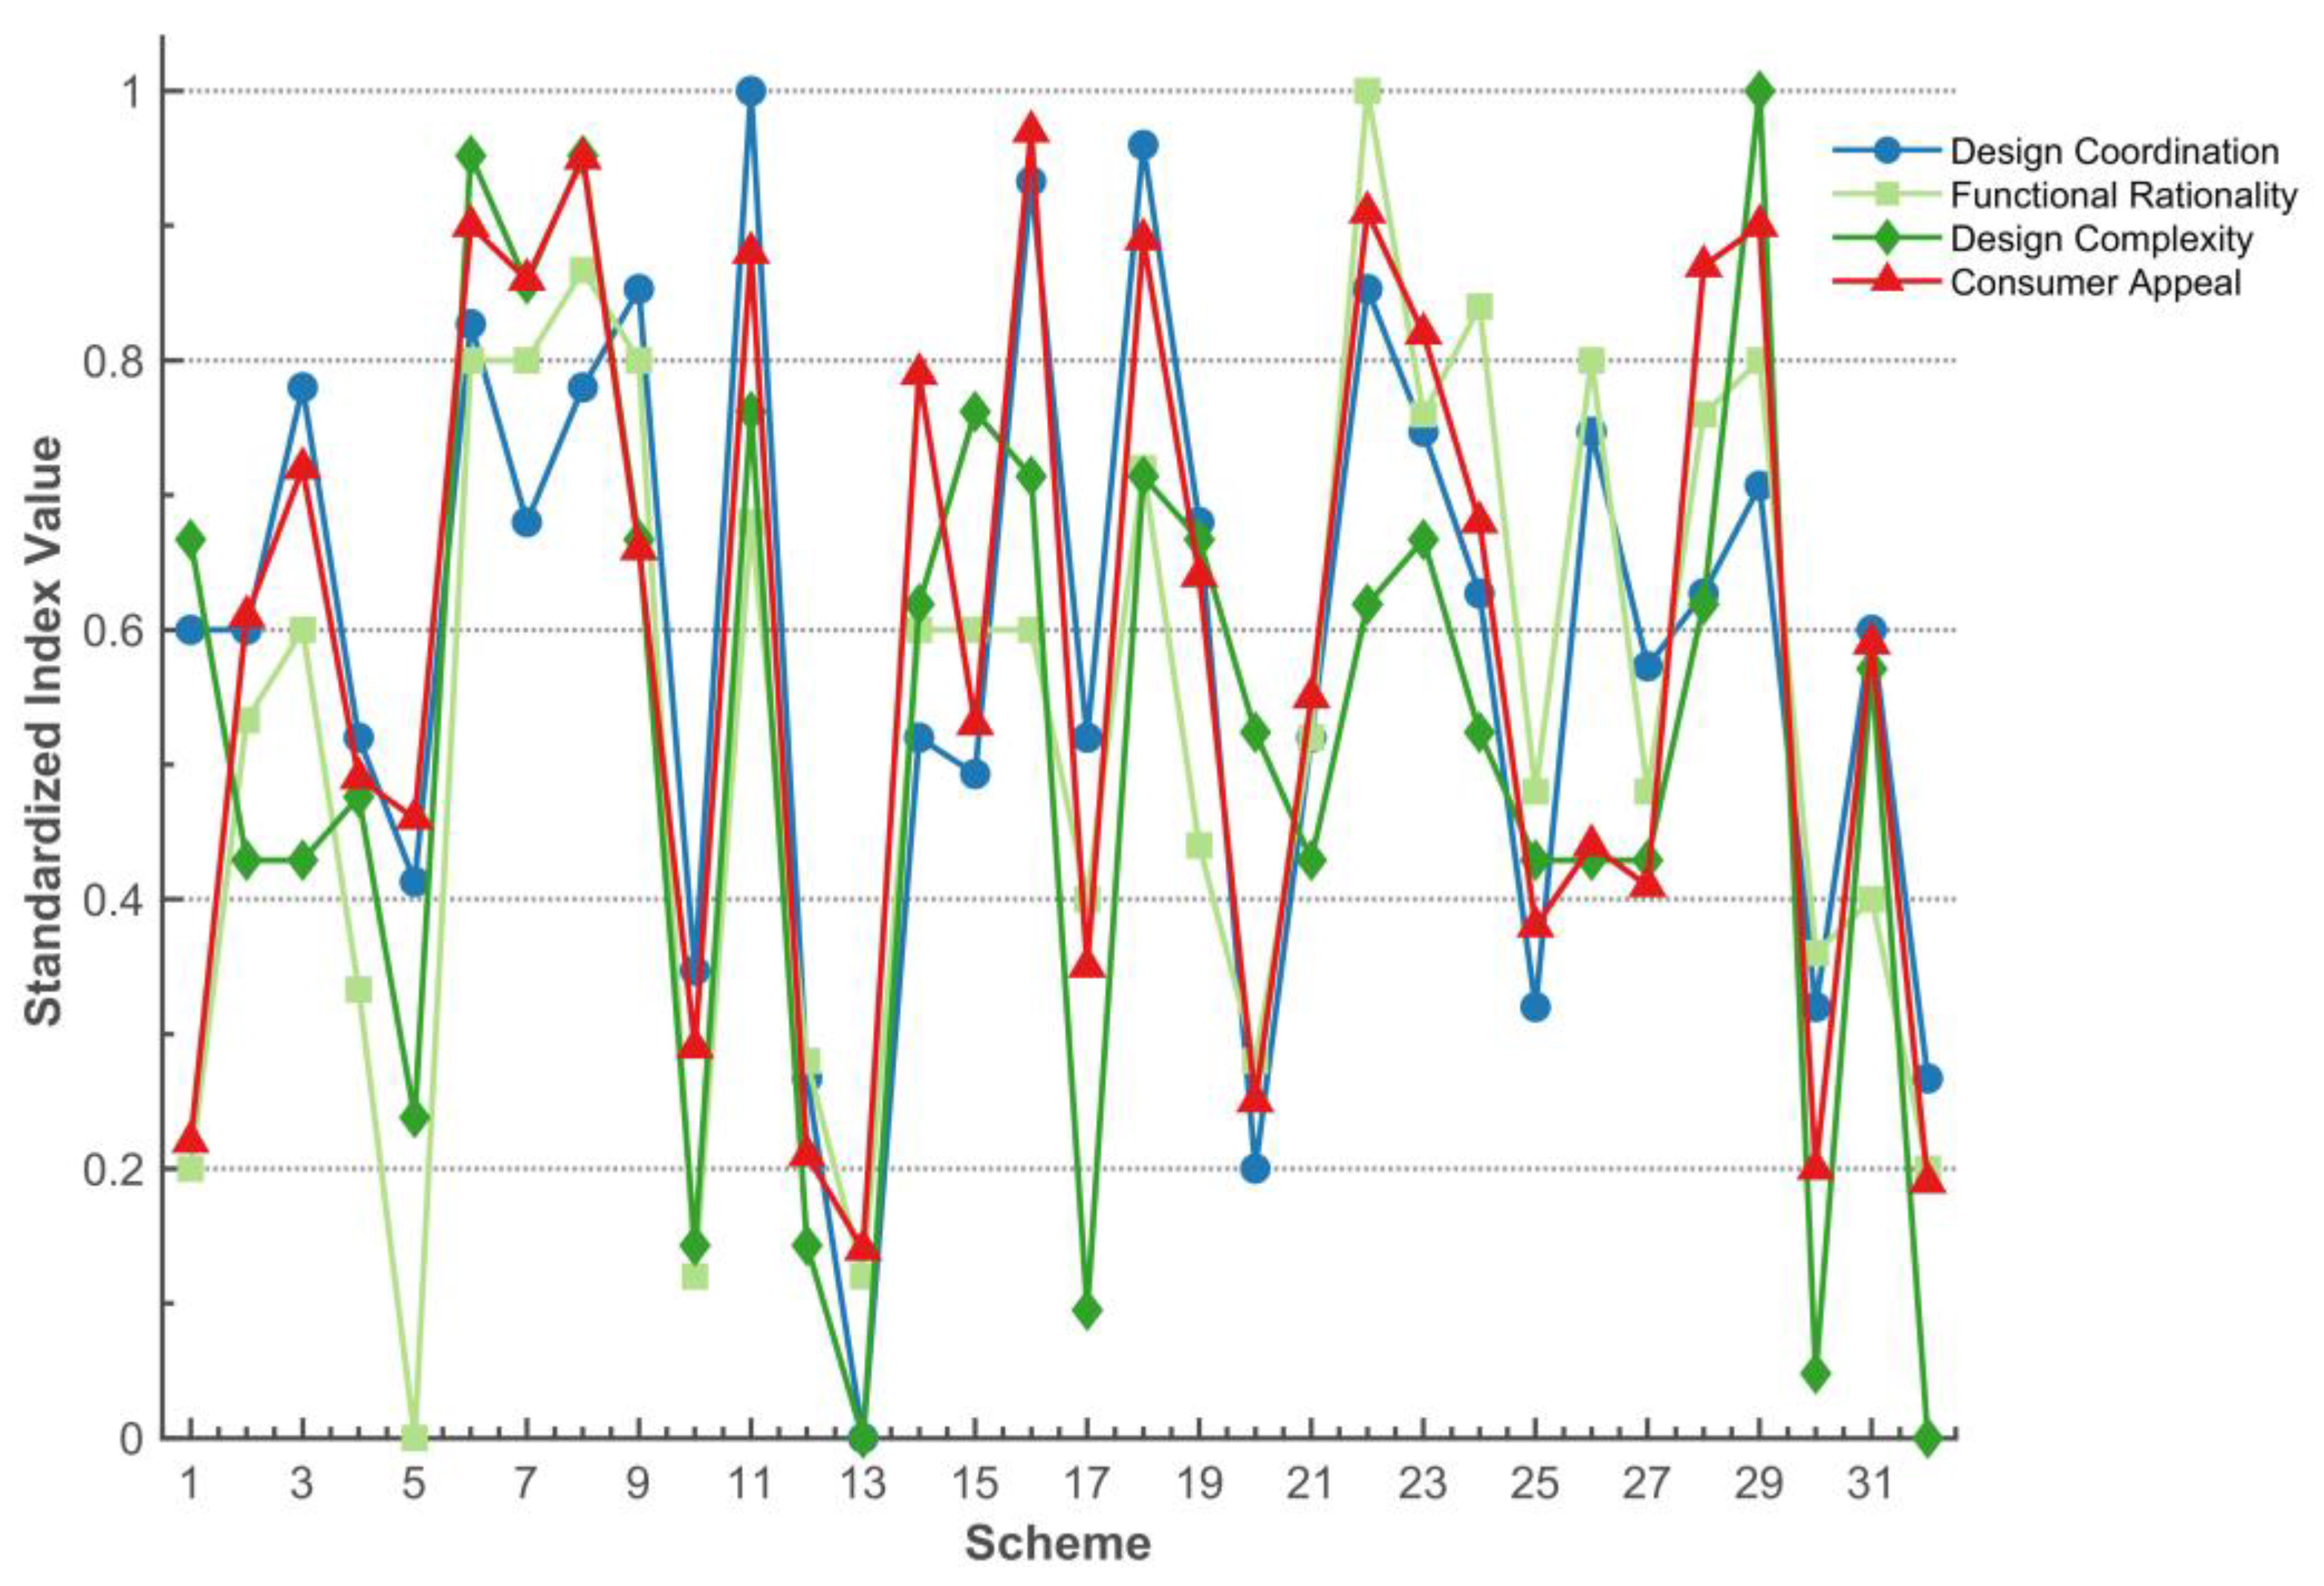
4.2.1. Simulation-Based Generation and Discussion of Schemes
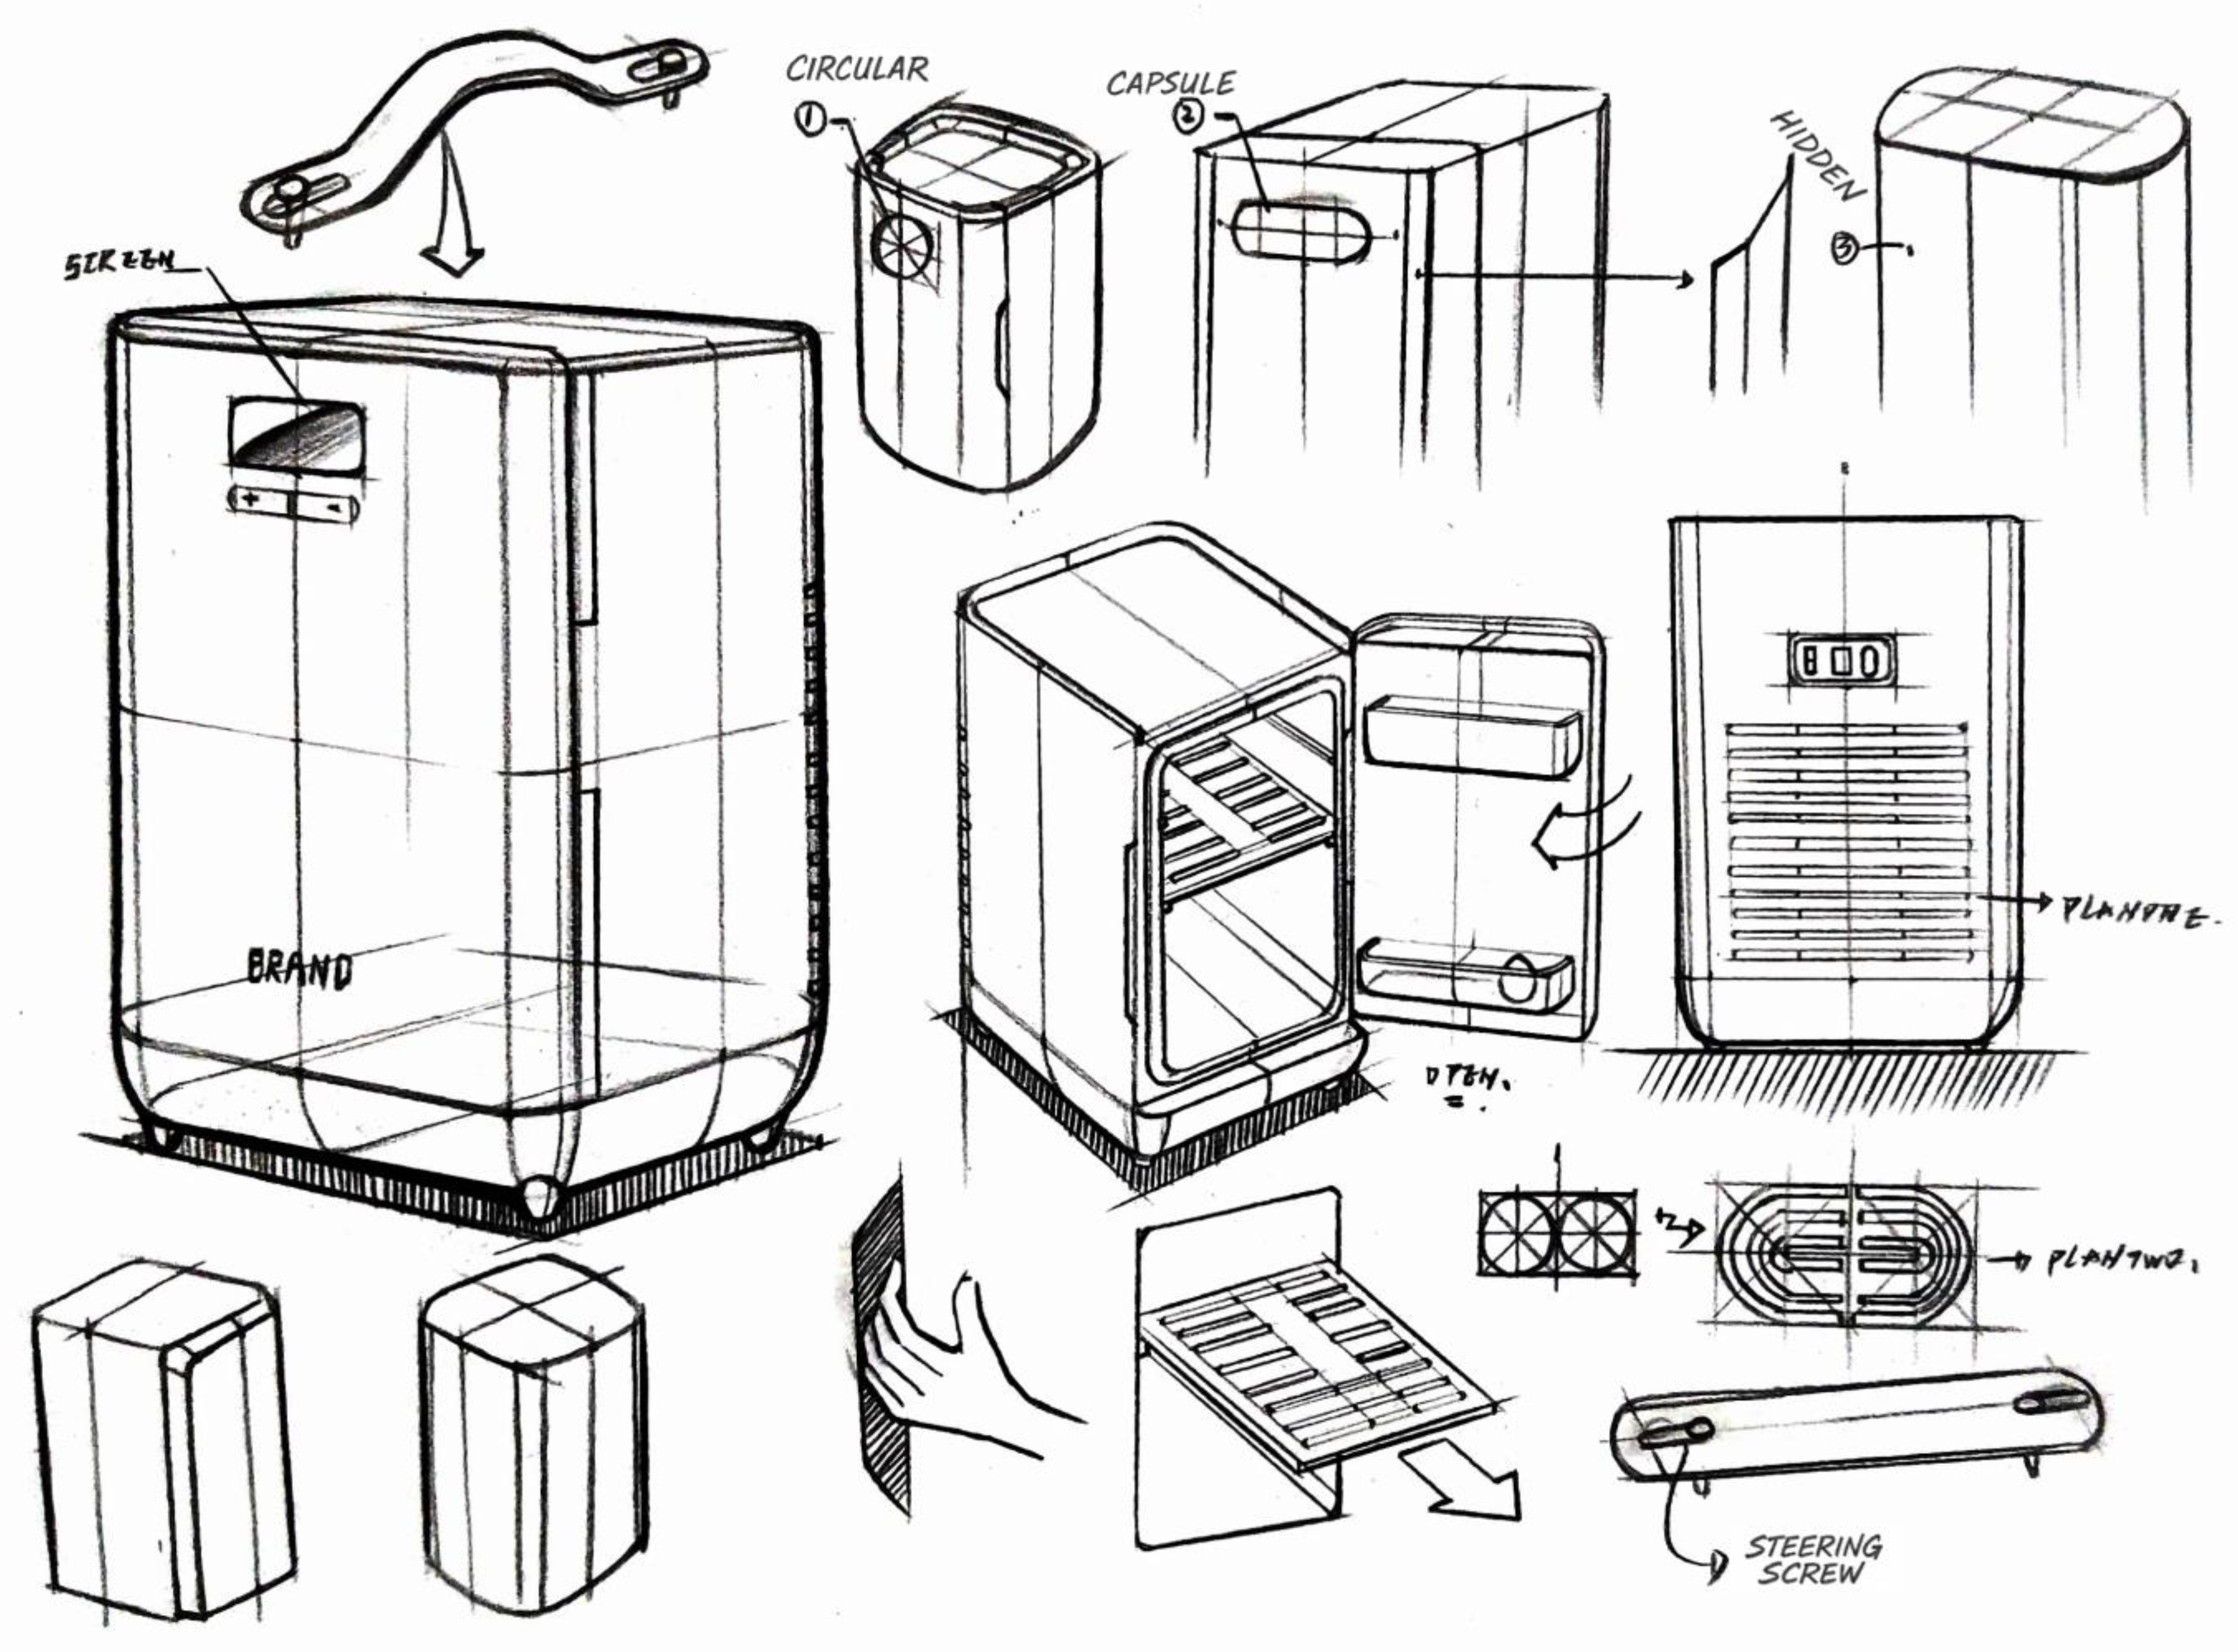
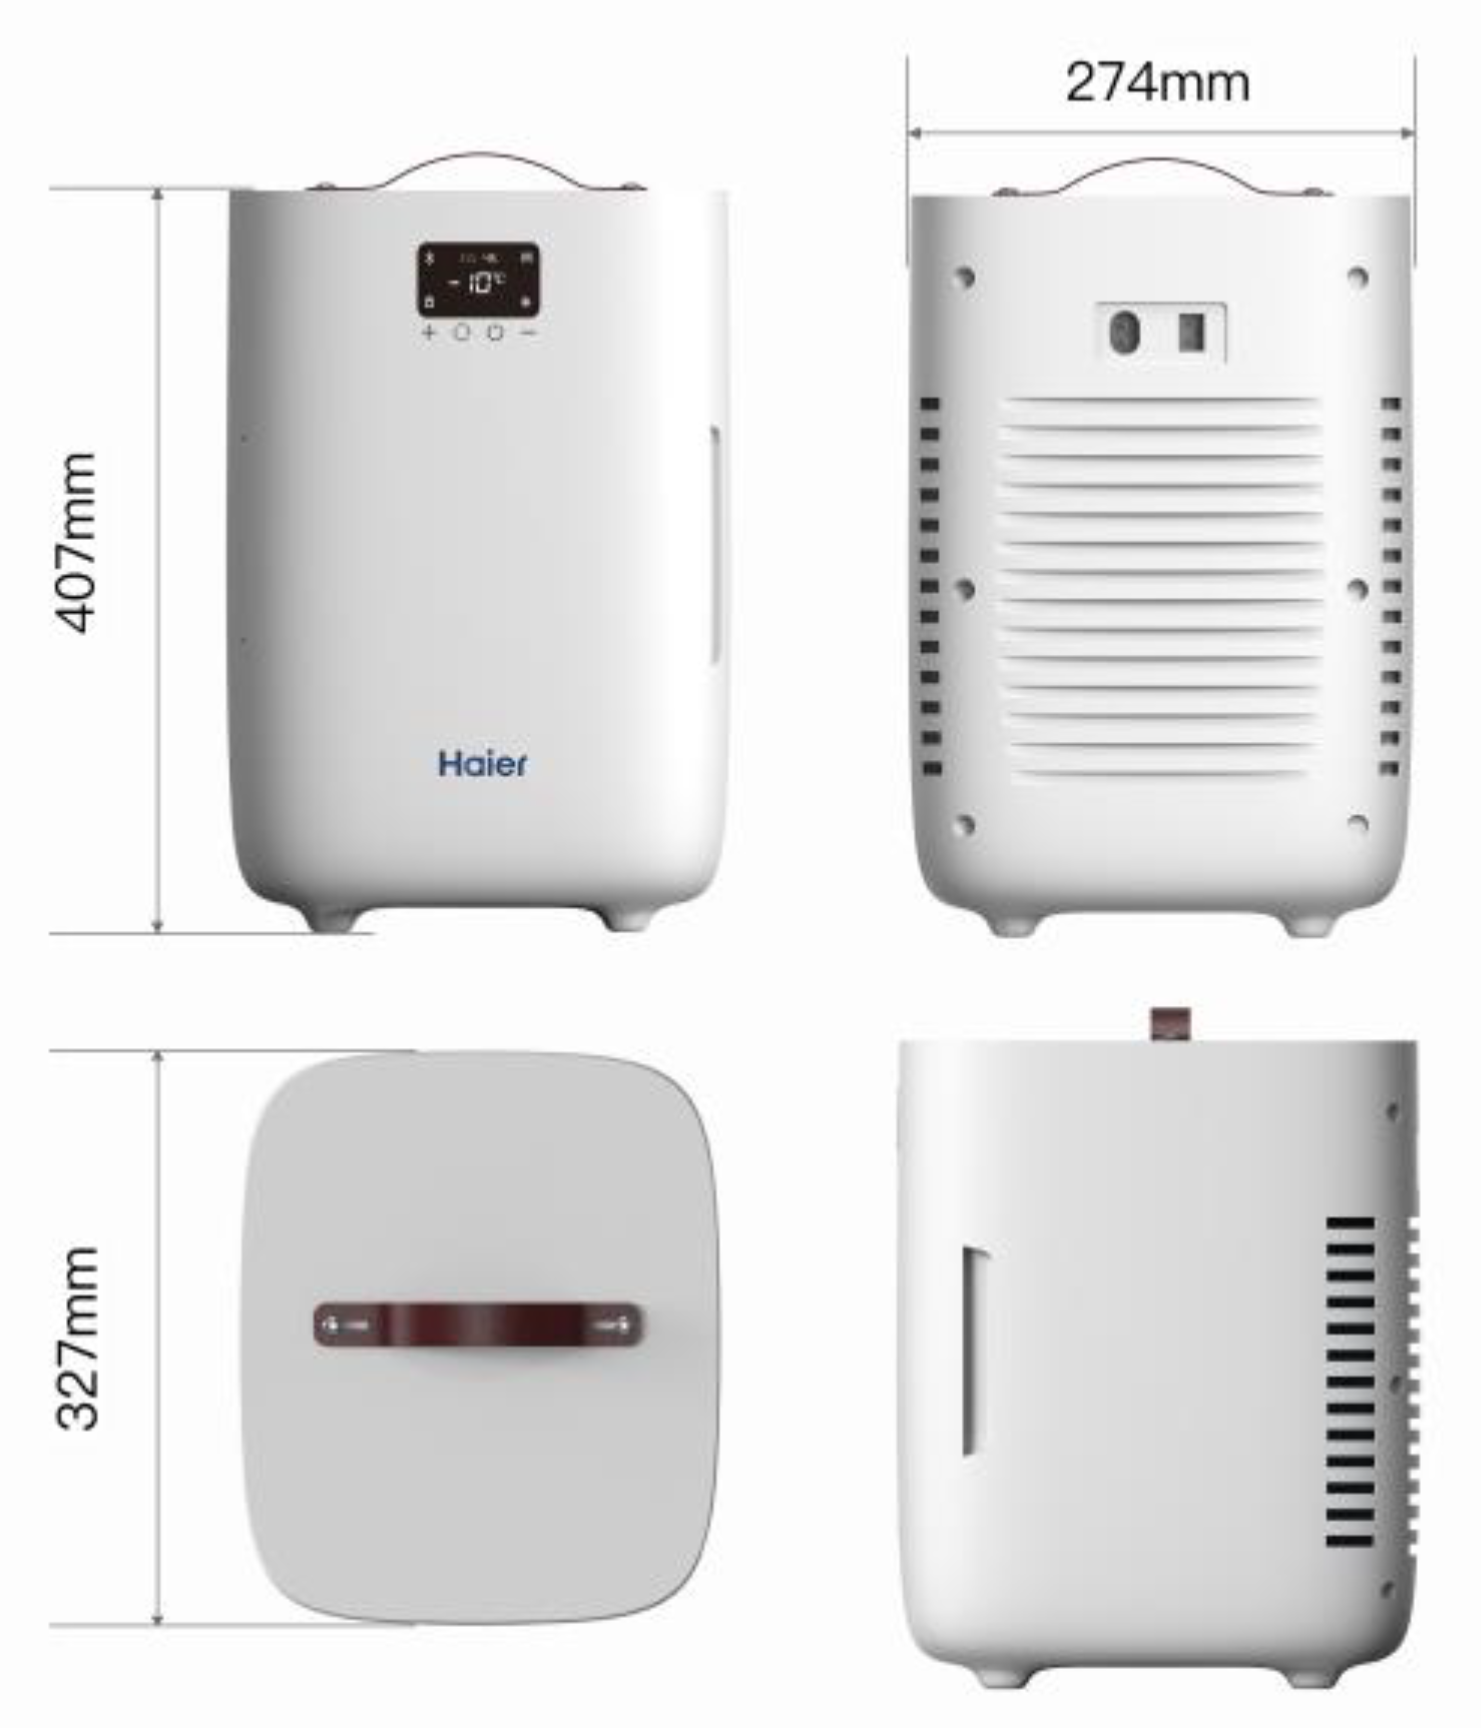
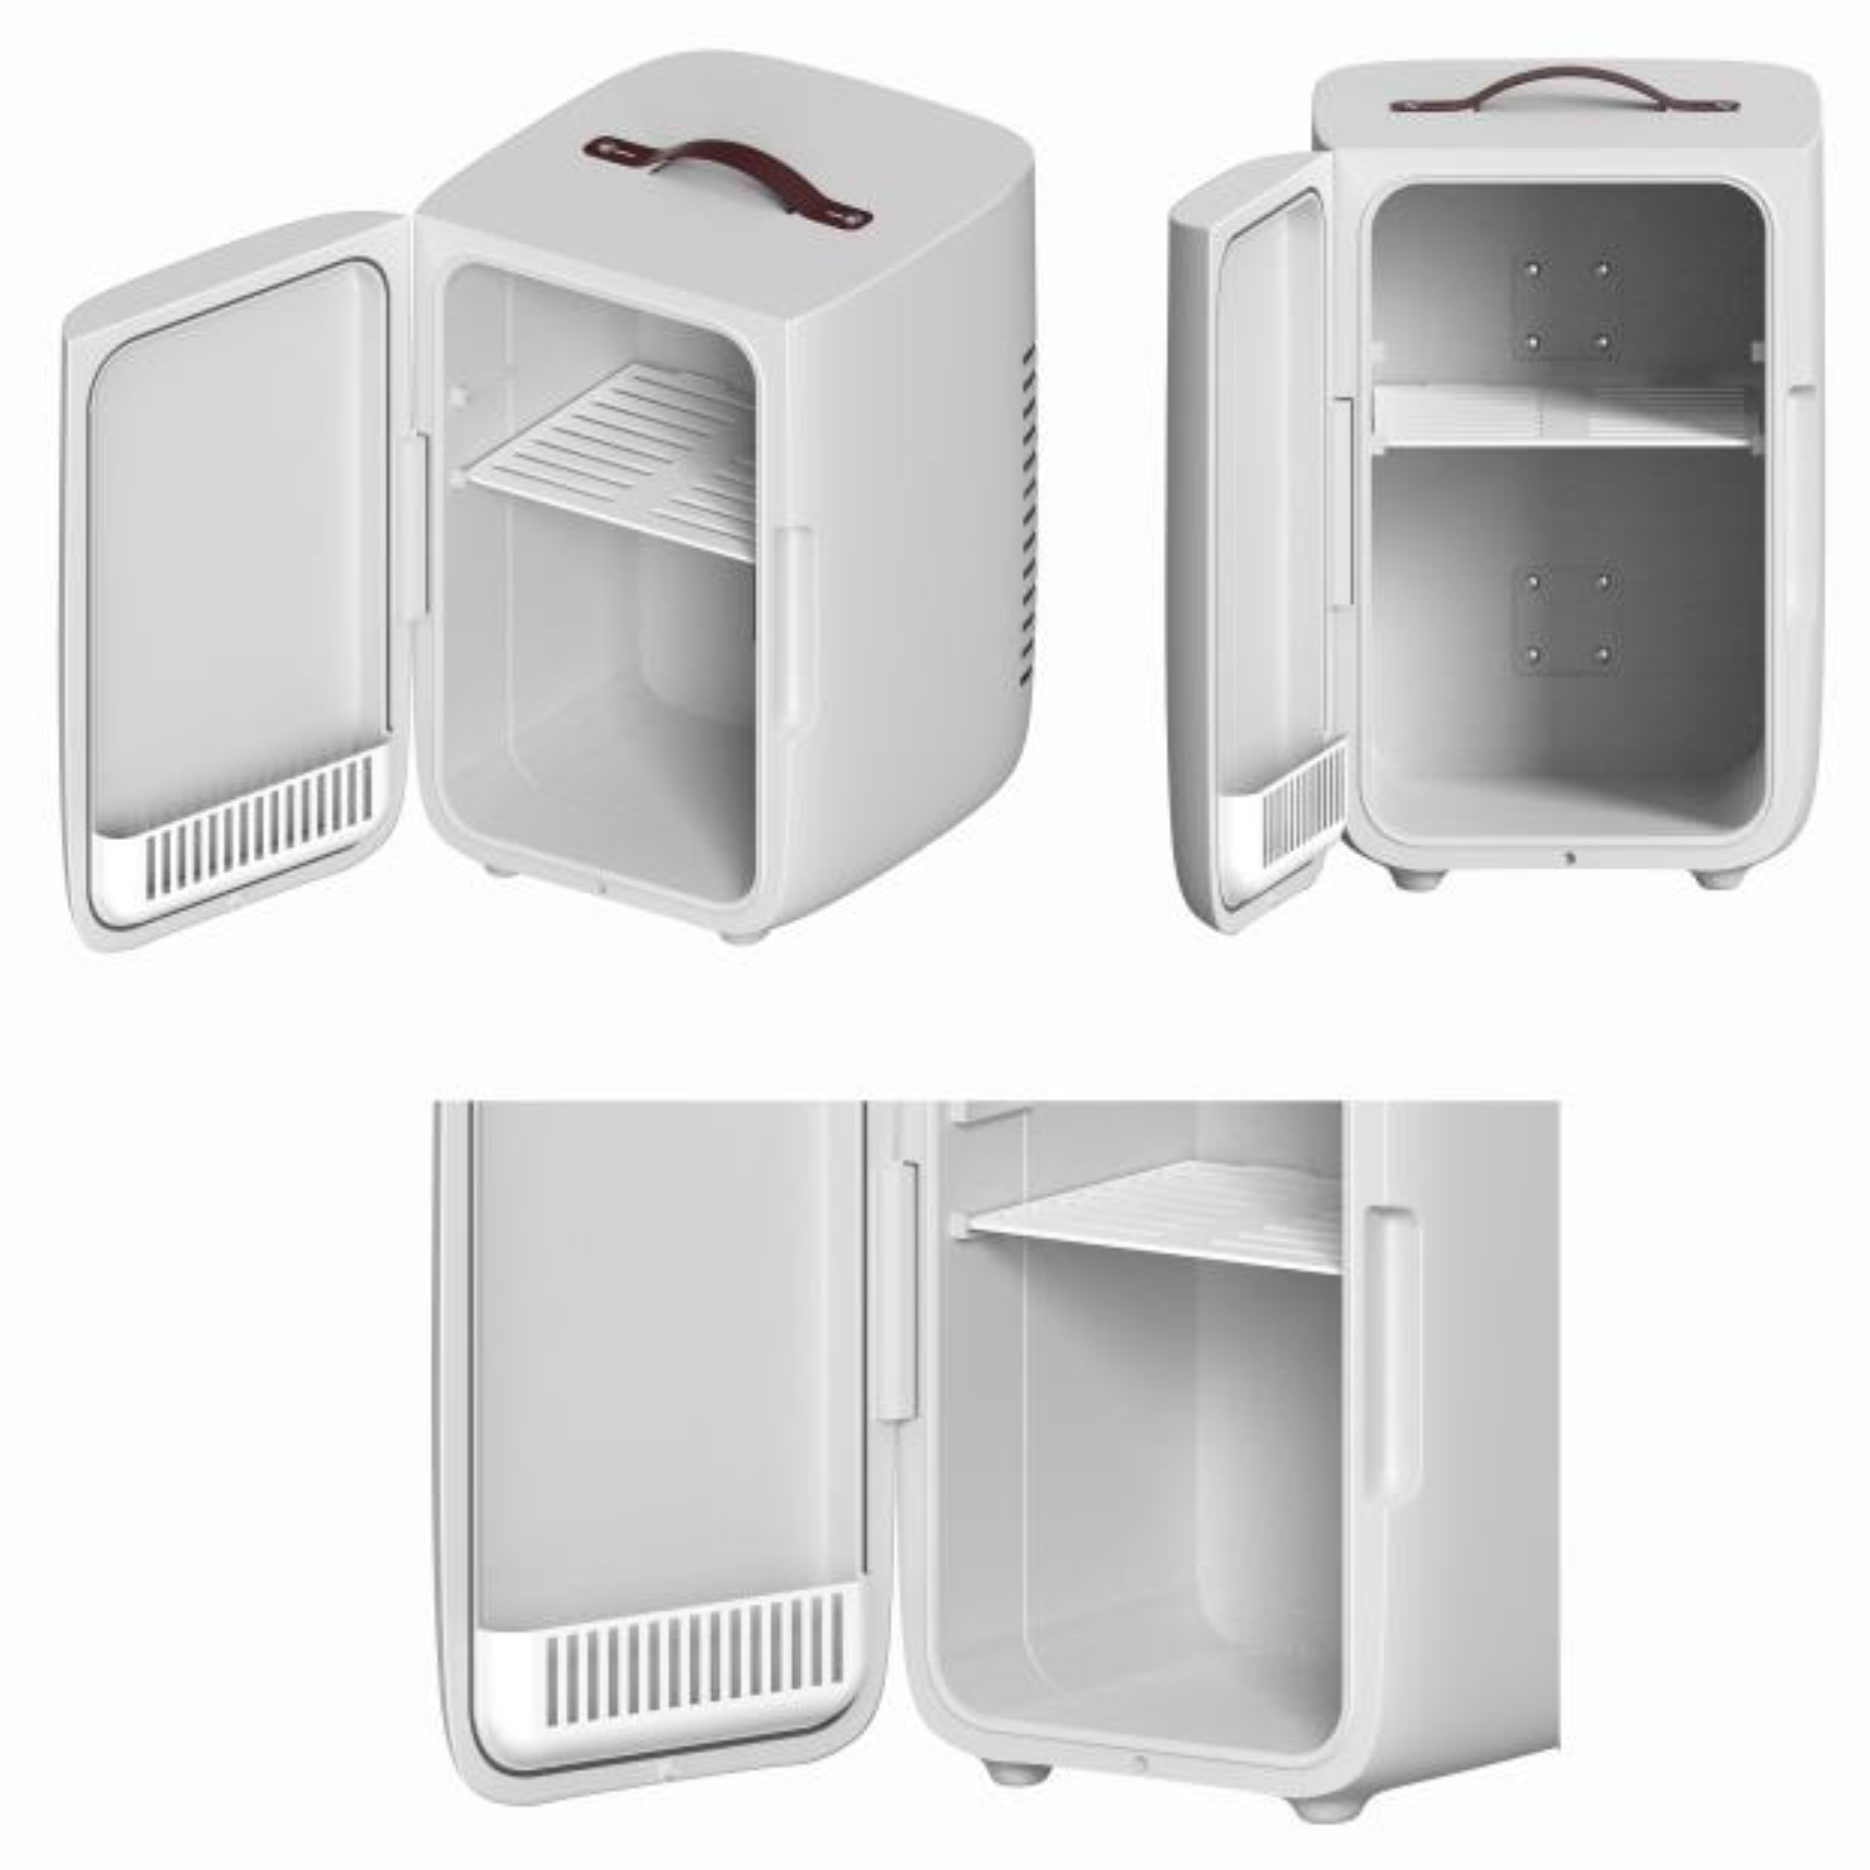
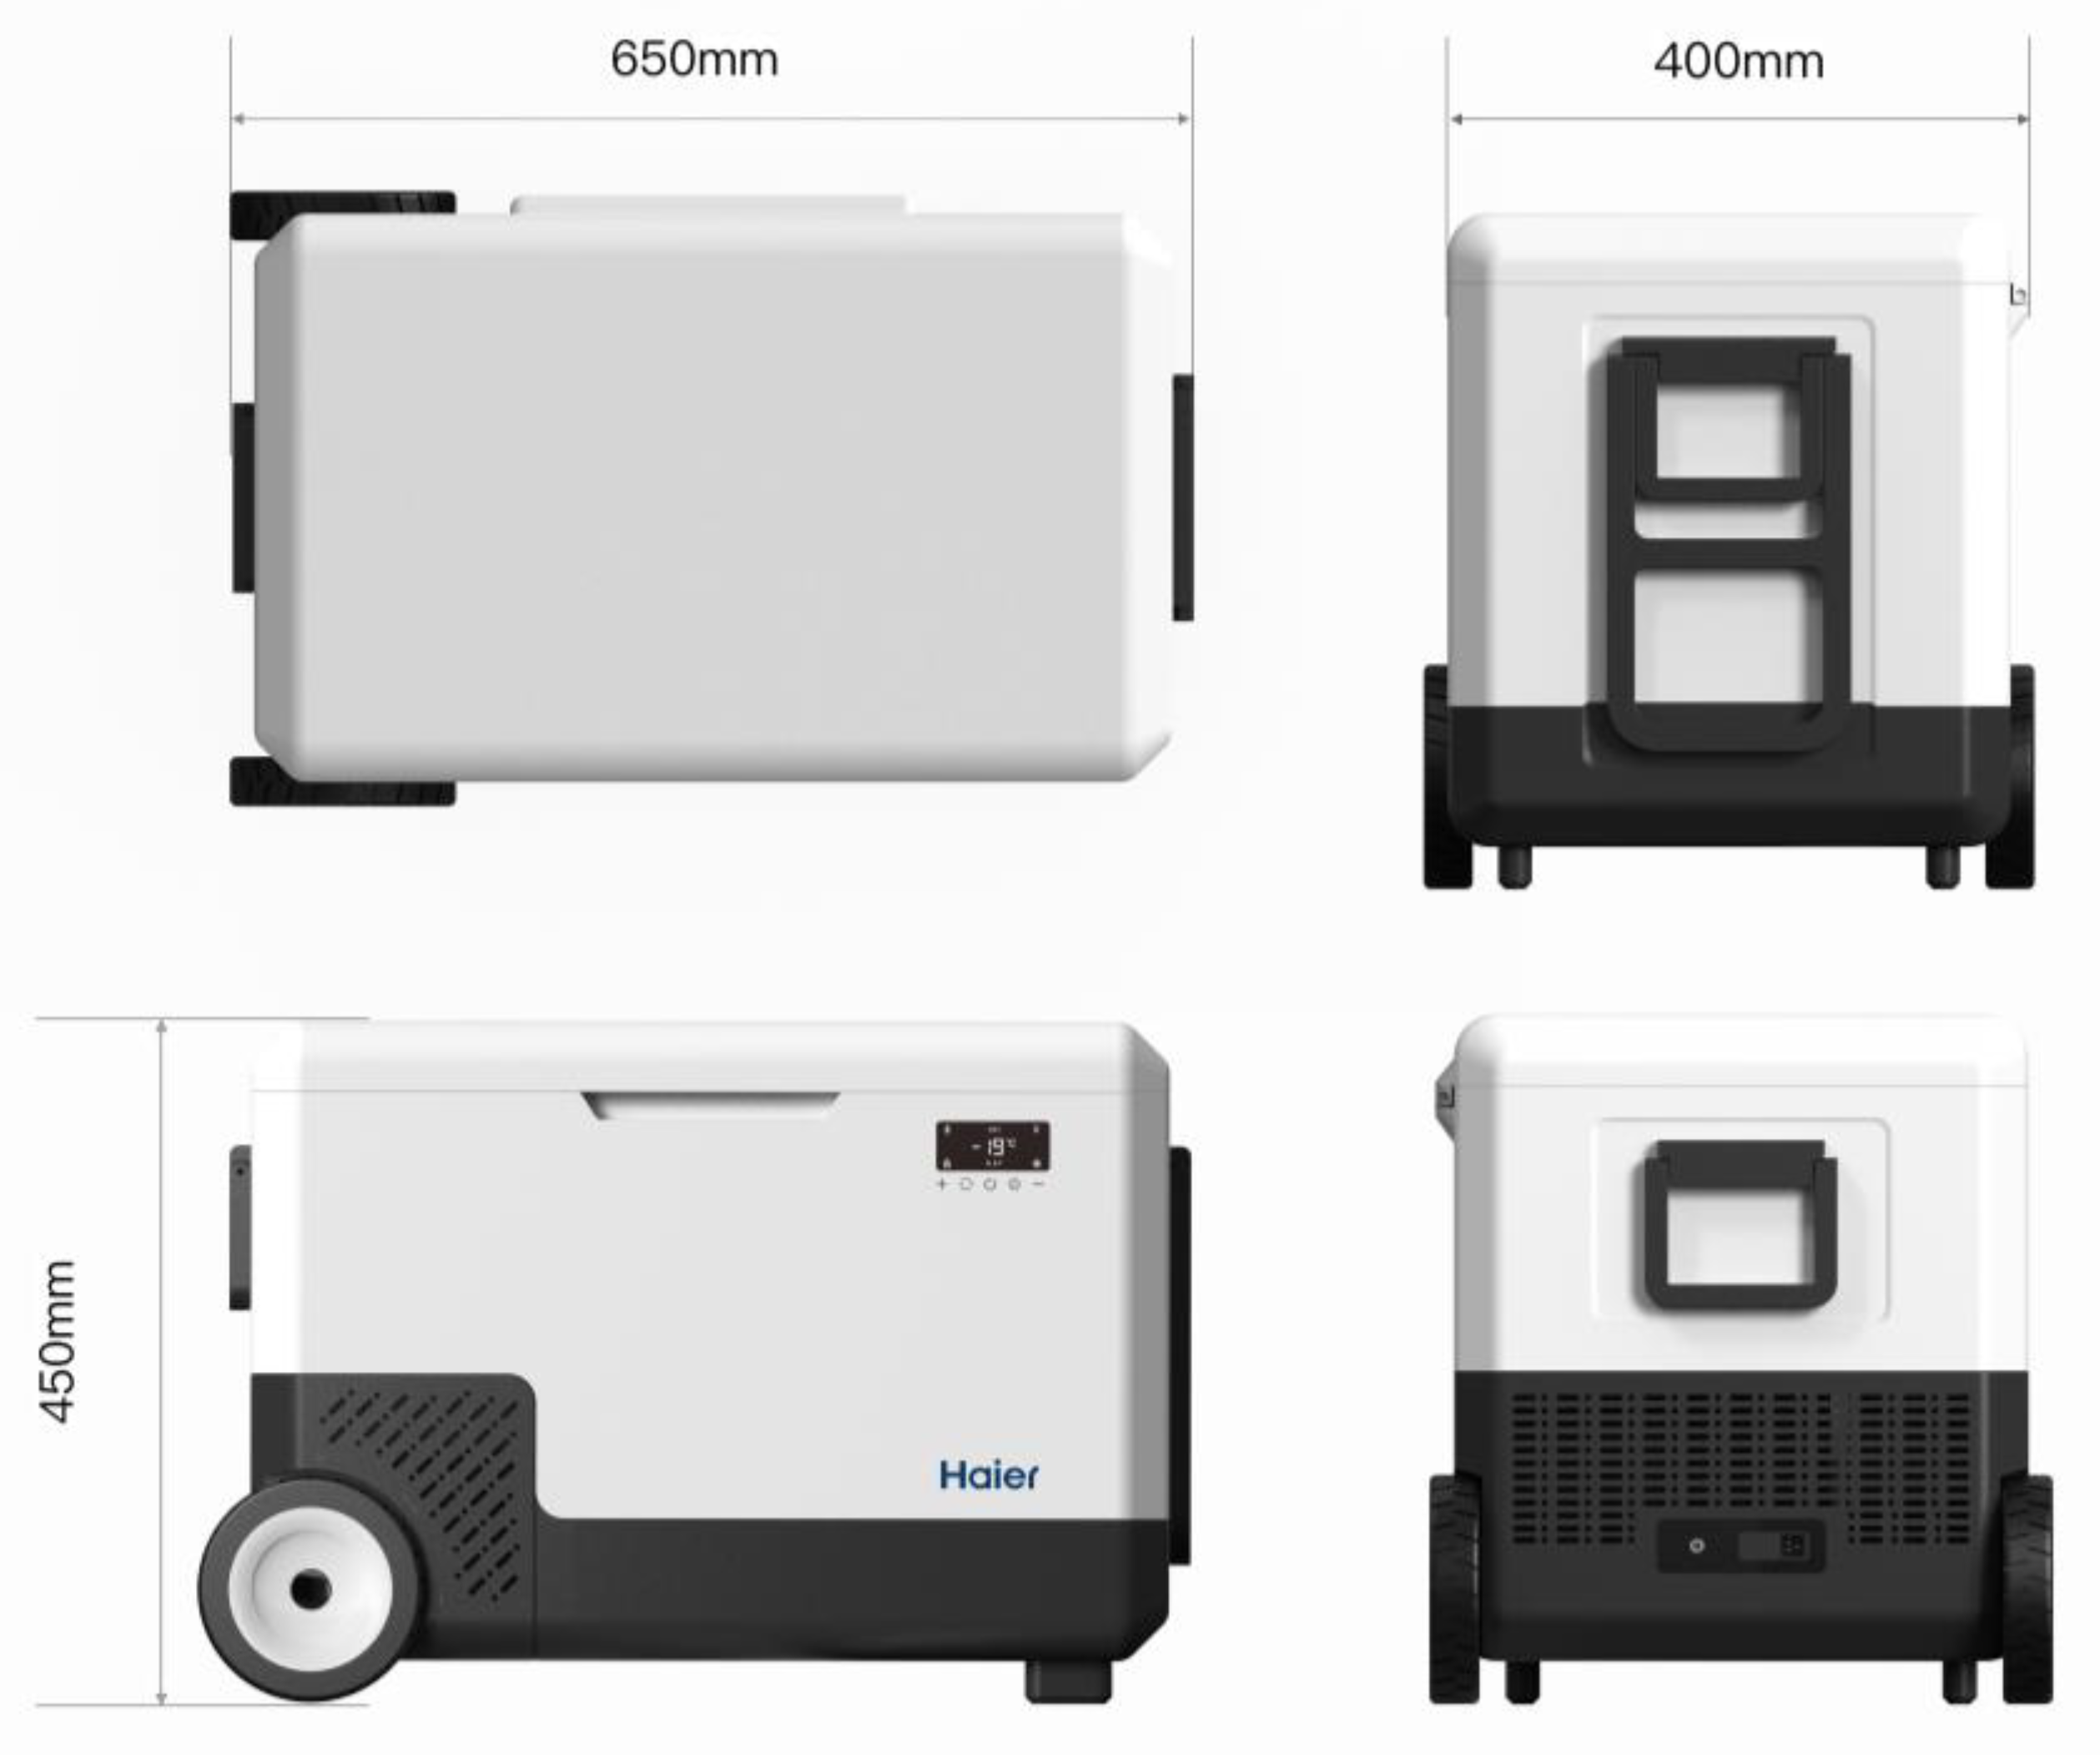
4.2.2. Design Implementation and Engineering Analysis
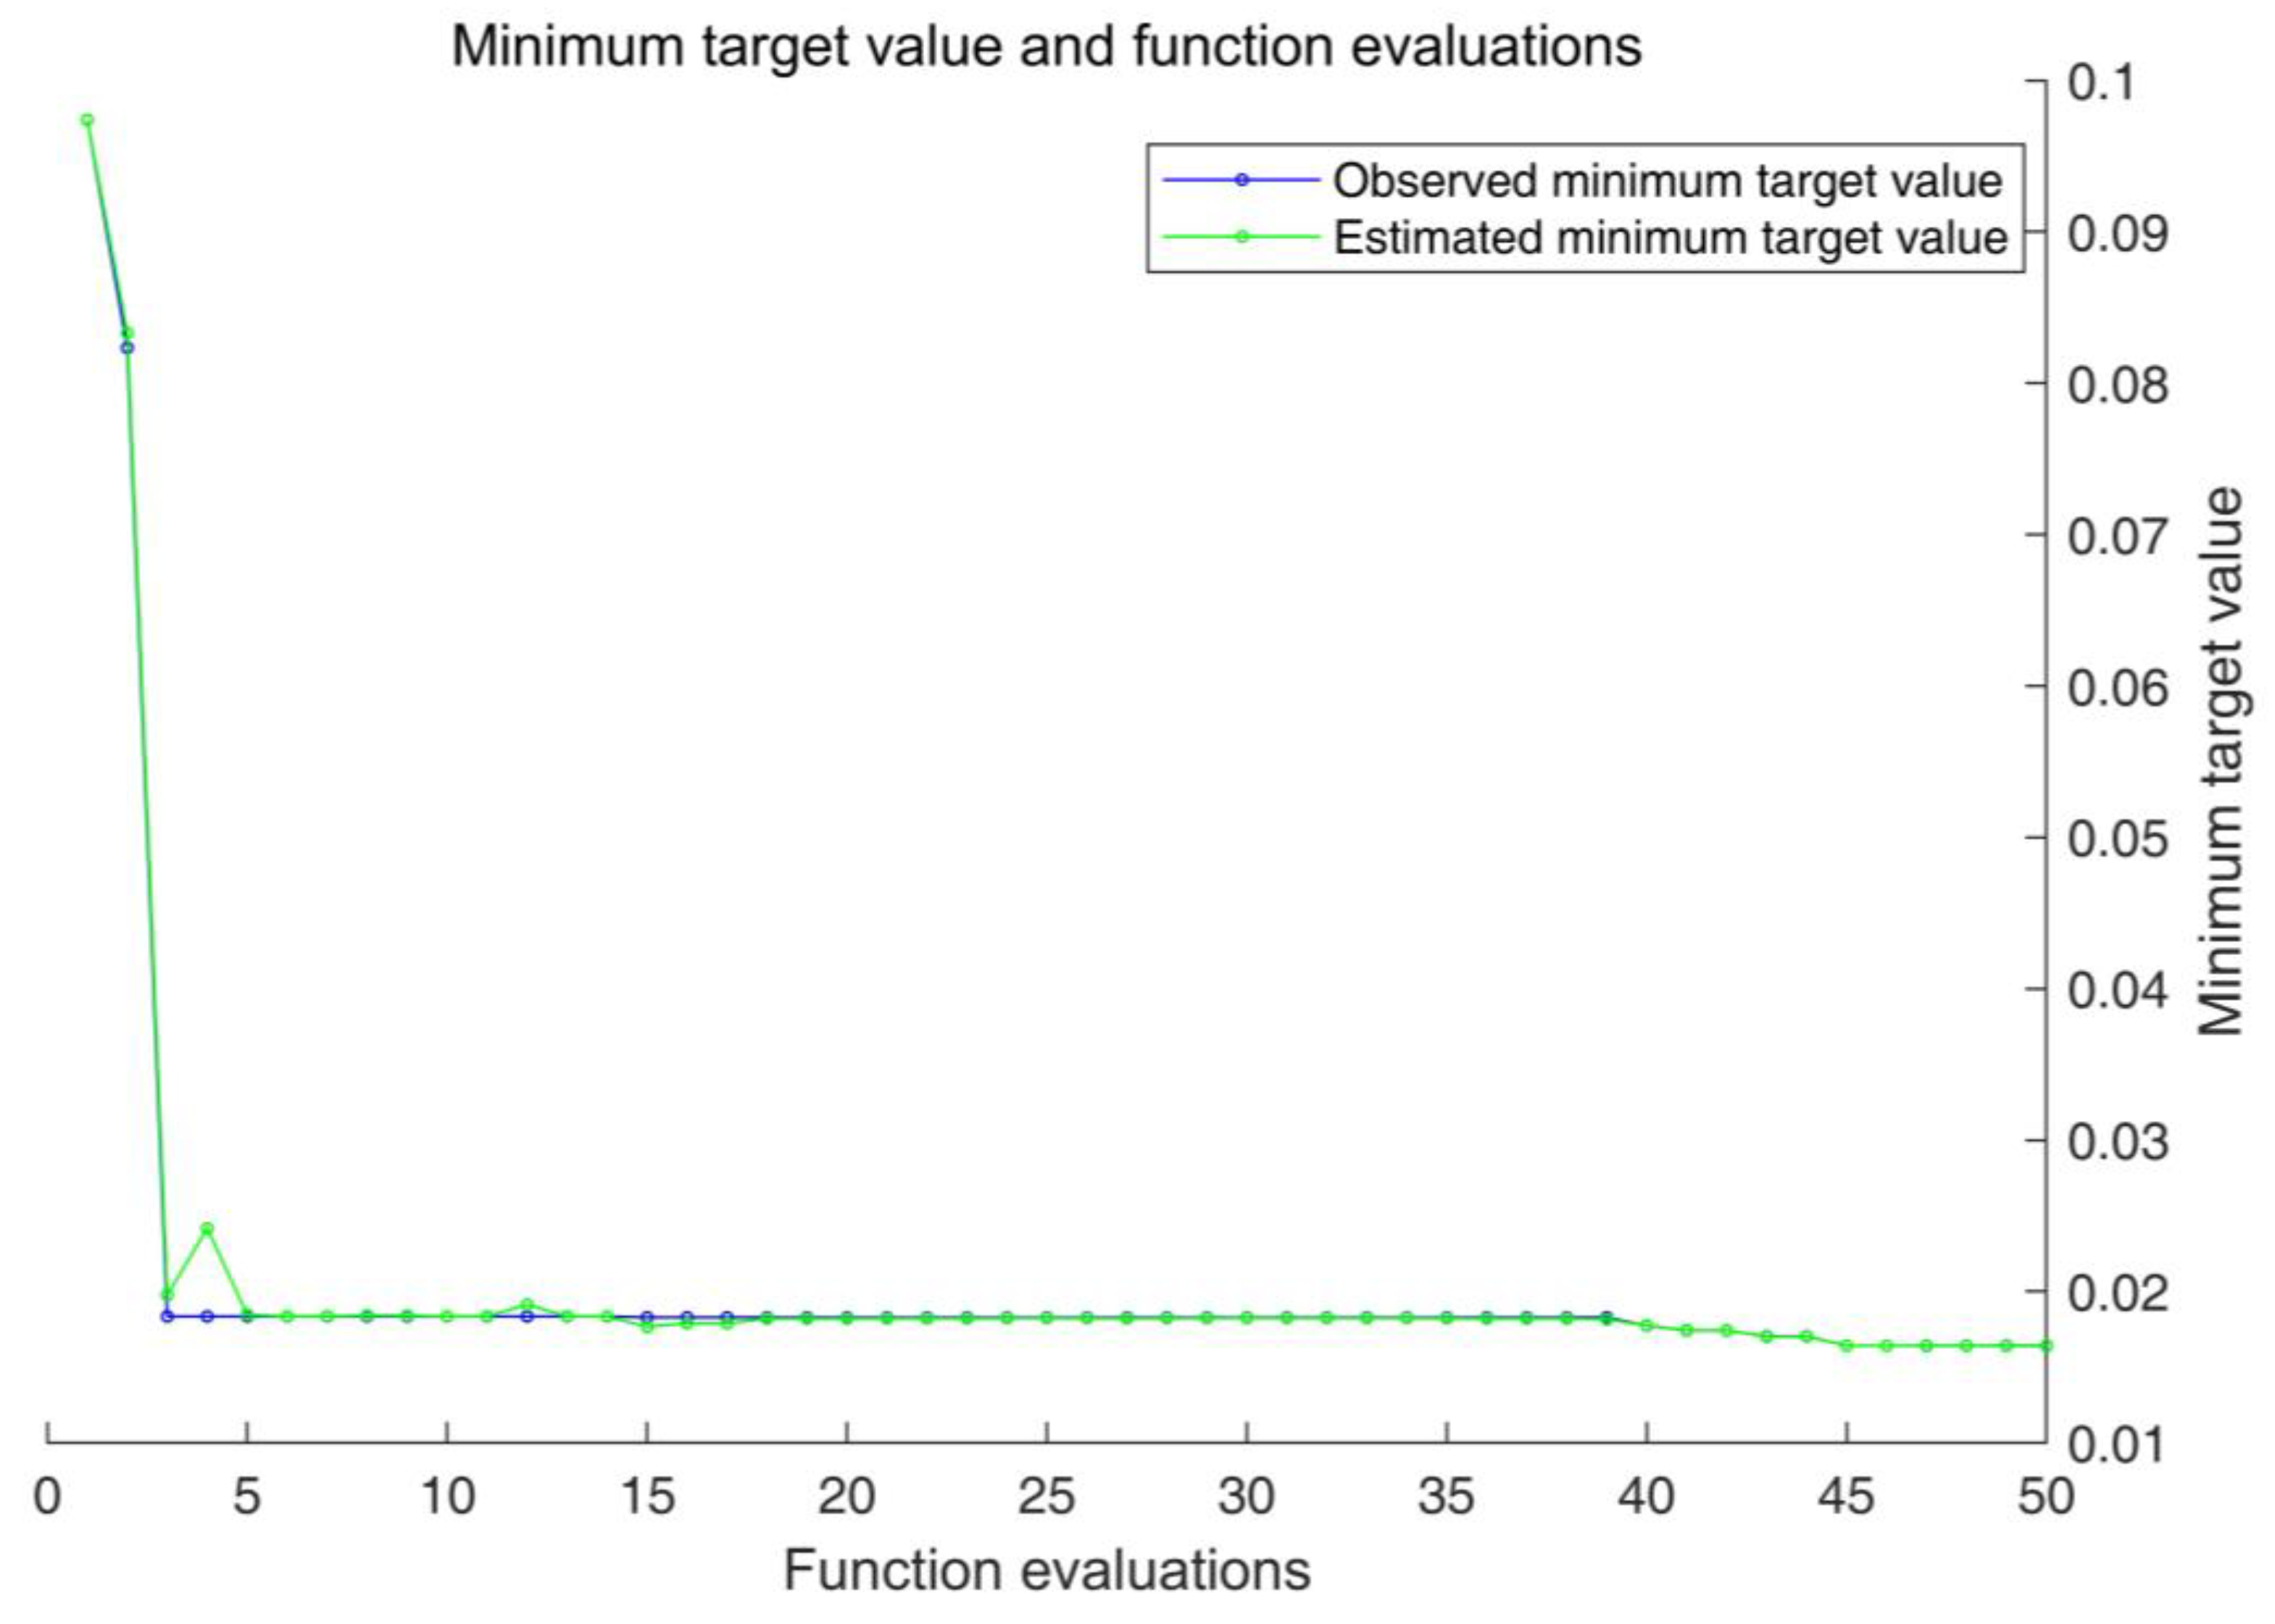
4.3. Establishment of a Sustainable Consumption Mapping Model
4.4. Comparative Experiments and Discussions
5. Limitations and Future Research Directions
6. Conclusions
Author Contributions
Funding
Data Availability Statement
Conflicts of Interest
References
- Anwar, R.S.; Ahmed, R.R.; Streimikiene, D.; Strielkowski, W.; Streimikis, J. Customer Engagement, Innovation, and Sustainable Consumption: Analyzing Personalized, Innovative, Sustainable Phygital Products. J. Innov. Knowl. 2025, 10, 100642. [Google Scholar] [CrossRef]
- Ceschin, F.; Gaziulusoy, I. Evolution of Design for Sustainability: From Product Design to Design for System Innovations and Transitions. Des. Stud. 2016, 47, 118–163. [Google Scholar] [CrossRef]
- Xiao, R.; Zhang, Y.; Liu, X.; Yuan, Z. A Life-Cycle Assessment of Household Refrigerators in China. J. Clean. Prod. 2015, 95, 301–310. [Google Scholar] [CrossRef]
- Kwilinski, A. Mapping Global Research on Green Energy and Green Investment: A Comprehensive Bibliometric Study. Energies 2024, 17, 1119. [Google Scholar] [CrossRef]
- Wang, S.; Sun, W.; Liu, J.; Nah, K.; Yan, W.; Tan, S. The Influence of AR on Purchase Intentions of Cultural Heritage Products: The TAM and Flow-Based Study. Appl. Sci. 2024, 14, 7169. [Google Scholar] [CrossRef]
- Đurić, I.; Medić, S.; Ecet, D.; Grgić, S.; Atanacković Jeličić, J. Enhancing Public Space Experiences: Evaluating Perception of Digital and Digitized Sculptures in Augmented Reality. Appl. Sci. 2025, 15, 870. [Google Scholar] [CrossRef]
- Basu, S. Personalized Product Recommendations and Firm Performance. Electron. Commer. Res. Appl. 2021, 48, 101074. [Google Scholar] [CrossRef]
- Sreen, N.; Mehrotra, A.; Alghafes, R.; Agarwal, V. Interplay between Minimalism, Moral Identity, and Ethically Minded Consumer Behavior in Retail Context: Cross-Cultural Investigation of Indian and American Consumers. J. Retail. Consum. Serv. 2025, 84, 104191. [Google Scholar] [CrossRef]
- Zheng, S.; Chen, J.; Liao, J.; Hu, H.-L. What Motivates Users’ Viewing and Purchasing Behavior Motivations in Live Streaming: A Stream-Streamer-Viewer Perspective. J. Retail. Consum. Serv. 2023, 72, 103240. [Google Scholar] [CrossRef]
- Wang, Z.; Chen, C.-H.; Li, X.; Zheng, P.; Khoo, L.P. A Context-Aware Concept Evaluation Approach Based on User Experiences for Smart Product-Service Systems Design Iteration. Adv. Eng. Inform. 2021, 50, 101394. [Google Scholar] [CrossRef]
- Shen, B.; Tan, W.; Guo, J.; Zhao, L.; Qin, P. How to Promote User Purchase in Metaverse? A Systematic Literature Review on Consumer Behavior Research and Virtual Commerce Application Design. Appl. Sci. 2021, 11, 11087. [Google Scholar] [CrossRef]
- Qin, Z.; Song, Y.; Tian, Y. The Impact of Product Design with Traditional Cultural Properties (TCPs) on Consumer Behavior Through Cultural Perceptions: Evidence from the Young Chinese Generation. Sustainability 2019, 11, 426. [Google Scholar] [CrossRef]
- Velaoras, K.; Menegaki, A.N.; Polyzos, S.; Gotzamani, K. The Role of Environmental Certification in the Hospitality Industry: Assessing Sustainability, Consumer Preferences, and the Economic Impact. Sustainability 2025, 17, 650. [Google Scholar] [CrossRef]
- Szaban, M.; Szymkowiak, A.; Zdziennicka, A. Unpacking Consumer Price Perceptions: The Role of Sustainability and Ethical Labels in the Cosmetics Market. J. Clean. Prod. 2025, 490, 144730. [Google Scholar] [CrossRef]
- Navidan, H.; Moshiri, P.F.; Nabati, M.; Shahbazian, R.; Ghorashi, S.A.; Shah-Mansouri, V.; Windridge, D. Generative Adversarial Networks (GANs) in Networking: A Comprehensive Survey & Evaluation. Comput. Netw. 2021, 194, 108149. [Google Scholar] [CrossRef]
- Zhang, Z.; Li, Y.; Zhou, W.; Chen, X.; Yao, W.; Zhao, Y. TONR: An Exploration for a Novel Way Combining Neural Network with Topology Optimization. Comput. Methods Appl. Mech. Eng. 2021, 386, 114083. [Google Scholar] [CrossRef]
- Wang, L.; Liu, Z. Data-Driven Product Design Evaluation Method Based on Multi-Stage Artificial Neural Network. Appl. Soft Comput. 2021, 103, 107117. [Google Scholar] [CrossRef]
- Zhu, Q.; Li, J.; Lin, X.; Lu, F.; Jang, J. A BP Neural Network Product Design Optimization Model Based on Emotional Design and Sustainable Product Design. Appl. Sci. 2024, 14, 6225. [Google Scholar] [CrossRef]
- Qian, C.; Ye, W. Accelerating Gradient-Based Topology Optimization Design with Dual-Model Artificial Neural Networks. Struct. Multidiscip. Optim. 2021, 63, 1687–1707. [Google Scholar] [CrossRef]
- Burnap, A.; Hauser, J.R.; Timoshenko, A. Product Aesthetic Design: A Machine Learning Augmentation. Mark. Sci. 2023, 42, 1029–1056. [Google Scholar] [CrossRef]
- Yoo, S.; Lee, S.; Kim, S.; Hwang, K.H.; Park, J.H.; Kang, N. Integrating Deep Learning into CAD/CAE System: Generative Design and Evaluation of 3D Conceptual Wheel. Struct. Multidiscip. Optim. 2021, 64, 2725–2747. [Google Scholar] [CrossRef]
- Ding, M.; Cheng, Y.; Zhang, J.; Du, G. Product Color Emotional Design Based on a Convolutional Neural Network and Search Neural Network. Color. Res. Appl. 2021, 46, 1332–1346. [Google Scholar] [CrossRef]
- Badawy, M.; Ramadan, N.; Hefny, H.A. Healthcare Predictive Analytics Using Machine Learning and Deep Learning Techniques: A Survey. J. Electr. Syst. Inf. Technol. 2023, 10, 40. [Google Scholar] [CrossRef]
- Falatouri, T.; Darbanian, F.; Brandtner, P.; Udokwu, C. Predictive Analytics for Demand Forecasting–A Comparison of SARIMA and LSTM in Retail SCM. Procedia Comput. Sci. 2022, 200, 993–1003. [Google Scholar] [CrossRef]
- Aljohani, A. Predictive Analytics and Machine Learning for Real-Time Supply Chain Risk Mitigation and Agility. Sustainability 2023, 15, 15088. [Google Scholar] [CrossRef]
- Chen, Y.-T.; Sun, E.W.; Chang, M.-F.; Lin, Y.-B. Pragmatic Real-Time Logistics Management with Traffic IoT Infrastructure: Big Data Predictive Analytics of Freight Travel Time for Logistics 4.0. Int. J. Prod. Econ. 2021, 238, 108157. [Google Scholar] [CrossRef]
- Dawood, T.; Elwakil, E.; Novoa, H.M.; Gárate Delgado, J.F. Toward Urban Sustainability and Clean Potable Water: Prediction of Water Quality via Artificial Neural Networks. J. Clean. Prod. 2021, 291, 125266. [Google Scholar] [CrossRef]
- Zhang, L.; Huang, Z.; Liu, W.; Guo, Z.; Zhang, Z. Weather Radar Echo Prediction Method Based on Convolution Neural Network and Long Short-Term Memory Networks for Sustainable e-Agriculture. J. Clean. Prod. 2021, 298, 126776. [Google Scholar] [CrossRef]
- Rombach, R.; Blattmann, A.; Lorenz, D.; Esser, P.; Ommer, B. High-Resolution Image Synthesis with Latent Diffusion Models. In Proceedings of the IEEE/CVF Conference on Computer Vision and Pattern Recognition (CVPR) CoRR, Nashville, TN, USA, 20–25 June 2021. [Google Scholar]
- Yang, W.; Zhao, Y. Artistic Intelligence: A Diffusion-Based Framework for High-Fidelity Landscape Painting Synthesis. IEEE Access 2024, 13, 26037–26049. [Google Scholar] [CrossRef]
- Adeoye-Olatunde, O.A.; Olenik, N.L. Research and Scholarly Methods: Semi-Structured Interviews. JACCP J. Am. Coll. Clin. Pharm. 2021, 4, 1358–1367. [Google Scholar] [CrossRef]
- Mukurunge, E.; Nyoni, C.N.; Hugo, L. Context of Assessment in Competency-Based Nursing Education: Semi-Structured Interviews in Nursing Education Institutions in a Low-Income Country. Nurse Educ. Today 2025, 146, 106529. [Google Scholar] [CrossRef] [PubMed]
- Yang, Y.N.; Kumaraswamy Mohan, M.; Pam, H.J.; Mahesh, G. Integrated Qualitative and Quantitative Methodology to Assess Validity and Credibility of Models for Bridge Maintenance Management System Development. J. Manag. Eng. 2011, 27, 149–158. [Google Scholar] [CrossRef]
- Galvin, R. How Many Interviews Are Enough? Do Qualitative Interviews in Building Energy Consumption Research Produce Reliable Knowledge? J. Build. Eng. 2015, 1, 2–12. [Google Scholar] [CrossRef]
- Stanca, L.; Dabija, D.-C.; Câmpian, V. Qualitative Analysis of Customer Behavior in the Retail Industry during the COVID-19 Pandemic: A Word-Cloud and Sentiment Analysis Approach. J. Retail. Consum. Serv. 2023, 75, 103543. [Google Scholar] [CrossRef]
- Taye, M.M. Understanding of Machine Learning with Deep Learning: Architectures, Workflow, Applications and Future Directions. Computers 2023, 12, 91. [Google Scholar] [CrossRef]
- Zhang, L.; Rao, A.; Agrawala, M. Adding Conditional Control to Text-to-Image Diffusion Models. arXiv 2023, arXiv:2302.05543. [Google Scholar] [CrossRef]
- Chen, P. Effects of the Entropy Weight on TOPSIS. Expert. Syst. Appl. 2021, 168, 114186. [Google Scholar] [CrossRef]
- Balali, A.; Valipour, A.; Edwards, R.; Moehler, R. Ranking Effective Risks on Human Resources Threats in Natural Gas Supply Projects Using ANP-COPRAS Method: Case Study of Shiraz. Reliab. Eng. Syst. Saf. 2021, 208, 107442. [Google Scholar] [CrossRef]
- Surucu, O.; Gadsden, S.A.; Yawney, J. Condition Monitoring Using Machine Learning: A Review of Theory, Applications, and Recent Advances. Expert. Syst. Appl. 2023, 221, 119738. [Google Scholar] [CrossRef]
- Cox, J.; Griffith, S.; Giorgi, S.; King, G. Consumer Understanding of Product Lifetimes. Resour. Conserv. Recycl. 2013, 79, 21–29. [Google Scholar] [CrossRef]
- Victor, V.; Joy Thoppan, J.; Jeyakumar Nathan, R.; Farkas Maria, F. Factors Influencing Consumer Behavior and Prospective Purchase Decisions in a Dynamic Pricing Environment—An Exploratory Factor Analysis Approach. Soc. Sci. 2018, 7, 153. [Google Scholar] [CrossRef]
- Bogusz, M.; Matysik-Pejas, R.; Krasnodębski, A.; Dziekański, P. The Concept of Zero Waste in the Context of Supporting Environmental Protection by Consumers. Energies 2021, 14, 5964. [Google Scholar] [CrossRef]
- Huang, Y.-C.; Tung, Y.-S.; Chen, J.-C.; Wang, S.-W.; Wu, J.-L. An Adaptive Edge Detection Based Colorization Algorithm and Its Applications. In Proceedings of the 13th Annual ACM International Conference on Multimedia, Singapore, 6–11 November 2005; Association for Computing Machinery: New York, NY, USA, 2005; pp. 351–354. [Google Scholar]


| Scheme | Indicator 1 | Indicator 2 | Indicator 3 | |||
|---|---|---|---|---|---|---|
| CV | SV | CV | SV | CV | SV | |
| S1 | 6 | 0.6 | 3.5 | 0.2 | 4 | 0.667 |
| S2 | 6 | 0.6 | 5.5 | 0.533 | 5.25 | 0.429 |
| S3 | 7.25 | 0.78 | 6 | 0.6 | 5.25 | 0.429 |
| S4 | 5.5 | 0.52 | 4.25 | 0.333 | 5 | 0.476 |
| S5 | 4.75 | 0.413 | 2.25 | 0 | 6.25 | 0.238 |
| S6 | 7.5 | 0.827 | 7.25 | 0.8 | 2.5 | 0.952 |
| S7 | 6.5 | 0.68 | 7.25 | 0.8 | 3.25 | 0.857 |
| S8 | 7.25 | 0.78 | 7.75 | 0.867 | 2.5 | 0.952 |
| S9 | 7.75 | 0.853 | 7.25 | 0.8 | 4.25 | 0.667 |
| S10 | 4.25 | 0.347 | 3 | 0.12 | 6.75 | 0.143 |
| S11 | 8.75 | 1 | 6.5 | 0.68 | 3.5 | 0.762 |
| S12 | 3.75 | 0.267 | 4 | 0.28 | 6.75 | 0.143 |
| S13 | 2 | 0 | 3 | 0.12 | 7.5 | 0 |
| S14 | 5.5 | 0.52 | 6 | 0.6 | 4.25 | 0.619 |
| S15 | 5.25 | 0.493 | 6 | 0.6 | 3.5 | 0.762 |
| S16 | 8.25 | 0.933 | 6 | 0.6 | 3.75 | 0.714 |
| S17 | 5.5 | 0.52 | 4.75 | 0.4 | 7 | 0.095 |
| S18 | 8.5 | 0.96 | 6.75 | 0.72 | 3.75 | 0.714 |
| S19 | 6.5 | 0.68 | 5 | 0.44 | 4 | 0.667 |
| S20 | 3.25 | 0.2 | 4 | 0.28 | 4.75 | 0.524 |
| S21 | 5.5 | 0.52 | 5.5 | 0.52 | 5.25 | 0.429 |
| S22 | 7.75 | 0.853 | 8.5 | 1 | 4.25 | 0.619 |
| S23 | 7 | 0.747 | 7 | 0.76 | 4 | 0.667 |
| S24 | 6.25 | 0.627 | 7.5 | 0.84 | 4.75 | 0.524 |
| S25 | 4 | 0.32 | 5.25 | 0.48 | 5.25 | 0.429 |
| S26 | 7 | 0.747 | 7.25 | 0.8 | 5.25 | 0.429 |
| S27 | 5.75 | 0.573 | 5.25 | 0.48 | 5.25 | 0.429 |
| S28 | 6.25 | 0.627 | 7 | 0.76 | 4.25 | 0.619 |
| S29 | 6.75 | 0.707 | 7.25 | 0.8 | 2.25 | 1 |
| S30 | 4 | 0.32 | 4.5 | 0.36 | 7.25 | 0.048 |
| S31 | 6 | 0.6 | 4.75 | 0.4 | 4.5 | 0.571 |
| S32 | 3.75 | 0.267 | 3.5 | 0.2 | 7.5 | 0 |
| Rank | Scheme | Benefit Value | Cost Value | Utility Value |
|---|---|---|---|---|
| 1 | S16 | 0.596 | 0.168 | 1.145 |
| 2 | S22 | 0.858 | 0.145 | 1.132 |
| 3 | S8 | 0.633 | 0.224 | 1.128 |
| 4 | S29 | 0.579 | 0.235 | 1.123 |
| 5 | S11 | 0.633 | 0.179 | 1.117 |
| 6 | S6 | 0.621 | 0.224 | 1.109 |
| 7 | S18 | 0.635 | 0.168 | 1.103 |
| 8 | S7 | 0.569 | 0.201 | 1.096 |
| 9 | S23 | 0.577 | 0.157 | 1.088 |
| 10 | S28 | 0.535 | 0.145 | 1.081 |
| 11 | S14 | 0.431 | 0.145 | 1.074 |
| 12 | S3 | 0.523 | 0.101 | 1.067 |
| 13 | S24 | 0.568 | 0.123 | 1.059 |
| 14 | S19 | 0.421 | 0.157 | 1.052 |
| 15 | S2 | 0.431 | 0.101 | 1.045 |
| 16 | S9 | 0.63 | 0.157 | 1.037 |
| 17 | S31 | 0.376 | 0.134 | 1.03 |
| 18 | S21 | 0.398 | 0.101 | 1.023 |
| 19 | S4 | 0.321 | 0.112 | 1.016 |
| 20 | S15 | 0.422 | 0.179 | 1.009 |
| 21 | S25 | 0.311 | 0.101 | 1.002 |
| 22 | S26 | 0.593 | 0.101 | 0.995 |
| 23 | S27 | 0.4 | 0.101 | 0.988 |
| 24 | S5 | 0.145 | 0.056 | 0.981 |
| 25 | S17 | 0.348 | 0.022 | 0.974 |
| 26 | S1 | 0.294 | 0.157 | 0.967 |
| 27 | S10 | 0.172 | 0.034 | 0.96 |
| 28 | S20 | 0.186 | 0.123 | 0.953 |
| 29 | S30 | 0.262 | 0.011 | 0.946 |
| 30 | S12 | 0.21 | 0.034 | 0.939 |
| 31 | S32 | 0.177 | 0 | 0.932 |
| 32 | S13 | 0.05 | 0 | 0.925 |
Disclaimer/Publisher’s Note: The statements, opinions and data contained in all publications are solely those of the individual author(s) and contributor(s) and not of MDPI and/or the editor(s). MDPI and/or the editor(s) disclaim responsibility for any injury to people or property resulting from any ideas, methods, instructions or products referred to in the content. |
© 2025 by the authors. Licensee MDPI, Basel, Switzerland. This article is an open access article distributed under the terms and conditions of the Creative Commons Attribution (CC BY) license (https://creativecommons.org/licenses/by/4.0/).
Share and Cite
Chen, Y.; Liu, H.; Zhang, J.; Wu, J. A Data-Driven Methodology for Industrial Design Optimization and Consumer Preference Modeling: An Application of Computer-Aided Design in Sustainable Refrigerator Design Research. Symmetry 2025, 17, 621. https://doi.org/10.3390/sym17040621
Chen Y, Liu H, Zhang J, Wu J. A Data-Driven Methodology for Industrial Design Optimization and Consumer Preference Modeling: An Application of Computer-Aided Design in Sustainable Refrigerator Design Research. Symmetry. 2025; 17(4):621. https://doi.org/10.3390/sym17040621
Chicago/Turabian StyleChen, Yu, Haotian Liu, Jianwei Zhang, and Jiang Wu. 2025. "A Data-Driven Methodology for Industrial Design Optimization and Consumer Preference Modeling: An Application of Computer-Aided Design in Sustainable Refrigerator Design Research" Symmetry 17, no. 4: 621. https://doi.org/10.3390/sym17040621
APA StyleChen, Y., Liu, H., Zhang, J., & Wu, J. (2025). A Data-Driven Methodology for Industrial Design Optimization and Consumer Preference Modeling: An Application of Computer-Aided Design in Sustainable Refrigerator Design Research. Symmetry, 17(4), 621. https://doi.org/10.3390/sym17040621