Abstract
The Paraíba is an Au-Cu-Mo deposit located in the southern part of the Amazon Craton, in the Alta Floresta Mineral Province, Mato Grosso State, Brazil. It is composed of Au-Cu-bearing quartz veins and Cu-Mo-rich hydrothermal breccias and stockworks, both associated with several hydrothermal alteration zones. The integration of spectral (reflectance and imaging spectroscopy) and conventional techniques (core logging, petrography, mineral chemistry, and scanning electron microscopy) was applied to map alteration zones, identify mineral parageneses, and determine the evolution of the deposit to generate a solid proxy for mineralized zones. This study shows an overlapping of two different mineralization systems in the AFMP, referenced hereafter as alteration Groups 1 and 2. Group 1 is an Orogenic Gold system related to Au-Cu-rich quartz veins in phyllonites and mylonites. Group 2 is a Cu-Mo Porphyry system related to a syenogranite intrusion and the subsequent generation of several hydrothermal alteration zones, Cu and Mo hydrothermal breccias, and stockwork mineralization. This study reveals several alteration footprints, guides, and vectors for the mineral exploration of these deposits in the Alta Floresta Mineral Province.
1. Introduction
The central-southern Amazon Craton hosts two important gold districts called the Alta Floresta Mineral Province (AFMP) and the Tapajós Mineral Province (Figure 1). The AFMP represents one of the provinces with paramount potential for gold and copper production in Brazil. Between the 1980s and 1990s, gold production was approximately 160 t of gold, mainly from small-scale and artisanal mining [1]. In 2017, a major company pre-announced a significant copper resource, which enormously increased the exploration projects in the region [2].
In the AFMP, three main types of deposits have been described: a shear zone-hosted Au ± Cu vein-type [3,4,5,6], also called an orogenic gold deposit [1,7,8,9,10]; a Au ± Cu porphyry [1,11,12,13]; and a Au + Zn + Pb ± Ag ± Cu epithermal vein-type [12,14,15,16]. However, the complexity of some of these Paleoproterozoic mineralization types suggests an overlap of hydrothermal events in the AFMP and results in different interpretations for the same deposit, which is the case of the Paraíba deposit [3,4,12]. This complexity halts the definition of both genetic and exploratory models in the province.
The Paraíba is an archetype Au-quartz vein deposit within the AFMP, which was discovered in the 1970s. It shows a history of exploration and is one of the few in the province to provide resource-reserve data. In the 1990s, mining evolved from artisanal to mine concession. It was initially exploited as an open pit and later for underground mining [4]. A new underground mine concession started at the end of 2021. The current Au reserves are around 650,000 Oz. Despite the many studies developed regarding the Paraíba deposit, including structural geology [3,4], hydrothermal alteration, and fluid inclusion analyses [12], its complex hydrothermal alteration has not been fully portrayed, partially because of the existence of fine-grained hydrothermal alteration minerals and overlapping halos, which are difficult to detect.
Reflectance spectroscopy represents a rapid, effective, and non-destructive technique for the characterization of such alteration minerals e.g., [17,18,19,20,21]. Minerals exhibit diagnostic absorption features in the wavelength ranging from 400 to 2500 nm in response to electronic and vibrational processes [22,23]. Alteration minerals, such as white mica, chlorite, and epidote, are characteristic of several hydrothermal systems and commonly present compositional variations in the distance to the system [24,25,26,27]. The spectral signature of alteration minerals is increasingly used as a vector to find, measure, and map alteration zones. The quantitative information yielded from spectral techniques allows for the determination of the relative abundance and physical-chemical properties of minerals, such as their composition and degree of structural ordering [28]. Therefore, it indirectly provides information about hydrothermal fluids, temperature, and mineral composition [29]. On a detailed scale, the hyperspectral images with high spatial resolution obtained from borehole samples are helpful for verifying the spatial and temporal relationships of alteration zones e.g., [30,31].
Prospecting complex Paleoproterozoic gold deposits in the AFMP is challenging. The recent discovery of considerable Cu content related to hydrothermal breccia (with a different mineralization style than Au-quartz veins) indicates a new perspective for mineral exploration and demands a better understanding of the genesis of these deposits and the relationship between Au-Cu-rich breccias and Au-quartz veins.
Herein, we provide new insights into the evolutionary hydrothermal history of the Paraíba deposit and suggest possible footprints and vectors for assisting the mineral exploration of Au-Cu-Mo deposits in the AFMP. To achieve this objective, we apply and evaluate the integration of spectral and conventional methods (petrography and mineral chemistry).

Figure 1.
Regional and local geology. (a) Geochronological provinces of the Amazonian craton, with the Tapajós and Alta Floresta Mineral Provinces highlighted in red (modified from [32]); (b) eastern sector of the Alta Floresta Mineral Province (AFMP) (modified from [33,34]); (c) local geology of the Paraíba deposit with the main lithotypes (modified from [35]). Geochronological ages from: 1—[12], 2—[1], 3—[15], 4—[36], and 5—[35].

2. Geological Framework
This research focuses on the eastern sector of the AFMP, in the southern portion of the Amazonian Craton. The craton represents an Archean–Paleoproterozoic crustal segment arranged in tectonic provinces with an NW–SE orientation [37,38] (Figure 1a).
The AFMP is elongated in an NW-trending direction and comprises rocks of the 2.05–1.95 Ga Cuiú-Cuiú magmatic arc (Peixoto de Azevedo Domain of the Tapajós-Parima Province), which is surrounded and superimposed by the 1.81–1.75 Ga Juruena magmatic arc (Rondonia-Juruena Province) (Figure 1a,b). The Cuiú-Cuiú arc is composed of gneiss and metagranitoids of the Cuiú-Cuiú Complex (ca. 2.05–1.98 Ga; [16,35,39]) and is cut by the granitic stocks of the Pé Quente Suite (ca. 2.0–1.97 Ga) [12,13,14,40,41] and the Nhandu Suite (1.97–1.95 Ga) [1,41,42]. The post-orogenic felsic magmatism comprises the Guarantã do Norte (ca. 1.9–1.89 Ga, [15]) and Matupá suites (1.89–1.5 Ga; [39,43,44]).
The Juruena magmatic arc (1.81 to 1.75 Ga) is composed of metamorphic complexes (Nova Monte Verde, Bacaeri-Mogno, and Juruena); the Juruena Granitic Supersuite; the Colíder Group; and the Teles Pires Intrusive Suite [9,13,45,46,47,48,49]. Younger sedimentary sequences cover all units (ca. 1.44 Ga-Cenozoic; [13]).
2.1. Eastern Sector Geology of the AFMP
The AFMP eastern sector comprises the 2.05-1.95 Ga Cuiú-Cuiú complex (Peixoto de Azevedo domain), which is surrounded by the 1.81–1.75 Ga Rondonia-Juruena province (Figure 1b,c) [39].
The main rocks of the Cuiú-Cuiú complex are ca. 2.96 Ga orthogneiss and amphibolite, and ca. 1.98–2.05 Ga foliated (Sn) granitoids such as the Paraíba biotite tonalite, the Naiuram granodiorite, and hornblende quartz-diorite [1,12,35] (Figure 1c). The main type of foliation (Sn) is defined by gneiss banding and a spaced foliation [35,39]. These rocks possess medium to high potassium calc-alkaline content, meta- to peraluminous content, and are magnesian-rich [16,35,39].
A WNW-trending shear zone system affects the Peixoto de Azevedo Domain rocks [10,35,39,40]. The system comprises first-order transpressional to strike-slip shear zones, mostly with dextral movements [35,39,50]. The rocks developed a Sn+1 foliation, which transposed the previous foliation [4]. Significant Au ± Cu vein-type deposits occur in second-order, subsidiary shear zones, as the Paraíba deposit [1,4,12].
Younger Paleoproterozoic granitoid suites, with no deformation, cut and overprint the remnant units [1,35,51], including the Matupá biotite monzogranite (1869 ± 10 Ma U-Pb zircon; [36]) and the Peixoto biotite granodiorite (1781 ± 9 Ma U-Pb zircon; [36]) (Figure 1c). These younger granitoids belong to the high potassium calc-alkaline magmatic series, which is metaluminous to slightly peraluminous, typical of post-collisional volcanic arc environments [39]. Alkaline felsic magmatism is the last magmatic event in the eastern sector of the AFMP, including the Teles Pires Intrusive Suite (ca. 1.78–1.75 Ga; [9,15,45], subvolcanic rocks as the quartz-feldspar porphyry (Figure 1c; [35]), and porphyritic biotite granites as the Paraíba syenogranite porphyry [16]. Mesoproterozoic clastic sediments cover all these units (ca. 1.38–1.34 Ga; [8,51,52].
2.2. Local Geology and Characteristics of the Paraíba Deposit
The Paraíba deposit’s host rocks are part of the old 2.05–1.98 Ga Peixoto de Azevedo Domain in the AFMP. They include the Paraíba biotite gneiss, the Paraíba biotite tonalite, and mafic to ultramafic amphibolite [3,4,9,39,51]. The Paraíba tonalite is the principal host rock of the deposit. It is a medium to coarse-grained, magnetic, heterogeneously foliated, and biotite-rich tonalite with titanite, apatite, zircon, and magnetite [12].
The Paraíba gneiss is the oldest (ca. 2.8–2.7 Ga) rock of the AFMP and appears as large fragments, such as the Gavião gneiss in the foliated granitoids of the Cuiú-Cuiú complex [1,16] (Figure 1c). These rocks comprise a tonalitic to granitic composition and are metamorphosed into amphibolite facies.
The Cuiú-Cuiú complex’s rocks are cut by mafic, dioritic, and sienogranitic dykes, and by a 1.79 Ga syenogranite quartz-feldspar porphyry [16,53,54]. These rocks experienced an intense hydrothermal alteration.
Paraíba Vein
The Paraíba deposit is controlled by an N-trending, second-order shear zone, a subsidiary of the WNW-trending first-order shear zones [3,4,9,40]. The Paraíba tonalite and gneiss develop mylonite and phyllonite rocks, composed of biotite, chlorite, white mica, and carbonate [3,5,9]. The phyllonite hosts a sinuous array system of three Au-rich quartz veins, which are parallel to oblique to the phyllonite foliation (N50-70W/60-80SW) and are classified as central to oblique fault-fill veins [5,10]. The veins are from 20 cm up to ~1 m wide and display massive to banded textures [3,4]. The ore zone is characterized by pyrite, chalcopyrite, magnetite, bismuthinite, galena, chalcocite, bornite, and covelline [9,12]. Gold occurs as intra-crystal-subrounded aggregates and in fissures in pyrite and subordinately in chalcopyrite [3].
Trevisan [12] points out that the main quartz vein is in contact with a pervasive biotite-potassic alteration zone, which is enveloped by chloritic and sericitic alteration halos. For distal zones, the author defined a potassic alteration zone with K-feldspar, a spatially restricted propylitic alteration zone, and late veinlets with a variable mineral composition. Quartz fluid inclusions are aqueous-carbonic, with a salinity of 1 to 25 wt.% NaCl equivalent, and a homogenization temperature from 200 to 340 °C [12].
3. Material and Methods
3.1. Field Work
Rock sampling and structural measurements were focused on the Paraíba open pit mine and nearby regions. Some 1800 m of drill cores (boreholes BH020, BH041, and BH059), covering a full cross-section of the Paraíba deposit (Figure 2), were logged and spectrally characterized, yielding critical information on host rocks and the type and distribution of hydrothermal alteration zones.
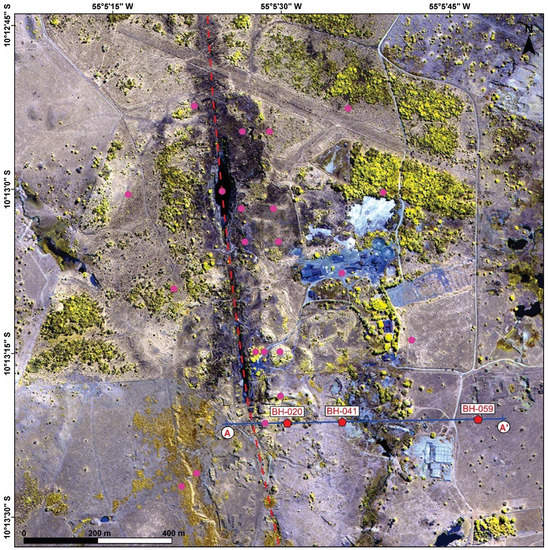
Figure 2.
Worldview-2 false color composite (bands 873 in RGB) image of the Paraíba deposit. A dashed red line marks the axis of the ore bodies. Boreholes BH020, BH041, and BH059, which constitute an archetypal cross-section of the deposit (blue line A-A’), are indicated. Pink circles correspond to additional boreholes. Inactive open pits, currently flooded, can also be spotted in the image. Colors in the image can be interpreted as follows: (i) yellow pixels correspond to vegetation; (ii) black to water; (iii) light blue to humid crops; (iv) white to exposed soil; (v) blue to mining infrastructure.
3.2. Reflectance Spectroscopy
Some 1400 point spectral measurements were performed along boreholes BH020, BH041, and BH059 with an ASD-FieldSpec® 3 Hi-Resolution spectroradiometer (Malvern Panalytical, Cambridge, UK), with equidistant intervals of 1.3 m. This instrument records spectra with 2151 bands, at a spectral resolution of 3 nm in the visible-near infrared (VNIR) and 6.5 nm in the shortwave infrared (SWIR) wavelength regions, and at sampling intervals of 1.4 nm (VNIR) and 2 nm (SWIR). The spectra were obtained using a contact probe with an internal illumination source and a measurement spot size of 1 cm (diameter). The term “reflectance spectroscopy” in the text is related to measurements made with this instrument on a 1 cm circular area of rock samples, so the resulting spectrum is an average response of all minerals included in this area. The radiance values were calibrated to reflectance values using a Spectralon™ panel (Malvern Panalytical, Cambridge, United Kingdom). ENVI® (5.6 version, L3Harris Geospatial, Broomfield, CO, USA) and TSG™ 8 (CSIRO, Canberra, Australia) software was employed to analyze the spectra and to derive sample mineralogy using the USGS library as a reference [55].
Spectral metrics, such as depth, shape, and position of the spectral absorption features e.g., [56,57], allowed for the determination of relative abundance, composition, and structural ordering (crystallinity) of the minerals. The Al-OH ~2200 nm characteristic absorption feature is due to the combination of vibrations caused by stretching and bending [58]. In white mica, the wavelength of the Al-OH absorption can shift as a response to the Tschermak substitution in the octahedral position, from Al-rich (Si-poor) white mica (muscovite) to Al-poor (Si-rich) phengite [59]. This substitution implies an exchange given by (AlIV, AlVI) = Si [Mg, Fe2+], where AlIV is substituted by Si, and AlVI by Mg and Fe [60,61]. This substitution can increase the principal absorption wavelength. The white mica composition can vary from 2184 nm, typically associated with the most Na-rich (paragonite), through 2200 nm (muscovite) and up to 2225 nm, generally associated with Fe-Mg and Si substitution (phengite) [62]. Moreover, the intermediate values are designated as intermediate compositions.
Crystallinity is a term used to refer to the disturbance of order and periodicity of crystalline materials [63]. In practice, crystallinity is defined as “the degree of perfection of translational periodicity” of adjacent layers (pag. 390 from [63]). The crystallinity index (CI) for white mica was calculated by the ratio of the Al-OH absorption depth at ~2200 nm by the water absorption depth at ~1900 nm. The presence of other minerals containing Al-OH and H2O absorptions in the same wavelengths (e.g., kaolinite) could increase the depth of these absorptions and, consequently, modify the CI values. So, different masks were created in TSG-8 software to filter these spectra. The CI limits used here were up to 0.5 for pure smectite, from 0.5 to 1 for mixed-layer smectite/illite, 1 to 2 for mixed-layer illite/smectite, 2 to 4 for pure illite, and 4 to 15 for pure muscovite.
Two absorption features can be used to identify Mg- or Fe-rich chlorite: (i) the “Fe-OH” ~2250 nm feature between 2242 and 2262 nm, and (ii) the “Mg-OH” ~2350 nm feature between 2325 and 2355 nm. In both features, the higher the Fe content, the longer the wavelength [27]. In this work, the composition spectral metrics of chlorite were based on Mg-OH ~2350-nm absorption wavelength e.g., [64,65,66]. This absorption is not affected by the AlVI content of chlorite [67]. Mg-OH absorption wavelength reference ranges are 2325–2332 nm for Mg-series, 2332–2340 nm for Mg-Fe-series, 2340–2347 nm for Fe-Mg-series, and 2347–2355 nm for Fe-series.
3.3. Petrography and Mineral Chemistry
A total of 40 samples collected from drill cores were submitted to petrographic analysis with transmitted and reflected light. Ore minerals were further detailed using an LEO 430i scanning electron microscope (SEM) with a coupled energy dispersive X-ray spectrometer (EDS) at the Institute of Geosciences, UNICAMP. The analyses were performed using the following operating conditions: 20 kV accelerating voltage, 3 nA as sample current, and 19 mm focal length.
Eight thin sections were investigated under a JEOL JXA-8230 Electron Microscope Analyzer (EMPA) with Wavelength Dispersive Spectroscopy (WDS) at the Geosciences Institute of the University of São Paulo State (UNESP). The chemical analyses were carried out on chlorite, white mica, biotite, phlogopite, and epidote in representative samples of the ore zones. The measurements were collected using a 15 kV accelerating voltage, a 15 nA probe current, and a 1-micron beam size; peak and background count times varied between 15 and 30 s. The objectives here were: (i) to classify these minerals and determine their composition, (ii) to cross-compare their chemical compositions in different hydrothermal alteration zones, and (iii) to delimit crystallization temperature intervals in chlorite (geothermometer), aiming to understand the physical-chemical conditions of the Paraíba deposit emplacement.
3.4. Imaging Spectroscopy
The drill core samples were also scanned using a SisuCHEMA™ hyperspectral imager (SWIR model, SPECIM Spectral Imaging LTD., Oulu, Finland) to detect the mineral variability in micron-scale resolution. This camera generates images in the wavelength range between 928 and 2524 nm, through 256 channels, and a spatial resolution of 156 × 156 and 30 × 30 μm. The instrument has a spectral resolution of 10 nm and a spectral sampling of 6.3 nm. The SisuCHEMA hyperspectral data will be referred to as “SisuCHEMA” hereafter.
The pre-processing step includes masks to eliminate unwanted sectors of the samples and eliminate noisy bands or non-coherent data at the beginning and the end of the whole spectra. The processing was based on the classic Spectral “Hourglass” tool implemented in ENVI® software, to generate different mineral maps from the samples [68,69]. The Spectral Hourglass uses a series of processing steps to seek for spectrally pure pixels (i.e., endmembers) and uses them to produce mineral classification maps. Optionally, it employs user-defined endmembers into classification algorithms.
The Spectral Hourglass applies the Minimum Noise Fraction method (MNF) to eliminate the correlation between the original bands and segregate the noise, which is discarded. The Pixel Purity Index (PPI) [68] is applied to the MNF bands to find and select spectrally different pixels. The spectrally purest pixels are then selected as endmembers with the aid of “n-dimensional” interactive dispersion diagrams (where n equals the number of selected MNF bands) [68]. The Spectral Angle Mapper (SAM) classification method, which uses an n-D angle to compare the pixels with reference spectra, was employed to generate mineral maps using custom spectral libraries derived from measured spectral endmembers.
SisuCHEMA images, integrated with reflectance spectra, SEM, and petrography data, were used to identify different mineral groups and associations and their correspondence with the alteration zones. Spectra derived from these SisuCHEMA images correspond to an average response of the pixel area (156 × 156 or 30 × 30 μm); in consequence, there is a reduced mixture of minerals. Some SisuCHEMA images were collected on the same rock blocks used for thin sections. From these images, spectral parameters were acquired at the same spots as the microprobe measurements. In spots inside the minerals that are smaller than the image pixel size, we chose areas with crystal aggregates of the same mineral. In these areas, we extracted the mean spectra of a few pixels.
4. Results
4.1. Distribution and Petrography of Host Rocks
The study area is part of the Amazon region and is covered by a widespread thick lateritic profile up to 50 m, which complicates the mapping of the geology on the surface. There is no reliable surface geologic map at the deposit scale. The almost unique method used in this study to efficiently map the geology was through the drill cores and vertical sections.
The Paraíba deposit comprises five main host rocks: (i) Paraíba biotite gneiss; (ii) Paraíba biotite tonalite, cut by (iii) fine-grained to coarse-grained porphyritic gabbro dykes; (iv) Paraíba syenogranite porphyry; and (v) quartz-rich, fine-grained, felsic syenogranite dykes. The spatial and temporal relationships among these lithotypes are illustrated in Figure 3a.
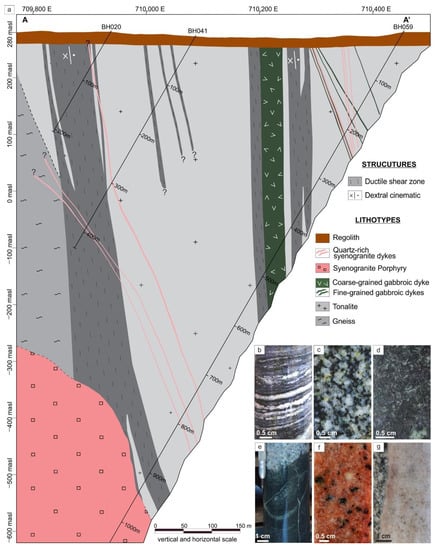
Figure 3.
(a) Full section of the Paraíba deposit, showing temporal and spatial relationships among lithotypes. Vertical and horizontal scales are equivalent; (b) Paraíba biotite gneiss, with classic gneissic banding; (c) isotropic Paraíba biotite tonalite; (d) fine-grained gabbroic dyke; (e) fine-grained gabbroic dyke, cutting the Paraíba tonalite discordantly; (f) syenogranite porphyry; (g) quartz-rich, fine-grained, felsic syenogranite dyke cutting the Paraíba tonalite.
The Paraíba biotite gneiss shows a well-defined banding, varying in thickness between 0.5 and 2 cm (Figure 3b). Its mafic bands are composed of biotite and hornblende aggregates, marking a well-defined foliation. Its leucocratic bands comprise plagioclase, quartz, and K-feldspar.
The Paraíba biotite tonalite exhibits an intrusive contact with the Paraíba biotite gneiss; however, this contact is tectonic through an N-trending subsidiary shear zone. It is a leucocratic, white-greyish, fine to medium-grained rock (Figure 3c), with a heterogeneously spaced foliation defined by plagioclase porphyroclasts and biotite. Compositionally, this unit comprises plagioclase, biotite, hornblende, titanite, apatite, and zircon.
Fine-grained to coarse-grained porphyritic gabbro dykes cut the Paraíba biotite gneiss and the Paraíba biotite tonalite. This is a melanocratic greenish-black porphyritic rock with subhedral plagioclase phenocrysts and a phaneritic matrix (Figure 3d,e). Parts of the rock are obliterated by intense propylitic alteration, resulting in an actinolite-rich rock.
The Paraíba syenogranite’s porphyry is a fine, leucocratic, porphyritic rock with microcline, plagioclase, quartz phenocrysts, and biotite aggregates (Figure 3f). The matrix comprises fine to very fine biotite, plagioclase, K-feldspar, quartz, and magnetite crystals.
The quartz-rich syenogranite dykes cut all previous lithotypes. Syenogranite is a fine-grained light pink rock with subhedral K-feldspar phenocrysts (Figure 3g). Its mineral assemblage is quartz, K-feldspar, muscovite, epidote, and opaque minerals (pyrite and chalcopyrite).
4.2. Hydrothermal Alteration and Mineralization
The Paraíba deposit shows a complex set of hydrothermal alteration zones distributed in the drill-hole section of Figure 4. The zones are organized into two groups based on their mineral foliation. Group 1 comprises shear-related alteration zones, while Group 2 comprises alteration zones without foliation. The photomicrographs, SisuCHEMA images, and reflectance spectra are shown in Figure 5, Figure 6 and Figure 7. The white mica, biotite, chlorite, and epidote characteristics are summarized in Table 1, Table 2, Table 3 and Table 4. The “Mineral Assemblage” field of Table 1, Table 2, Table 3 and Table 4 shows all the minerals associated with each alteration zone identified by drill-core logging, petrography, reflectance spectroscopy, and SisuCHEMA.
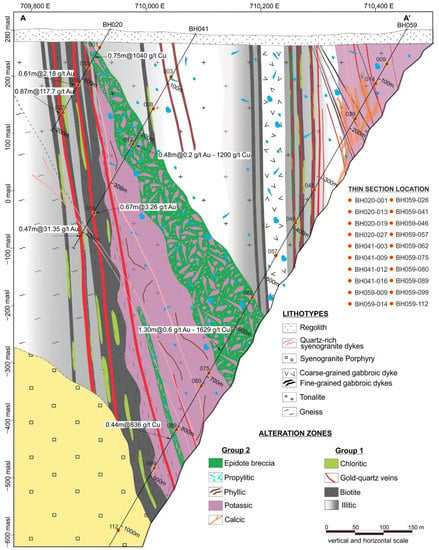
Figure 4.
Paraíba main section with hydrothermal alteration zones. Au-Cu geochemical values and width of some main intercepts and thin-section locations in the drill hole are shown. For drill hole locations, see Figure 2. Vertical and horizontal scales are analogous.

Figure 5.
Group 1 hydrothermal alteration zones. (a,c,d,g,i) Cross-polarized and (h) plain-polarized thin section microphotographs, (b,f) hand samples, (e) underground mine, and (j) reflectance spectra. (a) Illitic zone in the Paraíba tonalite, Wm–1 defines de Sn+1 phyllonitic foliation. Plagioclase alteration generates fine grain white mica (Wm–1). Calcite veinlets and epidote from propylitic alteration crosscut Wm–1 (sample BH020-001 in Figure 4). (b) Biotite zone constitutes the biotite-phlogopite phyllonite. The pyrite aggregates, micas, and quartz or calcite bands defined the phyllonite foliation (sample BH020-019). (c) In the biotite zone, biotite (Bt–1) and chlorite (Chl–1) lenses define the phyllonite foliation (sample BH059-041). (d) Biotite zone composed of stretched phlogopite lamellae (Bt–3) with irregular grain boundaries. Note the mica fish microstructure (sample BH041-016). (e) Main Paraíba gold-quartz vein. Laminated quartz and sulfide bands define the foliation and are parallel to the vein walls. Phyllonite (Phyll) hosts the veins. (f) Greyish black, fine-grain chlorite phyllonite, defining the chloritic zone. Chlorite and biotite relicts define the foliation (arrow) (sample BH059-041). (g) Chloritic zone composed of Bt–2 overprinted by Wm–2, Chl–2, and calcite crystals (sample BH020-027). (h) Detail of pale brown biotite (Bt–2) overprinted by pale green Chl–2 and dark brown titanite-rounded grains (sample BH020-027). (i) In the chloritic zone, the pyrite grains are surrounded by relic phlogopite (Bt–3) and large Chl–2 lamellae. (j) Characteristic reflectance spectra from I to VII. Al-OH and Mg-OH absorption wavelengths are shown in red and green, respectively. Bt—biotite; Cal—calcite; Chl—chlorite; Ep—epidote; Ill—illite; Ms—muscovite; Ms-Phg—white mica with intermediate composition muscovite-phengite; Wm—white mica, Phg—phengite; Phl—phlogopite; Py—pyrite; Qtz—quartz; Ttn—titanite.
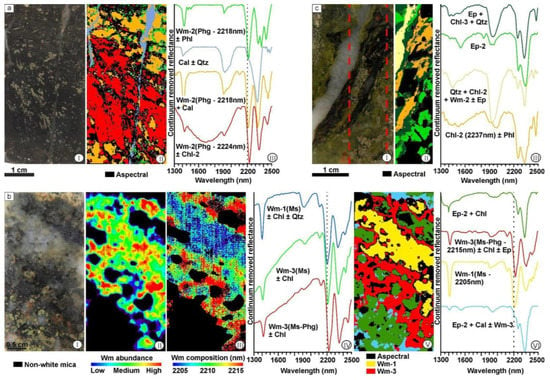
Figure 6.
Images and spectra derived from SisuCHEMA data from drill core samples. The colors of the spectra are the key for the mineral maps. (a) Group 1 chloritic zone in the phyllonite, where calcite-quartz veinlets cut the Wm–2 and Chl–2 foliation (sample BH020-019): (I) true color image, (II) spectrally predominant mineral map (156μm pixel resolution), and (III) main spectra derived from Figure 6aII. (b) Group 2 phyllic zone overprinted by propylitic zones (sample BH059-009): (I) true color image, (II) white mica relative abundance map (156μm pixel resolution), (III) Al-OH wavelength composition map, (IV) spectra derived from previous Figure 6bIII, (V) spectrally predominant mineral map, and (VI) spectra derived from Figure 6bV. Wm–1 (Al-OH feature at 2205nm) and Wm–3 (Al-OH feature at 2215 nm) are spectrally distinct. In the maps, Wm–1 is surrounded and superimposed by Wm–3. (c) Group 2 propylitic and epidote zones (Ep–3) over Group 1 alteration zones (Bt–1, Chl–1, and quartz) in the phyllonite (sample BH059-046): (I) true color image, (II) spectrally predominant mineral map (30μm pixel resolution), and (III) main spectra derived from Figure 6cII. Note the two overprinted alteration minerals: the epidote (Ep–1)–chlorite–(Chl–3)–quartz assemblage (propylitic zone) overprints the chlorite Chl–1-phlogopite Bt–1 (chloritic zone) phyllonite and quartz-sulfide veinlets, while epidote (Ep–2) from epidote zone overprints the propylitic alteration. Cal—calcite; Chl—chlorite; Ep—epidote; Ms—muscovite; Phg—phengite; Phl—phlogopite; Qtz—quartz; Ms-Phg—white mica with intermediate composition muscovite-phengite; Wm—white mica.
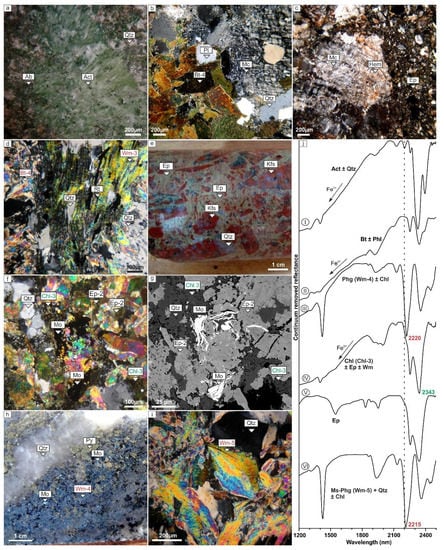
Figure 7.
Group 2 hydrothermal alteration zones. (a) Plain-polarized and (b–d,f,h,i) cross-polarized thin section microphotographs; (g) EMP back-scattered electron image; (h) hand samples; and (j) reflectance spectra. (a) Fibro-radial actinolite, albite, and quartz in the calcic zone. (b) Large idiomorphic biotite (Bt–4) lamellae, microcline, and quartz in the Potassic zone (sample BH041-003 in Figure 4). (c) Reddish microcline with abundant hematite inclusions. Biotite is partial or totally substituted for epidote and titanite from the propylitic zone (sample BH041-003). (d) Biotite (Bt–4) from the potassic zone is transformed into Wm–3, quartz, ilmenite, rutile, and titanite from the phyllic zone (sample BH059-009). (e) Epidote breccia containing subangular k-feldspar-hematite altered clasts with abundant epidote cement (Ep–2) (sample BH041-012). (f,g) Chl–3, epidote (Ep–2), and molybdenite in the epidote breccia zone (sample BH041-012). (h) Halos of Wm–4, chlorite, pyrite, and molybdenite in a quartz–pyrite veinlet from the breccia zone (sample BH041-012). (i) Details of a late white mica veinlet composed of white mica (Wm–5) and quartz (sample BH041-003). (j) Characteristic reflectance spectra of the Group 2 minerals. Act: actinolite; Bt: biotite; Cal: calcite; Chl: chlorite; Ep: epidote; Hem: hematite; Kfs: K-feldspar; Mc: microcline; Mo: molybdenite; Ms: muscovite; Phg: phengite; Phl: phlogopite; Pl: plagioclase; Py: pyrite; Rt: rutile; Qtz: quartz; Ttn: titanite; Ms-Phg: white mica with intermediate composition muscovite-phengite; Wm: white mica.

Table 1.
Summary of the five groups of white mica described in the Paraíba deposit, based on the mineral characteristics, drill-core logging, petrography, reflectance spectroscopy, and EMPA-derived data based on 11 oxygens. In Figure 4, Wm–1 in samples BH059-009; Wm–2 in samples BH020-019 and BH020-027; Wm–3 in samples BH041-003 and BH059-009; Wm–4 in sample BH041-012; and Wm–5 in sample BH041-003.
Table 2.
Summary of the four groups of biotite described in the Paraíba deposit, based on the mineral characteristics, drill-core logging, petrography, reflectance spectroscopy, and EMPA-derived data based on 11 oxygens. In Figure 4, Bt–1 in samples BH059-041 and BH059-46, Bt–2 in samples BH020-027 and BH020-019, Bt–3 in BH041-016, and Bt–4 in BH041-003.
Table 3.
Summary of the three chlorite groups of the Paraíba deposit, based on the mineral characteristics, drill-core logging, petrography, reflectance spectroscopy, and EMPA-derived data based on 14 oxygens. Chl–1 in samples BH059-041 and BH059-046; Chl–2 in sample BH020-027; and Chl–3 in sample BH041-003.
Table 4.
Summary of the three epidote groups of the Paraíba deposit, based on the mineral characteristics, drill-core logging, petrography, reflectance spectroscopy, and EMPA-derived data based on 12.5 oxygens. Ep–1 in sample BH041-003; Ep–2 in sample BH041-012; and Ep–3 in sample BH059-046.
A special mention needs to be provided in relation to white mica. Although the techniques used in this work (EMPA, reflectance spectroscopy, and SisuCHEMA) allow for the correct discrimination of the mineral species of white micas (e.g., muscovite, illite, and phengite), the term “white mica” (Wm) was used here as a blanket term. This is because five groups of white micas (Wm–1 to –5) were interpreted, each related to a different hydrothermal alteration zone, and each with somewhat variable compositions and crystallinities (Table 1). The characteristics of each of these groups were described within each zone of hydrothermal alteration.
4.2.1. Group 1 Hydrothermal Alteration Zones
Group 1 comprises illitic, biotite, and chloritic hydrothermal alteration zones controlled by the N-trending second-order shear zone, which is subsidiary to the WNW-trending first order shear system (Figure 1c). In these high-strain zones, the Paraíba tonalite has mainly been transformed into mylonite that evolved into a phyllonite fabric close to quartz veins (Figure 6a,b). A Sn+1 foliation defines the mica orientation in the shear zones. The illite phyllonite and thin bands (1 to 10 m) of biotite and chlorite phyllonite are distal to the ore veins, while the thickest band (up to 100 m) of biotite and chloritic phyllonites host the gold-quartz veins.
Illitic Zone
The illitic alteration zone is a pervasive alteration composed of fine-grained white mica, hereafter referred to as white mica-1 (Wm–1), and quartz (Figure 5a) (Table 1). In the margins of the N-trending shear zone, Wm–1 completely replaces igneous plagioclase and partially replaces igneous biotite, thereby developing a phyllonite. The Wm–1 reflectance spectra indicate illite with a muscovitic composition (Figure 5j-I) and low crystallinity, from mixed-layers of illite/smectite to illite (CI values: 1–2.3). This low crystallinity illite provides the name of the alteration zone.
Biotite Zone
The biotite alteration zone is a greyish to dark green foliated alteration, which defines the biotite phyllonite (Figure 5b). The biotite phyllonite occurs as N-trending (N05W dipping 65-70NE) bands of 1 to 100 m wide, roughly defining the contact between the Paraíba tonalite and the Paraíba gneiss (Figure 3 and Figure 4). The zone’s thin bands are barren and distal to the veins, while the wider band hosts gold-quartz veins (Figure 4) and includes biotite, carbonate, pyrite, and chalcopyrite as mineral assemblages (Figure 5b,c; Table 2).
In the biotite zone, the biotite was classified into three groups (Table 2). Biotite 1 (Bt–1) occurs in thin phyllonite bands, distal to the gold-quartz veins (samples BH059-41 and BH059-46 in Figure 4). Biotite 2 (Bt–2) and biotite 3 (Bt–3) occur in the wider phyllonite band, which host the ore veins. Bt–2 occurs in shallow zones (samples BH020-19 and BH020-27) and Bt–3 in deeper zones (sample BH041-016 in Figure 4).
The three biotite groups are lamellar with fish microstructures and irregular grain boundaries mostly altered to chlorite (Figure 5c). Bt–1 and Bt–2 show a yellowish to brown pleochroism and a second-order yellow to orange interference color. Bt–3 shows light brown to dark greenish pleochroism and a third-order blue interference color (Figure 5d) (Table 2). Based on the reflectance spectra, Bt–3 is defined as phlogopite, while Bt–1 and Bt–2 correspond to biotite. Overall, the phlogopite spectra are similar, but the Fe-OH and Mg-OH absorptions of phlogopite occur at slightly shorter wavelengths than that of biotite (Table 2). An extra Mg-OH absorption or shoulder at ~2380 nm in phlogopite may not be evident in biotite [58] (Figure 5j-II).
Chloritic Zone
The chloritic zone develops a characteristic greyish black, fine-grain chlorite phyllonite rock (Figure 5f). In the thin phyllonite bands, biotite (Bt–1) is partially substituted by chlorite (Chl–1), calcite, titanite, and sulfides (Table 3; Figure 4 and Figure 5c). In the larger phyllonite bands, the altered Bt–2 develops chlorite (Chl–2), white mica (Wm–2), calcite, and titanite, associated with sulfides and traces of native gold (Table 1; Figure 5g,h). These minerals define the zone’s foliation. Locally, biotite is replaced by Chl–2, developing a coarser grain size than Chl–1 (Table 3; Figure 5i).
According to its Al-OH feature position, the Wm–2 reflectance spectra indicate an intermediate composition between muscovite and phengite (Figure 5j-III, Table 1). Wm–2 has a variable crystallinity, from illite/smectite mixed-layers to muscovite (CI values: 1–15; Table 1). The mixed spectra of Wm–2, phlogopite, biotite, and chlorite are typical in this alteration zone (Figure 5j-IV). The Chl–2 reflectance spectra indicate a Mg-rich composition (Table 3). Towards the center of the chlorite phyllonite zones, the spectra are dominated by absorption features of muscovite Wm–2, biotite, and calcite (Figure 5j-V).
Based on the Mg-OH absorption features from the reflectance spectra, Chl–1 and Chl–2 show a Mg-Fe composition (wavelengths from 2331 to 2340 nm; Figure 5j-VI,VII; Table 3). In the SisuCHEMA data, phengite (Wm–2) and chlorite (Chl–2) replace phlogopite (Bt–2) and define a phyllonitic foliation (Figure 6aI–III). Calcite-quartz veinlets cut the foliation.
Gold-Quartz Vein
The biotite and chlorite-white mica zones, which constitutes the phyllonite rocks, host several generations of quartz veins and veinlets, some of them with significant Au grades (Figure 4). The quartz veins are sub-parallel to oblique to the phyllonitic foliation and vary from 0.5 to 1.5 m wide and 1500 m in length (Figure 5e). The syenogranite porphyry cuts the quartz veins. The quartz crystals inside the vein grow sub-parallelly to obliquely to the vein, defining a fault-fill vein. In the rich-gold parts of the vein, the ore occurs as massive bands (1–3 cm) interleaved with anastomosed quartz bands (Figure 5e). The main ore minerals are pyrite and chalcopyrite, but metallic minerals such as magnetite, bismuthinite, and native bismuth traces are also present. The dilational veinlet systems show syntaxial quartz growing perpendicularly to the veinlet wall (Figure 6c I–III).
4.2.2. Group 2 Hydrothermal Alteration Zones
Group 2 comprises calcic, potassic, phyllic, propylitic, and epidote hydrothermal alteration zones unrelated to shear zones or other plastic deformation (Figure 4).
Calcic Zone
The hydrothermal alteration calcic zone is local and was the earliest observed in Group 2. It is distal from the ore-quartz vein and syenogranite porphyry (Figure 4). Its mineral assemblage is actinolite, albite, and quartz (Figure 7a). Actinolite is pale to dark green, prismatic to fibro-radial, and its length size varies from 50 to 350 μm. Albite is reddish with up to 20 μm rounded grains. Quartz is milky white, and the xenomorphic grains vary between 50 to 100 μm. Albite and quartz have no diagnostic absorptions in the shortwave-infrared; consequently, they are not represented in the spectra. However, quartz is inferred in Figure 7j-I through the rounded absorption at 1910 nm, probably associated with water as a fluid inclusion. Based on its diagnostic doublet Mg-OH feature absorption, the pure actinolite spectra are typical in this alteration zone (Figure 7j-I).
Potassic Zone
The potassic zone comprises microcline, biotite (Bt–4), quartz, subordinated anhydrite, and magnetite altered to hematite (Figure 7b). Biotite is lamellar idiomorphic, with straight to irregular boundaries and no deformational microstructures (Table 2). Microcline crystals measure between 20 μm and 5 mm in width and show a diffuse tartan twin. The presence of reddish crystals is due to sub-microscopic hematite inclusions (Figure 7c). The pure biotite and mixed spectra of biotite and phlogopite are from this alteration zone (Figure 7j-II). K-feldspar, quartz, and hematite have no absorption features in the shortwave-infrared.
Phyllic Zone
The phyllic alteration zone comprises white mica (Wm–3), rutile, ilmenite, and minor amounts of molybdenite. This mineral assemblage clearly replaced the potassic alteration biotite (Bt–4) (Figure 7d; Table 1). Wm–3 is lamellar to fibro-radial, associated with thin-grained (200 to 1000 μm) prismatic rutile and coarse-grained (100 to 300 μm) tabular ilmenite (Figure 7d).
In the white mica’s spectrally predominant mineral map produced from the SisuCHEMA data, Wm–3 surrounds and superposes Wm–1 (Figure 6bI, V and VII). Based on the Al-OH absorption, Wm–3 has an intermediate composition between muscovite and phengite (Figure 6bII, III, and IV) and a high crystallinity inside the muscovite field (CI values: 4–8; Table 1).
Propylitic Zone
The propylitic alteration zones are widely distributed in the studied area, usually distal to the syenogranite porphyry and the veins (Figure 4). Their mineral assemblage consists of chlorite (Chl–3), epidote (Ep–1), calcite, and minor pyrite (Table 4). Both Wm–1 and Wm–3 are substituted for Chl–3, calcite, and Ep–1 (Figure 5a). the chlorite (Chl–3) aggregates show straight contact with sub-idiomorphic prismatic epidote (Ep–1) crystals. The pyrite is intergrown with epidote (Ep–1) and chlorite (Chl–3). The Chl–3 reflectance spectra indicate a Mg-Fe intermediate composition (Figure 7j-IV).
Epidote Zone
The epidote-rich alteration zone occurs as a pervasive zone and as breccia. The breccias present angular, monomictic K-feldspar-hematite potassic-altered lithoclasts in prismatic epidote cement (Figure 7e). The breccias are mined for gold but have a high copper content as well (see Au and Cu content in Figure 4). The mineral assemblage is epidote (Ep–2), calcite, quartz, pyrite, chalcopyrite, molybdenite, and gold (Figure 7f,g).
Halos of white mica (Wm–4), molybdenite, pyrite, and chlorite surround the quartz-pyrite veinlets (Figure 7h). Wm–4 is tabular and fine to medium-grained. Based on the Al-OH absorption wavelength, Wm–4 presents an intermediate composition between muscovite/phengite (Figure 7j-III) to phengite and a high crystallinity inside the muscovite field (CI values: 4–15; Table 1). The SisuCHEMA data show Group 1 sulfide-rich quartz veinlets associated with white mica (Wm–2) and chlorite (Chl–2) superimposed by a propylitic alteration, followed by pervasive epidote Ep–2 (Figure 6b,c). When the epidote superimposed the Group 1 alteration, we called it epidote Ep–3.
Late Phases and Barren Veinlets
Late millimetric to centimetric barren veinlets cut all the lithotypes and hydrothermal alteration zones. They are monomineralic calcite (Figure 6a), quartz-calcite, and quartz-magnetite-fluorite-white mica (Wm–5). Wm–5 occurs in veinlets as coarse-grain fibro-radial lamellae (Figure 7i). Based on the Al-OH absorption, the Wm–5 reflectance spectra show an intermediate composition between muscovite and phengite (Figure 7j-VI) and a high crystallinity in the muscovite field (CI values: 4–8; Table 1).
4.3. Mineral Chemistry
The chemical (EMPA) composition of white mica, chlorite, biotite, and epidote is summarized in Table 1, Table 2, Table 3 and Table 4, and the complete data are included in Supplementary Tables S1–S4. The white mica Wm–1 and Wm–2 belong to the Group 1 hydrothermal alteration zones. Wm–1 composes the illitic alteration, and Wm–2 occurs in the chloritic alteration zone of the phyllonite rocks. Wm–3, Wm–4, and Wm–5 occur in the Group 2 hydrothermal alteration zones. Wm–3 occurs in the phyllic zone, Wm–4 in the epidote zone, and Wm–5 in the quartz-magnetite-fluorite-white mica veinlets. Chl–1 and Chl–2 together with Wm–1 and Wm–2 belong to Group 1, both in the chloritic alteration zones in phyllonites. Chl–3 belongs to Group 2 of the non-foliated propylitic alteration zone. The three biotite types are associated with phyllonites. Epidote together with Chl–3 occur in the propylitic zone or in the epidote-rich breccia zone.
4.3.1. White Mica
The conversion of the EPMA white mica data to atoms per formula unit (apfu) was based on 11 oxygen atoms, and all iron was considered to be Fe3+. The generic structural white mica cations’ minimum and maximum occupancies in apfu is as follows: (K 0.87–0.93, Na 0.01–0.03, and Ca 0.00), (Alvi 1.42–1.65, Mg 0.18–0.47, Fetot 0.14–0.27, Mn 0.00–0.01, and Ti 0.00–0.07), and (Si 3.09–3.31and AlIV 0.69–0.91), with an interlayer cation site occupancy of 0.88 to 0.96 apfu and an octahedral occupancy of 1.74 to 2.47 (Table 1 and Table S1).
The white mica majority has an interlayer charge of >0.9 apfu and a Si content over 3 apfu, which is characteristic of a phengite composition. The Fe + Mg and Al content are in the ideal compositional variation from muscovite to phengite, with the main substitutions following the muscovite-ferriphengite and muscovite-Mg-phengite trends (Figure 8a; [69]). Wm–1 (Group-1) along with Wm–3 and Wm–5 of Group 2 show well-defined fields of Fe-richer compositions in contrast to the scattered Wm–2 (Group-1) and Wm–4 (Group-2) superimposed Mg-phengites. The broad compositional field depicted in Figure 8a allows for the observation of two significant groups: (i) white micas associated with ore zones (Wm–2 and Wm–4) in the Mg-phengite field, and (ii) those associated with barren zones (Wm–1, Wm–3, Wm–5) clustering in an Fe-richer trend. Even without an Fe2+–Fe3+ distinction via the EPMA analysis, the Muscovite’s deviation to Ferrimuscovite suggests that an Fe3+ ↔ Al3+ substitution could also have occurred [69].
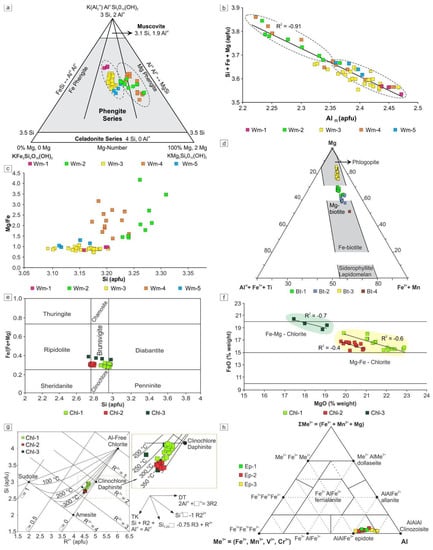
Figure 8.
Mineral chemistry (EMPA) of the Paraíba deposit: white mica (a–c), biotite (d), chlorite (e–g), and epidote (h). (a) Compositional field of the Phengite Series [70]. (b) Al(t) vs. (Si + Fe + Mg) correlation diagram (R2 = correlation coefficient). (c) Si vs. Mg/Fe white mica distribution. (d) Biotite classification according to Foster [71]. (e) Chlorite classification Si vs. Fe/(Fe + Mg) diagram [71]. (f) The FeO vs. MgO chlorite distribution. (g) Chlorite crystallization temperatures calculated using the Bourdelle and Chatelineau [72] geothermometer according to the Wiewióra and Weiss [73] diagram. (h) Ternary diagram proposed by Kartashov [74]. Abbreviations: Bt—biotite, Chl—chlorite, Ep—epidote, Wm—white mica, and Me—octahedral cations.
The Tschermak exchange reaction ((SiIV + (Mg + Fe2+)VI = IVAl + VIAl) is an important controller of compositional variations since most samples cluster in a negative linear correlation (Figure 8b). Wm–1, Wm–3, and Wm–5 concentrate closer to the muscovite composition endmember (richer in total Al), while Wm–2 and Wm–4 are closer to the celadonite endmember, richer in Fe2+, Mg2+, and Si. The Wm–2 and Wm–4 groups occur in two mineralized alteration zones, namely, the chlorite-white mica phyllonite hosting the gold-quartz vein and the epidote breccia zone, respectively.
According to the Si vs. Mg/Fe diagram (Figure 8c), the white mica associated with barren zones (Wm–1, Wm–3, Wm–5) presents a constant Mg/Fe ratio of approximately 1, while in those associated with ore zones (Wm–2 and Wm–4) the Mg/Fe ratio varies between 1.5 to 4. Moreover, there are differences between the two white mica groups in the ore zones. Wm–2 (Group 1) shows a Si content > 3.22 apfu, while Wm–4 (Group 2) shows a Si content between 3.17 to 3.24 apfu. Furthermore, a positive correlation exists between the Mg/Fe ratio and Si content in Group 1 from the Fe-rich Wm–1 to the Mg- and Si-rich Wm–2 (Figure 8c). However, that correlation is not observed in the Group 2 white mica.
4.3.2. Biotite-Phlogopite
The EMPA biotite data are related to the phyllonites of Group 1 (Bt–1, Bt–2, and Bt–3) and to the potassic alteration zone (Bt–4 of Group 2) (Figure 4; Table 2). All mineral formulas were calculated on the basis of 11 oxygen atoms. The classification of Deer et al. [75] shows that phlogopite has a Mg:Fe ratio > 2:1. In this sense, the three biotites of Group 1 have a phlogopite composition: Bt–1 has Mg:Fe > 2.32, Bt–2 has Mg:Fe > 2.0 (with one sample 1.9), and Bt–3 has Mg:Fe > 4.6, up to 8.4. The Bt–4 of Group 2 has Mg:Fe = 1.46 and is classified as biotite. According to the ternary plot of Foster [62], a trend of a Mg-biotite field characterizes the biotite compositions of phyllonites, marked by an Aliv ~1.17 apfu and an Fe# of 0.26 in Bt–1, and by an Aliv ~1.4 apfu and an Fe# of 0.32 in Bt–2. This positive correlation indicates a substitution of Al in both octahedral and tetrahedral sites, tending toward the siderophyllite endmember [75]. Bt–3 is Mg-richer (phlogopite) with an Fe# up to 0.15, and two main clusters: one Si-rich (Aliv from 0.7 to 0.8 apfu) and another Si-poor (Aliv from 1 to 1.1 apfu). Bt–3 also indicates an Al substitution in the octahedral and tetrahedral sites, tending towards the eastonite endmember. Bt–4 is an Fe-rich biotite with an Aliv ~1.4 apfu and an Fe# of 0.41 (Figure 8d; Table 2).
4.3.3. Chlorite
The EMPA mineral chemistry was carried out in all three chlorite groups, considering 14 equivalent oxygen atoms and all iron as Fe2+ (Table 3). Chl–1 and Chl–2, which are spatially related to mineralized zones within phyllonites (Group 1), show similar contents of Fe and Mg. Chl–3, associated with propylitic hydrothermal alteration zones (Group 2), displays a marked Fe-enrichment.
According to the Si vs. Fe/(Fe+Mg) diagram [71], all the chlorites classify as brunsvigite (Figure 8e). Ch-1 clusters closely to Si-richer diabantite and Ch-2 closely to ripidolite, and a compositional trend from ripidolite to diabantite and a greater Fe/(Fe+Mg) ratio is observed for Chl–3. According to Foster [71], variations in FeO and MgO concentrations involve the substitution of Fe2+ for Mg2+ in the octahedral layers. This cation substitution was recognized by a negative linear correlation between the chlorite samples. Thus, Chl–1 and Chl–2 are considered Mg-Fe chlorites, whereas Chl–3 corresponds to Fe-Mg chlorite (Figure 8f).
The chlorite crystallization temperatures were calculated following the graphical geothermometer of Bourdelle and Chatelineau [72], using the R2+ vs. Si diagram proposed by Wiewióra and Weiss [73] (Figure 8g). It is recommended for temperatures up to 350 °C, and it is based on the equations of Bourdelle et al. [76] and Jefferies et al. [77]. Both consist of semi-empirical methods that do not consider pressure or non-ideal conditions. These geothermometers are based on endmember ratio activities to directly relate the temperature to the constant equilibrium between quartz and chlorite.
The chlorite samples at the Paraíba deposit are distributed along with the Al-free chlorite–amesite endmember line, resulting from the Tschermak substitution Si + R2+ = AlIV + AlVI (arrow TK in Figure 8g; [72]). The Al-free chlorite–amesite line also indicates zero vacancies and, according to Hillier and Velde [78], it suggests an Fe3+ content close to zero. In Figure 8g, the three chlorite group data are close to the clinochlore (daphinite) endmember, with a R3+ content ranging from 2.2 to 2.8 apfu, a R2+ content from 4.3 to 4.8 apfu, and a Si content from 2.5 to 3.0 apfu. Most samples plot close to the zero-vacancy line and have crystallization temperatures around 350 °C (Figure 8g). In general, most of the Chl–2 compositions indicate crystallization temperatures of 300°–350 °C. The Chl–1 and Chl–3 compositions deviate from the zero-vacancy line toward higher silica and vacancy, and lower R2+ content, indicating lower temperatures. Chl–1 has an average crystallization temperature around 300 °C. The Chl–3 compositions are highly dispersed, with temperatures varying between 220 °C and 350 °C.
4.3.4. Epidote
A total of twelve points were measured in three thin sections (BH041-003, BH041-012, and BH059-046). The epidotes are designated according to the alteration zone they belong to. Ep–1 is related to the propylitic alteration zone (Group 2). Ep–2 and Ep–3 are related to the hydrothermal breccia matrix (Group 2). The epidote hydrothermal alteration zone is considered critical within the Paraíba deposit due to its relationship with the Group 2 mineralized zones (Table 4). All the epidotes plot closer to the epidote composition in Kartashov’s [74] ternary diagram. Ep–3′s compositions are scattered towards the clinozoisite field (Figure 8h).
5. Data Integration, Discussion, and Conclusion
5.1. Spectral, Mineral Chemical, and Au-Cu Data Integration
In this section, we present and discuss an integration of the spectral, mineral chemical, and Au-Cu content data. Firstly, we approach the spectral abundance, composition, and crystallinity of the five white micas, and their comparison with the mineral chemical compositions and Au-Cu content. Further on, we integrate all the data using an archetype borehole of the Paraíba deposit. In addition, the spectral composition of the three types of chlorites, and their comparison with the mineral chemical compositions and Au-Cu content, are presented. Finally, we will discuss the spectral composition of the epidote and its comparison with respect to mineral chemistry and Au-Cu content.
The white micas observed in the Paraíba deposit have a variable spectral composition, partially overlapped in some cases. The composition varies from muscovite (minimum Al-OH absorption at 2198 nm) to phengite (maximum Al-OH absorption at 2224 nm) (Figure 9a,b). The compositions of Wm–2, Wm–3, Wm–4, and Wm–5 with overlapped wavelengths between 2207 and 2224 nm are the most abundant. Wm–3 and Wm–5 have a similar intermediate muscovite-phengite composition (Al-OH absorption 2207 to 2214 nm). Wm–2 and Wm–4 are more phengitic. Wm–1 is the only type that spectrally presents a muscovitic composition (Al-OH absorption between 2198 and 2207 nm), and it does not overlap with other white mica types (Figure 9a,b). It is important to note that all these results are based on reflectance spectroscopy data measured with an ASD/FieldSpec-3 Hi-Res spectroradiometer and with a contact probe of a 1 cm spot size.
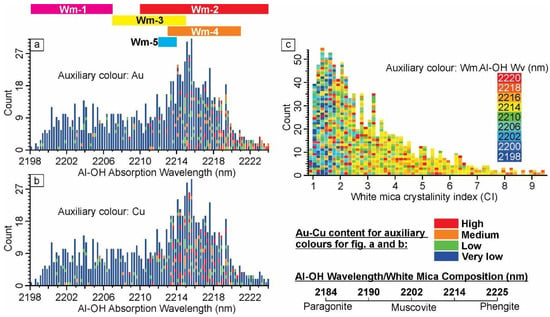
Figure 9.
White mica spectral data and Au-Cu content integration from Paraíba samples. Histogram of Al-OH feature position for overall white mica samples related to Au content (a) and Cu content (b). The colored horizontal bars above the histograms indicate the interval of Al-OH absorption wavelengths associated with the white mica groups (Wm–1 to Wm–5). (c) Histogram of white mica crystallinity index (CI), with white mica Al-OH wavelength (Al-OH Wv) in auxiliary colors. The maximum CI value of Paraíba samples is 15, but there are few samples with CI above 9. This is considered as the maximum value in this figure for clarity.
According to the data derived from the EMPA, all five types of white mica belong to the phengite series (Figure 8a). However, the Wm–1 crystals show a slight decrease in Si and Fe content, and an enrichment in Al, which leaves it closer to the composition of muscovite (Figure 8a). A comparison of the SisuCHEMA and EMPA data from the white mica shows a high correlation (Figure 10a). This high correlation is because the spectral data were collected with the SisuCHEMA sensor (pixel size of 30 μm) in the same areas of the thin sections where the EMPA measurements were carried out. Figure 10a shows that longer wavelengths correspond to white mica with higher Si, Fe2+, and Mg2+ content and lower Al(t) content (see also Figure 8b). Therefore, the wavelengths related to white mica Al-OH absorptions show a systematic change, consistent with the level of Tschermak substitution ([Mg, Fe] + Si = AlIV + AlVI; [60]). The SisuCHEMA data show minimum values regarding their Al-OH wavelength of 2205 nm for Wm–1, which is slightly higher than the values measured with reflectance spectroscopy. This slight difference between the imaging and reflectance spectroscopy data could be related to the larger spot size of the FieldSpec instrument. A larger spot size could include several other minerals besides this very fine Wm–1 (illite/smectite to illite) in an average spectrum, and these could influence the position of the spectral parameter, mainly in a deposit with large overlapping events.
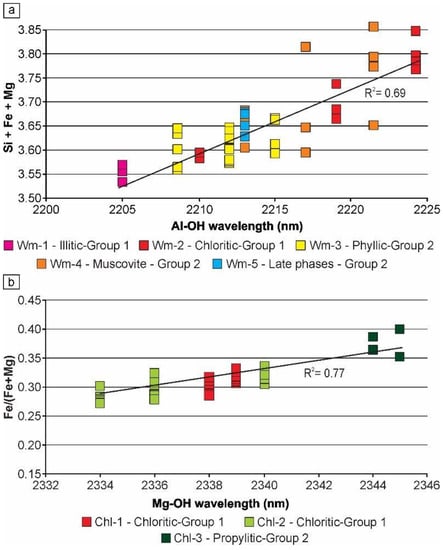
Figure 10.
Scatterplots showing white mica and chlorite principal absorption wavelengths versus EPMA-derived cation contents. (a) Al-OH wavelength vs. Si+(Fe + Mg) of white mica; (b) Mg-OH wavelength vs. Fe/(Fe+Mg) of chlorite (from EPMA data, for 14 oxygen atoms). Spectral data were collected using the SisuCHEMA sensor with 30 μm pixel size in the same sectors where the EMPA measurements were carried out.
The crystallinity index (CI) values of the Paraíba white mica vary from 1 to 15, corresponding to compositions ranging from mixed-layer illite/smectite to muscovite (Figure 9c; Table 1). CI values lower than 2.5 (corresponding to illite/smectite and illite crystallinity) are related to samples with a broader range of compositions, from muscovite to phengite (Al-OH absorptions 2198 to 2225 nm), but with a predominance of muscovite compositions (blue and light blue in Figure 9c). Low crystallinity (Figure 9c) and muscovite composition (Figure 9a) are associated with Wm–1. A wide range of crystallinity values (CI values from 1 to 15) and compositions from intermediate muscovite-phengite to phengite are related to Wm–2 (Figure 9a,c; Table 1). The almost similar composition (intermediate muscovite-phengite to phengite; Al-OH absorption range: 2207–2215 nm) and the high crystallinity (muscovite field; CI range: 4–8) of Wm–3 and Wm–5 make their discrimination difficult when using reflectance spectroscopy (Figure 9a,c). Wm–4 has a high muscovite crystallinity (CI range: 4–15) and compositions varying from intermediate muscovite-phengite to phengite (Al-OH absorption range: 2213–2221 nm) (Figure 9a,c).
The Wm–2 of the chloritic zone (Group 1) and the Wm–4 of the epidote breccia zone (Group 2) are related to high Au and high Cu contents, respectively (Figure 9a,b). The highest Au contents are related to the Wm–2 spectral range, especially at the right-side tail of the histogram of Figure 9a. The highest Cu values are related to the Wm–4 spectral range (Figure 9b). The Wm–1 of the illitic zone (Group 1), the Wm–3 of the phyllic zone (Group 2), and the Wm–5 of the later alteration phases are unrelated to significant Au and Cu contents (Figure 9a,b).
A representative Paraíba deposit borehole (BH041) was selected to show the spatial relationship between the hydrothermal alteration zoning, Au-Cu content, and white mica characteristics (Figure 11). Higher Au contents are related to the gold-quartz veins hosted in the Group 1 biotite or chlorite phyllonite (105, 370, and 410 m depth in Figure 11a,b). The Group 2 epidote breccia zone shows the highest Cu content, with an intermediary Au content (Figure 11a,c). The Group 2 propylitic zone and the 420 m depth Group 1 gold quartz vein also show high Cu contents. There is a relationship between the high abundance of white mica (Figure 11d) and the high Au and mainly high Cu contents in the epidote breccia zone of Group 2 (Figure 11b,c). The phengite composition (Al-OH absorption > 2214 nm) is clearly related to Cu- and Au-richer zones (Figure 11d, see auxiliary colors). Barren sectors are represented by white mica compositions from muscovite to intermediate muscovite-phengite (Al-OH absorptions from 2198 to 2215 nm) (Figure 11d). Comparing these observations with Figure 9a,b, it can be deduced that the phengite-rich samples (Al-OH absorption from 2214 to 2225 nm) are related to Wm–2 (Group 1) and/or Wm–4 (Group 2).

Figure 11.
Key features of the Paraíba deposit borehole BH04, integrating: (a) one-dimensional striplog, with geological and hydrothermal alteration core logging; (b) Au and (c) Cu contents (logarithmic scales); (d) white mica abundance (with white mica composition wavelengths in auxiliary colors); (e) white mica crystallinity (CI); and (f) white mica crystallinity (CI) with white mica composition wavelengths in auxiliary colors. The main lithotypes and hydrothermal alteration zones are from Figure 3 and Figure 4. The figure caption shows the complete mineral association described for each alteration zone derived from petrography, core logging, reflectance spectra, and SisuCHEMA. Pale-yellow horizontal levels show high Au content, pale-grey levels show high Cu content, and white background between grey and pale-yellow are barren.
The white mica’s crystallinity values (CI) increase in the Cu-rich zones within the Group 2 hydrothermal alteration zones, especially phyllic and epidote zones (Figure 11e). In these zones, the CI values are generally higher than four, indicating high crystallinity values similar to those of muscovite.
The characteristic muscovite composition and the low crystallinity of Wm–1 (see Figure 9a,c) indicate a marked presence of this white mica group at a 30 to 180 m depth (see blue and light blue points in Figure 11f). However, Wm–1 is not the only white mica type at this depth interval. Some of the variability observed in the crystallinity and composition values in the same few meters depth of the borehole suggests an overprinting of the different white mica types in the spectroradiometer spot size (diameter of 1 cm). Yet, part of this variability could be associated with the intrinsic range of crystallinity and composition values of each white mica type. For example, Wm–2 is a type with a composition from intermediate muscovite-phengite to phengite, with a crystallinity varying from mixed-layer illite/smectite to muscovite.
Wm–4 is similar in composition to Wm–2 (muscovite-phengite to phengite) but is only present in the Group 2 epidote hydrothermal alteration zone (from 180 to 260 m depth in BH041; Figure 11). A discrimination between Wm–4 and Wm–2 by reflectance spectroscopy is impossible, except when the phengitic white mica has low crystallinity—a characteristic combination only seen in Wm–2. On the other hand, all Wm–4 samples show high crystallinity (CI > 4).
These data are in concordance with the EMPA-derived data, which points out the existence of two significant trends: one comprising Wm–2 and Wm–4, the groups spatially related to the ore zones, and another involving Wm–1, Wm–3, and Wm–5 related to barren alteration zones (Figure 8a,c). Wm–2 was discriminated from the Wm–4 population by the EMPA-derived data (Figure 8c). The Wm–2 population shows a higher silica content (>3.2 apfu), a positive correlation, and the highest Mg content, whereas the Wm–4 population shows a reduced silica content (<3.2 apfu) and scattered distribution. In contrast, the barren Wm–1, Wm–3, and Wm–5 display restricted silica variations and lower values of Mg/Fe (<1.3). According to Guidotti [60], the muscovite deviates from its ideal composition mainly by two main substitution types: the Tschermak (or phengite substitution) and the Alvi for Fe3+.
Chlorites Chl–1 and Chl–2 have an intermediate Mg-Fe composition with a predominance of Mg-rich endmembers (Figure 12a). The Mg-OH absorption wavelengths are 2337–2340 and 2331–2339 nm for Chl–1 and Chl–2, respectively. Chl–3 has a Fe-Mg composition (Fe-rich endmember) and Mg-OH absorption wavelengths between 2340 and 2344 nm. These results are in agreement with those observed in the EMPA data (Figure 8e,f). The values of Fe and Mg show systematic changes with the ~2340 nm absorption wavelengths, consistent with the level of Tschermak substitution. The higher the Mg content in chlorite, the shorter the feature wavelength; conversely, when the Fe content increases, the feature wavelength is longer (Figure 10b). The EMPA-data also support the Tschermak substitution as the principal chlorite substitution, as the samples are distributed throughout the Al-free chlorite-amesite endmembers’ line (Figure 8g) [72]. Chl–1 and Chl–2 are related to the chloritic alteration zone (Group 1), with crystallization temperatures higher than 350 °C for Chl–1, and between 300 °C to 350 °C for Chl–2 [72] (Figure 8g). Chl–3, related to the propylitic alteration zone (Group 2), shows Fe enrichment, and scattered lower temperatures between 220 °C and 350 °C.
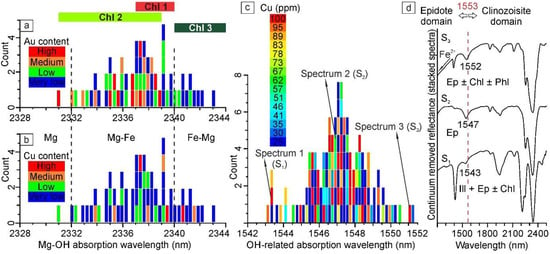
Figure 12.
Chlorite and epidote spectral analysis of the Paraíba deposit. (a) Histogram of chlorite Mg-OH feature position. The colored bars above indicate the wavelength interval of each chlorite group. Note the high correlation among Mg-rich chlorite samples (Chl–1 and Chl–2) and high Au values. (b) Histogram of the chlorite Mg-OH feature position. Chlorite samples do not show high correlation with Cu-rich values. (c) Histogram with the ~1545nm wavelength position for all samples of the Paraíba deposit. Note the high correlation among epidote samples and high Cu grades. (d) Epidote reflectance spectra. Classification of epidote and clinozoisite is differentiated by the dashed line at 1553nm. Chl: chlorite; Ep: epidote; Ill: illite; Phl: phlogopite.
In this scenario, Mg-rich Chl–1 and Chl–2 are spatially related to a higher Au content (Figure 12a) and, therefore, they can be used as vectors towards mineralized zones. In contrast, high Cu values have no relationship with these chlorite groups (Figure 12b).
The most conspicuous spectral features of epidote, positioned at ~2255 nm (Fe-OH) and ~2340 nm (Mg-OH), overlap absorptions of chlorite, biotite, or carbonate in spectral mixtures [58]. However, the OH-related absorption at ~1545 nm is a diagnostic feature that is not present in chlorite, biotite, or carbonate (Figure 7j-V). This absorption varies in position from the epidote endmember (1542nm) to the Al-rich clinozoisite endmember (1559 nm) [20]. The samples were classified as the epidote endmember, reaching the clinozoisite limit in a few cases (Figure 12c). The EMPA-derived data corroborate the epidote composition with only a few samples with high Al clinozoisite-fields (Figure 8h). There is no relationship between a high Cu content and epidote composition.
5.2. Interpretation
The Paraíba deposit has been studied by several researchers and has received different classifications, such as: a lode in brittle-ductile shear zones [3,4,5,9,51], a structurally controlled Au ± Cu vein-type [15], or an intrusion-hosted Au-quartz vein [12].
Following all the data presented herein, we propose a schematic paragenetic chart of the Paraíba deposit in Figure 13. The Group 1 hydrothermal alteration zones are controlled by shearing and marked by illitic, biotite, gold-quartz veins, and chloritic alteration zones. Group 2 comprises calcic, potassic, phyllic, propylitic, and epidote-breccia alteration zones, with extensive late barren veinlets. Each alteration group is associated with two major mineralizing systems: (i) a hydrothermal system (Group 1) related to Au-Cu-rich quartz veins hosted in phyllonites/mylonites, and (ii) a magmatic-hydrothermal system (Group 2) associated with Cu-Mo-rich breccias and veinlets (Figure 13).
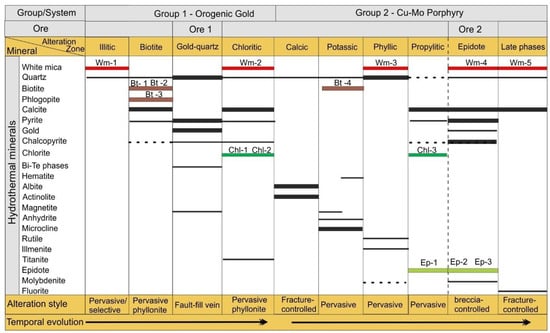
Figure 13.
Schematic paragenetic chart proposed for the Paraíba deposit, showing the two groups of hydrothermal alterations. It was based on drill core logging, petrographic description, and reflectance and SisuCHEMA data. Group 1 shows characteristics of an orogenic gold event. Group 2 is associated with a magmatic-hydrothermal event, with porphyry characteristics. Minerals present as common or minor phases are represented by solid and dashed lines, respectively, and the relative abundance is proportional to the thickness of the bars. Types of chlorite (Chl–1, –2, –3) and white mica (Wm–1 to –5) as presented in the text.
Group 1’s alteration and mineralization characteristics are: (a) at the district scale, hosted in transpressional major NW-trending shear zones; (b) at the deposit scale, hosted in fault-fill Au-quartz veins—the hydrothermal alteration is restricted to phyllonites of subsidiary shear zones; (c) 200 to 340 °C, low salinity, aqueous-carbonic fluid inclusions [12] white mica, chlorite, and fluid inclusion P-T evolutions suggesting a high fluid pressure gradient [10]. GrovesThese features are consistent with the orogenic gold model, as stated by many authors [78,79,80,81,82,83,84,85,86,87,88]. Orogenic gold deposits are developed in areas with moderate to high temperatures and low-to-moderate pressure metamorphism [89], which could be commonly associated with large volumes of granitic melts [80] typical of granitoid-hosted orogenic gold deposits [81,90], as in the case of AFMP. The orogenic gold model has structural control in faults and shear zones as its principal footprint, mainly in second or third-order shear zones, as in the case of the NE-trending subsidiary shear zone in the Paraíba deposit.
Paleoproterozoic orogenic belts are extremely complex and commonly host different types of gold deposits, which can originate from overprinted events, thereby generating controversies about their origin. The evidence gathered at the Paraíba deposit suggests that the magmatic-hydrothermal system (Group 2) associated with Cu-Mo-rich breccias and veinlets is superimposed on the orogenic gold event. Among this evidence is the following: (a) petrographic evidence showing Wm–1 (Group 1) superimposed by Wm–3, Chl–3, calcite, and Ep–1 (Group 2); (b) SisuCHEMA-based evidence of sulfide-rich quartz veinlets of Group 1, associated with Wm–2 and Chl–2, superimposed by propylitic alteration, (Chl–3) and followed by pervasive epidote-breccia alteration (Ep–2 and Ep–3) of Group 2; and (c) reflectance spectroscopical evidence of high variability in the crystallinity and composition of white mica, even in short-depth intervals of boreholes.
The Cu-Mo rich magmatic-hydrothermal system (Group 2) could be related to the Cu-Mo or Cu-Au-Mo porphyry models, as proposed by Mesquita et al. [10]. The lack of accurate ore ages in the AFMP hinders this discussion, but the available data indicate that the Paraíba deposit has two principal host rocks: the Paraíba tonalite (2.014 Ga, zircon U-Pb SHRIMP; [12]) and the syenogranite porphyry (ca. 1.79 Ga; [54]). The Au-rich quartz vein and phyllonites are hosted in the Paraíba tonalite, where the ore (pyrite) age is 1.814 Ga (pyrite Pb-Pb; [91]), which is older than the syenogranite porphyry. The porphyry cuts the shear foliation and gold-quartz veins and is associated with brecciated zones and diverse hydrothermal alterations (calcic, potassic, phyllic, propylitic, and epidote). Moreover, it hosts disseminated and veinlet-type Cu-Mo mineralization, whose age is 1.787 Ga (molybdenite: Re-Os; [54].
Furthermore, Assis et al. [13] suggest a Statherian metallogenetic event (ca. 1.80-1.78 Ga) correlated with felsic magmatism in the AFMP, with the volcanic rocks and granitoids generated at the same age. Despite the wide range of mineralization, the Au-Cu-Mo disseminated-type deposits have a more restricted occurrence, between 1.79–1.78 Ga (1787 ± 3.2 Ma, molybdenite, and pyrite Re-Os weighted average model age; [13]), and are closely associated with porphyry-like rocks [13,54].
In the vast majority of Cu-Mo porphyry deposits, epidote-chlorite alteration zones lie in the periphery of the system [24,92,93]. However, at the Paraíba deposit, epidote occurs both on the periphery, mainly associated with the typical propylitic assemblages, and proximal to the Cu-Au mineralization breccia. This atypical epidote alteration related to Cu and Mo was also observed by Cao et al. [94] in the giant Pulang porphyry Cu-Au district, China. The Pulang porphyry has hydrothermal alteration zones very similar to those described as a magmatic-hydrothermal system (Cu-Mo porphyry system) in the Paraíba deposit. According to Cao et al. [94], the atypical relationship between epidote-rich alterations in Pulang may be due to two factors, which are fully applicable to the Paraíba deposit as well: (i) there is another porphyry deposit nearby, and their fluids have overprinted epidote-rich alterations onto pre-existing Cu and Mo mineralizations, and/or (ii) ore fluids have removed Ca and Fe and collapsed onto the potassic alteration zone, overprinting it with high amounts of epidote. In the Paraíba deposit, the Paraíba tonalite (host rock), mafic bodies, and the high availability of carbonates, as well as Mg chlorite and white micas in the shear-hydrothermal system (orogenic gold system), could have contributed Ca, Fe, and Mg to the porphyry system.
5.3. Implications for Mineral Exploration
Based on the main spectral parameters and mineral chemical data, Figure 14 suggests some footprints and vectors for the mineral exploration of orogenic gold and superimposed Cu-Mo porphyry systems for the Paraíba deposit. The data are ordered according to the relative distance (distal to proximal) to the mineralized zones.

Figure 14.
Hypothetical representation of footprints and vectors for the mineral exploration of orogenic gold and Cu-Mo porphyry systems in the Paraíba deposit. (a) Orogenic gold system: hydrothermal system related to the NE-trending shear zone. Main vectoring minerals and their compositional and crystallinity variations according to proximal or distal zones. (b) Cu-Mo porphyry system: magmatic-hydrothermal. Main vectoring minerals and their compositional and crystallinity variations according to proximal or distal zones. Chl: chlorite; Ms: muscovite; Ms-Phg: white mica with intermediate composition muscovite-phengite; Wm: white mica. The terms Wm–1, –2, –3, –4, and –5 and Chl–1, Chl–2, and Chl–3 refer to groups of white mica and chlorite studied in the Paraíba deposit.
In the orogenic gold system (Figure 14a), the Wm–1 of the distal illitic zone has a typical Al-rich muscovite composition (Al-OH absorption range: 2198–2207 nm) and a low crystallinity (CI values < 4; illite to illite/smectite crystallinity). The characteristic composition and crystallinity differentiate Wm–1 from all other white mica groups, including those from the Cu-Mo porphyry system. Wm–2, spatially associated with high Au grades in the orogenic gold system, displays a composition varying from muscovite-phengite to phengite (Al-OH absorption range: 2210–2225 nm). The crystallinity of Wm–2 is not a good proxy due to its large variability (CI range: 1 to 15). However, there is a subtle tendency for higher crystallinities of the Wm–2 samples to be correlated with high Au grades (Figure 11e). Wm–2 occurs associated with Chl–1 and Chl–2 in the chloritic alteration zone. The composition of Chl–1 and Chl–2 is intermediate Mg-Fe, with a tendency towards a higher Mg content (Mg-OH absorption range: 2331–2340 nm). There are no spectral differences between Chl–1 and Chl–2. The EMPA-derived data of white mica also constitute a proxy for the high Au grades of the orogenic gold system, showing an increase in Si and Mg, and a decrease in Al and Fe. The Mg/Fe ratio also presents an increase from Wm–1 to Wm–2 (Figure 14a).
Figure 14b shows the vectors for the Cu-Mo porphyry system. Wm–4, spatially associated with the Cu-Mo-rich ore stage “2” (Figure 13), presents a higher abundance, phengite composition (Al-OH absorption range: 2213–2224 nm), and a high crystallinity (CI values: 4–15) (Figure 11d–f). There are no spectral differences between this Wm–4 and the Wm–2 of the orogenic gold system (both related to ore 2 and 1, respectively), except that Wm–2 may have lower crystallinity. However, the Si content in Wm–4 is higher than in Wm–2. As observed for the orogenic gold system, the EMPA-derived data for Wm–4 also show an increase in Si, Mg, and the Mg/Fe ratio, and a decrease in Al and Fe (Figure 14b). There is also an increase in epidote in the ore zone. Wm–3 and Wm–5, associated with barren and intermediate-distal zones, vary from being Al-rich to poor and consisting of muscovite to intermediate muscovite-phengite (Wm–3: 2207–2215 nm; Wm–5: 2212–2214 nm). The Fe-rich Chl–3 (Mg-OH absorption range: 2340–2344 nm) marks a distal and typical propylitic alteration.
6. Final Remarks
This work has revealed an overlapping of two different mineralization processes in the Paraíba deposit, referenced here as the orogenic gold system (associated with the shear-foliated alteration Group 1) and the Cu-Mo porphyry system (associated with the non-foliated alteration Group 2). The orogenic gold system is connected with a dextral shear zone and related to gold-rich quartz veins and veinlets in phyllonites and mylonites. The Cu-Mo porphyry system is related to a porphyritic syenogranite intrusion and the subsequent generation of several hydrothermal alteration zones, hydrothermal breccias, and Cu-Mo-Au mineralization.
The Paraíba deposit was previously investigated by several researchers using only conventional techniques, but none of them identified the overlapping of two different hydrothermal systems. The reflectance spectroscopy and SisuCHEMA analyses, applied in a systematic and detailed way through the boreholes and integrated with conventional techniques (petrography, SEM, EMPA, and core logging), were crucial to unveiling the overlapped alteration zones. This study is the first of its kind applied in a complex Paleoproterozoic deposit in the Alta Floresta Mineral Province, Brazil. The results revealed the alteration footprints of the Paraíba deposit and provided a mineral guide to exploration targeted at a district scale.
Reflectance spectroscopy is a well-established technique that is generally accepted by researchers and prospectors due to its ability to quickly determine the relative abundance, composition, and crystallinity of some fine-grained minerals found in hydrothermal systems. However, numerous publications using this technique are related to deposits with simple alteration zones and without polyphase overprinting. Furthermore, when applied by inexperienced users and/or research devoid of support from conventional studies, this method may yield inaccurate information and lead to confusing decisions regarding mineral exploration and production. In this sense, the isolated use of this technique seems insufficient to map overlapping alteration zones. This study reveals that some different white mica groups associated with different events can have similar mineral compositions and crystallinities. Therefore, attempts to separate different mineral groups using only spectral data must be undertaken carefully, especially in complex Paleoproterozoic terranes. To solve the matter, coupled spectral and conventional solution methods can be used to generate useful mineralogical information for exploratory vectoring.
Supplementary Materials
The following supporting information can be downloaded at: https://www.mdpi.com/article/10.3390/min12101327/s1, The Supplementary Tables S1–S4 are related to complete results of mineral chemistry from EMPA in white mica, biotite, chlorite, and epidote, respectively.
Author Contributions
Conceptualization, L.P. and D.F.D.; Methodology, L.P., D.F.D., M.J.M. and C.R.d.S.F.; Validation, L.P., D.F.D., I.C.M. and M.J.M.; Formal Analysis, L.P., D.F.D., M.J.M. and M.E.B.G.; Investigation, L.P., D.F.D., M.J.M., I.C.M., M.E.B.G. and C.R.d.S.F.; Resources, D.F.D. and C.R.d.S.F.; Writing—Original Draft Preparation, L.P., D.F.D. and C.R.d.S.F.; Writing—Review & Editing, L.P., D.F.D., M.J.M., I.C.M., M.E.B.G. and C.R.d.S.F.; Visualization, L.P., D.F.D. and M.J.M.; Supervision, D.F.D.; Project Administration, D.F.D.; Funding Acquisition, D.F.D. All authors have read and agreed to the published version of the manuscript.
Funding
This work was supported by the Fundação de Amparo à Pesquisa do Estado de São Paulo (FAPESP) (Proc. Nº 2016/04370-5), the Institute of Geosciences of the UNICAMP, and by a scholarship granted to L.P. by the Coordenação de Aperfeiçoamento de Pessoal de Nível Superior (CAPES). C.R.S.F. acknowledges the Brazilian National Council for Scientific and Technological Development (CNPq) for the research grant (Nr: 309712/2017-3).
Acknowledgments
The authors thank Rogério Moreno, Alan Brunelli, and Guilherme Passaneli from the PA Gold Mineração Company for providing drill core samples and geochemical data from the Paraíba deposit. The authors also thank Professor Celio Pasquini and Cristiane Vidal at the Institute of Chemistry of the University of Campinas for access and assistance with the SisuCHEMA instrument. João Gabriel Motta is also acknowledged for revising an early version of the manuscript. L.P. thanks the geologist María Celeste Bonacci for the enormous help provided throughout this work.
Conflicts of Interest
The authors declare no conflict of interest.
References
- Paes de Barros, A.J. Granitos da Região de Peixoto de Azevedo—Novo Mundo e Mineralizações Auríferas Relacionadas—Província Aurífera Alta Floresta (MT). Ph.D. Thesis, Instituto de Geociências, Universidade Estadual de Campinas, Campinas, Brazil, 2007; 154p. [Google Scholar]
- Crusader 2018. Brazilian Gold Clear Path to Production & Committed to Building Value. Available online: https://www.investi.com.au/api/announcements/brv/6fc29655-02d.pdf (accessed on 16 October 2022).
- Paes de Barros, A.J. Contribuição a Geologia e Controle das Mineralizações Auríferas de Peixoto de Azevedo-MT. Master’s Thesis, Instituto de Geociências, Universidade de São Paulo, São Paulo, Brazil, 1994; 145p. [Google Scholar]
- Siqueira, A.J.B. Geologia da Mina de Ouro Filão do Paraíba, Região de Peixoto de Azevedo, Norte de Mato Grosso. Master’s Thesis, Instituto de Geociências, Universidade Federal do Rio de Janeiro, Rio de Janeiro, Brazil, 1997; 98p. [Google Scholar]
- Mesquita, M.J.; Teixeira, R.; Trevisan, V.; Xavier, R.; Assis, R.; Quispe, P.; Moretti, M.; Agnoletto, E.; Paes de Barros, A.; Miguel, E., Jr. Gold deposits in ductile shear zone of the Paleoproterozoic Alta Floresta Province (Brazil). In Proceedings of the 13th Society for Geology Applied to Mineral Deposits, Nancy, France, 24–27 August 2015. [Google Scholar]
- Pimenta, V.A. Alteração Hidrotermal e Deformação no Depósito do Peteca, Província Aurífera de Alta Floresta (PAAF), Região de Peixoto de Azevedo-MT. Master’s thesis, Institute of Geosciences, UNICAMP, Campinas, Brazil, 2018; 152p. [Google Scholar]
- Santos, J.O.S.; Groves, D.I.; Hartmann, A.; Moura, M.A.; McNaughton, N.J. Gold deposits of the Tapajós and Alta Floresta domains, Tapajós-Parima orogenic belt, Amazon Craton, Brazil. Miner. Depos. 2001, 36, 278–299. [Google Scholar] [CrossRef]
- Moreton, L.C.; Martins, E.G. Geologia e Recursos Minerais de Alta Floresta. Vila Guarita. Escala 1:250.000; Serviço Geológico do Brasil/CPRM: Brasília, Brazil, 2005; 68p. [Google Scholar]
- Silva, M.G.; Abram, M.B. Projeto Metalogenia da Província Aurífera Juruena-Teles Pires, Mato Grosso; Serviço Geológico Brasileiro, CPRM: Oiânia, Brazil, 2008; 212p. [Google Scholar]
- Mesquita, M.J.; Gomes, M.E.B.; Moreira, I.C.; Paes, R.A.S.; Martins, H.E.S.; Matos, J.H.; Ruggiero, A.; Primo, G.M.A.; Ducart, D.F.; Poggi, L.; et al. Paleoproterozoic Gold Deposits at Alta Floresta Mineral Province, Brazil: Two Overprinted Mineralising Events? Geological Society, Special Publications: London, UK, 2022; Volume 516, p. SP516-2021-64. [Google Scholar] [CrossRef]
- Moura, M.A.; Botelho, N.F.; Olívio, G.R.; Kyser, T.K. Granite-related Paleoproterozoic, Serrinha gold deposit, Southern Amazonia, Brazil: Hydrothermal alteration, fluid inclusion and stable isotope constraints on genesis and evolution. Econ. Geol. 2006, 101, 585–605. [Google Scholar] [CrossRef]
- Trevisan, V.G. Estudo Comparativo Entre Mineralizações Filonares de Au ± Cu e Au + Metais de base do Setor Leste da Província de Alta Floresta (MT), Cráton Amazônico. Master’s Thesis, Instituto de Geociências, UNICAMP, Campinas, Brazil, 2015; 129p. [Google Scholar]
- Assis, R.R.; Xavier, R.P.; Creaser, R.A. Linking the Timing of Disseminated Granite-Hosted Gold-Rich Deposits to Paleoproterozoic Felsic Magmatism at Alta Floresta Gold Province, Amazon Craton, Brazil: Insights from Pyrite and Molybdenite Re-Os Geochronology. Econ. Geol. 2017, 112, 1937–1957. [Google Scholar] [CrossRef]
- Assis, R.R. Depósitos Auríferos Associados ao Magmatismo Granítico do Setor Leste da Província de Alta Floresta (MT), Cráton Amazônico: Tipologia das Mineralizações, Modelos Genéticos e Implicações Prospectivas. Master’s Thesis, Institute of Geosciences, UNICAMP, Campinas, Brazil, 2011; p. 474. (In Portuguese). [Google Scholar]
- Assis, R.R. Depósitos Auríferos Associados ao Magmatismo Félsico da Província de Alta Floresta (MT), Cráton Amazônico: Idade das Mineralizações, Geoquímica e Fonte dos Fluidos. Doctorate’s Thesis, Institute of Geociences, UNICAMP, Campinas, Brazil, 2015; 363p. [Google Scholar]
- Moreira, I.C. Petrogênese dos Granitóides do Depósito Paraíba, Domínio Peixoto de Azevedo, Província Aurífera de alta Floresta, Cráton Amazonas. Master’s Thesis, Institute of Geociences, UNICAMP, Campinas, Brazil, 2019; 92p. [Google Scholar]
- Hauff, P.L.; Kruse, F.A.; Madrid, R.J. Gold exploration using illite polytypes defined by X-ray diffraction and reflectance spectroscopy: Gold Forum on Technology and Practices. In Proceedings of the “World Gold 89”, Society for Mining, Metallurgy and Exploration, Littleton, CO, USA, 1989; pp. 76–82. [Google Scholar]
- Tappert, M.; Rivard, B.; Giles, D.; Tappert, R.; Mauger, A. Automated drill core logging using visible and near-infrared reflectance spectroscopy: A case study from the Olympic Dam IOCG deposit, South Australia. Econ. Geol. 2011, 106, 289–296. [Google Scholar] [CrossRef]
- Laukamp, C.; Cudahy, T.; Cleverly, J.S.; Oliver, N.H.S.; Hewson, R. Airborne hyperspectral imaging of hydrothermal alteration zones in granitoids of the Eastern fold belt, Mount Isa inlier, Australia. Geochem. Explor. Environ. Anal. 2011, 11, 3–24. [Google Scholar] [CrossRef]
- Roache, T.J.; Walshe, J.L.; Huntington, J.F.; Quigley, M.A.; Yang, K.; Bil, B.W.; Blake, K.L.; Hyvärinen, T. Epidote-clinozoisite as hyperspectral tool in exploration for Archean gold. Aust. J. Earth Sci. 2011, 58, 813–822. [Google Scholar] [CrossRef]
- Alva-Jimenez, T.; Tosdal, R.M.; Dilles, J.H.; Dipple, G.; Kent, A.J.R.; Halley, S. Chemical Variations in Hydrothermal White Mica Across the Highland Valley Porphyry Cu-Mo District, British Columbia, Canada. Econ. Geol. 2020, 115, 903–926. [Google Scholar] [CrossRef]
- Clark, R.N. Spectroscopy of Rocks and Minerals, and Principles of Spectroscopy. In Remote Sensing for the Earth Sciences: Manual of Remote Sensing, 3rd ed.; Geological Survey Denver: Denver, CO, USA, 1999; Volume 3, Chapter 1. [Google Scholar]
- Hook, S.; Abbott, E.; Grove, C.; Kahle, A.; Palluconi, F. Multispectral thermal infrared in geologic studies. In Manual of Remote Sensing; Rencz, A., Ed.; John Wiley & Sons, Inc.: New York, NY, USA, 1999; pp. 59–110. [Google Scholar]
- Sillitoe, R.H. Porphyry copper systems. Econ. Geol. 2010, 105, 3–41. [Google Scholar] [CrossRef]
- Halley, S.; Dilles, J.H.; Tosdal, R.M. Footprints: Hydrothermal alteration and geochemical dispersion around porphyry copper deposits. Soc. Econ. Geol. Newsl. 2015, 100, 1–29. [Google Scholar] [CrossRef]
- Chmielowski, R.M.; Jansson, N.; Fjellerad Persson, M.; Fagerström, P. 3D modelling of hydrothermal alteration associated with VHMS deposits in the Kristineberg area, Skellefte district, northern Sweden. Miner. Depos. 2016, 51, 113–130. [Google Scholar] [CrossRef]
- Neal, L.C.; Wilkinson, J.J.; Mason, P.J.; Chang, Z. Spectral characteristics of propylitic alteration minerals as a vectoring tool for porphyry copper deposits. J. Geochem. Explor. 2018, 184, 179–198. [Google Scholar] [CrossRef]
- Van der Meer, F. Analysis of spectral absorption features in hyperspectral imagery. Int. J. Appl. Earth Obs. Geoinf. 2004, 5, 55–68. [Google Scholar] [CrossRef]
- Reyes, A.G. Petrology of Philippine geothermal systems and the application of alteration mineralogy to their assessment. J. Volcanol. Geotherm. Res. 1990, 43, 279–309. [Google Scholar] [CrossRef]
- Mathieu, M.; Roy, R.; Launeau, P.; Cathelineau, M.; Quirt, D. Alteration mapping on drill cores using a HySpex SWIR-320m hyperspectral camera: Application to the exploration of an unconformity-related uranium deposit (Saskatchewan, Canada). J. Geochem. Explor. 2017, 172, 71–88. [Google Scholar] [CrossRef]
- Graham, G.E.; Kokaly, R.F.; Kelley, K.D.; Hoefen, T.M.; Johnson, M.R.; Hubbard, B.E. Application of imaging spectroscopy for mineral exploration in Alaska: A study over porphyry Cu deposits in the Eastern Alaska Range. Econ. Geol. 2018, 113, 489–510. [Google Scholar] [CrossRef]
- Santos, J.O.S.; Hartmann, L.A.; Gaudette, H.E.; Groves, D.I.; McNaughton, N.J.; Fletcher, I.R. A New Understanding of the Provinces of the Amazon Craton Based on Integration of Field Mapping and U-Pb and Sm-Nd Geochronology. Gondwana Res. 2000, 3, 453–488. [Google Scholar] [CrossRef]
- Lacerda Filho, J.V.; Abreu Filho, W.; Valente, C.R.; Oliveira, C.C.; Albuquerque, M.C. Geologia e Recursos Minerais do Estado de Mato Grosso (Escala 1:1.000.000); Mapa; Convênio entre Secretaria de Estado de Indústria, Comércio, Minas e Energia (SICME-MT) e Serviço Geológico do Brasil (CPRM-Goiânia): Goiânia, Brazil, 2004; 200p. [Google Scholar]
- Vasquez, M.L.; Rosa-Costa, L.T. Geologia e Recursos Minerais do Estado do Pará (Escala 1:1.000.000); Mapa; Serviço Geológico do Brasil (CPRM-Belém): Belén, Brazil, 2008; 328p. [Google Scholar]
- Quispe, P.E. Geologia, Geoquímica e Geocronologia dos Granitoides Foliados e Rochas Subvulcânicas da Região de Peixoto de Azevedo, Setor Leste da AFGP, MT. Master’s Thesis, Institute of Geosciences, UNICAMP, Campinas, Brazil, 2016. [Google Scholar]
- Silva, F.R. Geoquímica e Geocronologia U-Pb (SHRIMP) de Granitos da Região de Peixoto de Azevedo—Província Aurífera de Alta Floresta–MT. Master’s Thesis, Universidade Federal de Mato Grosso, Cuiabá, Brasil, 2014; 82p. [Google Scholar]
- Tassinari, C.C.G.; Macambira, M.J.B. Geochronological Provinces of the Amazonian Craton. Episodes 1999, 22, 174–182. [Google Scholar] [CrossRef]
- Santos, J.O.S. Os Terrenos Paleoproterozóicos da Província do Tapajós e as Mineralizações de Ouro Associadas. Ph.D. Thesis, Universidade Federal do Rio Grande do Sul, Porto Alegre, Brazil, 2000; 208p. [Google Scholar]
- Alves, C.L.; Rizzotto, G.J.; Rios, F.S.; Sant’Ana, M.A.B. The Orosirian Cuiú-Cuiú arc in Peixoto de Azevedo domain, Southern of Amazonian craton. J. South Am. Earth Sci. 2020, 102, 102648. [Google Scholar] [CrossRef]
- Miguel, E., Jr. Mineralizações auríferas do Lineamento Peru-Trairão, Província Aurífera de Alta Floresta-MT: Controle Estrutural e Idade U-Pb das Rochas Hospedeiras. Master’s Thesis, Institute of Geosciences, UNICAMP, Campinas, Brazil, 2011; p. 81. (In Portuguese). [Google Scholar]
- Dezula, S.E.M.; Barros, M.A.S.A.; Pierosan, R.; Santos, J.O.S.; Assis, R.R. Granito Aragão—Suíte intrusiva Nhandú—Um granito oxidado, tipo A2, de 1967 a 1964 Ma na Província Aurífera Alta Floresta—Cráton Amazônico. Geologia USP. Série Científica 2018, 18, 3–20. [Google Scholar] [CrossRef]
- Barros, M.A.S.; Barros, A.J.P.; Santos, J.O.S.; Rocha, M.L.B.P. Extension of the Tapajós domains to the Alta Floresta gold province: Evidence from U-Pb SHRIMP ages of the Nhandu intrusive suite at 1962 and 1967 Ma; 14◦ Simpósio de Geologia da Amazônia, Belém: Pará, Brasil, 2015. (In Portuguese) [Google Scholar]
- Moura, M.A. Omaciço Granítico Matupá no Depósito de ouro Serrinha (MT): Petrologia, Alteração Hidrometal e Metalogenia. Ph.D. Thesis, Institute of Geosciences, Universidade de Brasília, Brasília, Brazil, 1998; 238p. [Google Scholar]
- Rocha, M.L.B.P.; Junior, F.C.; Santos, J.O.S.; Sant’Ana, M.A.B.; Pinho, F.E.C.; Neal, J.M.; da Costa, P.C.; Roberts, C. U-Th-Pb Shrimp dating of hydrothermal monazite from the Trairão Gold Deposit—Alta Floresta Gold Province (Amazon Craton). Braz. J. Geol. 2020, 50. [Google Scholar] [CrossRef]
- Pinho, M.A.S.B.; Chemale, F., Jr.; Van Schumus, W.R.; Pinho, F.E.C. U-Pb and Sm-Nd evidence for 1.76–1.77 Ga magmatism in the Moriru region, Mato Grosso, Brazil: Implications for province boundaries in the SW Amazon Craton. Precambrian Res. 2003, 126, 1–25. [Google Scholar] [CrossRef]
- Duarte, T.B.; Rodrigues, J.B.; Ribeiro, P.S.E.; Scandolara, J.E. Tectonic evolution of the Juruena magmatic arc between the Aripuanã and Juruena rivers: Northwest Mato Grosso State, Brazil. Braz. J. Geol. 2012, 42, 824–840. [Google Scholar] [CrossRef]
- Scandolara, J.E.; Correa, R.T.; Fuck, R.A.; Souza, V.S.; Rodrigues, J.B.; Ribeiro, P.S.E.; Frasca, A.A.S.; Saboia, A.M.; Lacerda Filho, J.V. Paleo-Mesoproterozoic arc accretion along the southwestern margin of the Amazonian craton: The Juruena accretionary orogen and possible implications for Columbia supercontinent. J. South Am. Earth Sci. 2017, 73, 223–247. [Google Scholar] [CrossRef]
- Rizzotto, G.J.; Alves, C.L.; Rios, F.S.; Barros, M.A.D.S.A. The Nova Monte Verde metamorphic core complex: Tectonic implications for the southern Amazonian craton. J. South Am. Earth Sci. 2019, 91, 154–172. [Google Scholar] [CrossRef]
- Rizzotto, G.J.; Alves, C.L.; Rios, F.S.; Barros, M.A.D.S.A. The Western Amazonia Igneous Belt. J. South Am. Earth Sci. 2019, 96, 102326. [Google Scholar] [CrossRef]
- Alves, C.L.; Rizzotto, G.J.; Rios, F.S.; Gonçalves, G.F. Áreas de Relevante Interesse Mineral: Projeto Evolução Crustal e Metalogenia da Província Mineral Juruena-Teles-Pires; CPRM Serviço Geológico do Brasil: Brasília, Brazil, 2019; p. 231. (In Portuguese) [Google Scholar]
- Souza, J.P.; Frasca, A.A.S.; Oliveira, C.C. Geologia e Recursos Minerais da Província Mineral de Alta Floresta; Relatório Integrado; Serviço Geológico Brasileiro, CPRM: Brasília, Brazil, 2005; 164p. [Google Scholar]
- Leite, J.A.D.; Saes, G.S. Geocronologia Pb/Pb de zircões detríticos e análise estratigráfica das coberturas sedimentares proterozóicas do Sudoeste do Cráton Amazônico. Geol. USP Sér. Cien. 2003, 3, 113–127. [Google Scholar] [CrossRef][Green Version]
- Trevisan, V.G.; Xavier, R.; Assis, R.R.; Bartolomeu, J.O.; Matos, J.H.S.N.; Mesquita, M.J. Paleoproterozoic porphyry-related Au-(Cu, Mo) systems in the Alta Floresta Gold Province, southern Amazonian Craton, Brazil: The case of the X1 and Paraíba deposits. In Proceedings of the 14th Biennial Meeting 2017, Quebec City, QC, Canada, 20–23 August 2017. [Google Scholar]
- Trevisan, V.G.; Xavier, R.P.; Hagemann, S.; Kemp, A.; Loucks, R.; Gao, J.-F. Geology setting and metallogenesis of the Alta Floresta Province, southern Amazon Craton (Brazil). In Proceedings of the 15th Biennial SGA Meeting, Glasgow, UK, 27–30 August 2019; Volume 3, pp. 1109–1112. [Google Scholar]
- Kokaly, R.F.; Clark, R.N.; Swayze, G.A.; Livo, K.E.; Hoefen, T.M.; Pearson, N.C.; Wise, R.A.; Benzel, W.M.; Lowers, H.A.; Driscoll, R.L.; et al. USGS Spectral Library Version 7: US Geological Survey Data Series; USGS: Denver, CO, USA, 2017; Volume 1035, 61p. [Google Scholar] [CrossRef]
- Haest, M.; Cudahy, T.; Laukamp, C.; Gregory, S. Quantitative mineralogy from infrared spectroscopic data. I. Validation of mineral abundance and composition scripts at the Rocklea channel iron deposit in Western Australia. Econ. Geol. 2012, 107, 209–228. [Google Scholar] [CrossRef]
- Prado, E.M.G.; Silva, A.M.; Ducart, D.F.; Toledo, C.L.B.; de Assis, L.M. Reflectance spectroradiometry applied to a semi-quantitative analysis of the mineralogy of the N4ws deposit, Carajás Mineral Province, Pará, Brazil. Ore Geol. Rev. 2016, 78, 101–119. [Google Scholar] [CrossRef]
- Clark, R.N.; King, T.V.V.; Klejwa, M.; Sways, G.A. High spectral resolution reflectance spectroscopy of minerals. J. Geophys. Res. 1990, 95, 12653–12680. [Google Scholar] [CrossRef]
- Duke, E.F. Near infrared spectra of muscovite, Tschermak substitution, and metamorphic reaction progress: Implications for remote sensing. Geology 1994, 22, 621–624. [Google Scholar] [CrossRef]
- Guidotti, C.V. Micas in metamorphic rocks. In Micas, Reviews in Mineralogy; Bailey, S.W., Ed.; Mineralogical Society of America: Chantilly, VA, USA, 1984; Volume 13, pp. 357–467. [Google Scholar]
- Miyashiro, A.; Shido, F. Tschermak Substitution in Low- and Middle-grade Pelitic Schists. J. Petrol. 1985, 26, 449–487. [Google Scholar] [CrossRef]
- Herrmann, W.; Blake, M.D.; Doyle, M.G.; Huston, D.L.; Kamprad, J.; Merry, N.; Pontual, S. Short wavelength infrared (SWIR) spectral analysis of hydrothermal alteration zones associated with base metal sulfide deposits at Rosebery and Western Tharsis, Tasmania, and Highway-Reward, Queensland. Econ. Geol. 2001, 96, 939–955. [Google Scholar] [CrossRef]
- Guggenheim, S.; Bain, D.C.; Bergaya, F.; Brigatti, M.F.; Drits, V.A.; Eberl, D.D.; Formoso, M.L.L.; Galan, E.; Merriman, R.J.; Peacor, D.R.; et al. Order, disorder and crystallinity in phyllosilicates and the use of the “Crystallinity Index”. Report of the association Internationale pour l’Etude des Argiles (AIPEA). Clay Miner. 2002, 37, 389–393. [Google Scholar] [CrossRef]
- Doublier, M.P.; Roache, T.; Potel, S. Short-wavelength infrared spectroscopy: A new petrological tool in low-grade to very low-grade pelites. Geology 2010, 38, 1031–1034. [Google Scholar] [CrossRef]
- Kamps, O.M.; Ruitenbeek, F.J.A.; Mason, P.R.D.; Van der Meer, F.D. Near-Infrared Spectroscopy of Hydrothermal versus Low-Grade Metamorphic Chlorites. Minerals 2018, 8, 259. [Google Scholar] [CrossRef]
- Yang, M.; Ye, M.; Han, H.; Ren, G.; Han, L.; Zhang, Z. Near-infrared spectroscopic study of chlorite minerals. J. Spectrosc. 2018, 2018, 6958260. [Google Scholar] [CrossRef]
- Lypaczewski, P.; Rivard, B. Estimating the Mg# and AlVI content of biotite and chlorite from shortwave infrared reflectance spectroscopy: Predictive equations and recommendations for their use. Appl. Earth Obs. Geoinf. 2018, 68, 116–126. [Google Scholar]
- Boardman, J.W.; Kruse, F.A.; Green, R.O. Mapping target signatures via partial unmixing of AVIRIS data. In Summaries of the Fifth Annual JPL Airborne Earth Science Workshop. 1: AVIRIS Workshop; JPL: Pasadena, CA, USA, 1995; pp. 23–26. [Google Scholar]
- Guidotti, C.V. Compositional variation of muscovite in medium- to high-grade metapelites of northwestern Maine. Am. Mineral. 1987, 63, 878–884. [Google Scholar]
- Tappert, M.C.; Rivard, B.; Giles, D.; Tappert, R.; Mauger, A.J. The mineral chemistry, near-infrared, and mid-infrared reflectance spectroscopy of phengite from the Olympic Dam IOCG deposit, South Australia. Ore Geol. Rev. 2013, 53, 26–38. [Google Scholar] [CrossRef]
- Foster, M.D. Interpretation of the Composition and a Classification of the Chlorites; US Geological Survey Professional Paper 414-A; US Geological Survey: Washington, DC, USA, 1962; 33p. [Google Scholar]
- Bourdelle, F.; Cathelineau, M. Low-temperature chlorite geothermometry: A graphical representation based on a T–R2+ –Si diagram. Eur. J. Mineral. 2015, 27, 617–626. [Google Scholar] [CrossRef]
- Wiewióra, A.; Weiss, Z. Crystallochemical classifications of phyllosilicates based on the unified system of projection of chemical composition: II The chlorite group. Clay Miner. 1990, 25, 8392. [Google Scholar] [CrossRef]
- Kartashov, P. Clasification diagram for REE-bearing members of the epidote group based on crystallochemical data. In Workshop on Accessory Minerals; Univ Warsaw: Warsaw, Poland, 2014; pp. 19–21. [Google Scholar]
- Deer, W.A.; Howie, R.A.; Zussman, J. An Introduction to Rock-Forming Minerals, 2nd ed.; Longman Scientific & Technical: Essex, UK, 1992; 696p. [Google Scholar]
- Bourdelle, F.; Parra, T.; Chopin, C.; Beyssac, O. A new chlorite geothermometer for diagenetic to low-grade meta- morphic conditions. Contrib. Mineral. Petrol. 2013, 165, 723–735. [Google Scholar] [CrossRef]
- Jefferies, S.P.; Holdsworth, R.E.; Wibberley, C.A.J.; Shimamoto, T.; Spiers, C.J.; Niemeijer, A.R.; Lloyd, G.E. The nature and importance of phyllonite development in crustal-scale fault cores: An example from the Median Tectonic Line, Japan. J. Struct. Geol. 2006, 28, 220–235. [Google Scholar] [CrossRef]
- Sibson, R.H.; Robert, F.; Poulsen, K.H. High-angle reverse faults, fluid-pressure cycling, and mesothermal gold-quartz deposits. Geology 1988, 16, 551–555. [Google Scholar] [CrossRef]
- Groves, D.; Goldfarb, R.; Gebre-Mariam, M.; Hagemann, S.; Robert, F. Orogenic gold deposits: A proposed classification in the context of their crustal distribution and relationship to other gold deposit types. Ore Geol. Rev. 1998, 13, 7–27. [Google Scholar] [CrossRef]
- Groves, D.I.; Goldfarb, R.J.; Robert, F.; Hart, C.J.R. Gold deposits in metamorphic belts: Overview of current understanding, outstanding problems, future research, and exploration significance. Econ. Geol. 2003, 98, 1–29. [Google Scholar]
- Hagemann, S.; Cassidy, K.F. Archean orogenic lode gold deposits. In Gold in 2000 (Reviews in Economic Geology); Hagemann, S.G., Brown, P.E., Eds.; Society of Economic Geologists: Littleton, CO, USA, 2000; Volume 13, pp. 9–68. [Google Scholar] [CrossRef]
- Robert, F.; Poulsen, K.H. Vein formation and dformation in greenstone gold deposits. Rev. Econ. Geol. 2001, 14, 111–155. [Google Scholar] [CrossRef]
- Goldfarb, R.J.; Groves, D.I.; Gardoll, S. Orogenic gold and geologic time: A global synthesis. Ore Geol. Rev. 2001, 18, 1–75. [Google Scholar] [CrossRef]
- Goldfarb, R.J.; Groves, D.I. Orogenic gold: Common or evolving fluid and metal sources through time. Lithos 2015, 233, 2–26. [Google Scholar] [CrossRef]
- Deng, J.; Yang, L.-Q.; Li, R.-H.; Groves, D.I.; Santosh, M.; Wang, Z.-L.; Sai, S.-X.; Wang, S.-R. Regional structural control on the distribution of world-class gold deposits: An overview from the Giant Jiaodong Gold Province, China. Geol. J. 2018, 54, 378–391. [Google Scholar] [CrossRef]
- Groves, D.I.; Santosh, M.; Goldfarb, R.J.; Zhang, L. Structural geometry of orogenic gold deposits: Implications for exploration of world-class and giant deposits. Geosci. Front. 2018, 9, 1163–1177. [Google Scholar] [CrossRef]
- Groves, D.I.; Santosh, M.; Deng, J.; Wang, Q.; Yang, L.; Zhang, L. A holistic model for the origin of orogenic gold deposits and its implications for exploration. Miner. Depos. 2020, 55, 275–292. [Google Scholar] [CrossRef]
- Groves, D.I.; Santosh, M.; Zhang, L. A scale-integrated exploration model for orogenic gold deposits based on a mineral system approach. Geosci. Front. 2020, 11, 719–738. [Google Scholar] [CrossRef]
- Powell, R.; Will, T.M.; Phillips, G.N. Metamorphism in Archean greenstone belts: Calculated fluid compositions and implications for gold mineralization. J. Metamorph. Geol. 1991, 9, 141–150. [Google Scholar] [CrossRef]
- Cassidy, K.F.; Groves, D.; Mcnaughton, N. Late-Archaean granitoid-hosted lode-gold deposits, Yilgarn Craton, Western Australia: Deposit characteristics, crustal architecture and implications for ore genesis. Ore Geol. Rev. 1998, 13, 65–102. [Google Scholar] [CrossRef]
- Santos, A.C.; Geraldes, M.C.; Santos, W.H.; Ferreira, L.O. Paraíba Ore and the Alta Floresta Gold Province (SW Amazon Craton): Petrography, Pb and S Isotopes in Pyrite from Mineralized Vein. Anu. Inst. Geociênc. UFRJ 2018, 41, 690–701. [Google Scholar] [CrossRef]
- Lowell, J.D.; Guilbert, J.M. Lateral and vertical alteration-mineralization zoning in porphyry ore deposits. Econ. Geol. 1970, 65, 373–408. [Google Scholar] [CrossRef]
- Gustafson, L.B.; Hunt, J.P. The Porphyry Copper Deposit at El Salvador, Chile. Econ. Geol. 1975, 70, 857–912. [Google Scholar] [CrossRef]
- Cao, K.; Yang, Z.M.; Mavrogenes, J.; White, N.C.; Ji, F.-X.; Li, Y.; Li, W.-K. Geology and Genesis of the Giant Pulang Porphyry Cu-Au District, Yunnan, Southwest China. Soc. Econ. Geol. 2019, 114, 275–301. [Google Scholar] [CrossRef]


Publisher’s Note: MDPI stays neutral with regard to jurisdictional claims in published maps and institutional affiliations. |
© 2022 by the authors. Licensee MDPI, Basel, Switzerland. This article is an open access article distributed under the terms and conditions of the Creative Commons Attribution (CC BY) license (https://creativecommons.org/licenses/by/4.0/).