
Zonal Geochemistry and Elasticity Characteristics of Gallium- and Lithium-Rich No. 6 Coalbed in the Haerwusu Mine, North China


Abstract
:1. Introduction
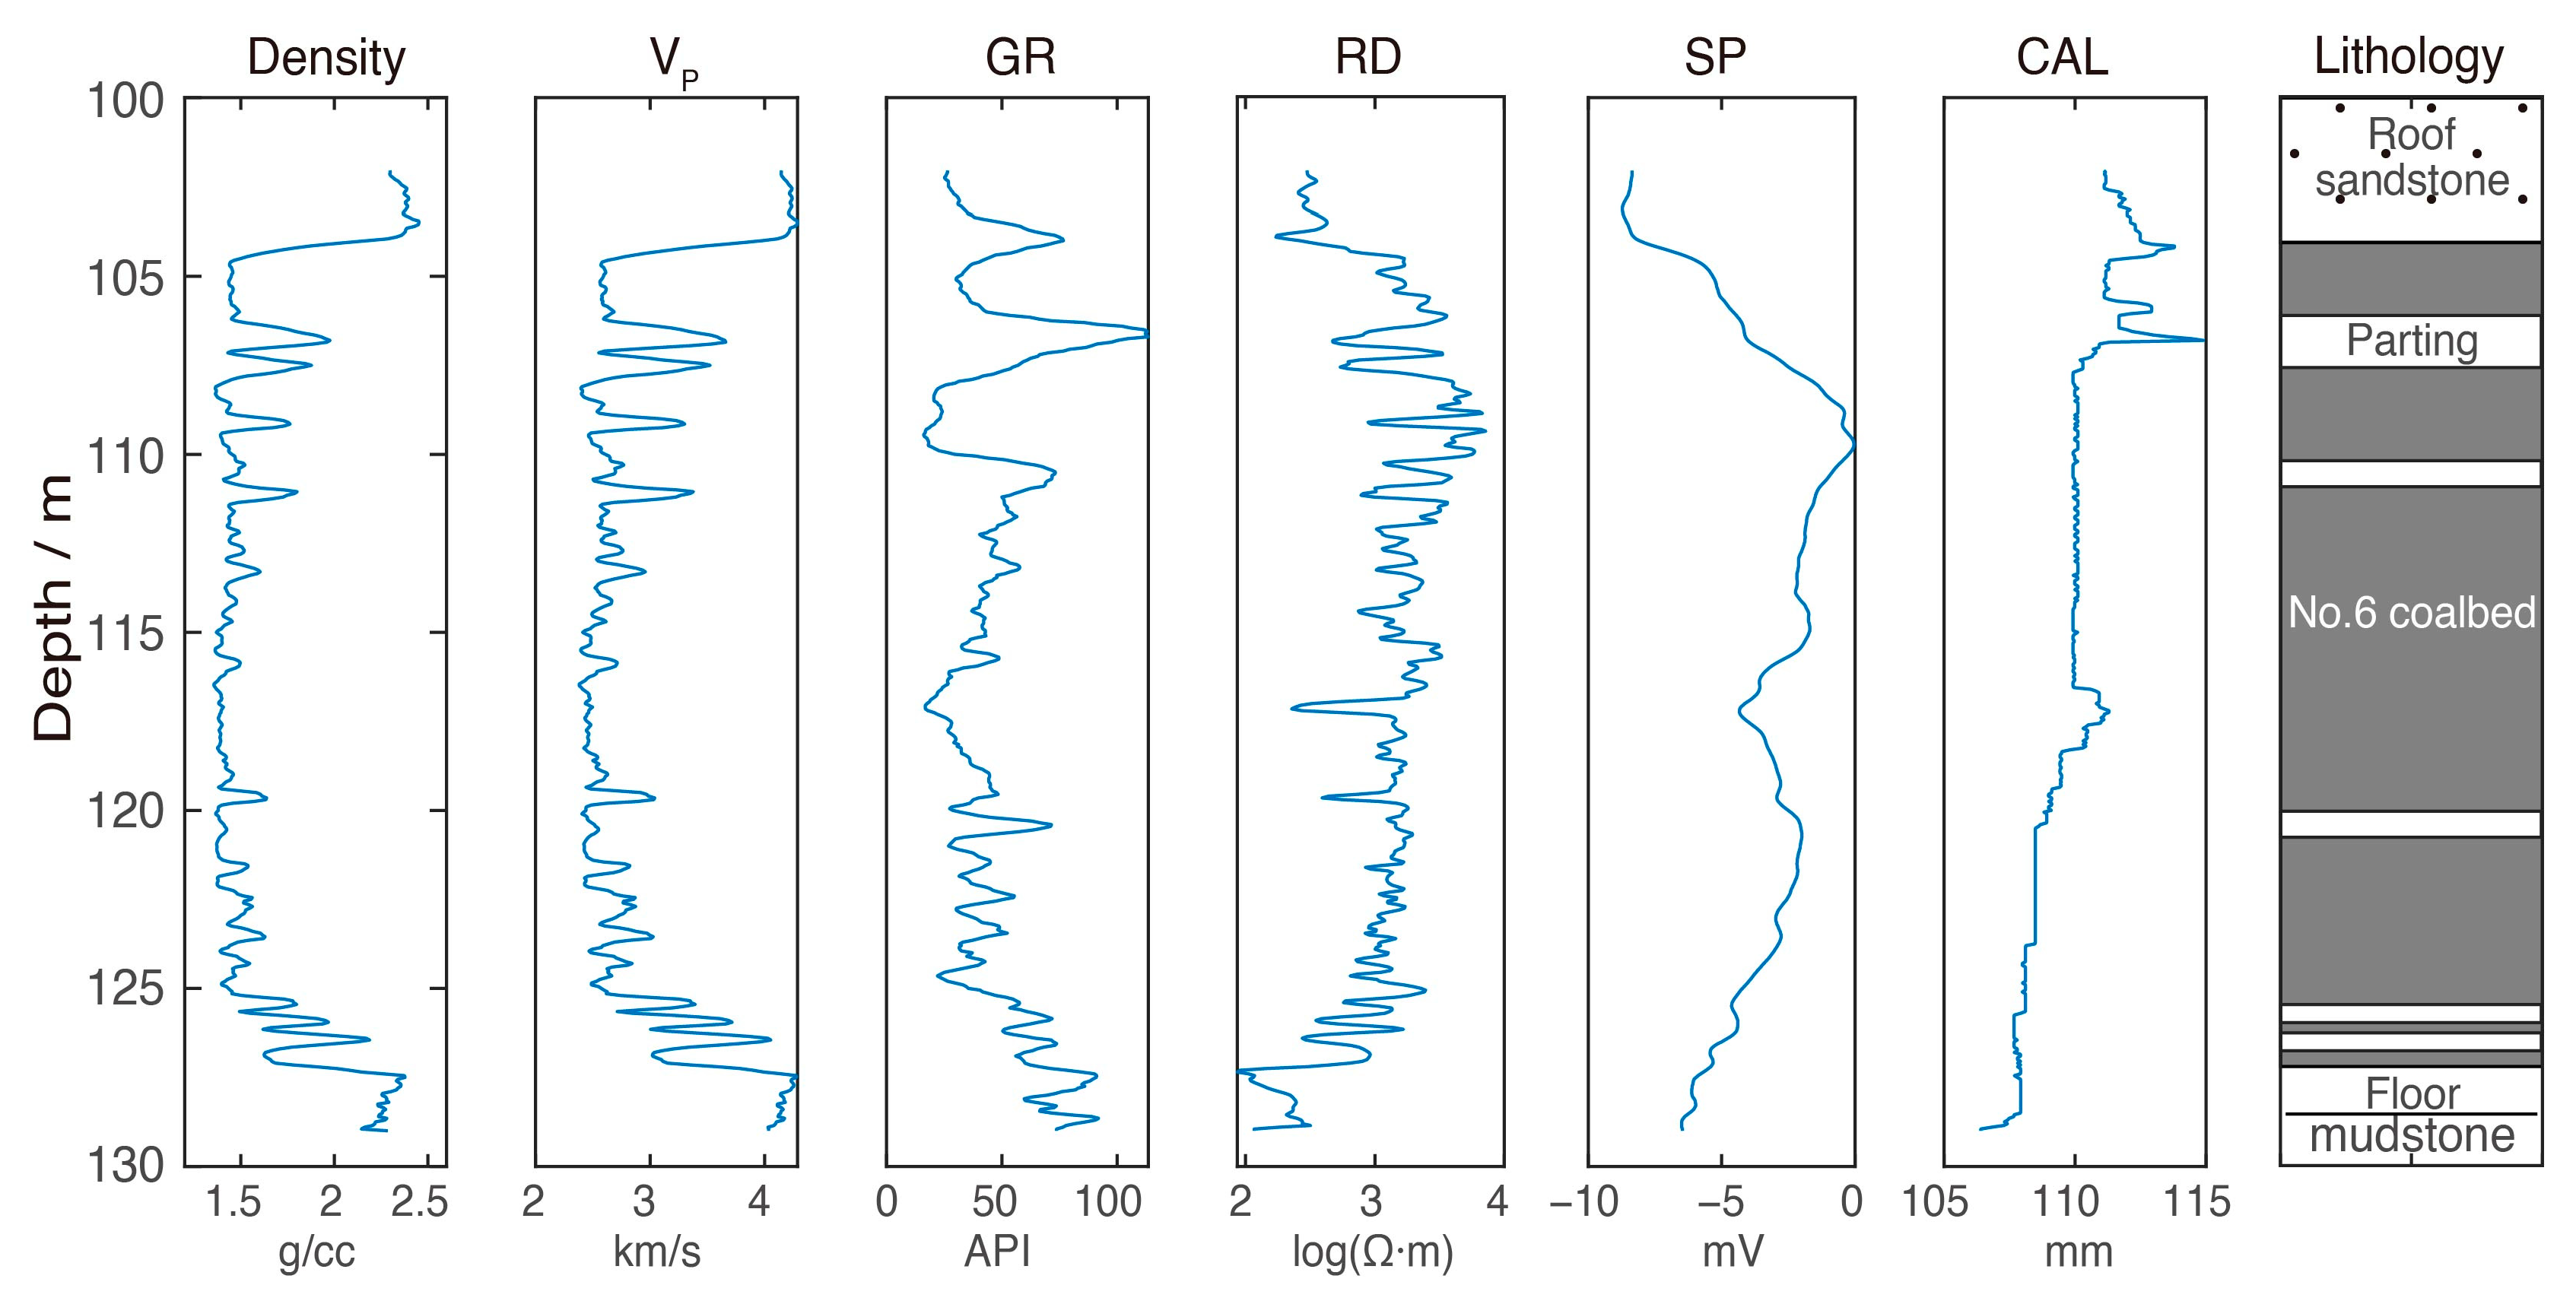
2. Geological Setting and Core Sampling
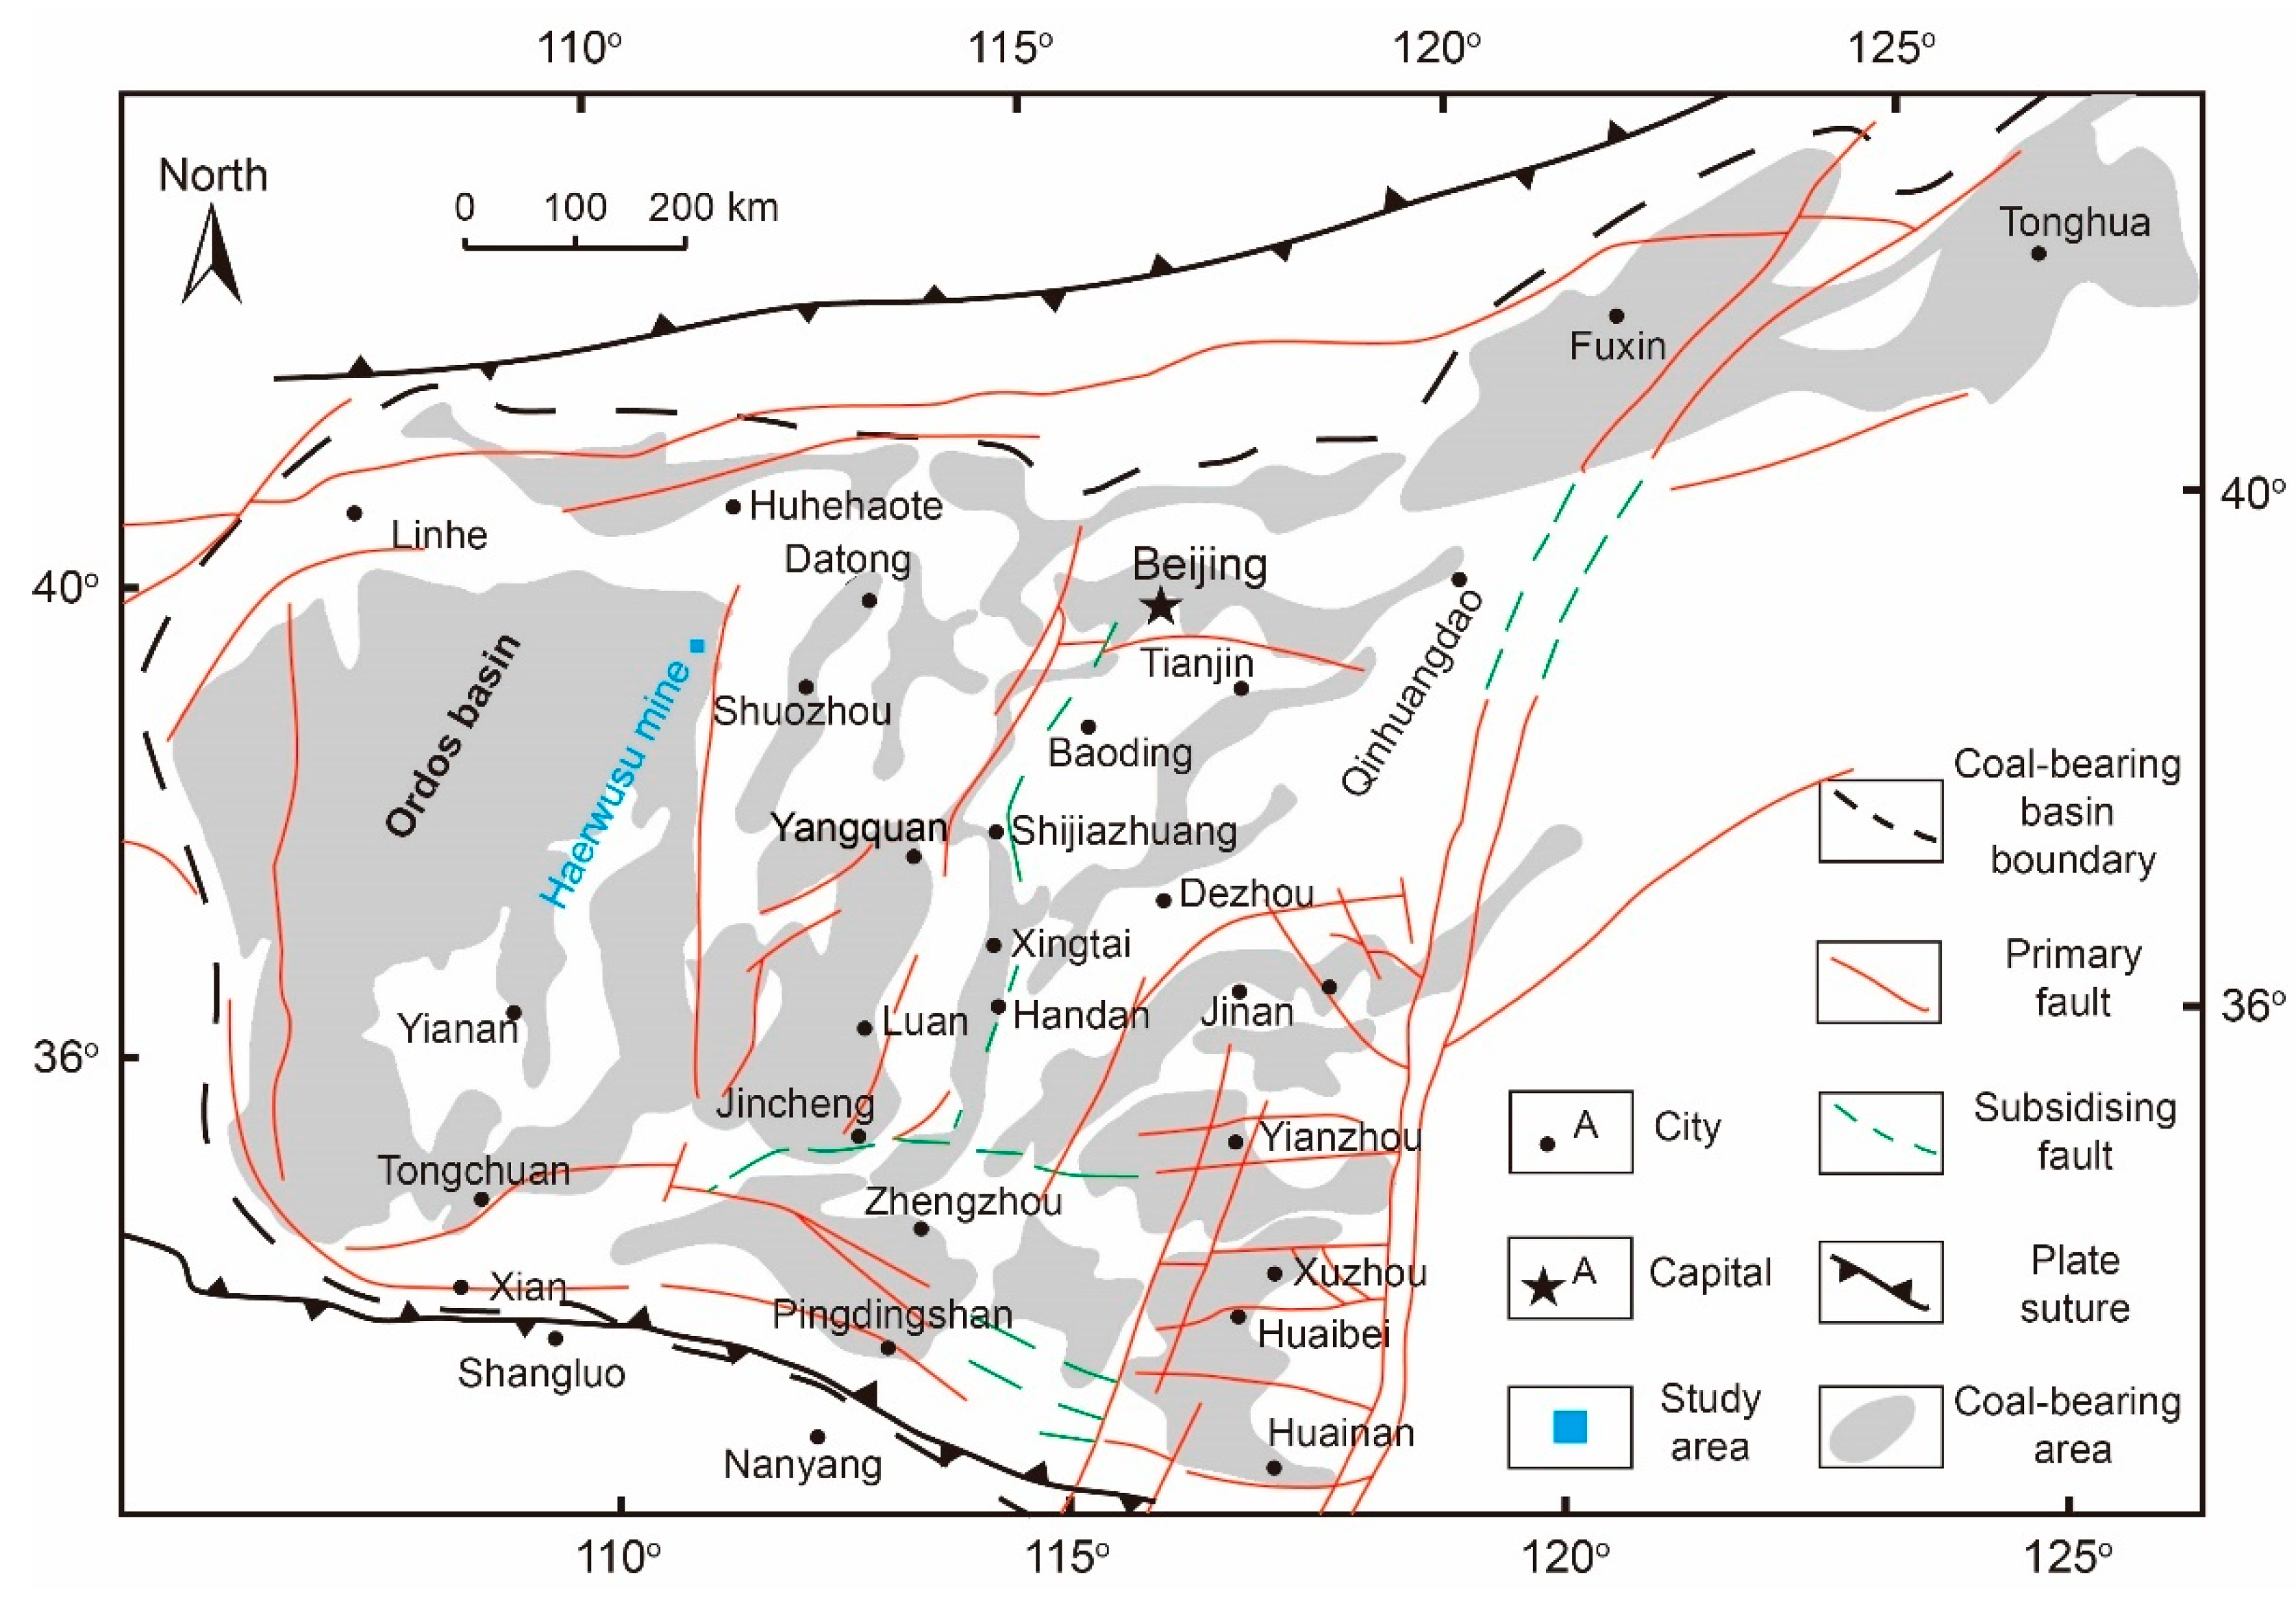
2.1. Geological Setting
2.2. Core Sampling and Testing
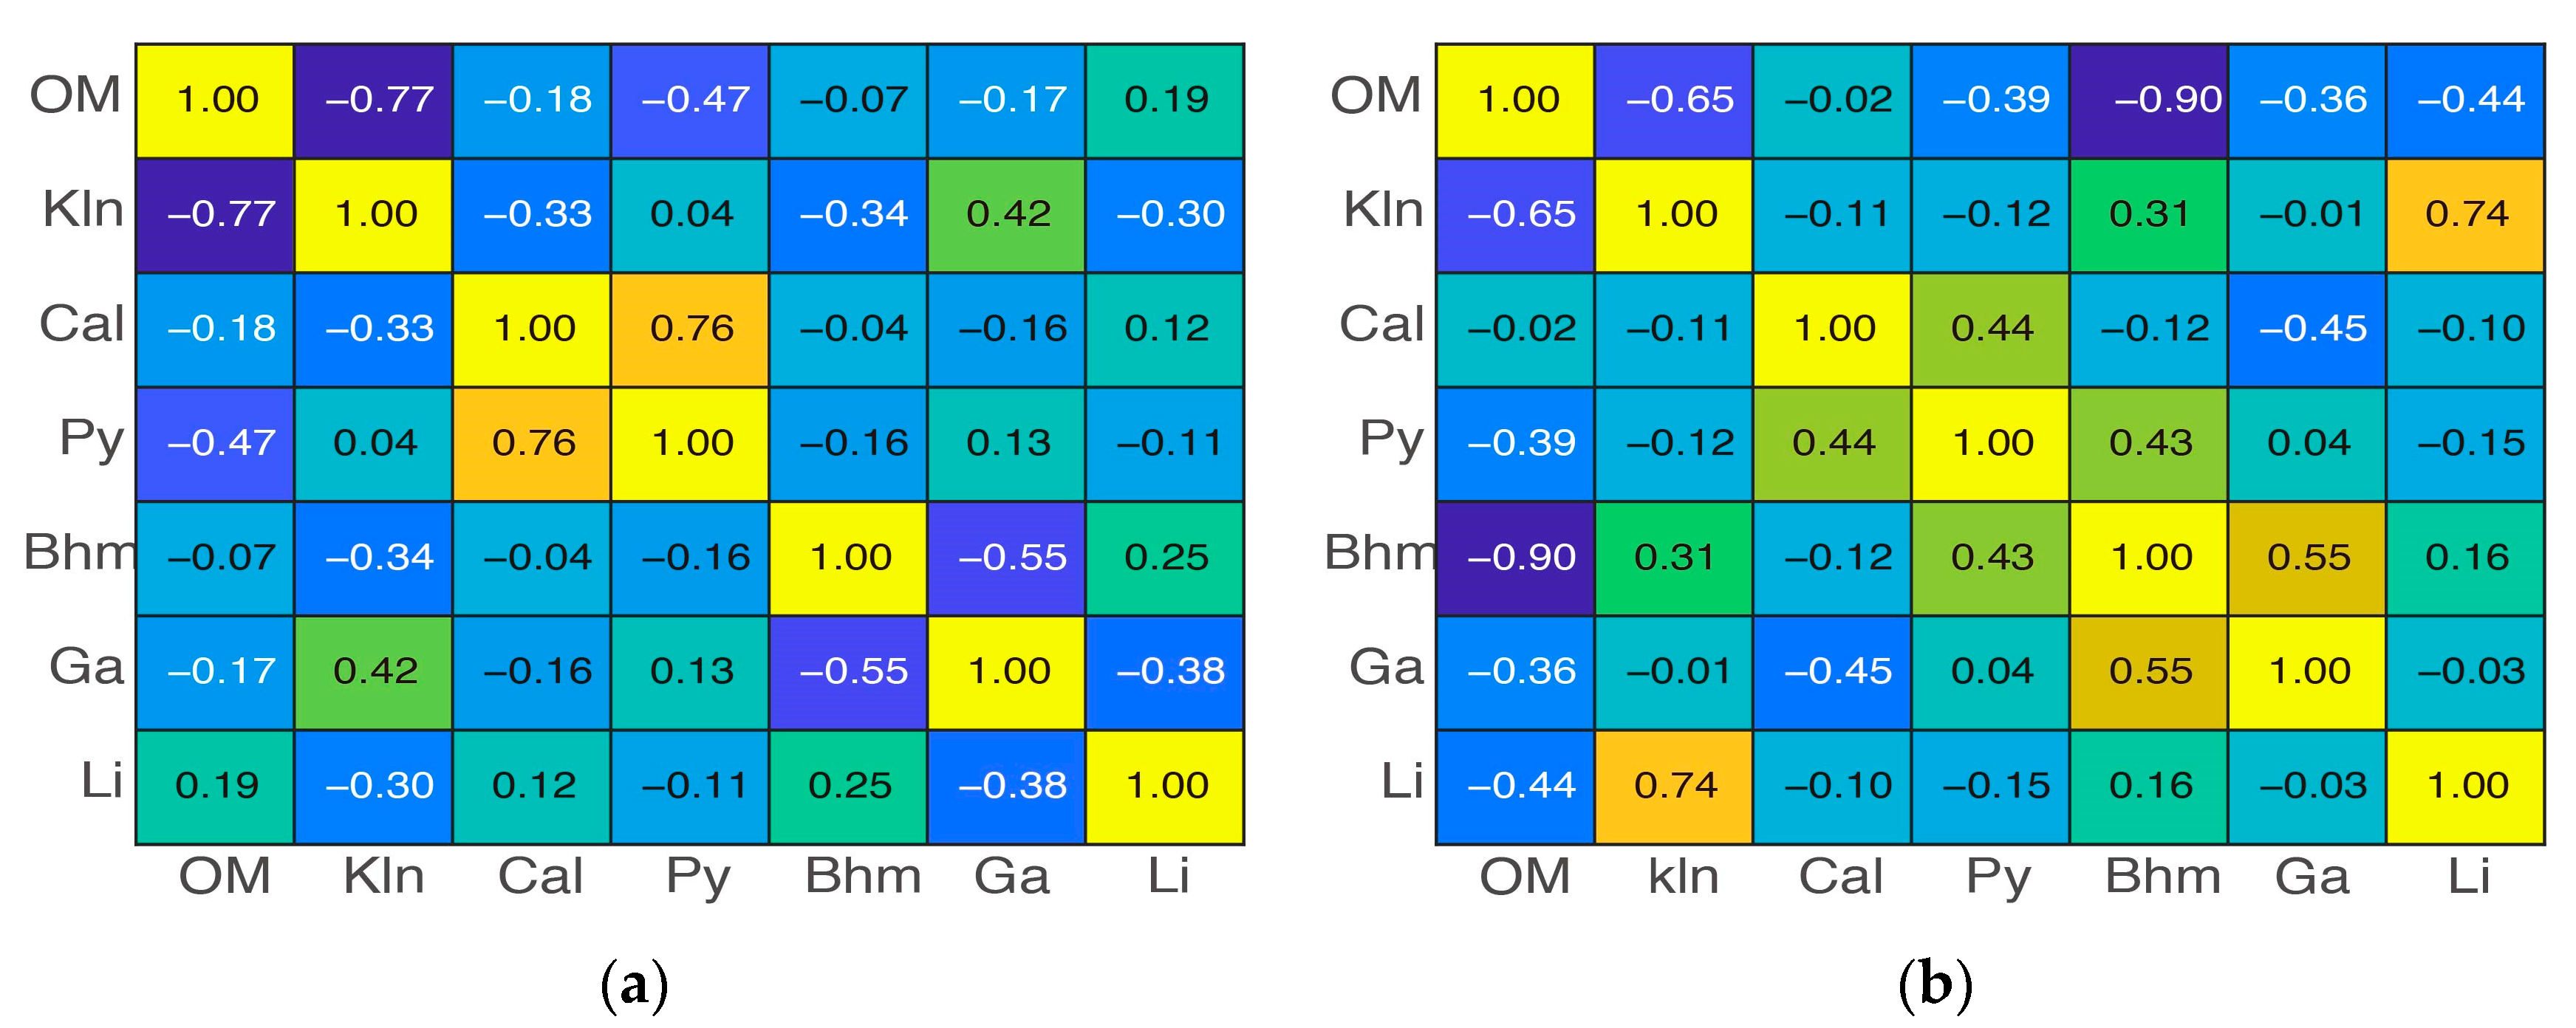
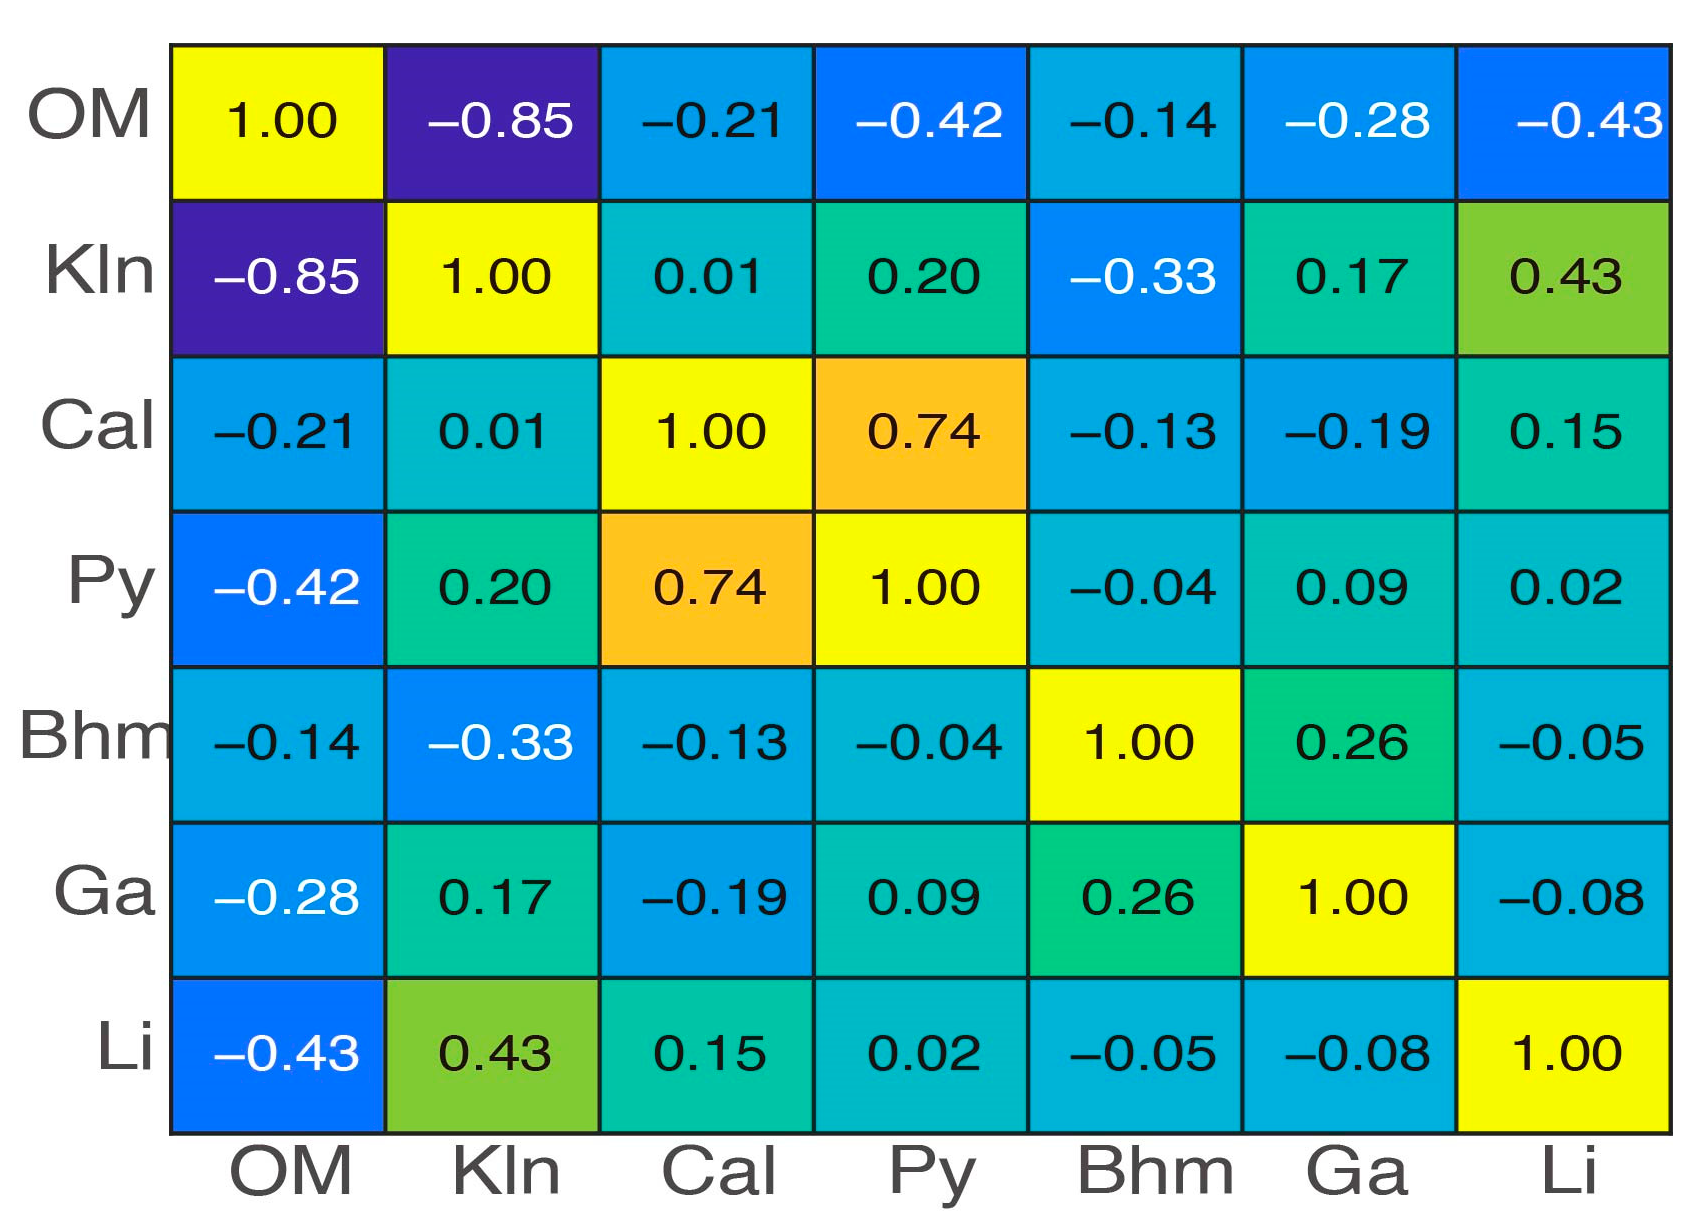
2.3. Overall Geochemistry Characteristics
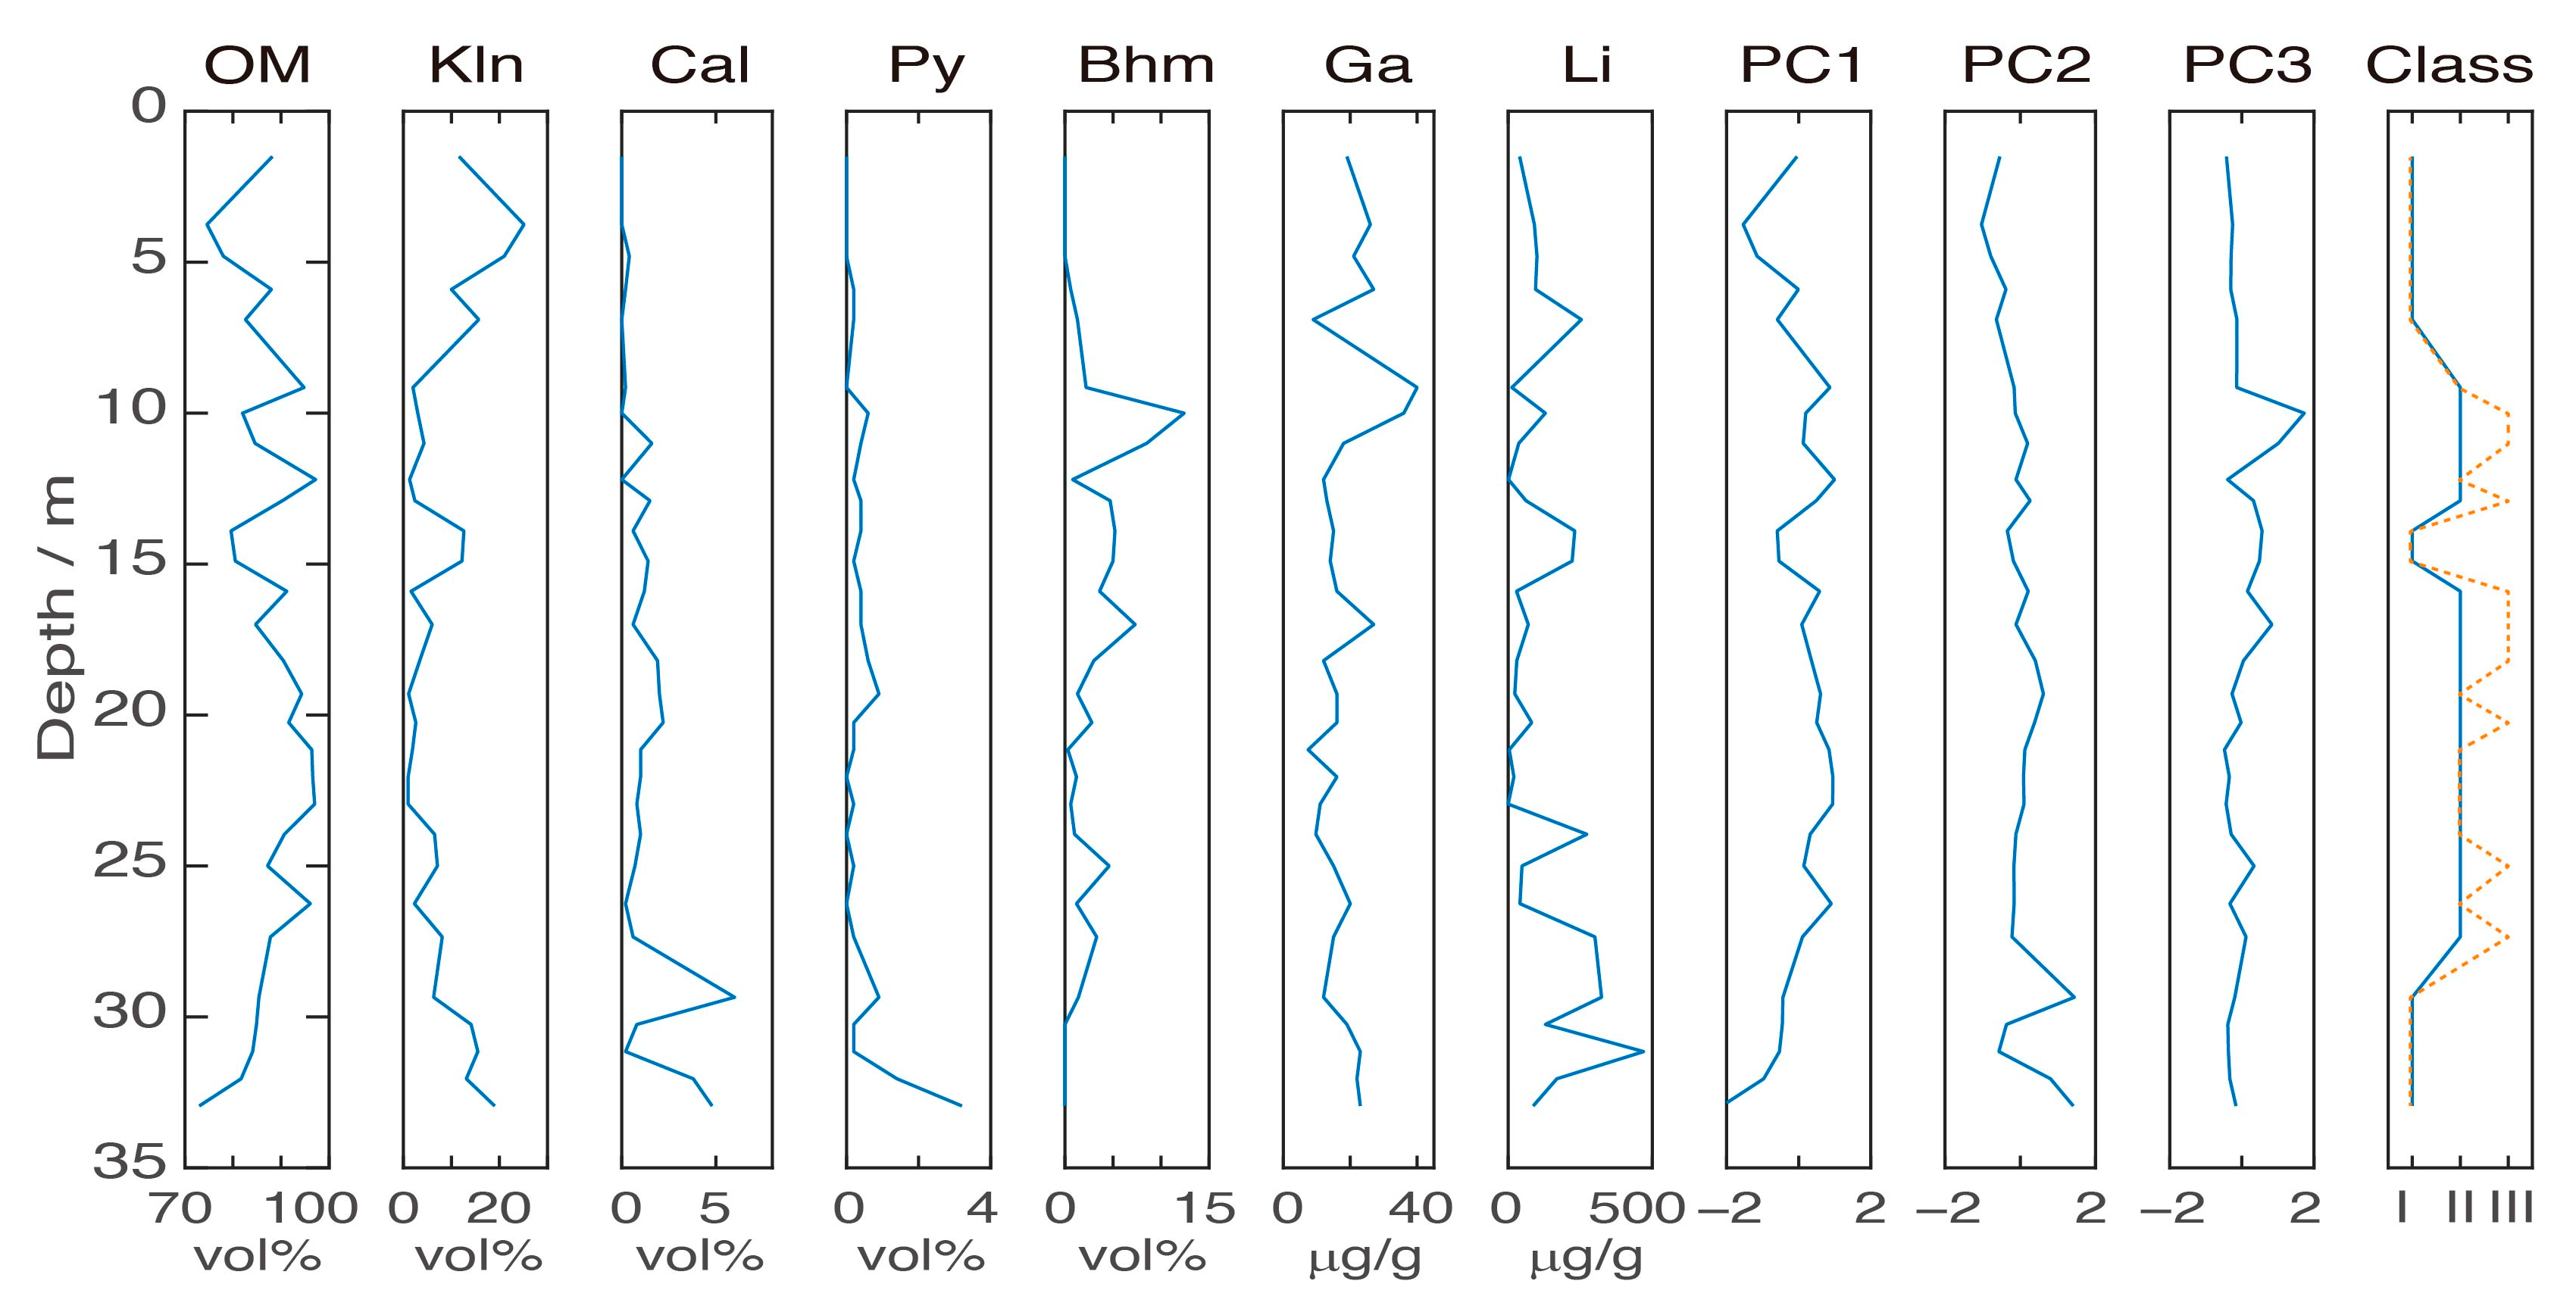
3. Zonal Geochemistry Characteristics
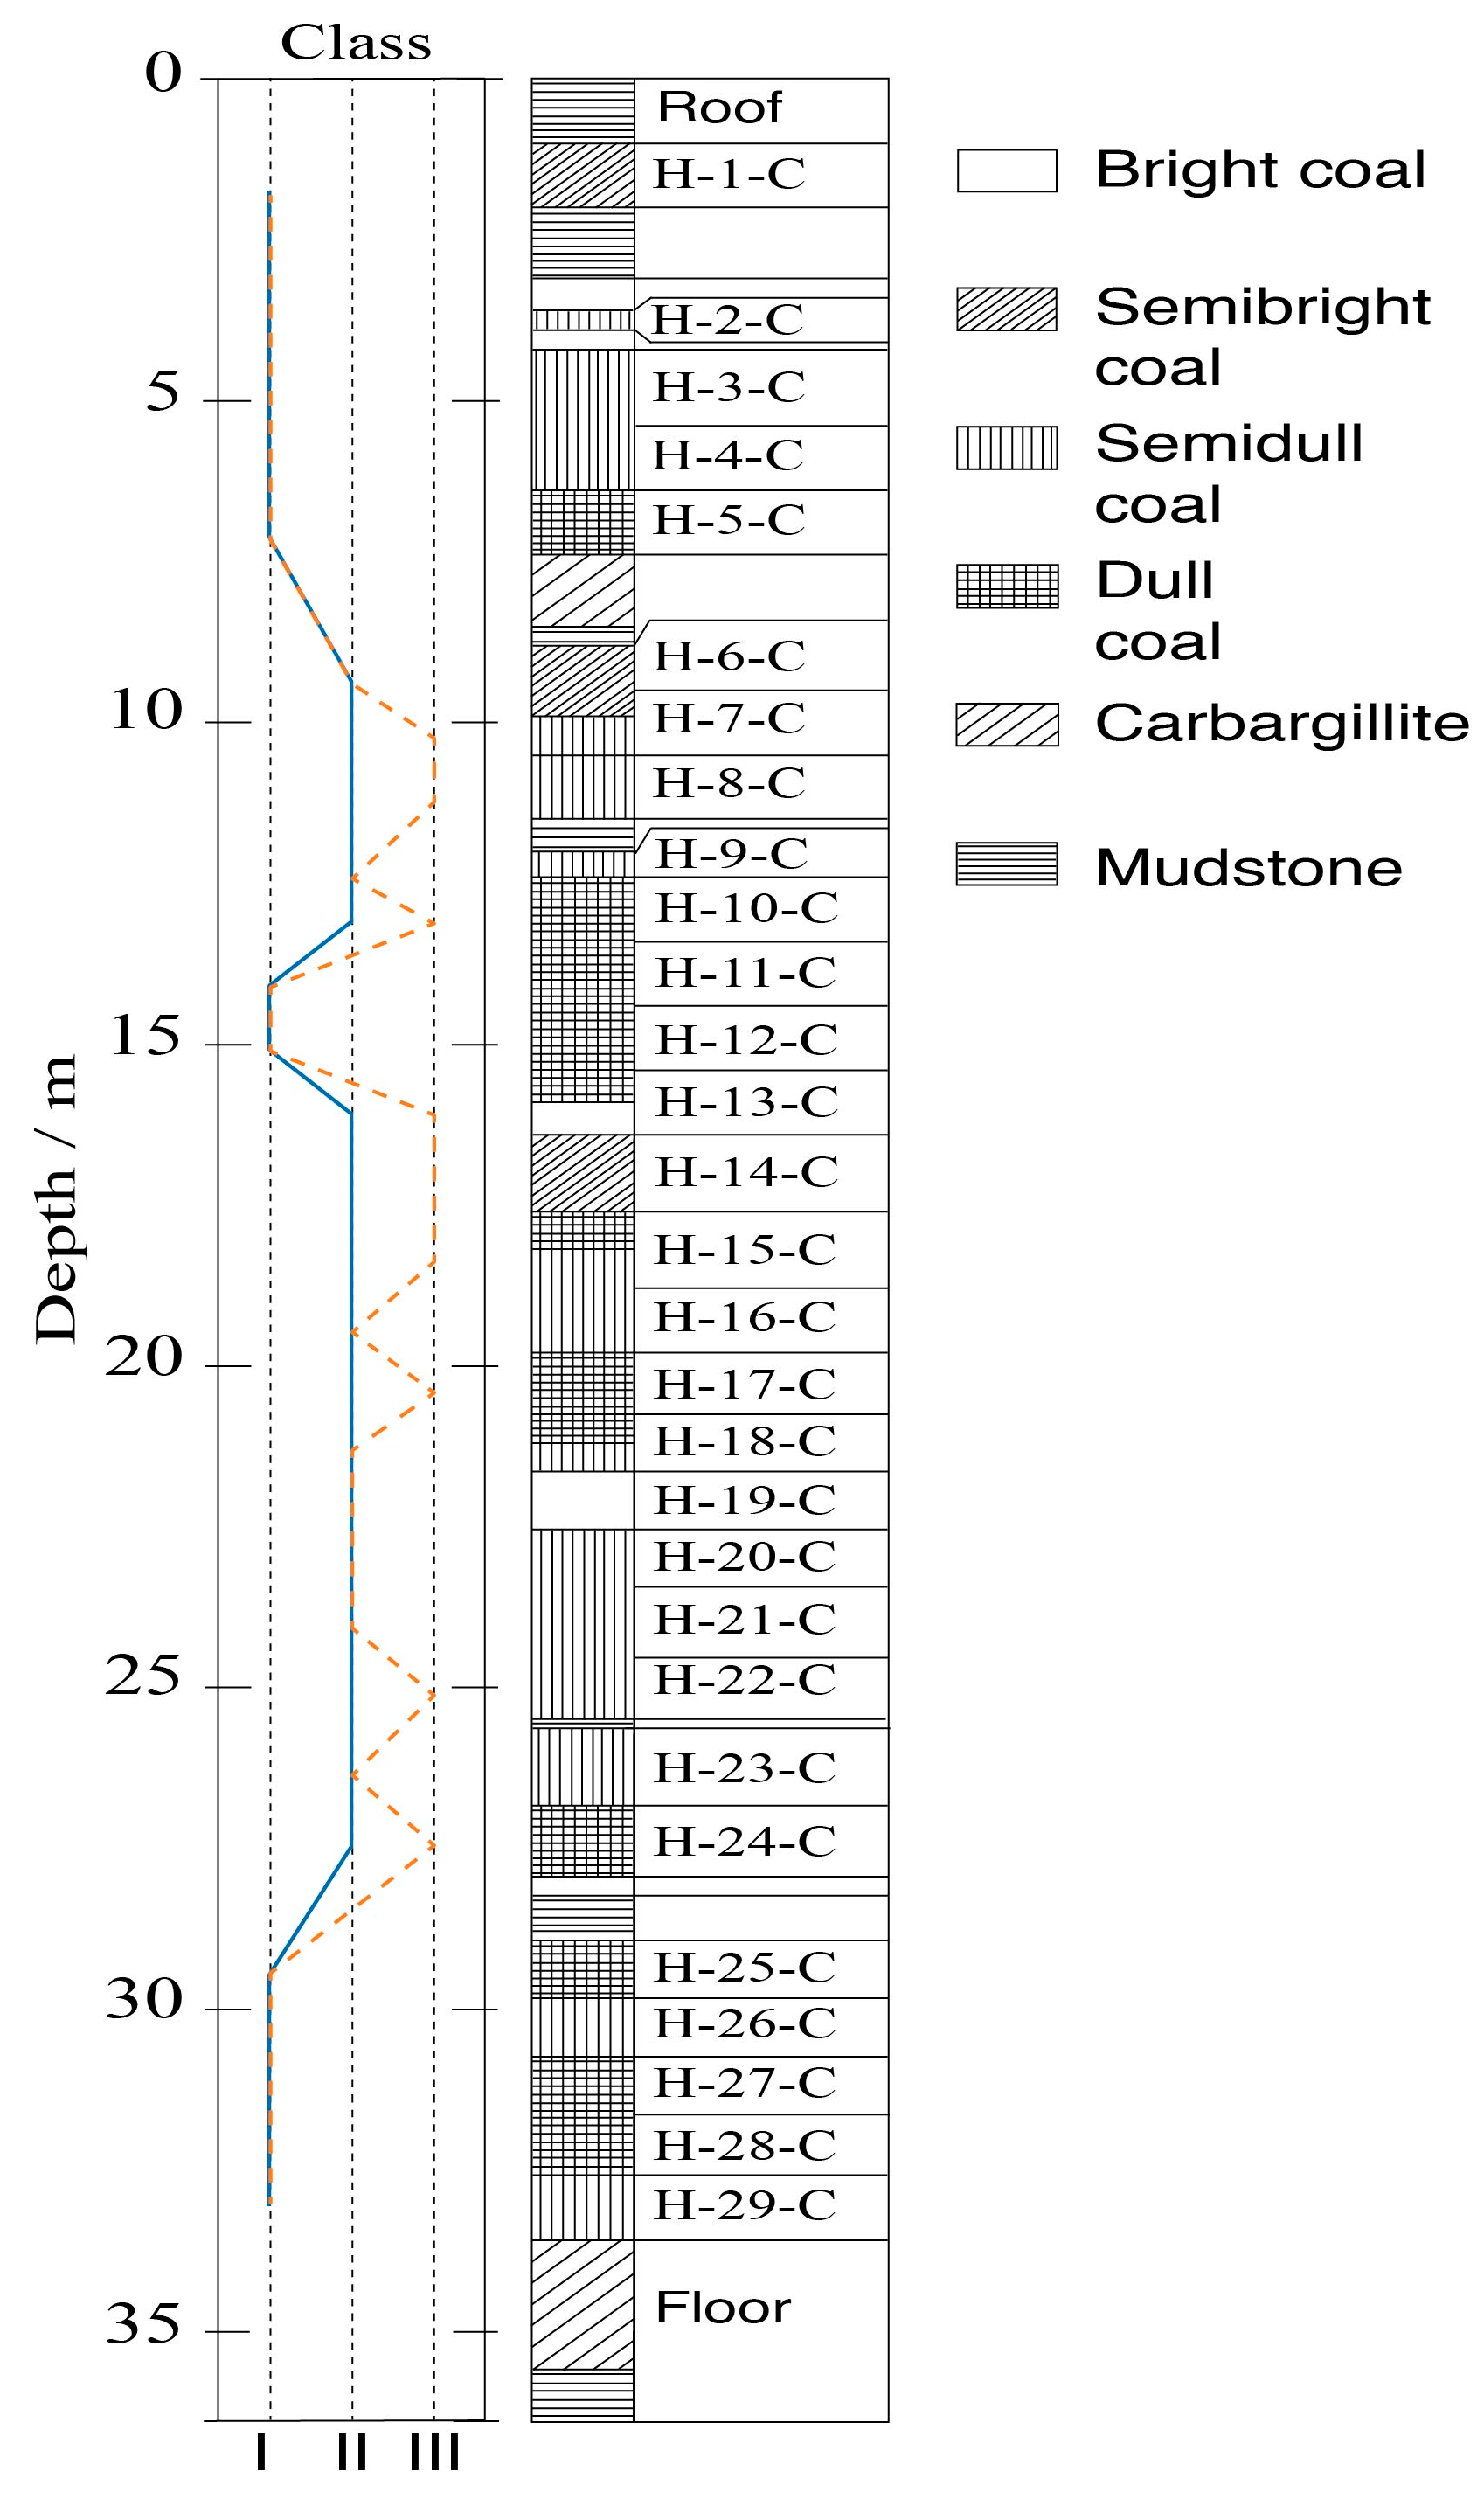
3.1. Classification Methodology
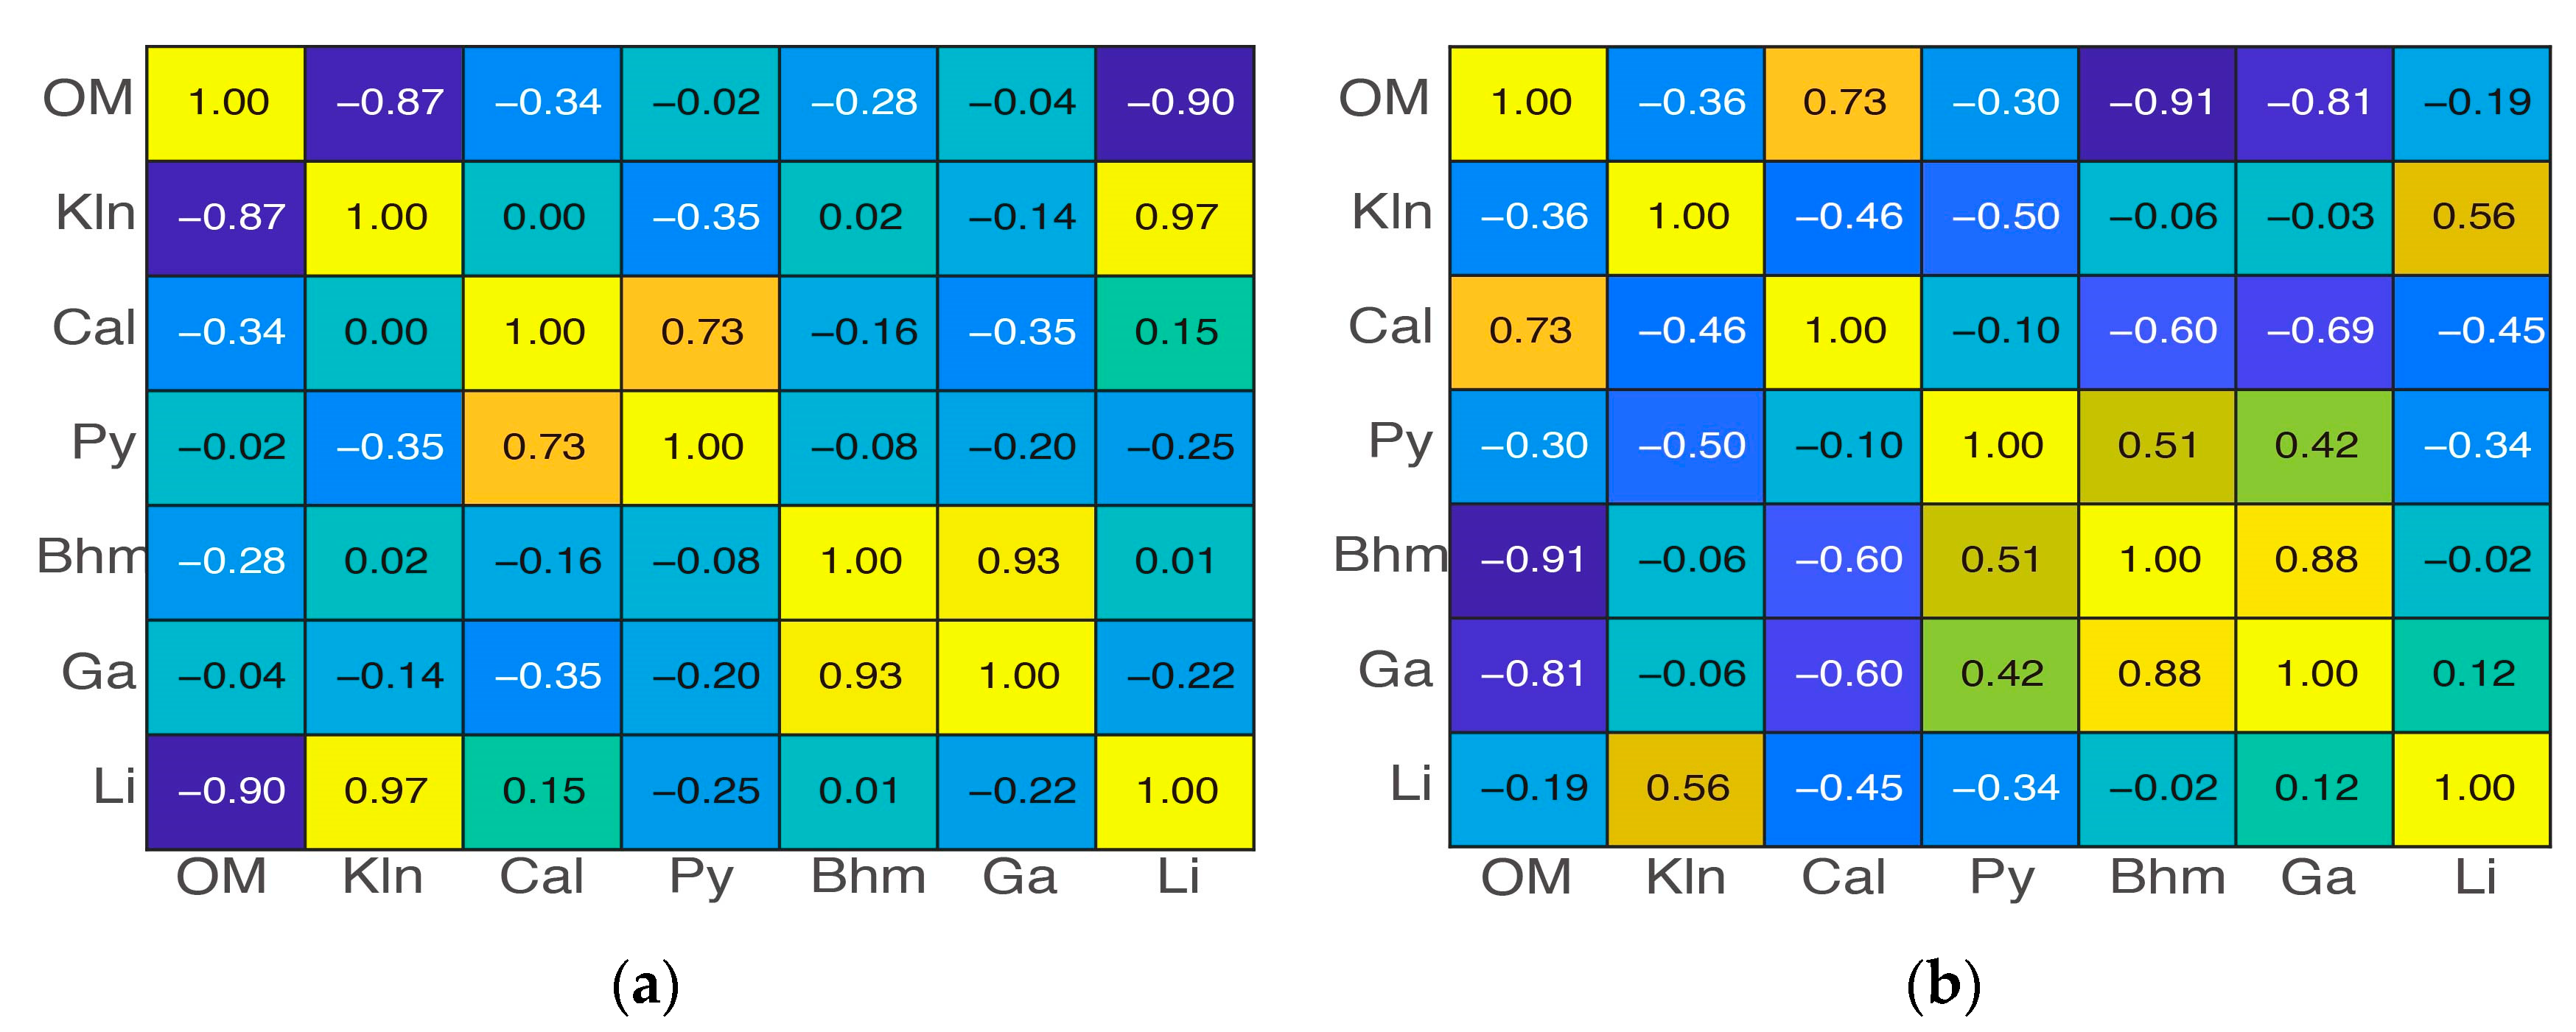
3.2. Zonal Geochemistry Characteristics after Two-Class Classification
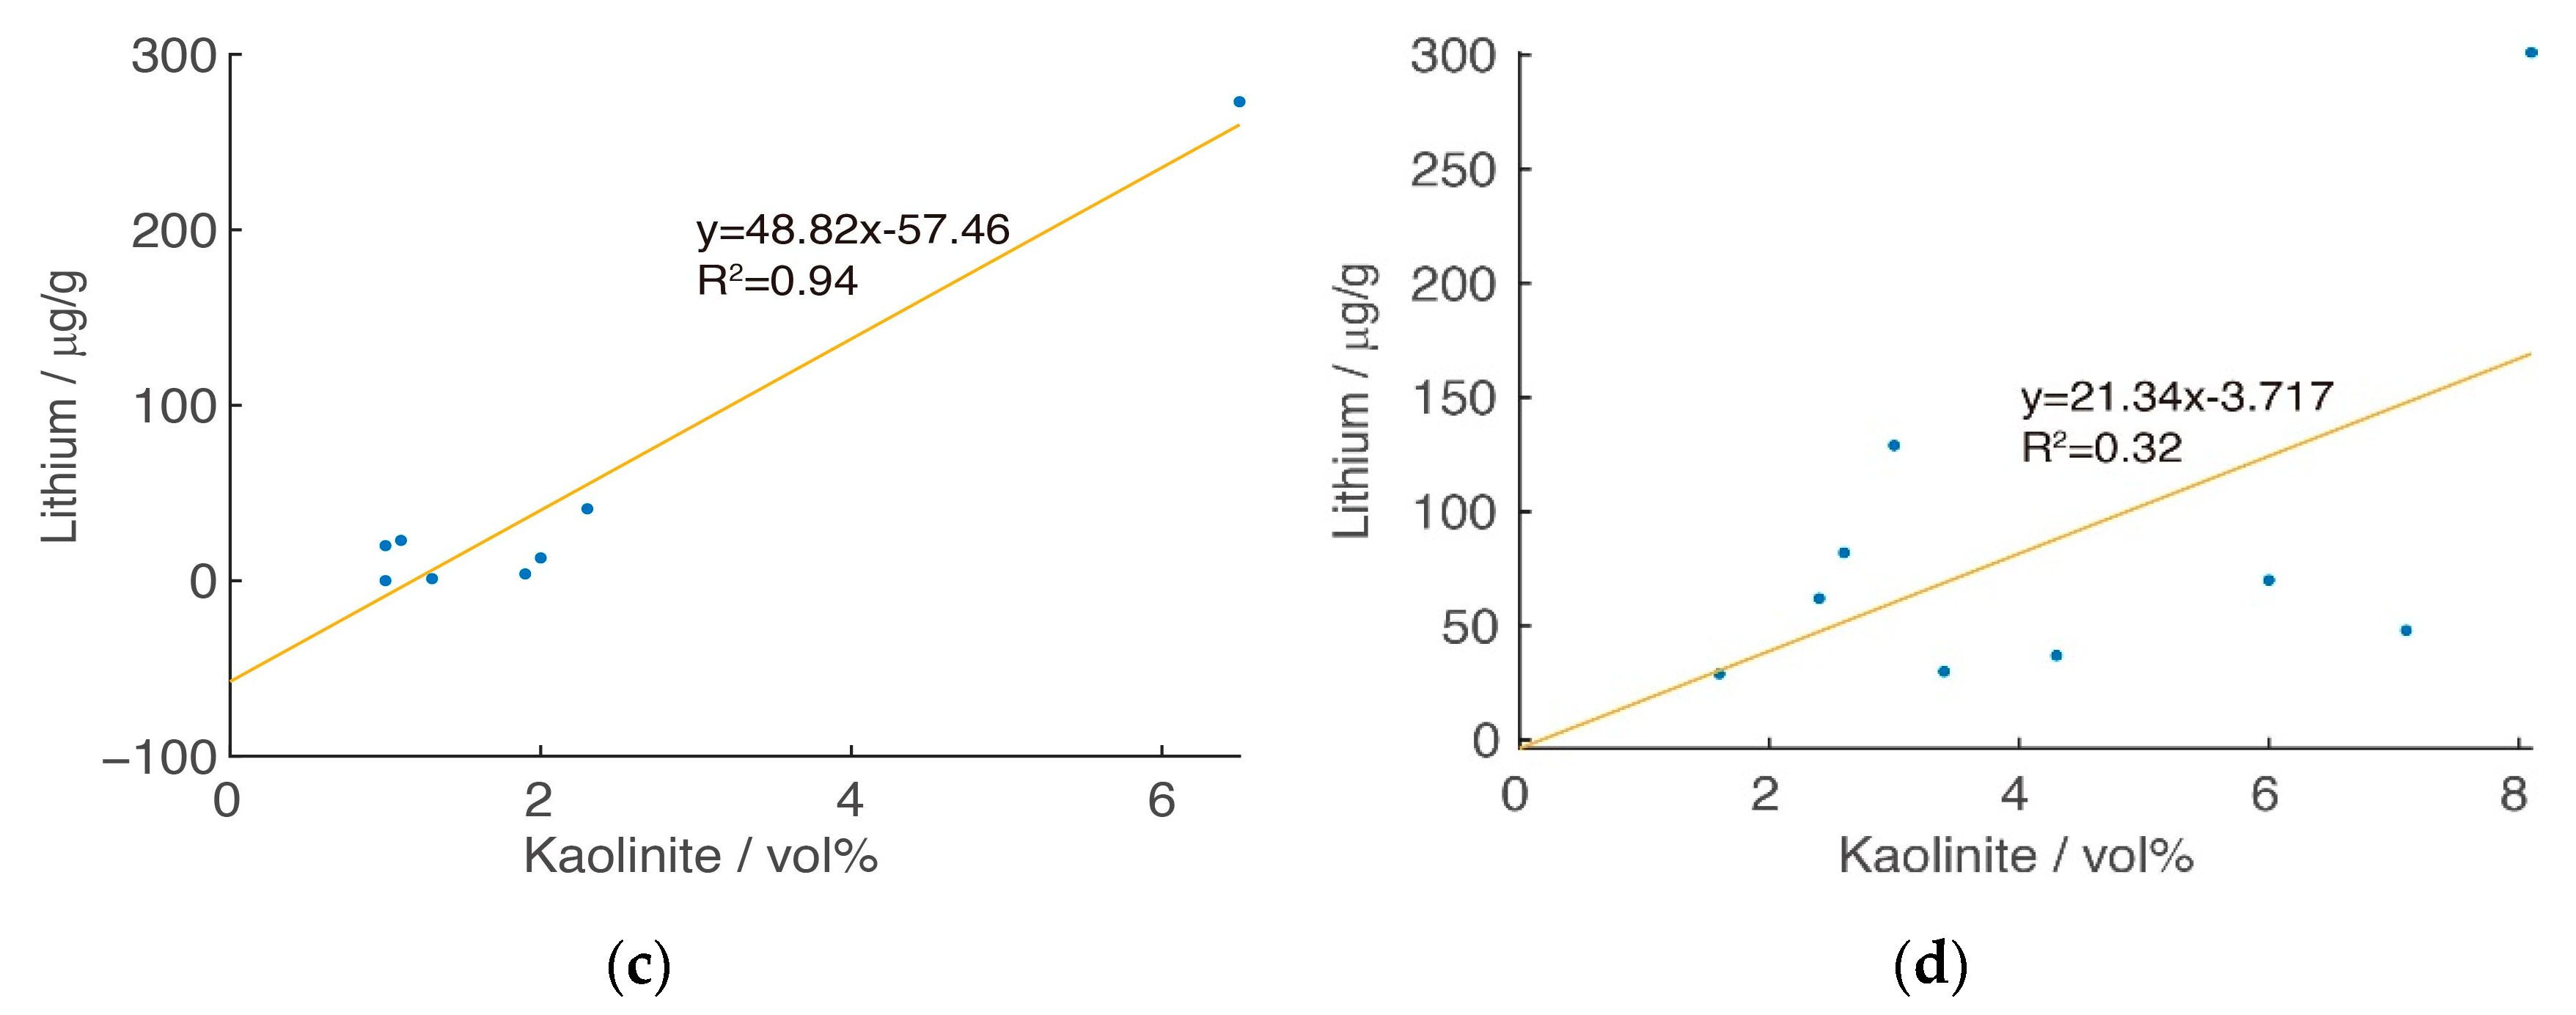
3.3. Zonal Geochemistry Characteristics after Three-Class Classification
4. Zonal Elasticity Characteristics
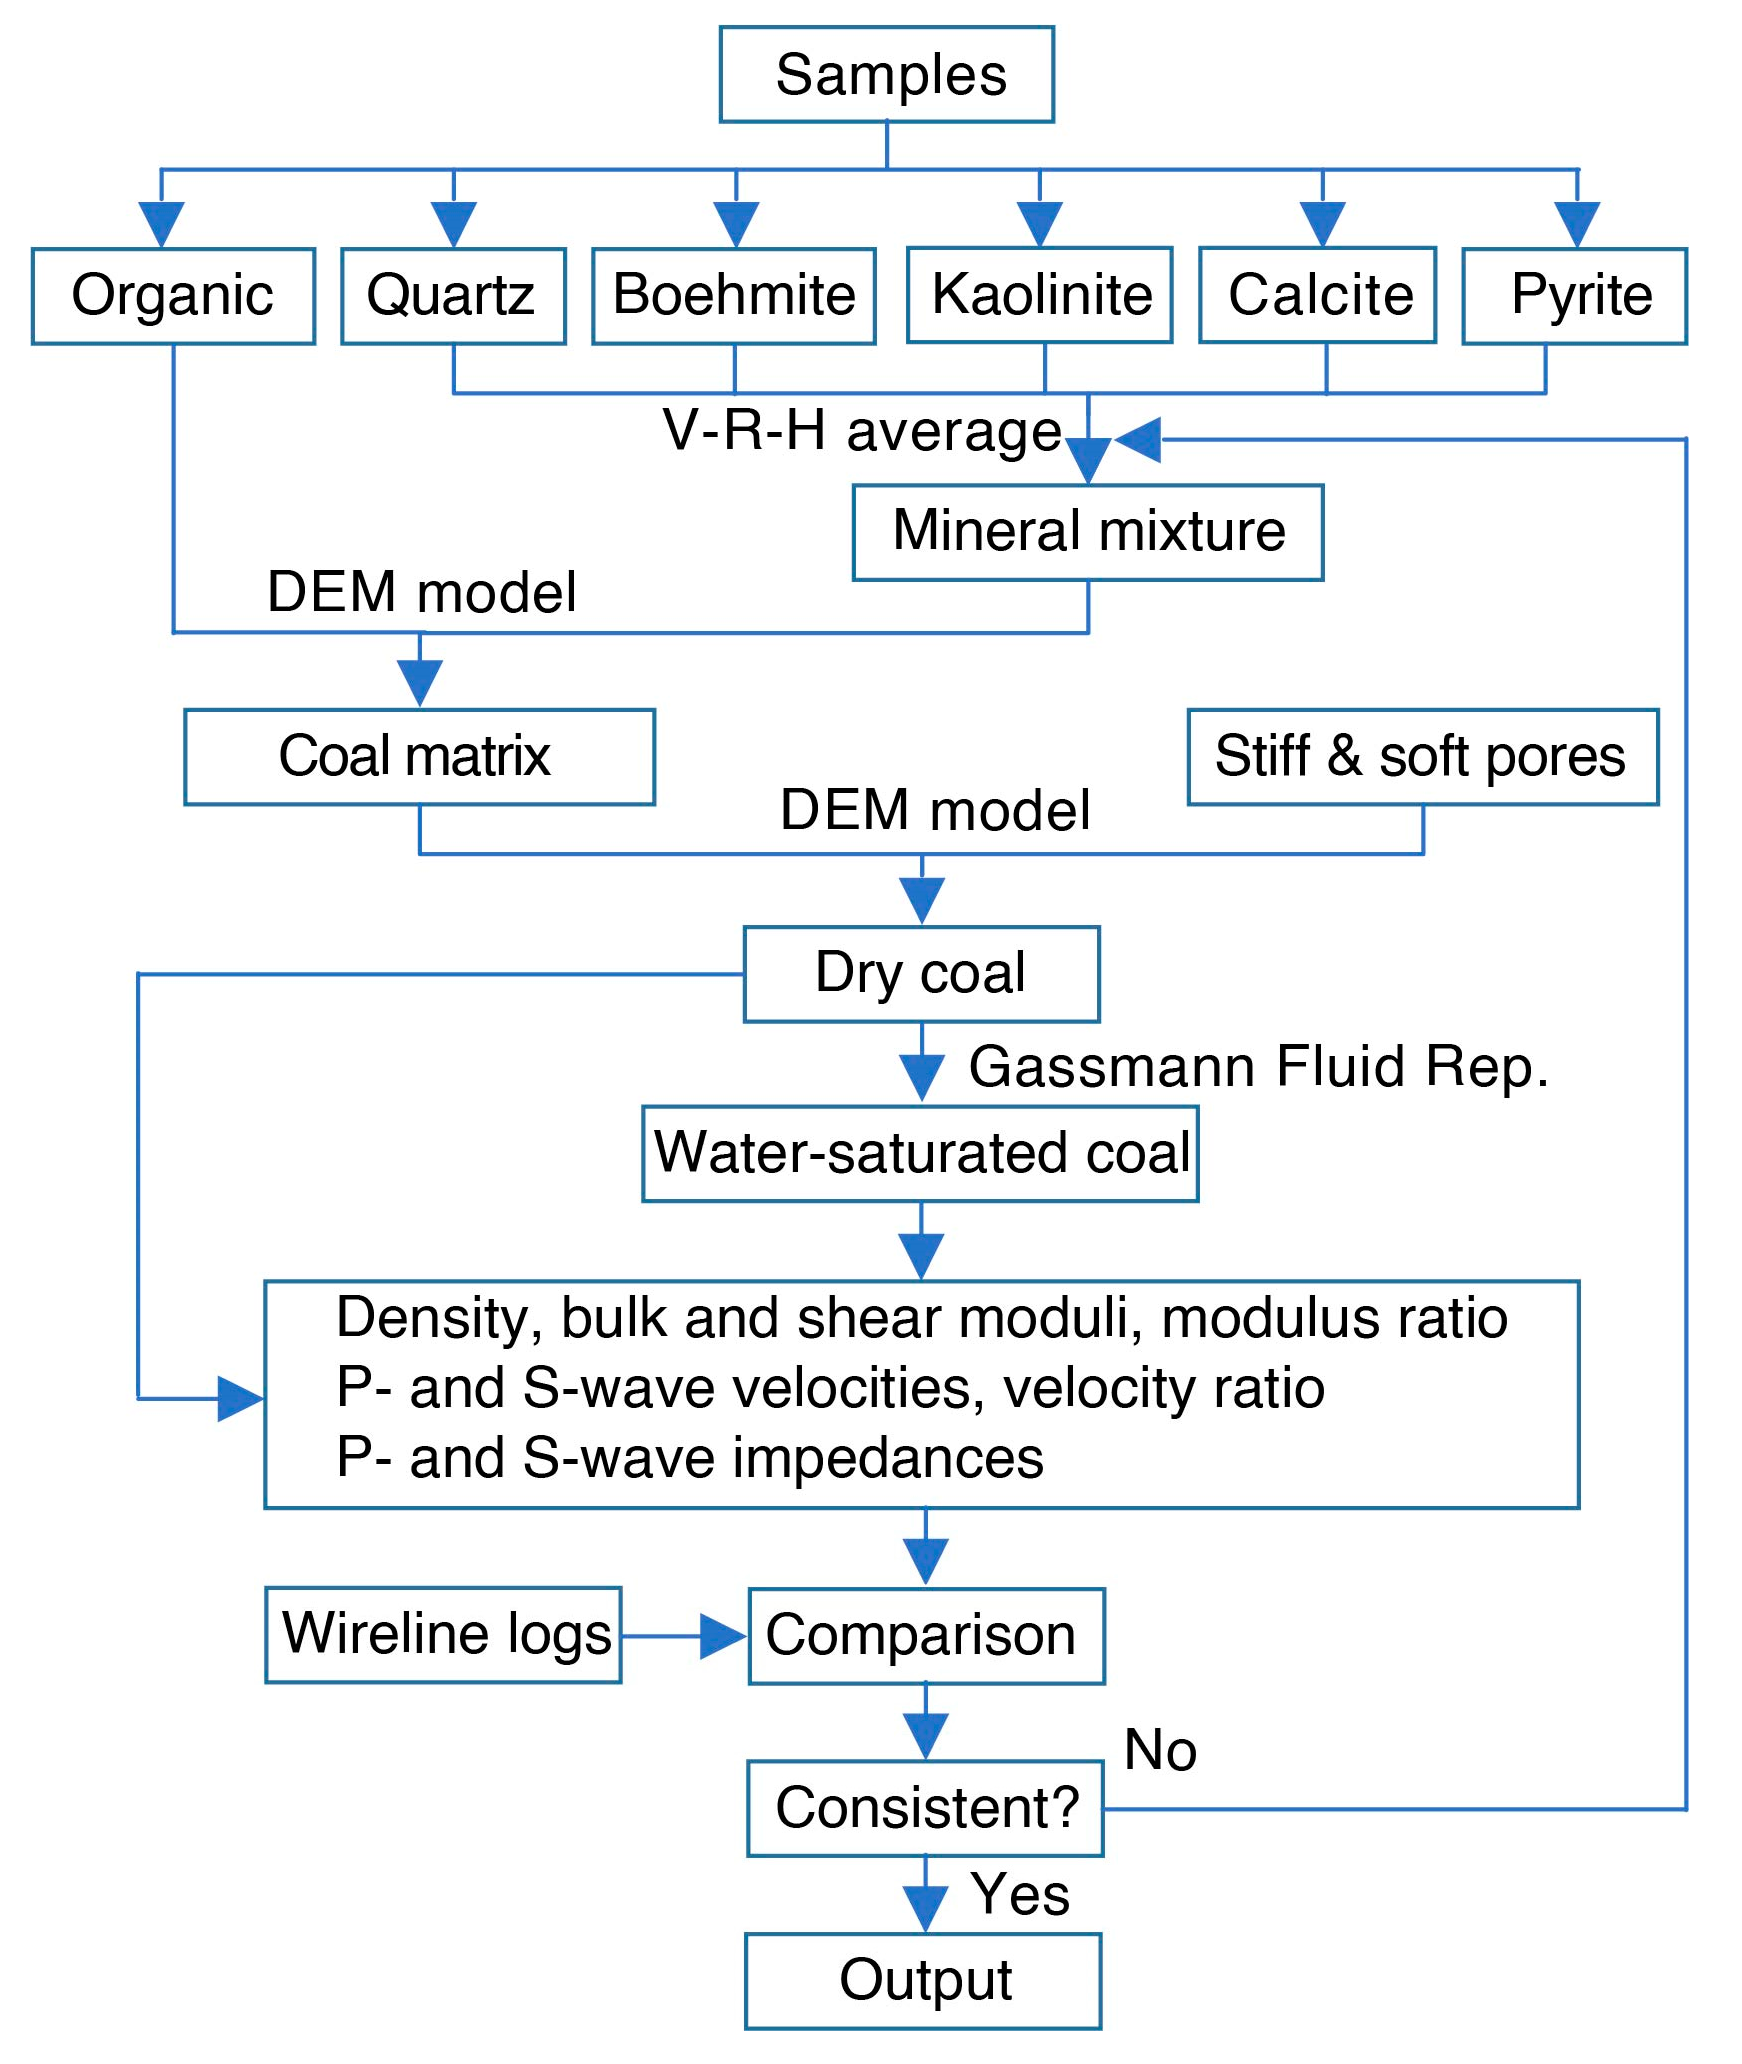
4.1. Rock Physics Modeling Strategy
4.2. Overall Elasticity Characteristics
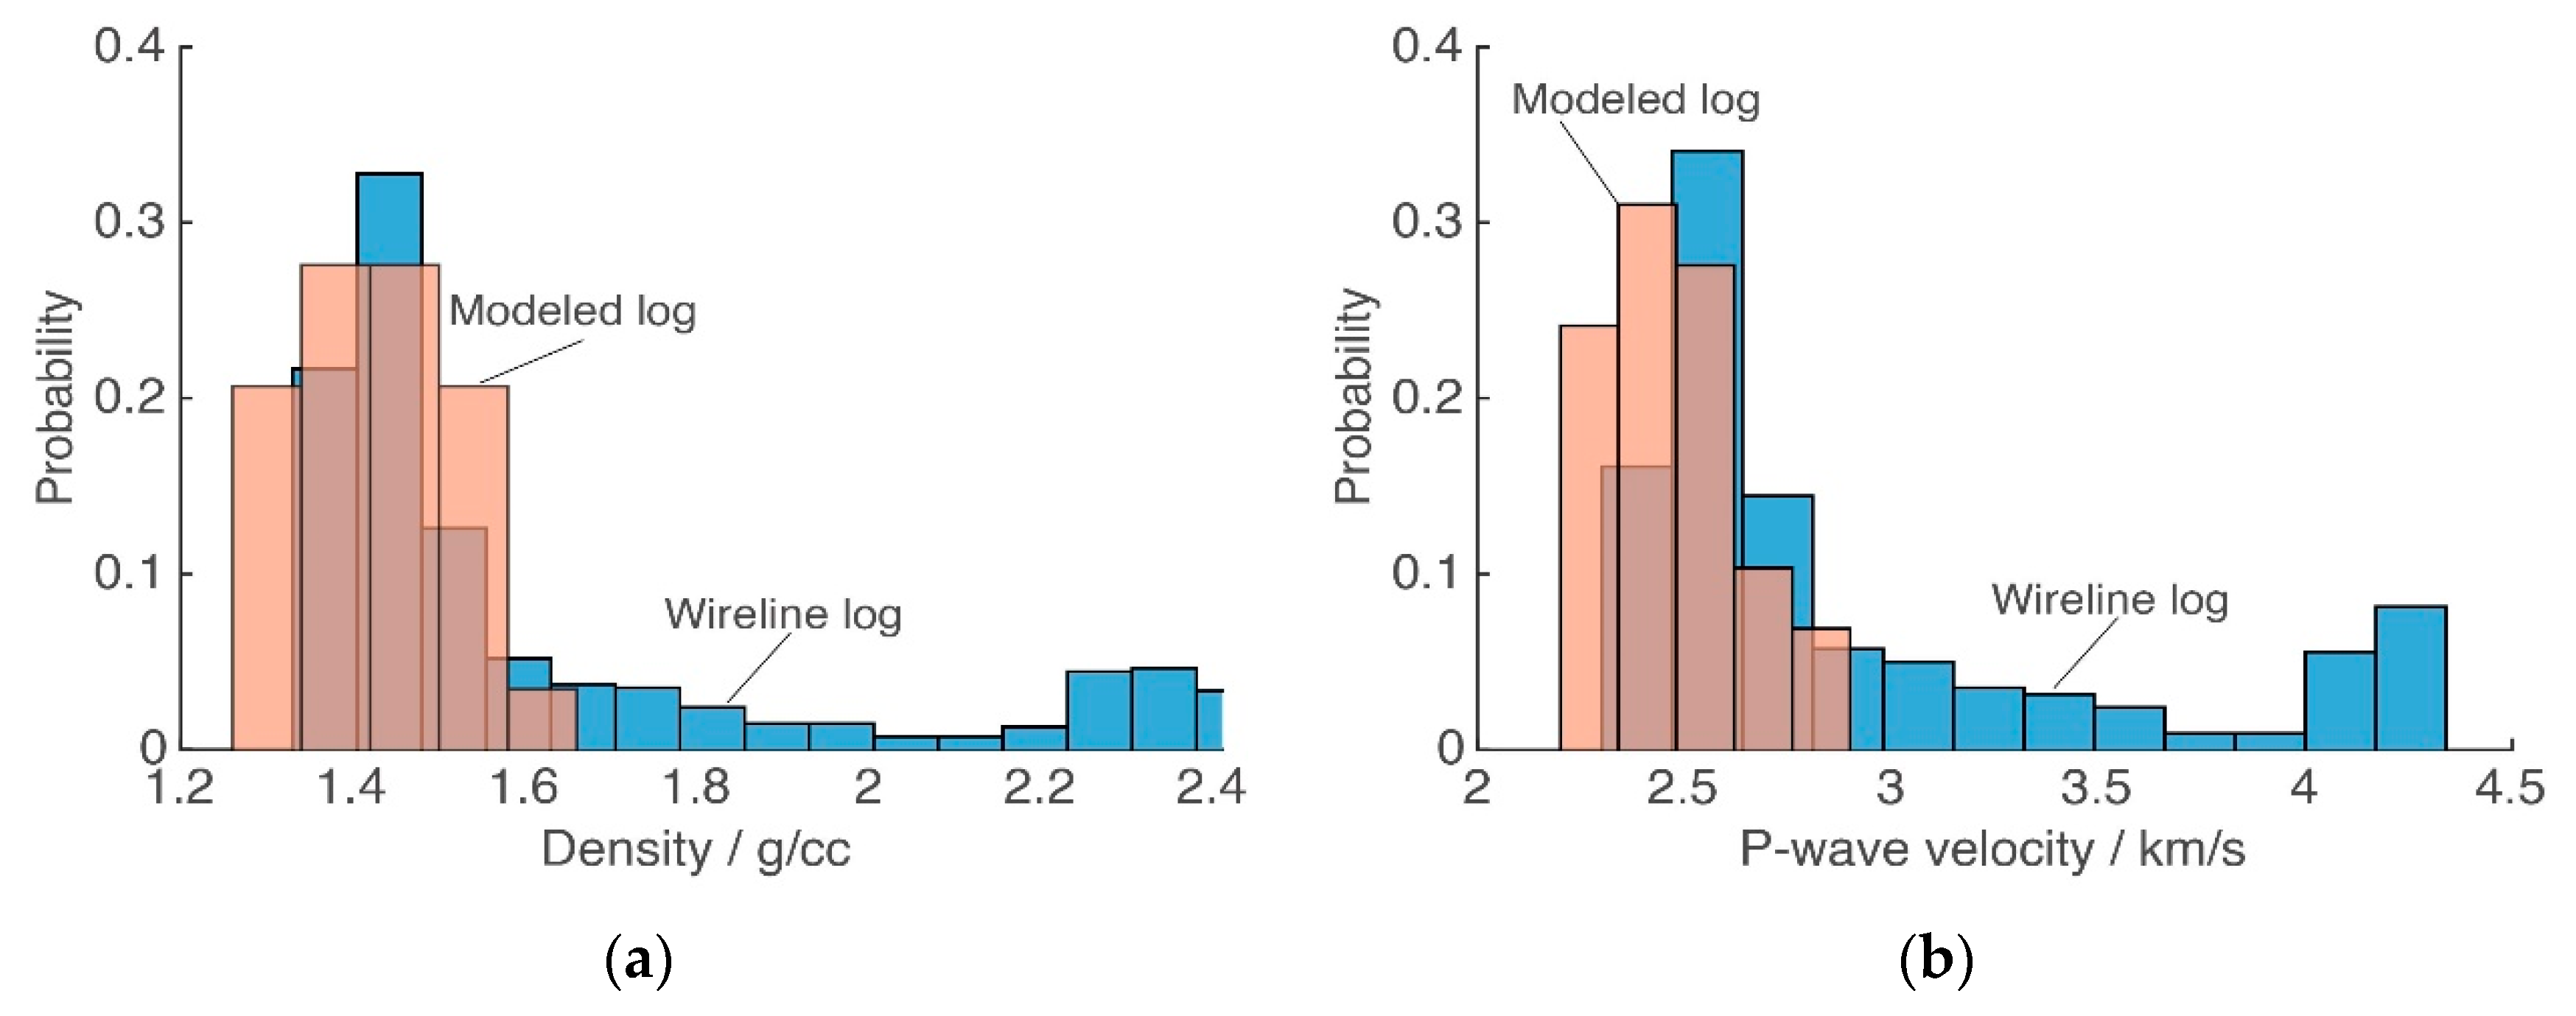
4.3. Rock Physics Modeling Validation
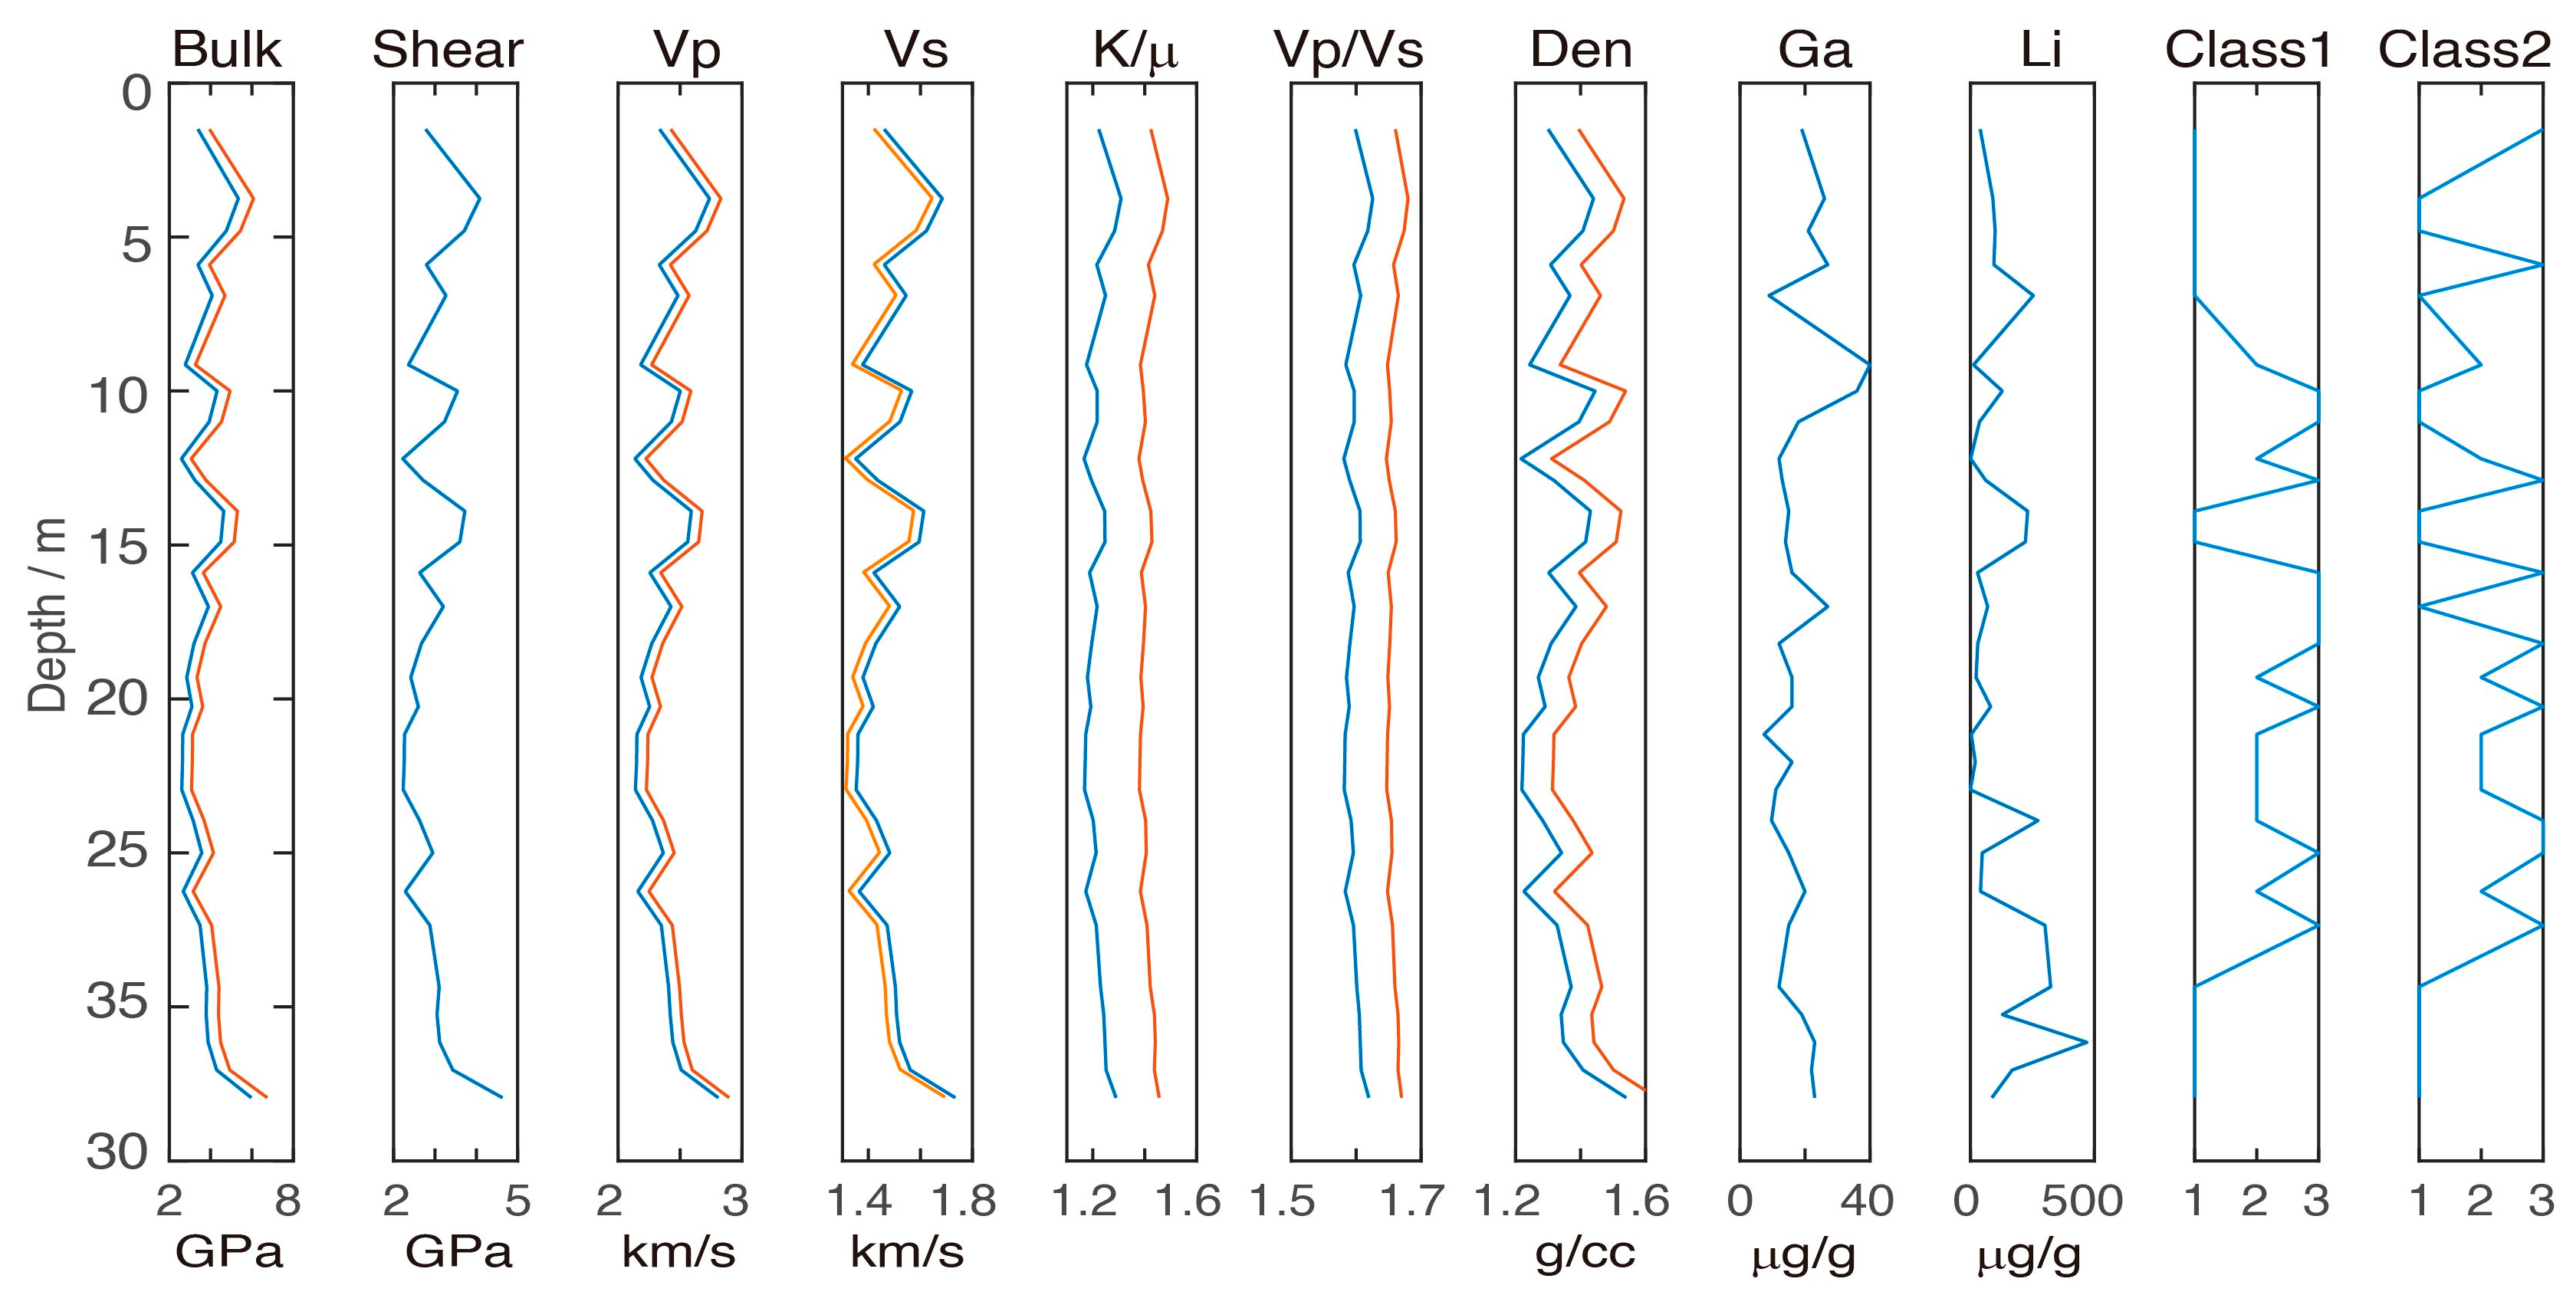
4.4. Zonal Elasticity Characteristics after Three-Class Classification
5. Discussion
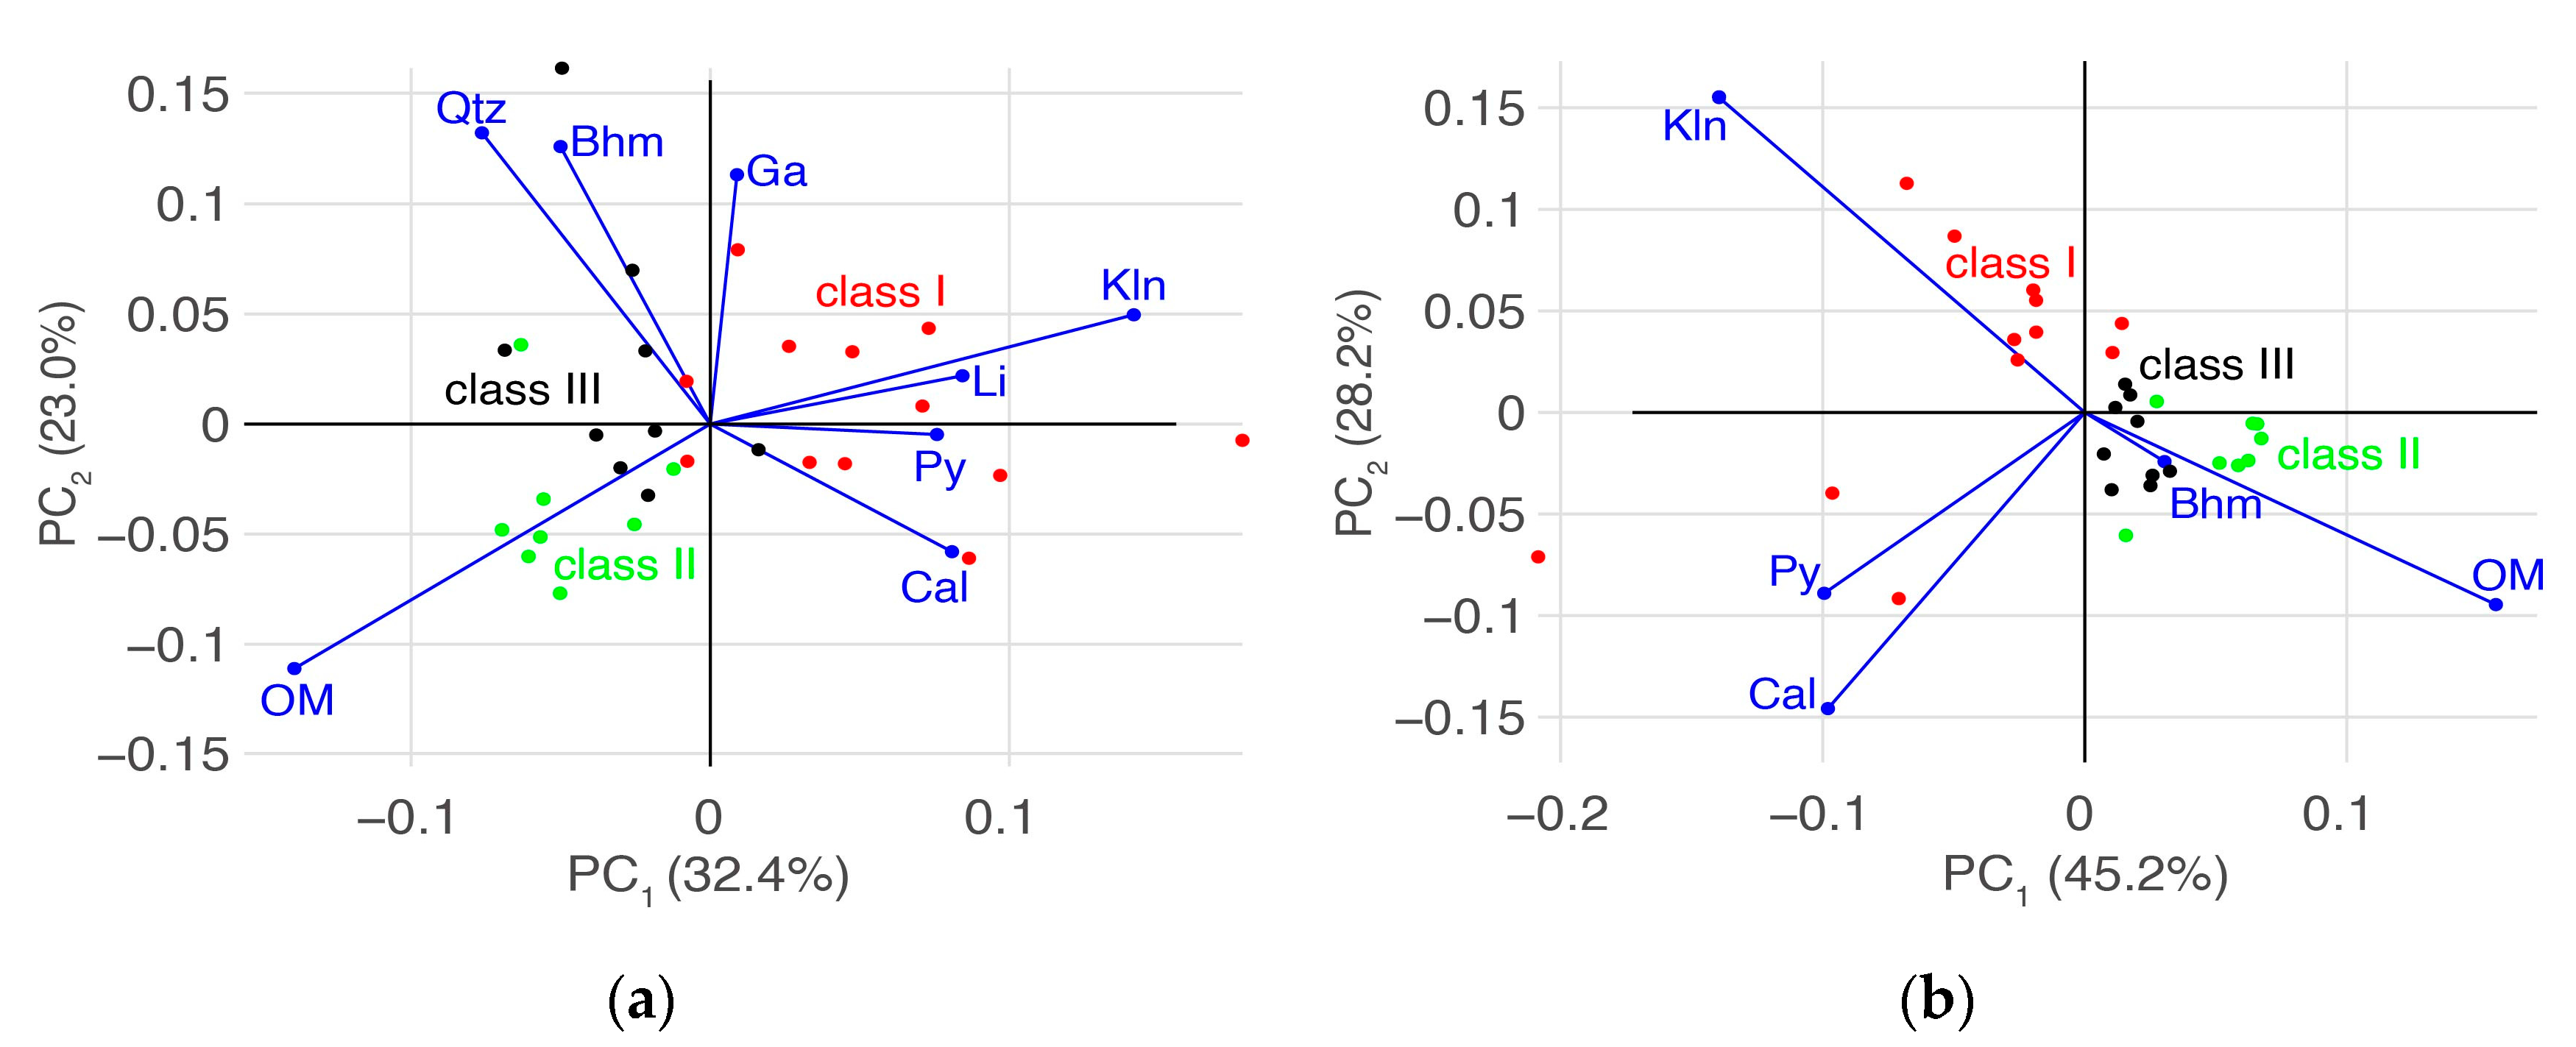
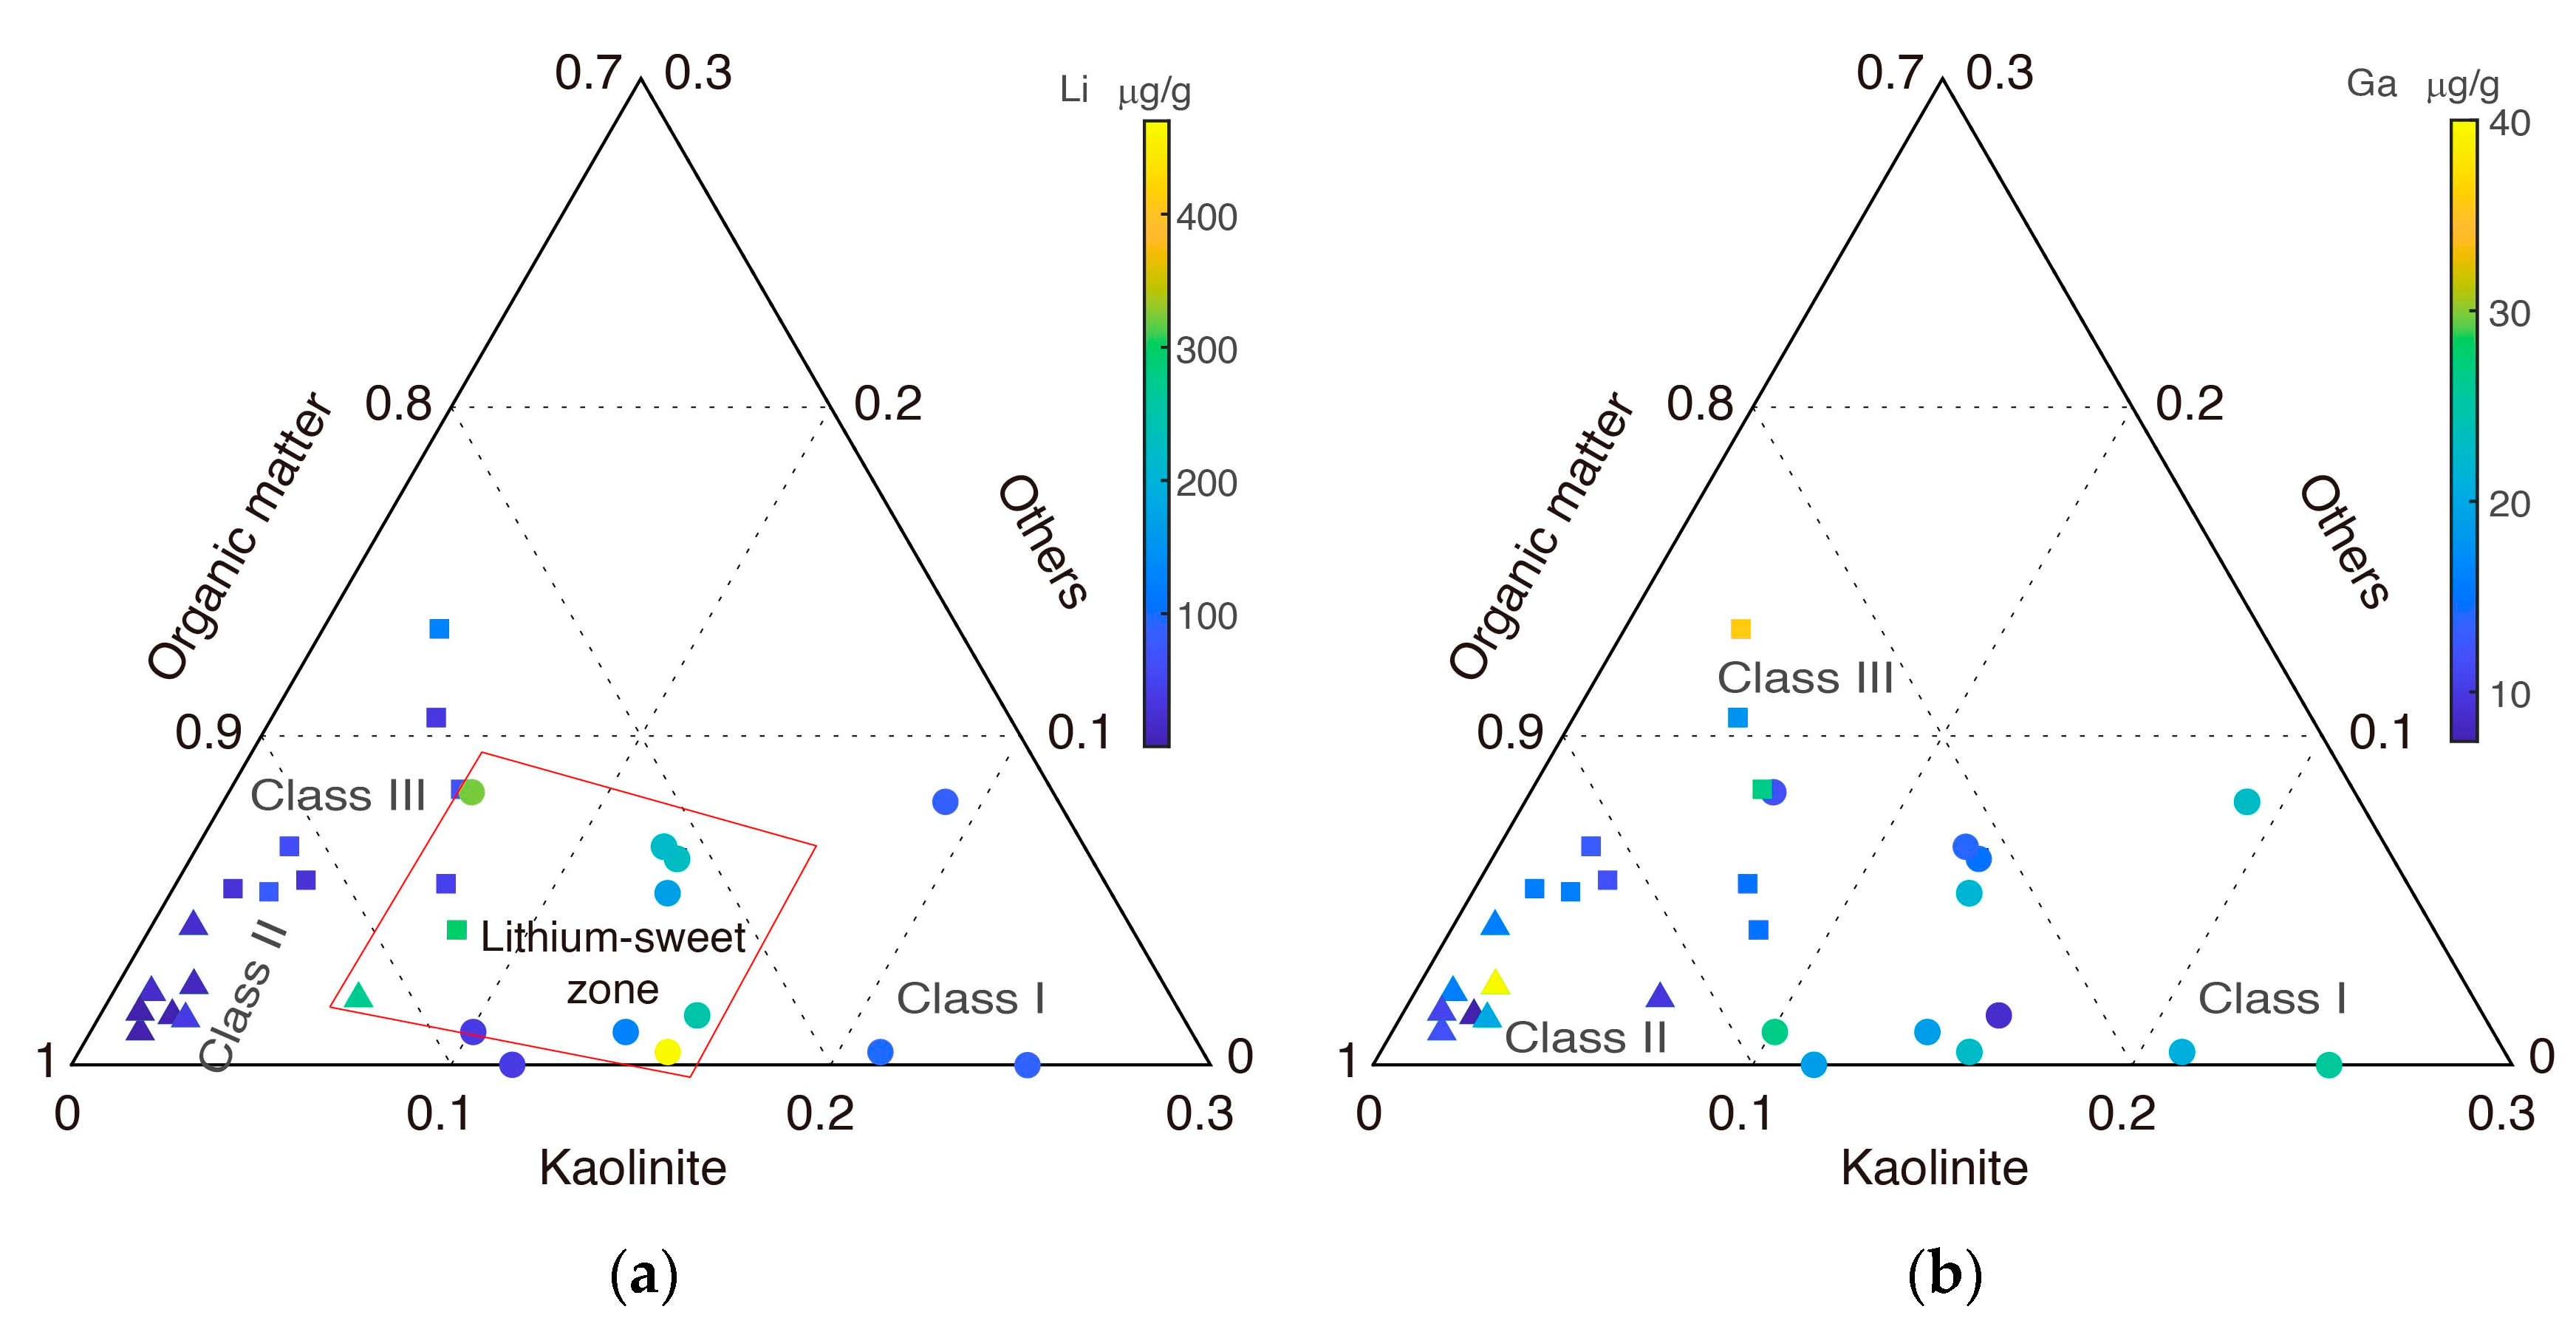
5.1. Interpretation Method with Compositional Ternary Plot
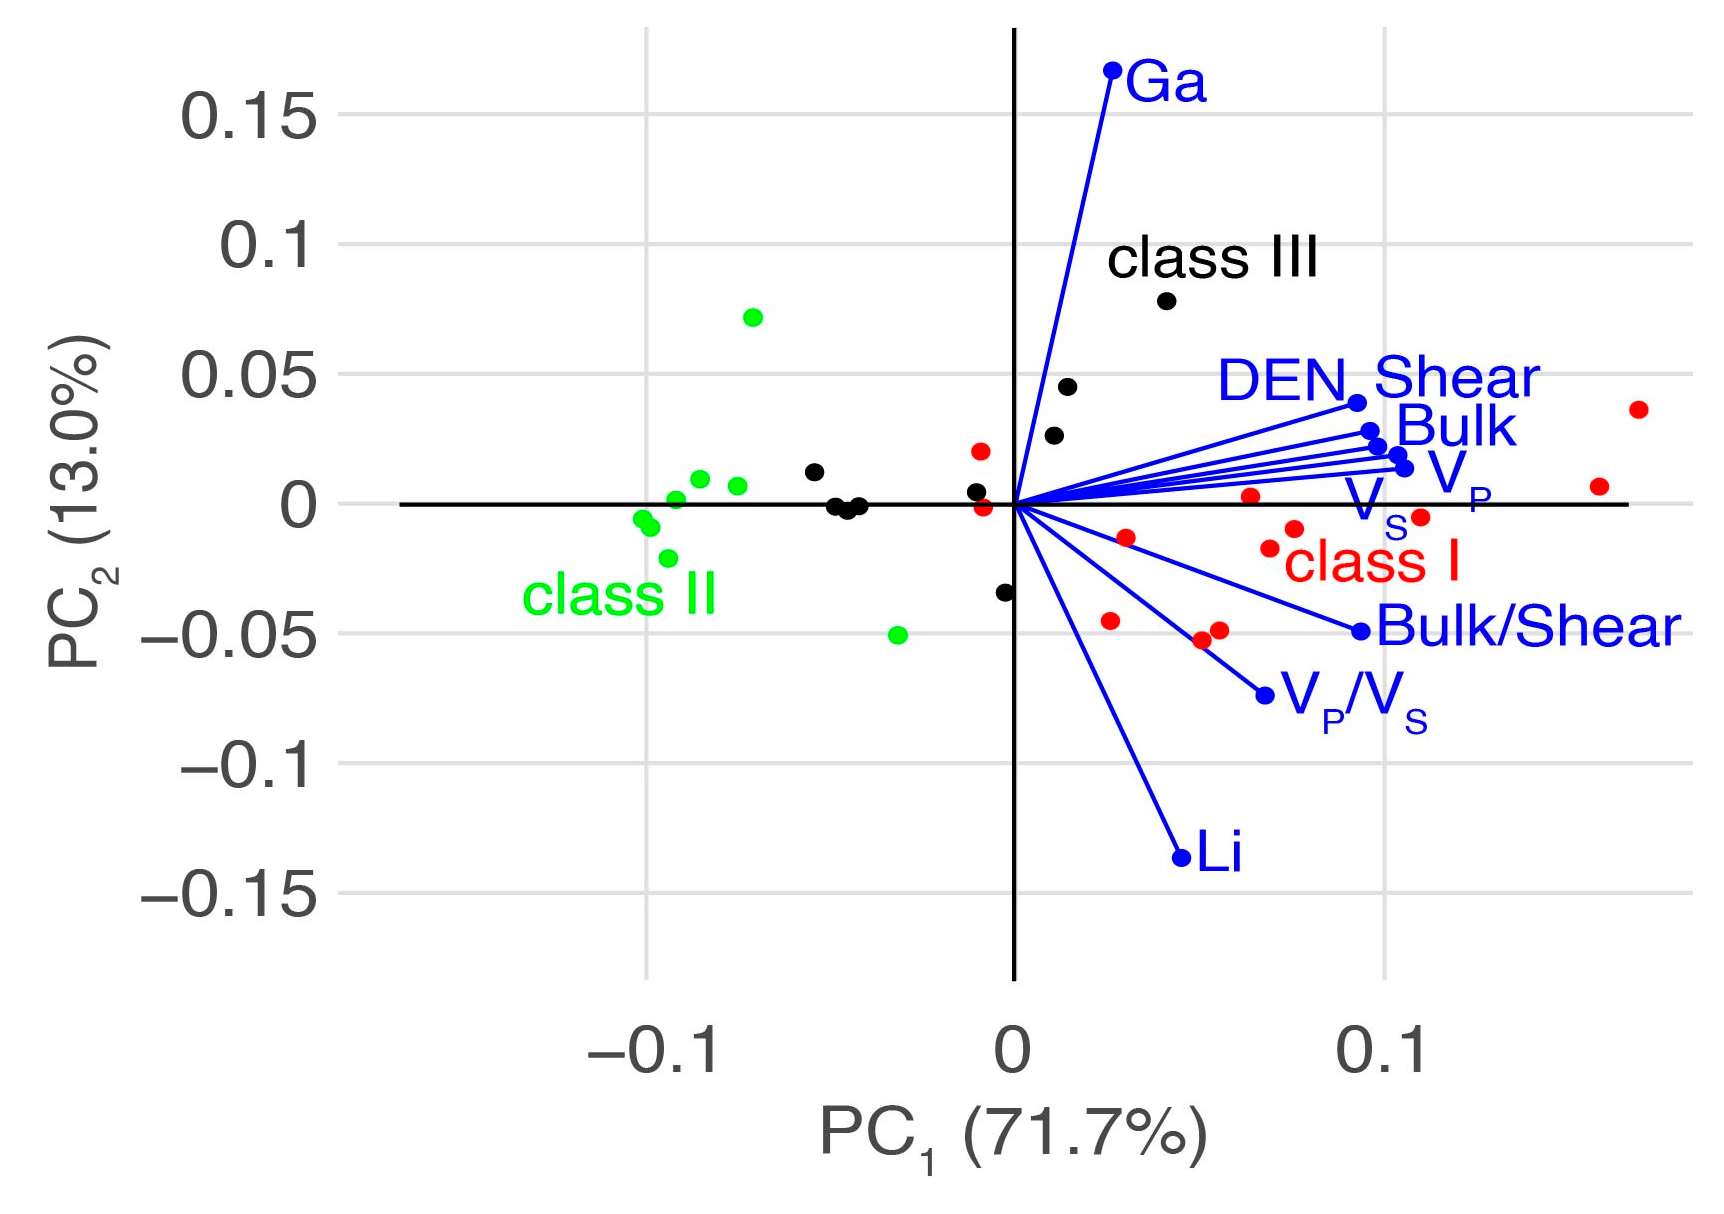
5.2. Interpretation Method with Elasticity Cross Plot
6. Conclusions
Author Contributions
Funding
Data Availability Statement
Acknowledgments
Conflicts of Interest
Appendix A. V-R-H Average
Appendix B. DEM Model
Appendix C. Gassmann Fluid Replacement
Appendix D. Elastic Parameter Transformation
References
- Musumeci, S.; Barba, V. Gallium Nitride Power Devices in Power Electronics Applications: State of Art and Perspectives. Energies 2023, 16, 3894. [Google Scholar] [CrossRef]
- Tabelin, C.B.; Dallas, J.; Casanova, S.; Pelech, T.; Bournival, G.; Saydam, S.; Canbulat, I. Towards a low-carbon society: A review of lithium resource availability, challenges and innovations in mining, extraction and recycling, and future perspectives. Miner. Eng. 2021, 163, 106743. [Google Scholar] [CrossRef]
- Greim, P.; Solomon, A.A.; Breyer, C. Assessment of lithium criticality in the global energy transition and addressing policy gaps in transportation. Nat. Commun. 2020, 11, 4570. [Google Scholar] [CrossRef] [PubMed]
- Dai, S.F.; Li, D.; Chou, C.L.; Zhao, L.; Zhang, Y.; Ren, D.; Ma, Y.W.; Sun, Y.Y. Mineralogy and geochemistry of boehmite-rich coals: New insights from the Haerwusu Surface Mine, Jungar Coalfield, Inner Mongolia, China. Int. J. Coal. Geol. 2008, 74, 185–202. [Google Scholar] [CrossRef]
- Hou, Y.; Dai, S.; Nechaev, V.P.; Finkelman, R.B.; Wang, H.; Zhang, S.; Di, S. Mineral matter in the Pennsylvanian coal from the Yangquan Mining District, northeastern Qinshui Basin, China: Enrichment of critical elements and a Se-Mo-Pb-Hg assemblage. Int. J. Coal. Geol. 2023, 266, 104178. [Google Scholar] [CrossRef]
- Jiu, B.; Huang, W.; Spiro, B.; Hao, R.; Mu, N.; Wen, L.; Hao, H. Distribution of Li, Ga, Nb, and REEs in coal as determined by LA-ICP-MS imaging: A case study from Jungar coalfield, Ordos Basin, China. Int. J. Coal. Geol. 2023, 267, 104184. [Google Scholar] [CrossRef]
- Liu, B.; Wang, J.; He, H.; Mishra, V.; Li, Y.; Wang, J.; Zhao, C. Geochemistry of Carboniferous coals from the Laoyaogou mine, Ningwu coalfield, Shanxi Province, northern China: Emphasis on the enrichment of valuable elements. Fuel 2020, 279, 118414. [Google Scholar] [CrossRef]
- Sun, B.L.; Zeng, F.G.; Moore, T.A.; Rodrigues, S.; Liu, C.; Wang, G.Q. Geochemistry of two high-lithium content coal seams, Shanxi Province, China. Int. J. Coal. Geol. 2022, 260, 104059. [Google Scholar] [CrossRef]
- Dai, S.F.; Jiang, Y.F.; Ward, C.R.; Gu, L.D.; Seredin, V.V.; Liu, H.D.; Zhou, D.; Wang, X.B.; Sun, Y.Z.; Zou, J.H.; et al. Mineralogical and geochemical compositions of the coal in the Guanbanwusu Mine, Inner Mongolia, China: Further evidence for the existence of an Al (Ga and REE) ore deposit in the Jungar Coalfield. Int. J. Coal. Geol. 2012, 98, 10–40. [Google Scholar] [CrossRef]
- Xie, P.; Hower, J.C.; Nechaev, V.P.; Ju, D.; Liu, X. Lithium and redox-sensitive (Ge, U, Mo, V) element mineralization in the Pennsylvanian coals from the Huangtupo coalfield, Shanxi, northern China: With emphasis on the interaction of infiltrating seawater and exfiltrating groundwater. Fuel 2021, 300, 120948. [Google Scholar] [CrossRef]
- Dai, S.F.; Ren, D.Y.; Li, S.S. Discovery of the superlarge gallium ore deposit in Jungar, Inner Mongolia, North China. Chin. Sci Bull. 2006, 51, 2243–2252. [Google Scholar] [CrossRef]
- Jiu, B.; Huang, W.H.; Mu, N. Mineralogy and elemental geochemistry of Permo-Carboniferous Li-enriched coal in the southern Ordos Basin, China: Implications for modes of occurrence, controlling factors and sources of Li in coal. Ore Geol. Rev. 2022, 141, 104686. [Google Scholar] [CrossRef]
- Horrocks, T.; Holden, E.J.; Wedge, D. Evaluation of automated lithology classification architectures using highly-sampled wireline logs for coal exploration. Comput. Geosci.-UK 2015, 83, 209–218. [Google Scholar] [CrossRef]
- Ameen, M.S.; Smart, B.G.D.; Somerville, J.M.; Hammilton, S.; Naji, N.A. Predicting rock mechanical properties of carbonates from wireline logs (A case study: Arab-D reservoir, Ghawar field, Saudi Arabia). Mar. Petrol. Geol. 2009, 26, 430–444. [Google Scholar] [CrossRef]
- Bai, Y.; Tan, M.J.; Shi, Y.J.; Zhang, H.T.; Li, G.R. Regression Committee Machine and Petrophysical Model Jointly Driven Parameters Prediction From Wireline Logs in Tight Sandstone Reservoirs. IEEE Trans. Geosci. Remote Sens. 2022, 60, 5900409. [Google Scholar] [CrossRef]
- Haque, A.K.M.E.; Qadri, S.M.T.; Bhuiyan, M.A.H.; Navid, M.; Nabawy, B.S.; Hakimi, M.H.; Abd-El-Aal, A.K. Integrated wireline log and seismic attribute analysis for the reservoir evaluation: A case study of the Mount Messenger Formation in Kaimiro Field, Taranaki Basin, New Zealand. J. Nat. Gas Sci. Eng. 2022, 99, 104452. [Google Scholar] [CrossRef]
- Shi, J.X.; Zeng, L.B.; Dong, S.Q.; Wang, J.P.; Zhang, Y.Z. Identification of coal structures using geophysical logging data in Qinshui Basin, China: Investigation by kernel Fisher discriminant analysis. Int. J. Coal. Geol. 2020, 217, 103314. [Google Scholar] [CrossRef]
- Vallee, M.A.; Smith, R.S.; Keating, P. Metalliferous mining geophysics—State of the art after a decade in the new millennium. Geophysics 2011, 76, W31–W50. [Google Scholar] [CrossRef]
- Dai, S.F.; Yang, J.Y.; Ward, C.R.; Hower, J.C.; Liu, H.D.; Garrison, T.M.; French, D.; O’Keefe, J.M.K. Geochemical and mineralogical evidence for a coal-hosted uranium deposit in the Yili Basin, Xinjiang, northwestern China. Ore Geol. Rev. 2015, 70, 1–30. [Google Scholar] [CrossRef]
- Gurevich, B.; Makarynska, D.; Pervukhina, M. Ultrasonic moduli for fluid-saturated rocks: Mavko-Jizba relations rederived and generalized. Geophysics 2009, 74, N25–N30. [Google Scholar] [CrossRef]
- Karimpouli, S.; Tahmasebi, P.; Saenger, E.H. Estimating 3D elastic moduli of rock from 2D thin-section images using differential effective medium theory. Geophysics 2018, 83, Mr211–Mr219. [Google Scholar] [CrossRef]
- Neto, I.A.L.; Missagia, R.M.; Ceia, M.A.; Archilha, N.L.; Oliveira, L.C. Carbonate pore system evaluation using the velocity-porosity-pressure relationship, digital image analysis, and differential effective medium theory. J. Appl. Geophys. 2014, 110, 23–33. [Google Scholar] [CrossRef]
- Zhao, L.; Chen, T.; Mukerji, T.; Zhang, M.; Xing, T. Brown and Korringa’s expression for the saturated bulk modulus at high frequencies: Modification of Mavko and Jizba’s squirt flow model. Geophysics 2022, 87, MR201–MR208. [Google Scholar] [CrossRef]
- Chen, T.; Song, X. Are Coal-Hosted Gallium-Rich Ores Elastically Detectable: A Rock-Physics Modeling Perspective. Minerals 2022, 12, 1619. [Google Scholar] [CrossRef]
- Gang, X.; Tingting, M.; Chaofeng, W.; Hongwei, J.; Yunlong, W. Study on the Characteristics of Coal Ultrasonic Response during Loading and Its Influence Mechanism. Sustainability 2023, 15, 1093. [Google Scholar] [CrossRef]
- Zhao, T.; Zou, G.; Peng, S.; Zeng, H.; Gong, F.; Yin, Y. Analysis of the viscoelasticity in coal based on the fractal theory. Geophysics 2022, 88, WA177–WA187. [Google Scholar] [CrossRef]
- Zou, G.G.; Zeng, H.; Peng, S.P.; Zhou, X.Y.; Satibekova, S. Bulk density and bulk modulus of adsorbed coalbed methane. Geophysics 2019, 84, K11–K21. [Google Scholar] [CrossRef]
- Ba, J.; Cao, H.; Carcione, J.M.; Tang, G.; Yan, X.F.; Sun, W.T.; Nie, J.X. Multiscale rock-physics templates for gas detection in carbonate reservoirs. J. Appl. Geophys. 2013, 93, 77–82. [Google Scholar] [CrossRef]
- Ba, J.; Hu, P.; Tan, W.H.; Muller, T.M.; Fu, L.Y. Brittle mineral prediction based on rock-physics modelling for tight oil reservoir rocks. J. Geophys. Eng. 2021, 18, 970–983. [Google Scholar] [CrossRef]
- Pan, X.P.; Zhang, G.Z.; Chen, J.J. The construction of shale rock physics model and brittleness prediction for high-porosity shale gas-bearing reservoir. Petrol. Sci. 2020, 17, 658–670. [Google Scholar] [CrossRef]
- Finkelman, R.B.; Palmer, C.A.; Wang, P. Quantification of the modes of occurrence of 42 elements in coal. Int. J. Coal. Geol. 2018, 185, 138–160. [Google Scholar] [CrossRef]
- Wedepohl, K.H. Handbook of Geochemistry; Springer: Heidelberg, Germany, 1969. [Google Scholar]
- Fairén, A.G.; Losa-Adams, E.; Gil-Lozano, C.; Gago-Duport, L.; Uceda, E.R.; Squyres, S.W.; Rodríguez, J.A.P.; Davila, A.F.; McKay, C.P. Tracking the weathering of basalts on Mars using lithium isotope fractionation models. Geochem. Geophys. Geosyst. 2015, 16, 1172–1197. [Google Scholar] [CrossRef] [PubMed]
- Li, W.; Liu, X.-M. Experimental investigation of lithium isotope fractionation during kaolinite adsorption: Implications for chemical weathering. Geochim. Cosmochim. Acta 2020, 284, 156–172. [Google Scholar] [CrossRef]
- Li, W.; Chen, T.; Song, X.; Gong, T.; Liu, M. Reconstruction of critical coalbed methane logs with principal component regression model: A case study. Energ. Explor. Exploit. 2020, 38, 1178–1193. [Google Scholar] [CrossRef]
- Kanungo, T.; Mount, D.M.; Netanyahu, N.S.; Piatko, C.D.; Silverman, R.; Wu, A.Y. An efficient k-means clustering algorithm: Analysis and implementation. IEEE Trans. Pattern Anal. Mach. Intell. 2002, 24, 881–892. [Google Scholar] [CrossRef]
- Dai, S.F.; Hower, J.C.; Finkelman, R.B.; Graham, I.T.; French, D.; Ward, C.R.; Eskenazy, G.; Wei, Q.; Zhao, L. Organic associations of non-mineral elements in coal: A review. Int. J. Coal. Geol. 2020, 218, 103347. [Google Scholar] [CrossRef]
- Geboy, N.J.; Engle, M.A.; Hower, J.C. Whole-coal versus ash basis in coal geochemistry: A mathematical approach to consistent interpretations. Int. J. Coal. Geol. 2013, 113, 41–49. [Google Scholar] [CrossRef]
- Jiu, B.; Jin, Z.; Wang, Z. Multiscale in-situ elemental characterization of critical elements in low rank coal, implications for modes of occurrence. Fuel 2023, 349, 128632. [Google Scholar] [CrossRef]
- Cosenza, P.; Giot, R.; Hedan, S. Elastic moduli of clay minerals and their aggregates: A review. Appl. Clay Sci. 2023, 236, 106878. [Google Scholar] [CrossRef]
- Mavko, G.; Mukerji, T.; Dvorkin, J. The Rock Physics Handbook; Cambridge University Press: Cambridge, UK, 2020; pp. 613–672. [Google Scholar]
- Cui, C.; Chang, S.L.; Yao, Y.B.; Cao, L.T. Quantify Coal Macrolithotypes of a Whole Coal Seam: A Method Combing Multiple Geophysical Logging and Principal Component Analysis. Energies 2021, 14, 213. [Google Scholar] [CrossRef]


| Sample | OM vol% | Kln vol% | Qtz vol% | Py vol% | Rt vol% | Cal vol% | Sd vol% | Bhm vol% | Ga μg/g | Li μg/g | Class |
|---|---|---|---|---|---|---|---|---|---|---|---|
| H-1-C | 88.2 | 11.6 | 0.2 | 0 | 0 | 0 | 0 | 0 | 19 | 40 | I |
| H-2-C | 74.6 | 25.1 | 0.2 | 0 | 0.1 | 0 | 0 | 0 | 26 | 91 | I |
| H-3-C | 78 | 21 | 0.6 | 0 | 0 | 0.4 | 0 | 0 | 21 | 100 | I |
| H-4-C | 88 | 10 | 0.6 | 0.2 | 0.4 | 0.2 | 0 | 0.6 | 27 | 95 | I |
| H-5-C | 82.6 | 15.7 | 0 | 0.2 | 0.2 | 0 | 0 | 1.3 | 8.9 | 254 | I |
| H-6-C | 94.8 | 2 | 0.6 | 0 | 0.2 | 0.2 | 0 | 2.2 | 40 | 13 | II |
| H-7-C | 82 | 3 | 1.6 | 0.6 | 0.4 | 0 | 0 | 12.4 | 36 | 129 | III |
| H-8-C | 84.6 | 4.3 | 0.4 | 0.4 | 0.2 | 1.6 | 0 | 8.5 | 18 | 37 | III |
| H-9-C | 97.2 | 1.3 | 0.5 | 0.2 | 0 | 0 | 0 | 0.8 | 12 | 1.2 | II |
| H-10-C | 90.3 | 2.4 | 0.7 | 0.4 | 0 | 1.5 | 0 | 4.7 | 13 | 62 | III |
| H-11-C | 79.6 | 12.6 | 1.6 | 0.4 | 0 | 0.6 | 0 | 5.2 | 15 | 231 | I |
| H-12-C | 80.5 | 12.2 | 0.7 | 0.2 | 0 | 1.4 | 0 | 5 | 14 | 222 | I |
| H-13-C | 91.2 | 1.6 | 1.8 | 0.4 | 0.2 | 1.2 | 0 | 3.6 | 16 | 29 | III |
| H-14-C | 84.7 | 6 | 0.8 | 0.4 | 0 | 0.6 | 0.2 | 7.3 | 27 | 70 | III |
| H-15-C | 90.5 | 3.4 | 0.4 | 0.6 | 0 | 1.9 | 0.2 | 3 | 12 | 30 | III |
| H-16-C | 94.3 | 1.1 | 0.4 | 0.9 | 0 | 2 | 0 | 1.3 | 16 | 23 | II |
| H-17-C | 91.6 | 2.6 | 0.6 | 0.2 | 0 | 2.2 | 0 | 2.8 | 16 | 82 | III |
| H-18-C | 96.4 | 1.9 | 0.2 | 0.2 | 0 | 1 | 0 | 0.3 | 7.4 | 3.9 | II |
| H-19-C | 96.6 | 1 | 0.2 | 0 | 0 | 1 | 0 | 1.2 | 16 | 20 | II |
| H-20-C | 97 | 1 | 0.4 | 0.2 | 0 | 0.8 | 0 | 0.6 | 11 | 0.06 | II |
| H-21-C | 90.7 | 6.5 | 0.8 | 0 | 0 | 1 | 0 | 1 | 9.7 | 273 | II |
| H-22-C | 87.2 | 7.1 | 0.2 | 0.2 | 0 | 0.7 | 0 | 4.6 | 15 | 48 | III |
| H-23-C | 96.1 | 2.3 | 0.2 | 0 | 0 | 0.2 | 0 | 1.2 | 20 | 41 | II |
| H-24-C | 87.8 | 8.1 | 0 | 0.2 | 0 | 0.6 | 0 | 3.3 | 15 | 301 | III |
| H-25-C | 85.4 | 6.3 | 0 | 0.9 | 0 | 6 | 0 | 1.4 | 12 | 324 | I |
| H-26-C | 84.9 | 14.1 | 0 | 0.2 | 0 | 0.8 | 0 | 0 | 19 | 129 | I |
| H-27-C | 84.1 | 15.5 | 0 | 0.2 | 0 | 0.2 | 0 | 0 | 23 | 470 | I |
| H-28-C | 81.7 | 13.1 | 0 | 1.4 | 0 | 3.8 | 0 | 0 | 22 | 169 | I |
| H-29-C | 73 | 19 | 0 | 3.2 | 0 | 4.8 | 0 | 0 | 23 | 87 | I |
| Content | PC1 | PC2 | PC3 | PC4 | PC5 |
|---|---|---|---|---|---|
| Organic | 0.67 | 0.09 | −0.33 | 0.10 | 0.65 |
| Kaolinite | −0.66 | −0.35 | −0.18 | −0.05 | 0.64 |
| Calcite | −0.20 | 0.78 | −0.08 | −0.57 | 0.14 |
| Pyrite | −0.26 | 0.52 | 0.04 | 0.81 | 0.09 |
| Boehmite | 0.11 | 0.01 | 0.92 | −0.06 | 0.37 |
| Content | Eigenvalues | Variance Contributions | Cumulative Contributions |
|---|---|---|---|
| PC1 | 0.62 | 0.50 | 0.50 |
| PC 2 | 0.32 | 0.25 | 0.75 |
| PC 3 | 0.27 | 0.21 | 0.96 |
| PC 4 | 0.04 | 0.04 | 1.00 |
| PC5 | 0.00 | 0.00 | 1.00 |
Disclaimer/Publisher’s Note: The statements, opinions and data contained in all publications are solely those of the individual author(s) and contributor(s) and not of MDPI and/or the editor(s). MDPI and/or the editor(s) disclaim responsibility for any injury to people or property resulting from any ideas, methods, instructions or products referred to in the content. |
© 2024 by the authors. Licensee MDPI, Basel, Switzerland. This article is an open access article distributed under the terms and conditions of the Creative Commons Attribution (CC BY) license (https://creativecommons.org/licenses/by/4.0/).
Share and Cite
Fu, J.; Chen, T.; Cui, F. Zonal Geochemistry and Elasticity Characteristics of Gallium- and Lithium-Rich No. 6 Coalbed in the Haerwusu Mine, North China. Minerals 2024, 14, 404. https://doi.org/10.3390/min14040404
Fu J, Chen T, Cui F. Zonal Geochemistry and Elasticity Characteristics of Gallium- and Lithium-Rich No. 6 Coalbed in the Haerwusu Mine, North China. Minerals. 2024; 14(4):404. https://doi.org/10.3390/min14040404
Chicago/Turabian StyleFu, Jiannan, Tongjun Chen, and Fan Cui. 2024. "Zonal Geochemistry and Elasticity Characteristics of Gallium- and Lithium-Rich No. 6 Coalbed in the Haerwusu Mine, North China" Minerals 14, no. 4: 404. https://doi.org/10.3390/min14040404