
The Role of Water Content and Binder to Aggregate Ratio on the Performance of Metakaolin-Based Geopolymer Mortars


Abstract
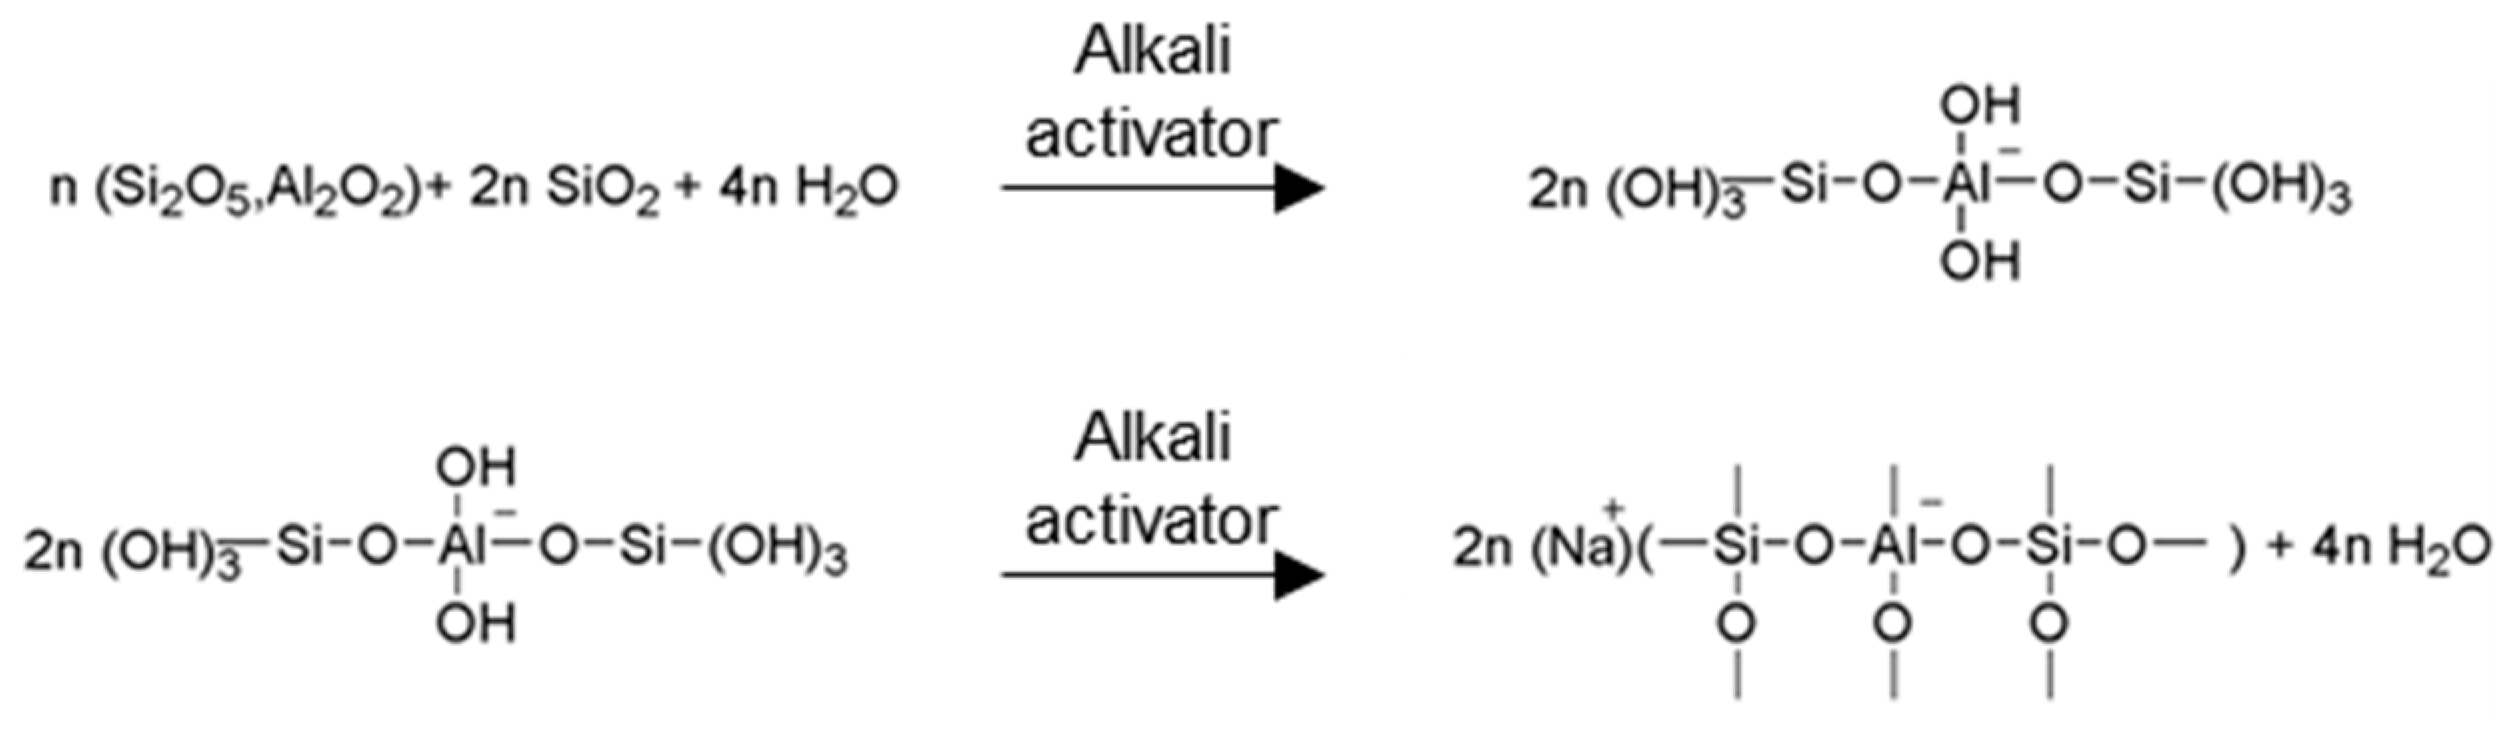
:1. Introduction
2. Materials and Methods
2.1. Raw Materials
2.2. Sample Preparation
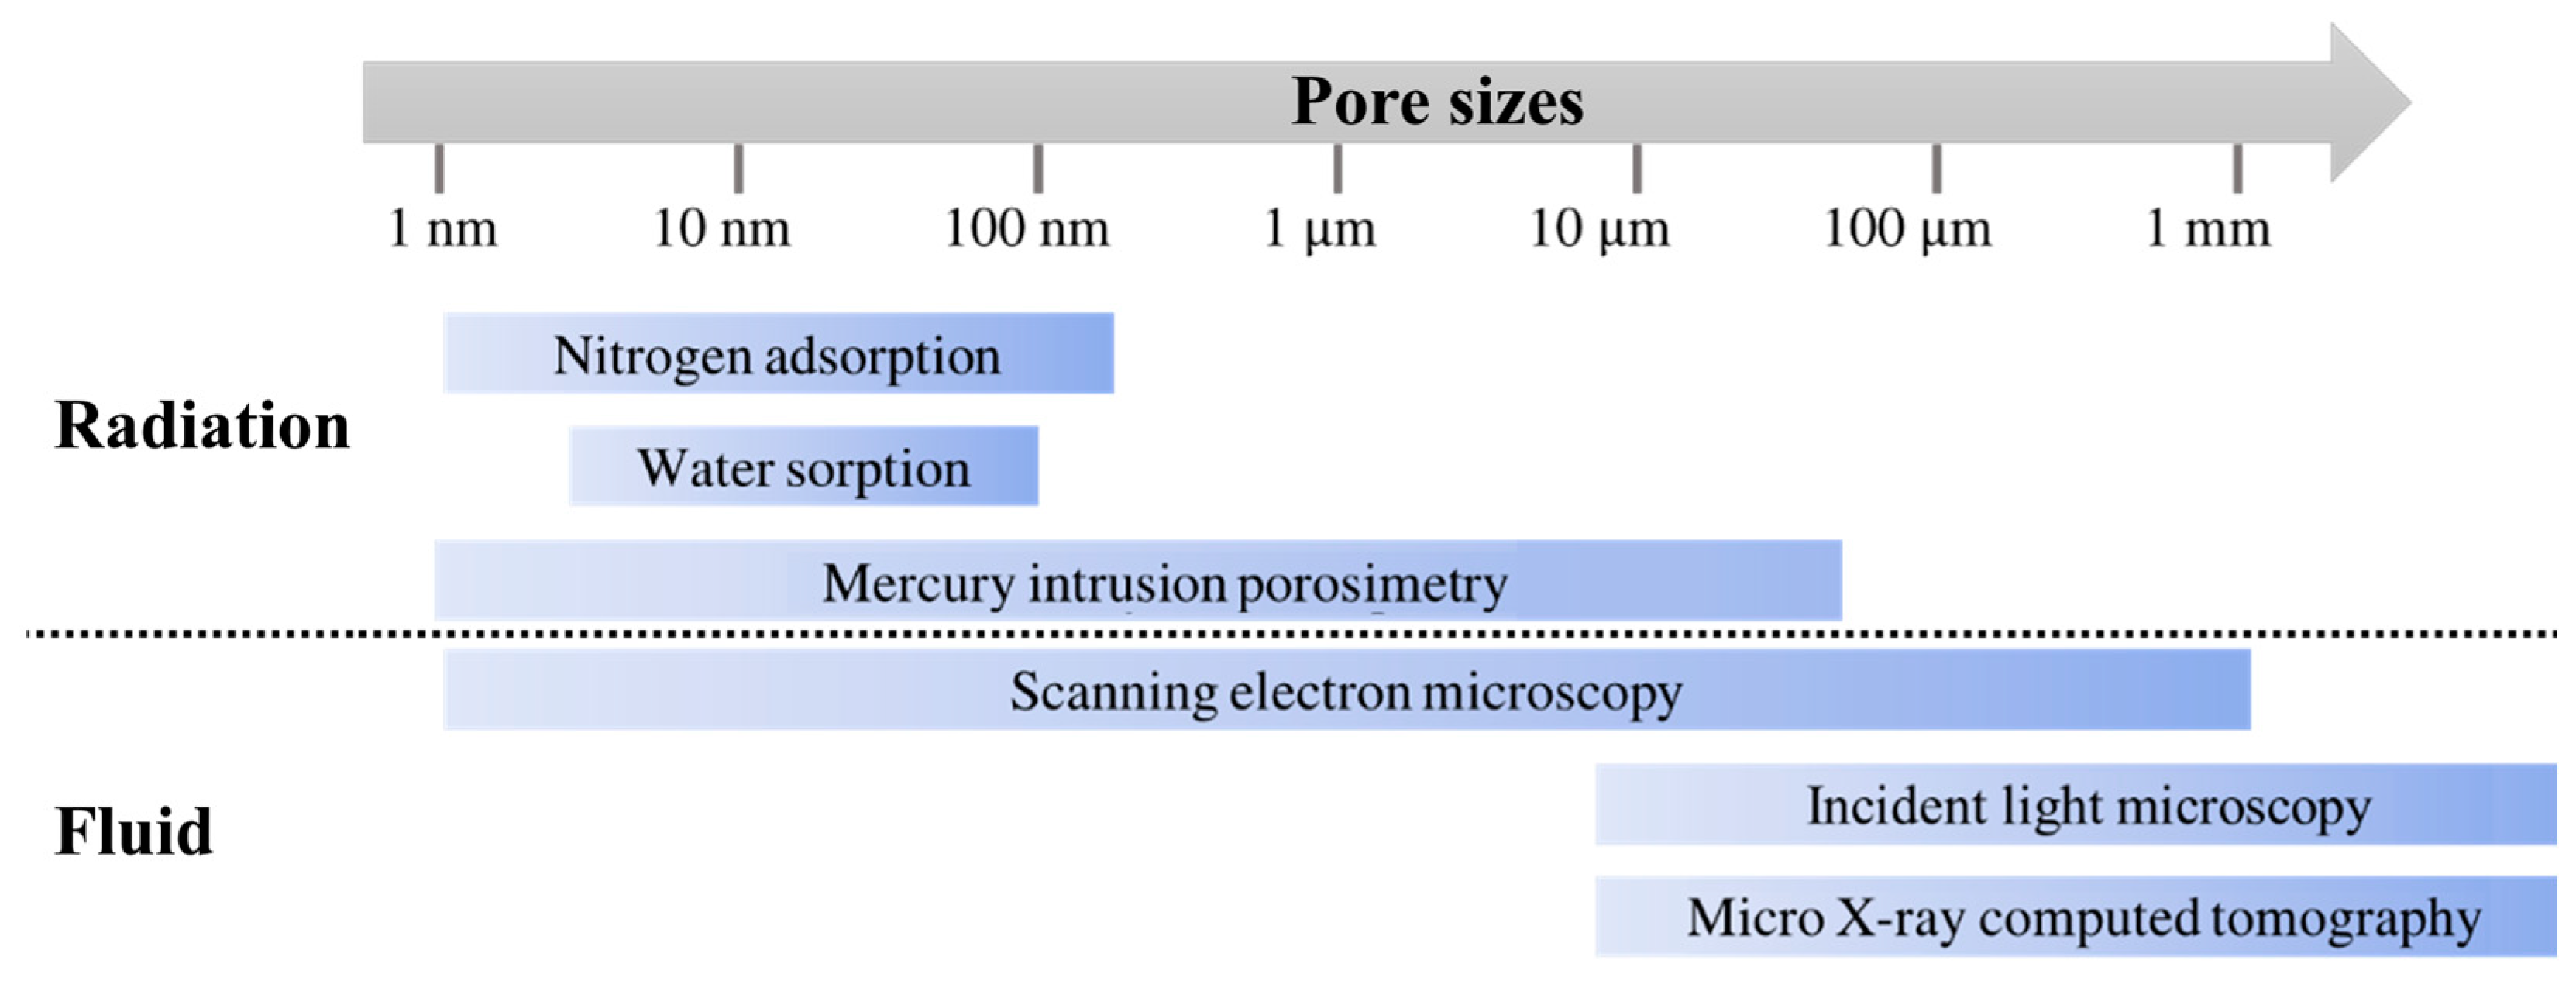
2.3. Methods
- εw = porosity determined for water
- ms = mass of the water saturated specimens
- md = mass of dried specimens
- pw = density of water
- V = sample volume
3. Results and Discussion
3.1. The Role of the Water Content in the Geopolymerization Process
3.1.1. Workability of the Fresh Mortar
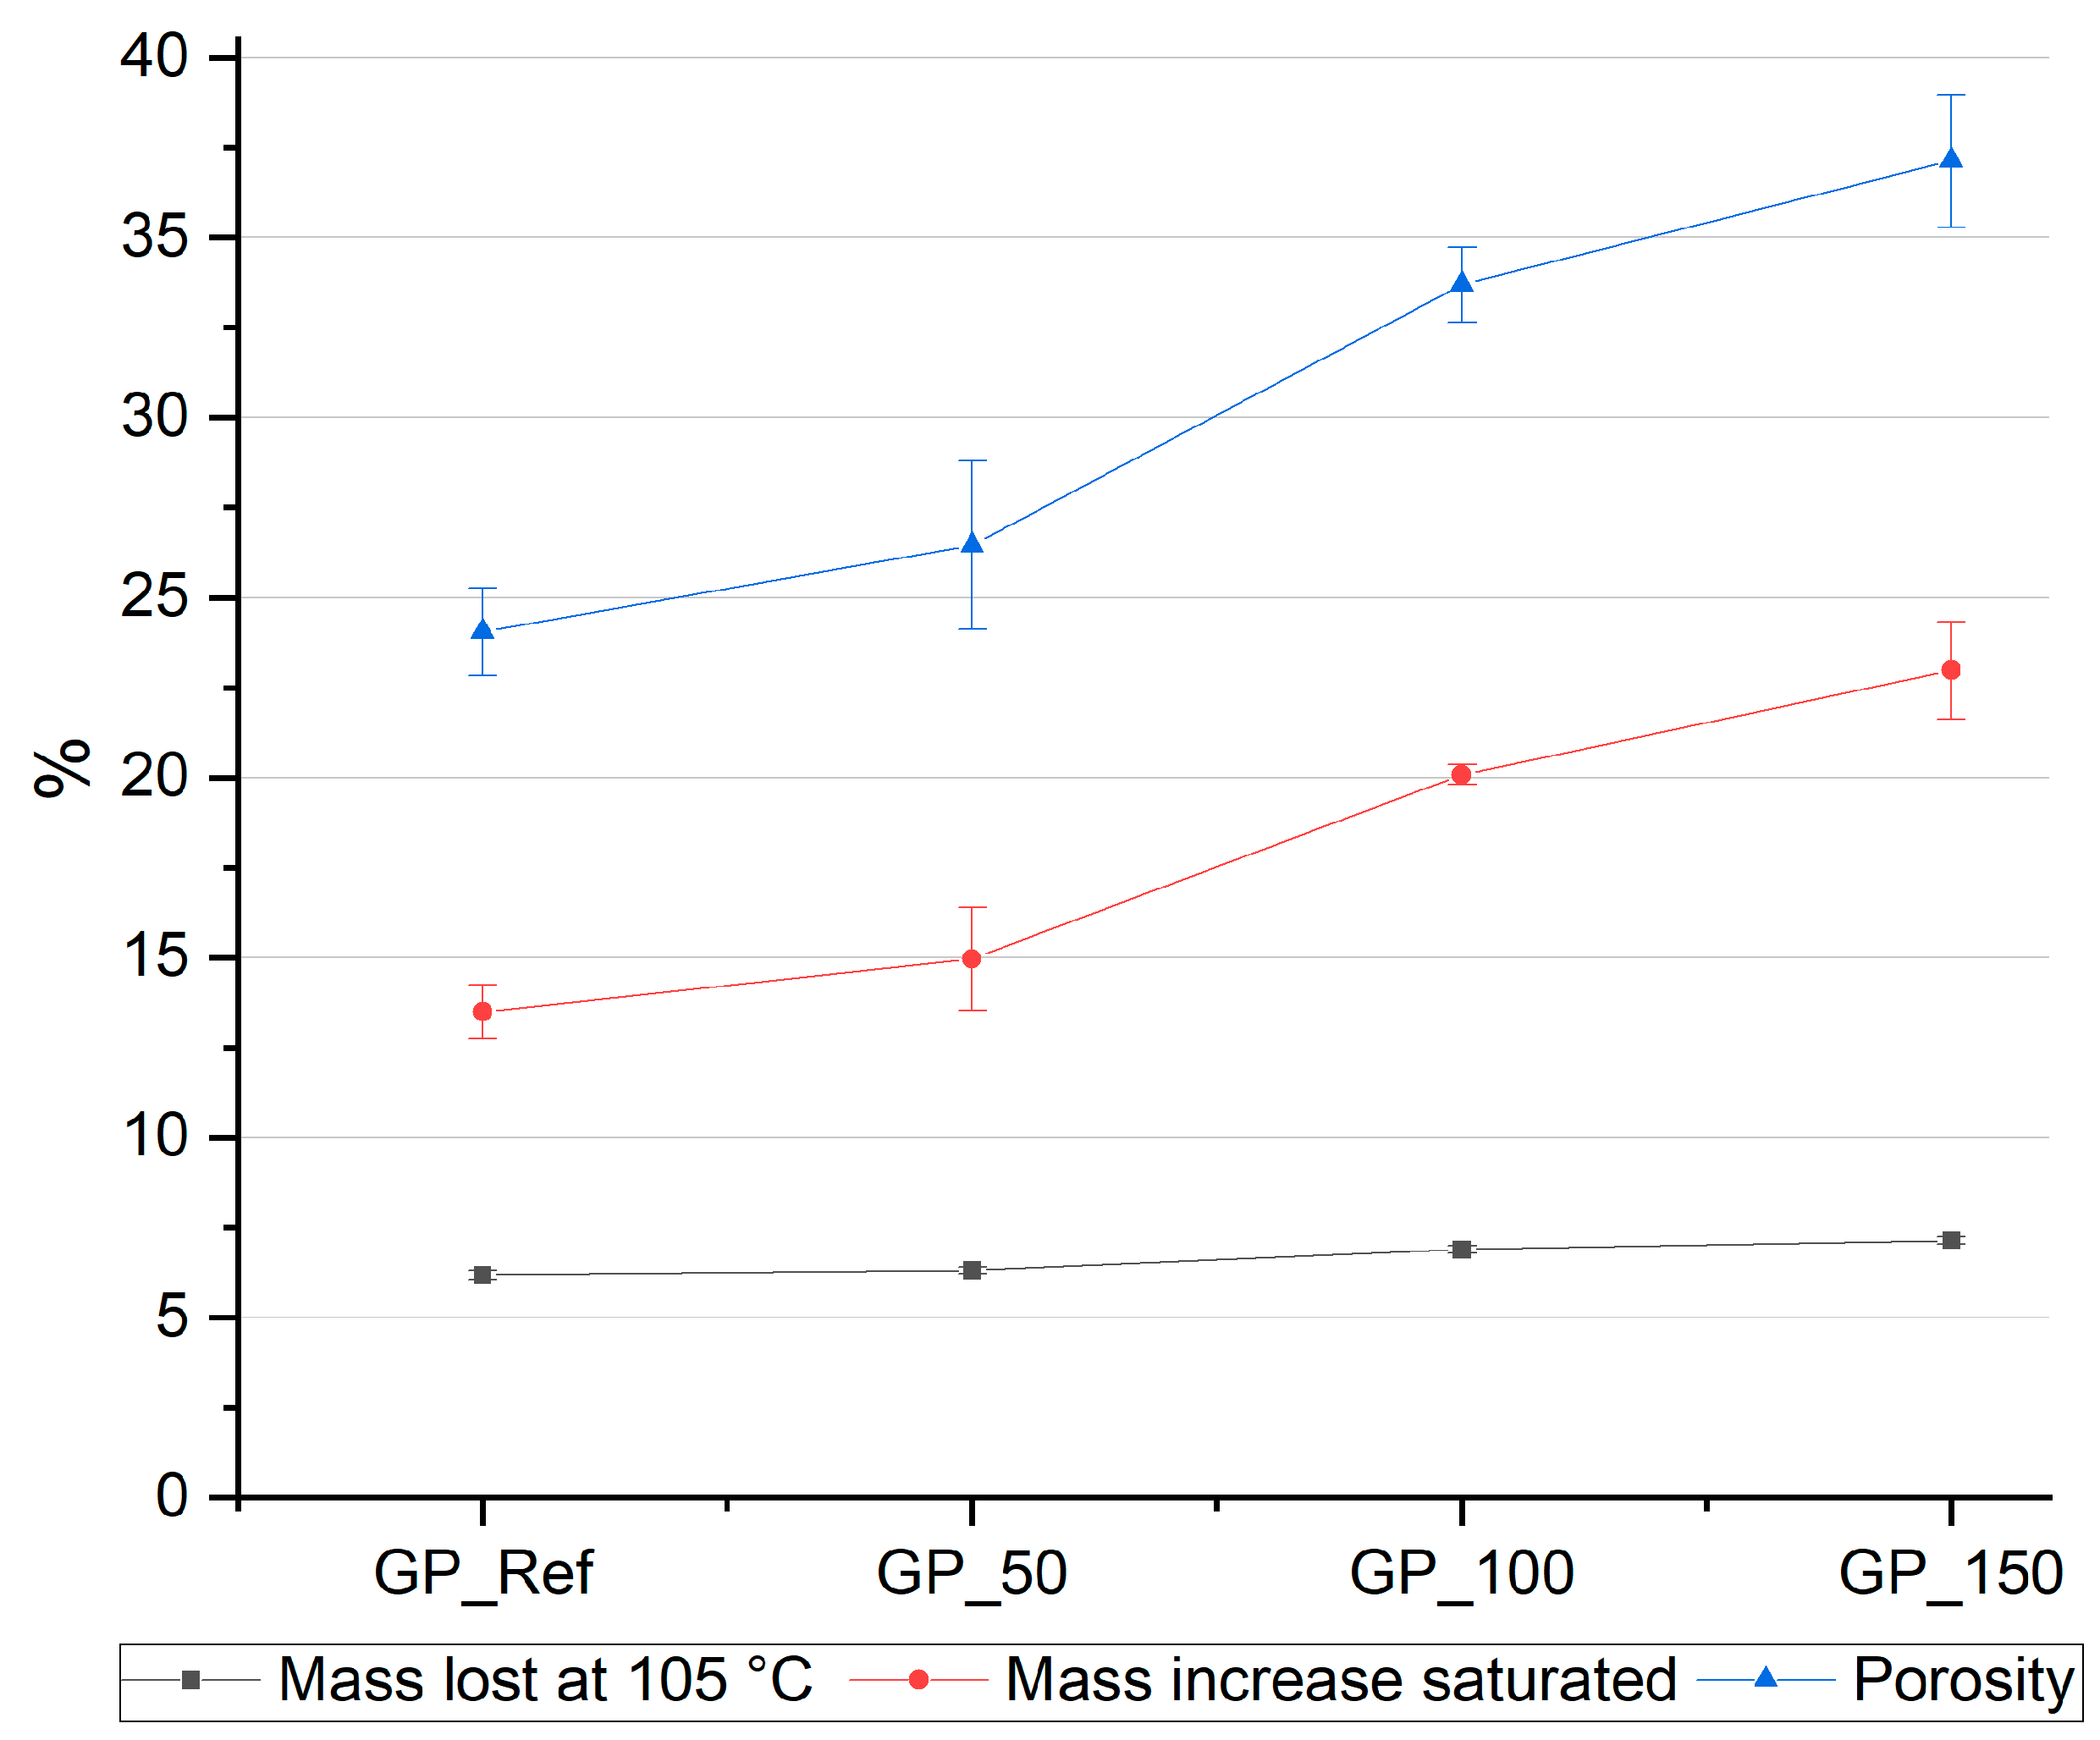
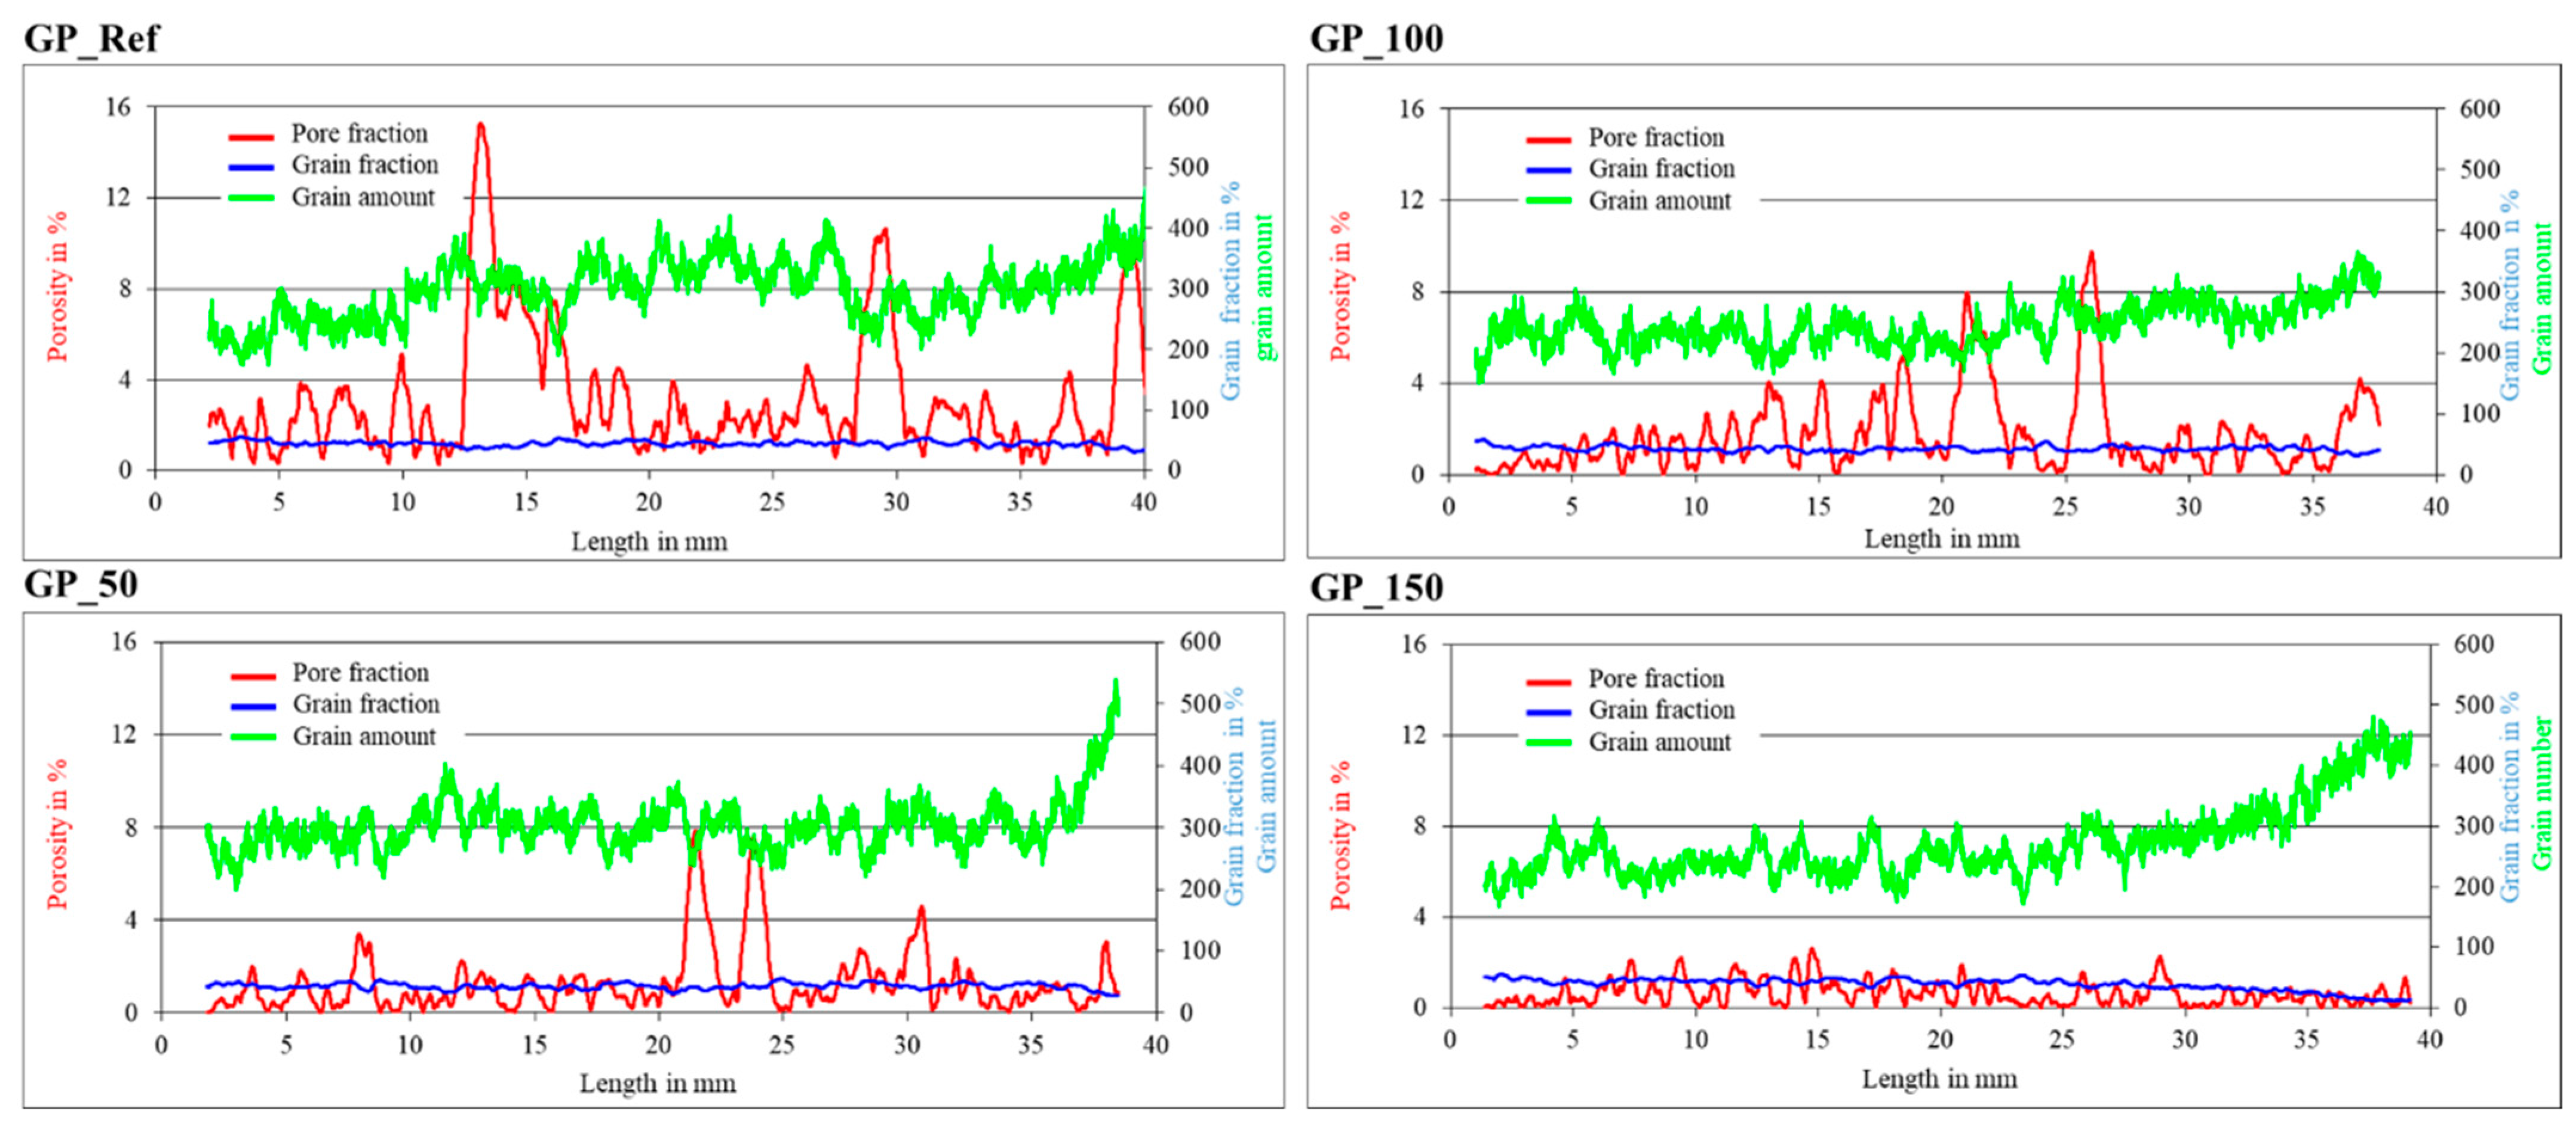
3.1.2. Investigation of the Porosity of Mortar Specimens
3.1.3. Mechanical Properties of the Mortar Specimens
3.2. The Role of the Binder to Aggregate Ratio
Mechanical Properties of the Mortar Specimens
4. Conclusions
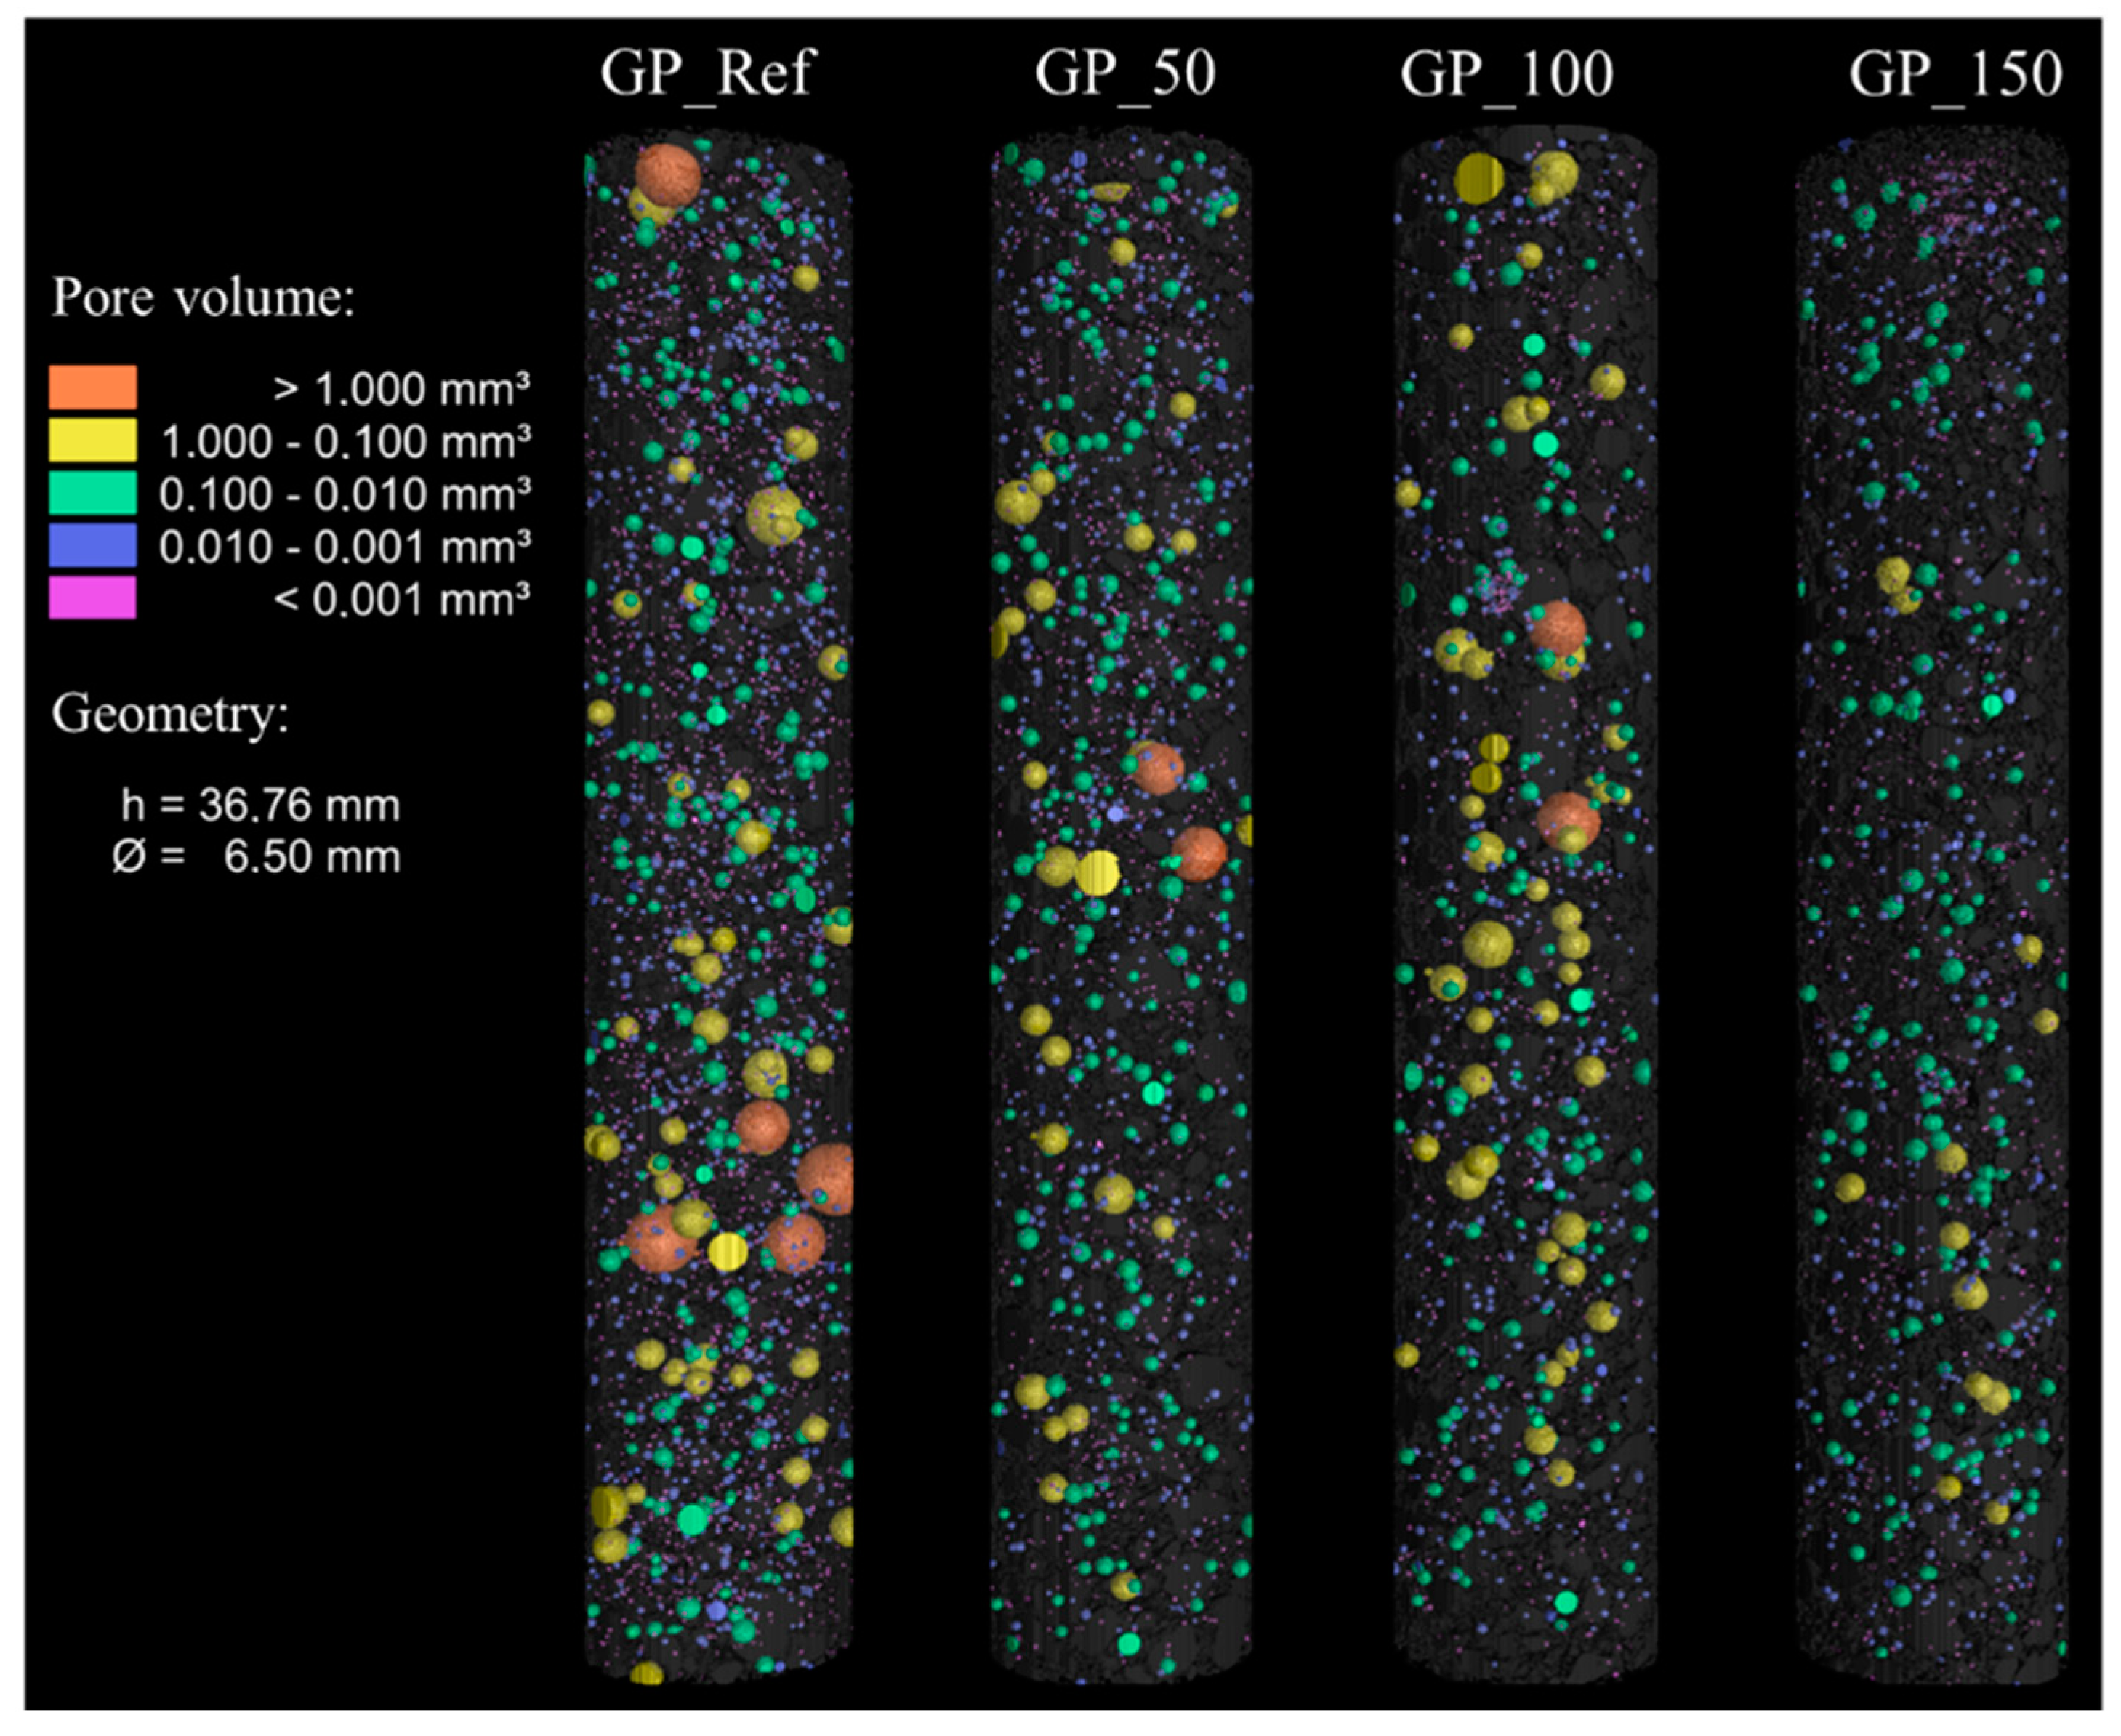
- A higher water content of the geopolymer mixture leads to a better workability, as indicated by the increase in flow spread of the fresh mortar, from 190 mm for GP-Ref to over 300 mm for GP_150. This enhanced workability is also indicated by the increase of relative flow spread from 2.6 for GP_Ref to 8.0 for GP_150. Simultaneously, the compressive strengths of the mortar specimens decreased, from 54.3 MPa for GP_Ref to 29.1 MPa for GP_150, due to an increase in capillary porosity. Simultaneously, the flexural strength declined from 4.4 MPa GP_Ref to 4.0 MPa for GP_150 as the water content increased. At the same time, the increasing water content led to an improved deaeration effect and therefore a low air void content, as indicated by micro X-ray computer tomography.
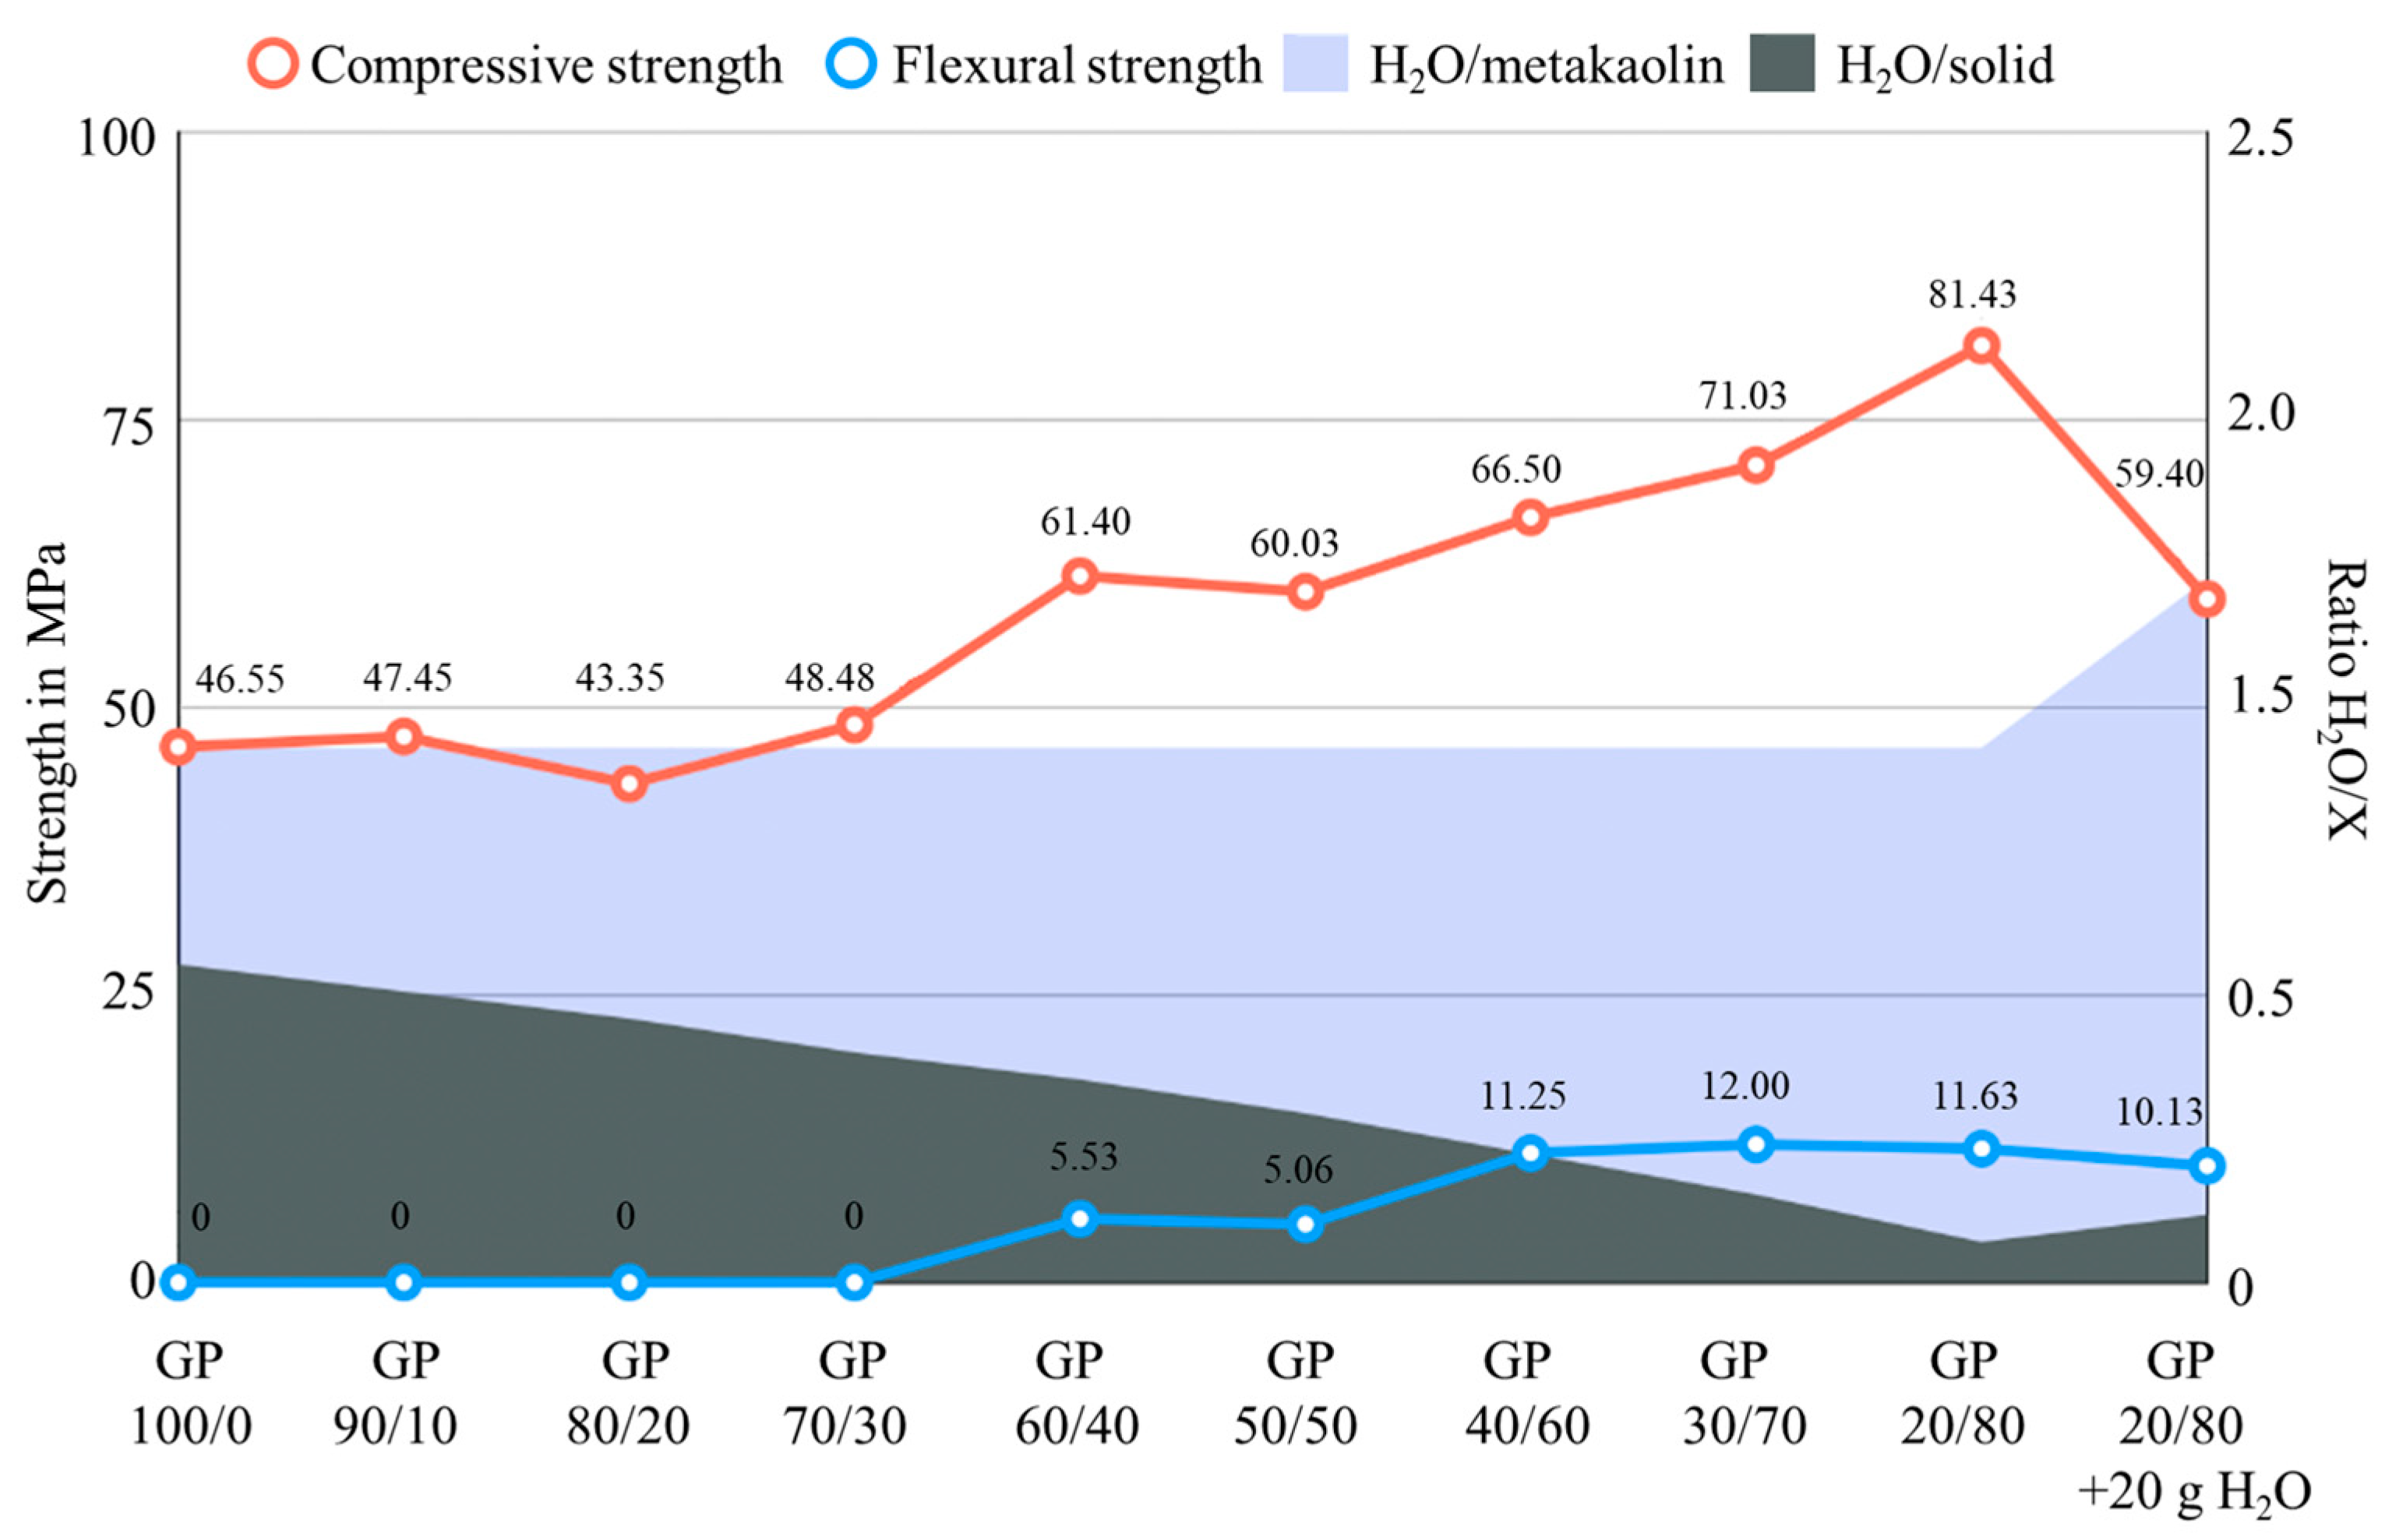
- The binder to aggregate ratio is crucial for the compressive and flexural strengths of the mortar specimens. Through the addition of quartz powder up to a ratio of 20:80 of metakaolin to quartz, an increase in strength can be witnessed. The compressive strength of the geopolymer obtained without any quartz powder amounted to 46.55 MPa, and its strength can be increased to 81.43 MPa in the case of the 20:80 mixture of metakaolin and quartz. Simultaneously, the flexural strength increased. This finding gives new information for the optimal design of the geopolymer mixture.
- The geopolymer formation is a complex process, which requires a detailed knowledge of the underlying factors that can influence the fresh mortar properties as well as the mechanical properties of the final geopolymer mortars.
Supplementary Materials
Author Contributions
Funding
Data Availability Statement
Acknowledgments
Conflicts of Interest
References
- International Energy Agency, Glob. Status Report: Towards a Zero-Emission, Efficient and Resilient Buildings and Construction Sector. 2018. Available online: https://www.iea.org/reports/2018-global-status-report (accessed on 4 June 2024).
- Petek Gursel, A.; Masanet, E.; Horvath, A.; Stadel, A. Life-cycle inventory analysis of concrete production: A critical review. Cem. Concr. Compos. 2014, 51, 38–48. [Google Scholar] [CrossRef]
- Habert, G.; Miller, S.A.; John, V.M.; Provis, J.L.; Favier, A.; Horvarth, A.; Scrivener, K.L. Environmental impacts and decorbonization strategies in the cement and concrete industries. Nat. Rev. Earth Environ. 2020, 1, 559–573. [Google Scholar] [CrossRef]
- Farooq, F.; Jin, X.; Faisal Javed, M.; Akbar, A.; Izhar Shah, M.; Aslam, F.; Alyousef, R. Geopolymer concrete as sustainable material: A state of the art review. Constr. Build. Mater. 2021, 306, 124762. [Google Scholar] [CrossRef]
- Davidovits, J. Geopolymers: Man-Made Rock Geosynthesis and the Resulting Development of Very Early High Strength Cement. J. Mater. Educ. 1994, 16, 91–139. [Google Scholar]
- Davidovits, J. Geopolymers: Inorganic polymeric new materials. J. Therm. Anal. Calorim. 2005, 37, 1633–1656. [Google Scholar] [CrossRef]
- Palomo, A.; Grutzeck, M.W.; Blanco, M.T. Alkali-activated fly ashes: A cement for the future. Cem. Concr. Res. 1999, 29, 1323–1329. [Google Scholar] [CrossRef]
- Provis, J.L.; van Deventer, J.S.J. (Eds.) Geopolymers: Structures, Processing, Properties and Industrial Applications; CRD Press: Boca Raton, FL, USA; Woodhead Publ.: Cambridge, UK, 2019. [Google Scholar]
- He, C.; Osbaeck, B.; Makovicky, E. Pozzolanic reactions of six principal clay minerals: Activation, reactivity assessments and technological effects. Cem. Concr. Res. 1995, 25, 1691–1702. [Google Scholar] [CrossRef]
- Seiffarth, T.; Hohmann, M.; Posern, K.; Kaps, C. Effect of thermal pre-treatment conditions of common clays on the performance of clay-based geopolymeric binders. Appl. Clay Sci. 2013, 73, 35–41. [Google Scholar] [CrossRef]
- Dathe, F.; Strelnikova, V.; Werling, N.; Emmerich, K.; Dehn, F. Influence of lime, calcium silicate and portlandite on alkali activation of calcined common clays. Open Ceram. 2021, 7, 100152. [Google Scholar] [CrossRef]
- Liew, Y.M.; Heah, C.Y.; Mohd Mustafa, A.B.; Kamarudin, H. Structure and properties of clay-based geopolymer cements: A review. Prog. Mater. Sci. 2016, 83, 595–629. [Google Scholar] [CrossRef]
- Werling, N.; Schwaiger, R.; Dathe, F.; Dehn, F.; Emmerich, K. Micromechanical properties of geopolymers with different calcined clay precursors. Appl. Clay Sci. 2024, 250, 107259. [Google Scholar] [CrossRef]
- Patankar, S.V.; Jamkar, S.S.; Ghugal, Y.M. Effect of water-to-geopolymer binder ratio on the production of fly ash based geopolymer conctrete. Int. J. Adv. Technol. Civ. Eng. 2012, 1, 296–300. [Google Scholar] [CrossRef]
- Luhar, S.; Nicolaides, D.; Luhar, I. Fire Resistance Behaviour of Geopolymer Concrete: An Overview. Buildings 2021, 11, 82. [Google Scholar] [CrossRef]
- Koenig, A.; Herrmann, A.; Overmann, S.; Dehn, F. Resistance of alkali-activated binders to organic acid attack: Assessment of evaluation criteria and damage mechanisms. Constr. Build. Mater. 2017, 151, 405–413. [Google Scholar] [CrossRef]
- Bakharev, T. Durability of geopolymer materials in sodium and magnesium sulfate solutions. Cem. Concr. Res. 2005, 35, 1233–1246. [Google Scholar] [CrossRef]
- Albidah, A.; Alghannam, M.; Abbas, H.; Almusallam, T.; Al-Salloum, Y. Characteristics of metakaolin-based geopolymer concrete for different mix design parameters. J. Mater. Res. Technol. 2021, 10, 84–98. [Google Scholar] [CrossRef]
- Pulidori, E.; Pelosi, C.; Fugazzotto, M.; Pizzimenti, S.; Carosi, M.R.; Bernazzani, L.; Stroscio, A.; Tiné, M.R.; Mazzoleni, P.; Barone, G.; et al. Thermal behavior of Sicilian clay-based geopolymers. J. Therm. Anal. Calorim. 2024, 23, 1–13. [Google Scholar] [CrossRef]
- Dal Poggetto, G.; Kittisayarm, P.; Pintasiri, S.; Chiyasak, P.; Leonelli, C.; Chaysuwan, D. Chemical and Mechanical Properties of Metakaolin-Based Geopolymers with Waste Corundum Powder Resulting from Erosion Testing. Polymers 2022, 14, 5091. [Google Scholar] [CrossRef] [PubMed]
- D’Angelo, A.; Dal Poggetto, G.; Piccolella, S.; Leonelli, C.; Catauro, M. Characterisation of White Metakaolin-Based Geopolymers Doped with Synthetic Organic Dyes. Polymers 2022, 14, 3380. [Google Scholar] [CrossRef]
- Zuhua, Z.; Xiao, Y.; Huajun, Z.; Yue, C. Role of water in the synthesis of calcined kaolin-based geopolymer. Appl. Clay Sci. 2009, 43, 218–223. [Google Scholar] [CrossRef]
- Yao, X.; Zhang, Z.; Zhu, H.; Chen, Y. Geopolymerization process of alkali–metakaolinite characterized by isothermal calorimetry. Thermochim. Acta 2009, 493, 49–54. [Google Scholar] [CrossRef]
- Davidovits, J. Geopolymer Chemistry and Applications, 5th ed.; Geopolymer Institute: Saint-Quentin, France, 2020. [Google Scholar]
- Van Jaarsveld, J.G.S.; Van Deventer, J.S.J.; Lukey, G.C. The effect of composition and temperature on the properties offly ash- and kaolinite-based geopolymers. Chem. Eng. J. 2002, 89, 63–73. [Google Scholar] [CrossRef]
- EN 196-1:2016; Methods of Testing Cement—Part 1, Determination of Strength. European Committee for Standardization: Brussels, Belgium, 2016.
- EN 480-11:2005; Admixtures for Concrete, Mortar and Grout—Test Methods—Part 11: Determination of Air Void Characteristics in Hardened Concrete. European Committee for Standardization: Brussels, Belgium, 2005.
- Koenig, A. Analysis of air voids in cementitious materials using micro X-ray computed tomography (µXCT). Constr. Build. Mater. 2020, 244, 118313. [Google Scholar] [CrossRef]
- EN 1015-3:2007; Methods of Test for Mortar for Masonry—Part 3: Determination of Consistence of Fresh Mortar (by Flow Table). European Committee for Standardization: Brussels, Belgium, 2007.
- Wang, H.; Li, H.; Yan, F. Synthesis and mechanical properties of metakaolinite-based geopolymer. Colloids Surf. A Physicochem. Eng. Asp. 2005, 268, 1–6. [Google Scholar] [CrossRef]
- Yunsheng, Z.; Wei, S.; Zongjin, L. Composition design and microstructural characterization of calcined kaolin-based geopolymer cement. Appl. Clay Sci. 2010, 47, 271–275. [Google Scholar] [CrossRef]
- Muller, A.C.A.; Scrivener, K.L. A reassessment of mercury intrusion porosimetry by comparison with 1H NMR relaxometry. Cem. Concr. Res. 2017, 100, 350–360. [Google Scholar] [CrossRef]
- Pelosi, C.; Occhipinti, R.; Finocchiaro, C.; Lanzafame, G.; Pulidori, E.; Lezzerini, M.; Barone, G.; Mazzoleni, P.; Rosaria Tiné, M. Thermal and morphological investigations of alkali activated materials based on Sicilian volcanic precursors. Mater. Lett. 2023, 335, 133773. [Google Scholar] [CrossRef]
- Kasaniya, M.; Thomas, M.D.A.; Moffatt, T.; Hossack, A. Microstructure and microanalysis of portland cement pastes with high w/c ratios. Cem. Concr. Res. 2024, 183, 107575. [Google Scholar] [CrossRef]
- Dujardin, N.; Salem, T.; Feuillet, V.; Fois, M.; Ibos, L.; Poilane, C.; Manuel, R. Measurement of pore size distribution of building materials by thermal method. Constr. Build. Mater. 2020, 245, 118417. [Google Scholar] [CrossRef]
- Abell, A.B.; Willis, K.L.; Lange, D.A. Mercury Intrusion Porosimetry and Image Analysis of Cement-Based Materials. J. Colloid Interface Sci. 1999, 211, 39–44. [Google Scholar] [CrossRef]
- Kang, S.H.; Jeong, Y.; Tan, K.H.; Moon, J. The use of limestone to replace physical filler of quartz powder in UHPFRC. Cem. Concr. Compos. 2018, 94, 238–247. [Google Scholar] [CrossRef]
- Haruna, S.; Mohammed, B.S.; Wahab, M.M.A.; Al-Fakih, A. Effect of aggregate-binder proportion and curing technique on the strength and water absorption of fly ash-based one-part geopolymer mortars. IOP Conf. Ser. Mater. Sci. Eng. 2021, 1101, 01202. [Google Scholar] [CrossRef]
- Joseph, B.G.; Mathew, G. Influence of aggregate content on the behavior of fly ash based geopolymer concrete. Sci. Iran. 2012, 19, 1188–1194. [Google Scholar] [CrossRef]
- Arellano-Aguilar, R.; Burciaga-Díaz, O.; Gorokhovsky, A.; Escalante-García, J.I. Geopolymer mortars based on a low grade metakaolin: Effects of the chemical composition, temperature and aggregate: Binder ratio. Constr. Build. Mater. 2014, 50, 642–648. [Google Scholar] [CrossRef]


| Code | Additional Water in g | W/S (Fresh Lime) | W/S (Mortar) |
|---|---|---|---|
| GP_Ref | 0 | 0.57 | 0.20 |
| GP_50 | 50 | 0.64 | 0.22 |
| GP_100 | 100 | 0.71 | 0.25 |
| GP_150 | 150 | 0.78 | 0.27 |
| Code | Metakaolin | Quartz Powder | Sodium Silicate | 50 wt.% NaOH | H2O from Sodium Silicate and NaOH |
|---|---|---|---|---|---|
| GP_100/0 | 500 | 0 | 500 | 250 | 445.0 |
| GP_90/10 | 450 | 50 | 450 | 225 | 400.5 |
| GP_80/20 | 400 | 100 | 400 | 200 | 356.0 |
| GP_70/30 | 350 | 150 | 350 | 175 | 311.5 |
| GP_60/40 | 240 | 160 | 240 | 120 | 213.6 |
| GP_50/50 | 200 | 200 | 200 | 100 | 178.0 |
| GP_40/60 | 160 | 240 | 160 | 80 | 142.4 |
| GP_30/70 | 120 | 280 | 120 | 60 | 106.8 |
| GP_20/80 | 80 | 320 | 80 | 40 | 71.2 |
| GP_20/80 + 20 g H2O | 80 | 320 | 80 | 40 | 91.2 |
| Code | Flow Spread in mm | Relative Flow Spread | Consistency |
|---|---|---|---|
| GP_Ref | 190 | 2.6 | Plastic mortar |
| GP_50 | 245 | 5.0 | Soft mortar |
| GP_100 | 275 | 6.6 | Soft mortar |
| GP_150 | >300 | 8.0 | Very soft mortar |
| Code | Porosity by Water Absorption in % |
|---|---|
| GP_Ref | 24.05 ± 1.2 |
| GP_50 | 26.5 ± 2.3 |
| GP_100 | 33.7 ± 1.1 |
| GP_150 | 37.1 ± 1.8 |
| Porosity in % | Cumulative Pore Volume in cm3/g | Average Pore Diameter in nm | |
|---|---|---|---|
| GP_Ref | 24.2 | 0.128 | 13.0 |
| GP_50 | 23.0 | 0.120 | 18.2 |
| GP_100 | 26.8 | 0.146 | 22.9 |
| GP_150 | 31.5 | 0.184 | 32.8 |
Disclaimer/Publisher’s Note: The statements, opinions and data contained in all publications are solely those of the individual author(s) and contributor(s) and not of MDPI and/or the editor(s). MDPI and/or the editor(s) disclaim responsibility for any injury to people or property resulting from any ideas, methods, instructions or products referred to in the content. |
© 2024 by the authors. Licensee MDPI, Basel, Switzerland. This article is an open access article distributed under the terms and conditions of the Creative Commons Attribution (CC BY) license (https://creativecommons.org/licenses/by/4.0/).
Share and Cite
Dathe, F.; Overmann, S.; Koenig, A.; Dehn, F. The Role of Water Content and Binder to Aggregate Ratio on the Performance of Metakaolin-Based Geopolymer Mortars. Minerals 2024, 14, 823. https://doi.org/10.3390/min14080823
Dathe F, Overmann S, Koenig A, Dehn F. The Role of Water Content and Binder to Aggregate Ratio on the Performance of Metakaolin-Based Geopolymer Mortars. Minerals. 2024; 14(8):823. https://doi.org/10.3390/min14080823
Chicago/Turabian StyleDathe, Felix, Steffen Overmann, Andreas Koenig, and Frank Dehn. 2024. "The Role of Water Content and Binder to Aggregate Ratio on the Performance of Metakaolin-Based Geopolymer Mortars" Minerals 14, no. 8: 823. https://doi.org/10.3390/min14080823