Article

Effects of Low-Temperature Heat Treatment on Mong Hsu Rubies

Institute of Mineral Resources Engineering, National Taipei University of Technology, Taipei 10608, Taiwan
*
Author to whom correspondence should be addressed.
Minerals 2024, 14(8), 829; https://doi.org/10.3390/min14080829
Submission received: 17 June 2024 / Revised: 12 August 2024 / Accepted: 13 August 2024 / Published: 15 August 2024
(This article belongs to the Special Issue Gem Deposits: Mineralogical and Gemological Aspects, 2nd Edition)

Abstract

:
This study examined the effects of low-temperature heat treatment on the characteristics of the rubies from Mong Hsu, Myanmar. Five ruby samples were heated to 400, 600, 900 and 1200 °C for different durations, respectively. Before and after each heating step, a visual examination was conducted with a gem microscope under different illumination conditions. Various spectral analyses such as UV-Vis, FTIR, Raman and PL were also used to examine the effect of heating on the ruby samples. The low-temperature heat treatment enhanced the ruby samples by causing the dark blue core to partially or completely fade away. It then increased the overall light transmittance and enhanced the fluorescence peak around 694 nm but did not improve the red hue of the samples. Two major changes were found in the experiments. One was the dark blue core of the samples that faded as the heating temperature increased. They were verified by the spectra to be the variation in the intervalence charge transfer between Fe2+ and Ti4+. The variation in the intervalence charge transfer of Mong Hsu ruby was not noticeable before heating to 900 °C but changed dramatically when heated to 1200 °C. The other was the shift of the FTIR peak, which is caused by decomposition of minerals due to heating. An FTIR 630 cm−1 peak proved to be sensitive to the low-temperature heating and might be helpful for detecting low-temperature treatment.

1. Introduction

Several methods can be used to enhance the quality and value of various gemstones. In particular, rubies can be enhanced using heat treatment methods. The effects of heat treatment on the internal structure of rubies can be identified using visual inspection methods; however, these methods are subjective and sometimes produce contestable results. Heat treatment techniques are constantly evolving. The effects of low-temperature heat treatment, an increasingly popular technique, on rubies have been investigated in several studies (Pardieu et al., 2015; Saeseaw et al., 2018; Lu et al., 2022; Hughes and Vertriest, 2022) [1,2,3,4]. Rubies from Madagascar, Mozambique and Myanmar have been subjected to low-temperature heat treatment experiments.
Several areas in Myanmar, including Mogok, Mong Hsu and Namya, are famous for their ruby deposits. In Mong Hsu, most ruby deposits are secondary deposits. This study conducted experiments on tabular rubies from Mong Hsu because they are unsuitable as gems and therefore are not typically heated (Peretti et al., 1995) [5]. The tabular rubies were directly obtained from a miner in Mong Hsu. Unheated Mong Hsu rubies have a dark blue core. When heated, this core turns dark red and becomes surrounded by a white cloud-like material (Peretti et al., 1995; Emmett, 1999) [5,6]. The present study analyzed changes in the cores of Mong Hsu ruby samples during heat treatment.
Rubies often contain primary or secondary inclusions. Some of these inclusions may decompose at low temperatures, which makes it possible to observe elemental changes in ruby samples through EDXRF, laser ablation inductively coupled plasma mass spectrometry and X-ray photoelectron spectroscopy. Peretti et al. (1995) [5] used EDXRF spectroscopy and found that heating (heating temperature: unknown) had no substantial effect on the trace elements in rubies. However, Song and Shen (2011) [7] employed laser ablation inductively coupled plasma mass spectrometry and observed that heat treatment (heating temperature: unknown) increased the Ti content in rubies but decreased their Fe content. Achiwawanich et al. (2006) [8] adopted X-ray photoelectron spectroscopy and noted that heat treatment caused variations in the surface concentrations of Fe, Ti and Al in rubies, with the surface concentration of Ti only changing at temperatures above 1100 °C. EDXRF spectroscopy was used to examine elemental variations in this study.
Studies that have explored the effect of heat treatment on Mong Hsu rubies (Peretti et al., 1995; Smith, 1995; Achiwawanich et al., 2006) [5,8,9] have only investigated high-temperature heat treatment techniques. In contrast to previous studies, which have mostly focused on high-temperature (1500 °C) heat treatment, the present study investigated the effects of low-temperature heat treatment on these rubies.
Samples of Mong Hsu rubies were heated at 400 °C, 600 °C, 900 °C and 1200 °C for 1–24 h. Changes in these samples were recorded through bright-field illumination, dark-field illumination, overhead illumination, crossed-Nicol illumination and fluorescent illumination. Changes in the X-ray fluorescence spectra, ultraviolet–visible (UV–Vis) spectra, Fourier transform infrared (FTIR) spectra, Raman spectra and photoluminescence (PL) spectra during low-temperature heat treatment were also examined under different maximum temperatures and durations of heating.

2. Materials, Experiments and Analytical Methods

2.1. Materials

Six unheated Mong Hsu ruby crystals of the Japesap (tiger’s mouth in Burmese) type (occurring between layers of soil and rock) were collected for this study. Five samples were tabular (MH-1 to MH-5), and one was barrel-shaped with planes perpendicular and parallel to the c-axis (MH-8). MH-5 was used for comparison; therefore, no heat treatment was carried out. The unheated MH-1 to MH-4 and Mh-8 are shown in Figure 1 and the unheated MH-5 is shown in Figure 2.

2.2. Experiments

The exsolved rutile filaments that are often found in rubies undergo changes after heating to ≥1200 °C (Hughes and Vertriest, 2022; Themelis, 2018; Hughes, 2022) [4,10,11] and can be easily observed through visual inspection. The temperature of 1200 °C is considered the maximum temperature for low-temperature heat treatment (Karampelas et al., 2023, Hughes and Vertriest, 2022; Hughes et al., 2017; Saeseaw et al., 2018; Long et al., 2021) [2,4,12,13,14]. Accordingly, the present study selected 1200 °C as the maximum temperature for the low-temperature heat treatment.
An electric furnace with a precise heating rate, temperature control and duration of heating control supplied by the National Taipei University of Technology Mineral Processing Laboratory was used for heating purposes.
The ruby samples were heated in four stages with maximum temperatures of 400 °C, 600 °C, 900 °C and 1200 °C under an oxidizing atmosphere (Themelis, 2018; Nassau, 1981; The Diploma in Gemmology Course, 2012) [10,15,16], respectively. The heating duration was also varied from 1 hour to 24 h, as indicated in Table 1. The temperature was increased from 25 °C to 900 °C at a rate of 2.5 °C/min and from 900 °C to 1200 °C at a rate of 4.0 °C/min (Themelis, 2018) [10]. The samples were then allowed to cool naturally. The heated samples were then subjected to a spectral analysis to determine the effects of heating.

2.3. Analytical Methods

The energy-dispersive X-ray fluorescence (EDXRF), UV–Vis, FTIR, Raman and 532 nm PL were used to examine the same area of the samples subjected to different temperatures and heating periods. For samples MH-1 to MH-4, only the basal pinacoid perpendicular to the c-axis was observed. For sample MH-8, the planes perpendicular and parallel to the c-axis were observed.

2.3.1. EDXRF Spectra

EDXRF (Thermo Fisher Scientific, Tewksbury, MA, USA) was used to determine the chemical compositions of the ruby samples before and after being subjected to heat treatment at various temperatures. The test results can be used to verify the influence of heat treatment on the concentration of Fe, Ti, Cr and Al ions in the ruby samples.

2.3.2. UV–Vis Spectra

UV–Vis, with a Qspec Gem-3000 UV–Vis–near-infrared (NIR) spectrophotometer (BIAOQI, Guangzhou, China), was used to detect the effects of heating on the color and color covariance of the samples.

2.3.3. FTIR Spectra

FTIR, with a PerkinElmer Spectrum Two FTIR spectrometer (PerkinElmer, Waltham, MA, USA), was used to indicate the inclusions of the samples at a near-infrared range of 2000–8000 cm−1 (transmission method) and a mid-infrared range of 400–1600 cm−1 (reflection method) under a 4 cm−1 resolution and 60 s scanning time.

2.3.4. Raman Spectra

Raman, with an Enwave UID-G5 Raman spectrometer (CRAIC, San Dimas, CA, USA), was used to indicate the inclusions of the samples. The test conditions were a 785 nm laser wavelength; 300 mw laser energy; a resolution of 2.2 cm−1; a test range of 100–3300 cm−1 under 25 °C; and a 50% humidity environment.

2.3.5. PL Spectra

The Enwave UID-G5 spectrometer was also used to obtain 532 nm PL spectra to examine the effect of heating on the fluorescence peaks of the samples.

3. Results and Discussions
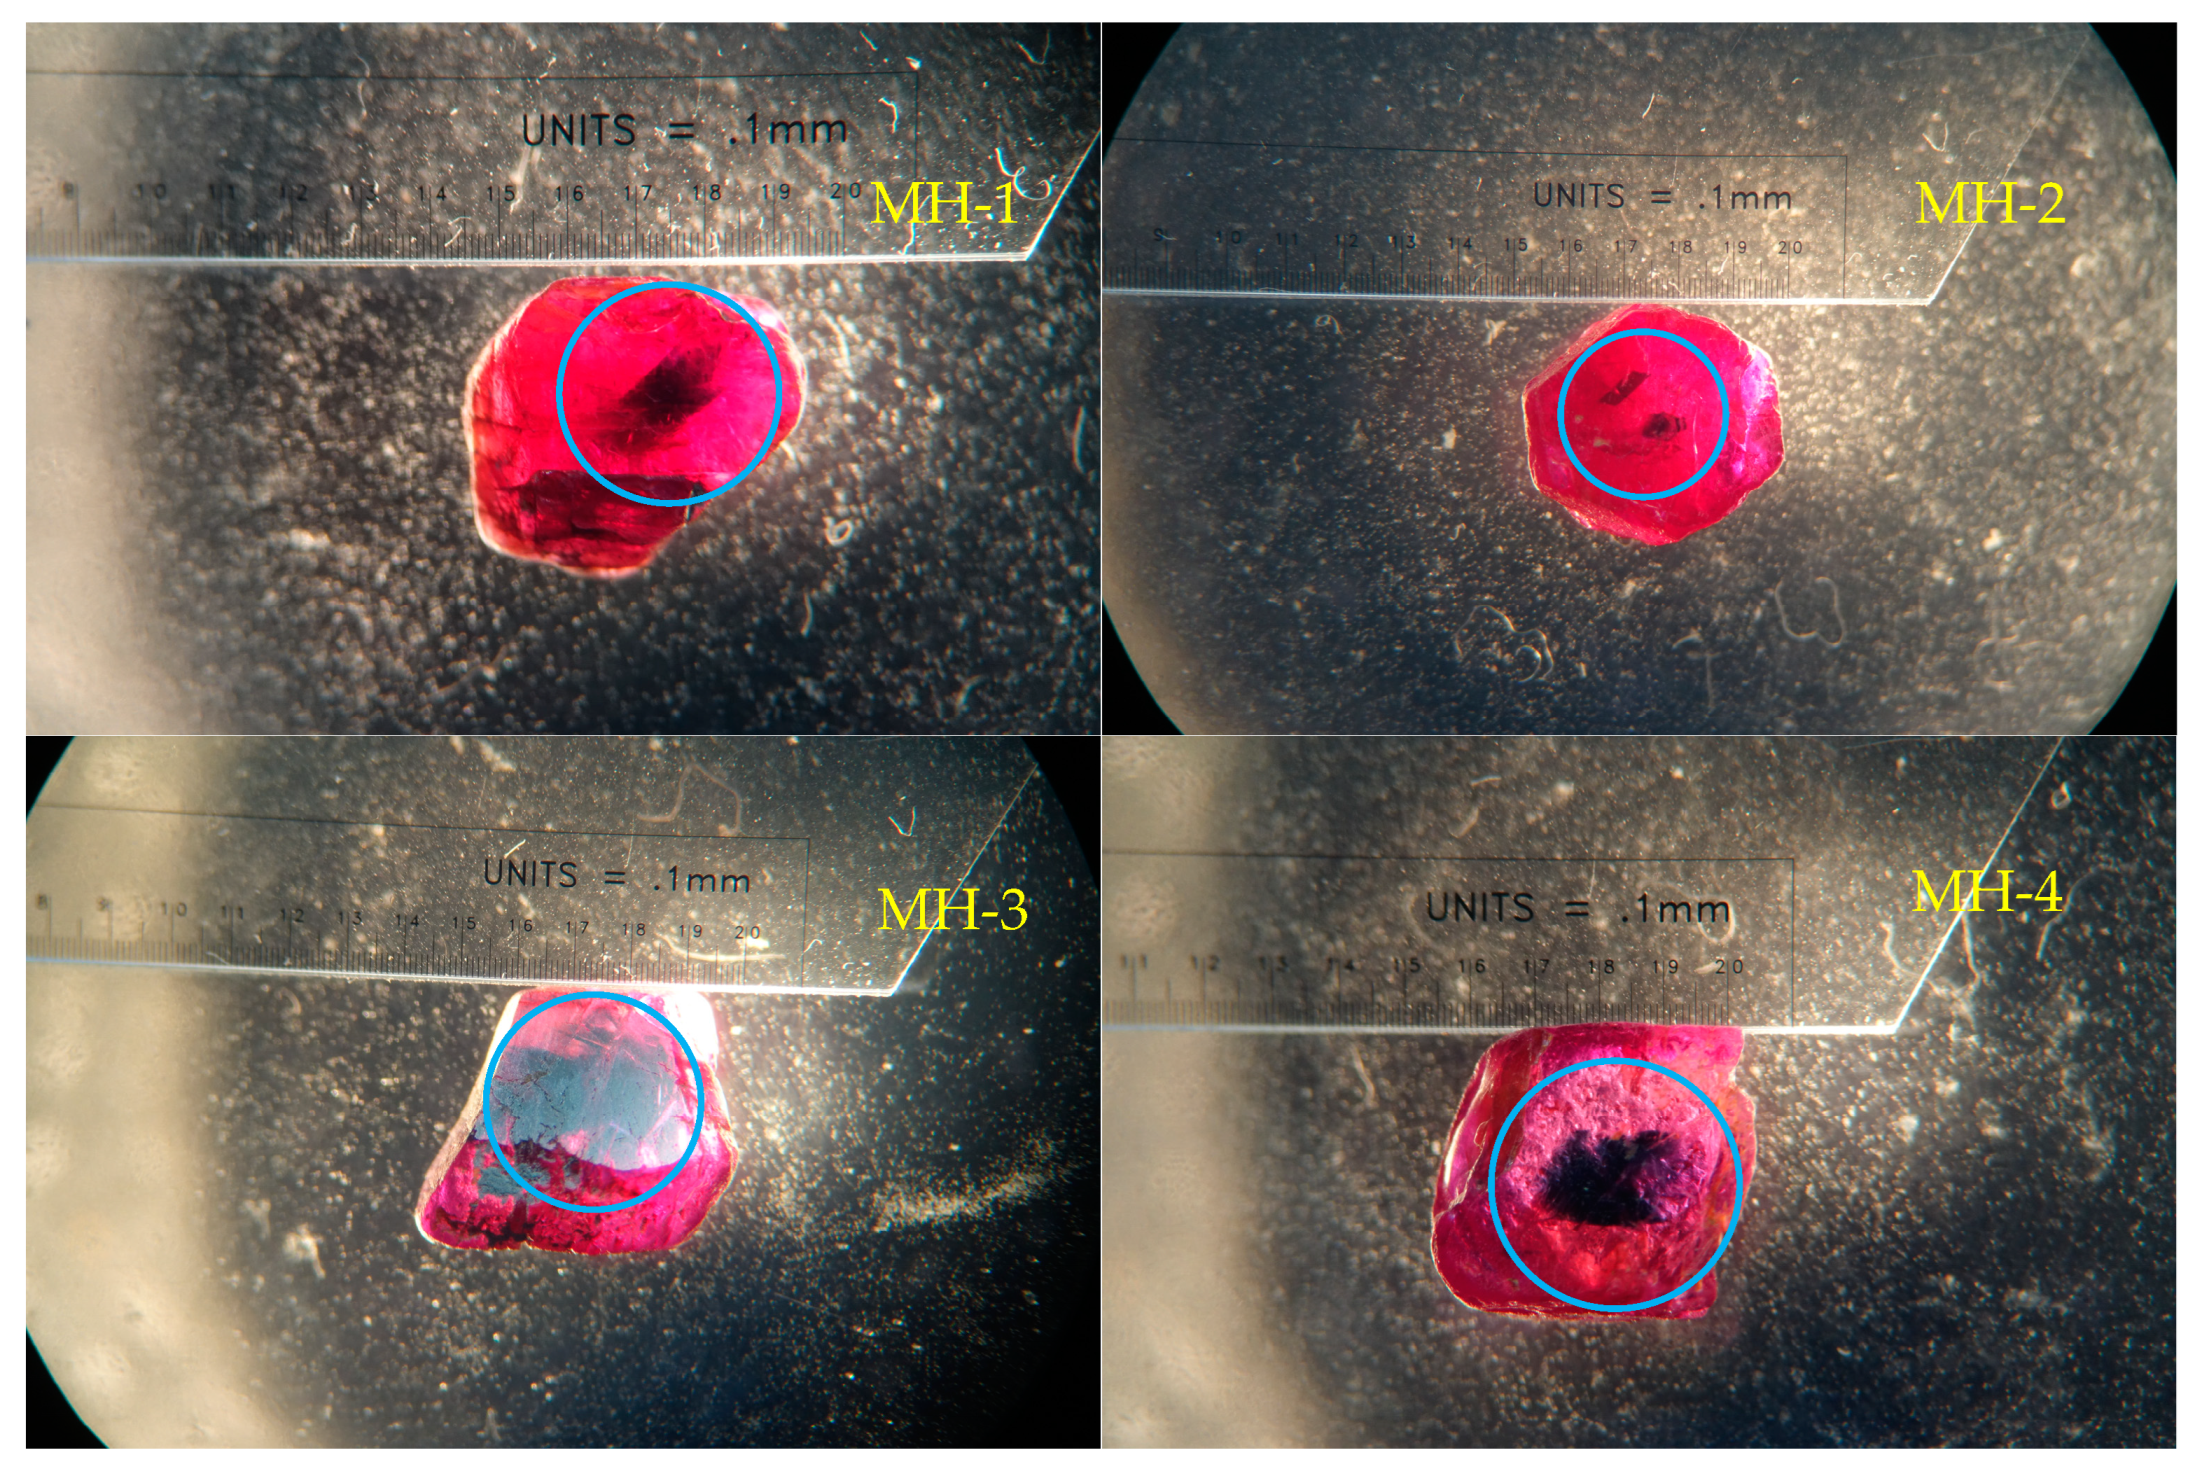
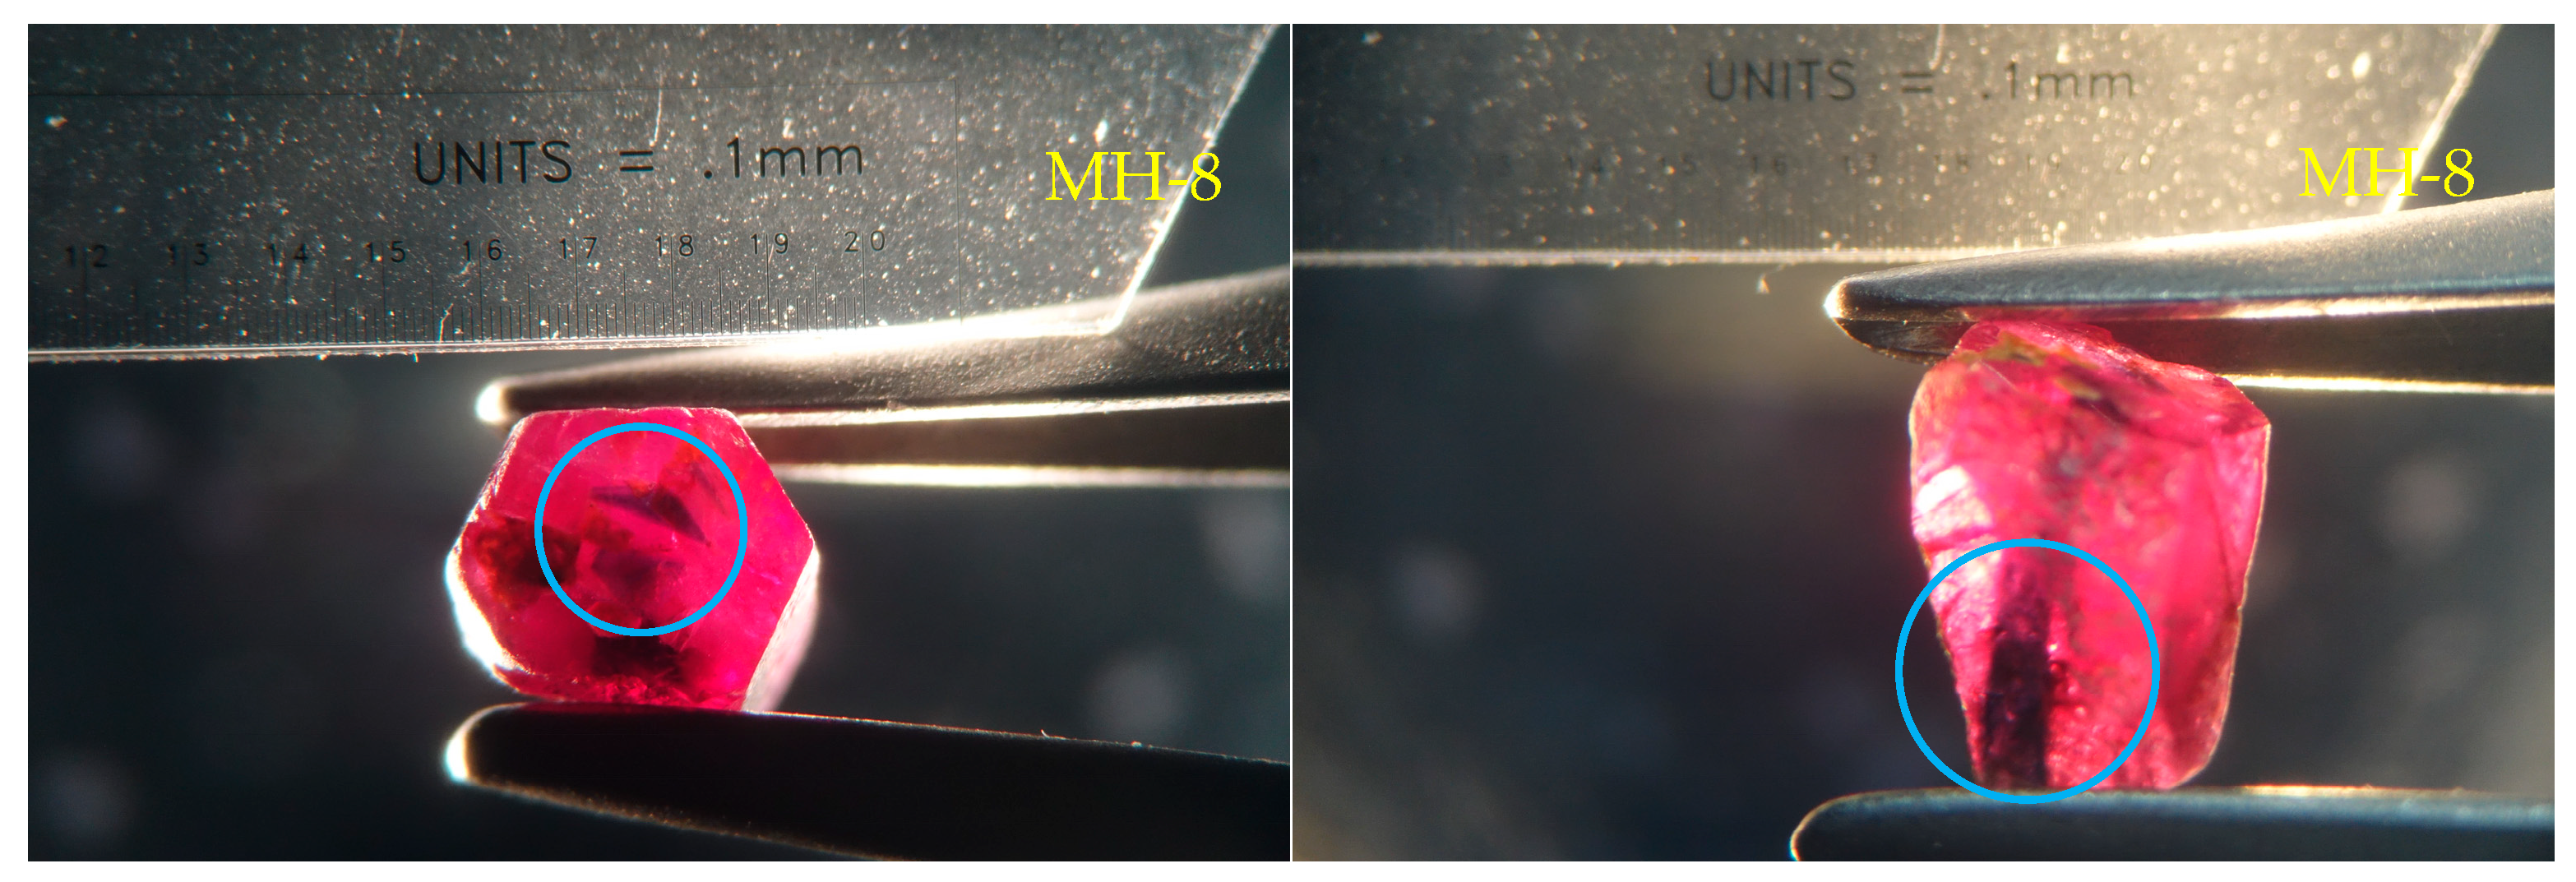
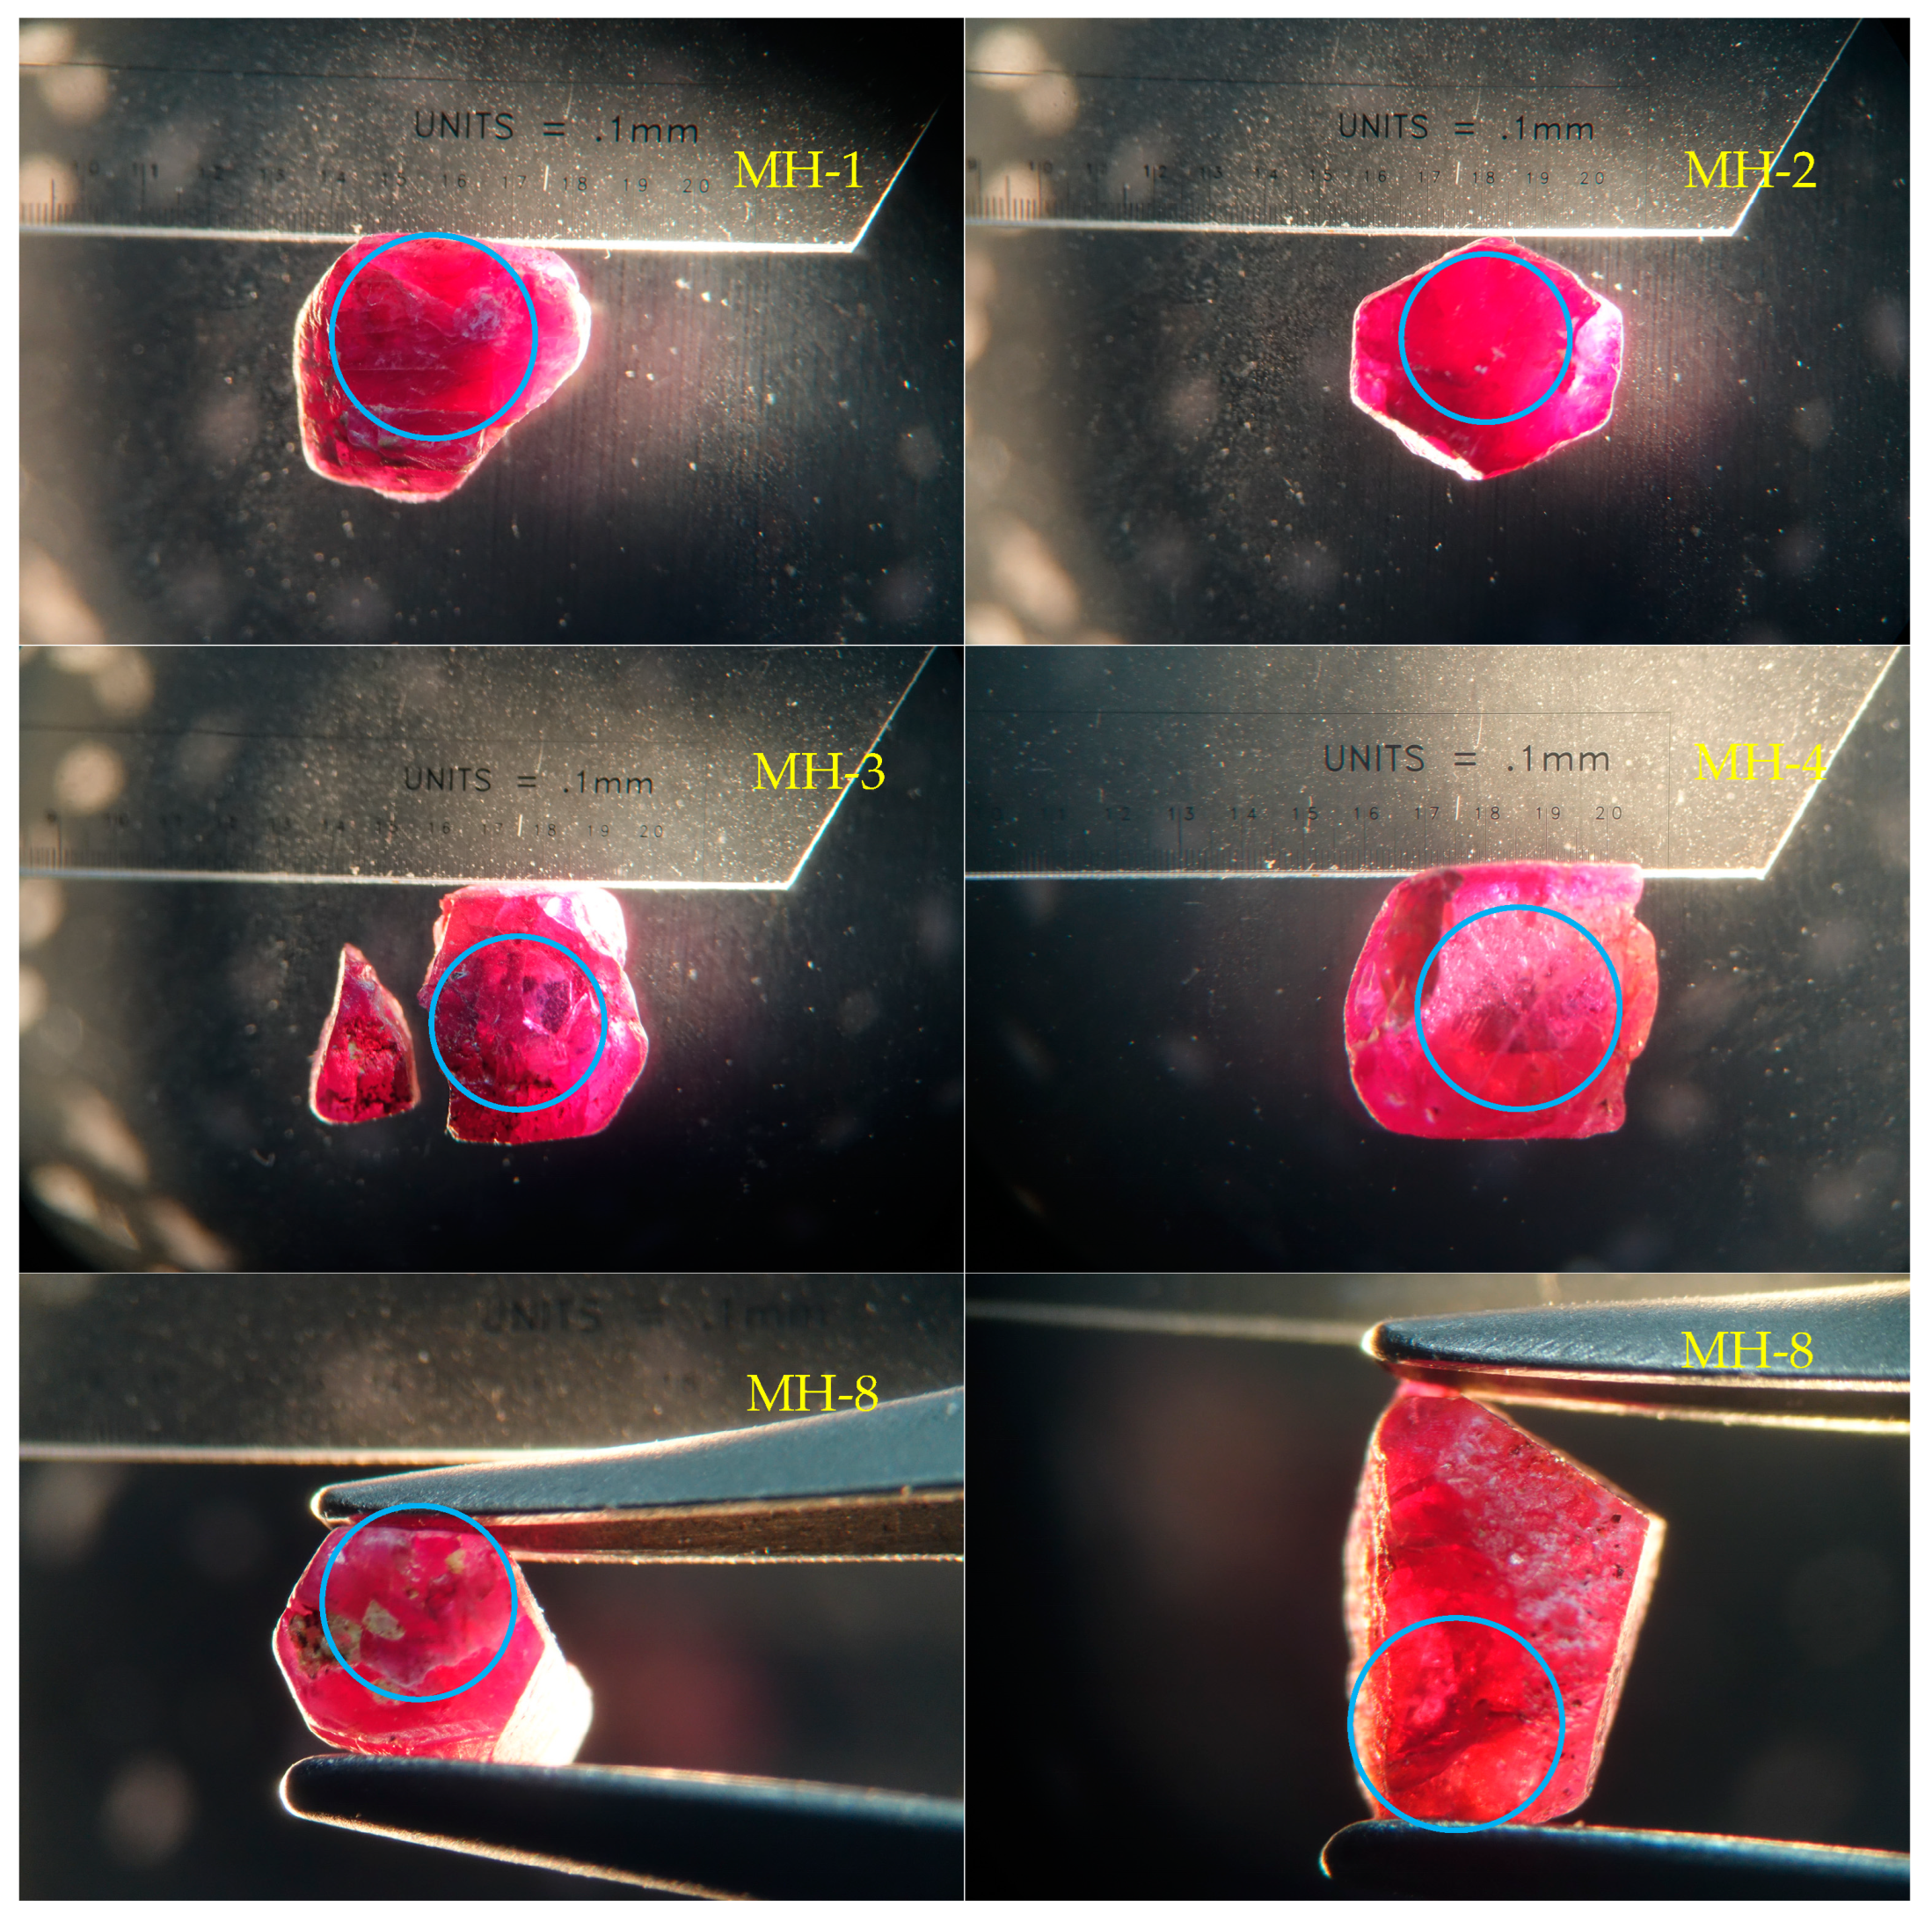
3.1. Appearance

The five ruby samples were heated to 1200 °C (Figure 3).
By comparing the fading pattern of the dark blue core as shown in Figure 1 and Figure 3, the ruby samples can be divided into two groups, that is, the MH-1 group and the MH-2, MH-3, Mh-4 and MH-8 group. The core of MH-1 faded away with diffusion phenomena. By contrast, the cores of MH-2, MH-3, MH-4 and MH-8 did not spread but gradually disappeared.
Figure 4 shows the appearance of the core of MH-1 at different heating temperatures. As the temperature increased, the color of the dark blue core began to fade along the edges. As the temperature increased from 400 °C to 600 °C, only slight fading of the core was observed. The obvious changes in the shape of the core occurred when the temperature was increased from 900 °C to 1200 °C. After reaching 1200 °C, only traces of blue remained, and the shape of the core differed considerably from its original shape.
Inclusions of white cloudy material were distributed on the parting faces of the polysynthetic twining crystal (Figure 5) after MH-1 was heated to 1200 °C. Observation of the samples under cross-Nicol light and fluorescence also revealed visible differences between MH-1 and the other samples.
It was also found that a narrow white strip in the center of MH-1 became cohesive, larger and more pronounced as the heating temperature increased, as shown in Figure 6. When the face was checked by the reflection light illumination, a crack was observed. It could be a crack on the surface that opens further during the heating process.
MH-2 contained two dark blue domains in the core. One of these domains was hexagonal and had several layers, whereas the other domain was parallelogram-shaped and not layered (Figure 7). When the sample was heated to 900 °C, the color of both cores faded. When the temperature reached 1200 °C, only two sides of the hexagonal domain remained, and the parallelogram-shaped domain was no longer visible.
At 1200 °C, a white cloud-like material formed around the hexagonal domain (Figure 8). This material could be a substitution pseudomorph inclusion of dehydrated diaspore as discussed by Song and Shen, 2021, and Ruan et al., 2002 [7,17].
MH-3 broke into two pieces after being heated to 400 °C. However, the subsequent heating continued on the larger of the two broken pieces.
It was also found that the fading of the dark blue cores of the MH-3, MH-4 and MH-8 samples was similar to that of MH-2. The most obvious color fading occurred at a temperature between 900 °C and 1200 °C. However, most of the core was still visible under fluorescent illumination but was much less when compared with the unheated samples.
The light yellow impregnated patches in MH-2, MH-3 and MH-4 turned orange-red when they were heated to 400 °C. This is probably due to the transformation of limonite into brown hematite at 260 °C–350 °C (Koivula, 2013; Sripoonjan et al., 2016) [18,19].
The core of MH-1 faded away and exhibited diffusion phenomena. These diffusion phenomena were not observed on the cores of MH-2, MH-3, MH-4 and MH-8. This difference can possibly be attributed to the fact that MH-1 was a polycrystalline twin, which the other samples were not.

3.2. EDXRF Spectra

Table 2 lists the elemental analysis of the ruby samples tested. According to the test results, heating did not substantially alter the concentrations of the Fe, Ti, Cr and Al ions in MH-2, MH-3, MH-4 or MH-8. However, the heat treatment reduced the concentration of the Fe ions but increased the concentrations of the Ti, Cr and Al ions in MH-1. It is probably caused by the effect of low-temperature heat treatment on the polysynthetic twin that allowed Fe ions to move inward and Ti ions to diffuse to the surface. This is believed to be due to Ti4+ ions being smaller than Fe2+ ions. The differences in the EDXRF results between MH-1 and those of MH-2, MH-3, MH-4 and MH-8 can be attributed to low-temperature heat treatment that enhances the ion diffusion in crystals with polysynthetic twins, thus causing substantial changes in the element concentrations of these crystals.
Table 2 indicates that the Cr/Fe ratios of MH-1, MH-2, MH-3 and MH-4 were 2.5688, 23.368, 2.9682 and 3.4767, respectively, before heating and 10.7569, 24.452, 2.8778 and 4.733 after heating. It was found that the Cr/Fe ratios of MH-1, MH-2 and MH-4 increased after heating but decreased marginally after heating for MH-3.

3.3. UV–Vis–NIR Spectra

As shown in Figure 9, the UV–Vis–NIR spectra of the ruby samples show two broad absorption peaks, centered at 420 nm and 554 nm, and fluorescence peaks near 694 nm before and after heat treatment.
Heating caused a decrease in the UV–Vis absorbance of all the samples, with the only exception being the UV–Vis absorbance of MH-4 in the 300–600 nm band. This result shows that heating increased the transmittance of all the samples except MH-4.
By comparing the absorption peaks for the two planes of the MH-8 sample when the samples were unheated (Figure 9), we determined that the blue core in the plane perpendicular to the c-axis was more noticeable than that in the plane parallel to the c-axis, which matched our visual observations. The improvement in light transmittance by heating on the plane parallel to the c-axis is significantly better than that on the plane perpendicular to the c-axis.
The strong trough at 694 nm in Figure 9 is a fluorescence peak, which emits light instead of absorption. Therefore, the absorption will be a negative value sometimes. Heating enhanced the intensity of the fluorescence peak around 694 nm because of the corresponding increase in sample transmittance. By comparing the amplitude of the 694 nm peak with the Cr/Fe ratio of the sample, it was found that the increase in this peak corresponds with the increase in the Cr/Fe ratio for MH-1, MH-2 and MH-4. The decrease in the 694 nm peak for MH-3 also relates to the decrease in the Cr/Fe ratio for MH-3, as shown in the red box in Figure 9.
During the heating process, the absorption peak centered at 420 nm gradually moved to lower wavelengths. An average wavelength decrease of 13.6 nm can be observed in Figure 10a. The large decrease (blue shift) in the wavelength of the 420 nm peak represented the gradual fading of the blue color of the samples, which is consistent with the change in appearance for each sample examined. The location of the 554 nm absorption peak fluctuated, but the wavelength of this peak exhibited an average increase of 1.55 nm as shown in Figure 10b. The small increase (red shift) in the wavelength of the 554 nm absorption peak indicated that the red color of the samples did not change substantially.
According to Saeseaw et al. (2018) [2], absorption peaks at 376, 387 and 451 nm in UV–Vis–NIR spectra are related to Fe3+. The samples tested exhibited 376 and 387 nm absorption peaks but not the 451 nm peak. The 376 and 387 nm absorption peaks of MH-1 disappeared at 900 °C. These same peaks were also observed for MH-2, MH-3, MH-4 and MH-8, even after heating to 1200 °C, as shown in Figure 11. The presence of the 376 and 387 nm absorption peaks that are associated with iron after heating is related to the polysynthetic twins on the ruby sample.
Two small peaks centered at 468 and 476 nm were observed when the samples were heated to 900 °C. However, these peaks were barely visible after being heated to 1200 °C, as shown in Figure 12. The 669 nm fluorescence peak did not appear until the samples were heated to 400 °C–600 °C. This indicates that a sample may have been heated to 400 °C–600 °C when the sample shows a fluorescence peak of 669 nm. Therefore, the 669 nm fluorescence peak might assist in the detection of low-temperature heat treatment.
Song and Shen (2021) [7] described that the absorption peak near 570 nm is caused by the intervalence charge transfer between Fe2+ and Ti4+, giving the rubies from Myanmar a bluish tone. As shown in Figure 13, a typical 570 nm band can be clearly identified for the unheated MH-3 sample but disappeared after it was heated at 1200 °C. The absorption bands near 570 nm changed considerably at 900 °C and disappeared at 1200 °C, as shown in Figure 14.
As shown in Figure 7, the blue core of the samples visually faded considerably as the temperature increased. The complete discoloration of the entire core occurred between 900 °C and 1200 °C. It was found that this result is consistent with the change in the 570 nm absorption band.
It is clear that the intervalence charge transfer between Fe2+ and Ti4+ correlated with the color of the dark blue core. And the change in the 570 nm absorption band of Mong Hsu ruby was more evident between 900 °C and 1200 °C.
Figure 15 shows the intensity difference in the UV–Vis absorbance of the samples without heating and those heated to 1200 °C, i.e., the absorption intensity of the unheated sample minus the intensity of the sample heated to 1200 °C. The largest differences in absorbance were observed for wavelength ranges of 400–513, 600–650 and 685–692 nm as indicated in the orange box in Figure 15.
However, Saeseaw et al. (2018) [2] found that the maximum absorbance difference occurred around 580 nm for Mozambique rubies after subjecting them to low-temperature heat treatment. This discrepancy can be attributed to the blue core that covers a relatively small proportion of the Mong Hsu ruby samples tested in this study. Moreover, it is probably because of the strong influence of Cr3+, and thus, the charge transfer between Fe2+ and Ti4+ may not be the primary factor responsible for the changes in the UV–Vis spectrum of Mong Hsu rubies.
Peretti et al. (1995) [5] observed 675 nm absorption bands for unheated ruby samples. These bands were also observed for all the samples but MH-2. For MH-1, the 675 nm absorption band disappeared immediately after heating. For MH-3, this band disappeared when the temperature reached 1200 °C. However, heating did not cause the absorption band to disappear for MH-4 and MH-8. These results indicate that 675 nm absorption bands might be absent for both unheated and heated ruby samples. Therefore, it is difficult to determine whether 675 nm absorption bands are closely related to heating or not.
According to the analysis of the UV–Vis–NIR spectra, the low-temperature heat treatment enhanced the ruby samples by causing the dark blue core to partially or completely fade away. It then increased the overall light transmittance and enhanced the fluorescence peak around 694 nm but did not improve the red hue of the samples.

3.4. FTIR Spectra

A series of peaks between 1900 and 3400 cm−1 were observed in the FTIR spectra of the samples tested. Smith (1995) [9] attributed these peaks to diaspore. It was also confirmed in this study that the main inclusions in the ruby samples were diaspore and boehmite.
Under heating, the water in the diaspore slowly separated out, and the diaspore transformed into white scales. At temperatures greater than 450 °C, diaspore gradually transformed into corundum (Smith, 1995; Kammerling et al., 1994; Yanagida and Yamaguchi, 1966; Ruan et al., 2002) [9,17,20,21]. The white inclusions in the samples of this study (Figure 5 and Figure 8) were diaspore or its products.
Goethite (α-FeO(OH)), boehmite (γ-AlO(OH)) and diaspore (α-AlO(OH)) are hydrous oxide minerals that considerably affect the FTIR spectra of Mong Hsu rubies. The FTIR peaks for the aforementioned minerals are described by Smith (1995) and Sripoonjan et al. (2016) [9,19], as shown in Figure 16.
The 2925 and 2856 cm−1 peaks observed in Figure 16 can probably be attributed to the stretching vibration of the C–H bond, and this might have been caused by oil contamination during sample processing as discussed by Sripoonjan et al., 2016 [19].
According to the FTIR spectra shown in Figure 17, these three materials gradually decomposed and released OH during the heating process (Ruan et al., 2002) [17], resulting in the FTIR spectra of the ruby samples gradually changing from the characteristics of these three materials to the characteristics of OH (as indicated in the orange box in Figure 17).
As shown in Figure 17, the diaspore of MH-4 completely disappeared at 1200 °C, while the goethite and boehmite disappeared at 400 °C and were fully replaced by OH at 1200 °C. The changes in MH-2, MH-3 and MH-8 are similar to those in MH-4. In contrast to the aforementioned results, the MH-1 diaspore disappeared at 600 °C, while the goethite and boehmite disappeared at 1200 °C.
In general, the fingerprint region and characteristic region of FTIR spectra are used to identify gem types and detect elements or functional groups within gems, respectively.
By comparing the fingerprint regions of the heated and unheated rubies, this study discovered a special peak at 630 cm−1 for all the samples as indicated in the blue box in Figure 18. This peak is commonly found in the FTIR spectra of heated Mong Hsu rubies but almost never found (or barely noticeable) in that of unheated Mong Hsu rubies.
By comparing the 630 cm−1peaks of all the samples heated to various temperature ranges, their amplitude–temperature curves are shown in Figure 19. It was found that this peak changed linearly with the heating temperature. Furthermore, few changes were observed at temperatures of less than 400 °C and the favorable treatment results were observed only at temperatures exceeding 600 °C.
The 630 cm−1 peaks have rarely been examined in studies of rubies. Thus, the origin of this peak is not yet fully understood. However, the aforementioned peak has been examined in archeological studies, which have used the presence of OH libration bands at 630 cm−1 to determine whether the bones have been heated by fire (Shaw, 2022) [22]. This indicates that the 630 cm−1 peaks might be related to the presence of OH.
The Mong Hsu rubies did not change considerably at temperatures less than 400 °C, and the treatment results were observed only when the rubies were heated to at least 600 °C. This result was obtained because the rubies used in this study are products of amphibolite-phase metamorphism (Peretti et al., 1995) [5]. The amphibolite phase occurs at approximately 500 °C. Therefore, temperatures below 500 °C have no effect on Mong Hsu rubies and their inclusions. However, such temperatures affect foreign filling minerals in these rubies, such as limonite.
High-temperature heating is an effective method for eliminating the deep blue cores of Mong Hsu rubies. However, high-temperature heating might cause the alteration of the guest crystals in these rubies.
The present study found that almost all the samples exhibited a peak at 3310 cm−1 in the characteristic region after heating to 1200 °C as indicated in the orange box in Figure 20. Mong Hsu rubies produce an absorption peak at 3310 cm−1 after heat treatment, which has also been described by Peretti et al. (1995), Smith (1995) and Themelis (2018) [5,9,10]. However, how the peak varies with temperature is not clear.
The weak peaks at 3232 cm−1 accompanied the strong peaks at 3310 cm−1 for all the samples except for MH-1 (Figure 20).
The 3310 cm−1 peaks observed under different temperatures were compared, and the corresponding amplitude–temperature curve is shown in Figure 21. These peaks were less noticeable when the heating temperature was below 900 °C and became noticeable when the heating temperature was 1200 °C.
The 630 cm−1 peaks in the fingerprint regions are highly sensitive to low-temperature heat treatment as indicated in Figure 19. The 3310 cm−1 peaks in the characteristic regions are highly sensitive to such treatment at temperatures beyond 1200 °C as indicated in Figure 21. Therefore, when determining whether the Mong Hsu rubies are being heated, one should observe the changes in both of the aforementioned types of peaks.
In this study, the 3310 cm−1 peaks did not appear until heating to 1200 °C. However, samples from certain regions have 3310 cm−1 peaks before heating, and these peaks disappear after heating (Themelis, 2018; Long et al., 2021; Lowry, 2008) [10,14,23,24], which is inconsistent with that of the present study. The opposite can be explained by the difference in the host rocks between the rubies examined in these studies and the present study. The rubies in the present study were formed in metamorphic rocks.

3.5. Raman Spectra

The Raman spectra of MH-1, MH-2, MH-3, MH-4 and MH-8 (heated to 1200 °C) are shown in Figure 22. The unheated MH-5 also exhibited a Raman main peak similar to that of the heated samples. However, MH-5 exhibited a higher number of Raman peaks related to hydroxyl-containing minerals than the heated samples. It indicates that the hydroxyl minerals of the samples might have broken down after being heated to 1200 °C.
MH-5 exhibited stronger goethite-related peaks (at 676, 554, 468, 482, 298 and 242 cm−1) than the other samples. The MH-5 spectrum labeled with goethite-related peaks can also be found in Figure 22. The samples heated to 1200 °C exhibited stronger hematite-related peaks (at 748, 667, 614, 502, 416, 295, 245 and 224 cm−1) than MH-5. These results indicate considerable goethite (limonite) oxidized to hematite in the heated samples.

3.6. The 532 nm PL Spectra

The 532-nm PL spectra of the heated and unheated samples exhibited two strong peaks (at 4378 and 4351 cm−1). The peaks at 4378 and 4351 cm−1 corresponded to the fluorescence peaks at 692 and 694 nm, respectively, in the UV–Vis spectra. The fluorescence peaks were attributed to the Cr3+ in the rubies.
The fluorescence peaks at 692 and 694 nm merged into one fluorescence peak at 693 nm in the UV–Vis spectra. However, the corresponding peaks were clearly distinguished in the 532 nm PL spectra.
The results indicated that the 532 nm PL spectra were not helpful in detecting whether the Mong Hsu rubies were heated.

4. Conclusions

The conclusions are as follows:
  • Low-temperature heat treatment enhanced the ruby samples by causing the dark blue core to partially or completely fade away. It then increased the overall light transmittance and enhanced the fluorescence peak around 694 nm but did not improve the red hue of the samples.
  • The color of the dark blue cores of the Mong Hsu rubies gradually faded during the heat treatment because of iron oxidation, which weakened the intervalence charge transfer between the Fe2+ and Ti4+. This charge transfer weakened considerably or disappeared at 1200 °C. For the crystals with polysynthetic twins, the dark blue cores were diffused in the parting planes, whereas the single crystals faded at their original locations.
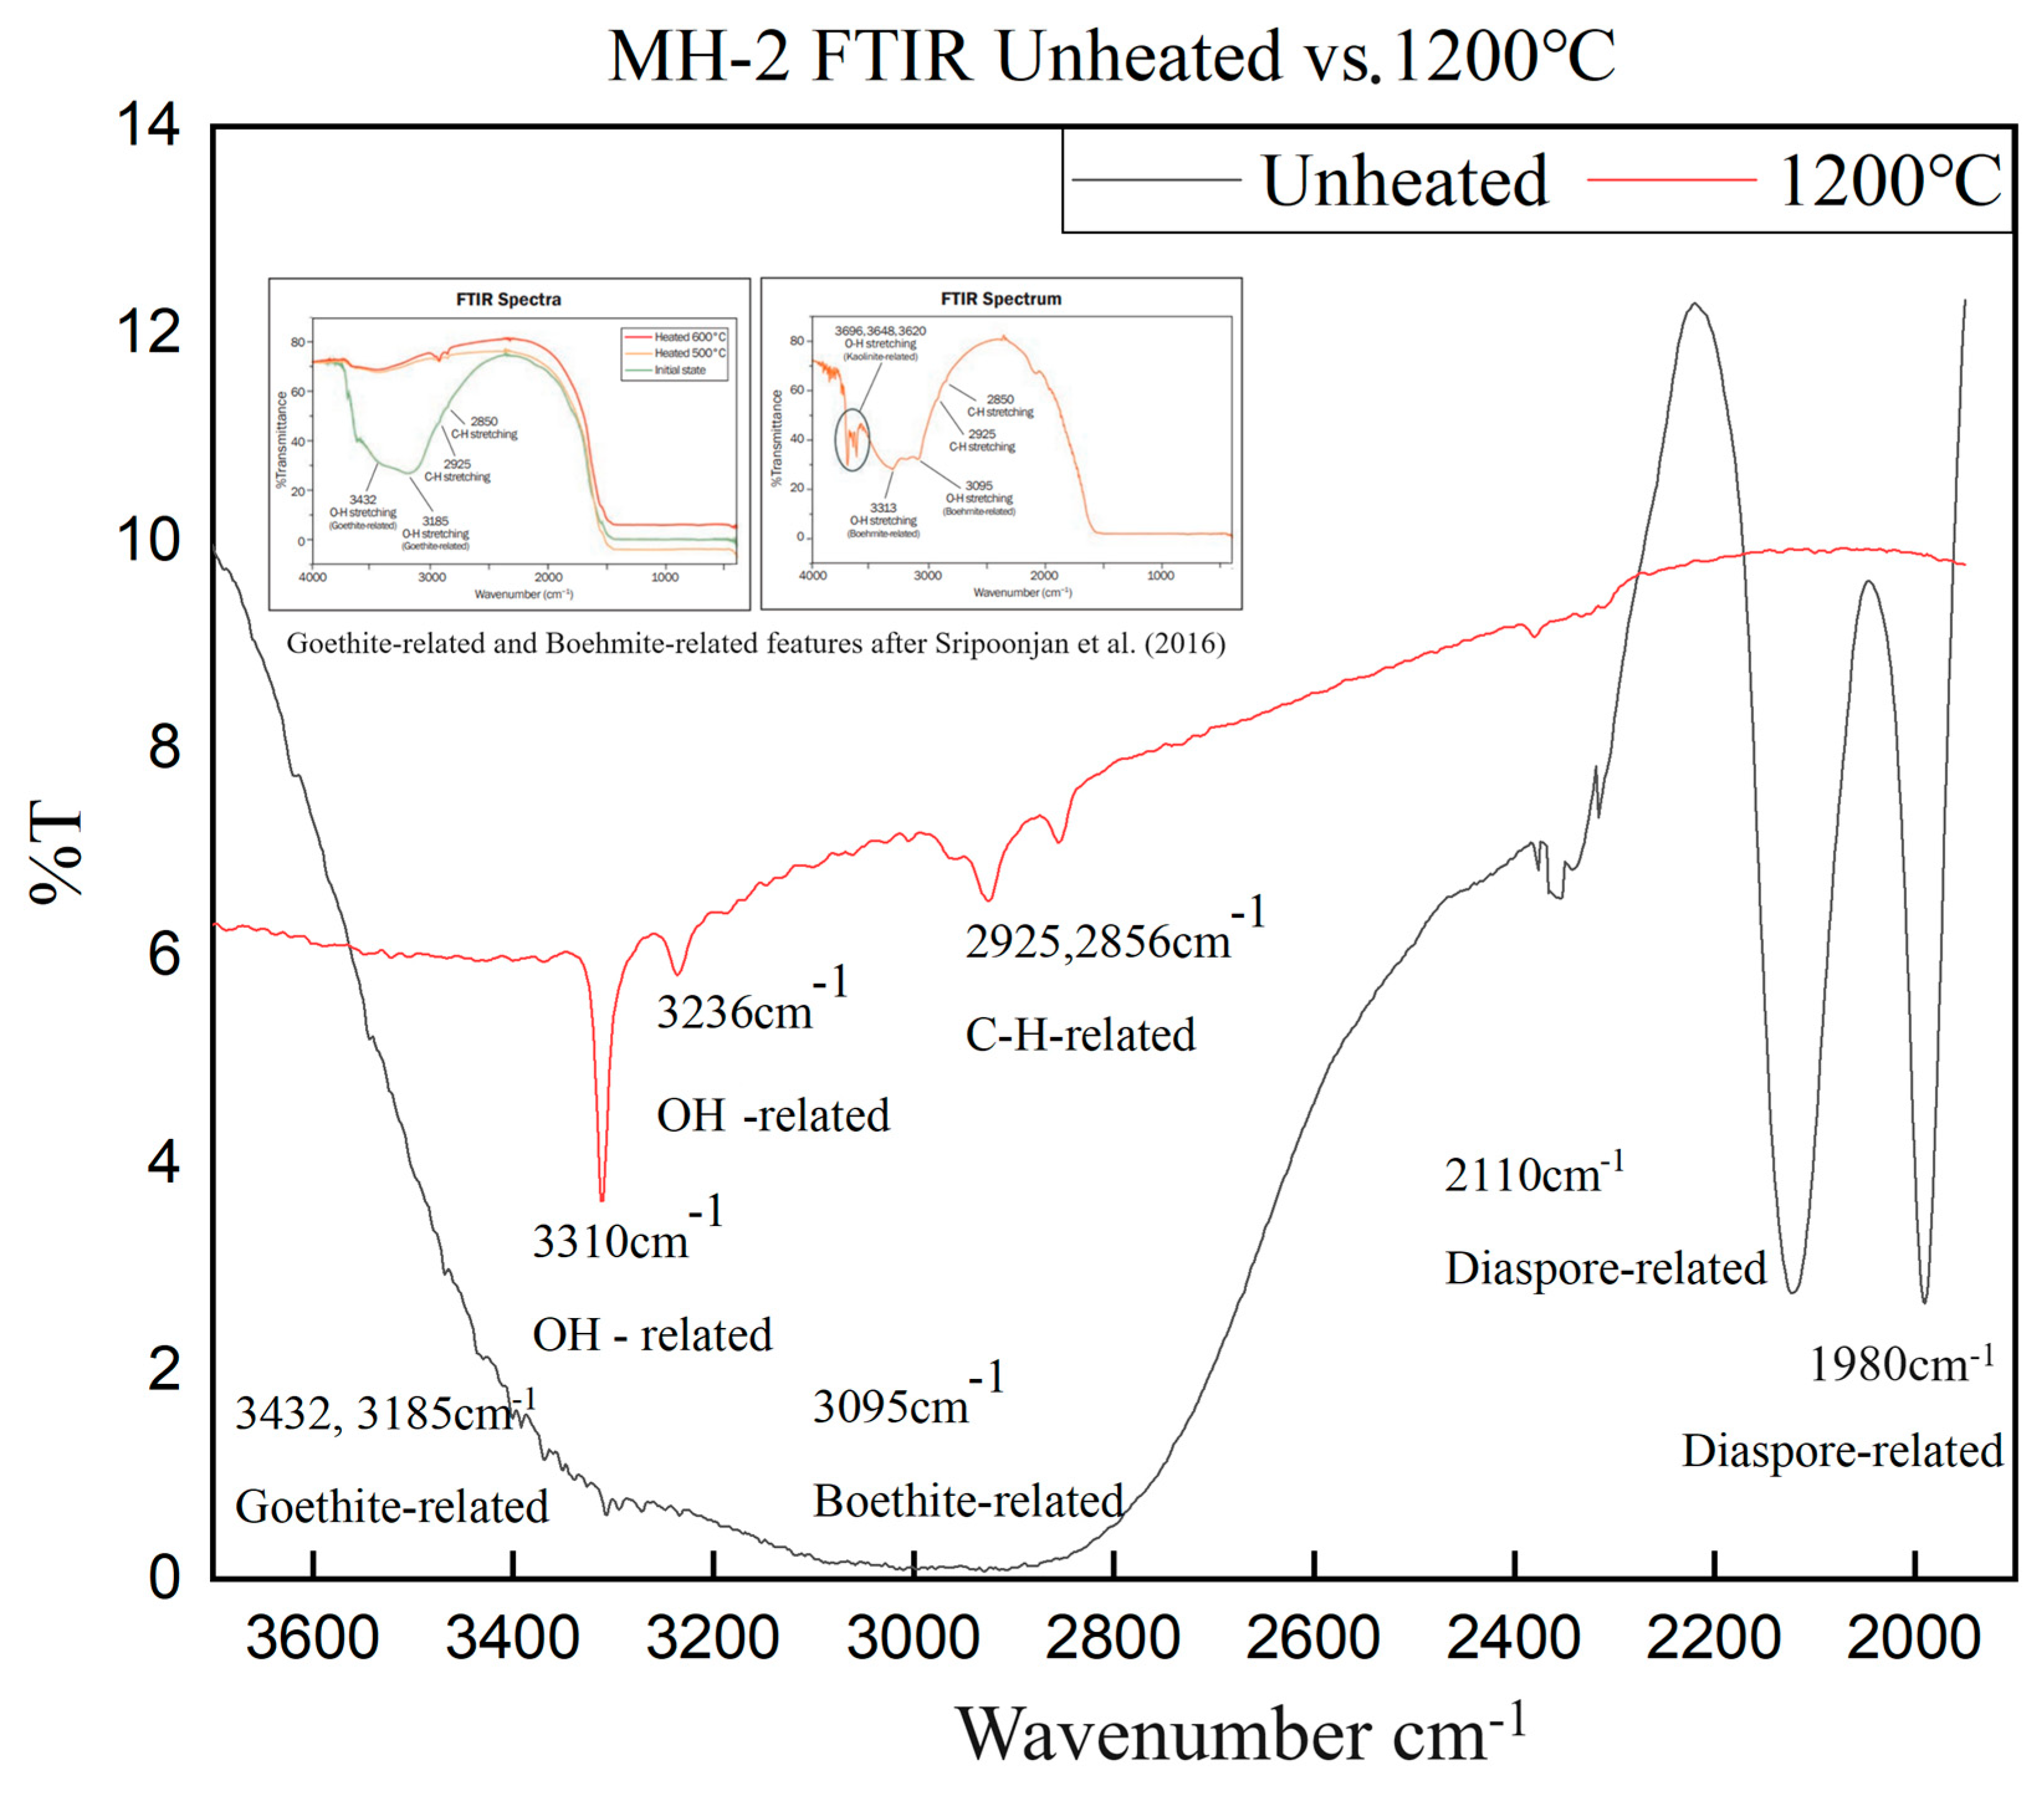
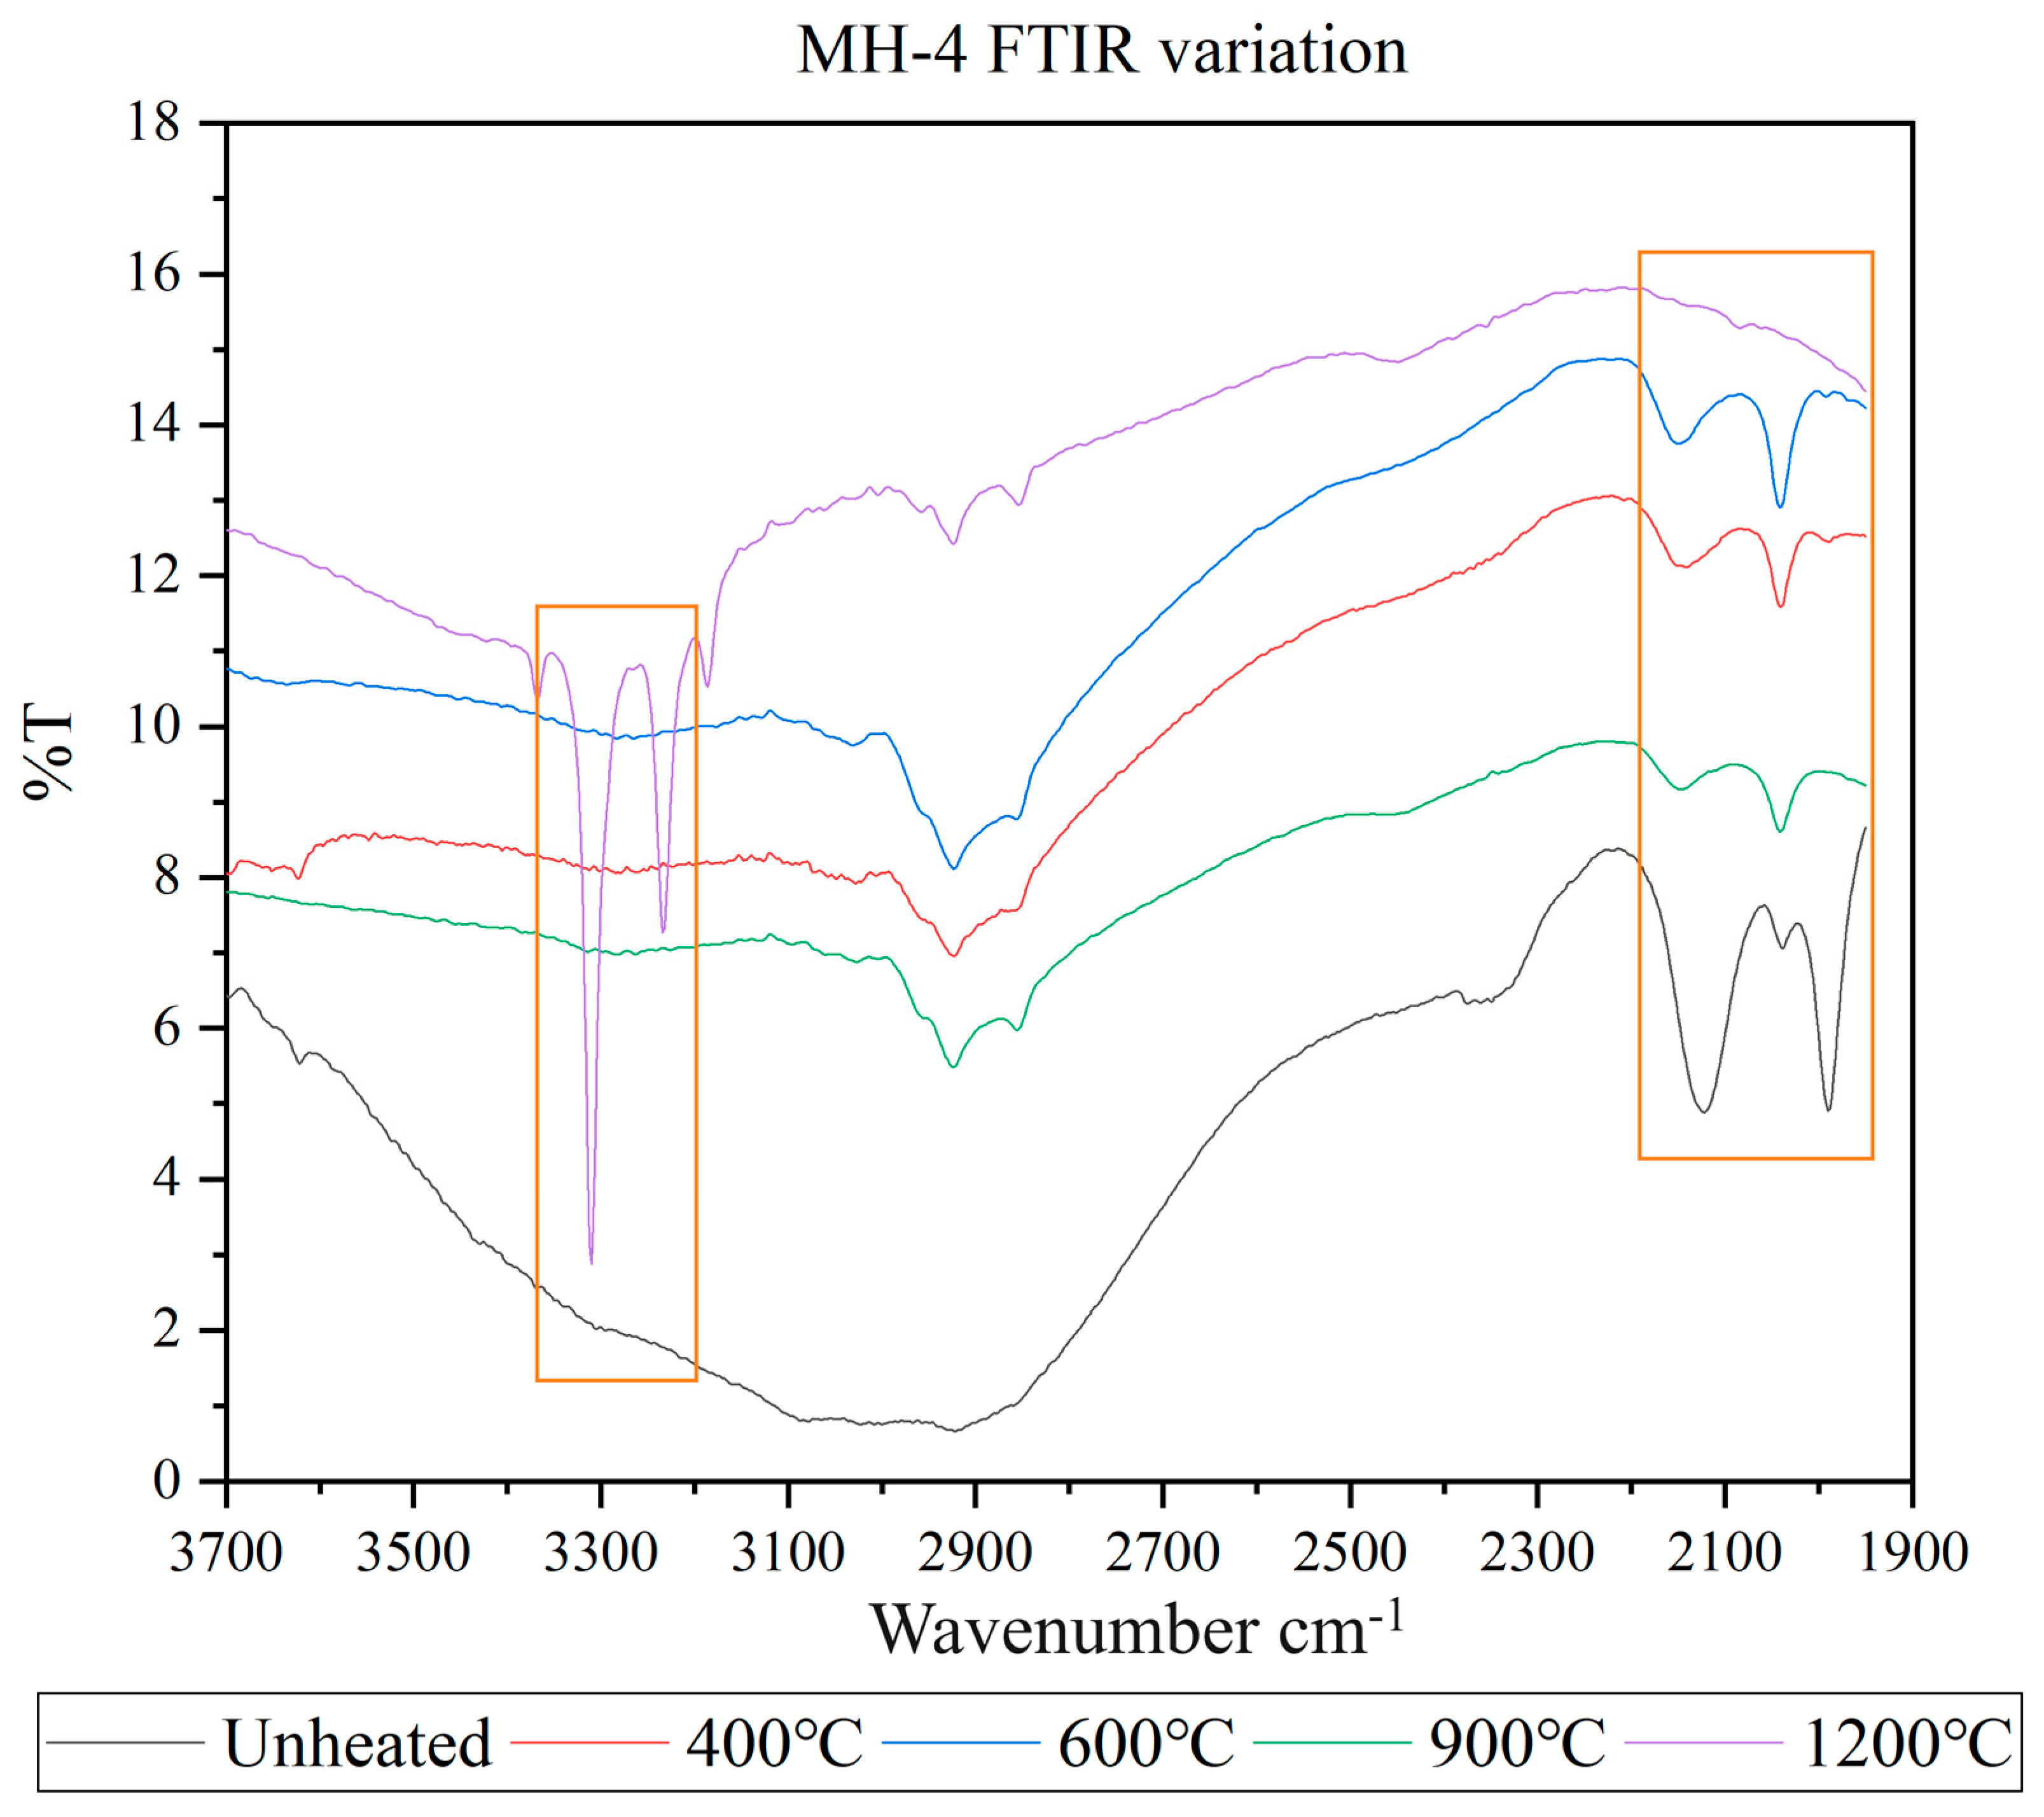
  • The main inclusions of the Mong Hsu rubies examined in this study were diaspore, boehmite and secondary goethite. The aforementioned inclusions slowly decomposed and released OH during the heating process, thus causing gradual changes in the FTIR spectra of the rubies. Therefore, observation of the release of OH is an effective method of detecting the effect of low-temperature heat treatment on rubies.
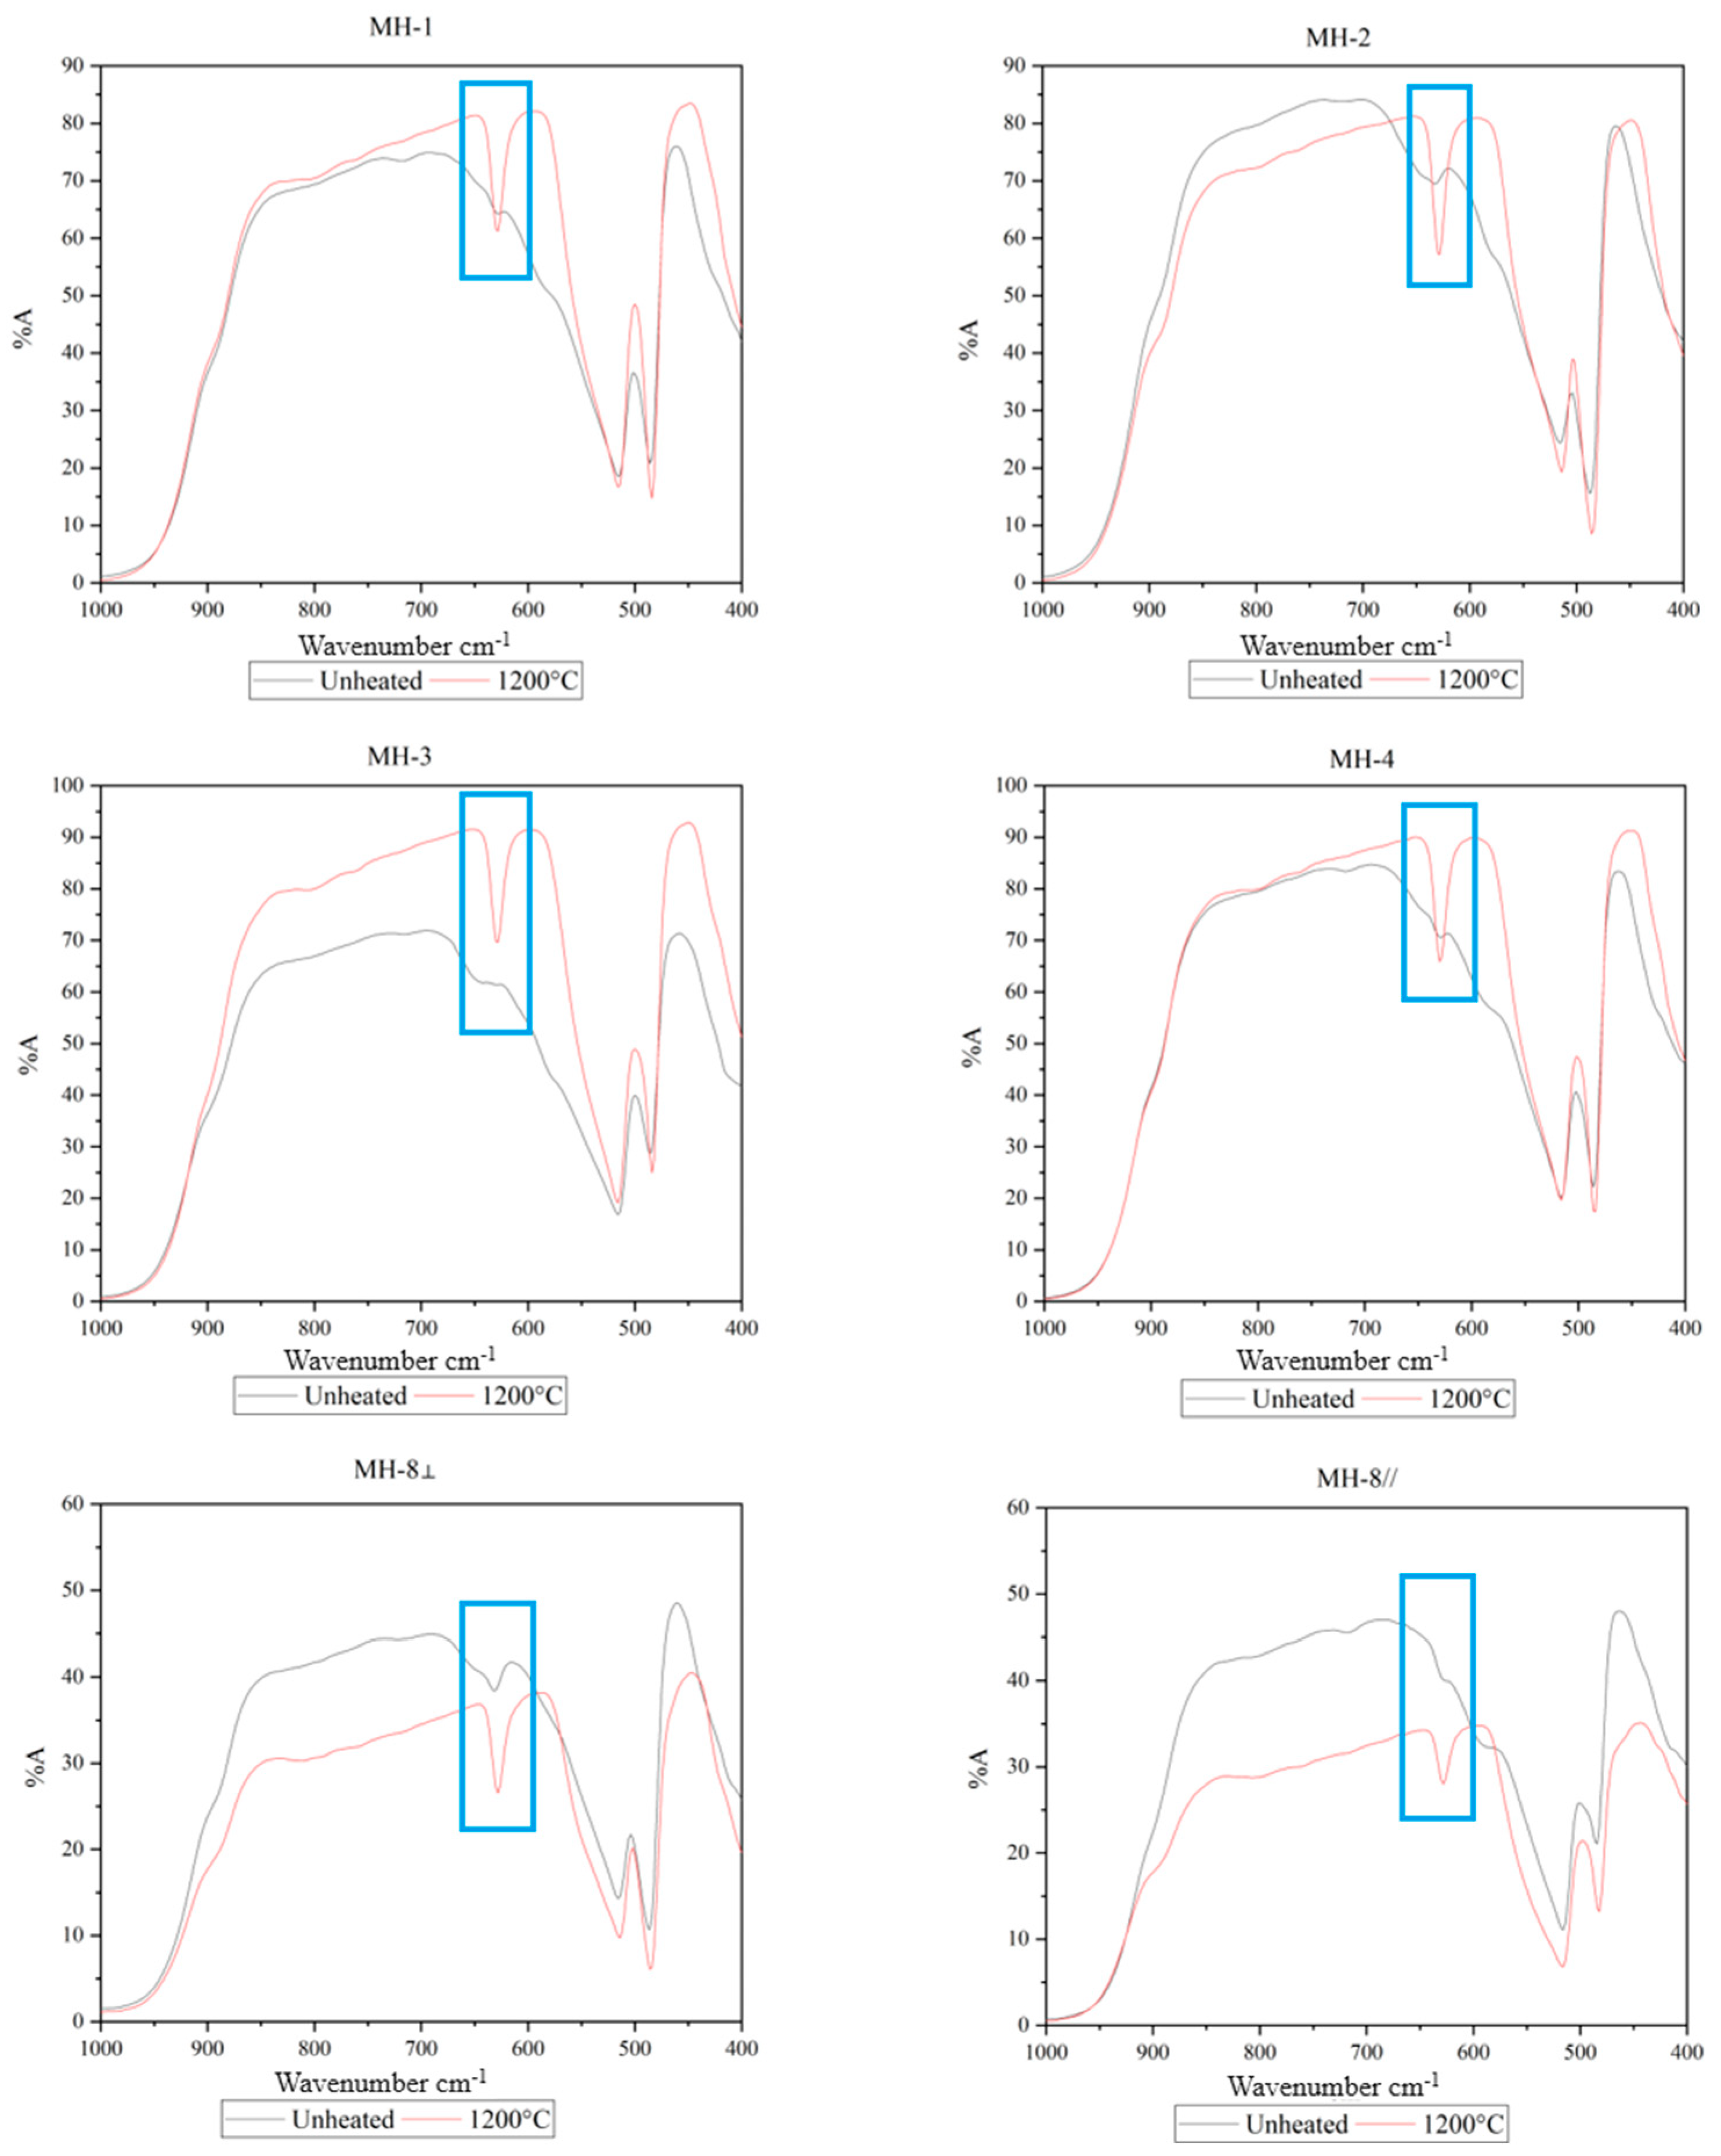
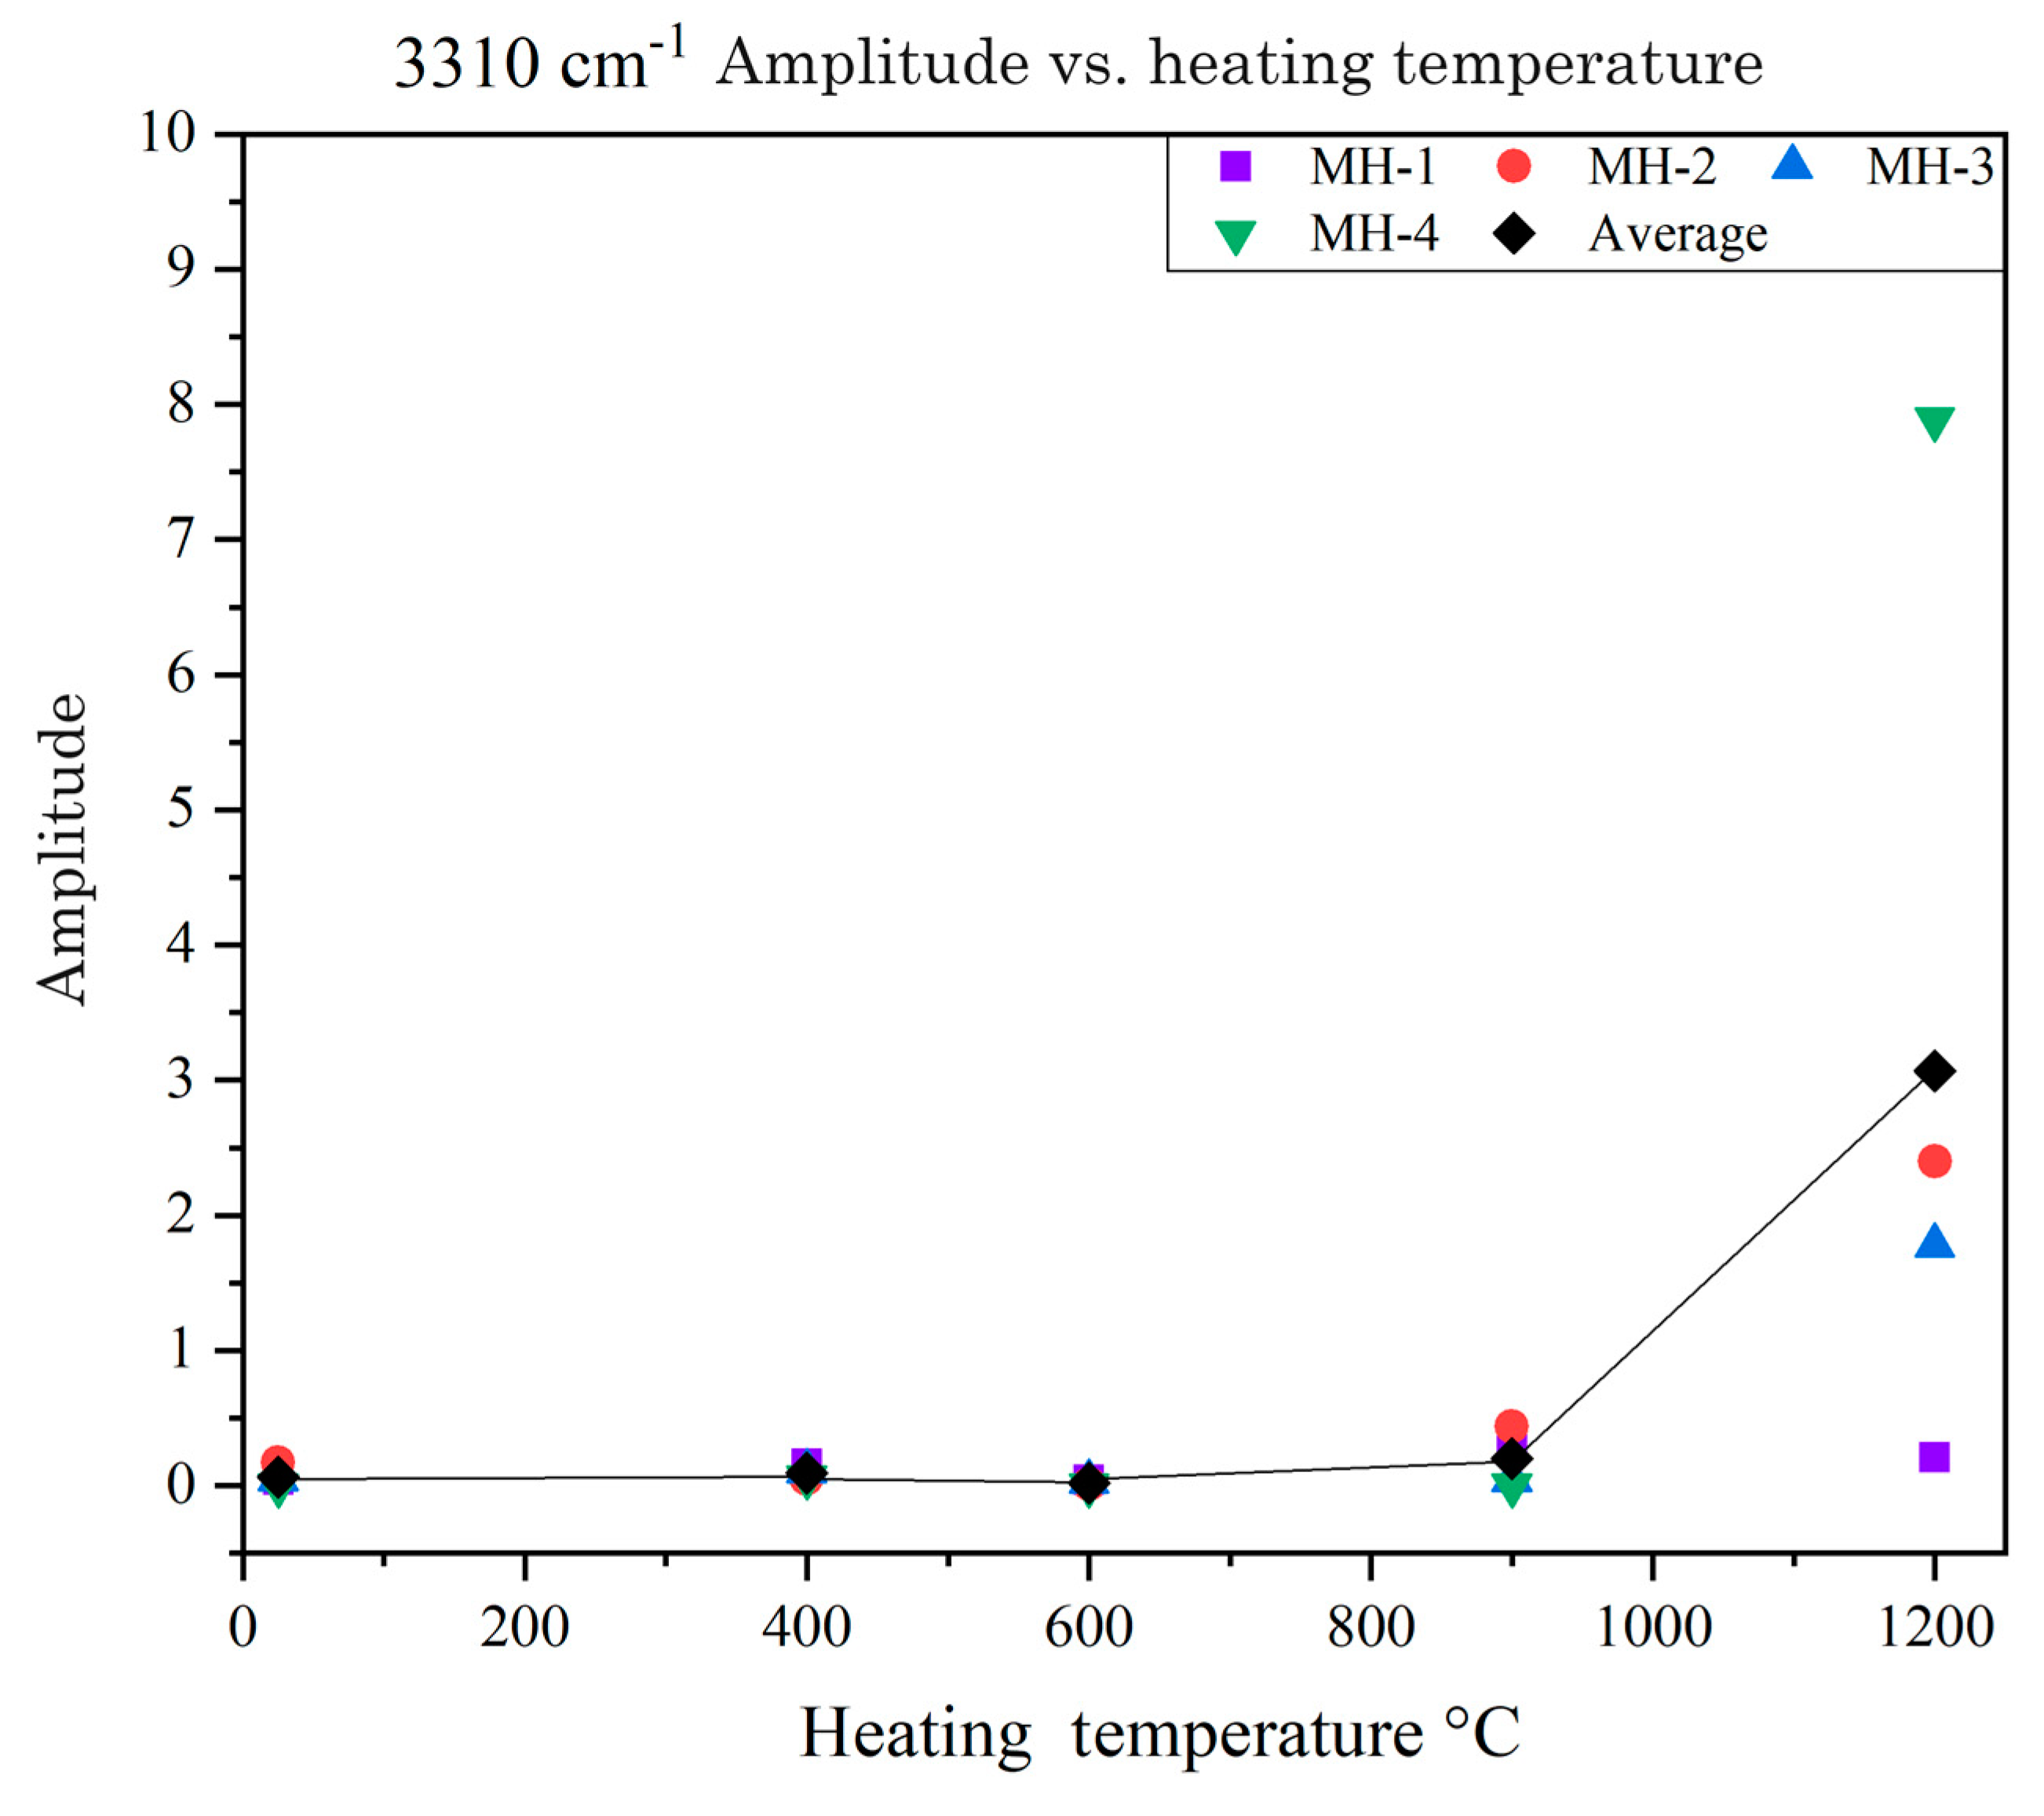
  • The 630 cm−1 peaks in the fingerprint region of the FTIR spectra of the ruby samples were highly sensitive to low-temperature heat treatment. The 3310 cm−1 peaks in the characteristic region of these spectra became sensitive to temperature when the temperature reached 1200 °C. Therefore, when determining whether the Mong Hsu rubies are being heated, one should observe the changes in both of the aforementioned types of peaks.

5. Recommendations

The presence of polysynthetic twins has unexpected effects on the heat treatment of Mong Hsu rubies, and the presence of surface cracks has negative effects on such treatment. Therefore, only ruby samples without polysynthetic twins and surface cracks can be enhanced through low-temperature heat treatment.

Author Contributions

Conceptualization, C.F.; methodology, C.F.; validation, Y.-C.D.; formal analysis, C.F.; investigation, C.F.; resources, C.F.; data curation, C.F.; writing—original draft preparation, C.F.; writing—review and editing, C.F. and Y.-C.D.; visualization, C.F.; supervision, Y.-C.D.; project administration, C.F.; funding acquisition, C.F. All authors have read and agreed to the published version of the manuscript.

Funding

This research received no external funding.

Data Availability Statement

Data are contained within the article.

Acknowledgments

The author thanks Robin Jewellery for providing the rough Mong Hsu rubies for this study. For technical assistance, we thank the National Taipei University of Technology Mineral Processing Laboratory and the Taiwan Central Gem Lab. The reviewers of Minerals are greatly appreciated. Parts of this text are revised according to their valuable comments.

Conflicts of Interest

The authors declare there are no conflicts of interests.

References

  1. Pardieu, V.; Saeseaw, S.; Detroyat, S.; Raynaud, V.; Sangsawong, S.; Bhusrisom, T.; Engniwat, S.; Muyal, J. GIA Lab Reports on Low-Temperature Heat Treatment of Mozambique Ruby. Gia News Res. 2015. [Google Scholar]
  2. Saeseaw, S.; Kongsomart, B.; Atikarnsakul, U.; Khowpong, C.; Vertriest, W.; Soonthorntantikul, W. Update on “Low-Temperature” Heat Treatment of Mozambican Ruby: A Focus on Inclusions and FTIR Spectroscopy, GIA NEWS FROM RESEARCH, April 25, 2018. Available online: https://www.gia.edu/doc/low_HT_Moz_report.pdf (accessed on 13 August 2024).
  3. Lu, Q.; Li, X.; Sun, L.; Qin, B. Chemical and Spectral Variations between Untreated and Heat-Treated Rubies from Mozambique and Madagascar. Minerals 2022, 12, 894. [Google Scholar] [CrossRef]
  4. Hughes, E.B.; Vertriest, W. A Canary in the Ruby Mine: Low-Temperature Heat Treatment Experiments on Burmese Ruby. Gems Gemol. 2022. Available online: https://www.gia.edu/gems-gemology/winter-2022-burmese-ruby (accessed on 13 August 2024). [CrossRef]
  5. Peretti, A.; Schmetzes, K.; Bernhadt, H.-J.; Mouawad, F.; Gem-Institute of America. RUBIES FROM MONG HSU. Gems Gemol. 1995, 31, 2–26. [Google Scholar] [CrossRef]
  6. Emmett, J.L. Fluxes and the Heat Treatment of Ruby and Sapphire. Gems Gemol. 1999, 35, 90–92. [Google Scholar]
  7. Song, Q.; Shen, A.H. Comparative Study of Unheated and Heated Rubies from Myanmar. 2021. Available online: http://jogg.cug.edu.cn/en/article/doi/10.15964/j.cnki.027jgg.2021.03.002 (accessed on 13 August 2024). (In Chinese with English abstract).
  8. Achiwawanich, S.; Brack, N.; James, B.D.; Liesegang, J. Surface analysis of heat-treated Mong Hsu rubies. Appl. Surf. Sci. 2006, 252, 8646–8650. [Google Scholar] [CrossRef]
  9. Smith, C.P. A contribution to understanding the infrared spectra of Mong Hsu rubies. J. Gemmol. 1995, 24, 321–335. [Google Scholar] [CrossRef]
  10. Themelis, T. The Heat Treatment of Ruby & Sapphire Experiments & Observations, 3rd ed.; Published by the author: Thailand, 2018; Volume 1: Attributes of Ruby-Sapphire and Related Heating Technology, ISBN 0-940965-57-7. [Google Scholar]
  11. Hughes, R.W. Ruby: An Expensive Mistake. Gems Gemol. 2022, 58, 258. [Google Scholar]
  12. Karampelas, S.; Hennebois, U.; Mevellec, J.-Y.; Pardieu, V.; Delaunay, A.; Fritsch, E. Pink to Purple Sapphires from Ilakaka, Madagascar: Insights to Separate Unheated from Heated Samples. Minerals 2023, 13, 704. [Google Scholar] [CrossRef]
  13. Hughes, R.W.; Manorotkul, W.; Hughes, E.B. Ruby & Sapphire: A Gemologist’s Guide; RWH Publishing/Lotus Publishing: Bangkok, Thailand, 2017. [Google Scholar]
  14. Long, C.; He, L.-Y.; Hou, S.-Y.; Zhao, B.-W.; Tu, C.; LÜ, X.-Y. The Characteristics of Hydrous Mineral Inclusions in Low-Temperature Heated Corundum. Spectrosc. Spectr. Anal. 2021, 41, 1530–1536. [Google Scholar]
  15. Nassau, K. Heat Treating Ruby and Sapphire: Technical Aspects. Gems Gemol. Fall 1981, 17, 121–131. [Google Scholar] [CrossRef]
  16. The Gemmological Association of Great Britain (FGA or Gem-A); The Diploma in Gemmology Course, 2012.
  17. Ruan, H.D.; Frost, R.L.; Kloprogge, J.T.; Duong, L. Far-infrared spectroscopy of alumina phases. Spectrochim. Acta A Mol. Biomol. Spectrosc. 2002, 58, 265–272. [Google Scholar] [CrossRef] [PubMed]
  18. Koivula, J. Useful Visual Clue Indicating Corundum Heat Treatment. Gems Gemol. Fall 2013, 49, 160. [Google Scholar] [CrossRef]
  19. Sripoonjan, T.; Wanthanachaisaeng, B.; Leelawatanasuk, T. Phase Transformation of Epigenetic Iron Staining: Indication of Low-Temperature Heat Treatment in Mozambique Ruby. J. Gemmol. 2016, 35, 156–161. [Google Scholar] [CrossRef]
  20. Kammerling, R.C.; Scarratt, K.; Bosshart, G.; Jobbins, E.A.; Kane, R.E.; Gubelin, E.J.; Levinson, A.A. Myanmar and its gems-An update. J. Gemmol. 1994, 24, 3–40. [Google Scholar] [CrossRef]
  21. Yanagida, H.; Yamaguchi, G. A Discussion on the Phase Diagram of the System Al2O3-H2O Considering the Transformation Mechanism of the Polymorphs Appearing in It. J. Ceram. Assoc. Japan. 1966, 74, 1966. [Google Scholar] [CrossRef]
  22. Shaw, C.L. An evaluation of the infrared 630 cm−1 OH libration band in bone mineral as evidence of fire in the archaeological record. J. Archaeol. Sci. Rep. 2022, 46, 103655. [Google Scholar] [CrossRef]
  23. Lowry, S. Analysis of Rubies and Sapphires by FT-IR Spectroscopy, Thermo Fisher Scientific Application Note: 51124. Available online: https://assets.thermofisher.com/TFS-Assets/CAD/Application-Notes/D10280~.pdf (accessed on 13 August 2024).
  24. Lowry, S. Using FTIR Spectroscopy to Analyze Gemstones, American Laboratory, 2008. Available online: https://www.americanlaboratory.com/913-Technical-Articles/730-Using-FTIR-Spectroscopy-to-Analyze-Gemstones/ (accessed on 13 August 2024).
Figure 1. Images of the unheated MH-1 to MH-4 and Mh-8 ruby samples with the dark blue core shown in a blue circle.
Minerals 14 00829 g001aMinerals 14 00829 g001b
Figure 2. Images of the unheated MH-5 ruby samples with the dark blue core shown in a blue circle.
Minerals 14 00829 g002
Figure 3. The effect of heating (1200 °C) on the dark blue core shown in a blue circle.
Minerals 14 00829 g003
Figure 4. The effect of heating on the appearance of the core for MH-1 after being heated to various temperatures.
Minerals 14 00829 g004
Figure 5. White cloudy material on the MH-1 parting faces of the polysynthetic twining crystal after being heated to 1200 °C.
Minerals 14 00829 g005
Figure 6. A white strip in the center of MH-1 as shown in the yellow circle. (a) Heated to 600 °C, (b) Heated to 1200 °C.
Minerals 14 00829 g006
Figure 7. The effect of the heating temperature on the appearance of the core of MH-2.
Minerals 14 00829 g007
Figure 8. The cloud-like material surrounding the hexagonal domain of MH-2 at 1200 °C.
Minerals 14 00829 g008
Figure 9. A comparison of the overall UV-Vis absorbance of all the samples unheated and heated to 1200 °C.
Minerals 14 00829 g009
Figure 10. The changes in the (a) 420 nm and (b) 554 nm absorption peaks during the heat treatment process.
Minerals 14 00829 g010
Figure 11. The changes in the 376 and 387 nm absorption peaks between the unheated and heated to 1200 °C. (a) MH-1 and (b) MH-3.
Minerals 14 00829 g011
Figure 12. The changes in the 468 and 476 nm absorption peaks between the ones heated to 900 °C and 1200 °C.
Minerals 14 00829 g012
Figure 13. A typical change in 570 absorption peaks between unheated and heated to 1200 °C.
Minerals 14 00829 g013
Figure 14. The changes in the 570 nm absorption peaks during the heat treatment process.
Minerals 14 00829 g014
Figure 15. The differences in the absorbance between the unheated and heated samples (to 1200 °C).
Minerals 14 00829 g015
Figure 16. The FTIR spectra show the influence of hydrous oxide minerals on MH-2 before and after being heated to 1200 °C [19].
Minerals 14 00829 g016
Figure 17. The changes in the FTIR spectra of the MH-4 samples at each heating step.
Minerals 14 00829 g017
Figure 18. The 630 cm−1 peaks are shown in the blue box for all the unheated and heated (1200 °C) ruby samples.
Minerals 14 00829 g018
Figure 19. The influence of the heating temperature on the amplitude of the 630 cm−1 peak.
Minerals 14 00829 g019
Figure 20. The 3310 cm−1 peak of all the ruby samples subjected to 1200 °C heat treatment.
Minerals 14 00829 g020
Figure 21. The influence of the heating temperature on the amplitude of the 3310 cm−1 peaks.
Minerals 14 00829 g021
Figure 22. The Raman spectra of the heated MH-1-MH-4 and MH-8 and unheated MH-5 samples.
Minerals 14 00829 g022
Table 1. The heating temperature and heating duration of the tested sample.
Temperature
Sample
Stage 1
400 °C
Stage 2
600 °C
Stage 3
900 °C
Stage 4
1200 °C
MH-112 h12 h12 h12 h
MH-224 h24 h24 h12 h
MH-34 h4 h4 h4 h
MH-41 h1 h1 h1 h
MH-812 h12 h12 h12 h
Table 2. The elemental compositions of the samples before and after heating at 1200 °C.
Element
Sample
Fe (ppm)Ti (ppm)Cr (ppm)Al (ppm)
Unheated1200 °CUnheated1200 °CUnheated1200 °CUnheated1200 °C
MH-1133171045168834207639388,897564,185
MH-24974711231146811,60111,515546,237496,440
MH-314852110466103444076071427,334472,278
MH-45955001506124920692368507,254496,193
MH-879810841171128524343688378,017382,673
Disclaimer/Publisher’s Note: The statements, opinions and data contained in all publications are solely those of the individual author(s) and contributor(s) and not of MDPI and/or the editor(s). MDPI and/or the editor(s) disclaim responsibility for any injury to people or property resulting from any ideas, methods, instructions or products referred to in the content.

